
Effects of Valve, Armature, and Armature Pin Guidance on Diesel Injector Performance

Abstract
:1. Introduction
1.1. Literature Review
1.2. Novelty
2. Materials and Methods
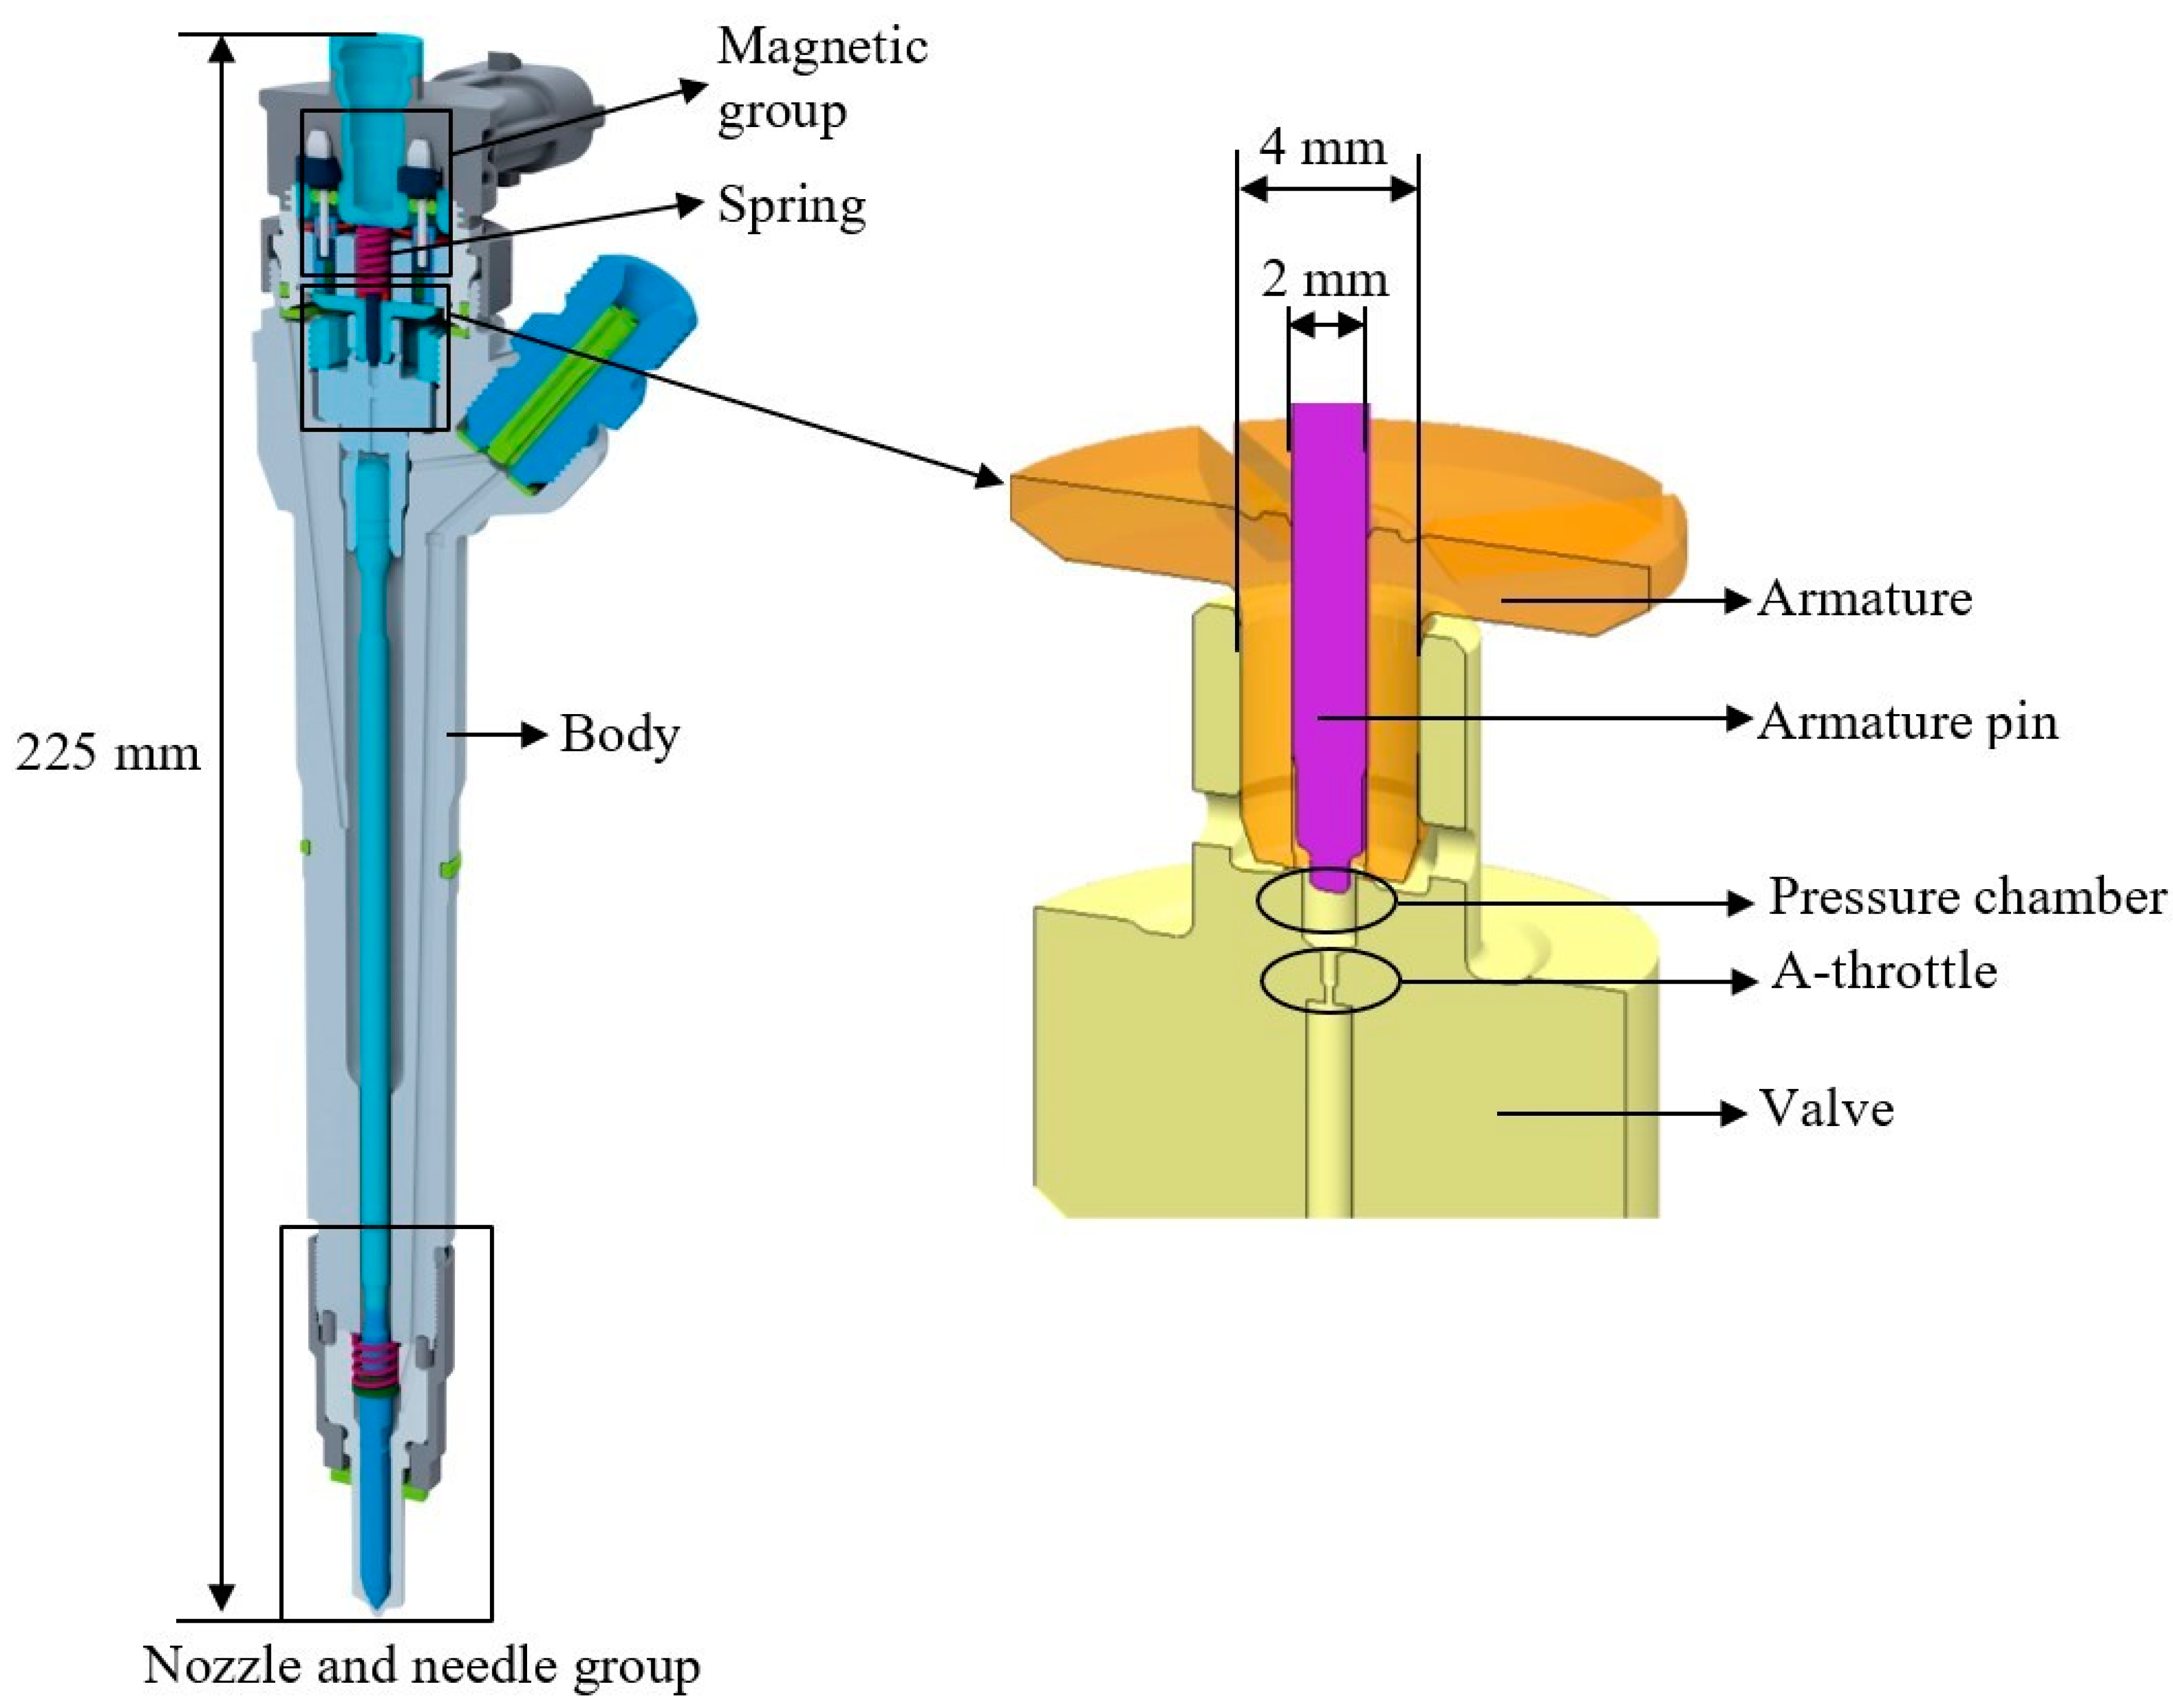
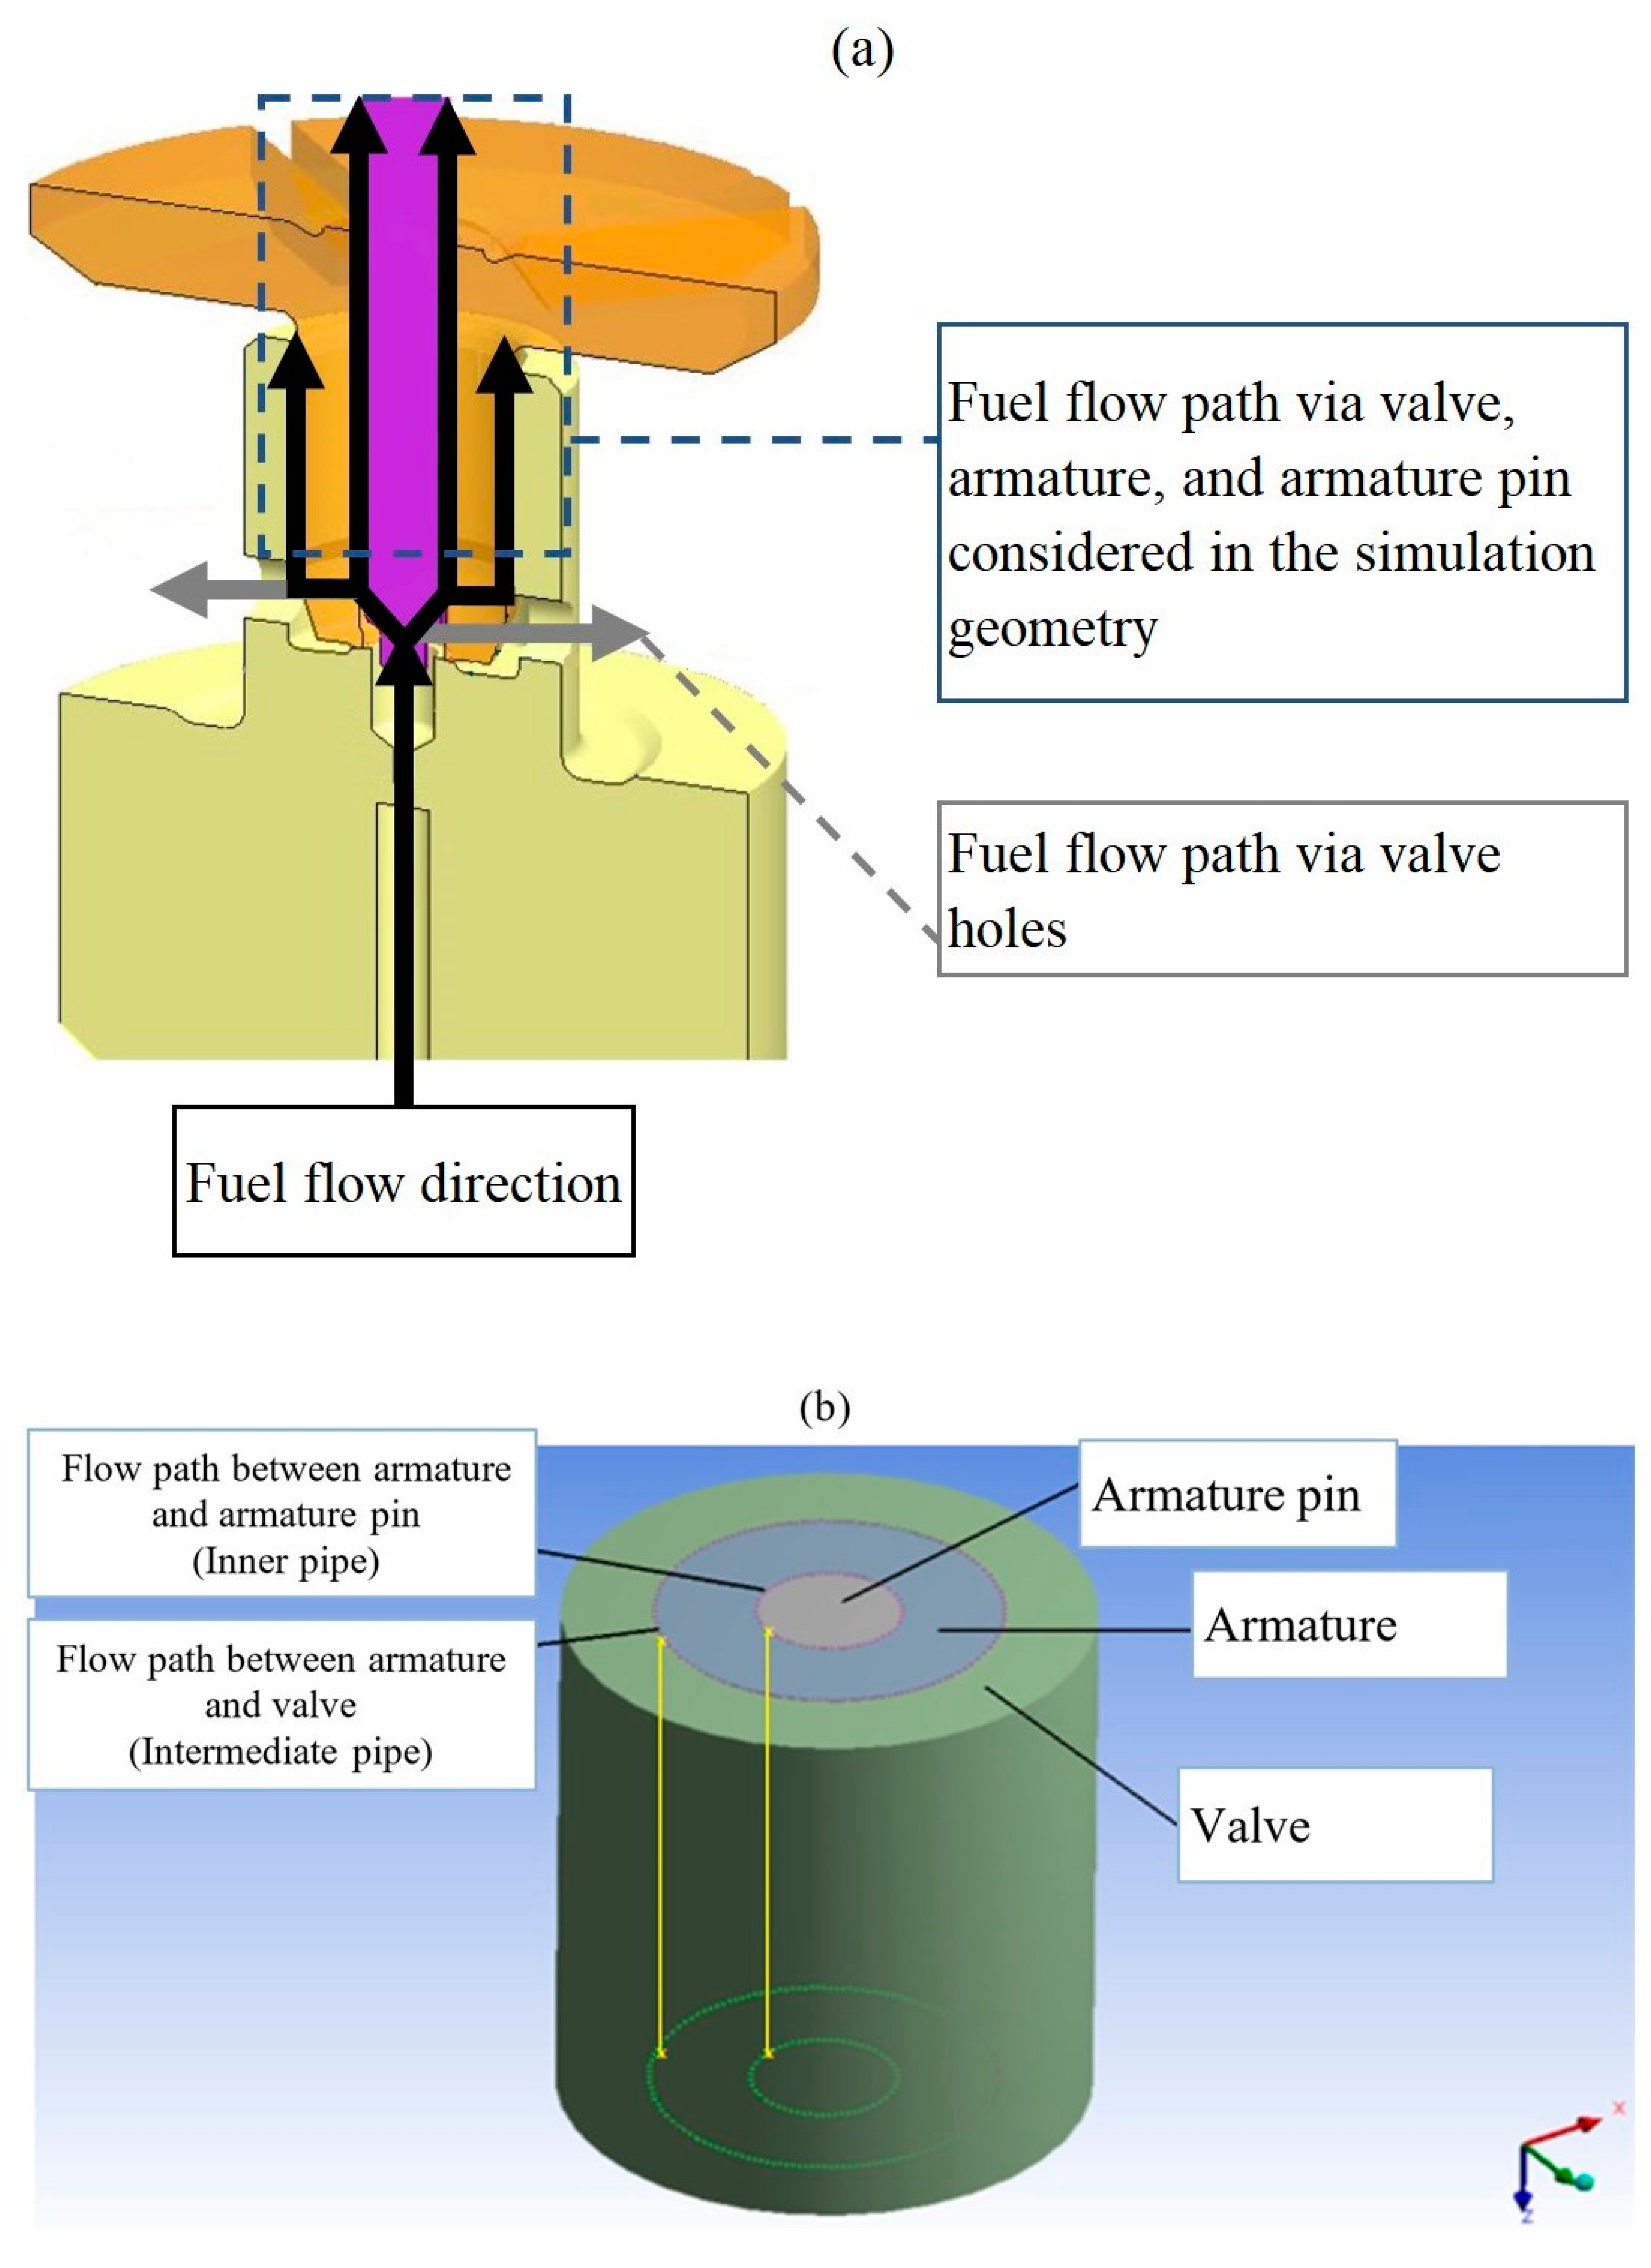
2.1. System and Problem Definition
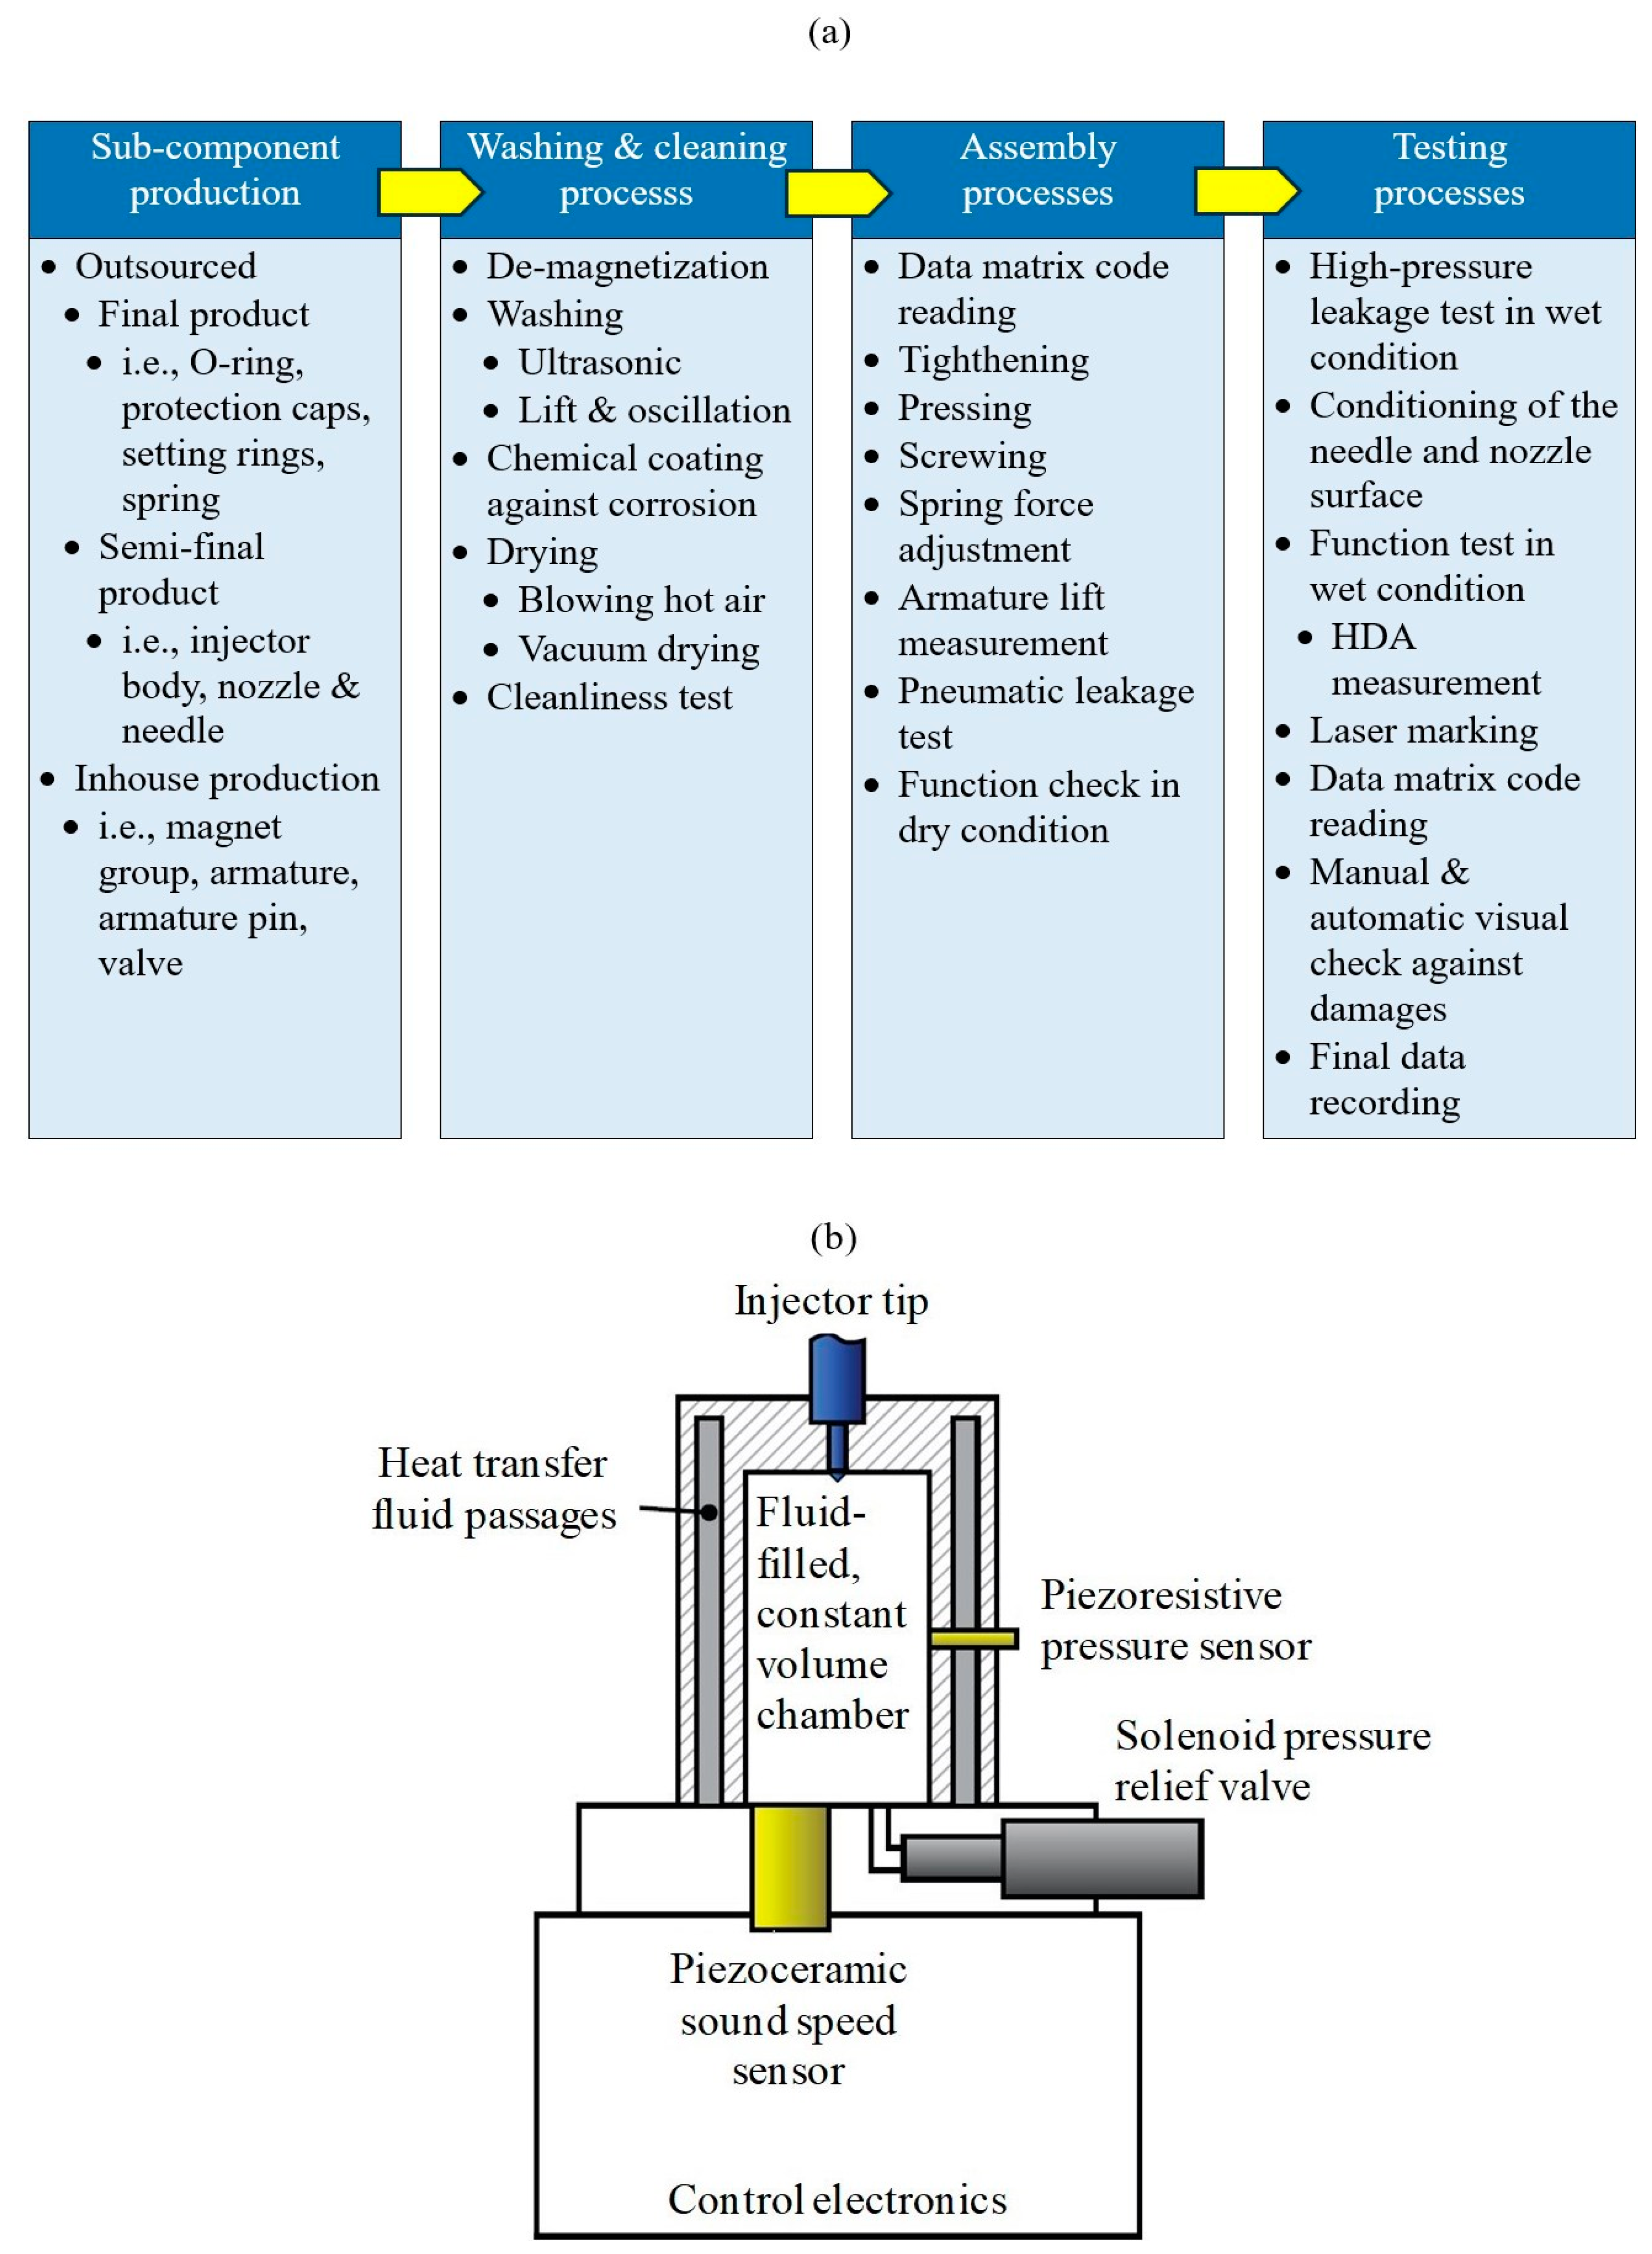
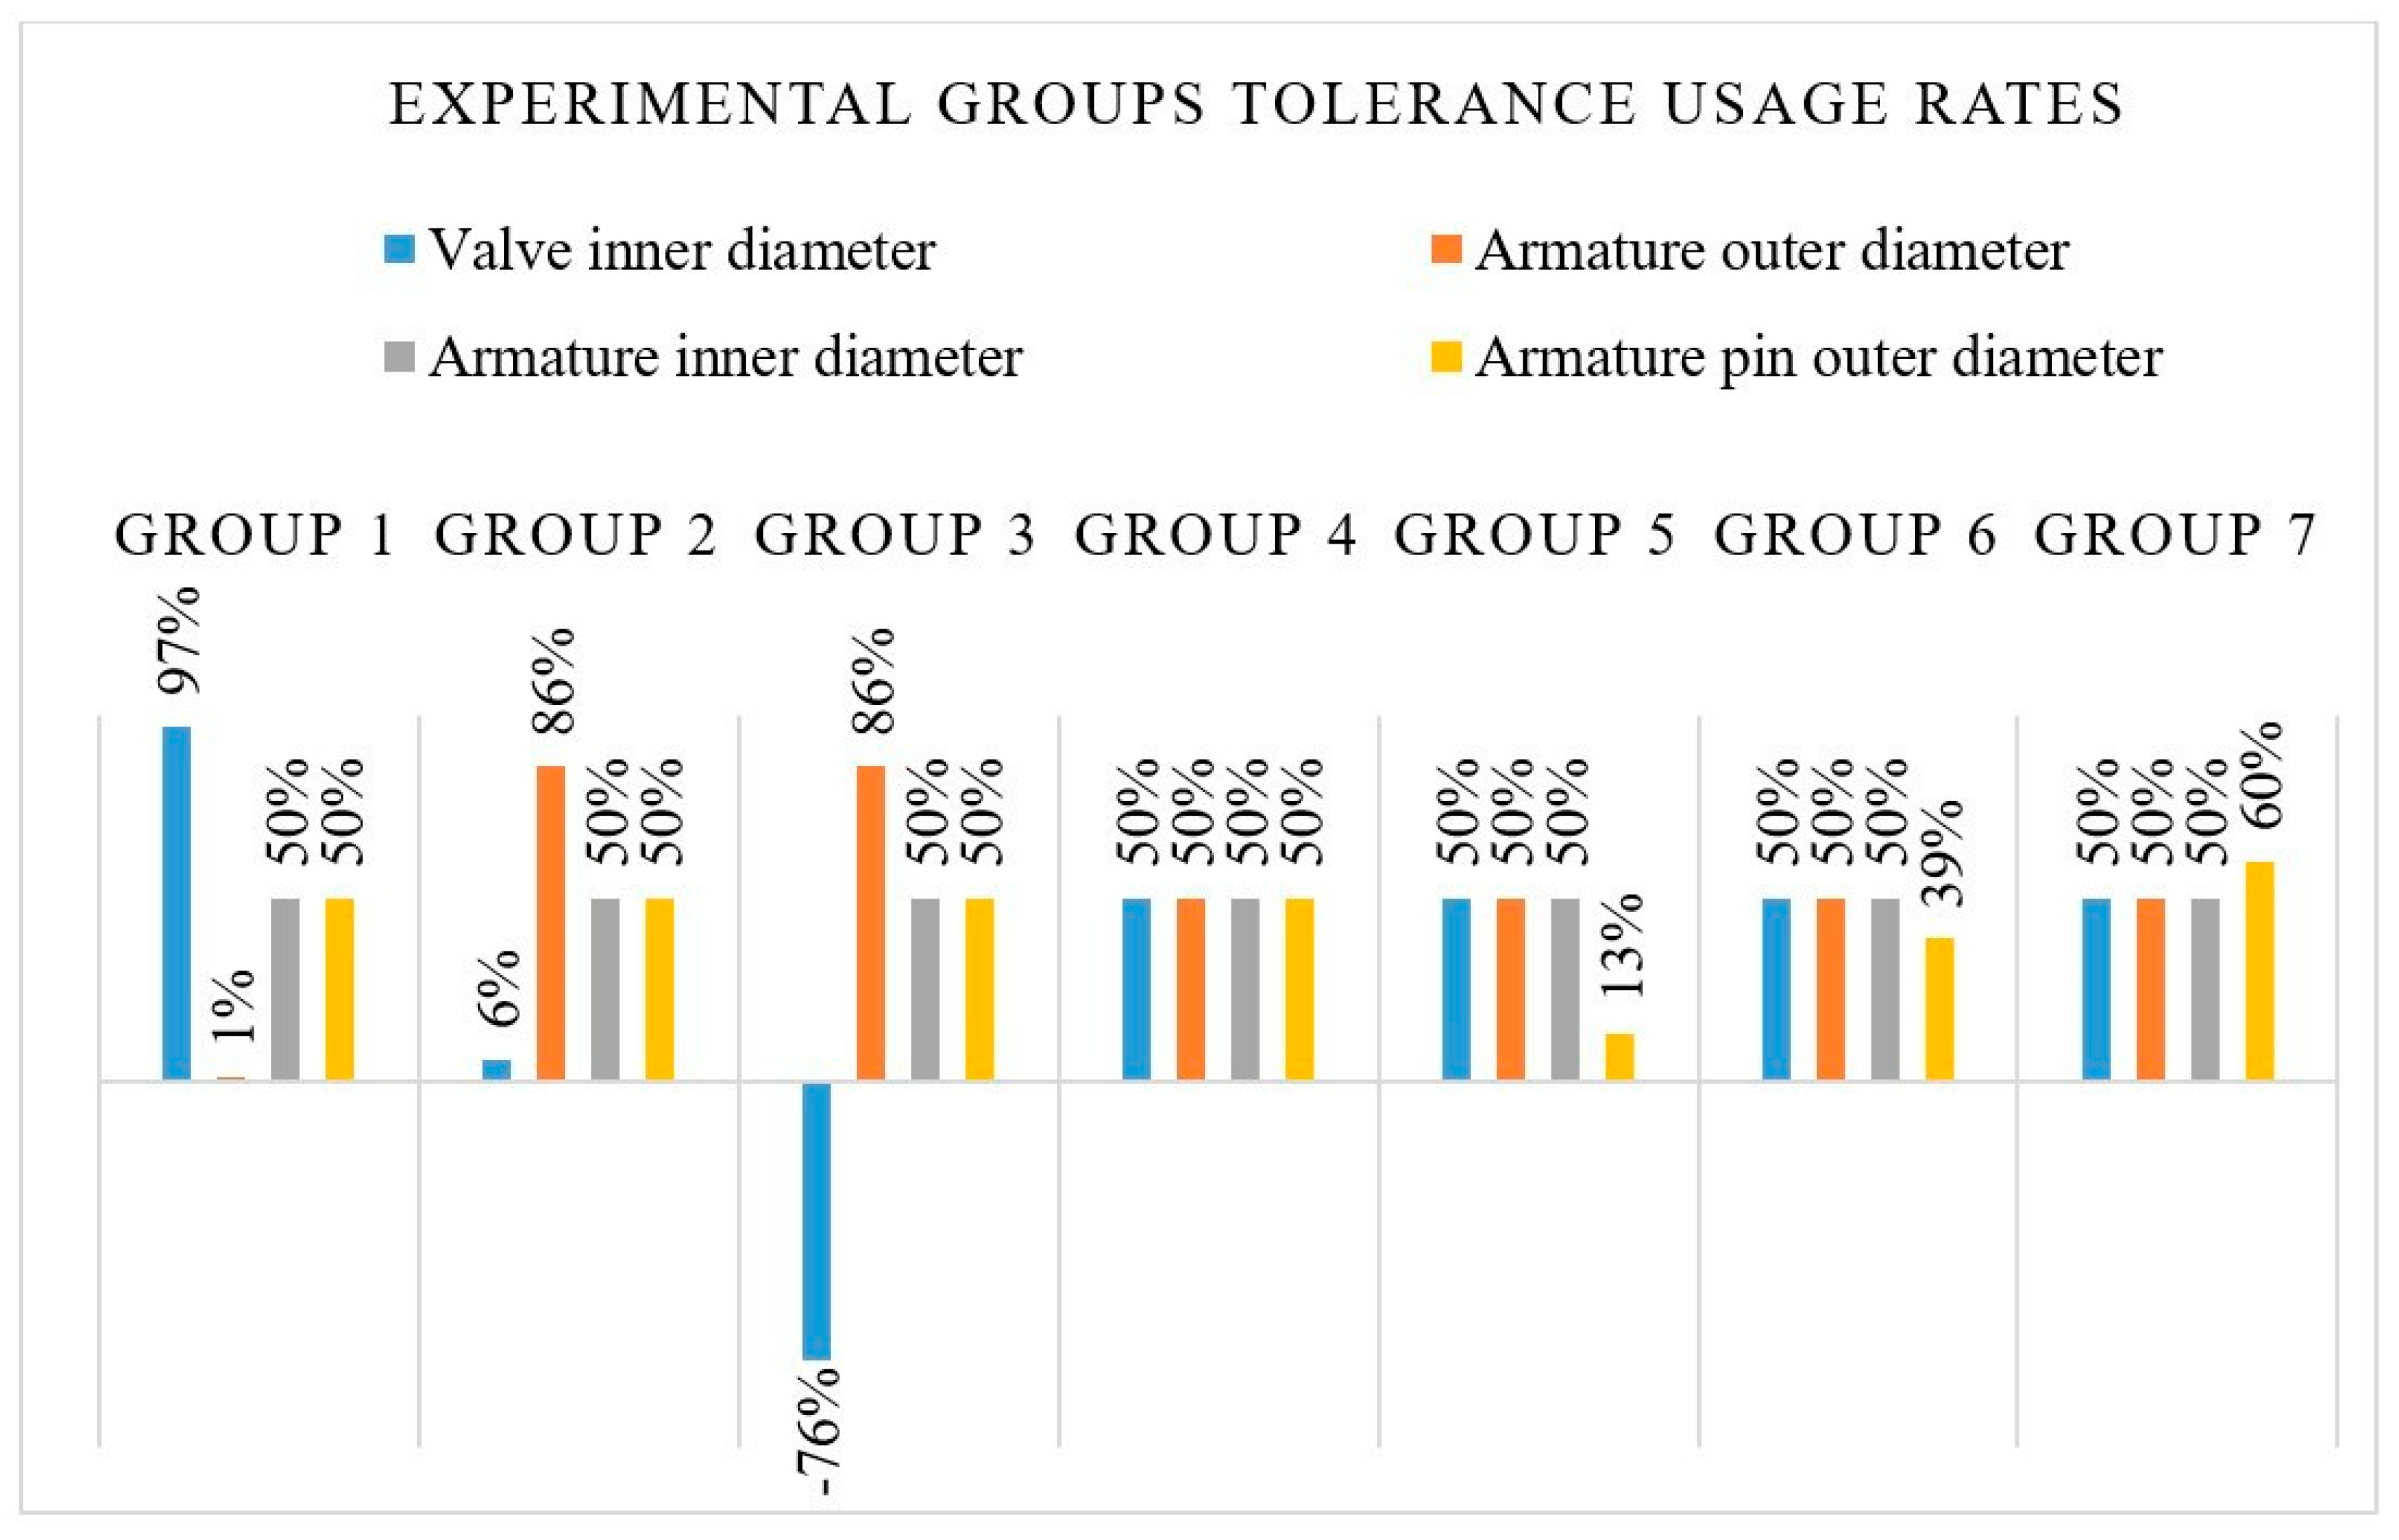
2.2. Experimental Method
- (a)
- clearance between the valve and armature;
- (b)
- clearance between the armature and armature pin.
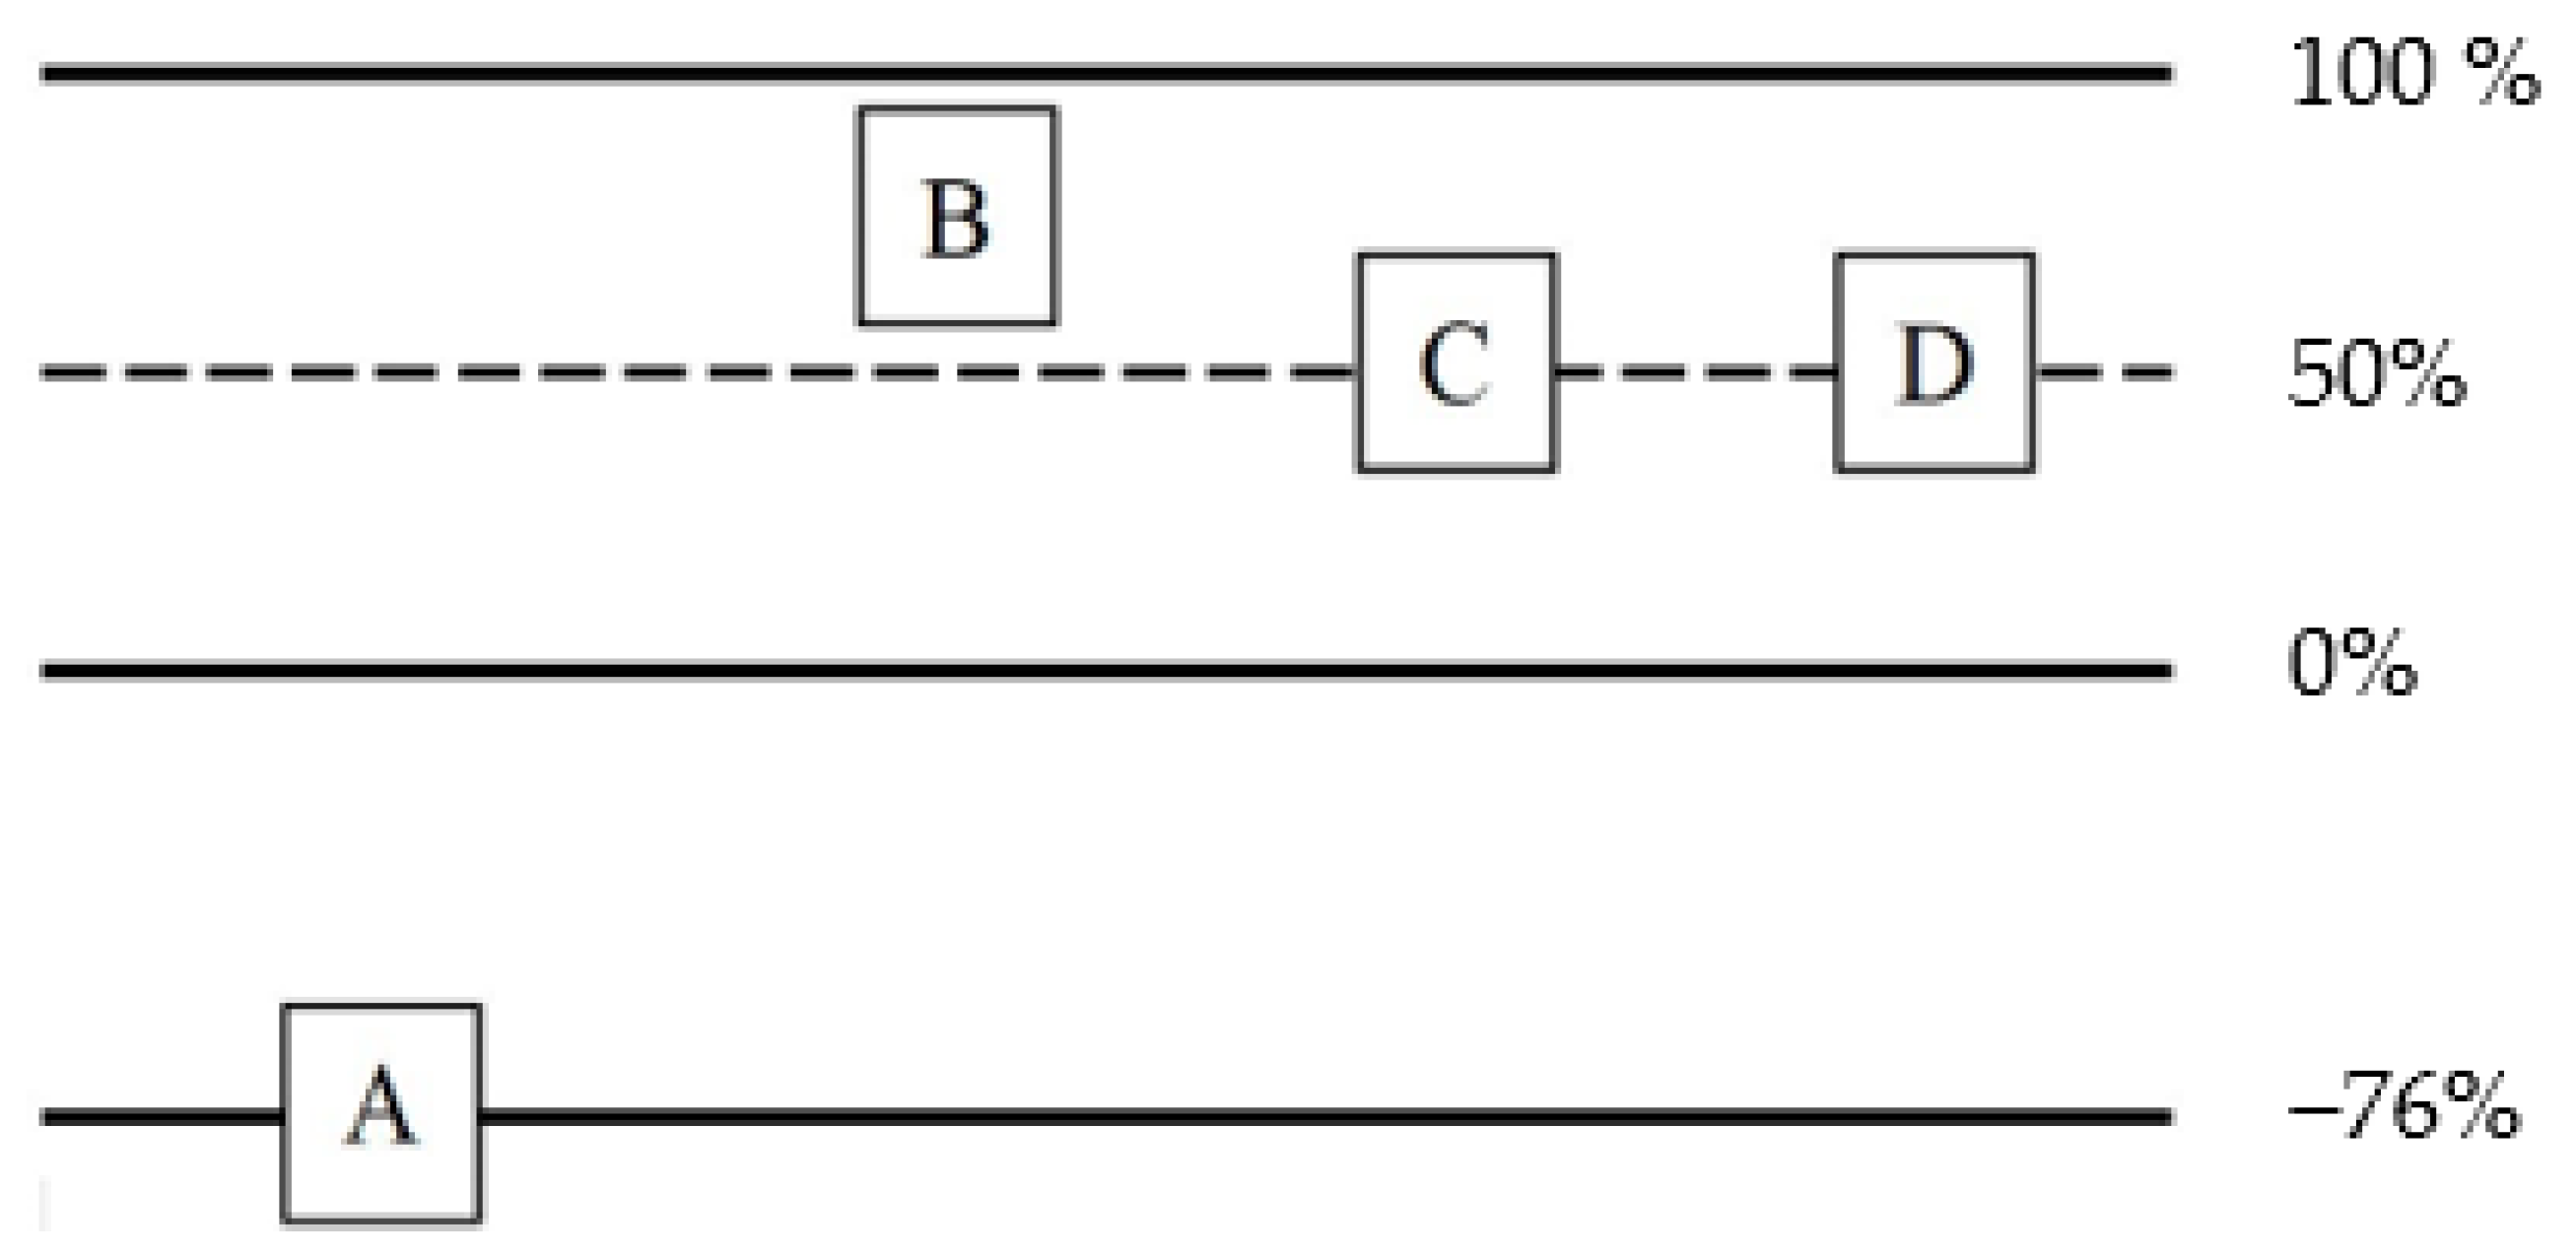
- high clearance;
- low clearance;
- lowest clearance.
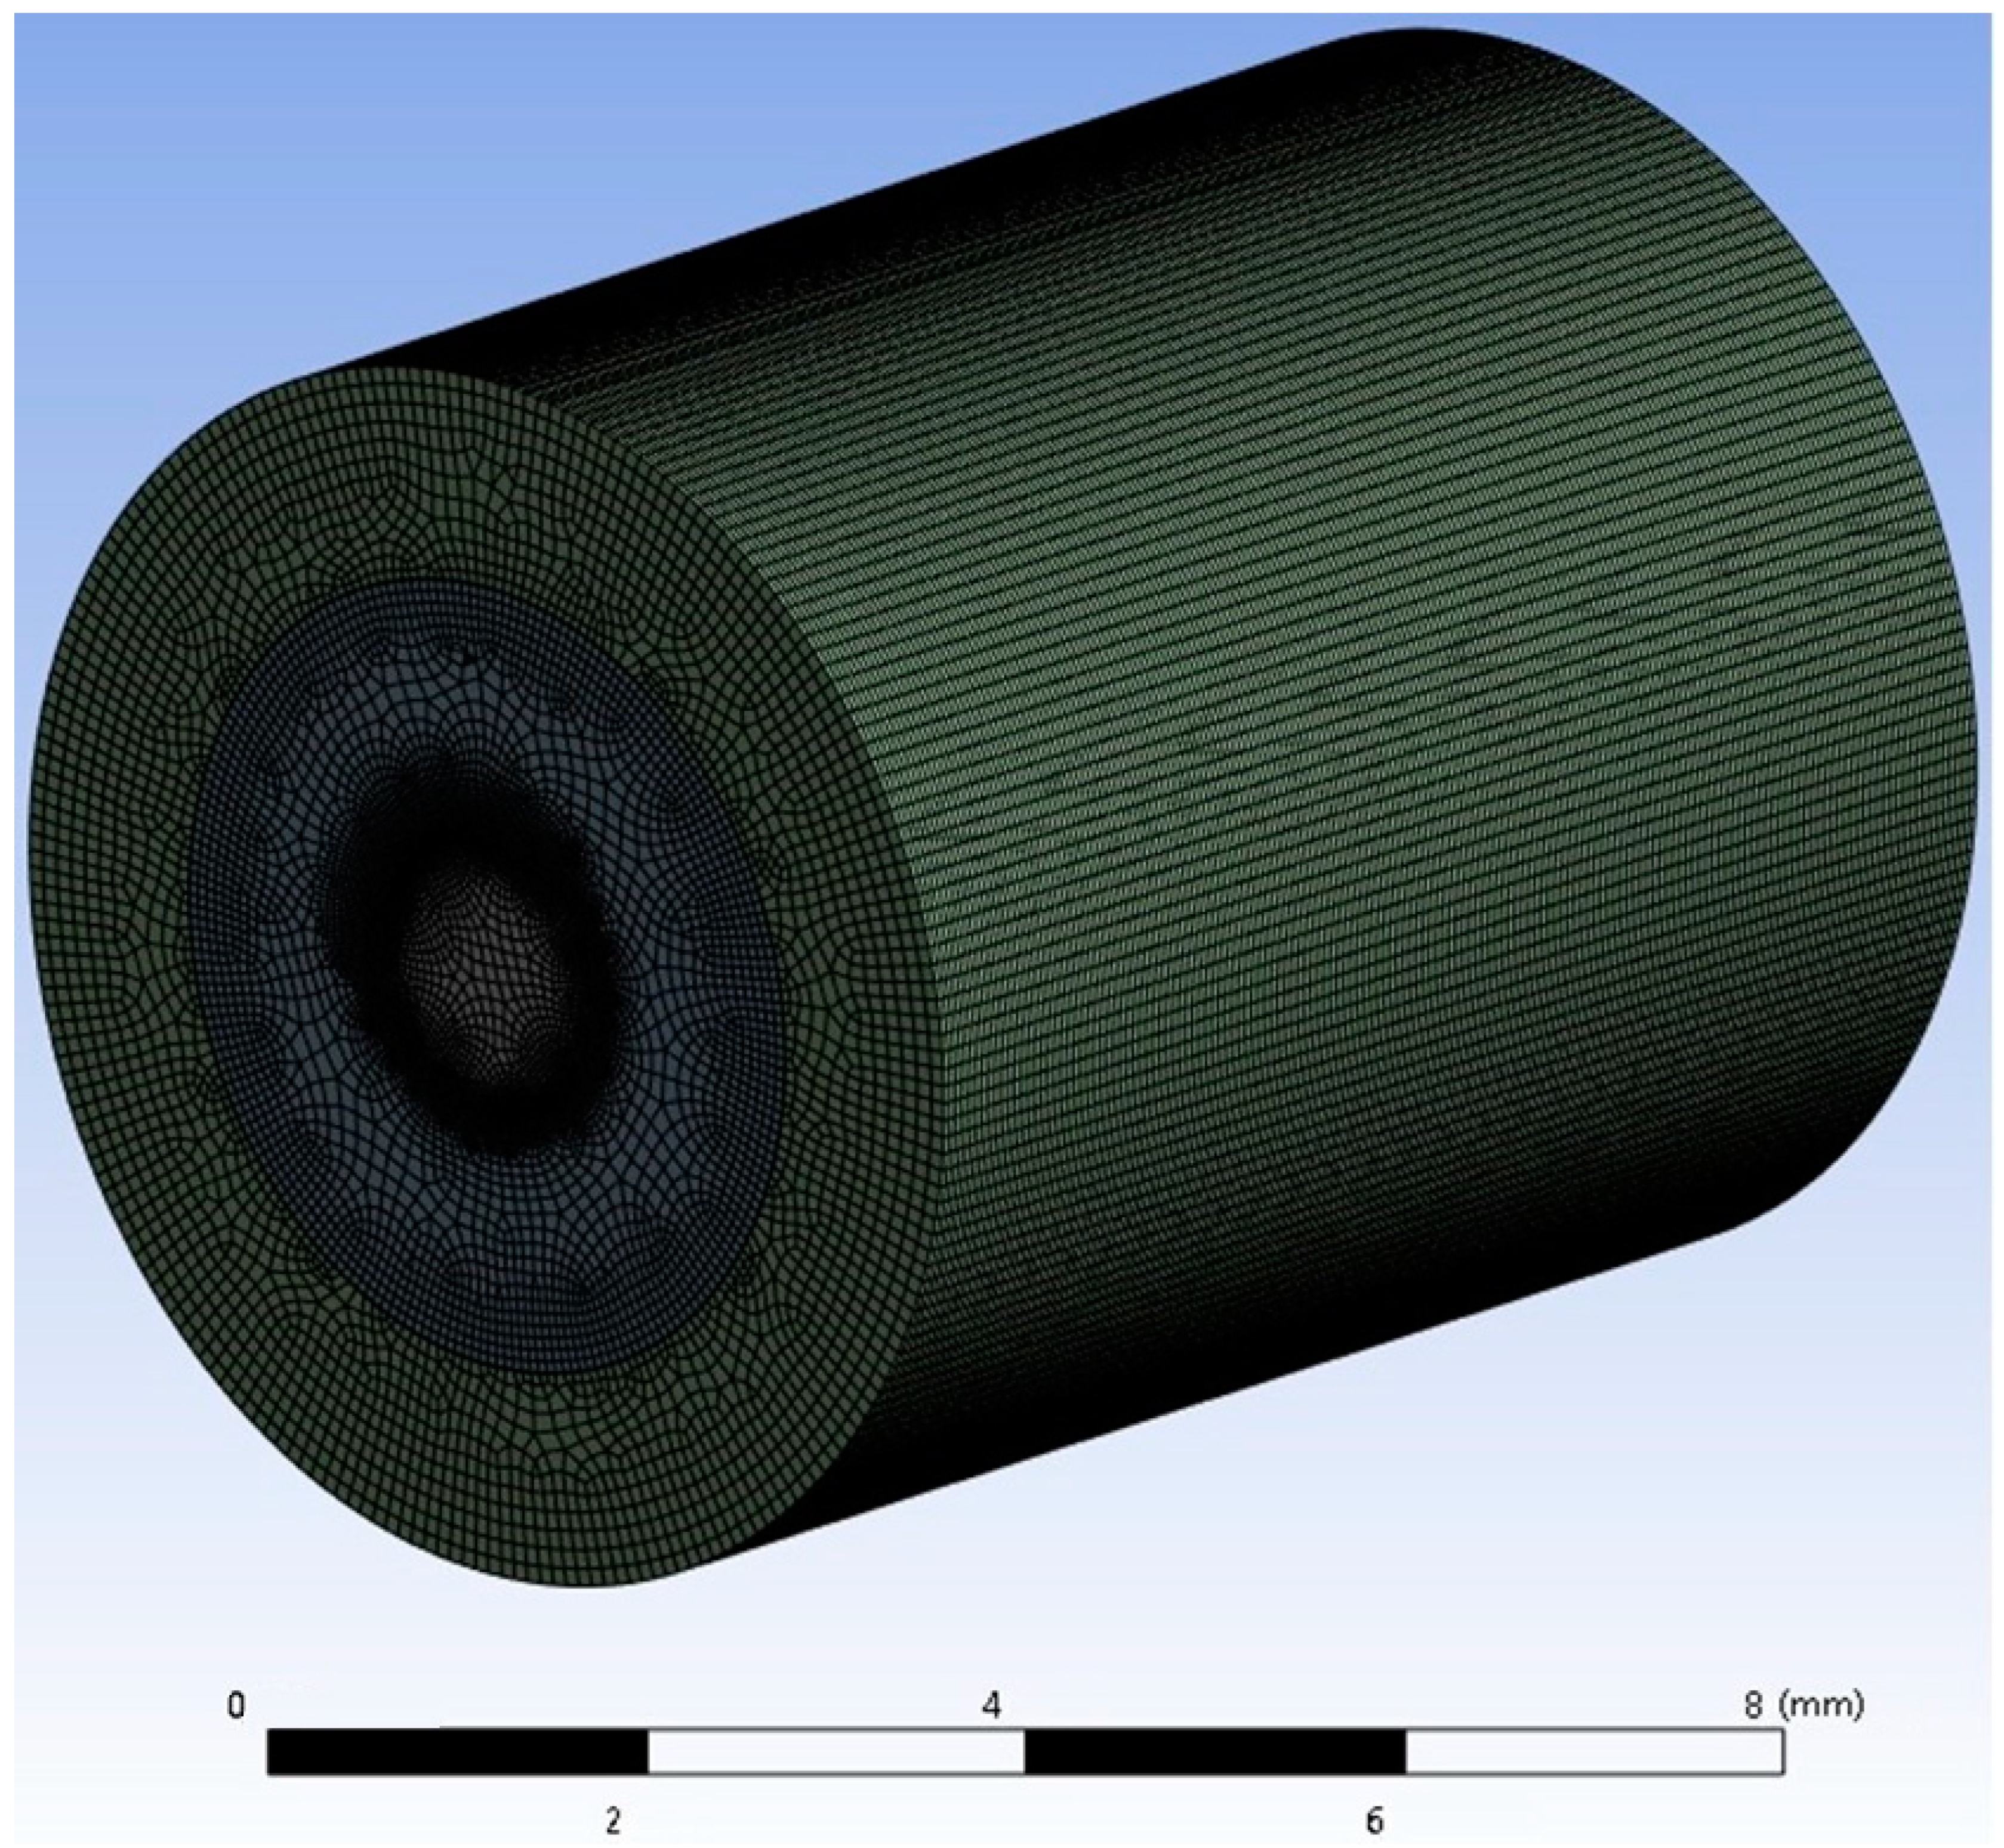
2.3. Geometry and Case Setup
3. Results and Discussion
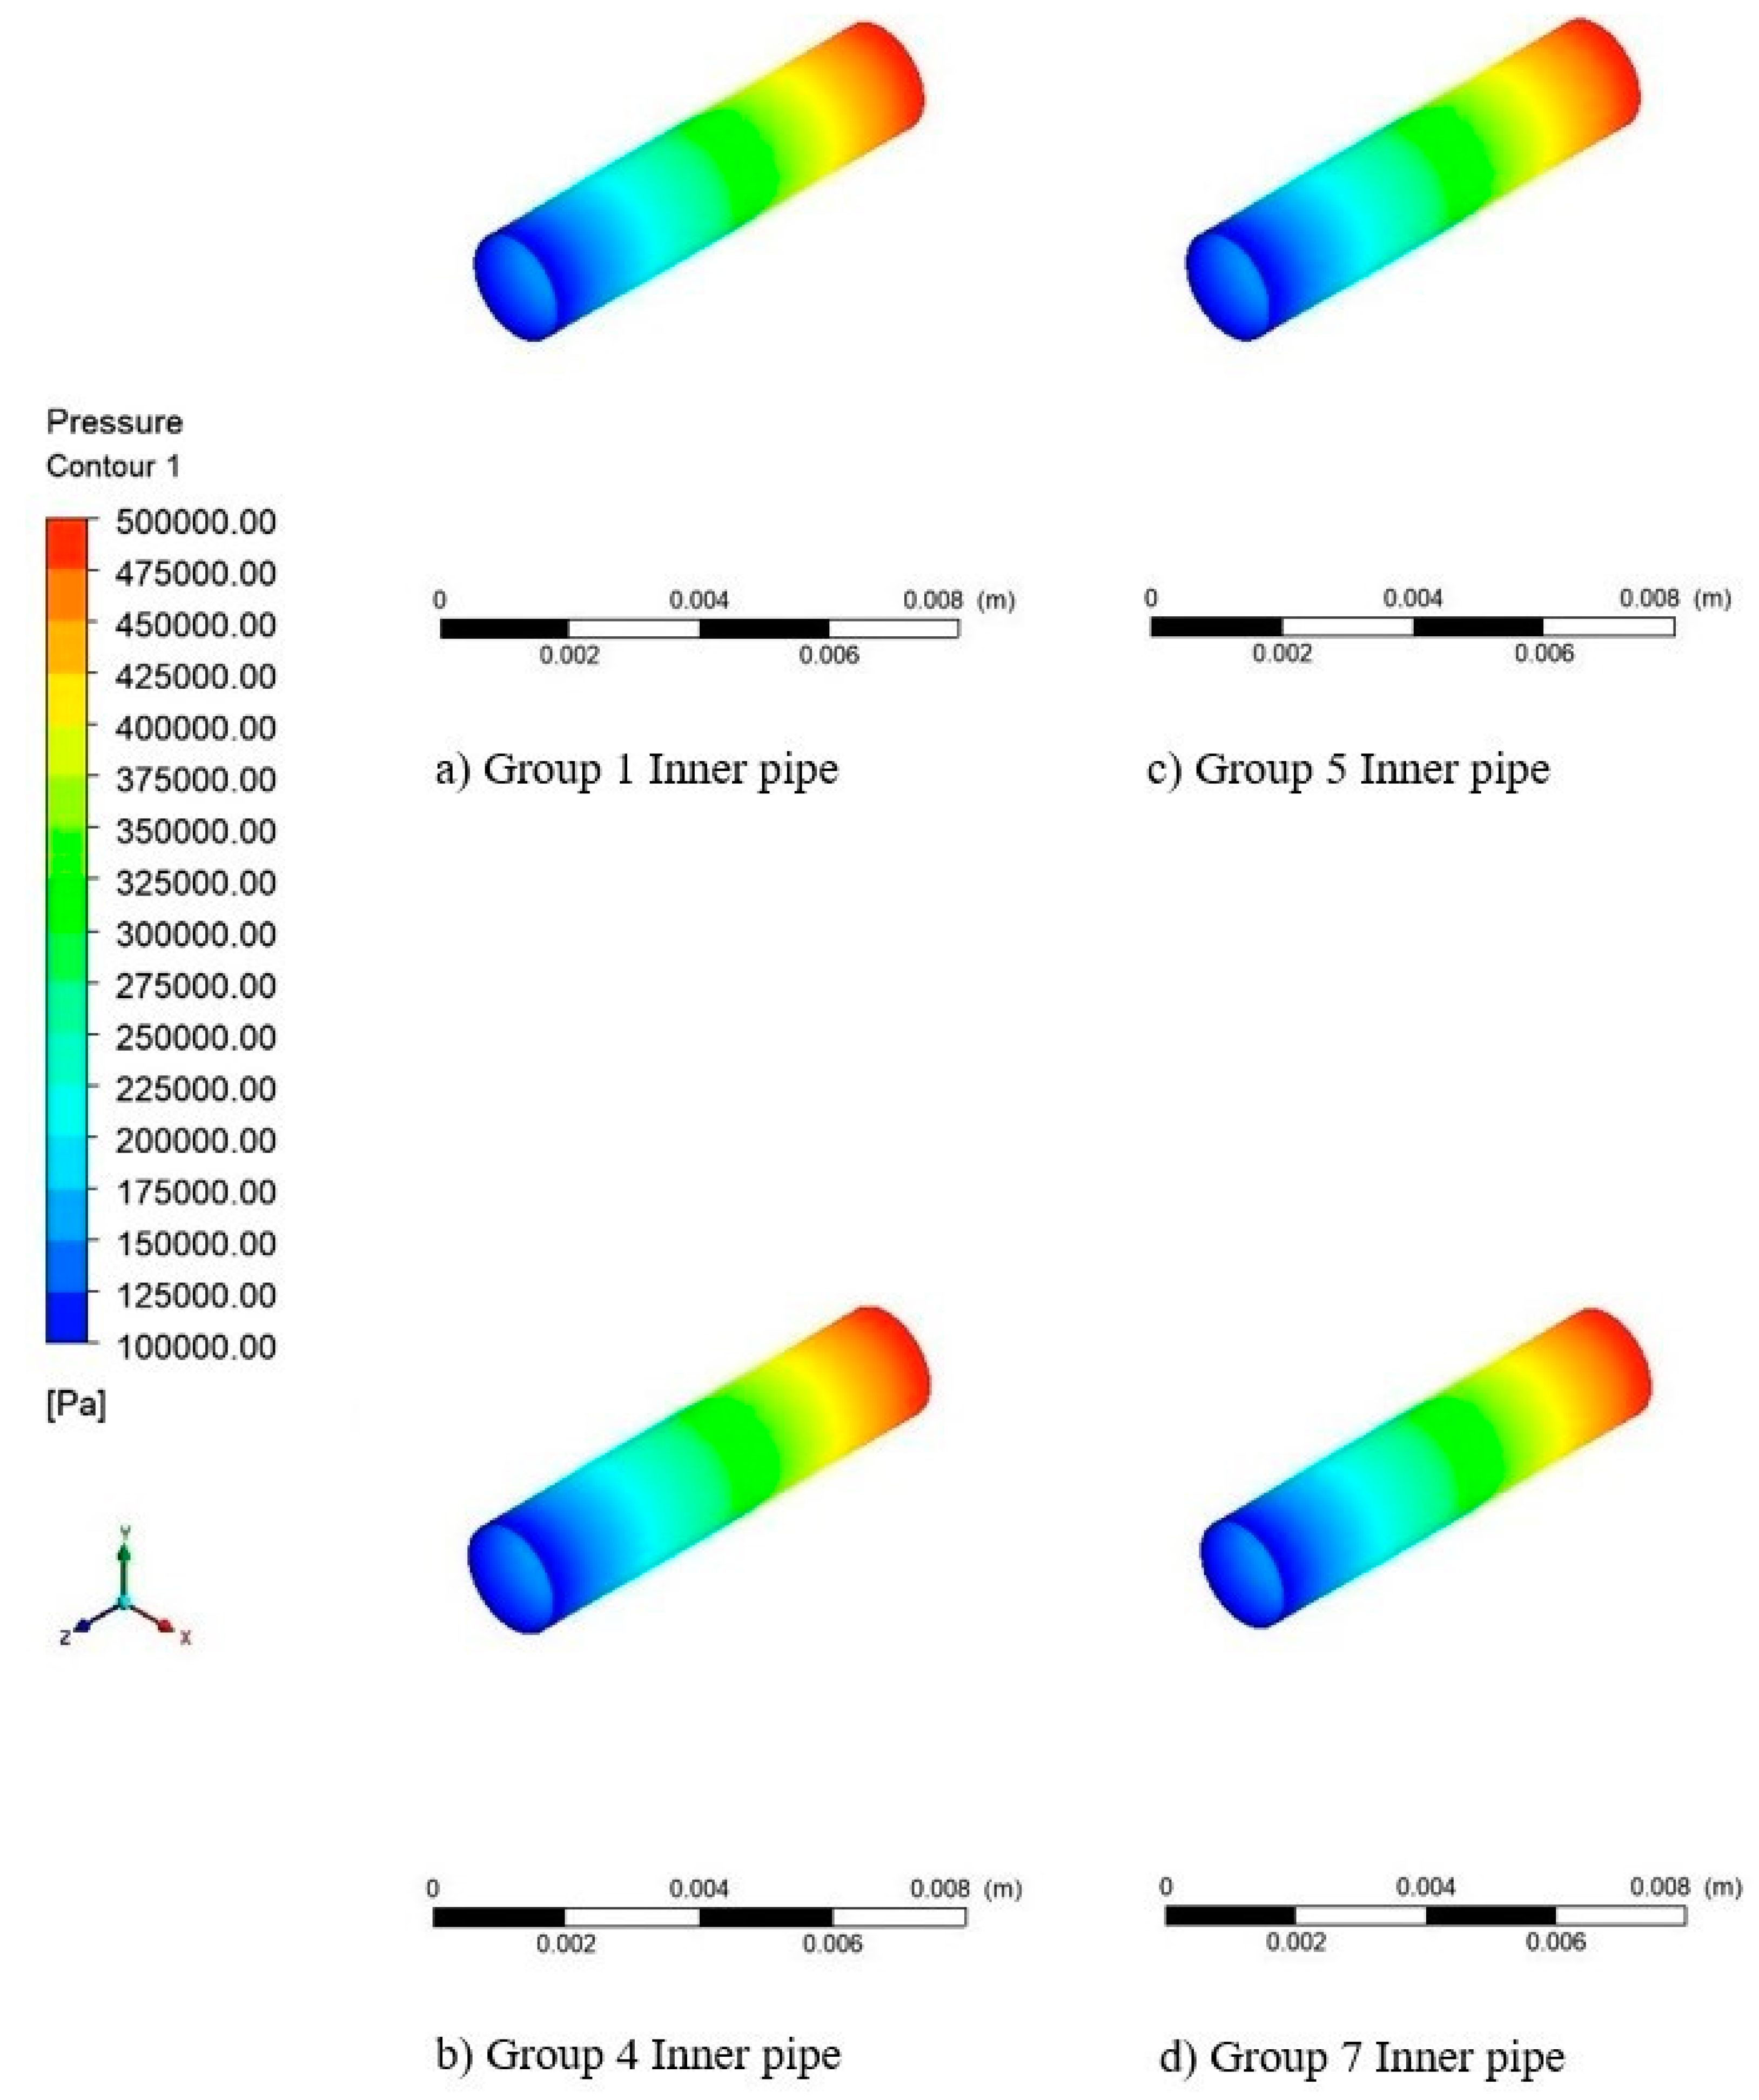
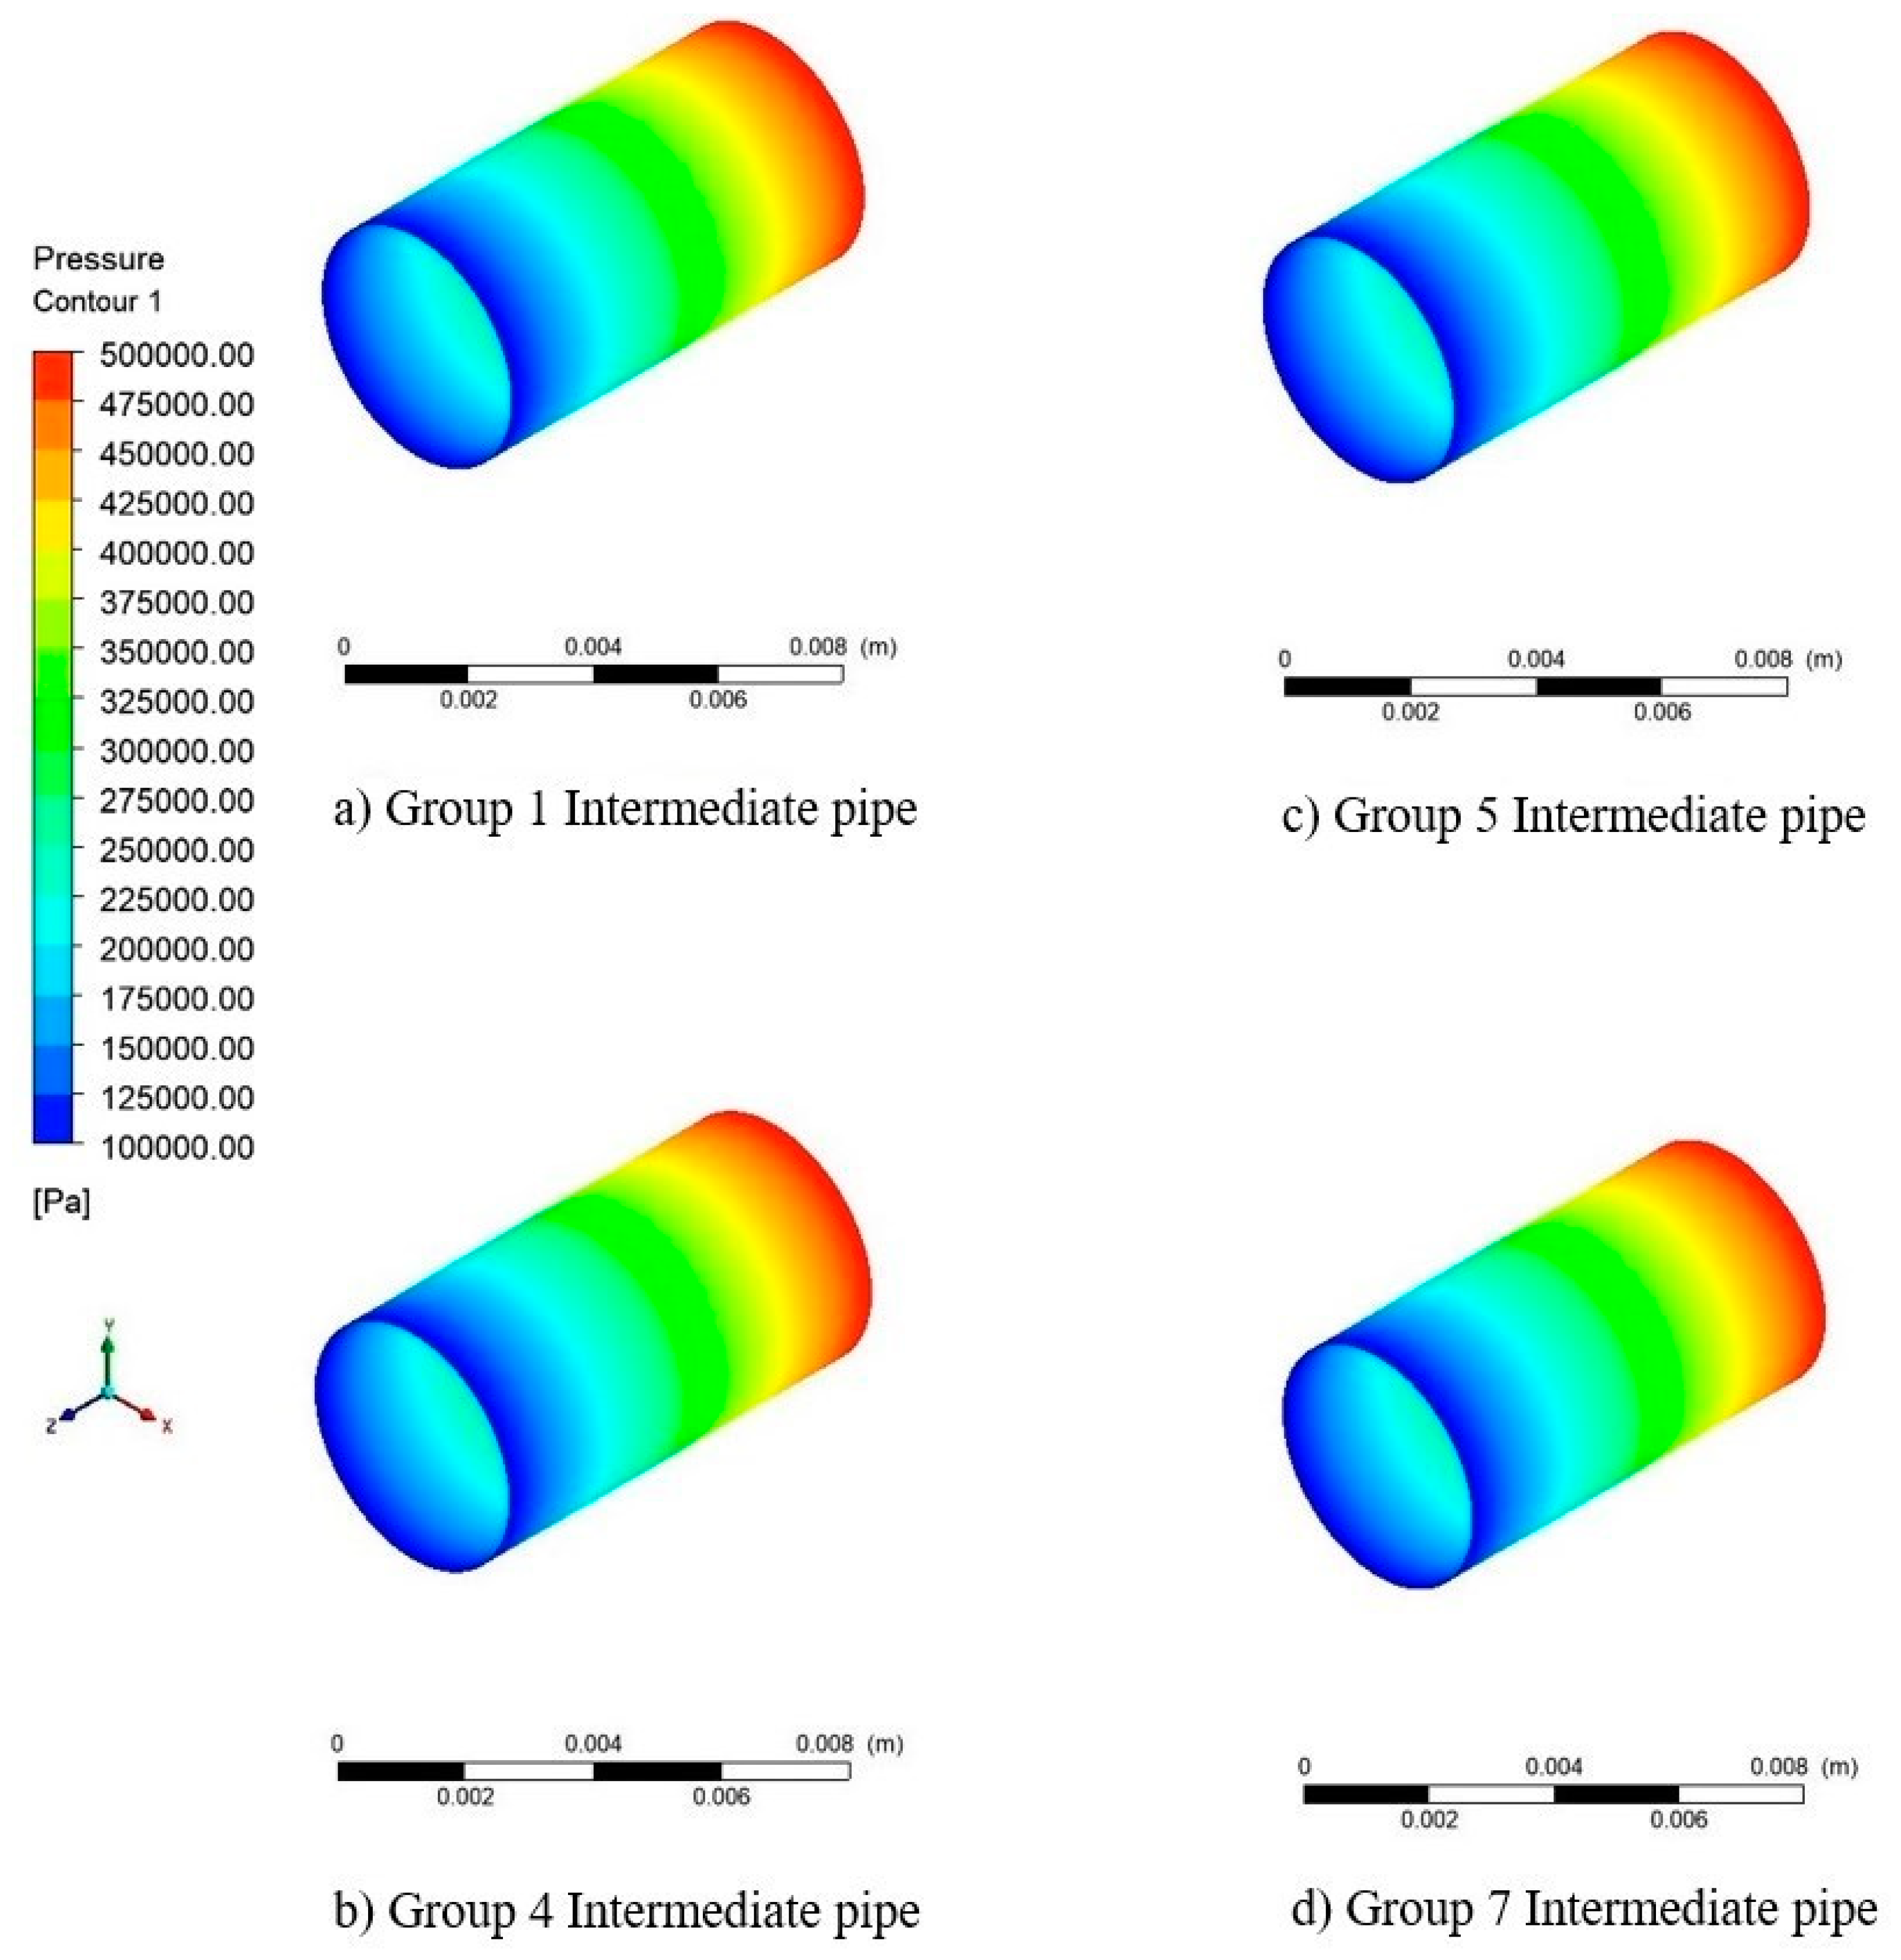
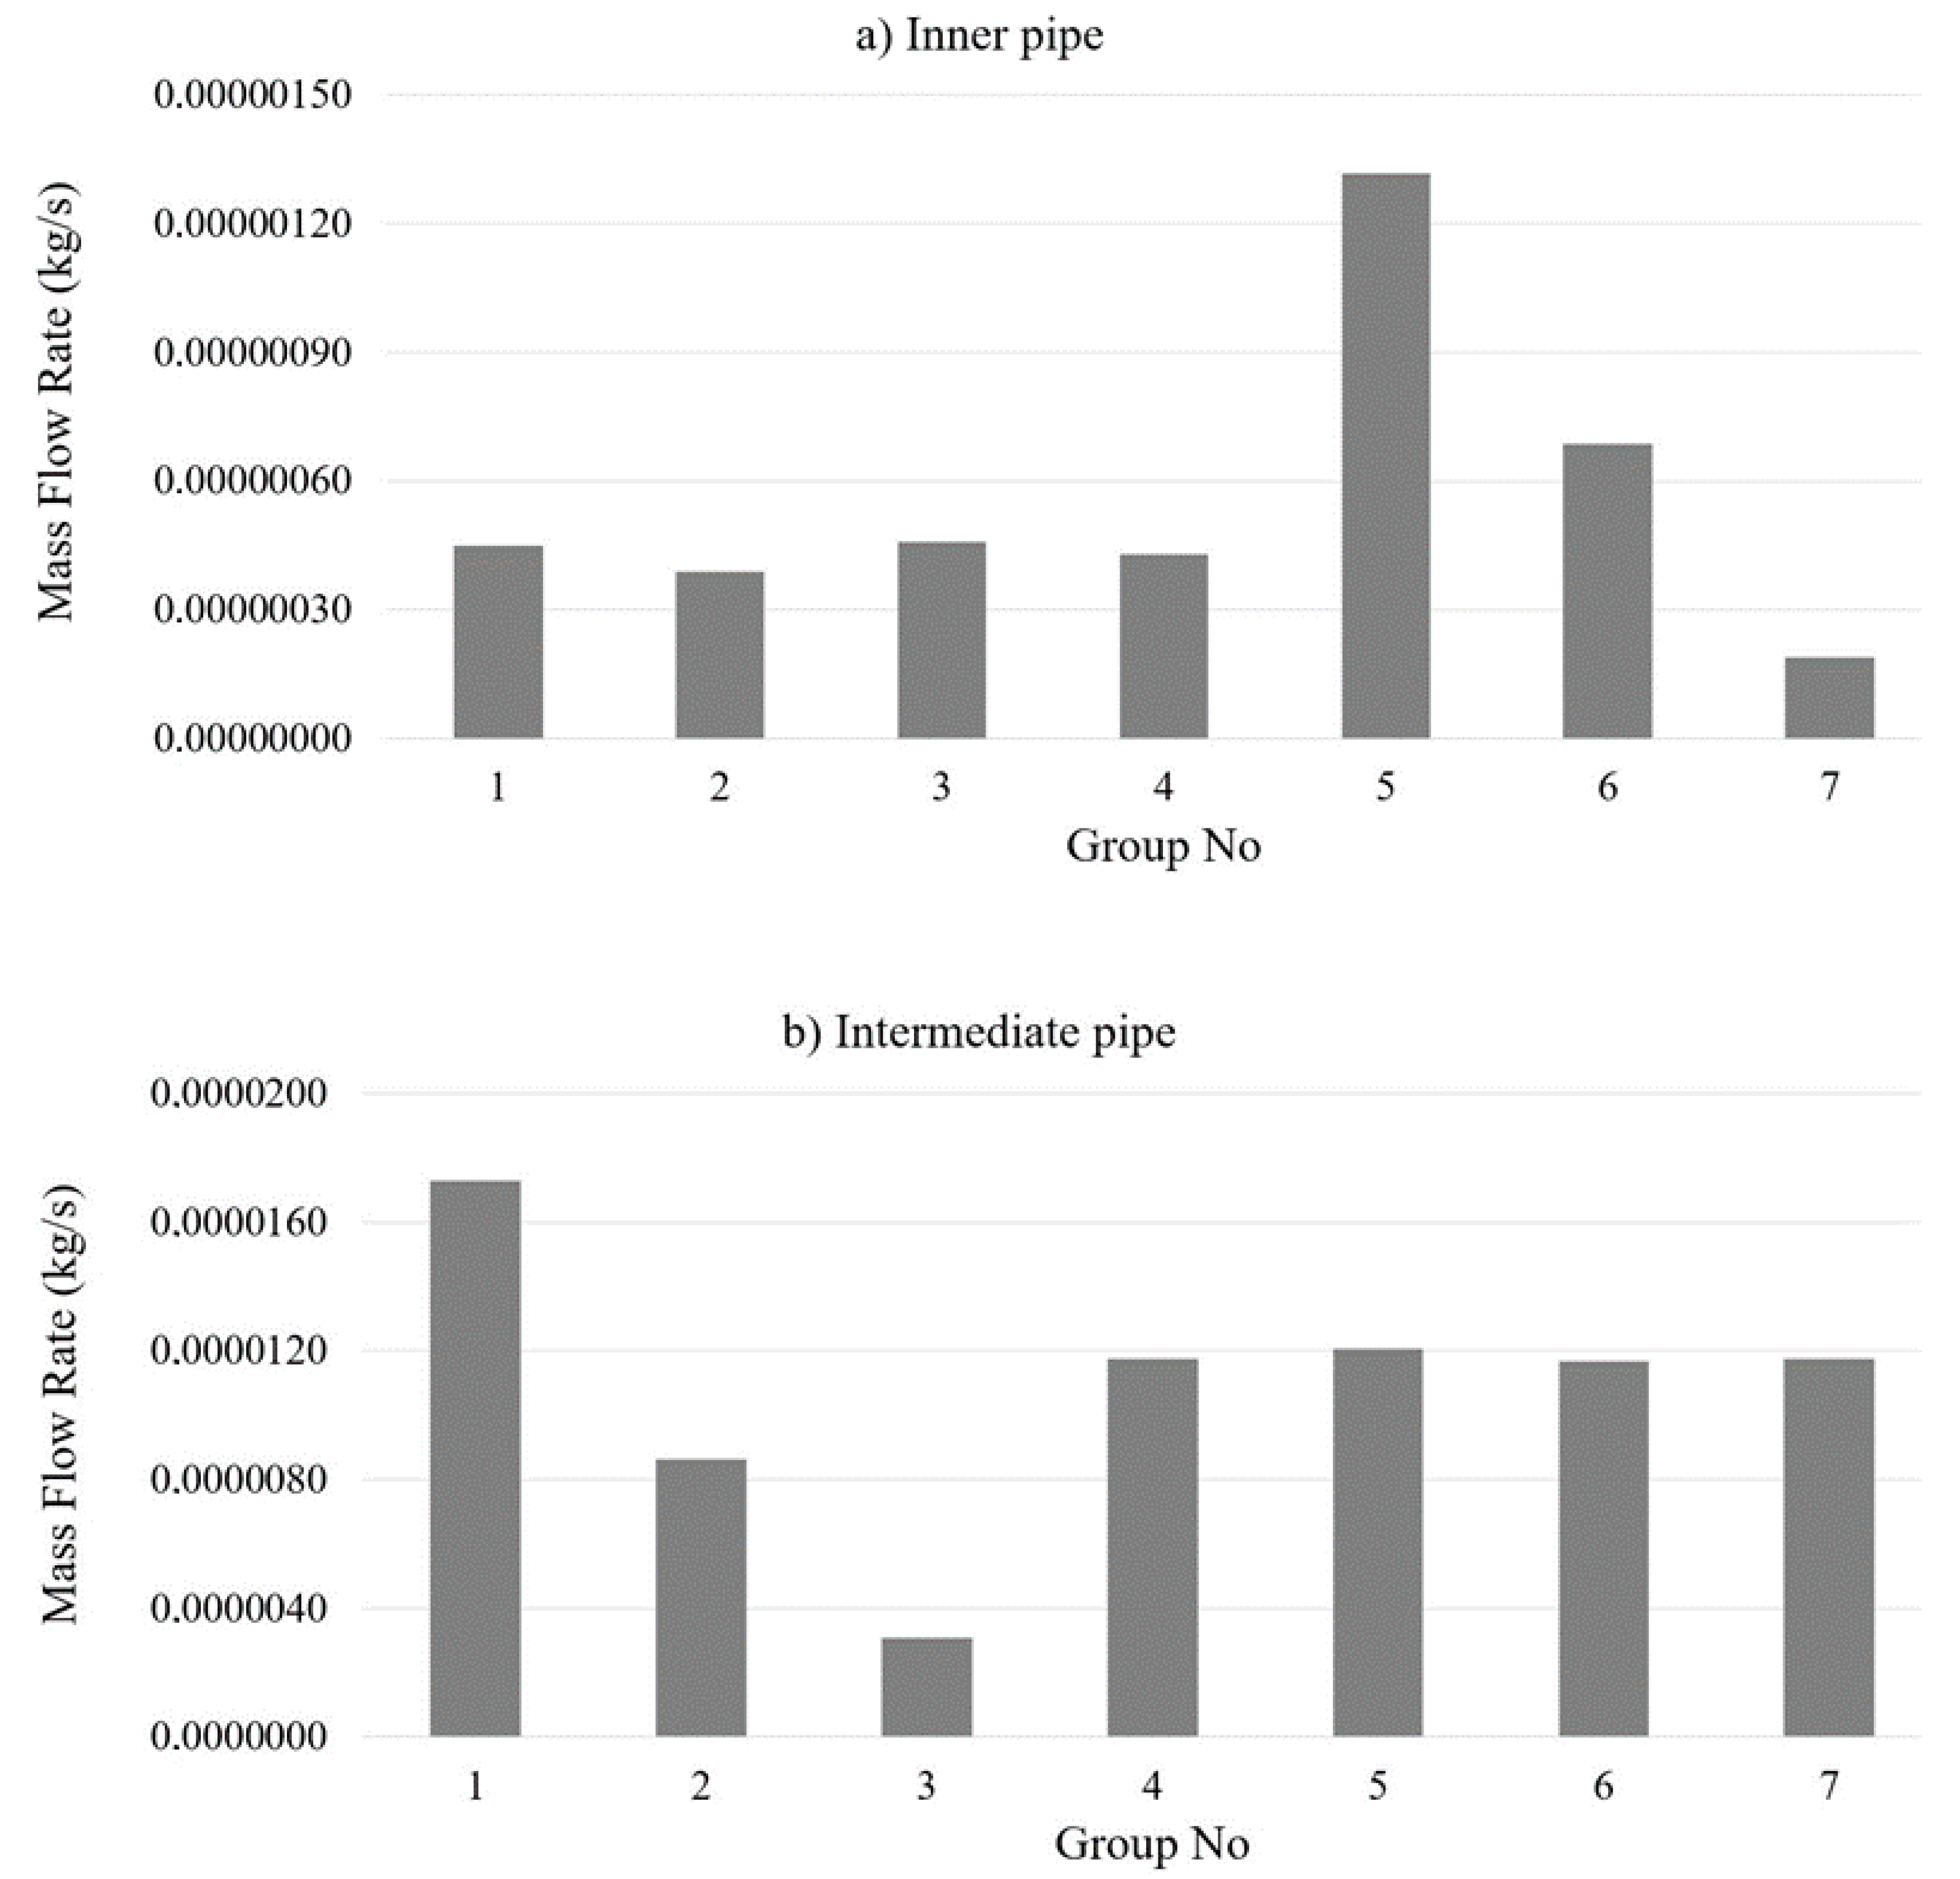
3.1. Simulation Results
3.2. Injector Function Results
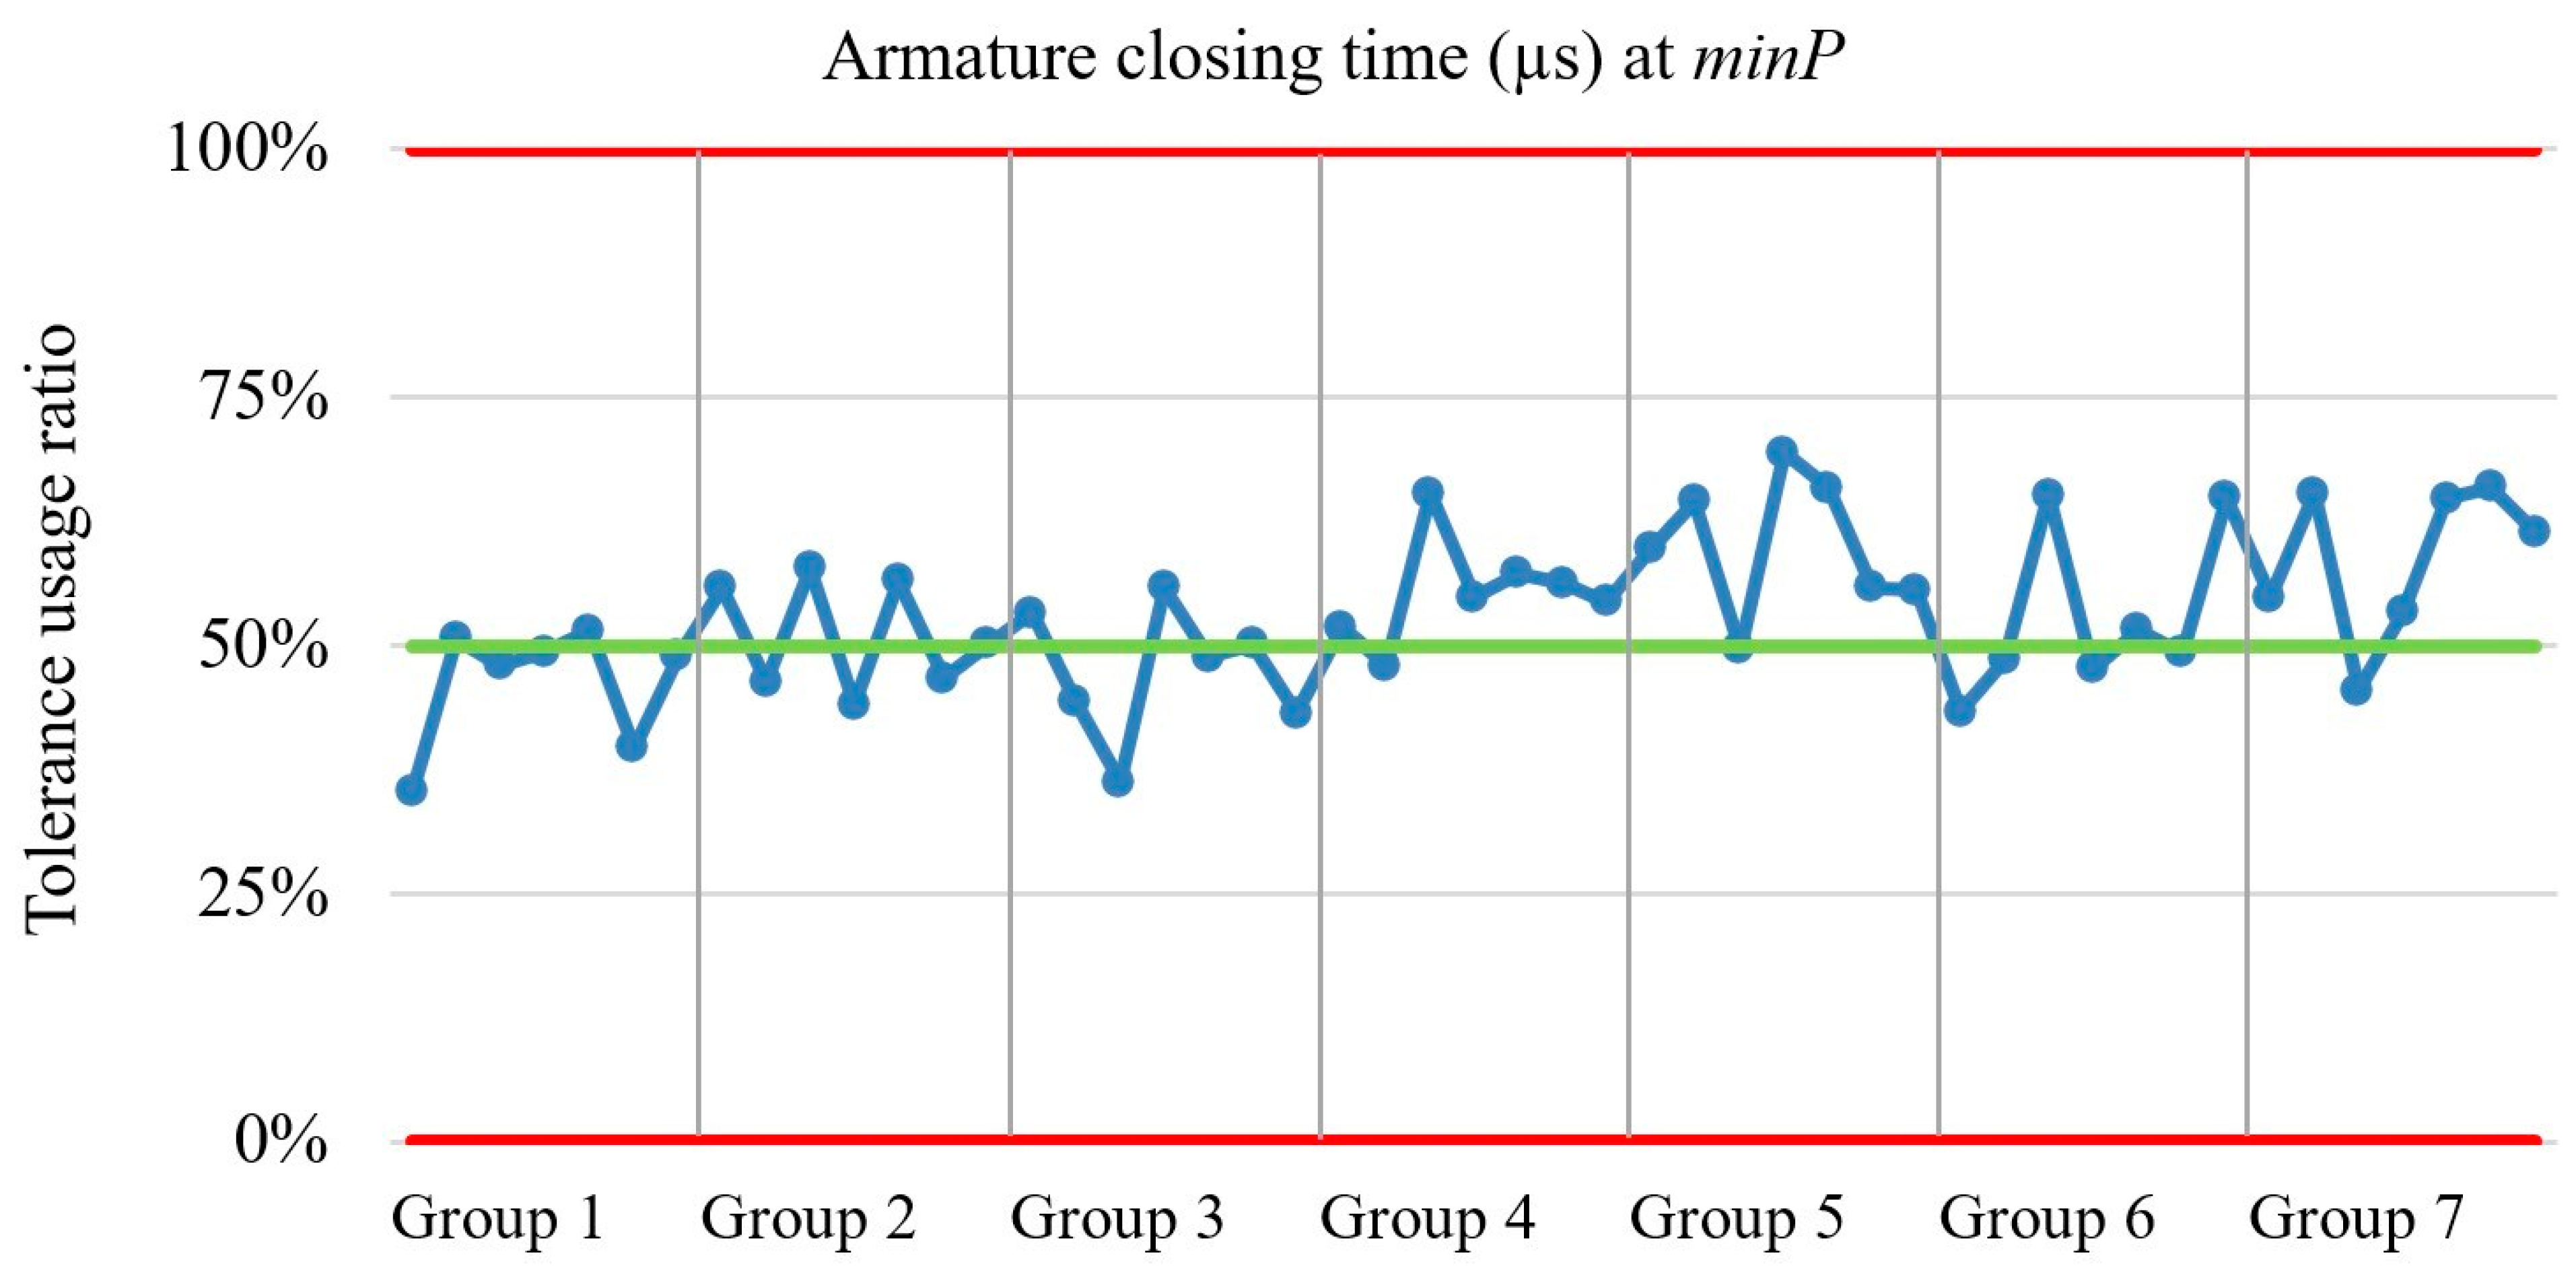
- armature opening closing time;
- injector needle opening and closing time;
- nozzle hole flow amount.
3.3. Correlation Matrix
- r = 1 indicates a perfect positive linear relationship;
- r = −1 indicates a perfect positive linear relationship;
- r = 0 indicates no linear relationship.
- The terms such as “valve inner diameter”, “armature inner diameter”, “armature outer diameter”, and “clearance between the armature and armature pin” in the correlation matrix represent inputs, while the other terms represent results.
- A value approaching +1 indicates a strong positive interaction between two variables, suggesting that as one variable increases, the other also increases.
- A value approaching −1 indicates a strong negative interaction between two variables, where one variable’s increase corresponds with the other’s decrease.
- A value approaching 0 suggests a weak or no interaction between two variables, indicating they are not significantly affected by each other.
4. Conclusions
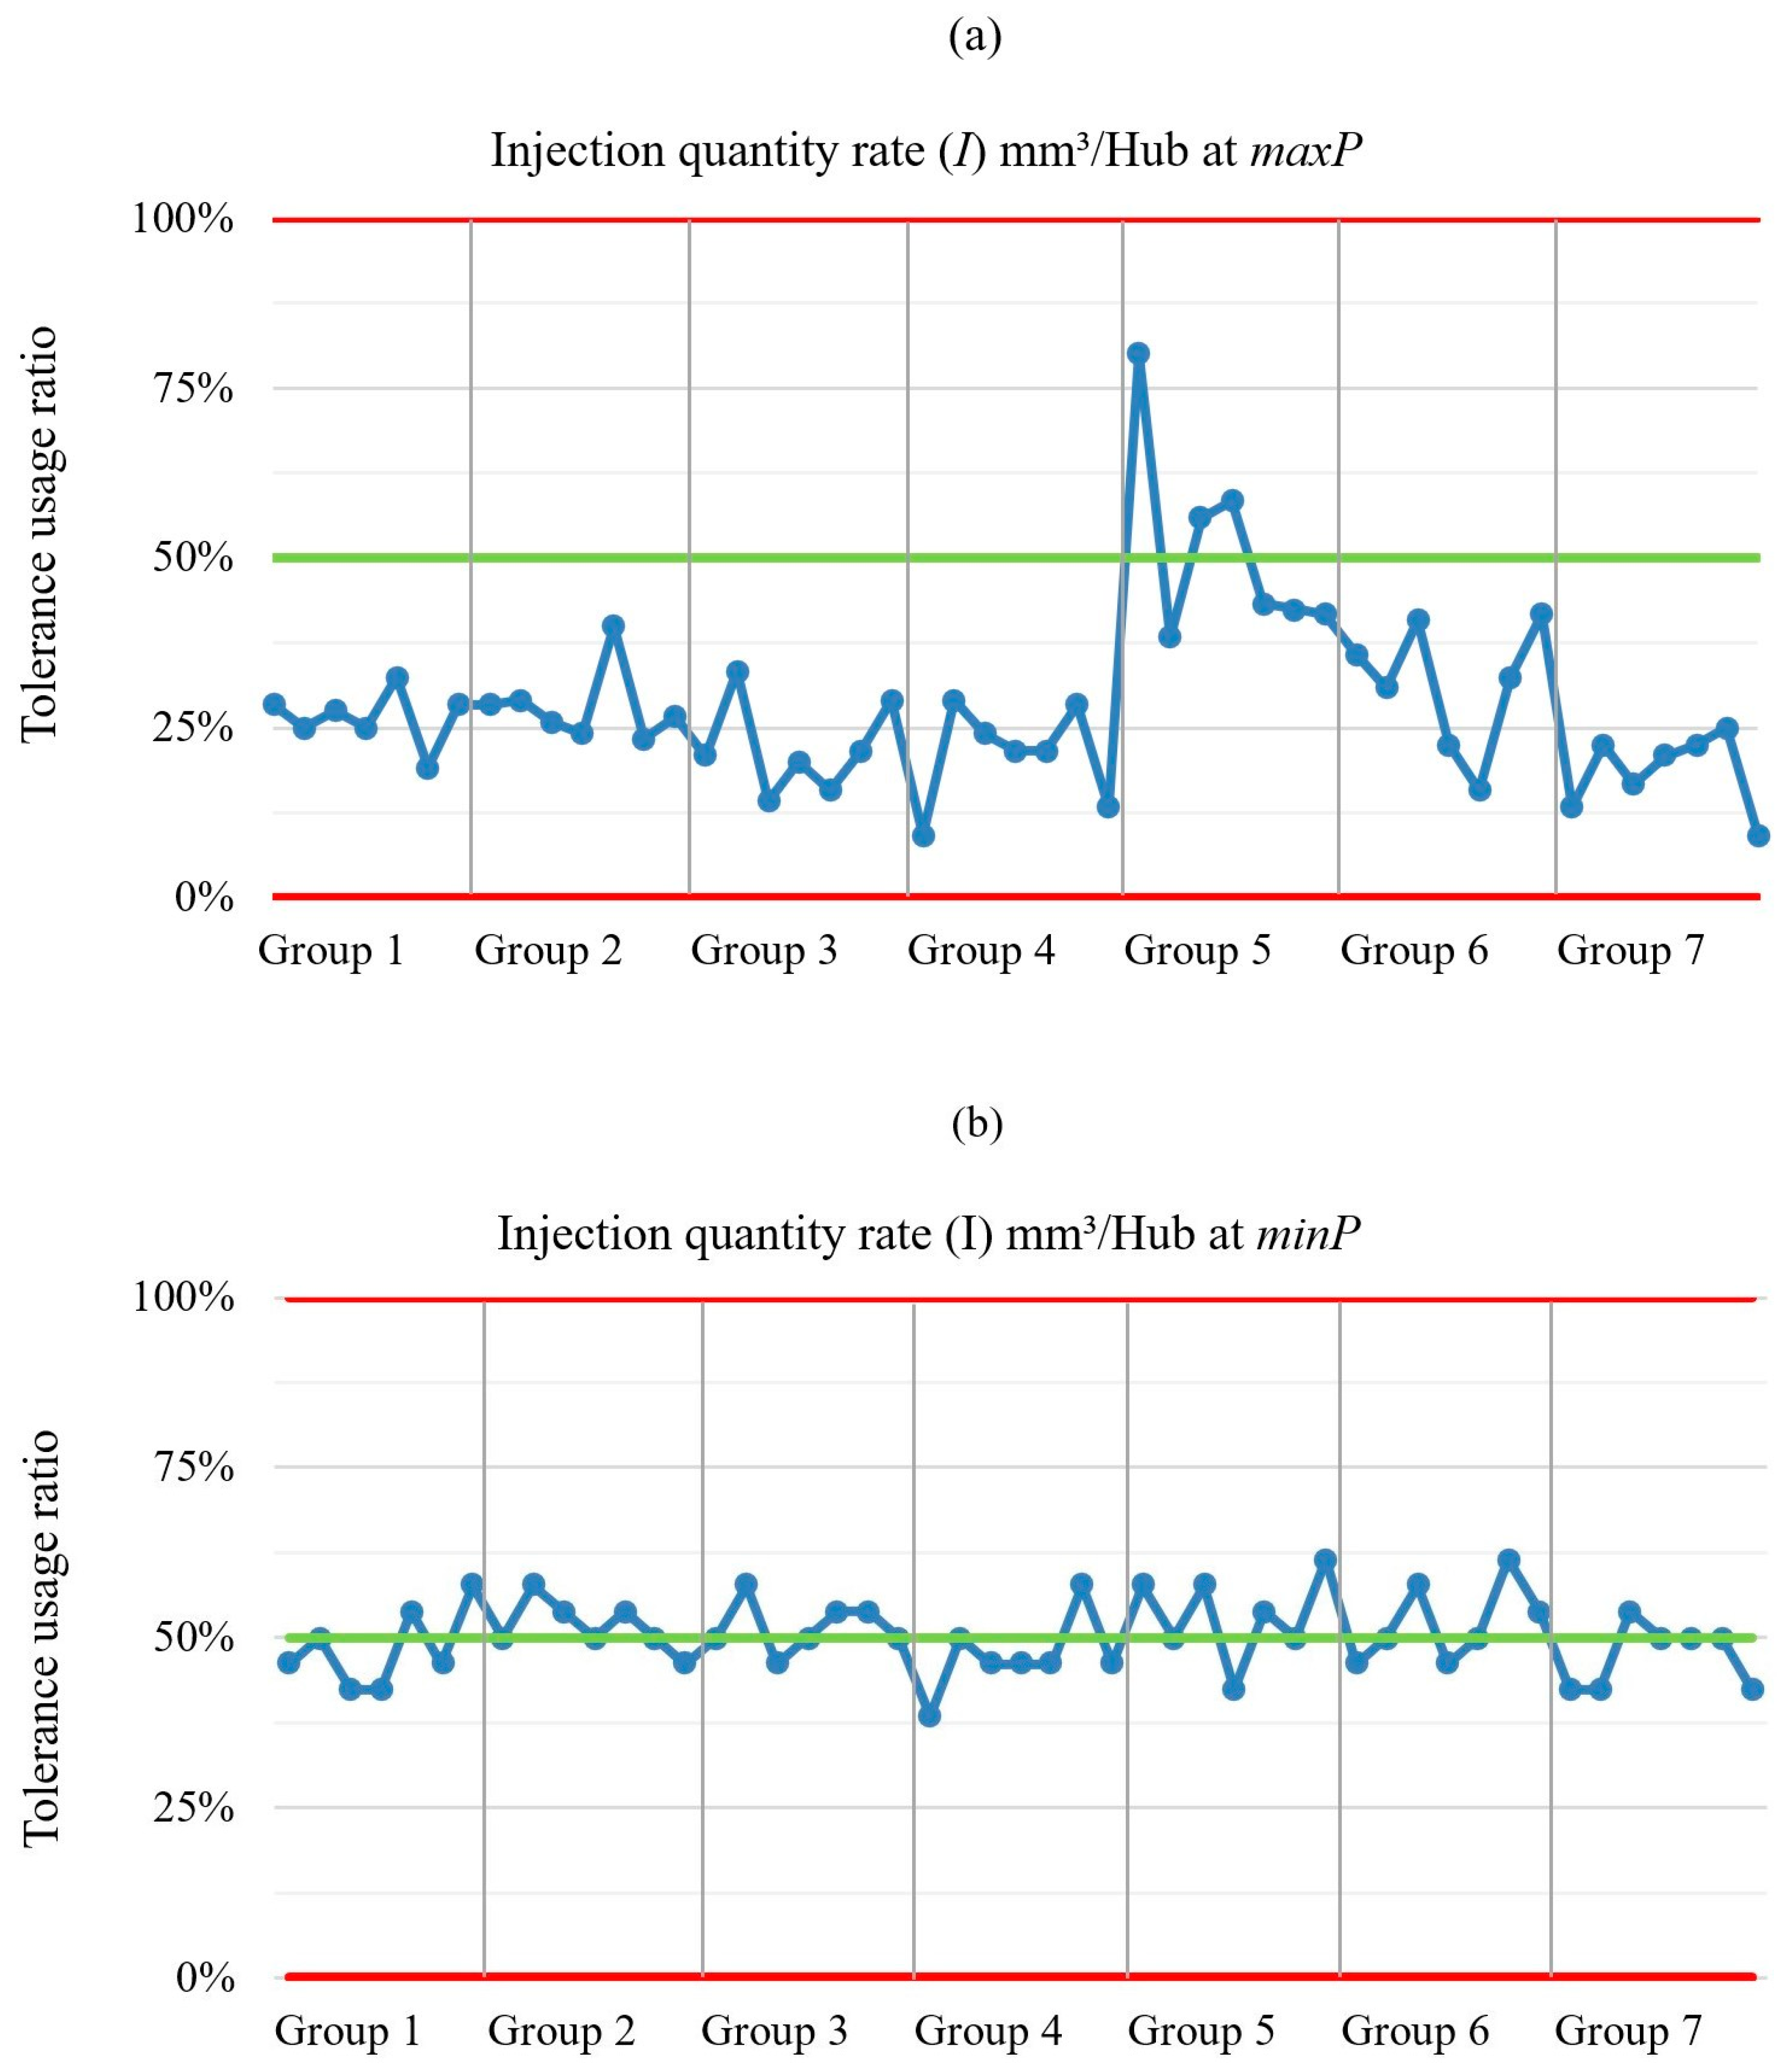
- The spray amount at maxP is notably influenced by the clearance between the armature pin and armature. Conversely, variations in the clearance between the armature and valve have minimal impact on the spray amount.
- The clearance between the armature pin and armature exerts the most significant effect at maxP. When this clearance is minimized, spray amounts at minP are comparable.
- High pressure accelerates changes in hydraulic pressure balance, resulting in earlier needle lift and longer open times during the standard magnetic trigger period, leading to increased fuel injection.
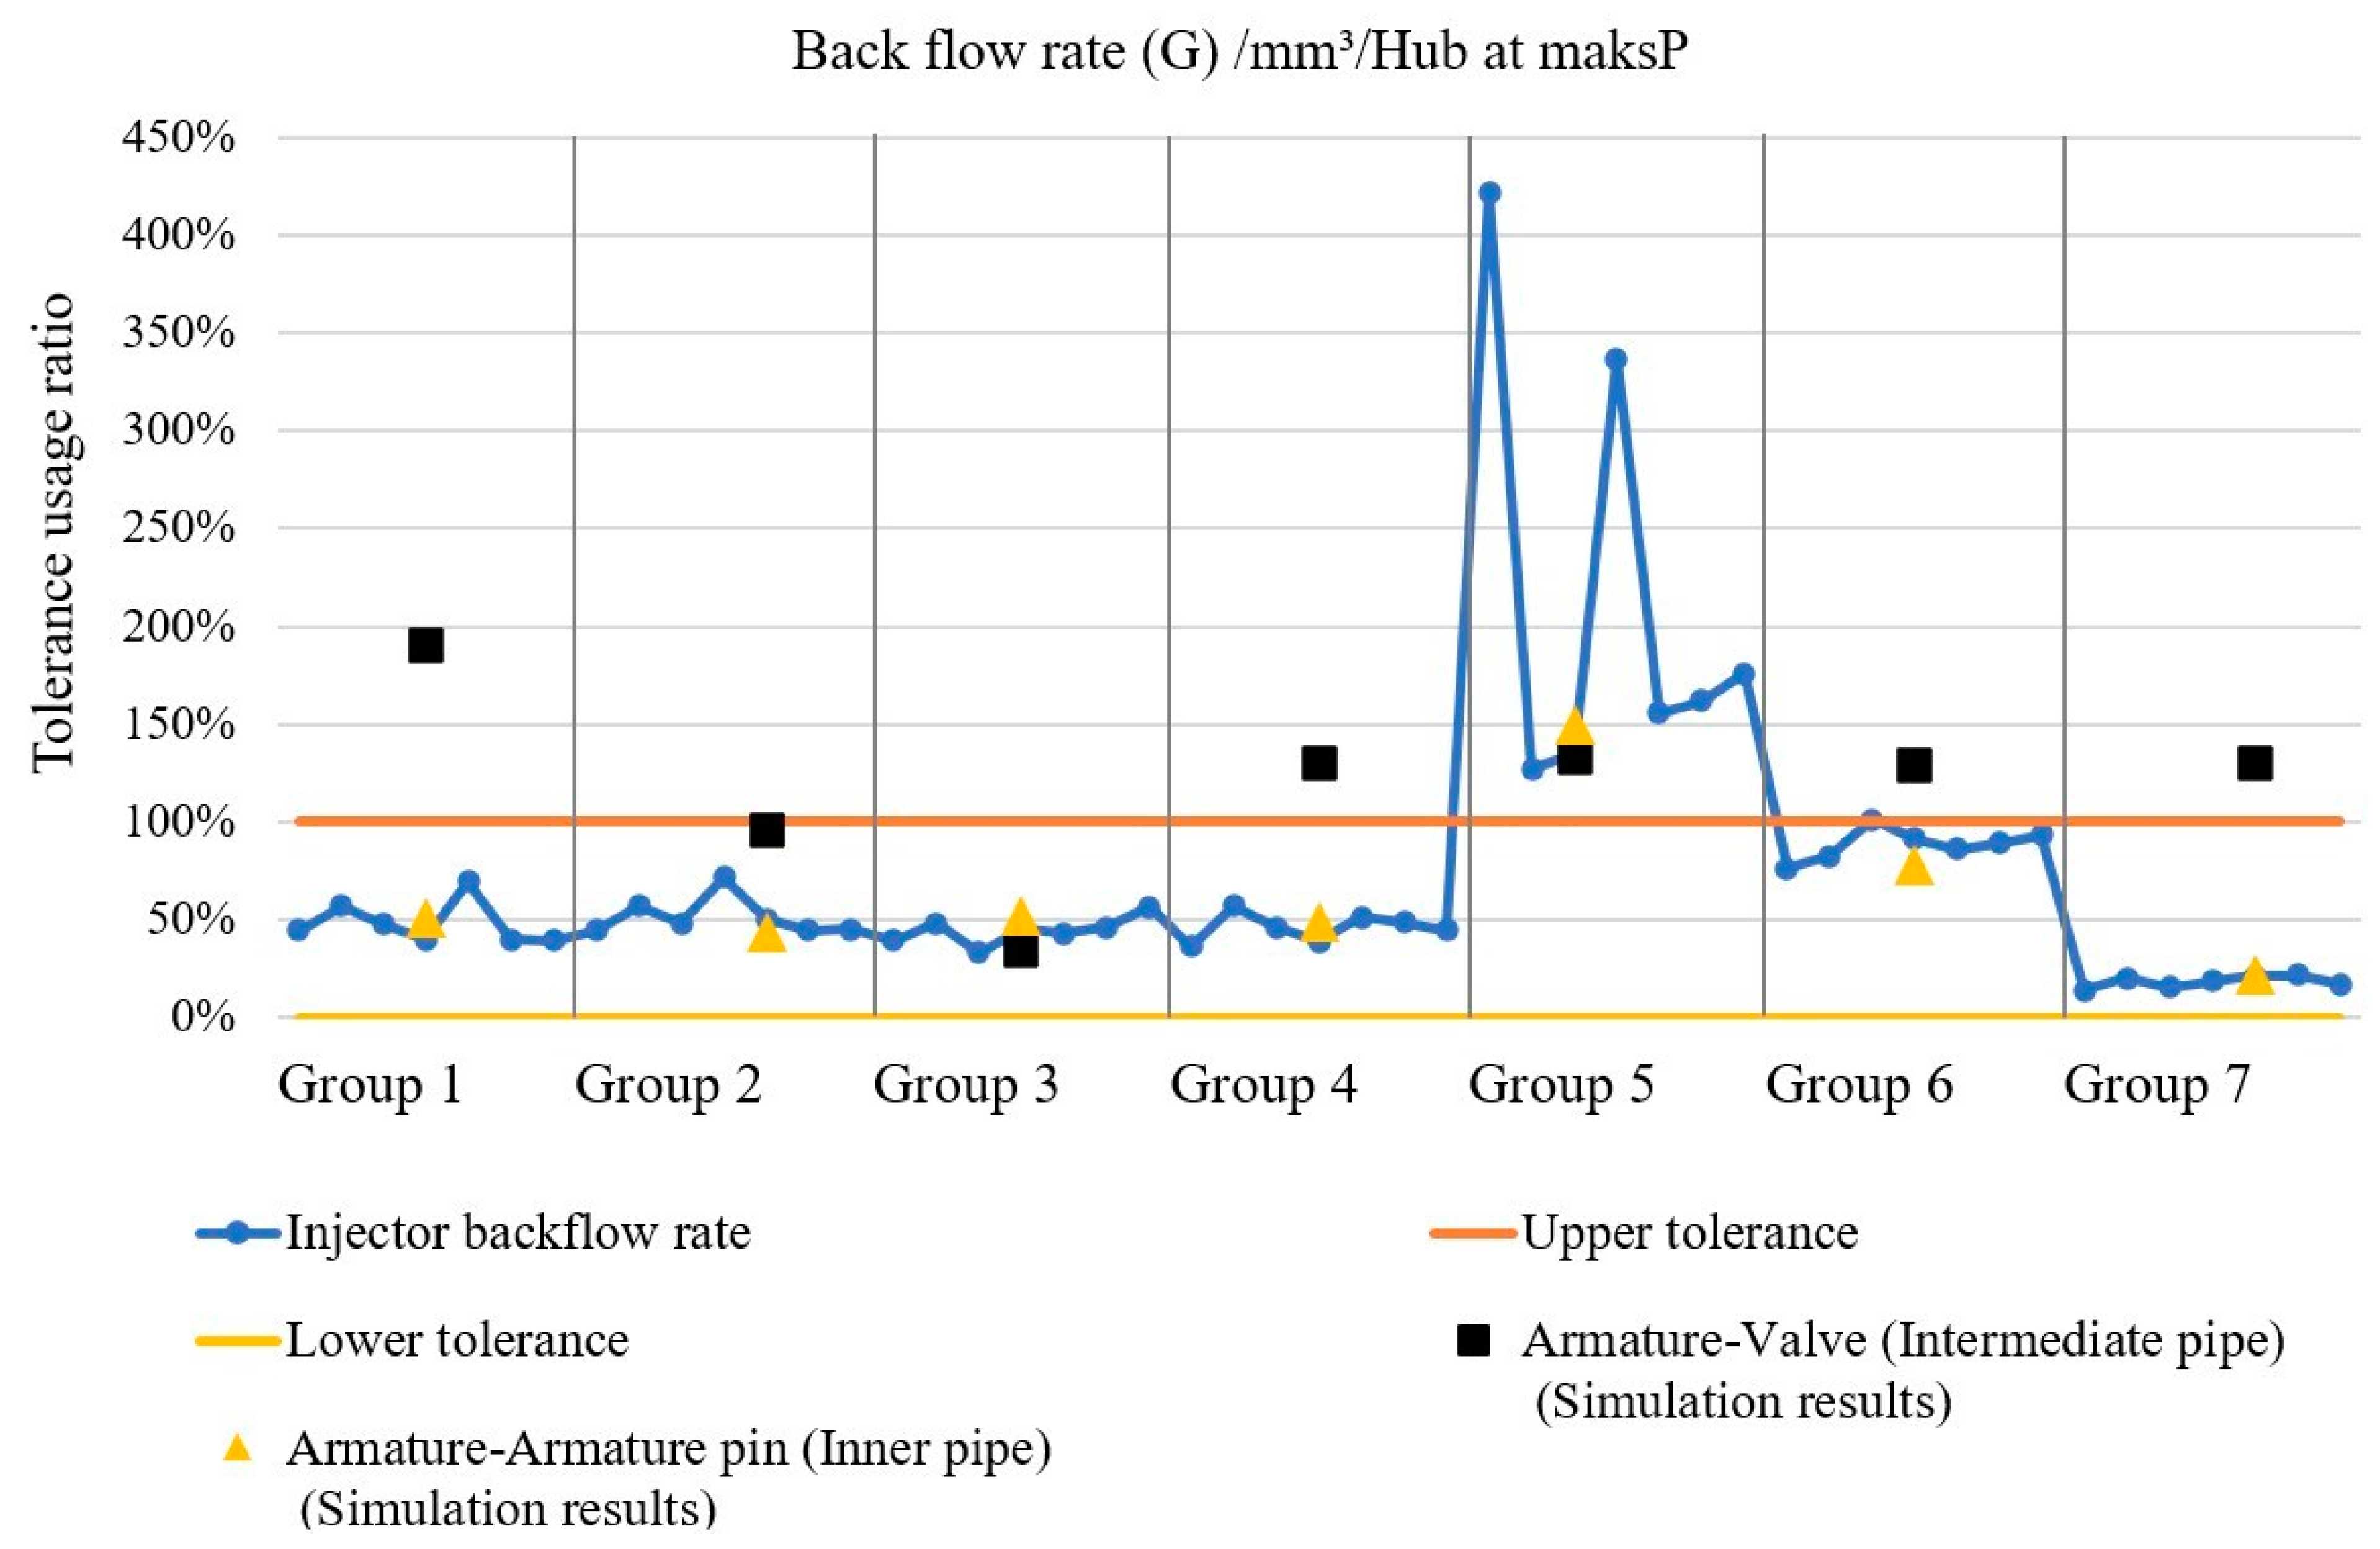
- Backflow is minimized when the clearance between the armature and armature pin is at its lowest. High pressure exacerbates forced backflow between these components and increases backflow due to needle movement.
- The amount of backflow at maxP is directly impacted by the clearance between the armature pin and armature. However, changes in the clearance between the armature and valve have minimal impact on backflow. Hence, optimizing backflow and injection quantity necessitates focusing on the armature and armature pin clearance. The continuous flow between the armature and armature pin, independent of energizing duration, further supports this phenomenon. In scenarios where there is no energizing, which corresponds to a larger portion of the injector’s lifespan, there is no flow between the valve and armature.
- The armature, armature pin, and valve are critical sub-components for creating hydraulic pressure differences and triggering needle movement in the injector. Despite being considered a black box owing to production and testing constraints, focusing on these components can yield significant improvements in injector performance and manufacturing efficiency, such as reducing scrap rates and saving cost, which lead competitive advantages
- More accurate and reliable injectors can enhance engine efficiency, reducing harmful combustion emissions and positively impacting environmental safety.
- Similar methodologies can be employed to separately evaluate the effects of all injector sub-parts on injector function, identifying critical areas for improvement studies.
Author Contributions
Funding
Data Availability Statement
Conflicts of Interest
References
- Payri, R.; Salvador, F.J.; Gimeno, J.; Morena, D. Influence of injector technology on injection and combustion development-Part1: Hydraulic characterization. Appl. Energy 2011, 88, 1068–1074. [Google Scholar] [CrossRef]
- Huang, W.; Moon, S.; Gao, Y.; Li, Z.; Wang, J. Eccentric needle motion effect on near-nozzle dynamics of diesel spray. Fuel 2017, 206, 409–419. [Google Scholar] [CrossRef]
- Teoh, Y.H.; How, H.G.; Peh, C.G.; Le, T.D.; Nguyen, H.T. Implementation of Common Rail Direct Injection System and Optimization of Fuel Injector Parameters in an Experimental Single-Cylinder Diesel Engine. Processes 2020, 8, 1122. [Google Scholar] [CrossRef]
- Lim, G.; Lee, S.; Park, C.; Choi, Y. Effect of ignition timing retard strategy on NOx reduction in hydrogen-compressed natural gas blend engine with increased compression ratio. Int. J. Hydrogen Energy 2013, 39, 2399–2408. [Google Scholar] [CrossRef]
- Natarajan, S.; Trasy, K.A.; Srihari, N.; Raja, S. Effects of injection timing on CI engine fuelled with algae oil blend with Taguchi technique. Energy Procedia 2017, 105, 1043–1050. [Google Scholar] [CrossRef]
- Ashok, B.; Nanthagopal, K.; Raj, R.T.K.; Bhasker, J.P.; Vignesh, D.S. Influence of injection timing and exhaust gas recirculation of a Calophyllum inophyllum methyl ester fuelled CI engine. Fuel Process. Technol. 2017, 167, 18–30. [Google Scholar] [CrossRef]
- How, H.G.; Masjuki, H.H.; Kalam, M.A.; Teoh, Y.H. Influence of injection timing and split injection strategies on performance, emissions, and combustion characteristics of diesel engine fueled with biodiesel blended fuels. Fuel 2018, 213, 106–114. [Google Scholar] [CrossRef]
- Khalid, A.; Manshoor, B. Effect of high injection pressure on mixture formation, burning process and combustion characteristics in diesel combustion. World Acad. Sci. Eng. Technol. 2012, 71, 73–77. [Google Scholar]
- Chen, P.-C.; Wang, W.-C.; Roberts, W.I.; Fang, T. Spray and atomization of diesel fuel and its alternatives from a single-hole injector using a common rail fuel injection system. Fuel 2013, 103, 850–861. [Google Scholar] [CrossRef]
- Xu-Gang, T.; Hai-Lang, S.; Tao, Q.; Zhi-Qiang, F.; Wen-Hui, Y. The impact of common rail system’s control parameters on the performance of high-power diesel. Energy Procedia 2012, 16, 2067–2072. [Google Scholar] [CrossRef]
- Gumus, M.; Sayin, C.; Canakci, M. The impact of fuel injection pressure on the exhaust emission of a direct injection diesel engine fueled with biodiesel-diesel fuel blends. Fuel 2012, 95, 486–494. [Google Scholar] [CrossRef]
- Nanthagopal, K.; Ashok, B.; Raj, R.T.K. Influence of fuel injection pressures on Calophyllum inophyllum methyl ester fuelled direct injection diesel engine. Energy Convers. Manag. 2016, 116, 165–173. [Google Scholar] [CrossRef]
- Wang, Z.; Wyszynski, M.L.; Xu, H.; Abdullah, N.R.; Piaszyk, J. Fuel injection and combustion study by the combination of mass flow rate and heat release rate with single and multiple injection strategies. Fuel Process. Technol. 2015, 132, 118–132. [Google Scholar] [CrossRef]
- Zhuang, J.; Qiao, X.; Bai, J.; Hu, Z. Effect of injection-strategy on combustion, performance and emission characteristics in a DI-diesel engine fueled with diesel from direct coal liquefaction. Fuel 2014, 121, 141–148. [Google Scholar] [CrossRef]
- Chau, V.T.; Long, T.D.; Vang, H.B.; Hoang, N.M.; Phuc, N.H.; Sy, N.Q. A study on the injection rate characteristics of the solenoid common-rail injector under using a high-pressure fuel system. Jurnal Teknologi 2023, 85, 25–33. [Google Scholar] [CrossRef]
- Gao, Z.; Li, G.; Xu, C.; Li, H.; Wang, M. A calculation method and experiment study of high-pressure common rail injection rate with solenoid injectors. Sci. Prog. 2021, 104, 1–25. [Google Scholar] [CrossRef] [PubMed]
- Zhao, J.; Zhao, S.; Grekhov, L. Study on transient fuel hydrodynamic force characteristics of high-speed solenoid valve for common rail injector. Int. J. Automot. Technol. 2020, 21, 1257–1269. [Google Scholar] [CrossRef]
- Chung, M.; Kim, J.; Kim, S.; Sung, G.; Lee, J. Effects of hydraulic flow and spray characteristics on diesel combustion in CR direct-injection engine with indirect-acting Piezo injector. J. Mech. Sci. Technol. 2015, 29, 2517–2528. [Google Scholar] [CrossRef]
- Huang, W.; Moon, S.; Ohsawa, K. Near-nozzle dynamics of diesel spray under varied needle lifts and its prediction using analytical model. Fuel 2016, 180, 292–300. [Google Scholar] [CrossRef]
- Payri, R.; Gimeno, J.; Vierai, J.P.; Plazas, A.H. Needle lift profile influence on the vapor phase penetration for a prototype diesel direct acting piezoelectric injector. Fuel 2013, 113, 257–265. [Google Scholar] [CrossRef]
- Pratama, R.H.; Huang, W.; Moon, S. Unveiling needle lift dependence on near-nozzle spray Dynamics of diesel injector. Fuel 2021, 285, 119088. [Google Scholar] [CrossRef]
- Ferrari, A.; Mittica, A.; Paocelli, F.; Pizzo, P. Hydraulic characterization of solenoid-actuated injectors for diesel engine common rail systems. Energy Procedia 2016, 101, 878–885. [Google Scholar] [CrossRef]
- Ren, R.; Su, T.; Ma, F.; Zhao, X.; Xu, C.; Wu, X. Influence of the flow area around the ball valve on the flow characteristics of the injector control valve. Flow Meas. Instrum. 2023, 90, 102333. [Google Scholar] [CrossRef]
- Vrublevskyi, O.; Wierzbicki, S. Measurement and theoretical analysis of the displacement characteristics of moving components in a solenoid injector in view of wave phenomena. Measurement 2021, 187, 110323. [Google Scholar] [CrossRef]
- Leonhard, R.; Warga, J.; Pauer, T.; Rückle, M.; Schnell, M. Solenoid common-rail injector for 1800 bar. MTZ Worldw. 2010, 71, 10–15. [Google Scholar] [CrossRef]
- Krivtsov, S.N.; Yakimov, I.V.; Ozornin, S.P. Numerical analysis and experimental studies on solenoid common rail diesel injector with worn control valve. IOP Conf. Ser. Mater. Sci. Eng. 2017, 327, 042057. [Google Scholar] [CrossRef]
- D’Ambrosio, S.; Ferrari, A. Diesel engines equipped with piezoelectric and solenoid injectors: Hydraulic performance of the injectors and comparison of the emissions, noise and fuel consumption. Appl. Energy 2017, 211, 1324–1342. [Google Scholar] [CrossRef]
- Ferrari, A.; Paocelli, F.; Pizzo, P. The new-generation of solenoid injectors equipped with pressure-balanced pilot valves for energy saving and dynamic response improvement. Appl. Energy 2015, 151, 367–376. [Google Scholar] [CrossRef]
- Common-Rail Injector CRI2-20/-22. Available online: https://boschdiesel.co.za/wp-content/uploads/2021/08/Poster_CRI_2_20_22_en_87688.pdf (accessed on 27 February 2024).
- Busch, S.; Miles, C.P. Parametric study of injection rates with solenoid injectors in an injection quantity and rate measuring device. J. Eng. Gas Turbines Power 2015, 137, 101503. [Google Scholar] [CrossRef]


| Research Package | Group Number | Clearance between Valve and Armature | Clearance between Armature and Armature Pin | ||||||
|---|---|---|---|---|---|---|---|---|---|
| High | Medium | Low | Lowest | High | Medium | Low | Lowest | ||
| Effect of clearance between valve and armature | 1 | ✓ | ✓ | ||||||
| 2 | ✓ | ✓ | |||||||
| 3 | ✓ | ✓ | |||||||
| Reference group | 4 | ✓ | ✓ | ||||||
| Effect of clearance between armature and armature pin | 5 | ✓ | ✓ | ||||||
| 6 | ✓ | ✓ | |||||||
| 7 | ✓ | ✓ | |||||||
| Group Number | Inner Pipe | Intermediate Pipe | ||
|---|---|---|---|---|
| Inlet (Pa) | Outlet (Pa) | Inlet (Pa) | Outlet (Pa) | |
| 1 | 500,000 | 101,119.5 | 500,000 | 101,136.25 |
| 2 | 500,000 | 101,087.92 | 500,000 | 101,127.22 |
| 3 | 500,000 | 101,122.9 | 500,000 | 101,114.73 |
| 4 | 500,000 | 101,115.05 | 500,000 | 101,129.32 |
| 5 | 500,000 | 101,117.37 | 500,000 | 101,128.32 |
| 6 | 500,000 | 101,118.19 | 500,000 | 101,129.66 |
| 7 | 500,000 | 101,115.6 | 500,000 | 101,129.32 |
Disclaimer/Publisher’s Note: The statements, opinions and data contained in all publications are solely those of the individual author(s) and contributor(s) and not of MDPI and/or the editor(s). MDPI and/or the editor(s) disclaim responsibility for any injury to people or property resulting from any ideas, methods, instructions or products referred to in the content. |
© 2024 by the authors. Licensee MDPI, Basel, Switzerland. This article is an open access article distributed under the terms and conditions of the Creative Commons Attribution (CC BY) license (https://creativecommons.org/licenses/by/4.0/).
Share and Cite
Işıklı, F.; Şentürk, G.; Sürmen, A. Effects of Valve, Armature, and Armature Pin Guidance on Diesel Injector Performance. Appl. Sci. 2024, 14, 5737. https://doi.org/10.3390/app14135737
Işıklı F, Şentürk G, Sürmen A. Effects of Valve, Armature, and Armature Pin Guidance on Diesel Injector Performance. Applied Sciences. 2024; 14(13):5737. https://doi.org/10.3390/app14135737
Chicago/Turabian StyleIşıklı, Fırat, Gökhan Şentürk, and Ali Sürmen. 2024. "Effects of Valve, Armature, and Armature Pin Guidance on Diesel Injector Performance" Applied Sciences 14, no. 13: 5737. https://doi.org/10.3390/app14135737