Article

Finite Element Analysis of Geogrid-Incorporated Flexible Pavement with Soft Subgrade

Department of Civil Engineering, Chandigarh University, Mohali 140413, Punjab, India
*
Author to whom correspondence should be addressed.
Appl. Sci. 2024, 14(13), 5798; https://doi.org/10.3390/app14135798
Submission received: 8 June 2024 / Revised: 23 June 2024 / Accepted: 29 June 2024 / Published: 3 July 2024
(This article belongs to the Special Issue Advanced Pavement Engineering: Design, Construction, and Performance)

Abstract

:
Improving the durability of flexible pavements and constructing new roads on weak soil foundations present significant challenges, prompting designers to explore alternative methods to prolong pavement lifespan. Geosynthetics have emerged as a promising solution for soil stabilization, with various materials developed for this purpose. The current study concentrates on using the finite element (FE) method to examine the effectiveness of geogrid-incorporated flexible pavements on soft soil substrates. A three-dimensional layered pavement is constructed with an FE model, incorporating subgrade layers of varying strengths based on their California bearing ratio (CBR) values, with a geogrid layer implemented to enhance subgrade stability. Additionally, attention is also given to investigating the effect of base course thickness. The findings reveal that the geogrid layer primarily influences the formation of plastic strains in the subgrade rather than resilient strains, effectively reducing vertical compressive strain by approximately 40%. With increasing CBR values, there is a reduction in vertical strain, although the influence zone extends up to a depth of 300 mm within the subgrade. At the surface of the subgrade, vertical strain decreases by around 17%, 39%, and 49% as the CBR values increase from 1% to 3%, 5%, and 8%, respectively.

1. Introduction

Flexible pavements, the most prevalent type of pavement, are found on 85–90% of roadways globally. However, excessive wheel loads, environmental impacts, etc., significantly impair pavements, so careful consideration must be given to their design and construction. The principal controlling elements are fatigue and rutting failures, which are mostly caused by tensile strain at the bituminous layer’s bottom and vertical strain at the top of the subgrade. To lessen these tensile and vertical strains, researchers created a synthetic polymeric substance called geosynthetic that works to stabilize the subgrade soil. Among the many types of geosynthetics, geogrid is a popular type that can be employed as a filtration membrane, drainage system, separation layer, and soil reinforcement in various pavement layers [1,2].
Several types of geogrids exist depending upon their pattern, manufacturing process and materials. Uniaxial, biaxial, and triaxial geogrids can be found based on the pattern of geogrid, where uniaxial geogrid provides longitudinal tension, biaxial geogrid provides both longitudinal and horizontal tension and triaxial geogrid provides strength in three dimensions. Based on the manufacturing process, geogrid can be classified as extruded geogrid, woven geogrid and bonded geogrid. Fiberglass geogrid, PET geogrid and warp knitted fiberglass geogrid are also very common nowadays. Geogrids are mostly used in pavements for reinforcing the materials of different layers due to their higher rigidity and ability to distribute the wheel loads. However, geogrids can also be used in retaining walls, soil foundation, slope stabilization, etc. Numerous investigators have investigated the performance of geogrid-modified pavements and verified the efficacy of geogrid materials [3,4,5]. The results of these tests demonstrated that reinforcement could lessen the possibility of persistent deformation in reinforced parts while also extending and enhancing their service life. It was clear that the geogrid’s strengthening and reinforcing properties improve tensile forces, boost stability, and contain persistent deformations [6]. The researchers noted that several variables, such as geogrid properties, interlocking with aggregate, pavement layer thickness, geogrid placement, and the condition of subgrade and base layers, impact how effectively geogrid reinforcement works in flexible pavements. However, the majority of research has focused on experimental studies at different scales, with limited attention given to numerical investigations [7]. In previous numerical investigations of geogrid-modified soil, the geogrid’s performance was simulated using either one- or three-dimensional computer models, often incorporating one-dimensional tensile elements to represent its behaviour [8,9] or a planar sheet-like structure [10,11,12]. Some researchers have recently introduced three-dimensional finite element numerical models for analysing geogrid reinforcement. These models can depict the performance of biaxial geogrids in both unconfined and soil-confined conditions [13,14]. Because rutting failure is primarily caused by vertical strains on the subgrade’s surface, understanding its strength and the impact of geogrid on the subgrade soil is crucial. This study focuses on conducting a three-dimensional numerical analysis of geogrid-reinforced pavements, considering various strengths of subgrade soil or California bearing ratio (CBR) values. The geogrid is predominantly positioned atop the subgrade, and different thicknesses of the aggregate base layer are examined to assess the reinforcement’s effect on base thickness. The primary emphasis lies in understanding the strains developed in pavements and the geogrid.

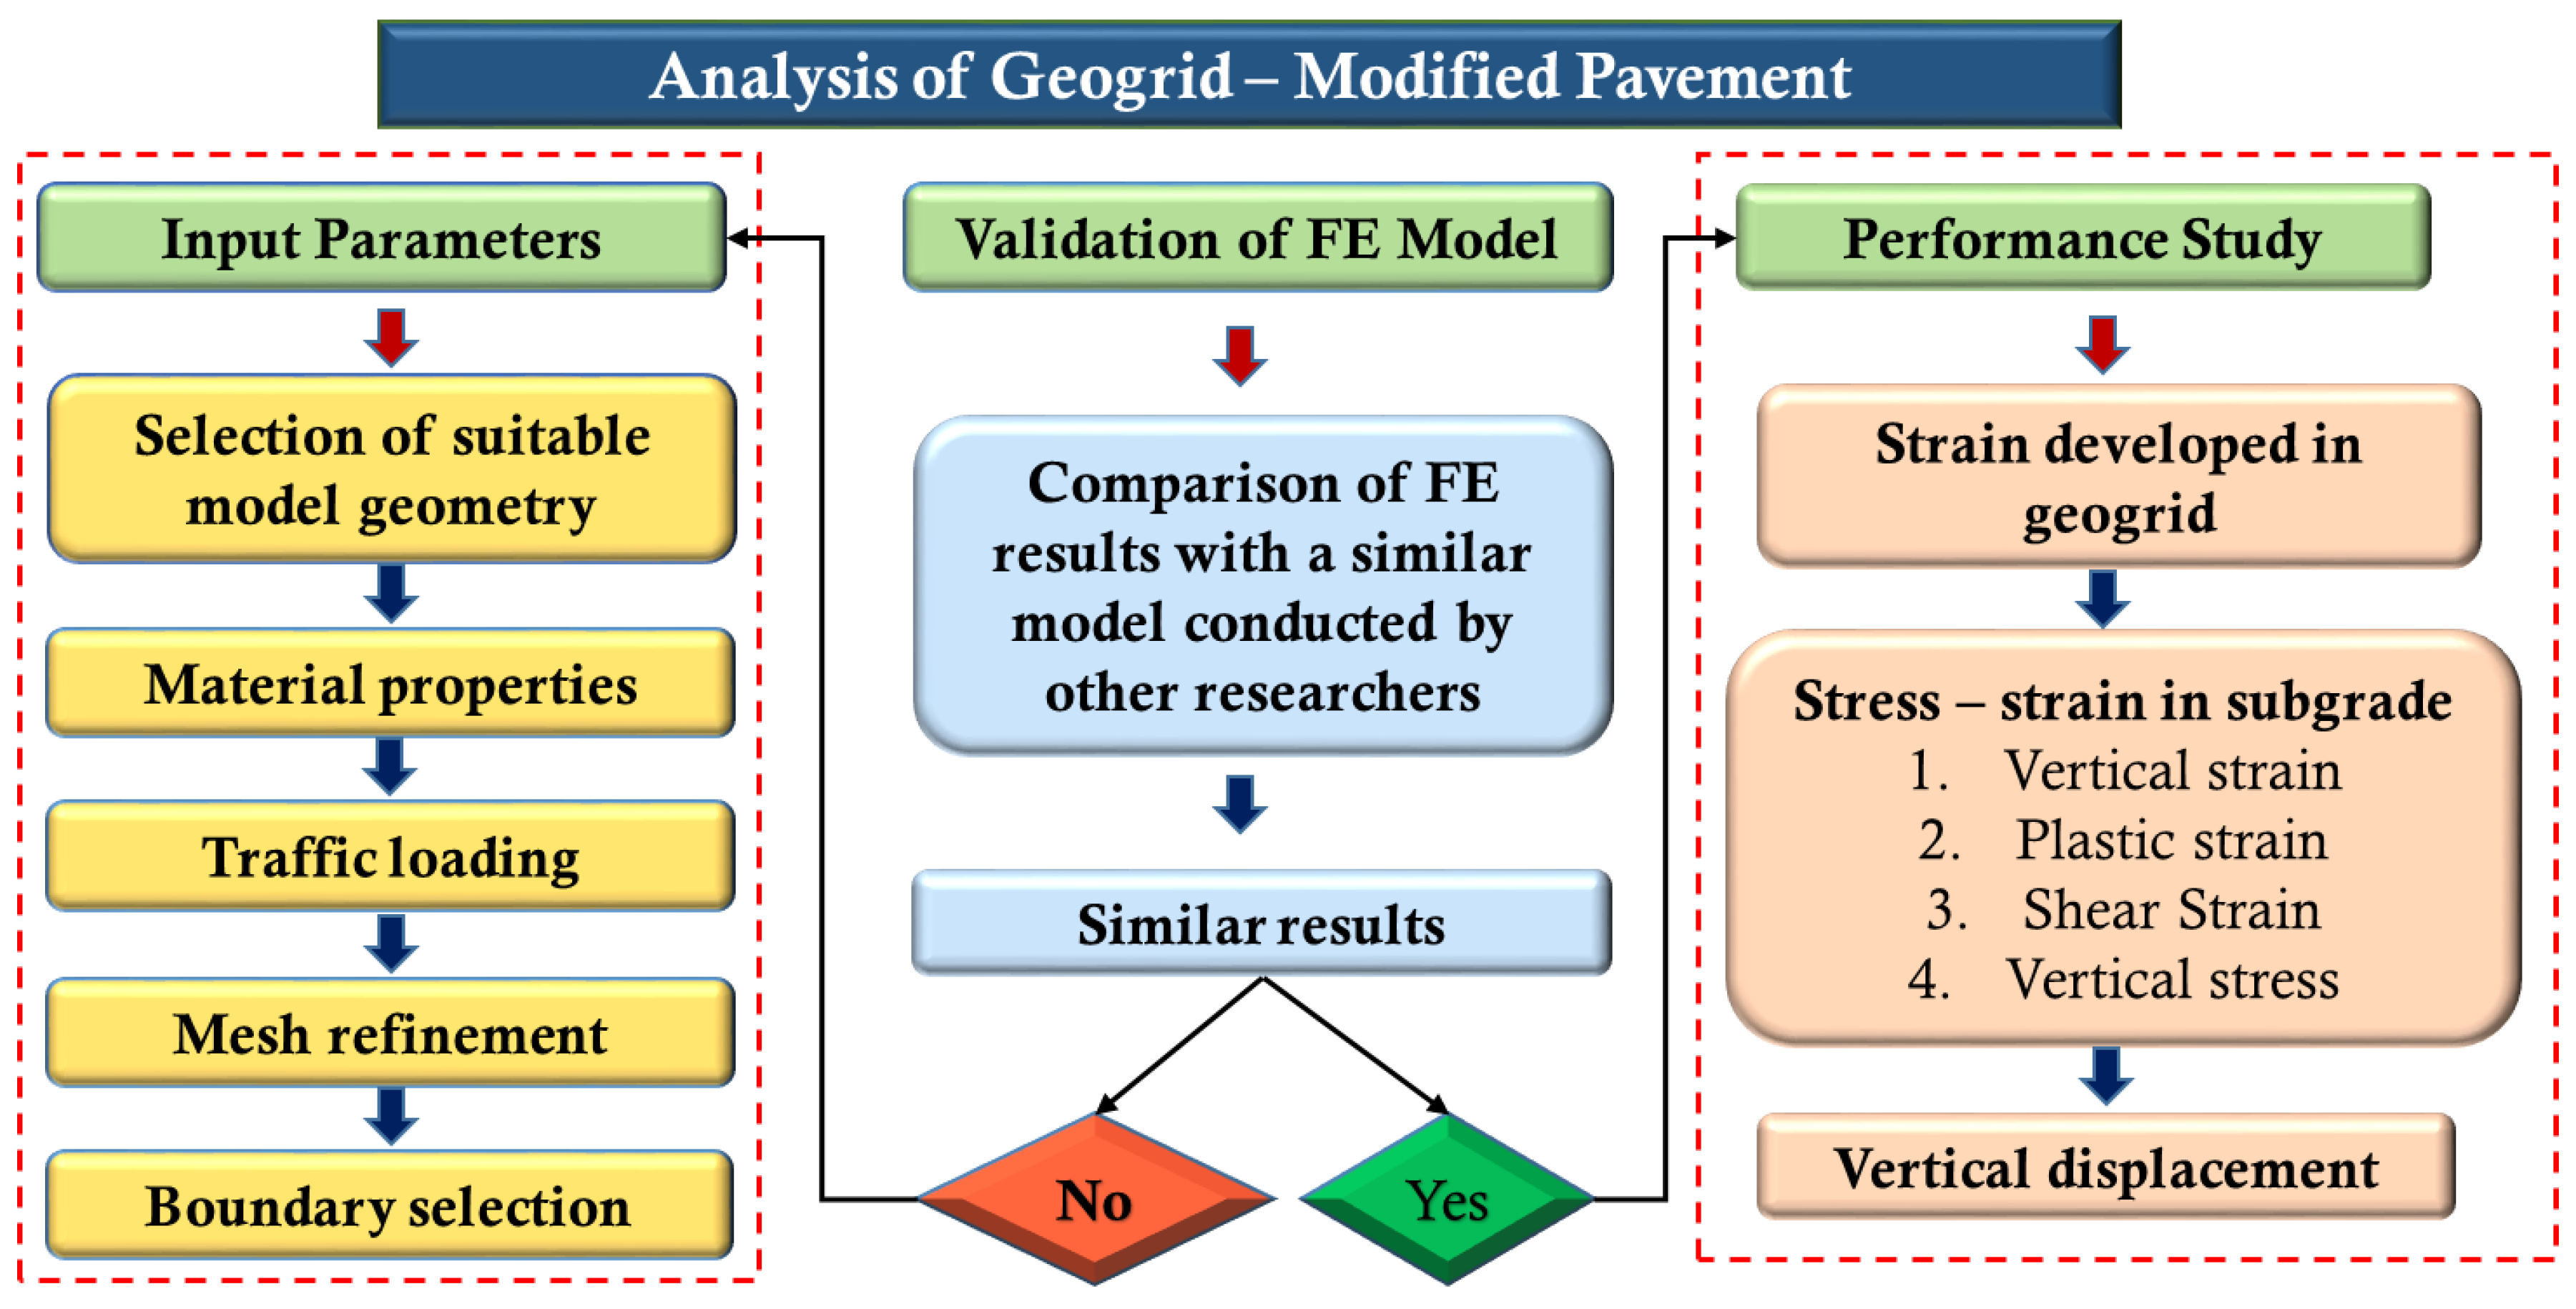
2. Research Approach and Numerical Simulation

2.1. Model Description

This study focuses on a flexible pavement consisting of four main layers: the surface course, base layer, sub-base layer, and subgrade. The surface course comprises an asphalt concrete (AC) and a binder course containing dense bituminous macadam (DBM). To ensure proper stress distribution, an embankment is placed beneath the subgrade layer. Figure 1 illustrates a schematic representation of the pavement, including the thicknesses of each layer [15]. The geometry and dimensions of the geogrid are also depicted in Figure 1. The properties of each layer are sourced from prior studies [16] and are mentioned in Table 1. Although asphalt is visco-elastic, the majority of researchers and the standard code consider asphalt concrete and binder course as elastic materials. However, the present study majorly focuses on the effect of geogrid on the subgrade layer and hence the material property of the subgrade becomes more important. Here, base, sub-base, subgrade, and embankment layers are modelled using the Mohr–Coulomb failure criterion to simulate the plastic nature of the materials. This Mohr–Coulomb failure behaviour allows the material to harden isotopically using a smooth flow potential with hyperbolic shape in the meridional stress plane and an elliptic shape in the deviatoric stress plane. The Mohr–Coulomb yield surface can be represented as
F = R m c q p tan C = 0
where is the friction angle in the meridional stress plane, C represents the cohesion of the material, p and q are the stress invariants, and R m c is the Mohr–Coulomb deviatoric stress, which is further described as
R m c = 1 3 cos sin θ + π 3 + 1 3 cos θ + π 3 tan
Here, θ is the deviatoric polar angle. The geogrid is considered purely elastic following Hooke’s law.

2.2. Load Application

For simulating the traffic load, a single-axle dual-wheel assembly with a gross weight of 80 kN is utilized (according to IRC 37:2018 [17]). While the actual tyre imprints are semi-elliptical, circular tyre imprints are adopted in this analysis for simplicity (refer to Figure 1). A radius of 107 mm is chosen for the tyre imprint, and the horizontal gap between the two wheels is set at 343 mm [18]. Typically, a single-axle dual-wheel configuration consists of two pairs of wheels, totalling four wheels, resulting in a 20 kN load applied to each wheel. Due to the symmetry of the pavement section and the dual-wheel assembly, only half of the pavement is analysed in this study. The model utilizes repeated loading to simulate traffic conditions, with a total of 20,000 load repetitions at a frequency of 10 Hz, meaning the load repeats 10 times per second. The pressure applied on each tyre is 0.56 MPa.

2.3. Mesh and Boundary

An 8-noded hexahedral brick element (C3D8R) is employed to divide the entire pavement prototype into smaller elements. Triangular prism elements (C3D6) are used to mesh the geogrid. Various mesh biases are investigated, with a finer mesh near the loading area and a coarser one elsewhere. Mesh refinement is also explored, with Figure 2 depicting the selected meshes for this model. Regarding boundary conditions, the bottom of the pavement is completely fixed, prohibiting any translation or rotation of its bottom nodes. The sides of the model are also restricted from certain translations and rotations along specific axes, as illustrated in Figure 2. A frictional behaviour is developed between two layers using the ‘surface-to-surface’ contact behaviour. A hard contact surface is selected with a friction coefficient of 0.3.

2.4. Model Validation

Validating numerical models is crucial for ensuring the accuracy and dependability of computational simulations mirroring real-world scenarios. Therefore, in this study, the development of finite element models undergoes validation against another study [19]. In that particular investigation, both experimental and numerical models were developed to comprehend rutting in asphalt pavements. In this study, the finite element (FE) model is sized at 8 m in length, 6 m in width, and 3.74 m in depth, with all the physical properties and loading conditions of the pavement layers sourced from the referenced study. However, meshing particulars, elemental behaviour, boundary conditions, etc., are based on the current study. The analysis focuses on the pavement’s rutting behaviour, with a comparison of results depicted in Figure 3. The alignment between the outcomes of the present study and those from the reference study indicates the consistency of the process used to prepare the numerical or FE model in this study, suggesting its suitability for further analysis of geogrid-reinforced pavements.

2.5. Research Plan

As stated earlier, this research investigates the performance of geogrid-reinforced flexible pavements under different subgrade strengths and base layer thicknesses. Pavement models are constructed with subgrade California bearing ratio (CBR) values of 3%, 5%, 8%, and 12%. Base layer thicknesses are set at 150 mm, 180 mm, 220 mm, and 250 mm. Accordingly, 16 models are developed, and the effectiveness of geogrid-reinforced pavements is evaluated. The research methodology employed in this study is illustrated through a flowchart in Figure 4.

3. Results

3.1. Geogrid Strain

Geogrid plays a crucial role in reinforcing pavement layers, which is often subjected to various stresses and strains under the weight of wheel loads. Figure 5a,b illustrates the geogrid strains along the wheel path, corresponding to 1% and 8% CBR values and several base course (BC) thicknesses. The wheel path, representing the total width of the pavement model, is normalized symmetrically from the centre. The figure reveals non-uniform geogrid strain, peaking at the wheel locations. Near the wheel positions or the loading area, the geogrid experiences tensile forces as it expands, gradually decreasing as the normalized path increases, resulting in tensile strain near the loading area and compressive strain at the central portion. Notably, the tensile strain is significantly higher than the compressive strain. Moreover, increasing base thickness leads to a considerable reduction in geogrid strain due to enhanced grain-to-grain load dispersion in flexible pavement. This results in lower load and strain on the geogrid at higher base thicknesses. Analysis of subgrade strength, indicated by CBR values, reveals that geogrid strain is prominent in cases of lower subgrade CBR values. For instance, changing the CBR from 1% to 3% results in approximately a 21% reduction in geogrid strain for a 150 mm base thickness, whereas this reduction increases to about 43–45% when the CBR changes from 1% to 5% or 8%. This underscores that a strong soil subgrade minimally affects geogrid strain due to its stiffness and ability to withstand high loads, whereas a weak subgrade necessitates geogrid support. The strain and deflections observed in the geogrid material, extracted from the FE model, are also depicted in Figure 6.

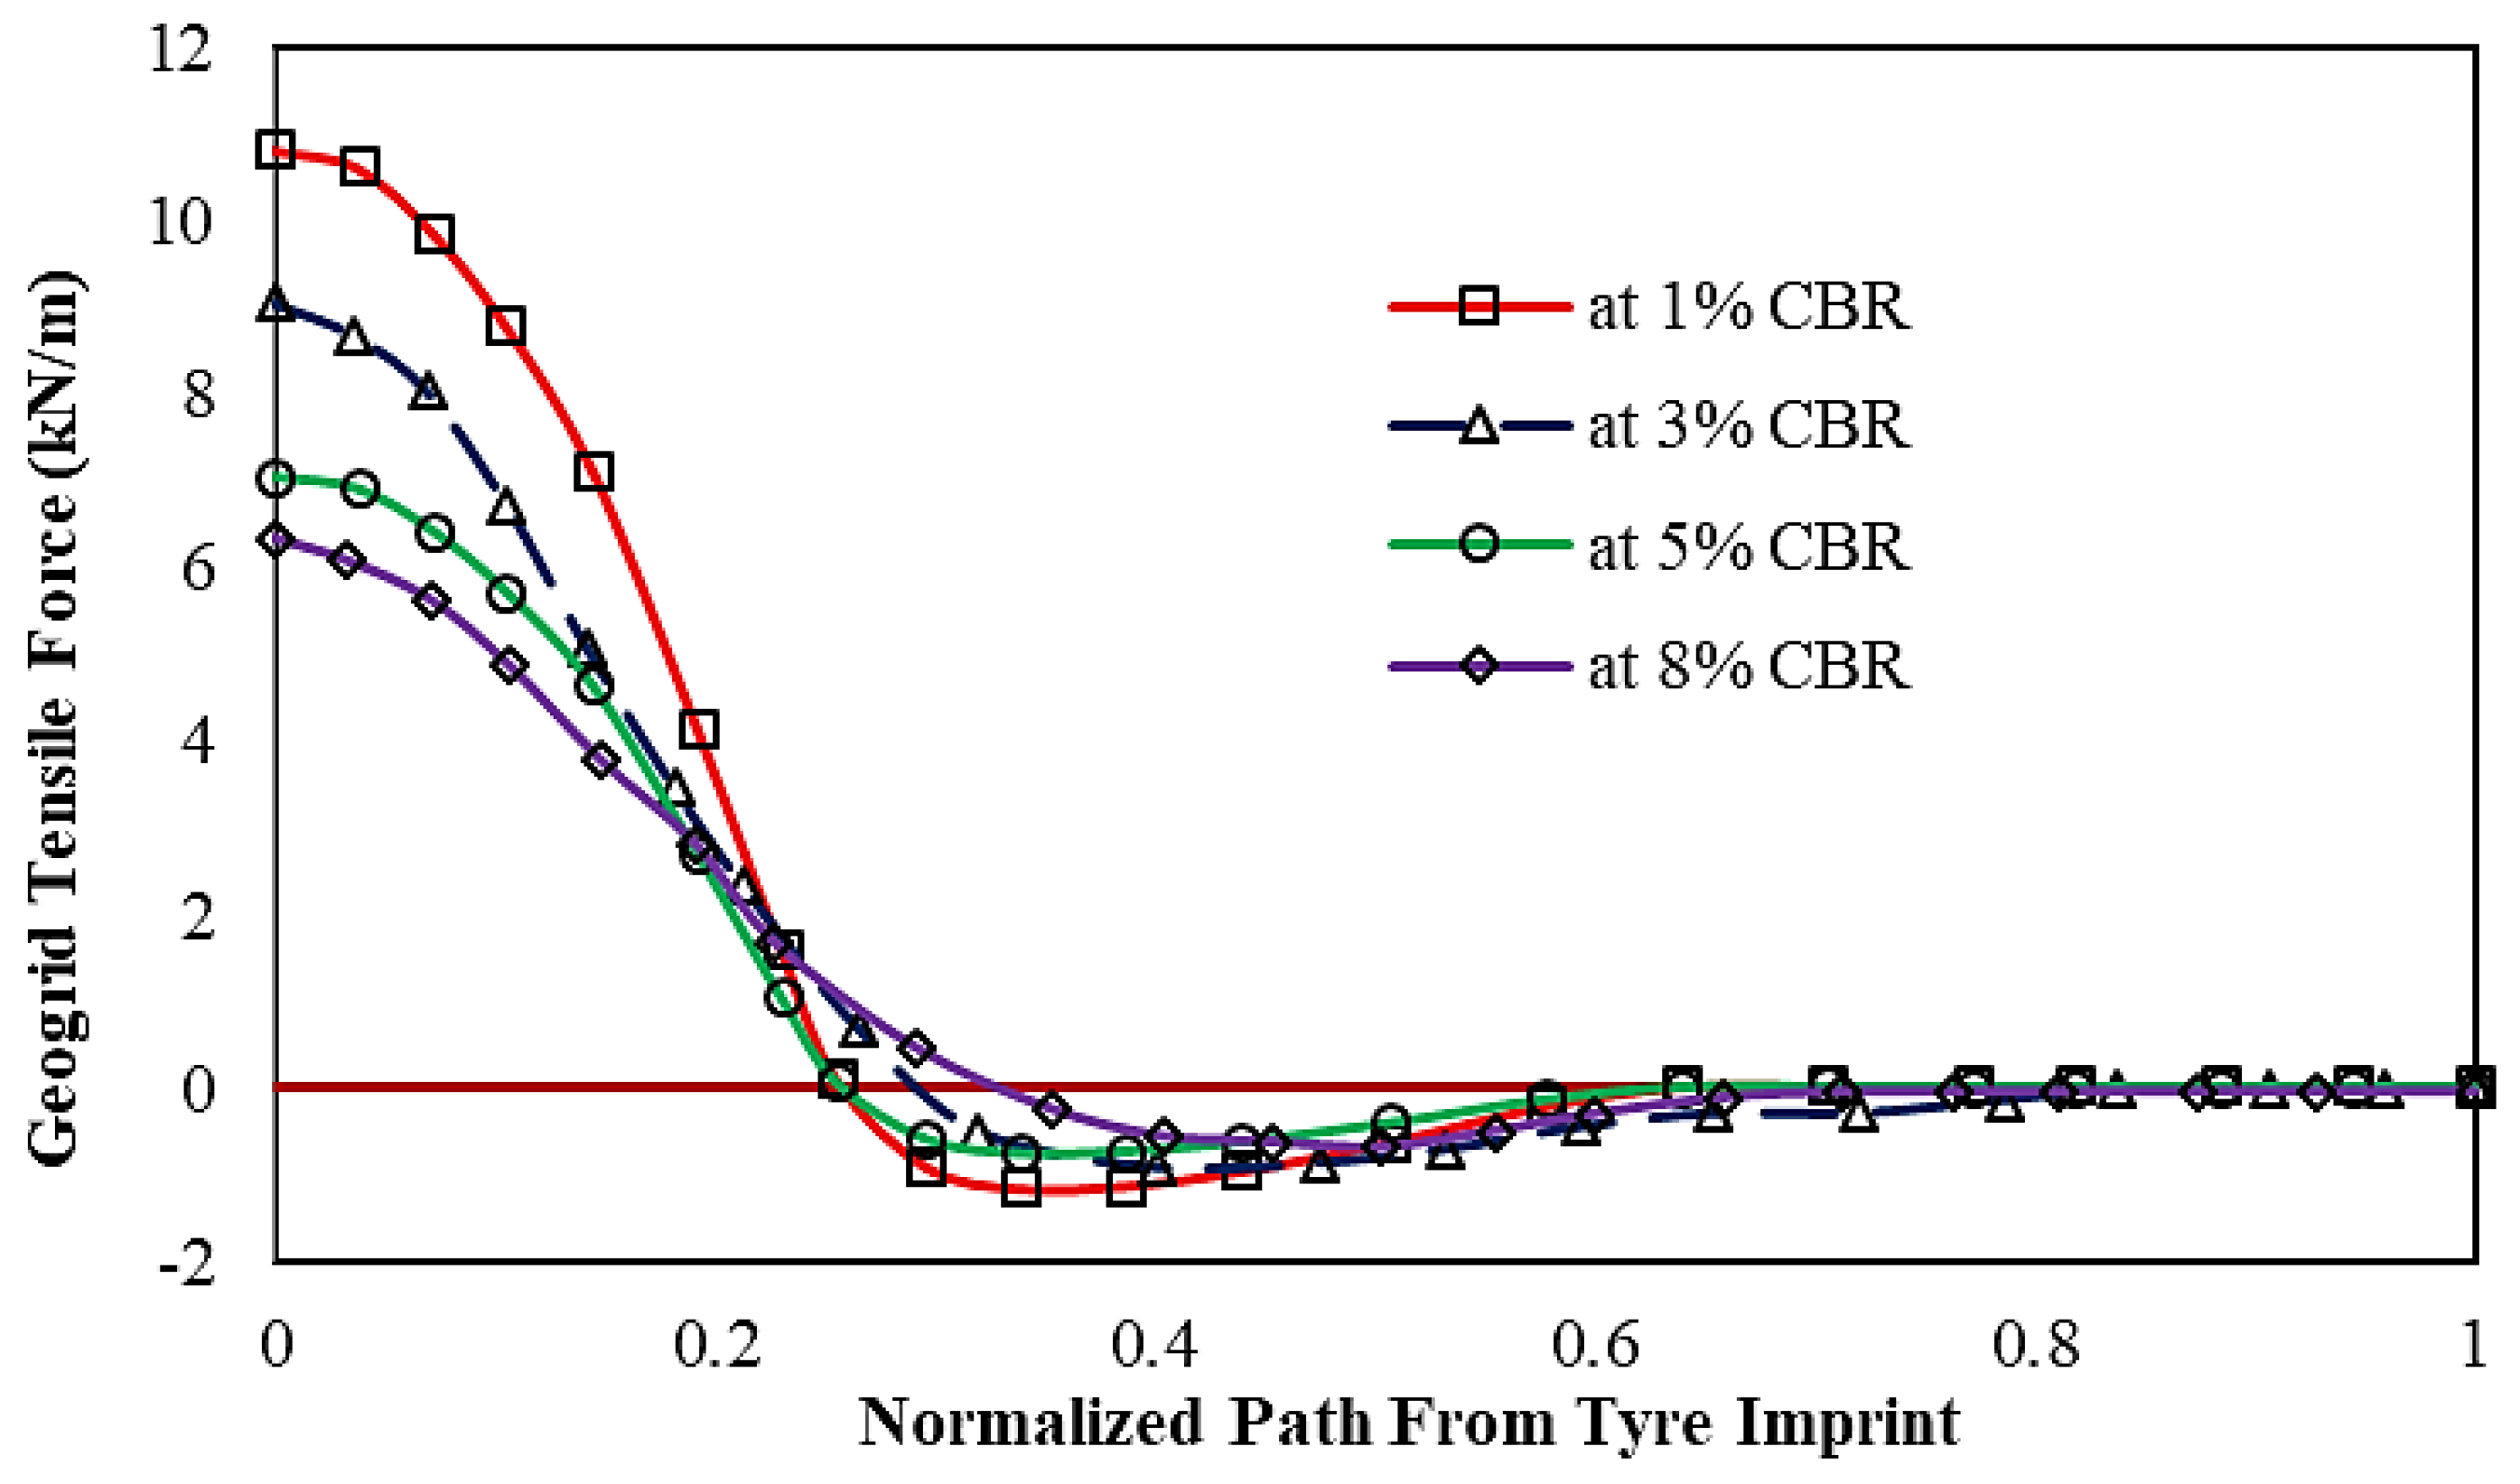
3.2. Tensile Force in the Geogrid

Figure 7 illustrates the tensile force generated in the geogrid due to the wheel load, focusing on a single tyre imprint, with the normalized wheel path specified within the figure. Like geogrid strain, the magnitude of tensile force is influenced by the subgrade strength, with weaker subgrades resulting in higher tensile forces in the geogrid while stronger subgrades yield comparatively lower forces. However, this tensile force predominates primarily beneath the tyre imprint and gradually diminishes as the wheel path extends towards the pavement model’s edge. A notable reduction of approximately 16% in geogrid tensile force is observed as the CBR value of the subgrade soil increases from 1% to 3%. In contrast, an increase of about 35% and 41% is noted if the CBR value changes to 5% and 8%, respectively.

3.3. Strain and Stress at the Subgrade

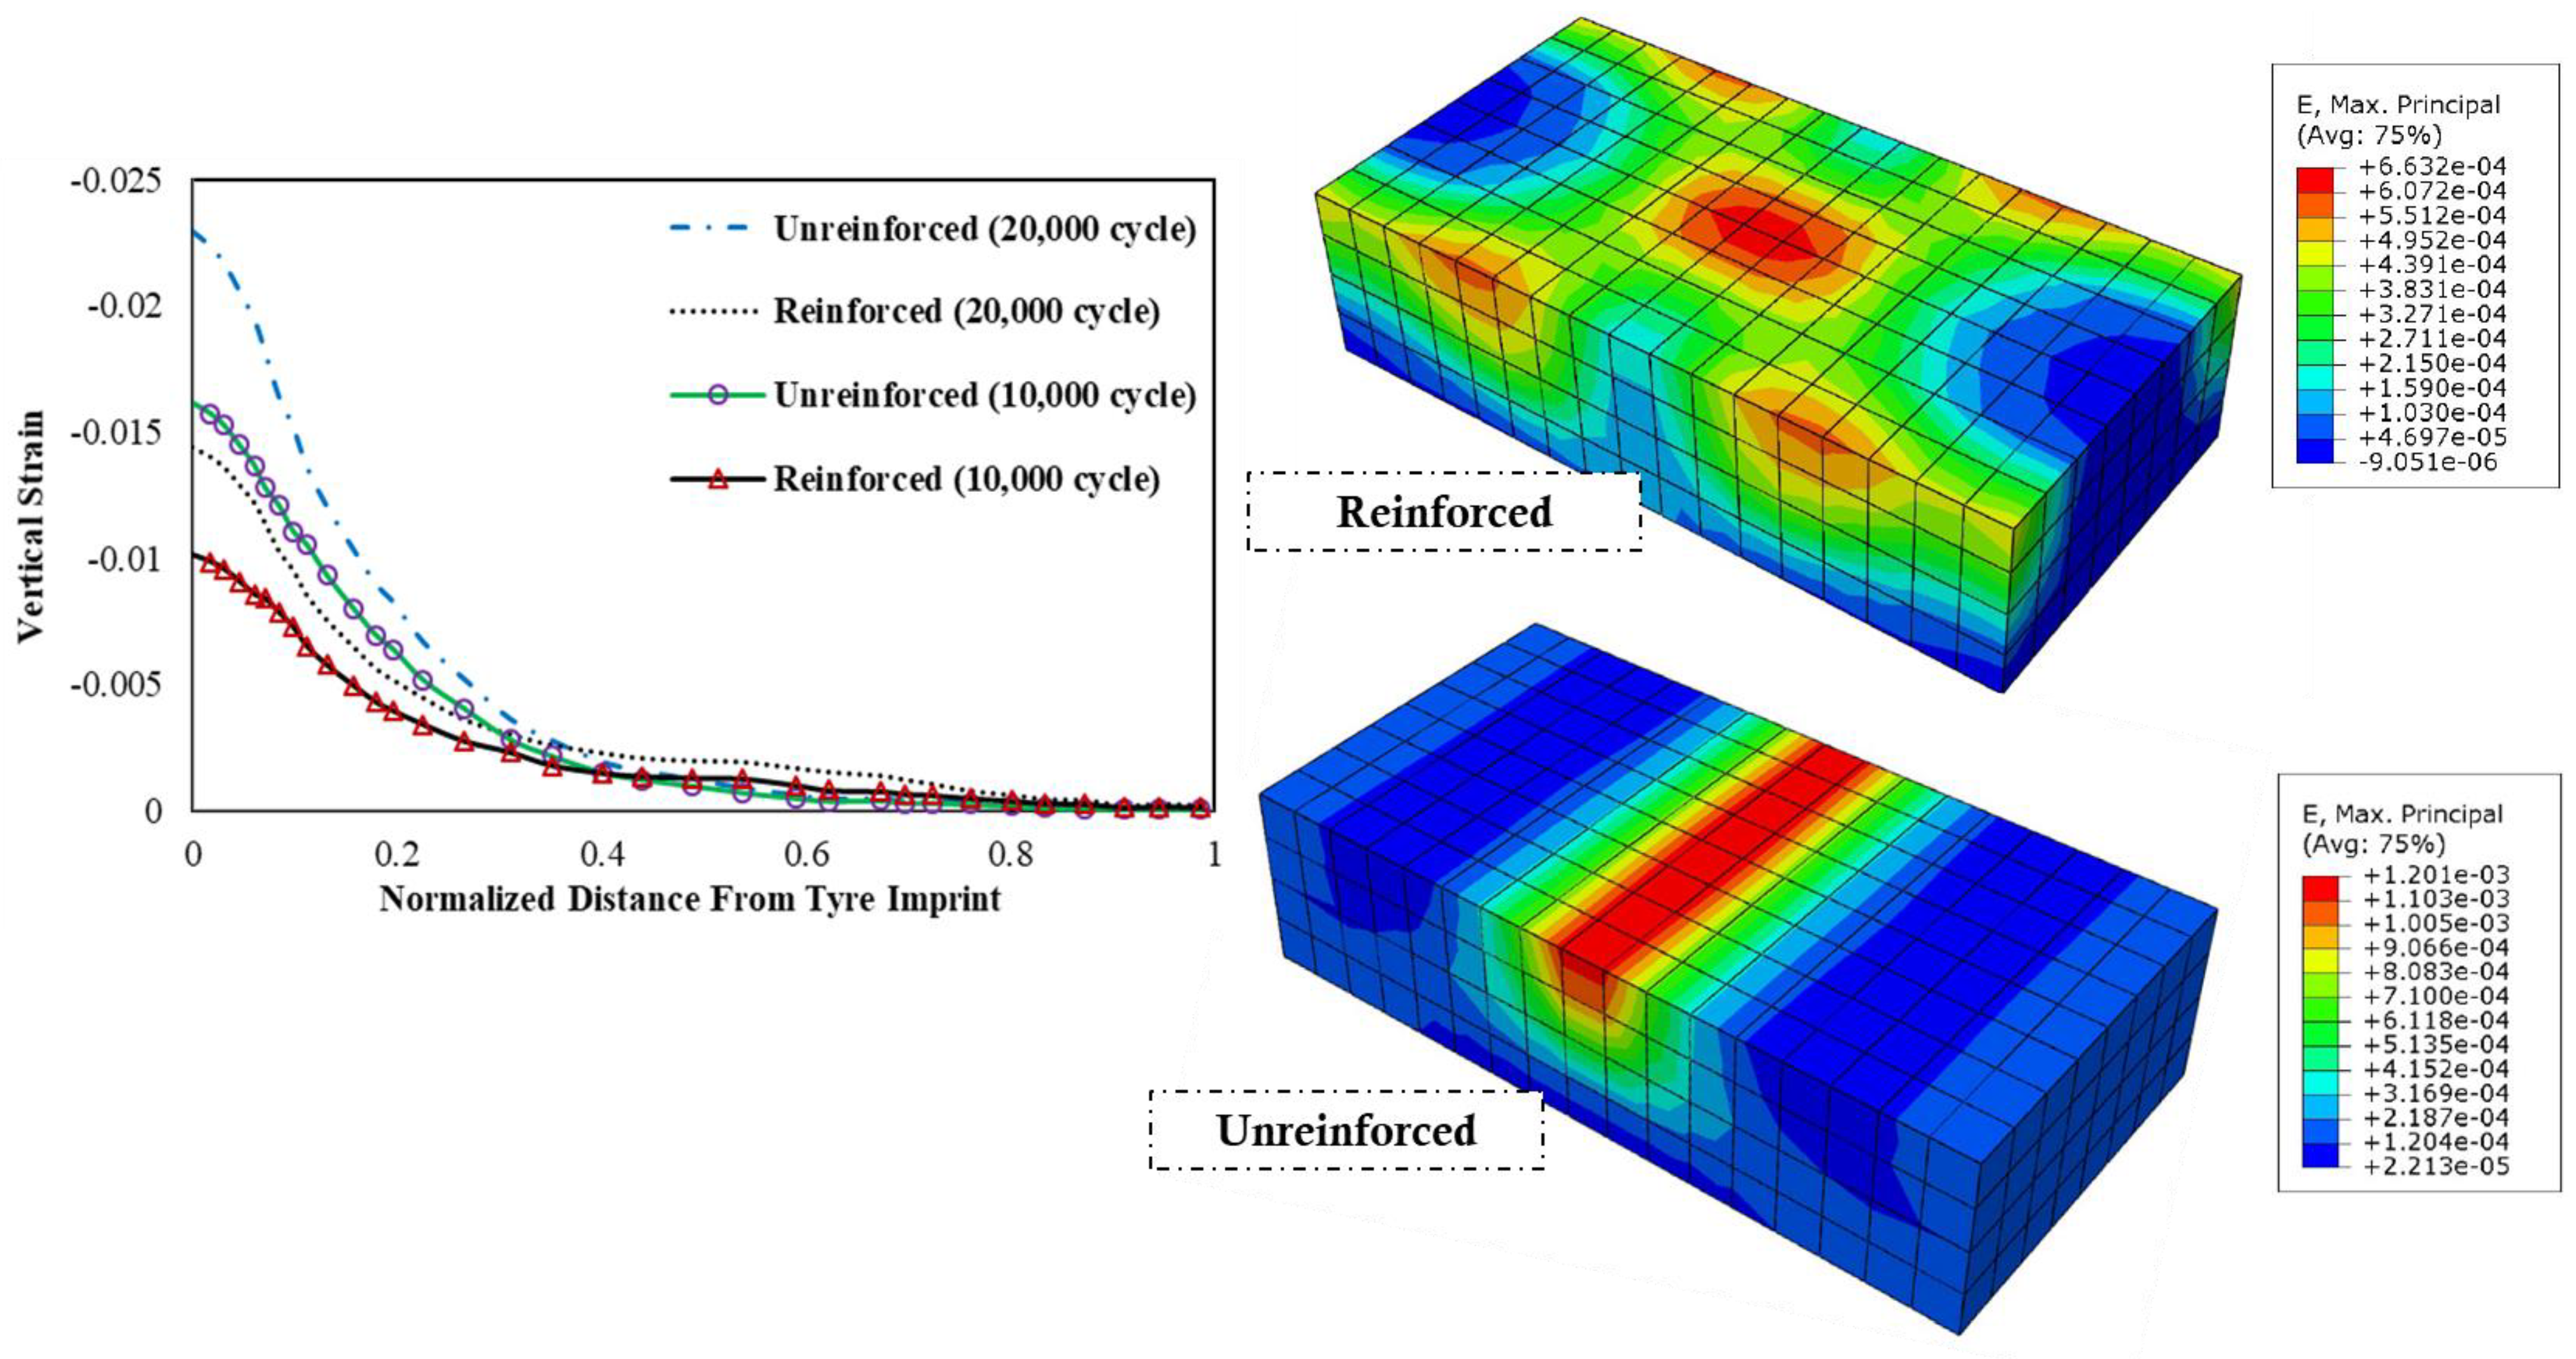
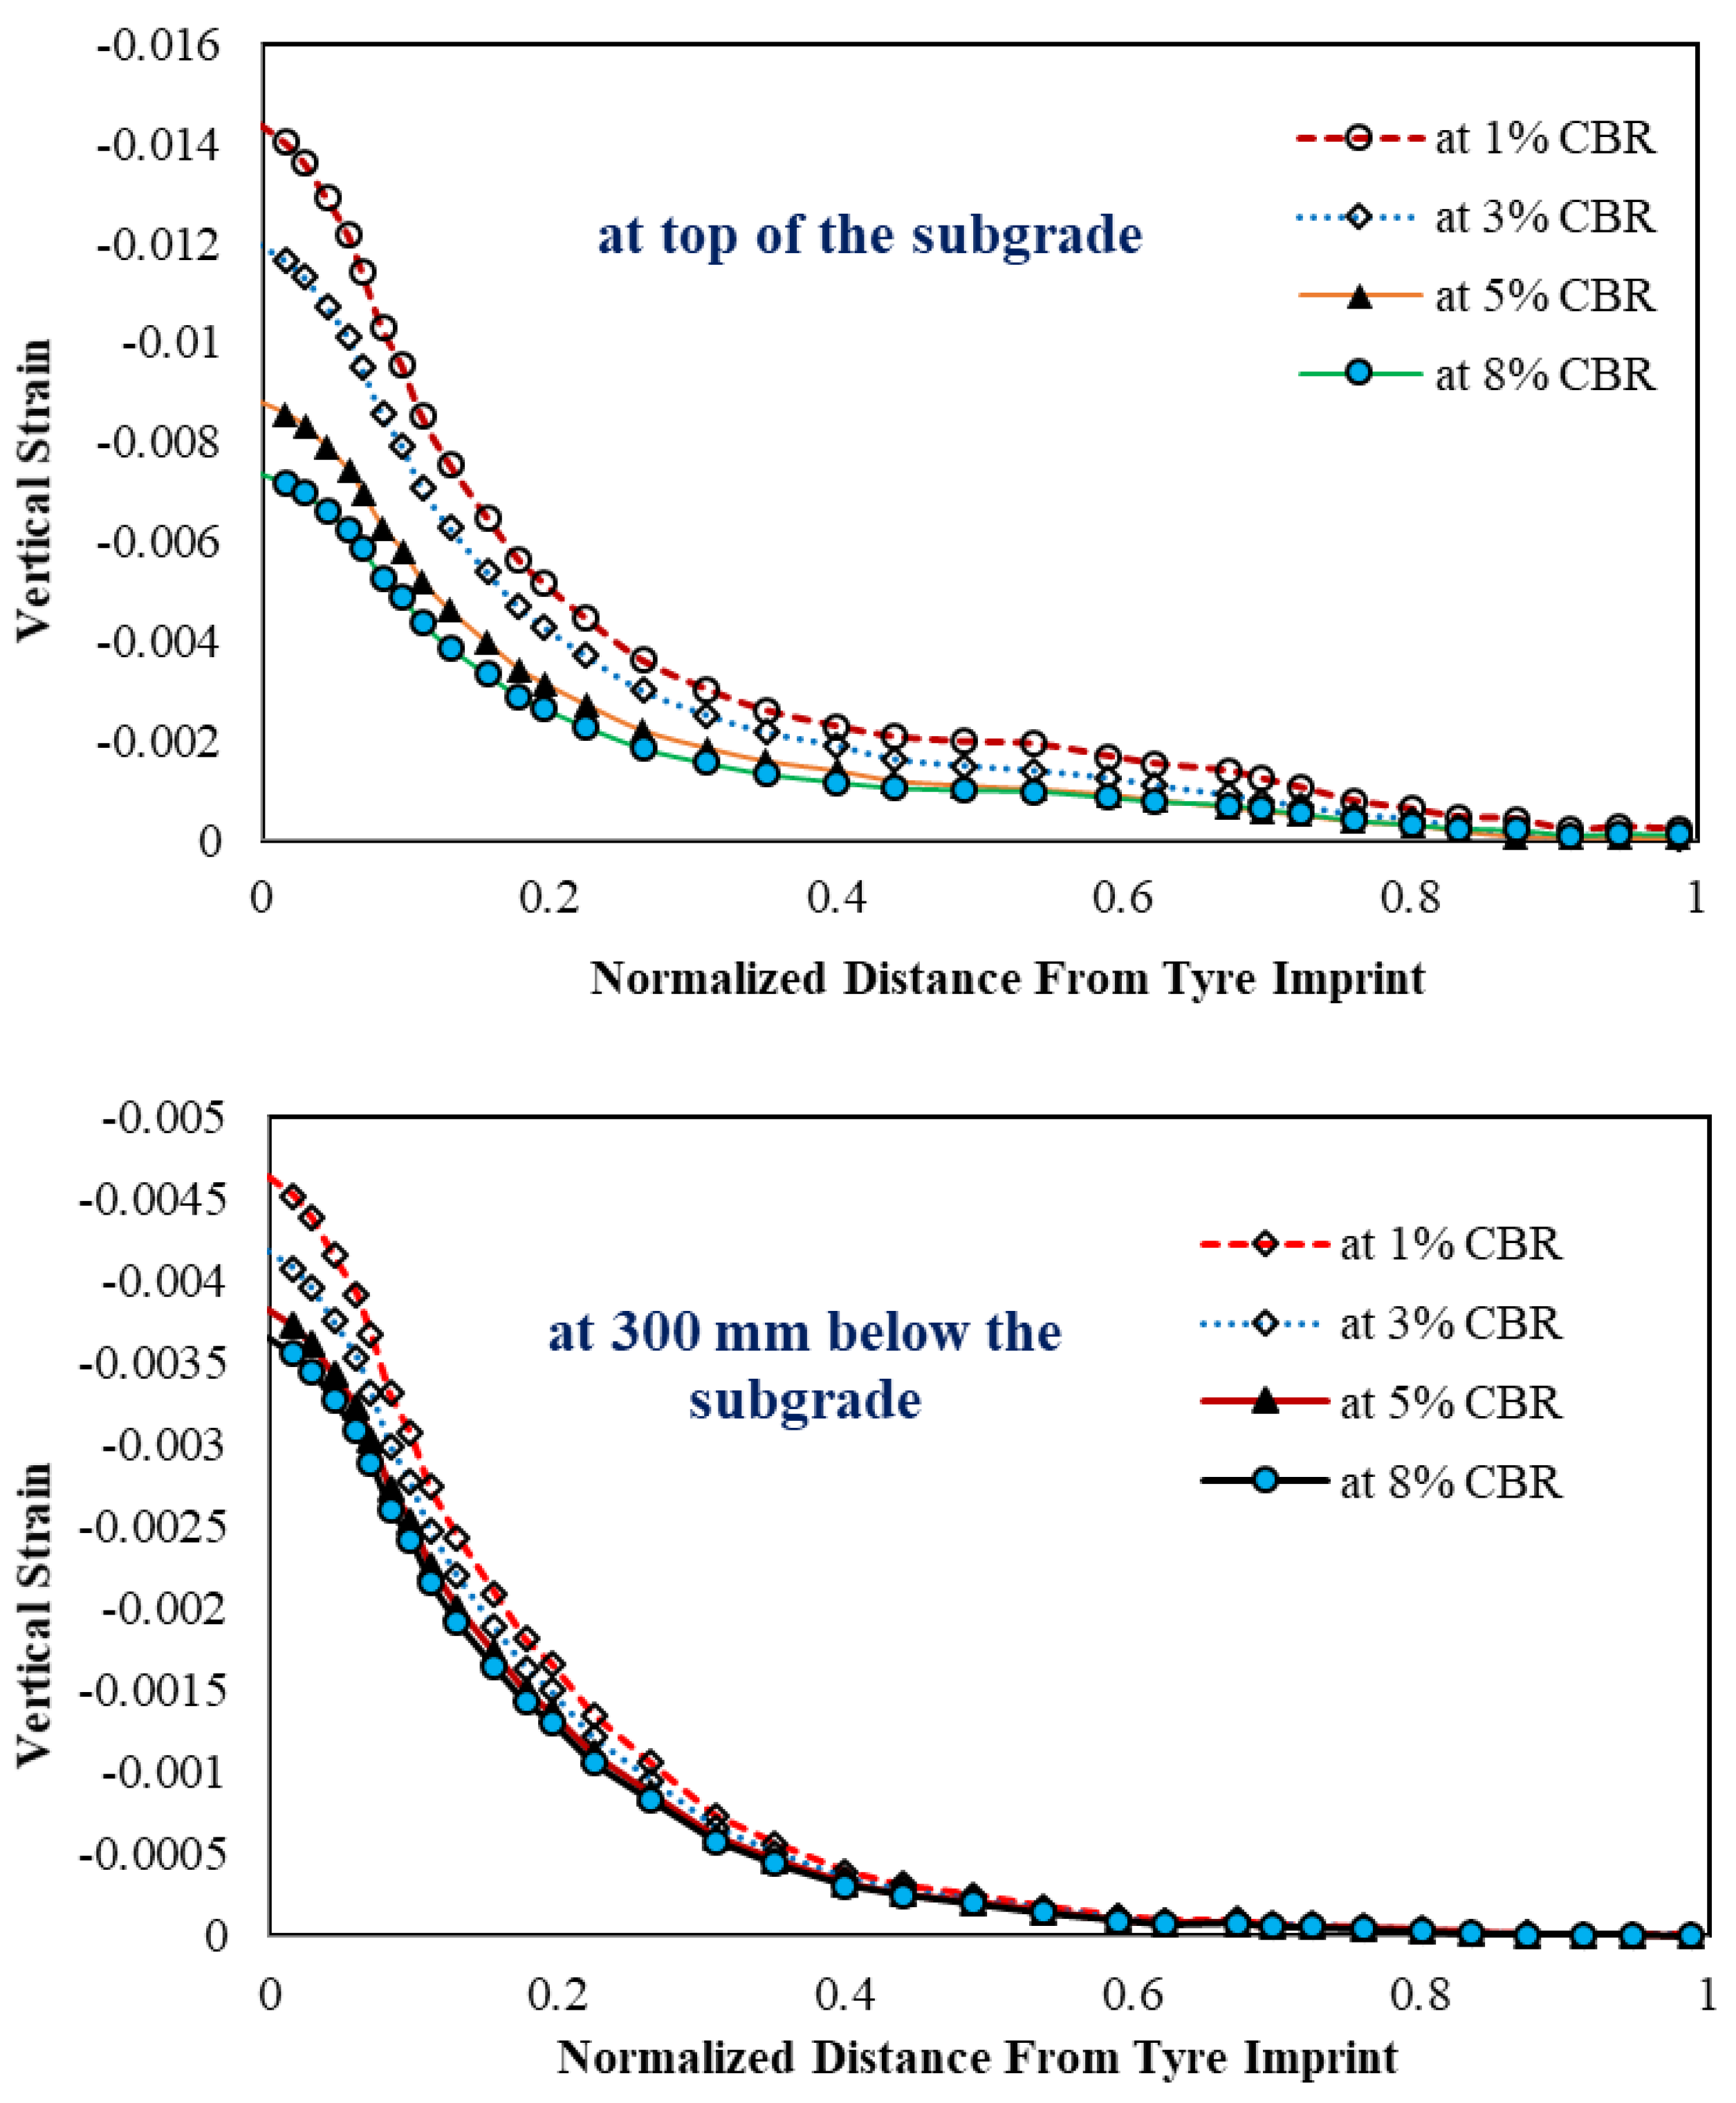
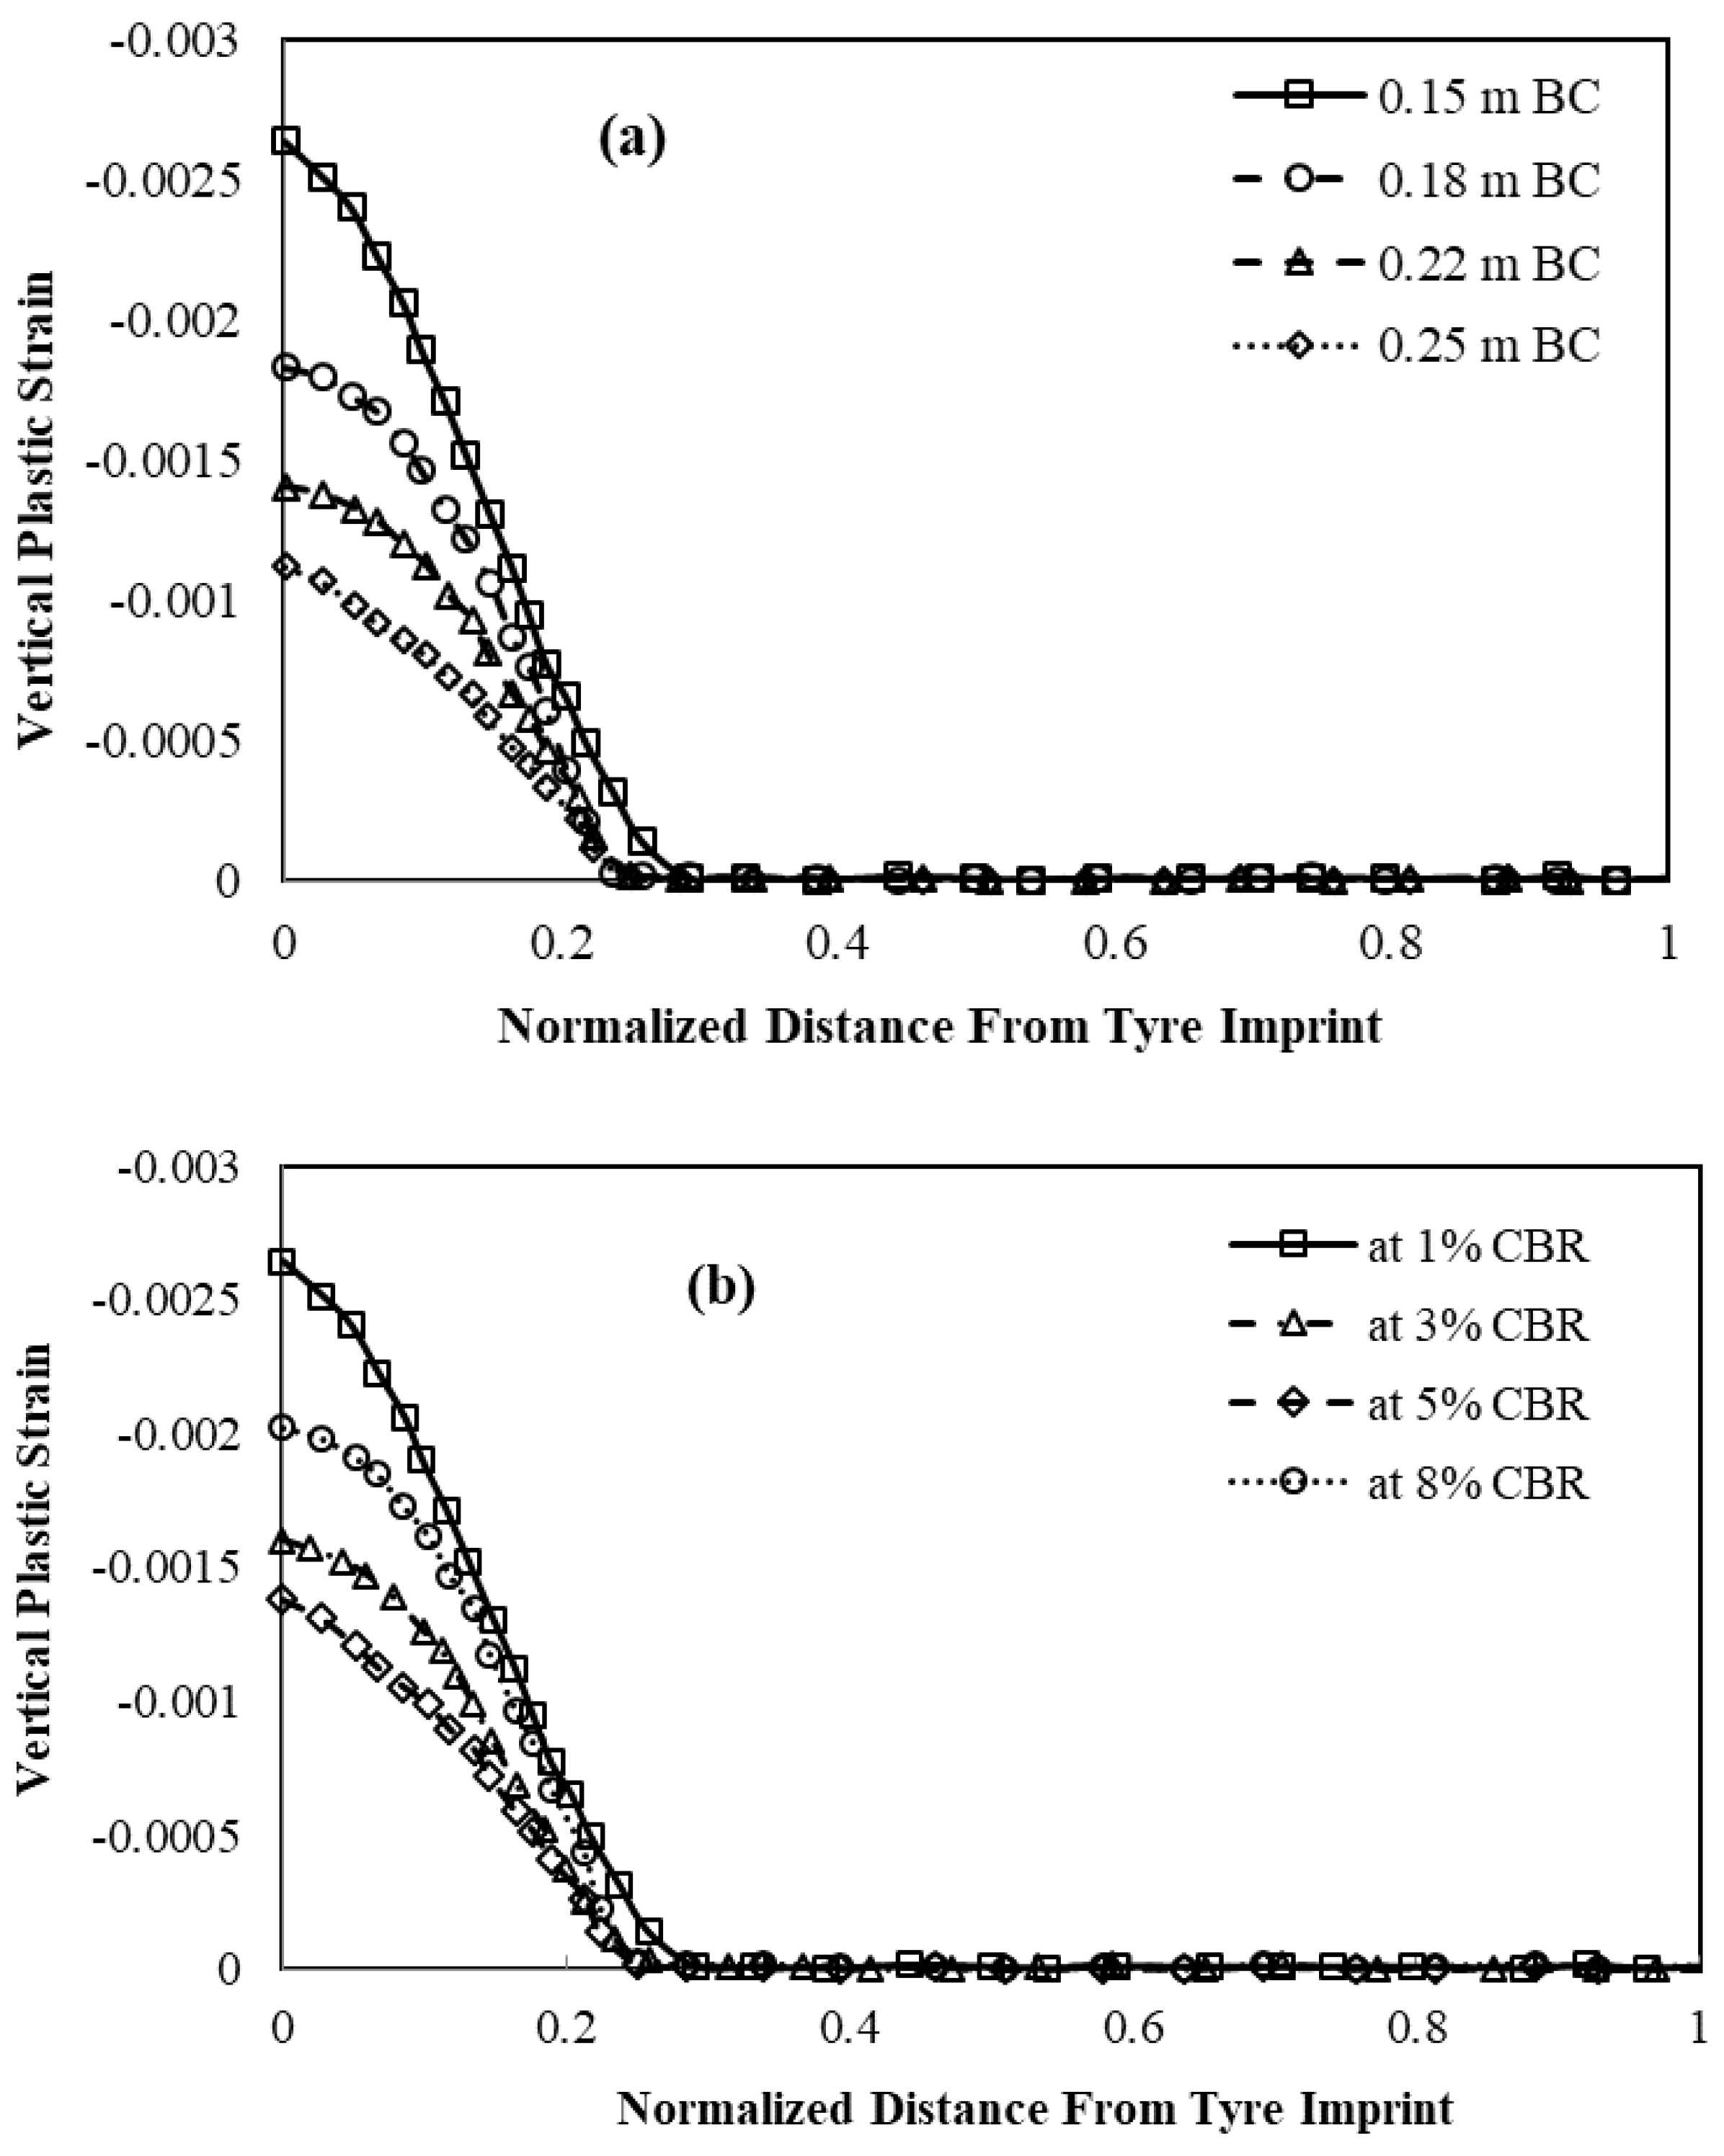
3.3.1. Vertical Stain

The vertical compressive strain experienced by the subgrade is considered pivotal as it directly impacts the permanent deformation of the pavement. Figure 8 illustrates the vertical strain atop the subgrade for pavements with and without geogrid reinforcement, subjected to 10,000 and 20,000 load repetitions (at CBR = 1%). These strain values are measured beneath the tyre imprint and observed as they propagate towards the pavement’s edge, with the normalized distance from the tyre imprint depicted in the figure. The incorporation of a geogrid layer leads to a significant reduction in vertical strain at the subgrade, albeit diminishing gradually towards the pavement’s edge. Acting as a protective layer for the subgrade, the geogrid distributes loads more uniformly, thereby mitigating vertical strains. Notably, a reduction of approximately 36–38% in maximum vertical strain is observed in the reinforced section for both 10,000 and 20,000 load repetitions.
Figure 9 displays profiles of vertical strain for reinforced pavements at various locations within the subgrade. These strain profiles indicate that both the presence of geogrid and the subgrade’s strength have substantial effects on vertical strain. As subgrade stiffness/strength increases, vertical strain decreases significantly. However, the influence zone of vertical strain extends up to a depth of 300 mm within the subgrade, beyond which there is no significant variation in strains for different CBR values of the subgrade soil. At the subgrade’s surface, vertical strain decreases by approximately 17%, 39%, and 49% as the CBR value increases from 1% to 3%, 5%, and 8%, respectively.

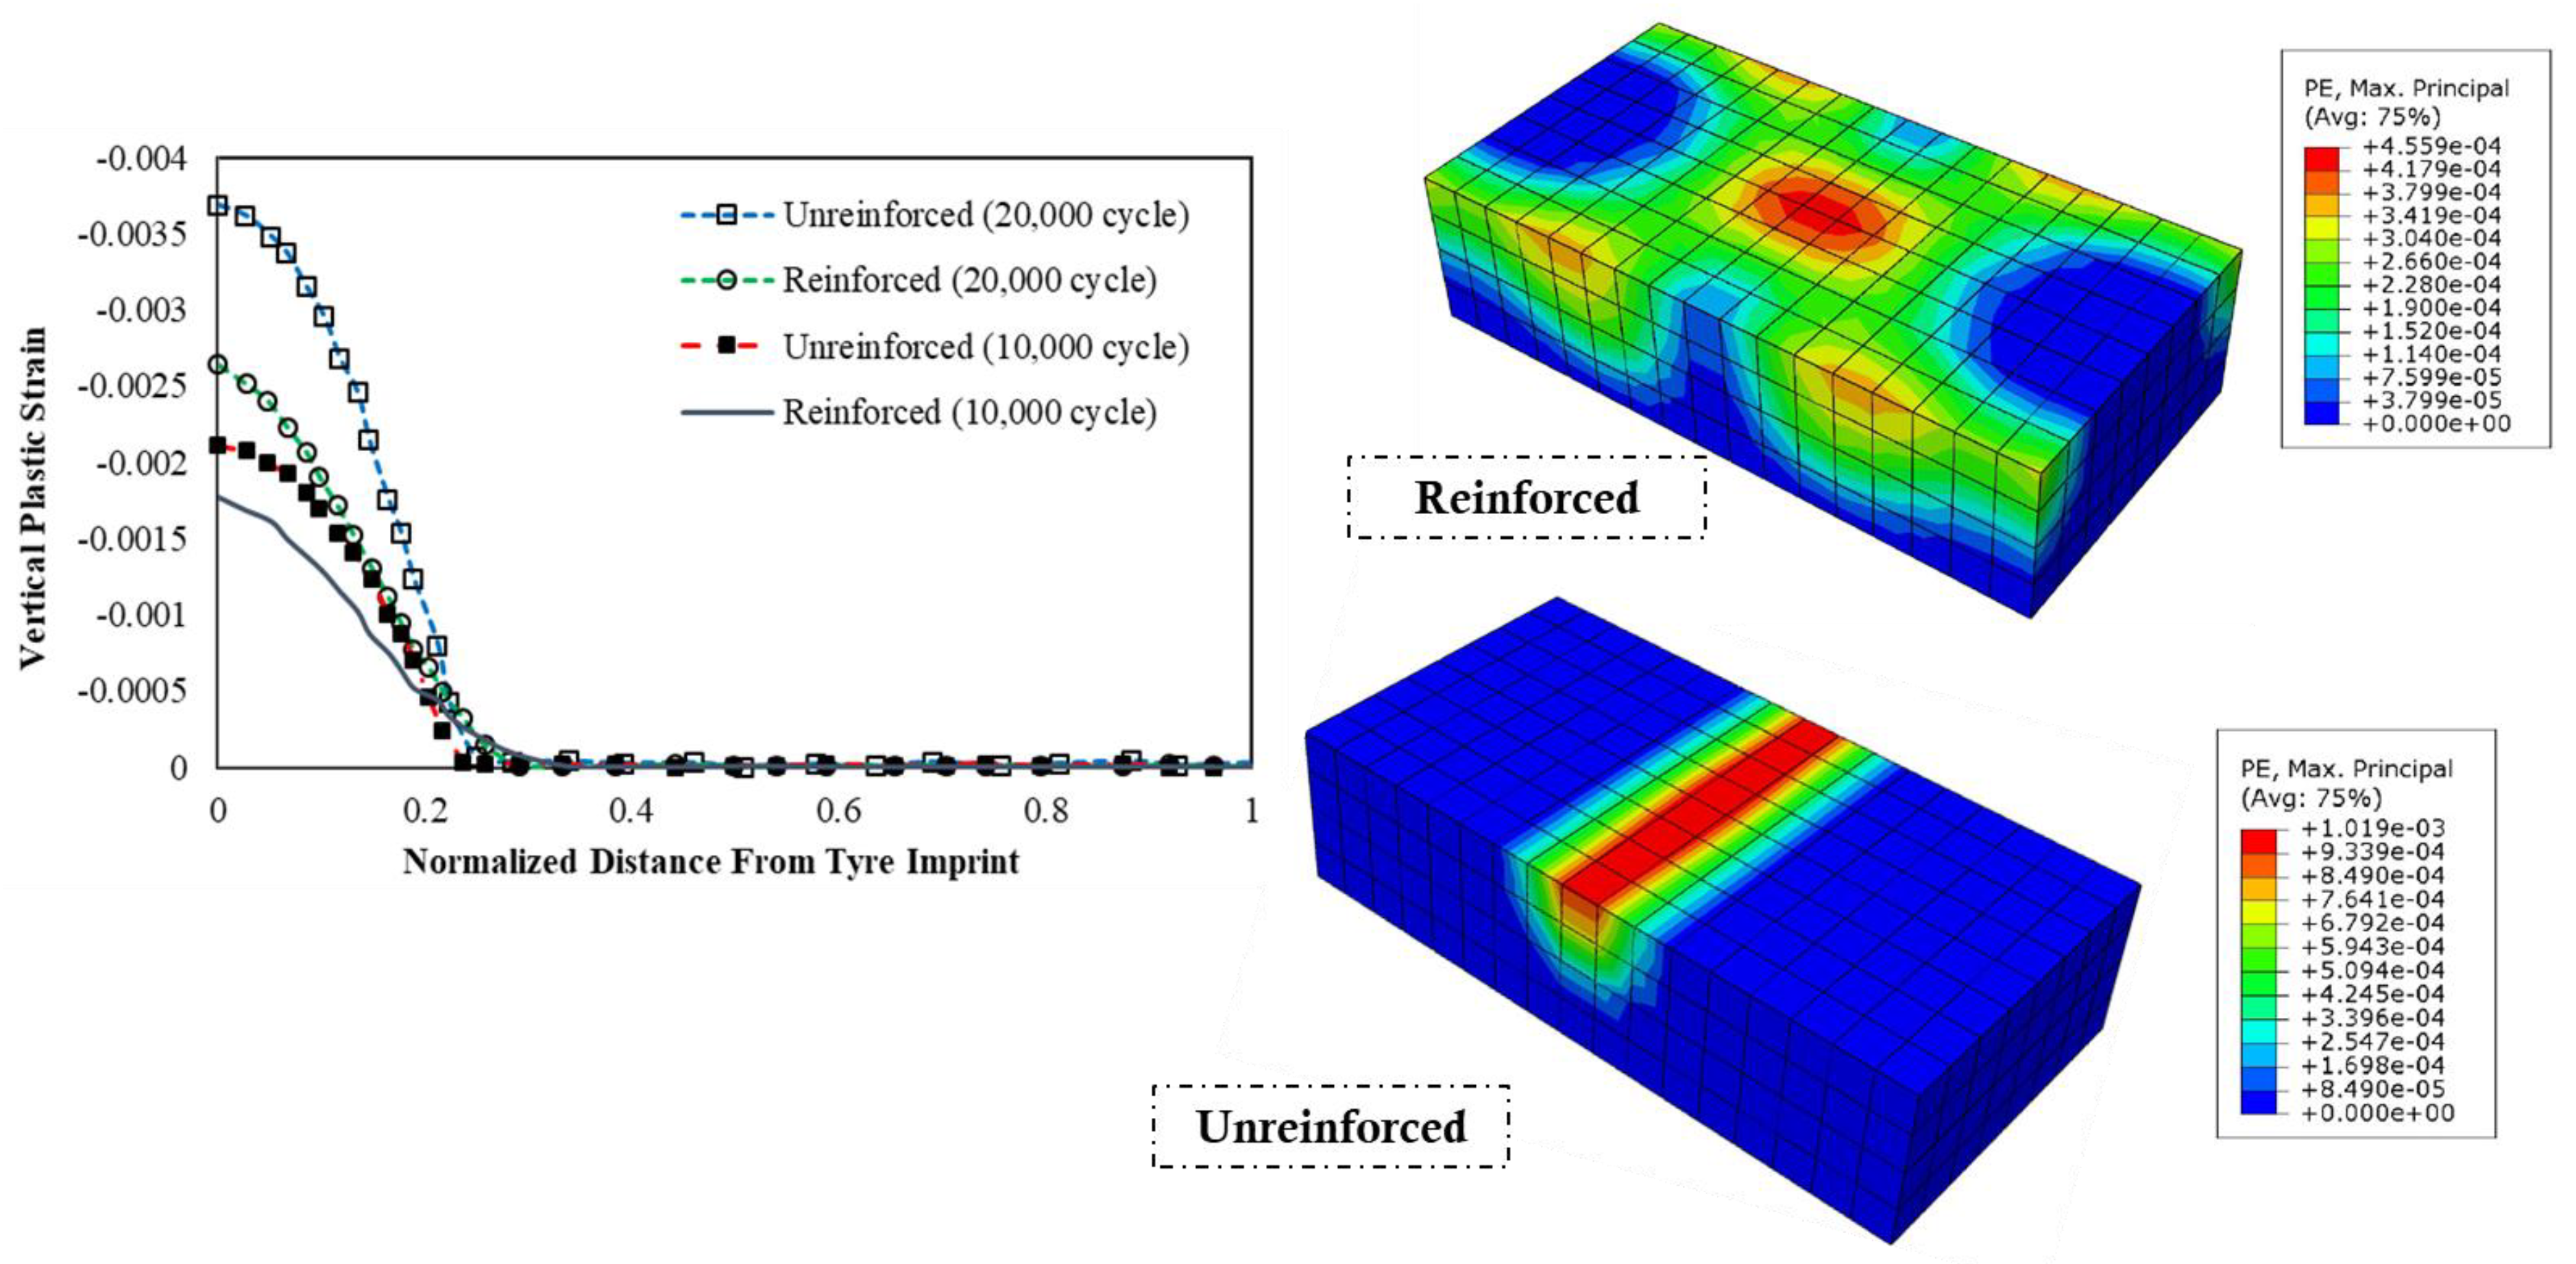
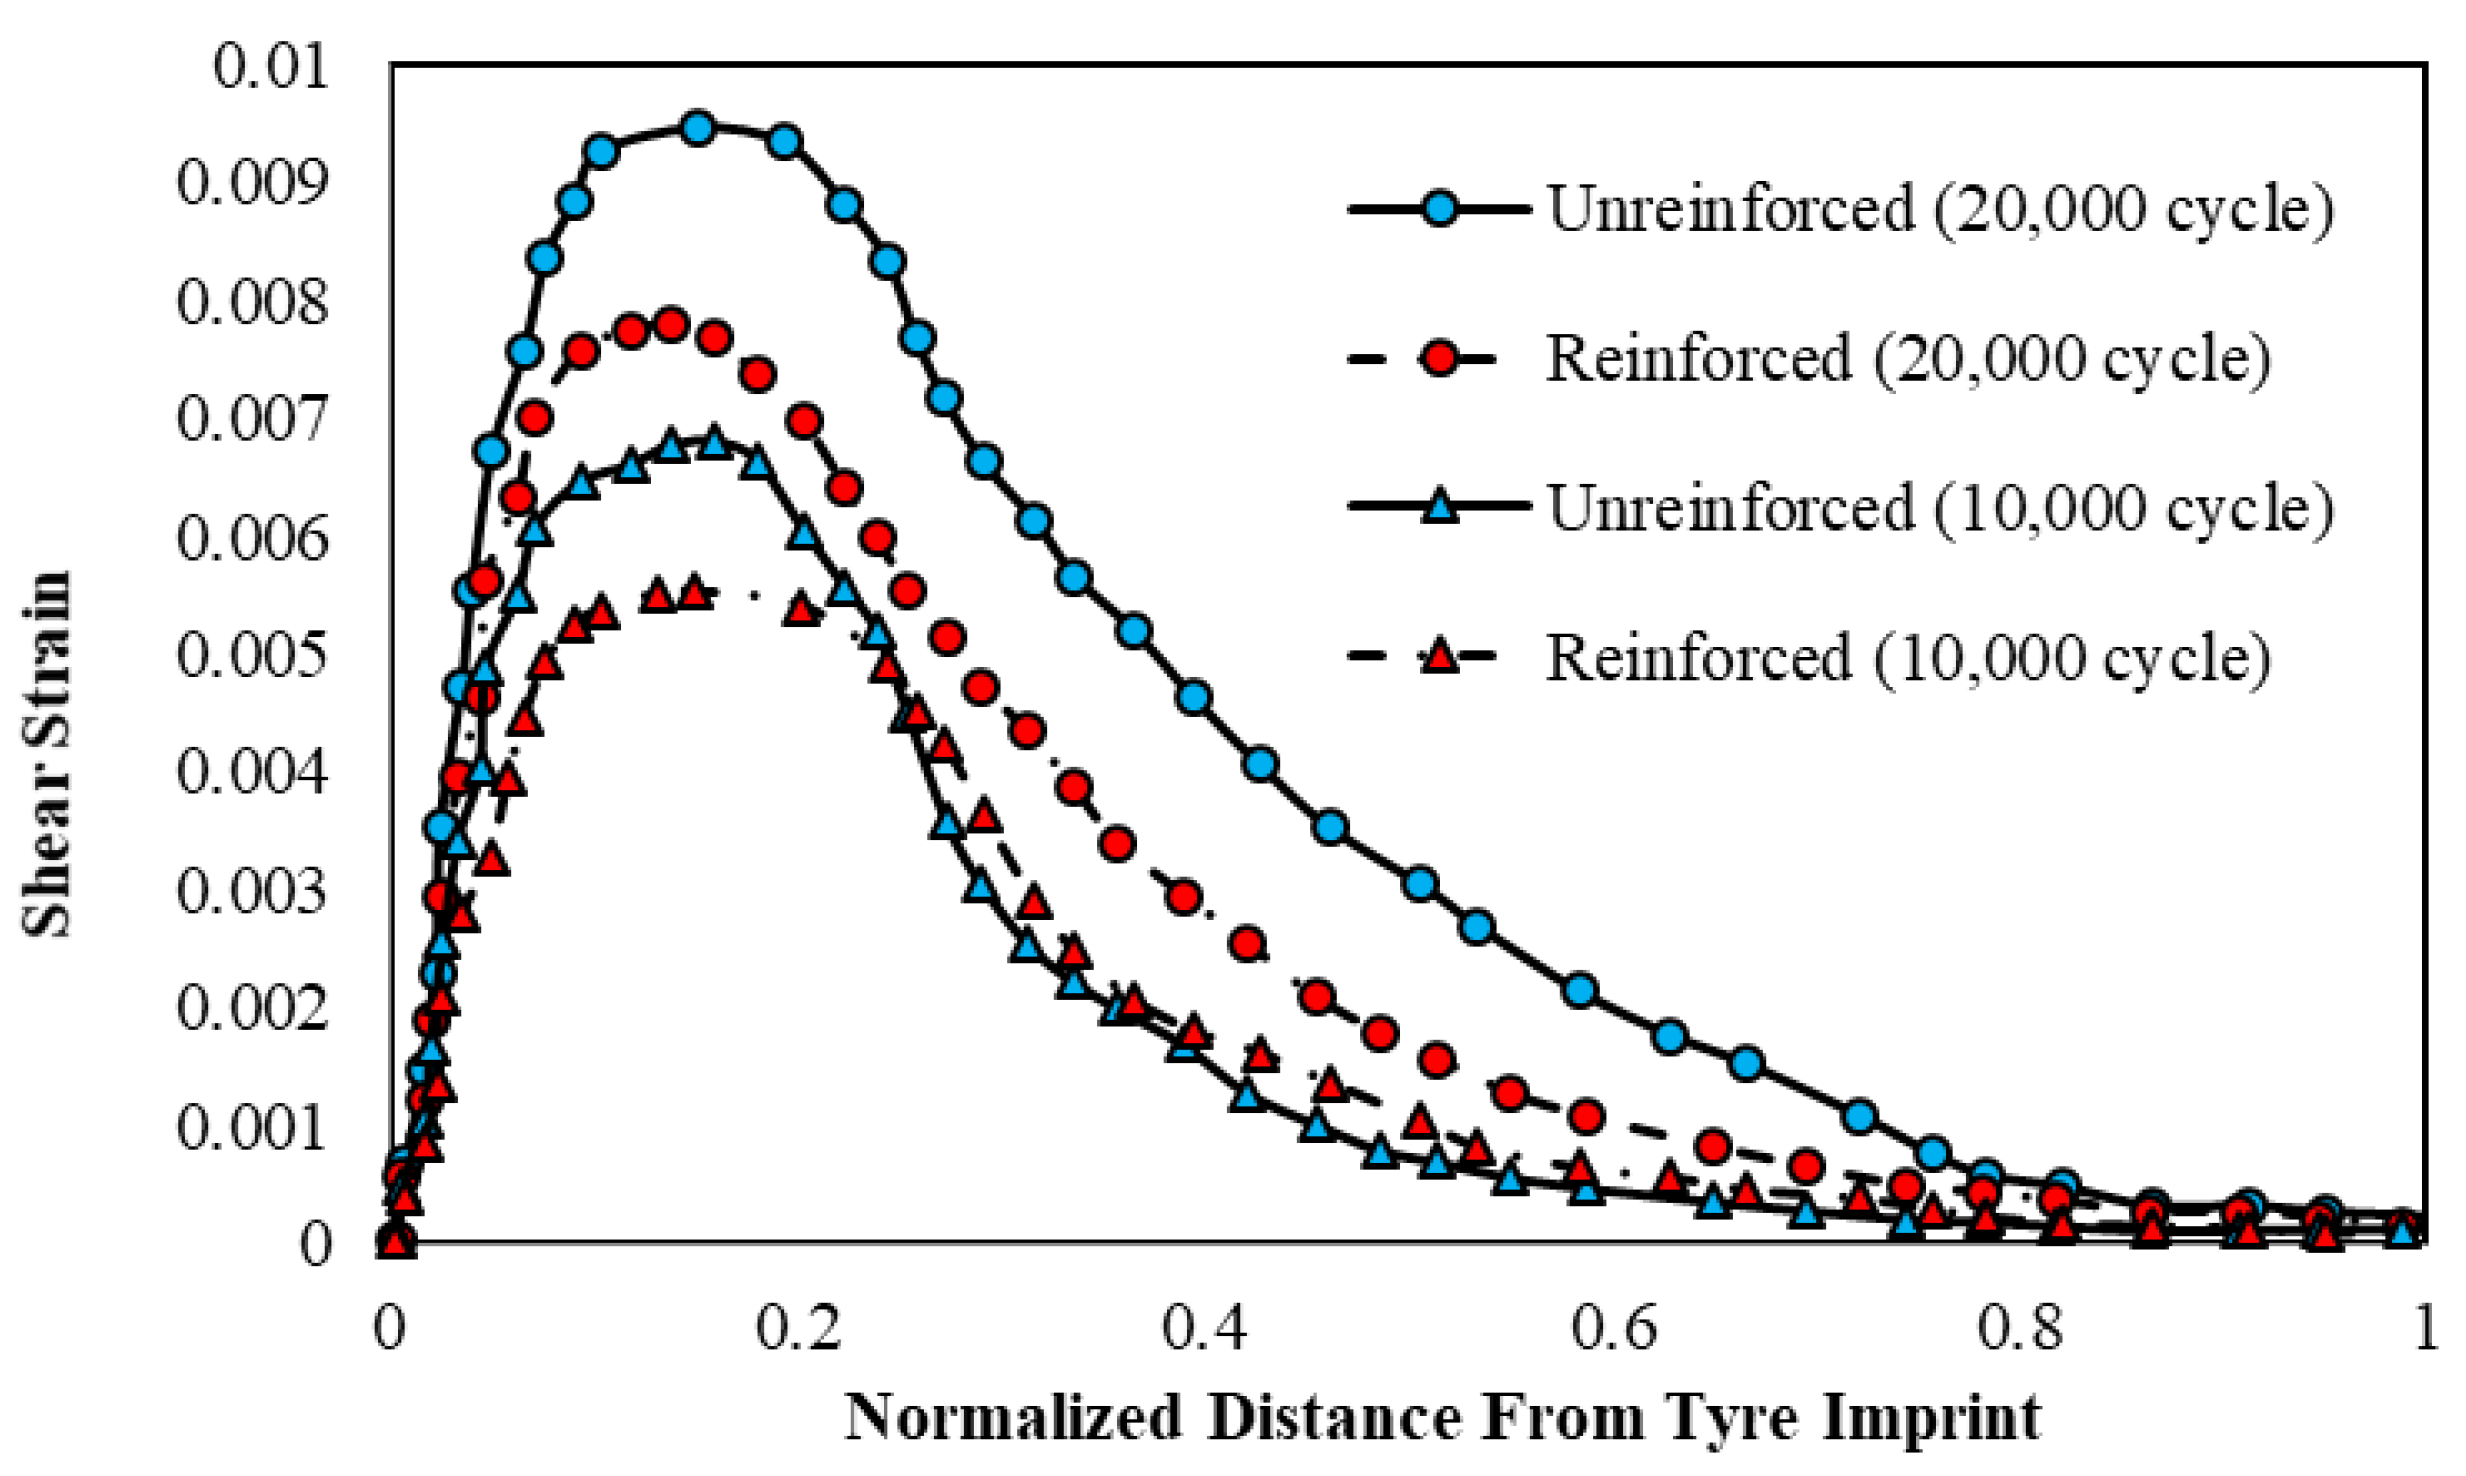
3.3.2. Plastic Strain and Shear Strain

Figure 10 illustrates the plastic strain profiles of both unreinforced and geogrid-reinforced pavements over 10,000 and 20,000 loading cycles. It is evident that the geogrid reinforcement results in lower plastic strain compared to the unreinforced section while also distributing the strain at the subgrade’s top. This significant plastic strain suggests that the influence of the geogrid layer predominantly affects the formation of plastic strains rather than resilient strains, indicating its efficacy in mitigating permanent deformation. Additionally, plastic strain is influenced by subgrade stiffness and base layer thickness, as depicted in Figure 11a,b. Increased base course thickness correlates with reduced vertical plastic strain, while higher CBR values of subgrade soil also lead to lower vertical plastic strain. For instance, increasing the base thickness from 150 mm to 180 mm reduces plastic strain by approximately 30%, while increases to about 47% and 58% are observed when the base thickness changes to 220 mm and 250 mm, respectively.
Examining shear strain reveals slightly distinct patterns compared to plastic strain. Unlike plastic strain, shear strain registers zero at the centre of the tire imprint, peaking after passing the tire centre, as depicted in Figure 12. Geogrid reinforcement not only decreases shear strains at the subgrade’s surface but also improves their distribution. This is primarily attributed to the base/sub-base layer predominantly transferring tensile loads to the geogrid reinforcement rather than the subgrade, thereby reducing shear strains in the subgrade soil. Considering base course thickness, it is clear that shear strain decreases as base thickness increases. For example, increasing the base thickness from 150 mm to 180 mm results in a 23% reduction in shear strain, while increases to about 32% and 37% are observed with base thickness changes to 220 mm and 250 mm, respectively. Similarly, CBR values also impact shear strain, with increasing soil strength leading to a continuous reduction in shear strain.

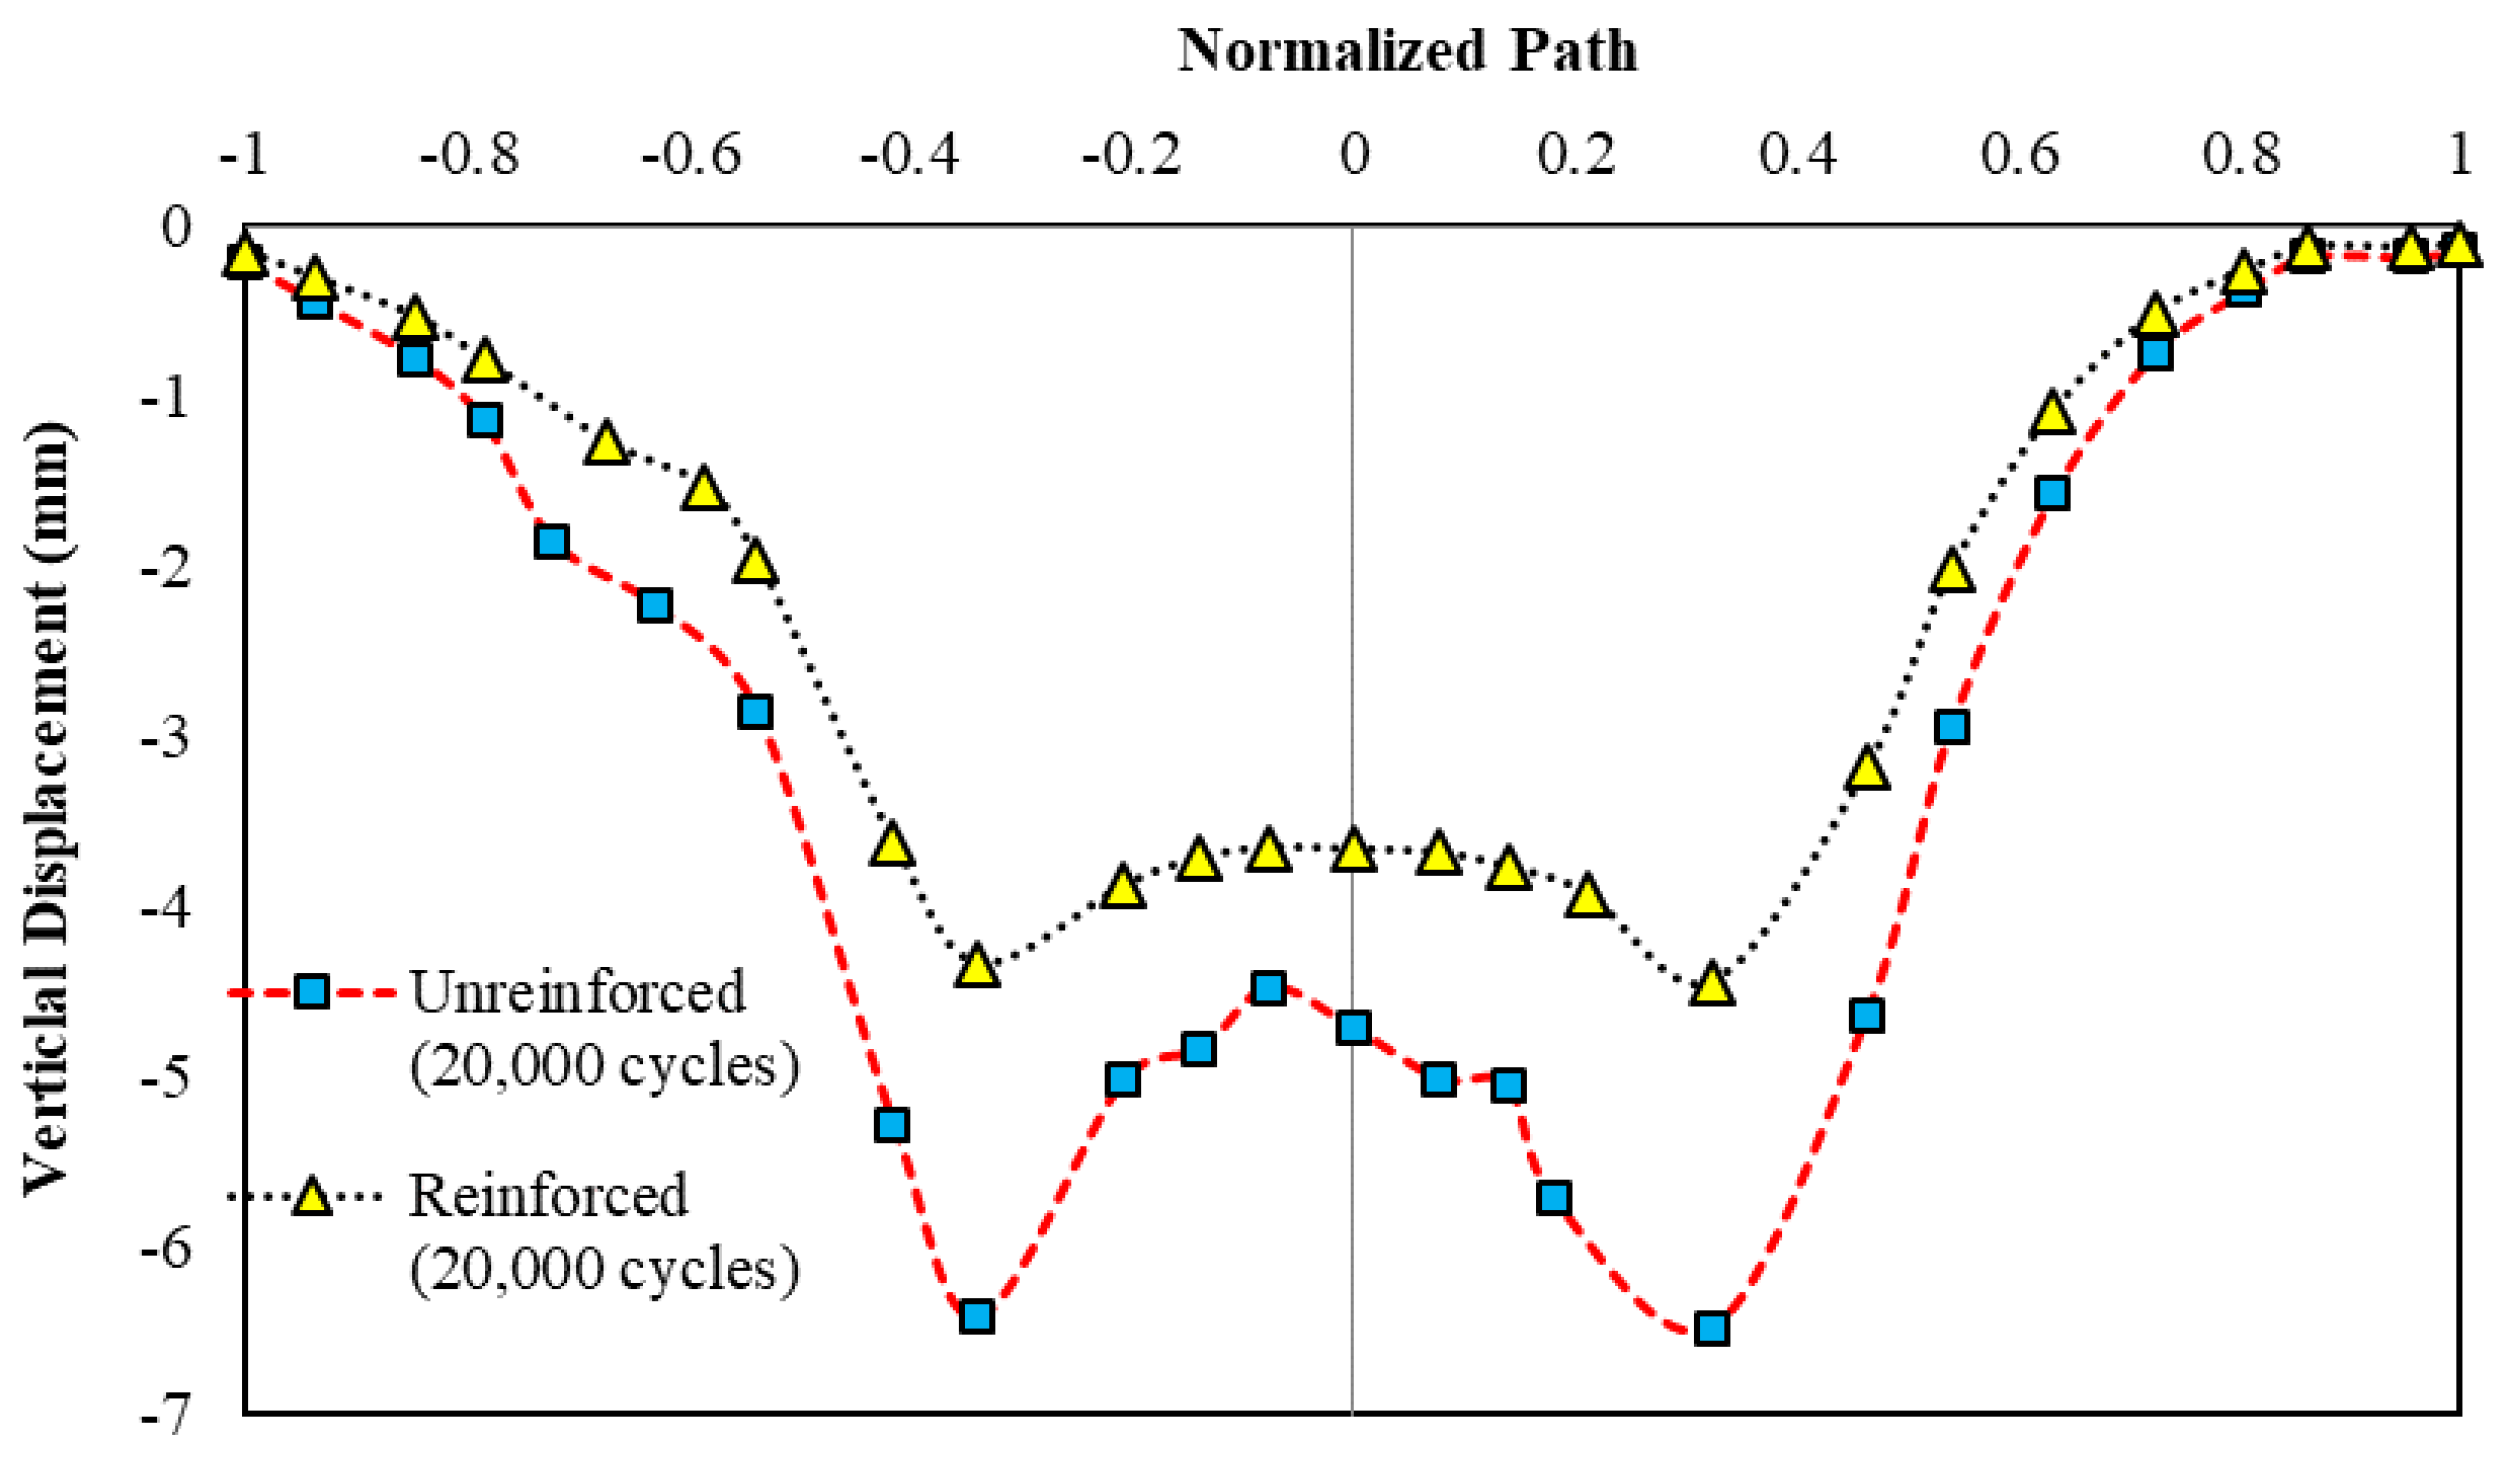
3.4. Vertical Stress and Displacement at the Top of the Subgrade

Table 2 presents the vertical stress at the top portion of the subgrade in both unreinforced and geogrid-reinforced pavements across various base thicknesses. Notably, the stresses in reinforced sections are significantly lower compared to unreinforced pavements. However, the reduction in stresses varies, being more pronounced with lower base thicknesses. As the base thickness increases, the disparity in stress between unreinforced and reinforced layers diminishes. With higher base thicknesses, a larger portion of the stresses induced by traffic loads is distributed, resulting in the geogrid bearing a smaller proportion of stress compared to lower base thicknesses. For instance, at a base thickness of 150 mm, the geogrid-reinforced model exhibits approximately 12–13% lower stress than the unreinforced model, whereas this reduction decreases to only about 6.5–7% at a base thickness of 250 mm. The vertical stresses observed from FE images for both reinforced and unreinforced subgrade sections are also mentioned in Figure 13.
Figure 14 displays profiles of vertical displacement along the normalized path of the pavement model for both unreinforced and reinforced sections, considering a 1% CBR value and a base thickness of 150 mm. Vertical displacement predominantly occurs beneath the tire imprint, diminishing to nearly zero at the pavement model’s edge. The material beneath the tire imprint experiences higher stress and greater deflection than other parts of the model. Nevertheless, geogrid reinforcement effectively mitigates vertical displacement of the subgrade soil, particularly beneath the wheels. This is primarily due to the geogrid layer sustaining the transferred load from the base/sub-base layer, thus preventing excessive deformation of the subgrade. Overall, this study reveals that reinforced pavements exhibit approximately 31–39% less vertical displacement compared to unreinforced pavement models. The displacement of the full pavement model for reinforced and unreinforced layers is also shown in Figure 15, where it is clearly visible that the reinforced section offers lesser deformation compared to the normal pavement.

4. Conclusions

The primary aim of this investigation was to assess how geogrid reinforcement impacts flexible pavement, employing finite element analysis. A comprehensive analysis of a 3D layered pavement was conducted, incorporating a geogrid layer atop the subgrade layer while varying subgrade strengths and base layer thicknesses. Key findings from this study are:
  • Geogrid significantly enhances the overall performance of flexible pavement by effectively managing tensile strain under traffic loads. It demonstrates notable tensile strain in proximity to the loading area while exhibiting minimal compressive strain at the central section.
  • Geogrid significantly decreases the vertical strain exerted at the top of the subgrade. By incorporating geogrid, a noticeable decrease of approximately 36–38% in the maximum vertical strain is evident when compared to pavement without reinforcement.
  • As the CBR value rises, vertical strain diminishes, though the zone of influence extends to a depth of 300 mm within the subgrade, beyond which strain variations are insignificant. At the subgrade’s surface, vertical strain decreases by approximately 17%, 39%, and 49% as the CBR value escalates from 1% to 3%, 5%, and 8%, respectively.
  • The plastic strain observed in geogrid-incorporated pavement suggests that the elastic strain resulting from stress is comparatively minor. This implies that the presence of the geogrid layer has a more significant impact on the development of plastic strains than on resilient strains.
  • Overall, this study shows the effectiveness of geogrid incorporation in flexible pavement and the role of geogrid in reducing the total stress, strain, and deflection of the pavement. However, further studies need to be carried out with different traffic loads to identify specific layer thicknesses for weak soil subgrade.

Author Contributions

Conceptualization, S.C. and P.D.; methodology, S.C.; software, S.C. and P.D.; validation, P.D.; data curation, S.C.; writing—original draft preparation, S.C.; writing—review and editing, P.D.; supervision, P.D. All authors have read and agreed to the published version of the manuscript.

Funding

This research received no external funding.

Institutional Review Board Statement

Not applicable.

Informed Consent Statement

Not applicable.

Data Availability Statement

The original contributions presented in the study are included in the article, further inquiries can be directed to the corresponding author.

Conflicts of Interest

The authors declare no conflicts of interest.

References

  1. Ziegler, M. Application of Geogrid Reinforced Constructions: History, Recent and Future Developments. Procedia Eng. 2017, 172, 42–51. [Google Scholar] [CrossRef]
  2. Zornberg, J.G. Functions and Applications of Geosynthetics in Roadways. Procedia Eng. 2017, 189, 298–306. [Google Scholar] [CrossRef]
  3. Abu-Farsakh, M.Y.; Chen, Q. Evaluation of geogrid base reinforcement in flexible pavement using cyclic plate load testing. Int. J. Pavement Eng. 2011, 12, 275–288. [Google Scholar] [CrossRef]
  4. Gong, H.; Sun, Y.; Huang, B. Gradient Boosted Models for Enhancing Fatigue Cracking Prediction in Mechanistic-Empirical Pavement Design Guide. J. Transp. Eng. Part B Pavements 2019, 145, 04019014. [Google Scholar] [CrossRef]
  5. Visvanathan, A.; Velayudhan, S.; Mathew, S. Field Evaluation of Coir Geotextile Reinforced Subgrade for Low Volume Pavements. J. Nat. Fibers 2022, 19, 597–609. [Google Scholar] [CrossRef]
  6. Leonardi, G.; Suraci, F. A 3D-FE Model for the Rutting Prediction in Geogrid Reinforced Flexible Pavements. Sustainability 2022, 14, 3695. [Google Scholar] [CrossRef]
  7. Alimohammadi, H.; Zheng, J.; Schaefer, V.R.; Siekmeier, J.; Velasquez, R. Evaluation of geogrid reinforcement of flexible pavement performance: A review of large-scale laboratory studies. Transp. Geotech. 2021, 27, 100471. [Google Scholar] [CrossRef]
  8. Hatami, K.; Bathurst, R.J. Development and verification of a numerical model for the analysis of geosynthethic-reinforced soil segmental walls under working stress conditions. Can. Geotech. J. 2005, 42, 1066–1085. [Google Scholar] [CrossRef]
  9. Hatami, K.; Asce, M.; Bathurst, R.J. Numerical Model for Reinforced Soil Segmental Walls under Surcharge Loading. J. Geotech. Geoenviron. Eng. 2006, 132, 673–684. [Google Scholar] [CrossRef]
  10. Demir, A.; Yildiz, A.; Laman, M.; Ornek, M. Experimental and numerical analyses of circular footing on geogrid-reinforced granular fill underlain by soft clay. Acta Geotech 2014, 9, 711–723. [Google Scholar] [CrossRef]
  11. Mukherjee, S.; Kumar, L.; Choudhary, A.K.; Babu, G.L.S. Pullout resistance of inclined anchors embedded in geogrid reinforced sand. Geotext. Geomembr. 2021, 49, 1368–1379. [Google Scholar] [CrossRef]
  12. Mukherjee, S.; Sivakumar Babu, G.L. Three-dimensional numerical modeling of geogrid reinforced foundations. Comput. Geotech. 2023, 158, 105397. [Google Scholar] [CrossRef]
  13. Hussein, M.G.; Meguid, M.A. A three-dimensional finite element approach for modeling biaxial geogrid with application to geogrid-reinforced soils. Geotext. Geomembr. 2016, 44, 295–307. [Google Scholar] [CrossRef]
  14. Amirhosseini, I.; Toufigh, V.; Toufigh, M.M.; Ghazavi-Baghini, E. Three-Dimensional Modeling of Geogrid Pullout Test Using Finite-Element Method. Int. J. Geomech. 2022, 22, 04021297. [Google Scholar] [CrossRef]
  15. Indian Roads Congress. IRC: 37-2012, Guidelines for the Design of Flexible Pavements; Indian Roads Congress: New Delhi, India, 2012; pp. 1–104. [Google Scholar]
  16. Abdesssemed, M.; Kenai, S.; Bali, A. Experimental and numerical analysis of the behavior of an airport pavement reinforced by geogrids. Constr. Build. Mater. 2015, 94, 547–554. [Google Scholar] [CrossRef]
  17. IRC 37:2018; Guidelines for the Design of Flexible Pavements. Indian Roads Congress: New Delhi, India, 2018.
  18. Singh, A.K.; Sahoo, J.P. Analysis and design of two layered flexible pavement systems: A new mechanistic approach. Comput. Geotech. 2020, 117, 103238. [Google Scholar] [CrossRef]
  19. Liu, Z.; Gu, X.; Ren, H. Rutting prediction of asphalt pavement with semi-rigid base: Numerical modeling on laboratory to accelerated pavement testing. Constr. Build. Mater. 2023, 375, 130903. [Google Scholar] [CrossRef]
Figure 1. Overview of the pavement and geogrid.
Applsci 14 05798 g001
Figure 2. Model mesh and boundary selection.
Applsci 14 05798 g002
Figure 3. Comparison of the current FE model to another study [19].
Applsci 14 05798 g003
Figure 4. Analysis approach adopted in this study.
Applsci 14 05798 g004
Figure 5. (a,b) Strain developed in the geogrid.
Applsci 14 05798 g005
Figure 6. Strain and deflection developed in the geogrid.
Applsci 14 05798 g006
Figure 7. Variation of tensile force in the geogrid with several CBR values.
Applsci 14 05798 g007
Figure 8. Vertical strain at the subgrade’s top.
Applsci 14 05798 g008
Figure 9. Profiles of vertical strain at different depths of the subgrade.
Applsci 14 05798 g009
Figure 10. Plastic strain profiles of unreinforced and geogrid-reinforced pavements.
Applsci 14 05798 g010
Figure 11. (a,b) Plastic strain developed in the geogrid-reinforced subgrade.
Applsci 14 05798 g011
Figure 12. Shear strain developed in the geogrid-reinforced subgrade.
Applsci 14 05798 g012
Figure 13. Vertical stresses at the subgrade’s top.
Applsci 14 05798 g013
Figure 14. Profiles of vertical displacement obtained at the top of the subgrade.
Applsci 14 05798 g014
Figure 15. Displacement of the full pavement model.
Applsci 14 05798 g015
Table 1. Properties of the pavement layers and geogrid used in the FE model.
LayersE
(MPa)
µ(kg/m3)C
(MPa)
Ø
(in Degree)
Element TypeFailure Criterion
Asphalt Concrete54000.42400--C3D8R and C3D6LE
Binder Course54000.42500--C3D8RLE
Base Course12000.3522001040C3D8RM-C
Sub-base Course10000.3518001040C3D8RM-C
SubgradeVariable0.3516001030C3D8RM-C
Embankment4000.315001030C3D8RM-C
Geogrid629.30.31100--C3D6LE
Note: C3D8R = 8-noded hexahedral brick, C3D6 = 6-noded triangular prism, LE = linear elastic, M-C = Mohr–Coulomb failure criterion, E = elastic modulus, µ = Poisson’s ratio, and Ø = angle of internal friction.
Table 2. Vertical stress at the top portion of the subgrade.
Vertical Stress (kPa) at Subgrade’s Top
Base Course (BC) ThicknessUnreinforcedReinforced
150267.5233.7
180229.3204.4
220197181.9
250175.4163.5
Disclaimer/Publisher’s Note: The statements, opinions and data contained in all publications are solely those of the individual author(s) and contributor(s) and not of MDPI and/or the editor(s). MDPI and/or the editor(s) disclaim responsibility for any injury to people or property resulting from any ideas, methods, instructions or products referred to in the content.

