Article

A Multi-Performance Reliability Evaluation Approach Based on the Surrogate Model with Cluster Mixing Weight

by
Xiaoduo Fan
,
Jiantai Wang
,
Jianguo Zhang
* and
Ziqi Ni
School of Reliability and Systems Engineering, Beihang University, Haidian District, Beijing 100191, China
*
Author to whom correspondence should be addressed.
These authors contributed equally to this work and should be considered as co-first authors.
Appl. Sci. 2024, 14(13), 5813; https://doi.org/10.3390/app14135813
Submission received: 14 June 2024 / Revised: 28 June 2024 / Accepted: 1 July 2024 / Published: 3 July 2024
(This article belongs to the Special Issue Advances and Challenges in Reliability and Maintenance Engineering)

Abstract

:
Kriging surrogate model has extracted extensive attention in reliability evaluation, owing to its excellent applicability and operability nowadays, which confronts with difficulties in balancing the efficiency and accuracy for complicated mechanical assets with multiple failure modes. Consequently, this paper devises a multi-performance reliability analysis approach within the surrogate model framework, particularly innovative in its use of cluster mixing weight. Specifically, high-value test points are selected to fit the surrogate model after sorting the samples referring to the corresponding values; then, a cluster-based active learning strategy is employed to accomplish rapid convergence, and the particle swarm algorithm is utilized to optimize relevant parameters. Afterwards, the mixing weight for every performance referring to the contributions to the final reliability is determined, and the failure probability is subsequently predicted. Furthermore, the superiority of the proposed approach with the clustering surrogate model and mixing weight, compared with traditional sampling as well as other surrogate models, has been verified via case studies, contributing to overcoming the multi-performance reliability analysis oriented to complicated mechanical assets.

1. Introduction

Complicated mechanical assets have served an increasingly significant role in industrial systems, which tend to accomplish diverse functions and operate in comprehensive and dynamic environment load, particularly restricted by multiple performance indicators, resulting in various probable failure modes. In addition, they are prone to induce downtime, trigger large economic losses, and even threaten personnel safety once failure occurs [1,2,3]. Notably, these multiple performance parameters, when operating, exhibit random uncertainties, such as variations in material properties, loads and structural geometry, which can produce inevitable effects on the reliability and safety analysis of complicated mechanical assets [4,5,6,7]. Furthermore, there exists more than one limit state function, and basic component variables vary with the different limit state functions induced by multiple failure modes. Consequently, it is extraordinarily significant to investigate the performance reliability analysis oriented to complicated mechanical systems, promoting operation efficiency in the economy, safety and other terms [8,9,10].
As aforementioned, the practical limit state function is generally characterized by being high-dimension, nonlinear and implicit, which generates a challenge in calculation. To this end, the Monte Carlo simulation earns a wide utilization [11,12], whose advantages encompass the execution convenience and excellent accuracy based on sufficient samples. However, the calculation efficiency of the Monte Carlo method will be seriously restricted when the limit state function is nonlinear, complex or implicit, especially for the system with low failure probability, indicating enormous computation cost and time [13,14,15]. Therefore, how to promote the calculation efficiency of the limit state function has become a widely concerned point in the reliability analysis of complicated mechanical assets.
In recent decades, the surrogate model has been widely employed to address the relevant issues, whose core is constructing a surrogate model to substitute the original limit state function during calculation. Guided by the mentioned principle, quantities of approaches arise, such as response surface method (RSM) [16,17,18], Kriging [19,20,21], polynomial chaos expansion (PCE) [22,23], radial basis function (RBF) [24,25], support vector machine (SVM) [26,27], artificial neural network (ANN) [28,29,30,31,32,33], etc., all of which are relatively convenient to be enforced and to promote the computation efficiency to a great extent. More specifically, the Kriging model possesses superior local characteristics, enabling it to concurrently predict sample response value and corresponding errors. Nonetheless, the intricate nature of its construction poses challenges, particularly in scenarios involving vast sample sizes, where a significant computational load will be incurred. Additionally, it behaves poorly in the fitting procedure for high-dimensional problems. The PCE model possesses excellent global characteristics, but its computation efficiency decreases exponentially with the increase in the dimension upon input variables. The RBF model has a distinct advantage in simple structure, concise training, fast and convergence aspects, and can approximate any nonlinear function, overcoming local minimum issues. Nevertheless, it falls short in interpretation, determining the number of hidden layer nodes, node center and width, and data pathology occurs in the optimization process. By contrast, the SVM model exhibits superior capabilities in handling high-dimensional data and possesses robot generalization abilities, but the computational complexity of the SVM model is high, especially for large-scale and high-dimensional data sets, leading to substantial demands on computation time and space [34]. Moreover, the training of the SVM algorithm necessitates numerous iterations, escalating computational complexity.
The construction of the surrogate model can be divided into two stages, namely the initial modelling and subsequent update. In the first phase, the initial sample can be generated via Latin hypercube sampling or other methods, supporting the modelling. Afterwards, samples of great significance will be gradually added to the initial sample referring to the principle of different points, accomplishing the update of the surrogate model.
Regarding the traditional Kriging model, it possesses advantages compared with other surrogate models, such as quadratic polynomials, in several cases. However, the analysis result might be worse than that if the calculation of weight coefficient is imprecise, that is, the accurate calculation of the weight coefficient is crucial for the reliability analysis within Kriging model. Furthermore, its computational efficiency is inherently constrained by the iterative process that discards all sample points, limiting further enhancement. In contrast, the single-step approach to agent model construction, which involves selecting the training set from the input variable space in a single instance, intuitively suggests an improvement in model accuracy with an increased number of sample points. However, empirical findings indicate that for low-dimensional scenarios, once the training point count reaches a threshold, further augmentation of sample points does not significantly enhance the constructed agent model. To overcome the mentioned issue, the adaptive surrogate model method comes into being. It adaptively screens training sample points via learning functions and convergence criteria, and then improves model accuracy through a multi-step iteration strategy. Common learning functions comprise U [35] and H [36], EFF [37], EGO [38], CCL [39], etc.
Motivated by fulling the aforementioned gaps, this paper devises a multi-performance reliability evaluation approach for complicated mechanical systems based on the surrogate model with cluster mixing weight, which produces several contributions in practical engineering, the surrogate model and performance-based reliability analysis, summarized as follows:
  • Devising a multi-performance reliability analysis algorithm appropriate for complicated mechanical assets with various failure modes;
  • Promoting efficiency in balancing the calculation cost and accuracy of the proposed cluster surrogate model to a great extent;
  • Generating a mixing weight channel to investigate the different contributions to overall reliability corresponding to diverse practical engineering scenarios.
In detail, the particle swarm algorithm is employed to optimize relevant parameters, avoiding the local optimality. This method avoids redundant information via preserving existing high-value test points through sample inheritance, which utilizes a cluster-based active learning strategy in selecting multiple high-value test points in each iteration to expand the test point set, achieving rapid convergence. Then, the convergent surrogate model is combined with the importance sampling method to calculate the reliability, and the weight importance sampling function is constructed to predict the failure probability. This paper utilizes a surrogate model based on the Kriging method to fit implicit reliability issues, which could greatly improve computing efficiency and reduce computing costs.
The remainder of the paper is organized as follows. Section 2 introduces the learning function definition and convergence criteria in the surrogate model construction. A brief introduction of mixing weight importance sampling is presented in Section 3. The proposed algorithm and application of reliability approaches are elaborated in Section 4. A numerical example as well as two engineering experiments are studied in Section 5 to demonstrate the applicability of the proposed approach. The conclusion is summarized in Section 6.

2. Cluster-Based Sample Inheritance Statement

2.1. Overview of Kriging Model

The Kriging model consists of regression terms and error terms, which can be expressed as follows:
Y ( X ) = F ( β , X ) + z ( X ) ,
where Y ( X ) represents the performance response of the system; z ( X ) denotes a random process with the expectation of 0 and variance of σ 2 . F ( β , X ) is a regression term, which encompasses a linear combination of polynomial functions, shown in the following:
F ( β , X ) = β 1 f 1 ( X ) + β 2 f 2 ( X ) + + β P f P ( X ) = [ f 1 ( X ) f p ( X ) ] T β = f T β .
f i ( X ) represents the polynomial function of X , β = ( β 1 , β 2 , , β p ) denotes the coefficient of the regression term, and p represents the number of polynomial functions.
The error term satisfies the following properties:
E [ z ( X ) ] = 0 ,
V a r [ z ( X ) ] = σ 2 ,
C o v [ z ( x i ) , z ( x j ) ] = σ 2 R ( x i , x j ) .
Among them, R ( x i , x j ) is a correlation function with parameters, which means that random variables at different positions in the design space tend to possess a certain correlation. The correlation function in the form of Gaussian function can be expressed as follows:
R ( x i , x j ) = exp ( k = 1 n θ k x i k x j k 2 ) ,
where θ k is the unknown parameter. It is apparent that only the weight coefficient, θ = [ θ 1   θ 2   θ k ] T , is necessary to give an estimation regarding any point in the sample space. The weight coefficient can be obtained via optimization, which is indicated in the following:
find   θ min V a r [ y ^ ( X ) y ( X ) ] s . t . F T θ f = 0 .
As for the reliability analysis based on the Kriging model, its procedure is elaborated in Figure 1. It mainly encompasses five steps: (1) step 1: generate the initial test points via Latin hypercube sampling and calculate the corresponding responses, where at least ( n + 1 ) ( n + 2 ) / 2 test points are selected based on the sampling center for the first fitting [37]; (2) step 2: select the sample points as the training samples and establish the training set; (3) step 3: calculate the surrogate model on the basis of the pre-specified training set; (4) step 4: evaluate the reliability index based on the obtained surrogate model; and (5) step 5: examine whether the condition of convergence has been satisfied. The procedure is suspended and outputs the reliability index if so; otherwise, the cycle continues. Notably, the second iteration is carried out to generate test points again and subsequently fit the model.

2.2. Parameters Optimization

The traditional Kriging model parameters can be estimated via the pattern search method, without the derivative of the objective function, which is more effective in solving optimization problems with non-differentiable functions or abnormal derivative functions. However, one disadvantage is that pattern search is prone to finding a local optimal solution, affecting the fitting accuracy, and the solution accuracy based on the Kriging model will be lower than that of the traditional quadratic response surface. To this end, particle swarm optimization (PSO) is employed to optimize the solution owing to its superior capacities, which can accomplish global optimization, treating each particle as a point in solution space. Specifically, in the initially constructed population N denotes the size of the particle swarm, x i represents the position of the i-th particle, b e s t i denotes the experienced ‘best’ position, V i represents its velocity, and g b e s t i denotes the position of the ‘best’ particle in the swarm. The particle finally obtains the optimal solution by constantly adjusting its position and velocity. As a result, the particle swarm optimization algorithm (PSO) can be applied to address the parameter issues of the Kriging model, showing a more efficient capacity compared with traditional pattern search channels. The steps of particle swarm optimization are elaborated as follows:
Step 1: Random initialization of particle swarm;
Step 2: Calculate the adaptation value of each particle;
Step 3: Update b e s t i , g b e s t i , particle velocity V i and position x i referring to the adaptation value;
V i + 1 = ω V i + c 1 r 1 ( b e s t i x i ) + c 2 r 2 ( g b e s t i x i ) ,
x i + 1 = x i + V i .
Step 4: Determine whether the iteration of the suspension condition is satisfied and output the result if so; otherwise, return to step 2.

2.3. Sample Inheritance

As aforementioned, quantities of iterations are necessary to promote the closeness of the surrogate model to the real limit state surface when investigating the reliability analysis based on the Kriging model. The mean value of random variables and test points are selected as the checking point and the test point, respectively, when first fitting. The reliability index and checking points can be obtained via model fitting, utilizing test points. Furthermore, the next iteration will be started, selecting the checking point as the new sampling center, and then determining whether the variation coefficient of the reliability index obtained from two iterations can satisfy the exit condition. Apparently, all generated test points have been abandoned, and the existing valid sample information is discarded as well, resulting in low efficiency when calculating the reliability index.
Taking the above-mentioned gaps into account, we devise a sample inheritance thinking innovatively, implying that part of the test points with high value for fitting will be selected to retain the iteration process following a certain rule, rather than discarding all the generated information. It can promote the model convergence efficiency to a great extent via avoiding the loss of effective information as well as the repeated utilization of redundant information. Significantly, the selecting criterion of test points in the proposed approach is supported by the learning function, which is based on the characteristics of the Kriging model, indicating both the estimation and its error of the predicted response. The calculation of the reliability index is prone to be affected by the model’s judgment on the point when the response is close to 0, and the possibility of the response symbol error increases with the increase in error. Therefore, the learning function is the absolute value of the ratio of the response estimate to its error, which can be expressed as follows:
U ( S * ) = μ ( S * ) σ ( S * ) ,
where S * denotes the test point set. Followed by the proposed approach, the test points oriented to constructing surrogate models become more and more valuable, improving the fitting accuracy and convergence speed noticeably.

2.4. Learning Function Construction

Followed by sample inheritance, the traditional method regenerates ( n + 1 ) ( n + 2 ) / 2 test points at each iteration. Although the introduction of sample inheritance method can gradually improve the effectiveness of the sample pool utilized for model fitting, which increases the sample pool size and the computation burden as well. Furthermore, the newly generated test points of each iteration, obtained via the Monte Carlo simulation, will be selected based on inheritance ideas. However, the information will be too redundant, owing to the concentrated selection points if the selection is carried out directly. Furthermore, the uneven allocation between the sampling center and the edge of the sample space is prone to arise if the sample space is divided by the standard deviation of random variables. Therefore, the clustering method [40] is introduced in this paper. Cluster the newly generated test points and divide them into several clusters. Then, calculate the learning function values based on the model obtained in the last iteration; subsequently, several test points with high learning value are selected into the sample pool. The clustering approach is elaborated as follows, shown in Figure 2.
Step 1: Select K as the initial centroids;
Step 2: Assign sampling point, ( s 1 * , s 2 * , , s i * ) , to the centroid to form clusters, based on the Euclidean distance between the sampling point and the centroid;
Step 3: Calculate the mean position of the sampling points in each cluster; the calculation converges if the distance between the new centroid and the original centroid, represented by A r g min j = 1 K x N j X u j 2 , is less than the threshold.

3. Calculation of Mixing Weight Importance Sampling Model

As for the complicated mechanical assets, multiple failure modes are possible owing to the dynamic environment and load, coupled with the comprehensive mechanisms, which results in the multi-performance reliability analysis as well. Consequently, we investigate the mixing weight importance sampling aimed at addressing the mentioned practical issues. In detail, after constructing the surrogate model, the subsequent procedure utilizes the importance sampling approach to calculate the failure probability upon every failure mode. Crucially, weight coefficients are introduced to characterize the impact of each failure probability on system reliability, considering the different contributions of each failure mode to the system.
Assuming one engineering system encompasses m failure modes, and the corresponding limit state function is represented as g ( k ) ( X ) = 0 ( k = 1 , 2 , , m ) , the relationship between the system failure and one single failure mode can be established as p f = Pr i = 1 m g ( k ) ( X ) 0 if m failure modes are in a series association.
With regard to the low failure probability issues, enormous samples are required to ensure convergence in the practical calculation, which expenses large cost and time. The proposed importance sampling approach can intervene in the mentioned topic, whose core is replacing the original sampling density function with an importance sampling density function, increasing the probability of sample points falling into the failure domain, thereby improving sampling efficiency and accelerating model convergence.
Additionally, a mixing importance sampling density function is constructed to address multi-performance reliability issues, where each failure mode possesses a different design point and failure area. As for the formulation of the function, firstly, determine the corresponding importance sampling density function for the single failure mode, then, consider the contributions of each mode to the final failure and construct the importance sampling density function via the proposed weight allocation method. The sampling density functions can be modelled in the following:
h X ( X ) = α 1 h X ( 1 ) ( X ) + α 2 h X ( 2 ) ( X ) + + α m h X ( m ) ( X ) ,
where h X ( i ) ( X ) is the importance sampling density function of the i-th pattern. α i is the weight of h X ( i ) ( X ) in the mixing importance sampling density function, which can be approximated as
α i = p f ( i ) i = 1 m p f ( i ) ,
where p f ( i ) denotes the failure probability of the i-th failure mode.

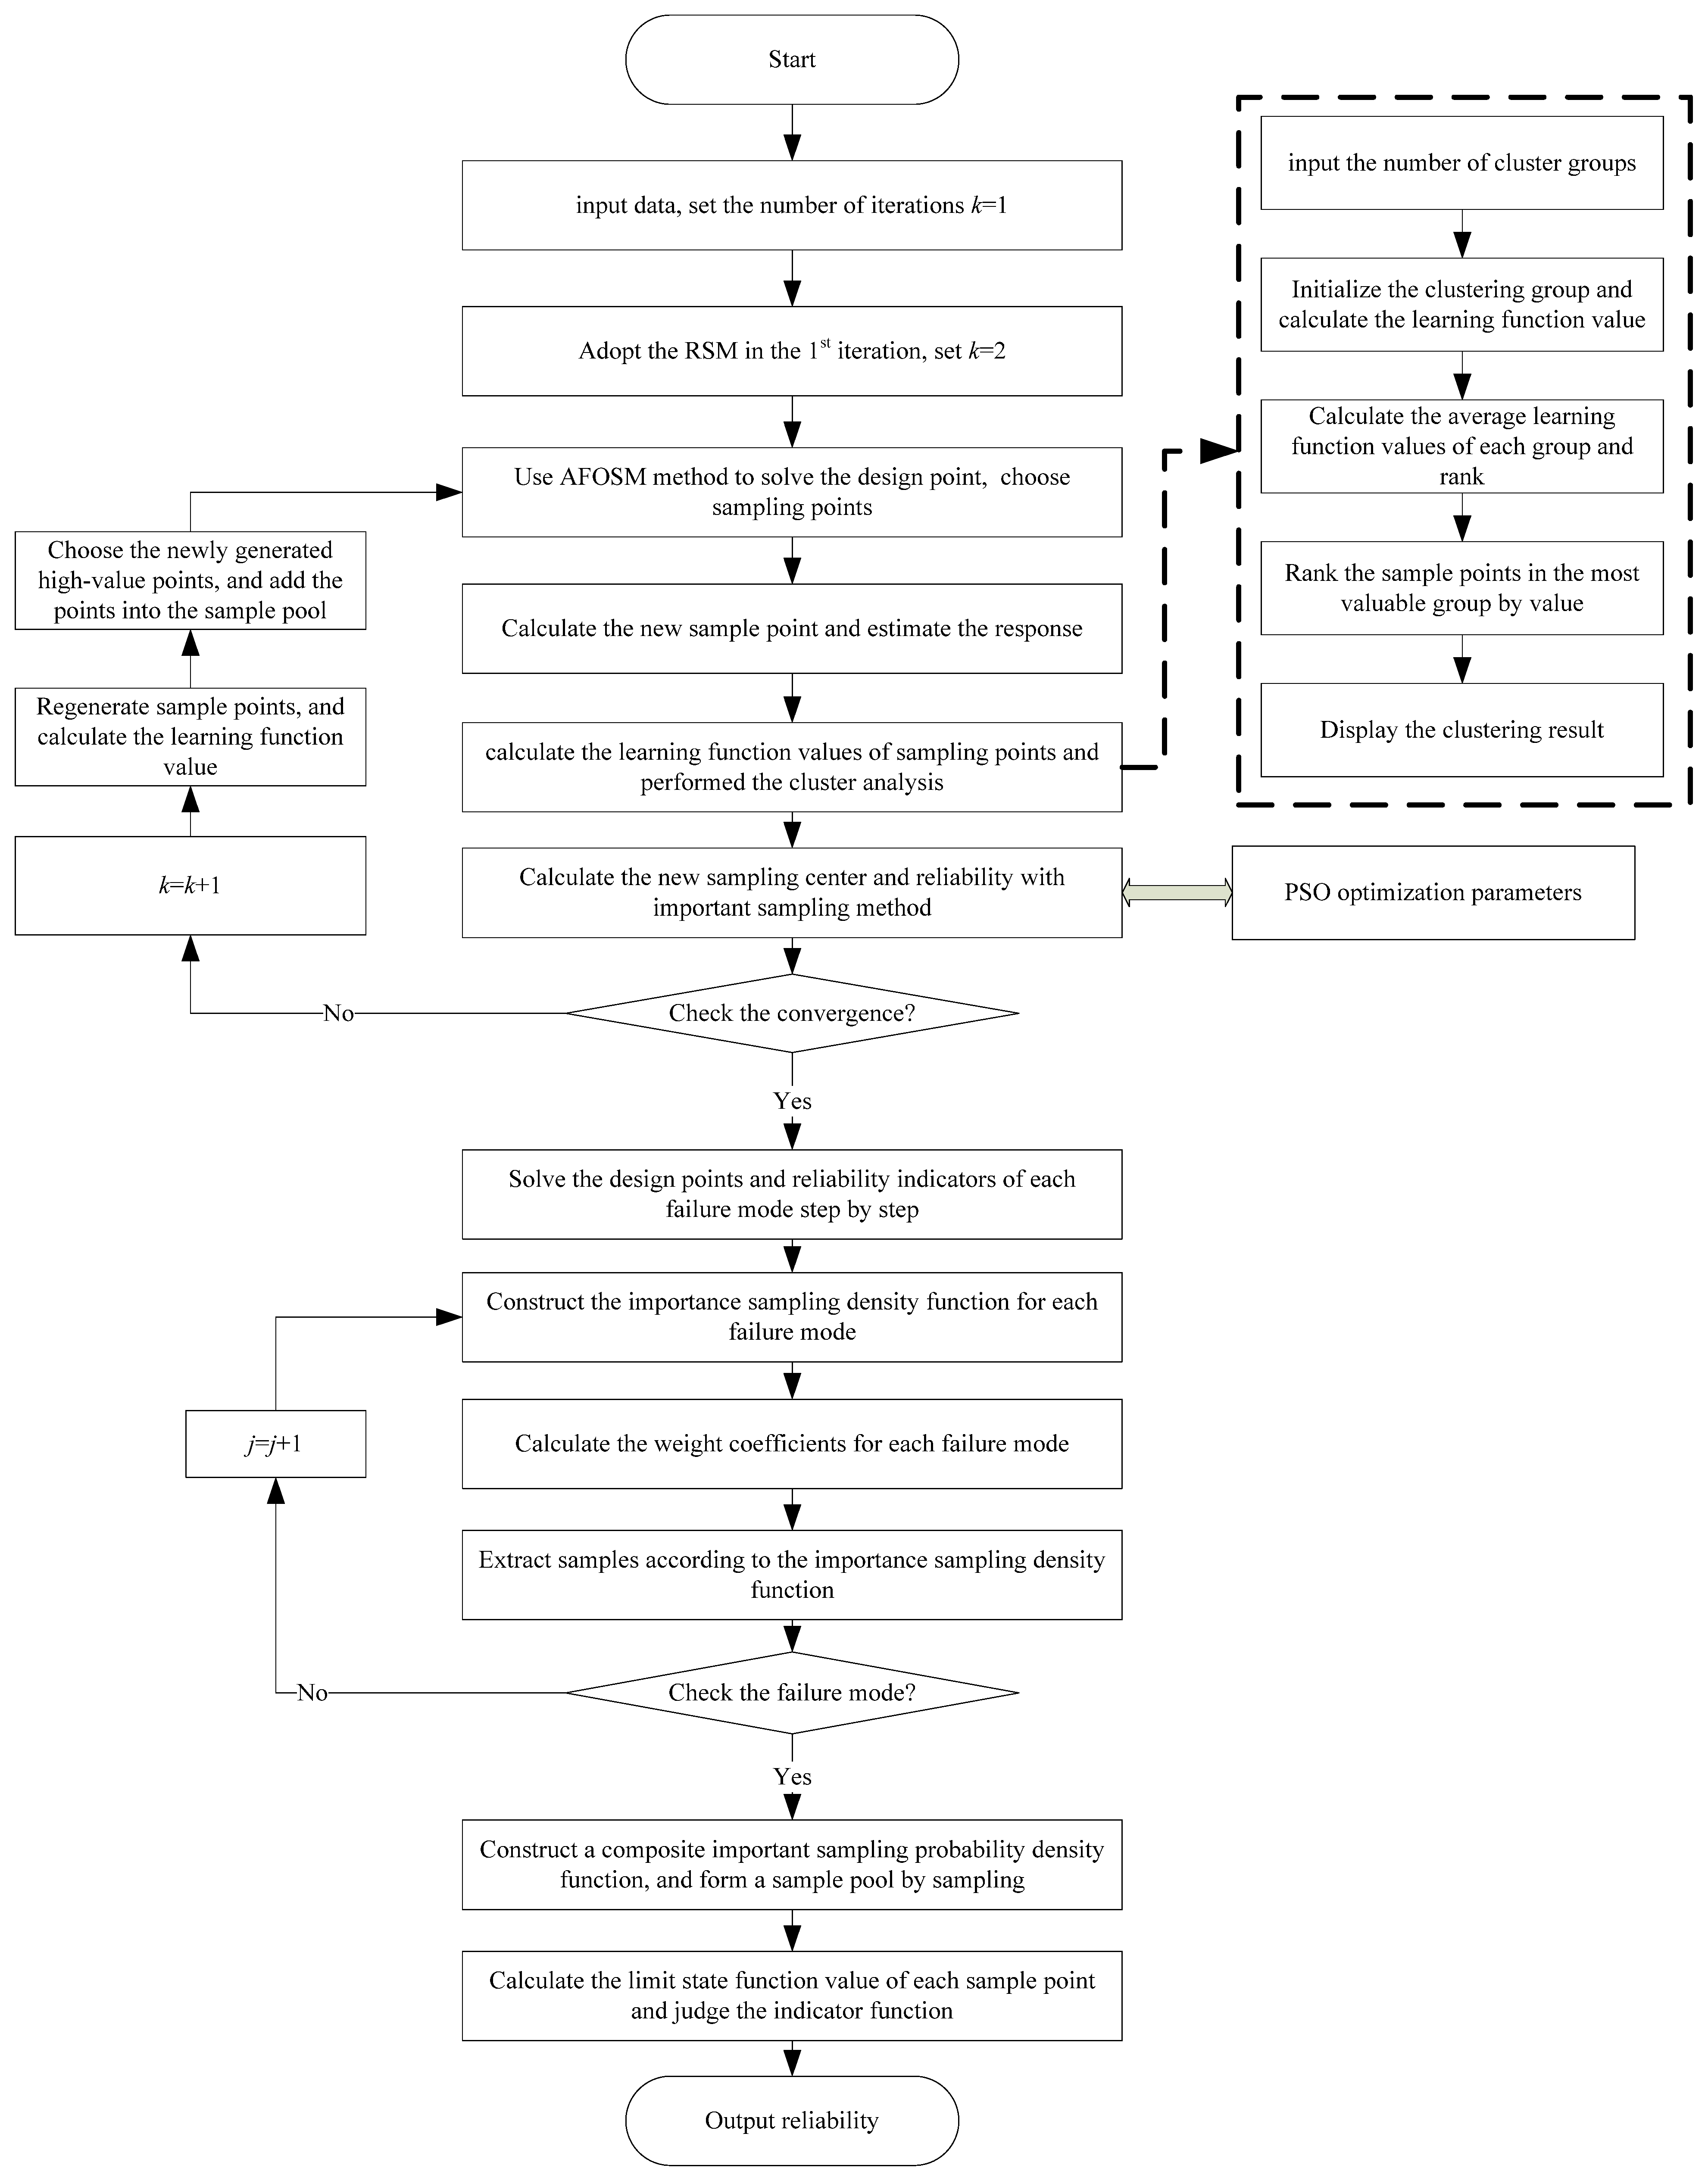
4. Algorithm Designing for Multi-Performance Reliability Analysis

The multi-performance reliability analysis is the main investigated issue, and an appropriate approach produces significant guidance for the identification and promotion of the reliability level. As a result, we designed a complicated algorithm to calculate innovatively, which is elaborated in the following, shown in Figure 3:
Step 1: Take the mean value of random variables as the center, select test points via Latin hypercube sampling, and calculate the corresponding response;
Step 2: Generate the sampling points via the Monte Carlo approach for clustering;
Step 3: Calculate the surrogate model referring to the existing test sites, and optimizing the correlated parameters by the particle swarm algorithm;
Step 4: Calculate the most likely failure point as well as reliability within the surrogate model, supported by the importance sampling method;
Step 5: Determine whether the calculation converges; if not, regenerate sampling points, cluster, and calculate the learning function value based on the most probable point; then, inherit the existing high-quality points, and the newly generated high-quality points will be put into the test set; otherwise, output the result;
Step 6: Check whether the convergence condition, p f ( k ) p f ( k 1 ) p f ( k ) < ε , has been satisfied; if not, let k = k + 1 and continue to cycle from step 2 to 4 until the suspension requirements are met;
Step 7: For different limit state functions, compute each design point x k * as well as failure probability p f ( k ) , and construct an important sampling density function h X ( k ) ( X ) , with each design point as the sampling center;
Step 8: Determine the weight coefficient and construct the formula of h X ( X ) subsequently;
h X ( X ) = k = 1 m α k h X ( k ) ( X ) = k = 1 m p f ( k ) j = 1 m p f ( j ) h X ( k ) ( X )
Step 9: Extract input variable samples, { x 1 ( k ) , x 2 ( k ) , , x N k ( k ) } ( k = 1 , 2 , , m ) , based on h X ( X ) ;
Step 10: Calculate the failure probability by statistically analyzing the input variable sample model.
P f = R n f X ( X ) h X ( X ) h X ( X ) d x = R n I F ( X ) f X ( X ) h X ( X ) k = 1 m α k h X ( k ) ( X ) d x .

5. Case Studies

The studies of one numerical experiment and two practical engineering experiments have been conducted to verify the applicability and superiority of the proposed multi-performance reliability evaluation approach with cluster mixing weight via comparing with several traditional channels, such as Monte Carlo, importance sampling, etc.

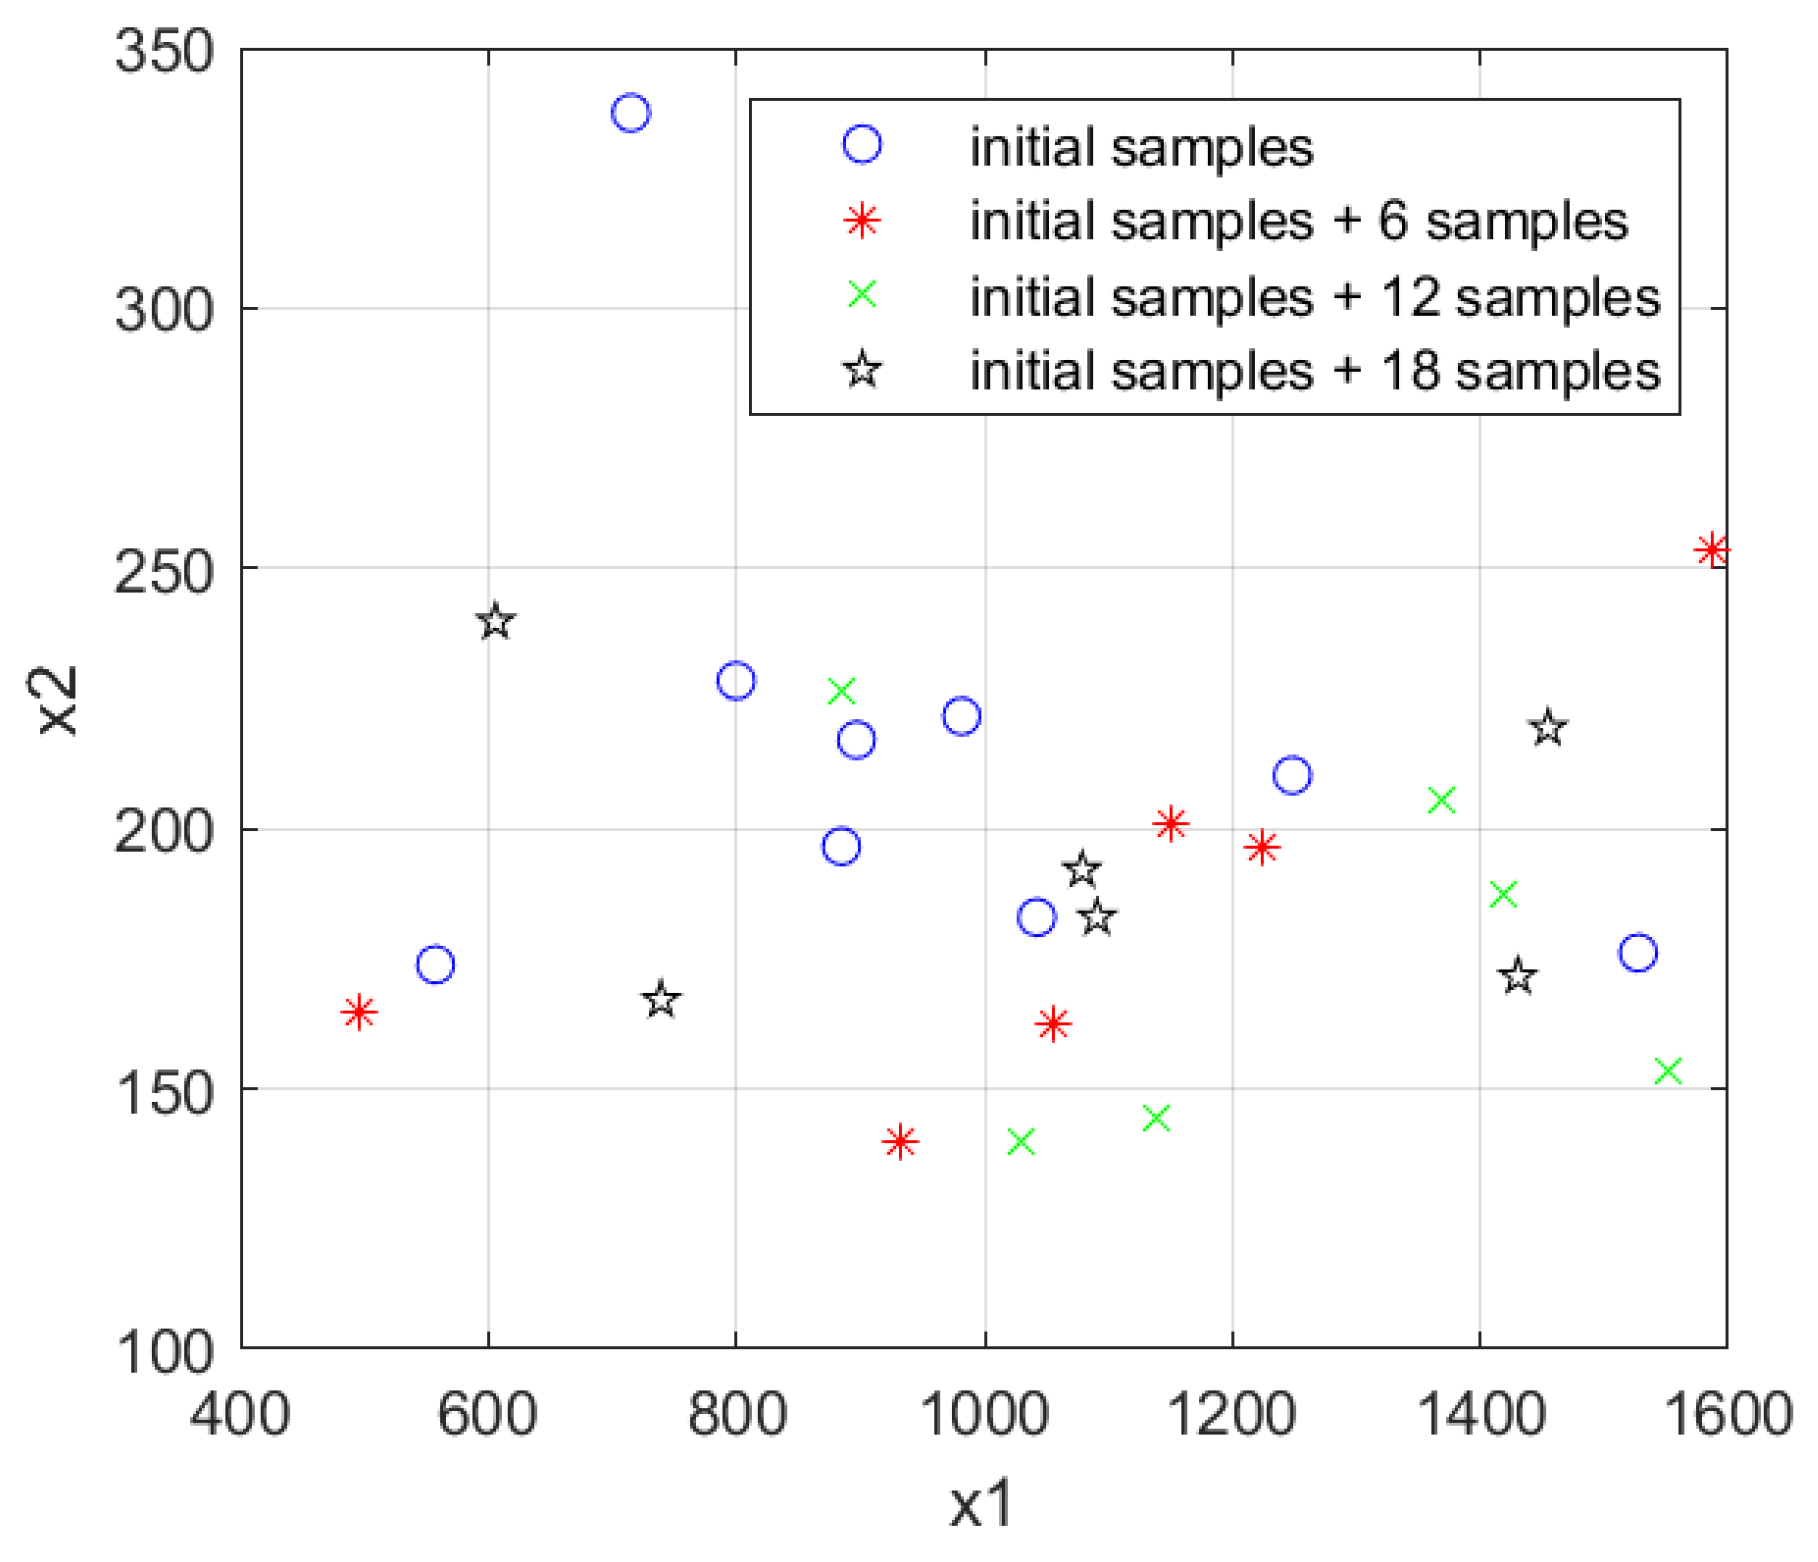
5.1. Numerical Experiment A: A Highly Nonlinear System

Assuming a nonlinear industrial system consisting of two failure modes, the two corresponding limit state functions can be expressed as g ( X ) = 0.018 74.769 x 1 x 2 3 , where X = ( x 1 , x 2 ) is the basic random variable, satisfying x 1 ~ N ( 2000 , 200 ) and x 2 ~ N ( 250 , 37.5 ) . Furthermore, to verify the applicability and superiority of the proposed approach in the calculation of failure probability, three comparative methods are employed, encompassing the Monte Carlo method, response surface method and Kriging method. Notably, the pre-set convergence criterion is that the relative error of the failure probability between two calculations is less than 0.001. The calculation results of four diverse approaches are shown in Table 1. It can be found that the proposed method implies an apparent superiority with least iteration cycles and highest computation accuracy.

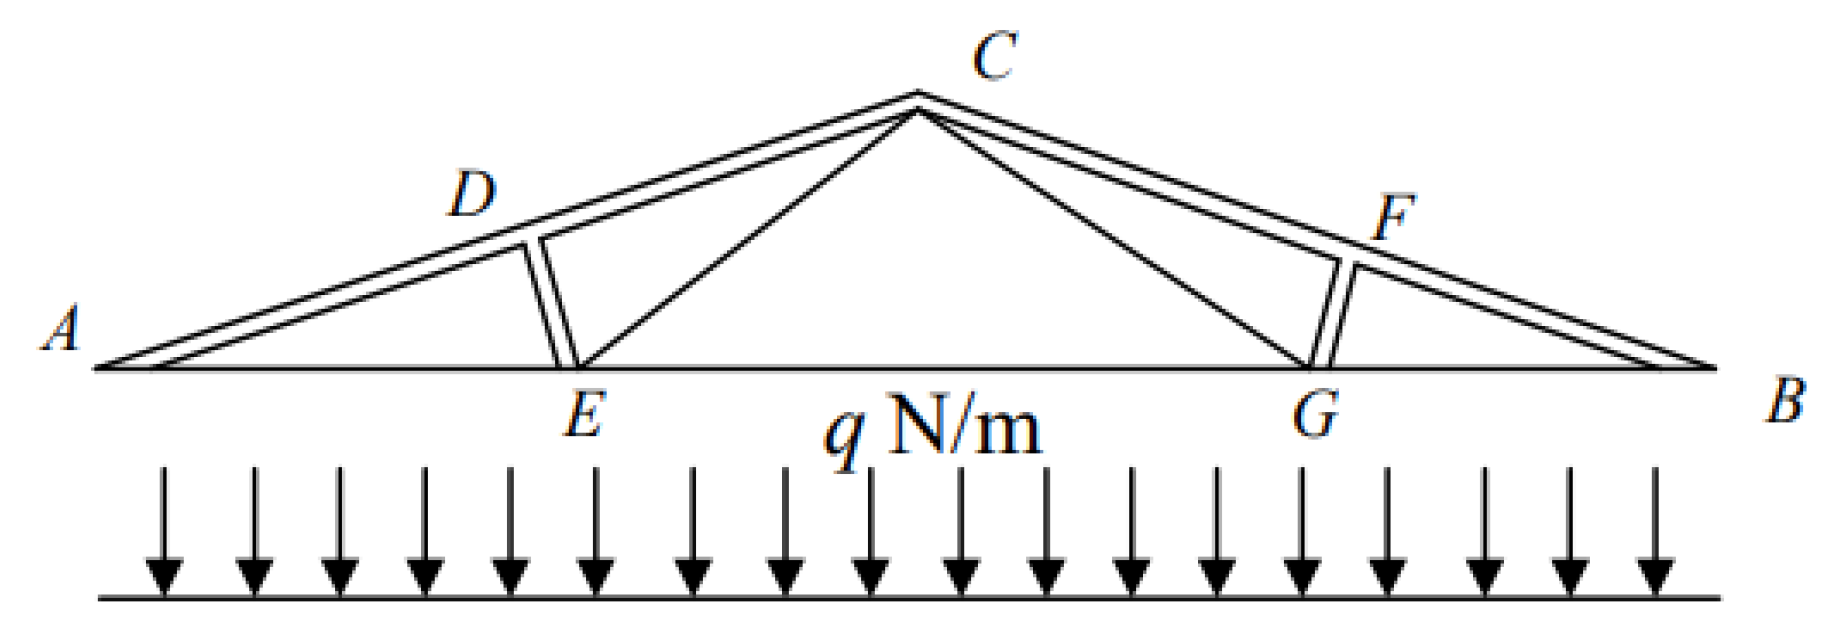
5.2. Engineering Experiment A: A Series Industrial System

We consider a roof truss structure in this experiment, shown in Figure 4, whose tie as well as bottom end rods are steel rods, and its press as well as top rods are concrete members. Taking the safety and availability of the roof truss into account, the vertical deflection of the node cannot exceed the threshold; hence, the limit state function of the roof truss structure can be expressed as two failure modes, and the two limit state functions are established as g 1 ( X ) = 4.0 x 3 + 4.0 x 1 3.9998 x 2 x 4 , g 2 ( X ) = 0.2299 x 3 + 3.2425 x 2 x 4 , whose parameters refer to the literature [41]. Furthermore, the functional function of the system is g ( X ) = min { g 1 , g 2 } , where X = ( x 1 , x 2 , x 3 , x 4 ) denotes the basic random variable, x 1 ~ N ( 83.5 , 10.02 ) , x 2 ~ N ( 83.5 , 10.02 ) , x 3 ~ N ( 83.5 , 10.02 ) and x 4 ~ N ( 150 , 37.5 ) . Analogous to the numerical experiment A, two comparative methods, the Monte Carlo and importance sampling methods, are employed to compare with the proposed approach when calculating the failure probability. The calculation results and the process of sample point addition during the iteration are shown in Table 2 and Figure 5, respectively.

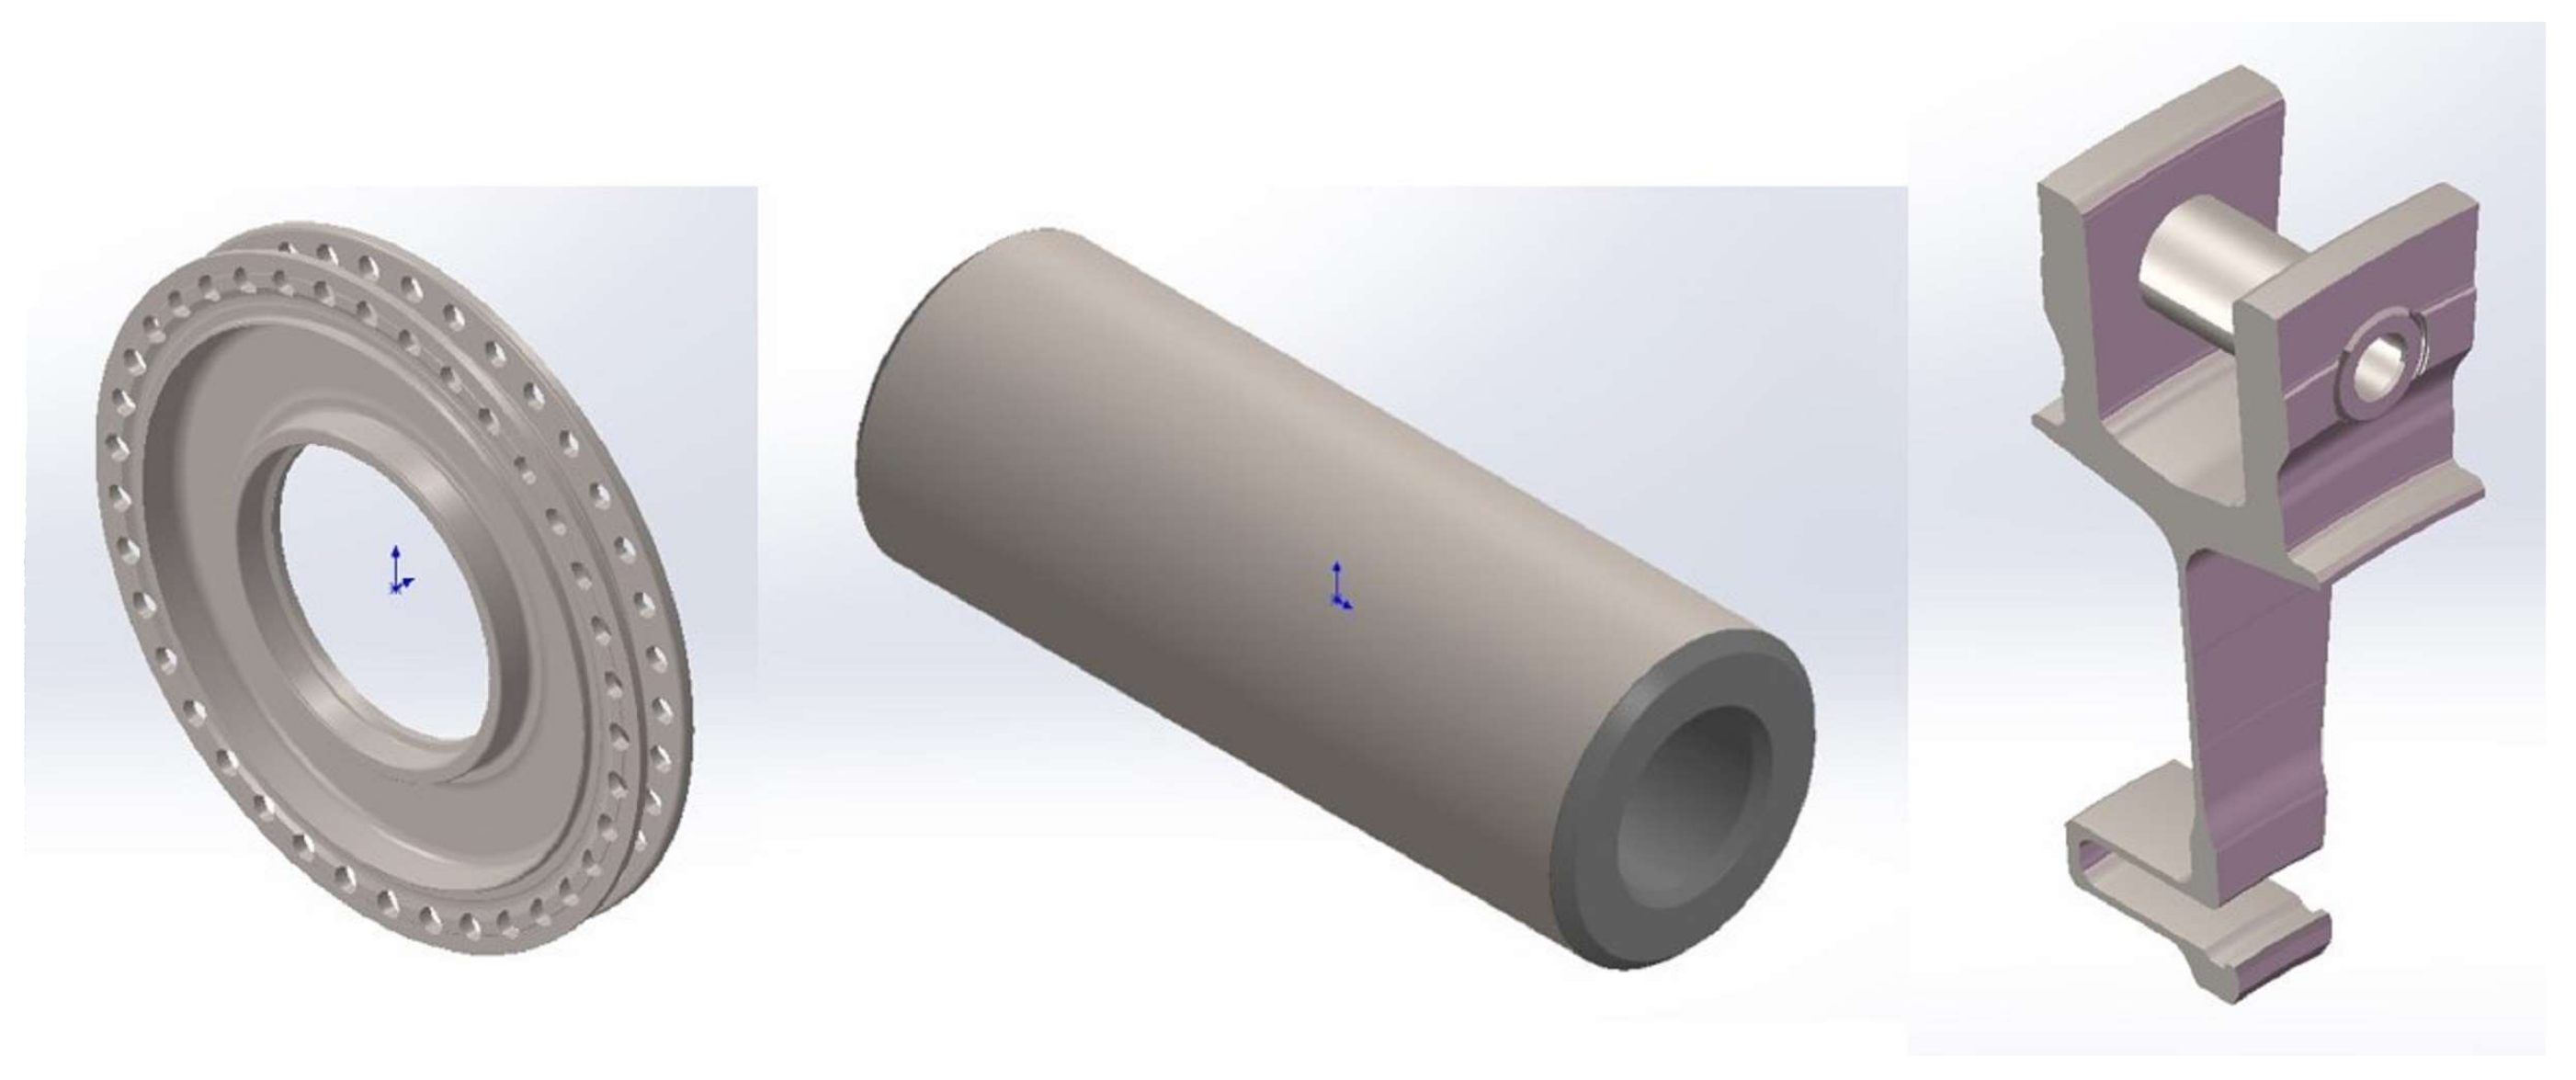
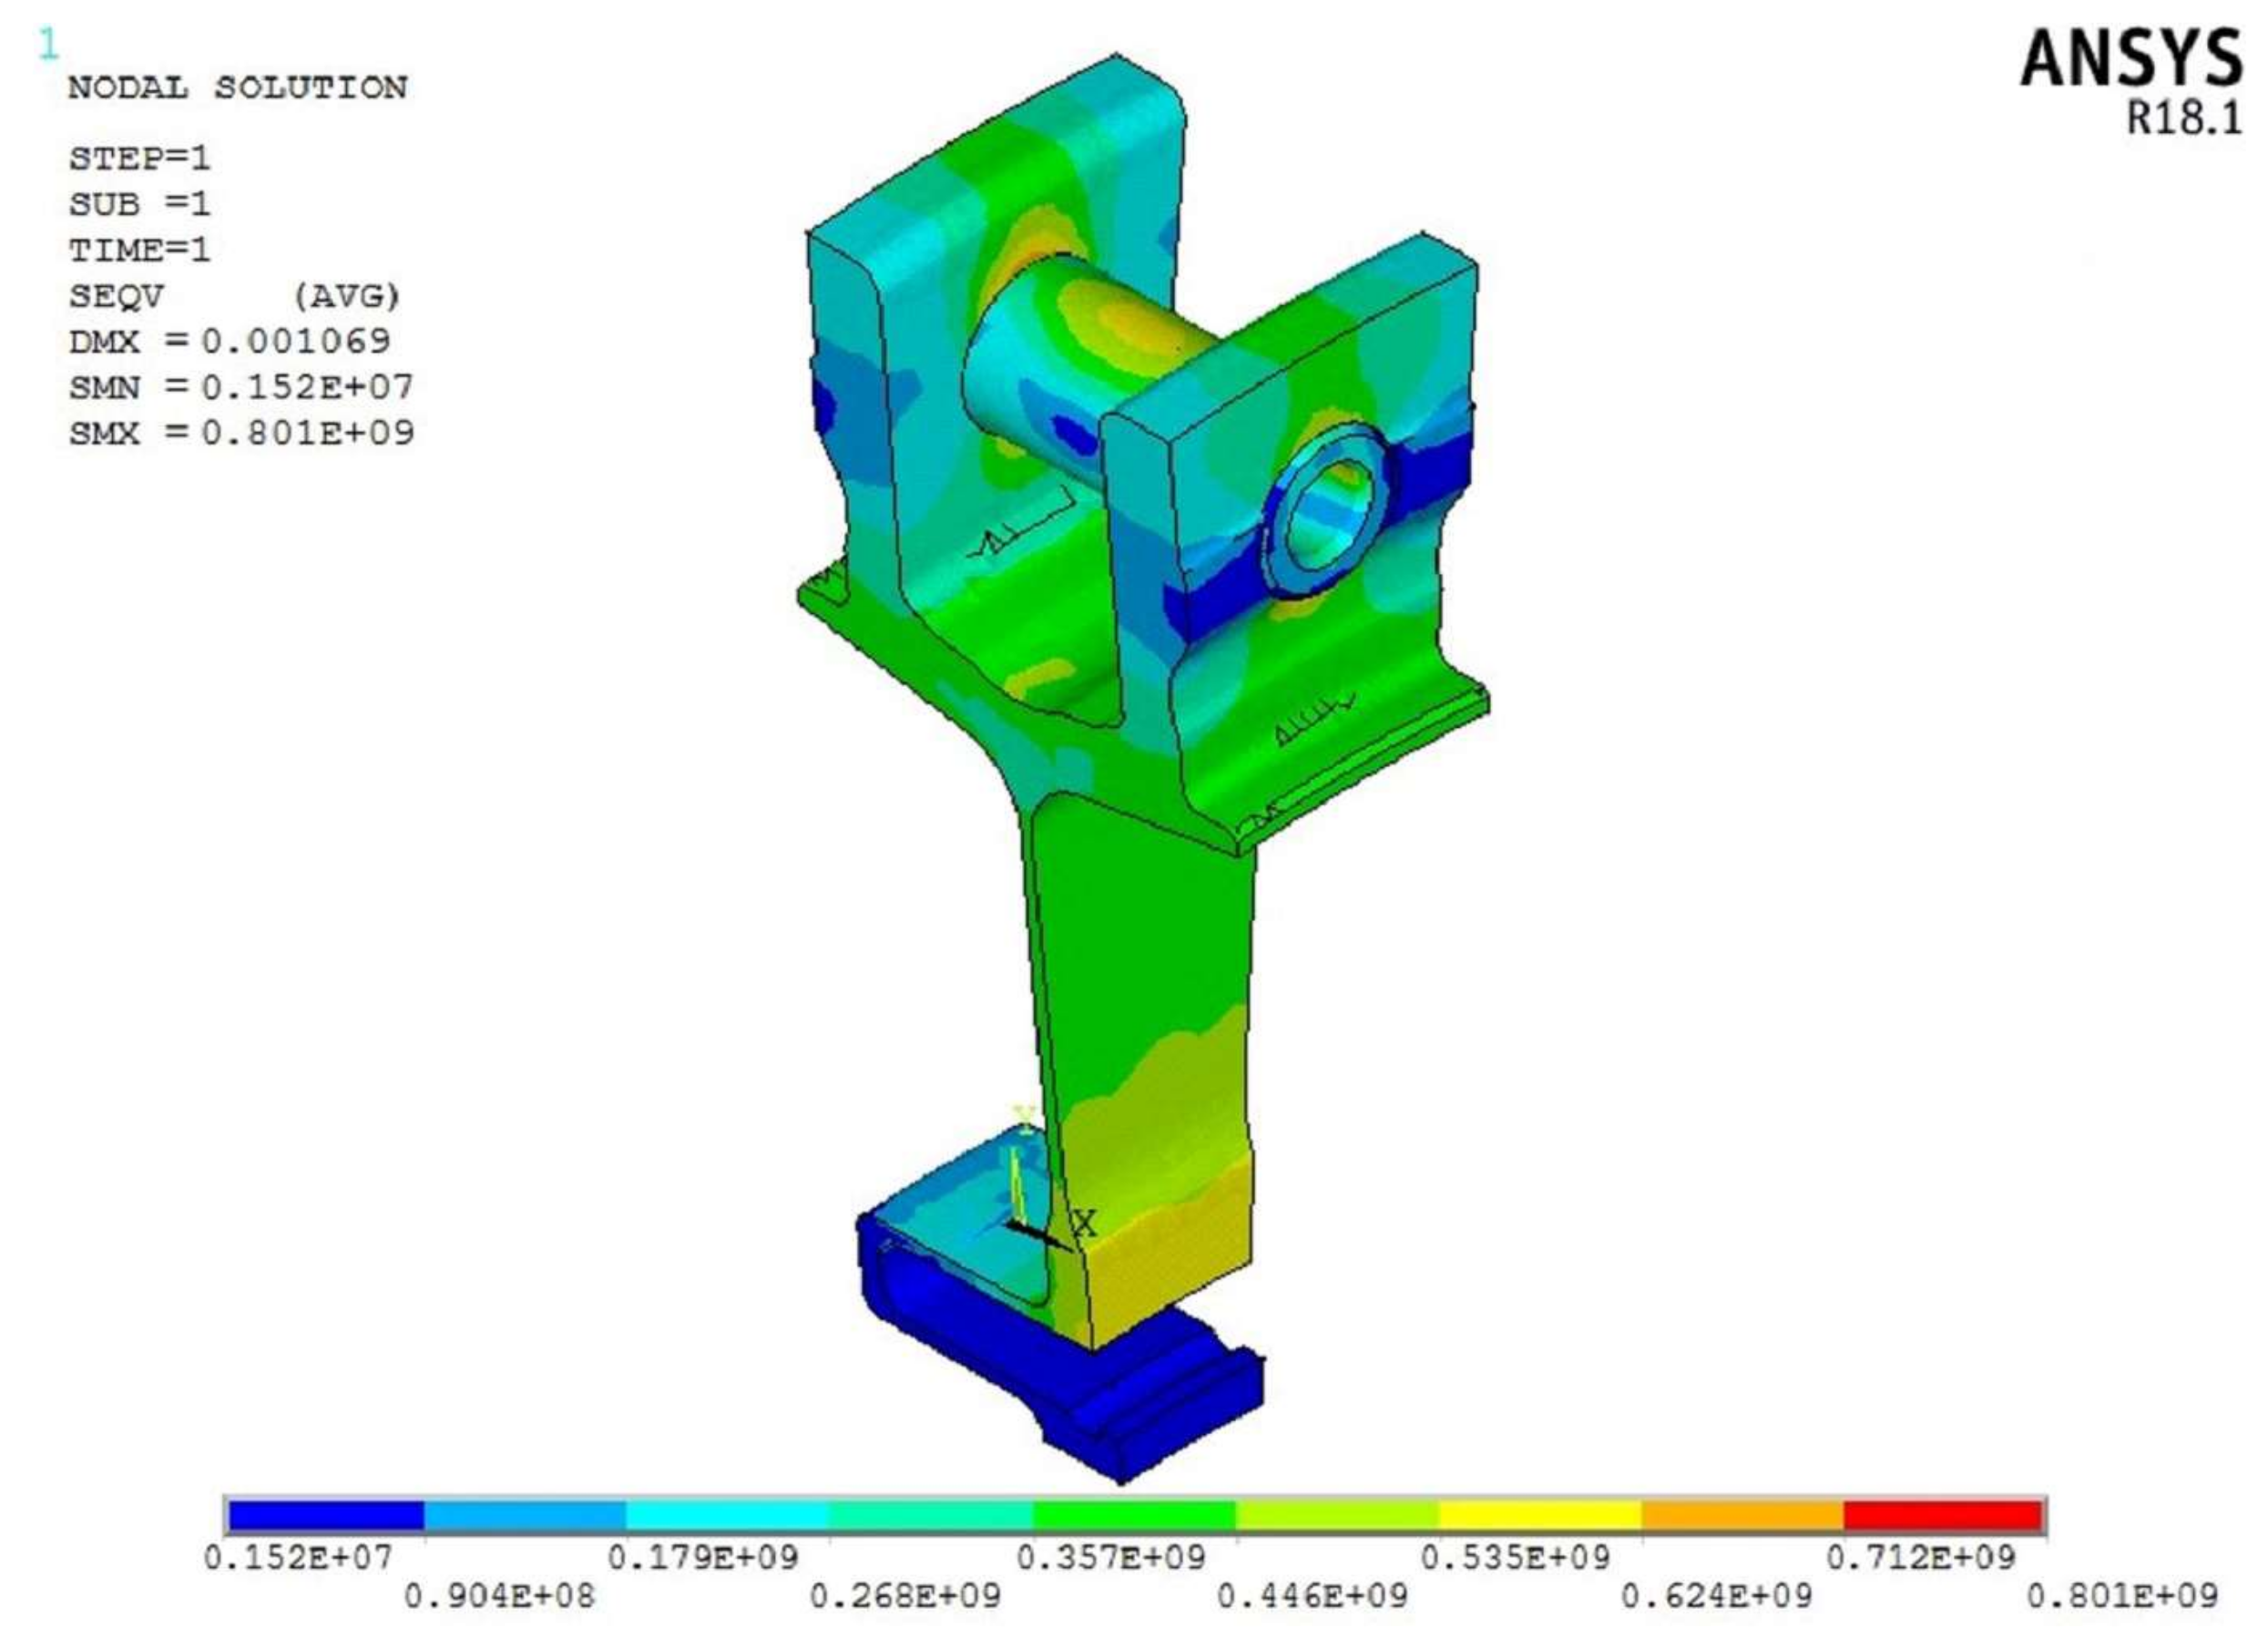
5.3. Engineering Experiment B: A Turbine Disc

The turbine disc, serving as a core component in modern aircraft engines, tends to operate under complicated environments, high temperature, high pressure, heavy loads and other terms. As for its working mechanism, the heat energy will be converted into mechanical energy when the high temperature gas flows from the combustion chamber to the engine of the turbine disc, driving the engine. As a key component of an engine, the reliability level of turbine disc affects the engine performance to a great extent. The 1/37 third-stage roulette of a low-pressure compressor is selected as the investigation object, and the reliability of the life-limiting part is analyzed in reference to the fatigue failure mechanism. The reliability of a turbine disc depends primarily on the distribution of stress and strain at a dangerous point since the shape and load are completely symmetric. The mean values of each variable are chosen as parameters, and the simulation is implemented with ANSYS 18.1.
The 3D model and the cloud map under equivalent stress distribution of the low-pressure compressor roulette at 1000 rad/s speed are shown in Figure 6 and Figure 7, respectively. It can be found that stress concentration occurs at the pin hole of the low-pressure compressor roulette, and the maximum equivalent stress equals to 801 MPa. Consequently, the dangerous section of the object is the contact between the roulette and semi-hollow pin, namely the lower outside of the pin hole.
The random factors affecting the failure probability of a low-pressure compressor roulette can be mainly divided into three categories, indicated in the following:
  • Material properties, such as the elastic modulus, density and Poisson’s ratio of the materials utilized in roulette and pins, can reflect the material uncertainties;
  • Roulette speed can reflect the uncertainty of centrifugal force;
  • Uncertainties exist in the assembly force at the connection between the pin and blade.
As mentioned above, eight variables are considered as random variables in this case, which represent the relevant parameters of materials and loads, respectively, and all of them obey normal distribution according to engineering experience and statistical data. In addition, eight random variables are assumed as independent normal distribution for the convenience; the mean and standard deviation are shown in Table 3.
The structure fails when the maximum stress at the dangerous point exceeds the allowable value in Table 3, 703.84 MPa; the corresponding limit state function can be expressed as follows:
N l i f e = K ( σ max 703.84 ) m = K ( f ( E 1 , ε 1 , ρ 1 , E 2 , ε 2 , ρ 2 , ω , F ) 703.84 ) m ,
where N l i f e denotes the fatigue life, and its unit is a cycle. K and m represent disc material parameters, K = 6.2784 × 10 15 and m = 4.736 . S max represents the stress field strength, which is a comprehensive function of roulette elastic modulus, roulette Poisson ratio, roulette density, semi-hollow pin elastic modulus, semi-hollow pin Poisson ratio, semi-hollow pin density, speed and assembly force.
The failure probability of the third-stage roulette of a low-pressure compressor can be calculated referring to the limit state equation, the characteristic parameters of random variables and the finite element model established above, utilizing the proposed method. The Kriging model is firstly fitted, and the convergence condition is satisfied after four iterations. The total sample number is 68 and the accuracy requirement is 10−3. The first iteration puts 17 sample points into the sample pool; 17 sample points are added to the sample pool in the second iteration; 16 sample points are added in the third iteration; and in the final iteration, 16 sample points are added. Finally, the values of some sample points are shown in Table 4.
The comparison outcome of several approaches for reliability analysis is indicated in Table 5, which shows that the classical response surface–importance sampling and the proposed method reach the convergence condition after 256 and 68 structural analyses, respectively. Furthermore, the number of iterations increases greatly with the increase in input parameters, but the proposed approach still maintains high efficiency, which demonstrates superior computation performance and robustness. In addition, the error corresponding to the response surface–importance sampling method is 3.9702%, while the calculation error via the proposed method is 2.6055%. Consequently, the proposed approach possesses higher computational accuracy and efficiency compared with the response surface–importance sampling method, which further demonstrates the superiority of dealing with implicit engineering issues.

6. Conclusions

This paper proposes a multi-performance reliability analysis framework, based on the Kriging surrogate model with cluster mixing weight, for a complicated mechanical system. Specifically, a Kriging surrogate model with limit state function corresponding to each failure mode is constructed based on the design of experimental test design and numerical analysis; then, the failure probability of the structural system under each single failure mode as well as multiple failure modes are investigated with an importance sampling channel. The conclusions via analysis and calculation are summarized as follows:
  • The local optimal issue has been avoided via employing the particle swarm optimization algorithm in the surrogate mode construction within the proposed approach; furthermore, the proposed sample inheritance and active learning strategies promote convergence efficiency to a great extent;
  • The proposed Kriging surrogate model combined with the importance sampling approach has overcome the nonlinear and implicit challenges when handling diverse limit state functions, which reduces the complexity of structural simulation calculation noticeably;
  • The proposed mixing weight with the importance sampling channel, considering the contribution of each single failure mode to the overall failure probability, is applied to the reliability analysis of several cases, which indicates a higher accuracy and computation efficiency, especially when the structural functions are nonlinear.

Author Contributions

Conceptualization, X.F. and J.Z.; methodology, X.F. and Z.N.; software, J.W.; validation, Z.N.; formal analysis, J.W.; investigation, X.F.; resources, X.F. and J.Z.; writing—original draft preparation, X.F. and Z.N.; writing—review and editing, X.F. and J.Z.; supervision, J.Z. All authors have read and agreed to the published version of the manuscript.

Funding

This research received no external funding.

Institutional Review Board Statement

Not applicable.

Informed Consent Statement

Not applicable.

Data Availability Statement

Data is contained within the article.

Acknowledgments

We appreciate for the platform of School of Reliability and Systems Engineering, and Beihang university.

Conflicts of Interest

The authors declare no conflicts of interest.

Abbreviations

Acronyms and notations
RSMResponse Surface Method
PCEPolynomial Chaos Expansion
RBFRadial Basis Function
SVMSupport Vector Machine
ANNArtificial Neural Network
X = ( x 1 , x 2 , , x n ) Design variable
Y ( X ) the performance response of the system
U ( S * ) the   earning   function   value   of   S *
h X ( i ) ( X ) importance sampling density function
α i the   weight   of   h X ( i ) ( X )
p f ( i ) the failure probability of the i-th failure mode

References

  1. Hu, X.Y.; Wang, R.P.; Wang, X.; Fu, Y.T. Recent development of safety and reliability analysis technology for model-based complex system. Acta Aeronaut. Astronaut. Sin. 2020, 41, 523436. [Google Scholar] [CrossRef]
  2. Afshari, S.S.; Enayatollahi, F.; Xu, X.; Liang, X. Machine learning-based methods in structural reliability analysis: A review. Reliab. Eng. Syst. Safety 2022, 219, 108223. [Google Scholar] [CrossRef]
  3. Wang, J.; Ma, X.; Yang, L.; Qiu, Q.; Shang, L.; Wang, J. A hybrid inspection-replacement policy for multi-stage degradation considering imperfect inspection with variable probabilities. Reliab. Eng. Syst. Saf. 2024, 241, 109629. [Google Scholar] [CrossRef]
  4. Wang, J.; Zhou, S.; Peng, R.; Qiu, Q.; Yang, L. An inspection-based replacement planning in consideration of state-driven imperfect inspections. Reliab. Eng. Syst. Saf. 2023, 232, 109064. [Google Scholar] [CrossRef]
  5. Han, T.; Liu, C.; Yang, W.; Jiang, D. Deep transfer network with joint distribution adaptation: A new intelligent fault diagnosis framework for industry application. ISA Trans. 2020, 97, 269–281. [Google Scholar] [CrossRef] [PubMed]
  6. Zhang, Z.; Huang, X.; Zhang, T. Review Of The Application Of Deep Learning In Health Management. In Proceedings of the 2021 Global Reliability and Prognostics and Health Management (PHM-Nanjing), Nanjing, China, 15–17 October 2021; pp. 1–7. [Google Scholar] [CrossRef]
  7. Lu, S.; He, Q.; Wang, J. A review of stochastic resonance in rotating machine fault detection. Mech. Syst. Signal Process. 2019, 116, 230–260. [Google Scholar] [CrossRef]
  8. Yi, P.; Yang, W.; Xie, D. Reliability analysis of engineering structure based on surrogate model. J. Dalian Univ. Technol. 2018, 58, 269–276. [Google Scholar] [CrossRef]
  9. Breig, S.J.M.; Luti, K.J.K. Response surface methodology: A review on its applications and challenges in microbial cultures. Mater. Today Proc. 2021, 42, 2277–2284. [Google Scholar] [CrossRef]
  10. Li, P.; Li, H.; Huang, Y.; Yang, S.; Yang, H.; Liu, Y. A high sparse response surface method based on combined bases for complex products optimization. Adv. Eng. Softw. 2019, 129, 1–12. [Google Scholar] [CrossRef]
  11. Lu, N.; Li, Y.F.; Huang, H.Z.; Mi, J.; Niazi, S.G. AGP-MCS+D: An active learning reliability analysis method combining dependent Gaussian process and Monte Carlo simulation. Reliab. Eng. Syst. Saf. 2023, 240, 109541. [Google Scholar] [CrossRef]
  12. Faraji, J.; Aslani, M.; Hashemi-Dezaki, H.; Ketabi, A.; De Grève, Z.; Vallée, F. Reliability Analysis of Cyber–Physical Energy Hubs: A Monte Carlo Approach. IEEE Trans. Smart Grid 2024, 15, 848–862. [Google Scholar] [CrossRef]
  13. Wu, J.; Zhang, J.; You, L.; Ye, N. Structural reliability calculation method based on improved weighted response surface. J. Beijing Univ. Aeronaut. Astronaut. 2021, 47, 1638–1645. [Google Scholar] [CrossRef]
  14. You, L.; Zhang, J.; Zhou, S.; Du, X. A new method for fatigue reliability calculation of aero-engine limited life parts. Acta Aeronaut. Astronaut. Sin. 2019, 40, 223228. [Google Scholar] [CrossRef]
  15. Gong, Y.; Zhang, J.; Wu, Z.; Chu, G.; Fan, X.; Huang, Y. Reliability algorithm of composite structure based on active learning basisadaptive PC-Kriging model. Acta Aeronaut. Astronaut. Sin. 2024, 45, 428982. (In Chinese) [Google Scholar]
  16. Yang, N.; Yao, X.; Das, P.K. Application of response surface method for reliability analysis of stiffened laminated plates. Ships Offshore Struct. 2015, 10, 653–659. [Google Scholar] [CrossRef]
  17. Zhao, W.; Su, G.-S.; Hu, L.-H. Reliability Analysis of Suspension Bridge Using Gaussian Process Based Response Surface Method. Adv. Mater. Res. 2014, 860, 2970–2974. [Google Scholar]
  18. Li, D.Q.; Zheng, D.; Cao, Z.J.; Tang, X.S.; Phoon, K.K. Response surface methods for slope reliability analysis: Review and comparison. Eng. Geol. 2016, 203, 3–14. [Google Scholar] [CrossRef]
  19. Wang, D.; Qiu, H.; Gao, L.; Jiang, C. A Subdomain uncertainty-guided Kriging method with optimized feasibility metric for time-dependent reliability analysis. Reliab. Eng. Syst. Saf. 2024, 243, 109839. [Google Scholar] [CrossRef]
  20. Chen, Z.; He, J.; Li, G.; Yang, Z.; Wang, T.; Du, X. Fast convergence strategy for adaptive structural reliability analysis based on kriging believer criterion and importance sampling. Reliab. Eng. Syst. Saf. 2024, 242, 109730. [Google Scholar] [CrossRef]
  21. Yang, S.; Meng, D.; Wang, H.; Yang, C. A novel learning function for adaptive surrogate-model-based reliability evaluation. Philos. Trans. R. Soc. A Math. Phys. Eng. Sci. 2024, 382, 20220395. [Google Scholar] [CrossRef]
  22. Han, Z.; Huang, Z. An Interpolation Method for Karhunen-Loeve Expansion of Random Field Discretization. CMES-Comput. Model. Eng. Sci. 2024, 138, 245–272. [Google Scholar] [CrossRef]
  23. Liu, Z.; Choe, Y. Data-driven sparse polynomial chaos expansion for models with dependent inputs. J. Saf. Sci. Resil. 2023, 4, 358–365. [Google Scholar] [CrossRef]
  24. Yu, C.; Lv, X.; Huang, D.; Jiang, D. Reliability-based design optimization of offshore wind turbine support structures using RBF surrogate model. Front. Struct. Civ. Eng. 2023, 17, 1086–1099. [Google Scholar] [CrossRef]
  25. Mukherjee, S.; Sivakumar Babu, G.L. Probabilistic Evaluation of the Uplift Capacity of Transmission Tower Foundations Using Reinforced Anchors. Int. J. Geomech. 2023, 23, 04023203. [Google Scholar] [CrossRef]
  26. Hu, J.; Wang, B.; Di, K.; Zou, J.; Ren, D.; Zhao, J. Self-healing FBG sensor network fault-detection based on a multi-class SVM algorithm. Opt. Express 2023, 31, 41313–41325. [Google Scholar] [CrossRef]
  27. Zhu, H.; Shi, Y. Displacement Self-Sensing Control of Permanent Magnet Assisted Bearingless Synchronous Reluctance Motor Based on Least Square Support Vector Machine Optimized by Improved NSGA-II. IEEE Trans. Ind. Electron. 2024, 71, 1201–1211. [Google Scholar] [CrossRef]
  28. Liu, J.-Q.; Feng, Y.-W.; Lu, C.; Pan, W.-H. Decomposed-coordinated framework with intelligent extremum network for operational reliability analysis of complex system. Reliab. Eng. Syst. Saf. 2024, 242, 109752. [Google Scholar] [CrossRef]
  29. Gao, Z.; Fu, Z.; Wen, M.; Guo, Y.; Zhang, Y. Physical informed neural network for thermo-hydral analysis of fire-loaded concrete. Eng. Anal. Bound. Elem. 2024, 158, 252–261. [Google Scholar] [CrossRef]
  30. Liu, H.; Li, S.; Huang, X.; Ding, P.; Jiang, Z. Adaptive stochastic configuration network ensemble for structural reliability analysis. Expert Syst. Appl. 2024, 237, 121633. [Google Scholar] [CrossRef]
  31. Harrou, F.; Hittawe, M.M. Road Traffic Modeling and Management: Using Statistical Monitoring and Deep Learning; Elsevier: Amsterdam, The Netherlands, 2021. [Google Scholar] [CrossRef]
  32. Harrou, F.; Zeroual, A.; Hittawe, M.M.; Sun, Y. Chapter 6—Recurrent and Convolutional Neural Networks for Traffic Management. In Road Traffic Modeling and Management; Elsevier: Amsterdam, The Netherlands, 2022. [Google Scholar] [CrossRef]
  33. Zhang, Y.; Mazen Hittawe, M.; Katterbauer, K.; Marsala, A.F.; Knio, O.M.; Hoteit, I. Joint seismic and electromagnetic inversion for reservoir mapping using a deep learning aided feature-oriented approach. In SEG Technical Program Expanded Abstracts 2020; Society of Exploration Geophysicists: Houston, TX, USA, 2020. [Google Scholar] [CrossRef]
  34. Hittawe, M.M.; Sidibe, D.; Meriaudeau, F. Bag of words representation and SVM classifier for timber knots detection on color images. In Proceedings of the 14th IAPR International Conference on Machine Vision Applications (MVA), Tokyo, Japan, 18–22 May 2015. [Google Scholar] [CrossRef]
  35. Echard, B.; Gayton, N.; Lemaire, M. AK-MCS: An active learning reliability method combining Kriging and Monte Carlo Simulation. Struct. Saf. 2011, 33, 145–154. [Google Scholar] [CrossRef]
  36. Li, G.; Zhang, K. A combined reliability analysis approach with dimension reduction method and maximum entropy method. Struct. Multidiscip. Optim. 2011, 43, 121–134. [Google Scholar] [CrossRef]
  37. Bichon, B.J.; Eldred, M.S.; Swiler, L.P.; Mahadevan, S.; McFarland, J.M. Efficient Global Reliability Analysis for Nonlinear Implicit Performance Functions. AIAA J. 2008, 46, 2459–2468. [Google Scholar] [CrossRef]
  38. Jones, D.R.; Schonlau, M.; Welch, W.J. Efficient Global Optimization of Expensive Black-Box Functions. J. Glob. Optim. 1998, 13, 455–492. [Google Scholar] [CrossRef]
  39. Hu, Z.; Du, X. Mixed efficient global optimization for time-dependent reliability analysis. J. Mech. Des. 2015, 137, 051401. [Google Scholar] [CrossRef]
  40. Aloise, D.; Deshpande, A.; Hansen, P.; Popat, P. NP-hardness of Euclidean sum-of-squares clustering. Mach. Learn. 2009, 75, 245–248. [Google Scholar] [CrossRef]
  41. Song, Z.; Lu, Z.; Zhou, C. A Novel and Efficient Subset Simulation (SubSim) Method for Obtaining Cumulative Distribution Function (CDF) of Structural Response and Its Application. J. Northwestern Polytech. Univ. 2011, 29, 542–547. [Google Scholar] [CrossRef]
Figure 1. Calculation flow of the traditional Kriging model.
Applsci 14 05813 g001
Figure 2. Flow chart of clustering.
Applsci 14 05813 g002
Figure 3. Flow chart of multi performance reliability analysis method.
Applsci 14 05813 g003
Figure 4. Diagram of the roof truss structure.
Applsci 14 05813 g004
Figure 5. Sample point addition process.
Applsci 14 05813 g005
Figure 6. The 1/37 3D model of a low-pressure compressor roulette.
Applsci 14 05813 g006
Figure 7. The 1/37 3D model of a low-pressure compressor roulette.
Applsci 14 05813 g007
Table 1. Comparison of the numerical example result.
MethodNumber of IterationsReliability IndexProbability of FailureRelative Error/%
Monte Carlo1082.3416250.0096-
Response Surface302.3883980.0084611.83
Kriging model72.3309120.0098790.62
Proposed approach32.3461990.0094830.41
Table 2. Comparison of the numerical example result.
MethodNumber of Sample PointsReliability IndexProbability of FailureRelative Error/%
Monte Carlo 1062.2714460.01156-
Importance sampling 40002.2587330.011953.374
Proposed approach15002.2824970.011232.855
Table 3. Parameter and its value of the engineering experiment.
Random VariablesPhysical SignificanceMean ValueStandard DeviationUnit
E1Elastic modulus of roulette123,0003000MPa
ε1Poisson’s ratio of roulette0.330.015/
ρ1Density of roulette4.480.2g/cm3
E2Elastic modulus of pin219,0006000MPa
ε2Poisson’s ratio of pin0.30.015/
ρ2Density of pin7.760.3g/cm3
nRotational speed100010rad/s
FAssembly force21.9280.01kN
SmaxFatigue strength of material703.84/MPa
Table 4. Comparison of the numerical example result.
IterationNumber of
Sample Points
E1ε1ρ1E2ε2ρ2nFSmax
11123,0000.3304.480219,0000.3007.760100021.928801.16
2120,0000.3304.480219,0000.3007.760100021.928801.25
3123,0000.3154.480219,0000.3007.760100021.928800.81
218121,149.4920.3474.521218,251.9760.2887.7461127.991.934837.75
19118,149.4920.3474.521218,251.9760.2887.7461127.991.934838.21
335121,152.7800.3514.531217,800.0720.2928.0471137.621.932840.61
36118,152.7800.3514.531217,800.0720.2928.0471137.621.932843.50
4
67121,065.2240.3544.554216,893.9770.2957.7451159.521.931847.23
68121,065.2240.3544.554216,893.9770.2957.7451159.521.941844.44
Table 5. Comparison of the turbine disc result.
MethodNumber of Sample PointsReliability IndexProbability of FailureRelative Error/%
Monte Carlo 1062.1414220.01612-
Response surface +
Importance sampling
2562.1575860.015483.9702
Proposed approach682.1311110.016542.6055
Disclaimer/Publisher’s Note: The statements, opinions and data contained in all publications are solely those of the individual author(s) and contributor(s) and not of MDPI and/or the editor(s). MDPI and/or the editor(s) disclaim responsibility for any injury to people or property resulting from any ideas, methods, instructions or products referred to in the content.

