Abstract
The dynamic characteristics of single DNA molecules translocating within micro/nano-channels are fundamental for a wide range of applications such as stretching, separating, mapping, and even sequencing of DNA molecules. In this study, a type of tapered microchannel chip with uniform height for all configurations was fabricated, with the major tapered structure having a length of 13 μm and a width that tapers from 5 μm to 20 μm. The dynamic characteristics such as the trajectories and velocities of λ-DNA molecules translocating from different positions driven by an external DC electric field force were systematically investigated by single-molecule fluorescence imaging technology. Some dynamic characteristics of DNA molecules translocation were found. Considering simply the effects of electrophoretic force and electro-osmotic force on the DNA molecules, the dynamic characteristics of DNA molecules are well understood. For example, the velocity of the DNA molecule is inversely proportional to the diameter of the tapered channel and the turning phenomena of the trajectory of the DNA molecules translocating through microchannels. This study is helpful and proposes new ideas for the design and development of microfluidic chips for the quantitative manipulation of DNA molecules.
1. Introduction
Micro/nanofluidics are usually employed to manipulate and study properties of single DNA molecules, such as stretching [1], separation [2], concentrating [3], amplification [4], sequencing [5], and interactions between DNA molecules [6,7]. To manipulate single DNA molecules accurately, researchers have developed various channel structures, including T-shaped [8], S-shaped [9], cross-shaped [10], tapered [11], hyperbolic [12], serrated [13] structures, etc. At the same time, nanopillar arrays [14], micro-nanochannel arrays, and nanoscale slits [15] are also integrated into fluidic channel systems. The combination of single-molecule imaging with micro/nanofluidics enables the visible research of the dynamic behavior of individual biomolecules. For instance, Kazuya Tatsumi et al. used microparticle image velocimetry (μPIV) to measure the velocities of two particles with different electrical surface properties. By subtracting the velocity component due to the effects of electrophoretic force from the velocity of the particles, the distribution of electro-osmotic flow velocity and electric field intensity was measured [16]. Shou-Shing Hsieh et al. observed the stretching of DNA molecules in semicircular and quarter-circular microchannels using the PIV (particle image velocimetry) technique. The effects of centrifugal force, electric field strength, and solution viscosity on the stretching efficiency were analyzed [17]. Thomas B. Goudoulas et al. studied the nonlinear rheological behavior of concentrated double-stranded (ds) and single-stranded (ss) DNA solutions under standard oscillation and large amplitude oscillatory shear (LAOS) deformation. Insights into the nonlinear response of the DNA solutions were achieved by performing PIV at a wide range of imposed strain amplitudes and two angular frequencies [18].
To drive DNA molecules within micro-/nano-fluidic channels, there are usually four kinds of methods: electrically driven [19,20,21], pressure driven [22], capillary force driven [23], and shear driven [24]. Of these, the electrically driven method is the most commonly used to guide the movement of DNA molecules within micro-nano channels. When an electric field drives the migration of DNA molecules, their velocity and direction are influenced by various factors, including electro-osmotic force [25], electrophoretic force [26], Stokes force [27], and Saffman force [28]. Additionally, the impact of the double electric layer [29] near the channel wall’s surface on DNA molecules and the constraining effect of the channel structure’s shape on DNA molecules cannot be ignored.
To manipulate the movement of DNA molecules accurately, researchers have designed and prepared micro-/nanofluidic channels with specific functional structures. For example, Yanan Liu et al. invented a hyperbolic microfluidic channel, which generates a constant strain rate along the flow centerline over a long distance, and it was used to extend and compress DNA molecules [12]. Jones et al. developed a device to successfully screen DNA molecules by using electric field force. The device regulates the deflection direction of DNA molecules at the channel exit by varying the magnitude and frequency of the voltage [30]. Shuyi Wu investigated the significant effect of the micro-funnel shape on DNA fragmentation using both microfluidic experiments and numerical simulations. The funnel shape controls the flow fields, especially the magnitude and distribution of the extension rate. Recently, Taesoo Kim et al. designed a kind of tapered microchannel entrance structure to prevent DNA molecules from accumulating at the entrance and to achieve a uniform distribution of DNA molecules in the microchannel. It is found that the tapered microchannels with gradually changing inner diameters can solve the problem of DNA molecules accumulating and clogging at interfaces when channels with different inner diameters are spliced together [31].
In this investigation, soft lithography was employed to prepare microfluidic chips that contained tapered fluidic channels. Two kinds of microfluidic channels with different inner diameters (5 μm and 120 μm) were connected by a tapered microchannel (inner diameter changed gradually from 5 μm to 20 μm) with a consistent height of 5 μm. The migration velocities changes in DNA molecules as they were translocated through the tapered microfluidic were monitored in real-time by using single-molecule fluorescence visualization technology, and the trajectories and velocity properties changes in DNA molecules were analyzed in detail as they entered/exited the tapered microchannels from different starting positions.
2. Materials and Methods
2.1. Tapered Microfluidic Channel Systems
The process of fabricating microfluidic chips by soft lithography [32] with polydimethylsiloxane (PDMS) consists of the following steps: UV exposure, PDMS casting, and punching and bonding. About the UV exposure (Figure 1a), a negative photoresist (SU-8, Microchem, Los Angeles, CA, USA) is first spin-coated onto a clean and flat wafer, prebaked, and then exposed under UV light (MIDASMDA400LJ, Daejeon, Republic of Korea) with appropriate exposure time. After that, the inactive photoresist is removed with a developer solution and post-baking, the photomask pattern is transferred onto the wafer as the master mold. All microchannel structures were fabricated in a single exposure using soft lithography, ensuring consistent height and preventing DNA molecules from becoming obstructed due to sudden height variations in the channels. About the casting the mold (Figure 1b), the structural layer was obtained by replicating the master mold with PDMS and in this step, the ratio of A rubber to B rubber of the PDMS is 9:1 to increase the softness. About the punching and bonding (Figure 1c), the microfluidic chip consists of three layers: the cover layer is a PDMS film that encapsulates sample cells; the middle layer is a structural layer with a microchannel structure and sample cells; and the base layer is a glass substrate that encapsulates the microchannels. A 0.5 mm diameter drill is used to make the inlet and outlet at the reserved places, then the three-layer structure is treated by oxygen plasma activation to achieve a tight bond between the cover, middle, and base layers [33].
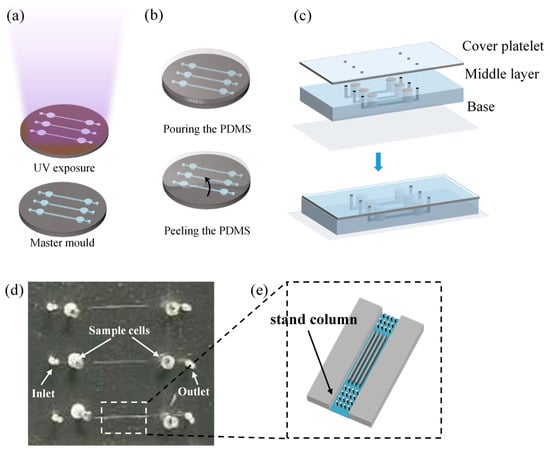
Figure 1.
Fabrication process of the microfluidic chip: (a) UV exposure; (b) casting the mold; (c) punching and bonding; (d) microfluidic chip; (e) local amplification of microchannel.
Each microfluidic chip is equipped with three sets of tapered microfluidic channel systems (Figure 1d), and the microfluidic channel system has five separate channels. At the inlet, five sets of tapered microchannels (length: 13 μm, inner diameters: 5~20 μm) are parallel and merged into a larger microchannel. At the outlet, each tapered microchannels is connected to a small microchannel (width of 5 μm). For enclosed channels, the aspect ratio (defined as the height of the channel/distance between walls) cannot be smaller than 1:10, or the channel can collapse on itself due to the lack of structural support [34,35]. To prevent channel collapse uniform stand columns array(d = 5 μm) are designed and manufactured inside the large microchannels (Figure 1e). The electrodes are placed in the sample cells.
2.2. Experimental Approach
Figure 2 is the schematic diagram of the experimental system. The experimental system mainly consists of an inverted fluorescence microscope (IX-70, Olympus, Tokyo, Japan), an EMCCD camera (iXon+885, Andor, Orlando, FL, USA), a self-prepared microfluidic chip, a syringe pump (PUMP 33, Harvard Apparatus, Holliston, MA, USA), an injector (50 μL, Hamilton, NV, USA), a pair of platinum wire electrodes (Jieyu Electronic Technology Co., Ltd., Shanghai, China), and an external high voltage power supply (PS 8000 2U, EPS, Germany). The image data were analyzed and processed using Image-J software (http://rsbweb.nih.gov/ij/). The laboratory temperature was maintained at 23 °C, and all experiments were conducted in a dark room.
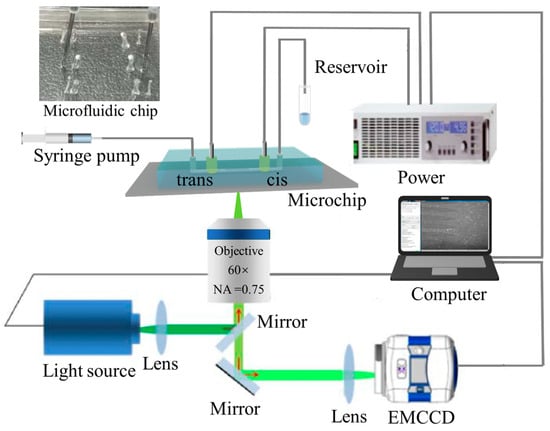
Figure 2.
Schematic diagram of the experimental setup.
The experimental procedure can be described briefly as follows: Tris-HCl buffer was injected into the cis chamber using a syringe pump at a rate of 5 μL/h first. After about 20 min, the microchannels were filled with buffer, then the λ-DNA/YOYO-1 sample solution was injected into the cis chamber at a rate of 5 μL/h. After about 20 min, the injector was removed to relieve pressure in the inlet port and reduce the effect of pressure between the inlet and outlet ports. Finally, a voltage was applied at a pair of platinum electrodes to translocate the movement of the λ-DNA molecules through the microchannel. The external voltage on the electrodes was adjusted between 0 and 100 V. It should be noted that before the start of the experiment, the microfluidic chip was pre-degassed. The movement of DNA molecules in microchannels was recorded in real-time using an EMCCD and analyzed using Image-J to calculate the migration velocity of the DNA molecules. The specific procedure was as follows: The EMCCD was set with an exposure time of 50 ms and an acquisition interval of 100 ms to record experimental images. The coordinates of the DNA molecules were obtained from two consecutive images (using the midpoint of the spot to represent the location of the DNA molecule) and the displacement of the DNA molecules was calculated. The migration velocity of the DNA molecules was then determined using the displacement divided by the exposure time.
2.3. DNA Sample Solution
The λ-DNA molecules used in this study were purchased from Fuzetex Biotechnology (Shenzhen, China) and labeled with the fluorescent dye YOYO-1 (Invitrogen, New York, NY, USA) at a ratio of 10:1 (dye molecules to base pairs) to achieve optimal fluorescence efficiency.
2.4. Simulation
The electric field distribution within the tapered microfluidic channel system was simulated using the COMSOL Multiphysics 6.1 software. Table 1 lists the main physical parameters used in the analytical and numerical simulations. It is assumed that all fluid properties remain stable and uniform throughout the microchannel.

Table 1.
Main physical parameters.
3. Results
A self-made microfluidic chip was employed to investigate the characteristics and mechanism of DNA molecules translocating through a tapered microfluidic channel system driven by an external electric field. The trajectories and velocities of DNA molecules when they entered the tapered microchannel from different locations were tracked, recorded, and analyzed.
Figure 3 illustrates the starting locations of three DNA molecules within the large channel. Figure 3a is a photograph of the tapered microfluidic channel system. The large diameter channel, tapered microchannel, and smaller diameter channel, as well as the array of pillars that prevents the collapse of the large diameter channel, can be seen clearly. Figure 3b shows the different starting locations for DNA molecules to enter the tapered microchannel: the ais direction of the tapered microchannel (P1), between the two neighboring tapered microchannels (P2), and near the wall of the large diameter microchannel (P3).
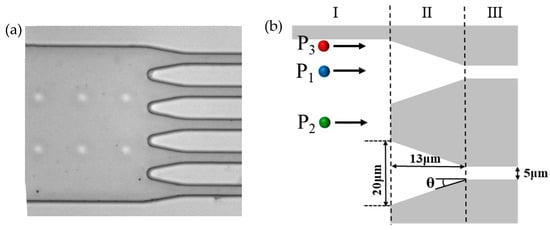
Figure 3.
Tapered microfluidic channels: (a) typical photograph of the microfluidic channel; (b) different positions of DNA molecules entering into tapered microchannels.
In addition, in order to clearly describe and discuss the trajectories and velocities of the DNA molecules, the microchannel system is divided into three regions as shown in Figure 3b, i.e., region I, region II, and region III.
This section is divided by subheadings. It provides a concise and precise description of the experimental results, their interpretation, as well as the experimental conclusions that can be drawn.
3.1. Properties of DNA Translocation in Tapered Microchannels from Different Original Positions
Figure 4 shows the movement trajectories of three DNA molecules translocating through the tapered channel system from different starting locations. The channel boundaries are delineated by white dashed lines, and the locations of the DNA molecule are indicated with blue dashed boxes. As shown in Figure 4, the trajectories for the three scenarios are as follows: DNA molecules entered the tapered microchannel along the axis direction as shown in Figure 3b and did not have their trajectories deflected and always migrated along the channel axis (Figure 4a). DNA molecules entered from the location between the two neighboring tapered microchannels as shown in Figure 3b and after moving a short distance in a straight line and reaching the region II (Figure 3b), it altered the moving direction and turned towards the tapered channel wall and moving forward along the channel wall, and then moved inside the small diameter channel and translocating forward along the channel wall (Figure 4b). DNA molecules that enter from a location near the wall of the large microchannel consistently moved near the channel wall in all channels (Figure 4c).
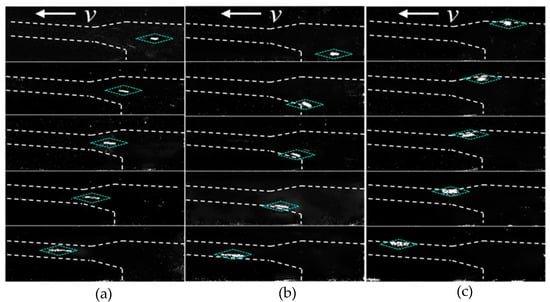
Figure 4.
The trajectories of DNA molecules translocating through tapered microchannels from different starting locations: (a) along the microchannel axis direction; (b) between two neighboring tapered microchannels; (c) near the wall of the large microchannel.
Figure 5 is the velocity change in DNA molecules translocating from three different starting locations as shown in Figure 4. Specifically, Figure 5a–c corresponds to the three cases of DNA molecule movement shown in Figure 4, and the corresponding velocities are defined as v1, v2, and v3, respectively.
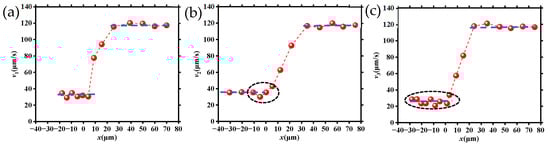
Figure 5.
Velocities of DNA molecules migrating through tapered microchannels from various starting locations: (a) along the microchannel axis direction; (b) between two neighboring tapered microchannels; (c) near the wall of the large microchannel.
It can be seen from Figure 5 that the velocity of the DNA molecules as they are translocating through the tapered microchannel from three different starting locations. This can be divided into three similar stages: (1) the velocities were all relatively smaller when they moved within the large channel (region I as shown in Figure 3b); (2) the velocities for all DNA molecules had a significant increase (region II); and (3) the velocities of DNA molecules achieved almost the same maximum value at the tapered microchannel exit. The velocity was maintained through the entire small channel (region III). However, the velocity characteristics of the three cases are obvious: (1) in region I, the average velocities were different in the three cases, v2 was the maximum, while v3 was the minimum; (2) v1 remained almost the same value and v3 kept fluctuating up and down, while v2 had a large change near the entrance (entering the region II), decreasing firstly and then increasing immediately; in addition, these velocity changes were different when DNA molecules translocated region II.
3.2. Velocities of DNA Molecules in the Tapered Microchannels
To learn about the velocity characteristics of DNA molecules as they translocated through the tapered microchannel in detail (region II, shown in Figure 3b), the tapered channels are systematically analyzed as shown in Figure 6. Figure 6 depicts images of DNA molecules as they move through tapered microchannels, along with corresponding velocity changes at various locations. Figure 6a1 shows that one DNA molecule moved through the tapered microchannel from the large microchannel to the small microchannel, and the corresponding verses with the inner diameter of the tapered microchannel are shown in Figure 6a2; it can be seen that the velocity of the DNA molecule was increasing monotonically. Figure 6b1 shows one DNA molecule exiting from the tapered microchannel region (II) and transferring into the large microchannel. The corresponding velocity is shown in Figure 6b2, and it is obvious that the velocity of the DNA molecule was decreasing monotonically with the inner diameter.
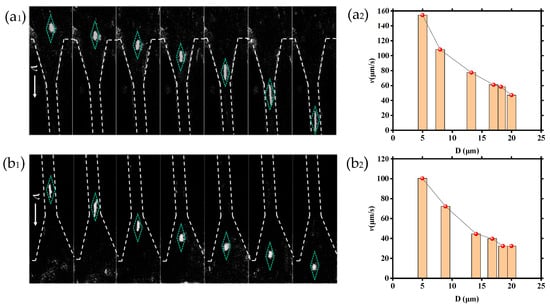
Figure 6.
Trajectories and velocities of DNA molecules translocate through the tapered microchannel: (a1) entering into the tapered microchannel and corresponding; (a2) velocity versus the inner diameter of the tapered microchannel; (b1) exiting from the tapered microchannel and corresponding; (b2) velocity versus the inner diameter during exit from the tapered microchannel.
As shown in Figure 6, whether the DNA molecule entered into or exited from the tapered microchannel, its velocity was inversely proportional to the diameter of the microchannel. The DNA molecules shown in Figure 6a2,b2 are not from the same experiment. Therefore, the DNA molecules have different velocities at the same inner diameter locations within the tapered microchannel.
3.3. Velocities of DNA Molecules under Different Applied Voltages
To further understand the effect of applied voltages on DNA molecules translocating through the tapered microchannels system, the velocities of DNA molecules transferring in large and small microchannels at different applied voltages (20 V, 40 V, 60 V, 80 V, and 100 V) are investigated in detail. Figure 7a shows the movement images of DNA molecules under different applied voltages. Figure 7b illustrates the relationship between the velocity of DNA molecule and the applied voltage, where vd and vD denote the velocity of the DNA molecule in small and large channels, respectively (the bars are standard deviation). It can be seen that the velocity of DNA molecules increases with the increasing voltage translocating through both large microchannels and small microchannels applied. Additionally, the vd is about three times greater than vD.
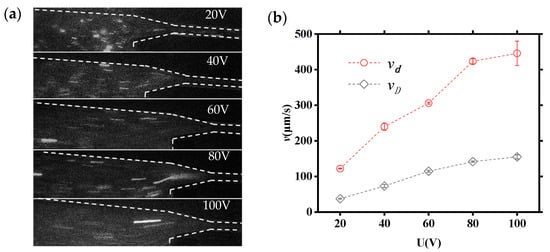
Figure 7.
The velocity of a DNA molecule within a tapered microfluidic channel: (a) real-time movement images of DNA molecules; (b) relationships of vd−U and vD−U of DNA molecules (the bars are standard deviation).
4. Discussion
DNA molecules are driven by an external electric field as they translocate through the microchannel system, which is mainly influenced by electrophoretic and electro-osmotic currents. When the motion of the buffer solution and DNA molecules both remain stable, the real velocity of DNA molecules (vreal) is the sum of the velocity of the electro-osmotic flow (vEOF) and the velocity of the DNA molecules induced by the electrophoretic force (vEP), as shown in Equation [36,37]:
where E is the electric field strength, ε0 is the vacuum permittivity, εr is the relative permittivity, ζwall is the zeta potential of the channel wall, ζDNA is the zeta potential of the surface of the DNA molecule, and η is the fluid viscosity. DNA molecules are negatively charged and thus move in an opposite direction of electrophoresis under the external electric field. In this study, we detected under a bright field that the direction of solution motion in microchannels was opposite to the direction of the electric field, indicating that the direction of electro-osmotic flow was also opposite to the external electric field. That is to say, the electrophoresis of DNA molecules and electro-osmotic flow were in the same direction. From Equation (3), it can be found that the velocity of DNA molecules increases with the strength of the electric field. Considering only the effects of electrophoretic flow and electro-osmotic flow on the dynamic characteristics of DNA molecules under a DC electric field, the velocity of DNA molecules increases with the increase in the electric field, and the dynamic characteristics of DNA molecules are well explained by electric field distribution. To better reveal the dynamic characteristics of DNA molecules in the tapered microchannel system, as shown in Figure 8, the electric field intensity distribution within the tapered microchannel system was simulated by COMSOL Multiphysics software, as shown in Appendix A. Figure 8 shows the electric field distribution within the tapered microfluidic channel system, where θ = 30°, U = 20 V as it is in the fabricated chip (shown in Figure 3).
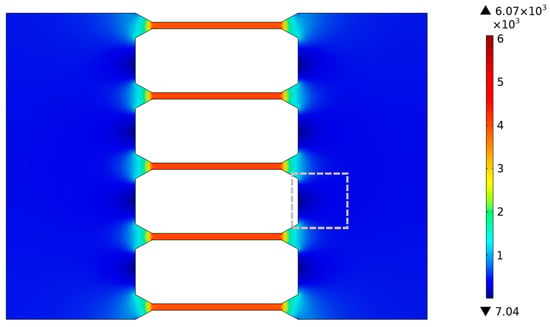
Figure 8.
Electric field distribution inside the tapered microfluidic channel system.
From Figure 8, it can be found that (1) the electric field strength inside the large microchannels is uniformly and weak, about 430 V/m, except for a region of reduced electric field strength between the two neighboring tapered microchannels (in the gray dashed box) and (2) that inside the tapered microchannels, the electric field strength increases sharply from 430 V/m to 4.1 × 10³ V/m. Due to the surged electric field and the confinement effect of the tapered microchannel on the fluid, the velocity of DNA molecules increases rapidly inside the tapered channel. Coupled with the uniformly distributed electric field at the exit port of the tapered microchannel, all DNA molecules leave the tapered channel at the same velocity of 117 μm/s (Figure 5). (3) The electric field strength is uniformly distributed and larger inside the small microchannels by about 4.1 × 10³ V/m. The electro-osmotic and electrophoretic forces remain stable. As a result, the DNA molecules maintain a stable velocity in region III (Figure 5). As the DNA molecule translocates through the tapered microchannel along the microchannel axis direction, it is subjected to a stable electric field force in region I and keeps the distance from the channel wall constant in region II, resulting in a straight trajectory and stable velocity (Figure 4a and Figure 5a).
To further reveal the velocity change rule of DNA molecules in tapered microchannels, the distribution of electric field strength in the tapered channel system was studied in detail, as shown in Figure 9 (U = 20 V). Figure 9a shows a schematic diagram of the tapered microchannel, and the coordinate axes were established to test the change in E. The axis of the channel is the x-axis, and the direction of the inner diameter is the y-axis. The trajectory of the DNA molecules may be deflected when approaching the tapered channel, so the origin is taken to be the O point 10 μm away from the entrance of the tapered microchannel. From the simulation results shown in Figure 8, it can be seen that the E is stable after entering the small microchannel for about 2 μm, so the point P (25.5, 0) is taken at a depth of 2.5 μm inside the small microchannel. Then, points A (0, 12), B (0, 8), and C (0, 4), which are the same distance away from the entrance of the tapered microchannel as point O are also selected, and points A, B, C, and O are connected with point P to test the electric field intensity changes in the four paths. The corresponding results are shown in Figure 9c. Figure 9b displays locally the simulated distribution of electric field strength (θ = 30°, U = 20 V). As the inner diameter of the tapered microchannel decreases, the corresponding electric field strength increases rapidly.
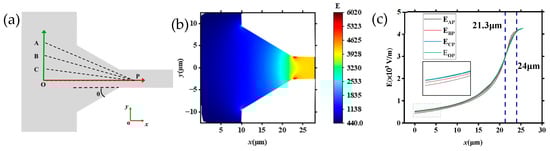
Figure 9.
Electric field distribution inside the tapered microchannel: (a) schematic of the tapered channel (θ = 30°); (b) local electric field strength inside the tapered microchannel; (c) distribution of E in different directions (θ = 30°).
Furthermore, by combining the distribution of electric field strength in Figure 9b, the velocity changes in DNA molecules as shown in Figure 5 and Figure 6 can be understood. The strength of the electric field is highest in the channel axis, and it reduces as the distance is far away from the channel axis. That is to say, the electric field force on DNA molecules in different positions of region II is different. DNA molecules moving along the axis of the tapered microchannel are under the largest electric field force (as the driving force), while DNA molecules in other places are under a smaller force. In addition, the E increases with decreasing inner diameter within the tapered microchannels, thus the velocity of the DNA molecules increases as the inner diameter decreases (Figure 6a2,b2).
Figure 9c is the distribution of E in various directions. It can be seen from Figure 9c that along each direction, the E is monotonically increasing, and the disparity in the intensity of E in distinct orientations is exceedingly modest. There are about three stages of the distribution of E in four different directions (AP, BP, CP, and OP, θ = 30°). At different stages the electric field strength (E) can be simply summarized as follows: When 0 < x < 21.3 μm, the region contains large channels and tapered microchannels as shown in Figure 9a, EOP > ECP > EBP > EAP; that is to say, as the distance from the channel axis decreases, the E gradually increases. Moreover, the closer to the inner channel the higher the electric field strength, and the gap among the electric fields on different paths gradually decreases. When x = 21.3 μm, EAP = EBP = ECP = EOP; when 21.3 < x < 24 μm, EAP > EBP > ECP > EOP; and when x > 24 μm, EAP = EBP = ECP = EOP, the electric field strength is equal in all directions, meaning the E inside the small microchannel is the same.
To further investigate the trajectory and velocity of DNA molecules translocating through the tapered microchannel (region II), we analyzed the distribution of electric field strength in the region between the two neighboring tapered microchannels as marked in the black dashed box of Figure 10a, ranged 28 μm × 28 μm with point O located in the center of the channel wall. Figure 10b displays the distribution of E in the region with θ = 30°, while Figure 10c shows that with θ = 60°. Figure 10d shows that the distribution of E at different θ in the OP direction is 30°, 45°, and 60° (U = 20 V).
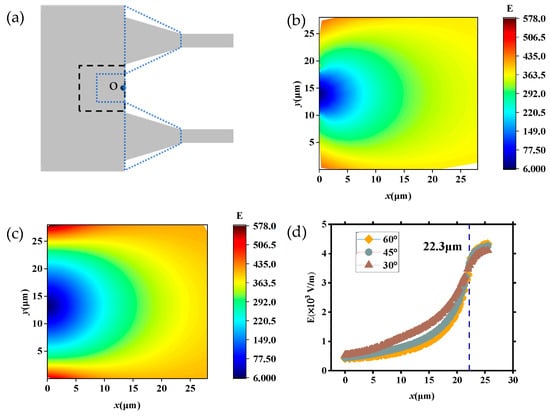
Figure 10.
Electric field strength distribution in the region between the two neighboring tapered microchannels: (a) location of the selected region (black dashed box); (b) distribution of E (θ = 30°); (c) distribution of E (θ = 60°); (d) the distribution of E at different θ in the OP direction is 30°, 45°, and 60° (U = 20 V).
As shown in Figure 10b, the E decreases as it approaches point O, and the strength decreases to 0 in point O, which affects the velocity of DNA molecules translocating through the region. As DNA molecules translocate through this area and approach region II, the effect of decreasing electric field strength and the channel wall slows the DNA molecules down. Additionally, the channel wall restricts the movement of DNA molecules and results in it deflecting to the tapered microchannels (Figure 4b and Figure 5b). When θ changed to 60° as Figure 10c depicts (the blue dotted line area), the distance between spacing tapered microchannels decreases and the electric field intensity in the selected area increases overall. It can be seen from Figure 10d that for each θ, the E is monotonically increasing, and the difference in E increases and then decreases in different θ. Figure 10d shows the variation of E along the OP direction with different θ values. When 0 < x < 22.3 μm, the E is monotonically increasing, and the difference in E increases and then decreases in different θ, and the value of E increases faster with smaller θ. When x = 22.3 μm, the values of E with different θ become equal. When x > 22.3 μm, the strength of E also increases as θ decreases.
Figure 11 illustrates the distribution of E within the tapered microchannel in the OP direction under different applied voltages (20 V, 40 V, 60 V, and 80 V, respectively). It can be seen that the E at all locations increases with the applied voltage U increase. Therefore, vd and vD increase when U increases (Figure 7b).
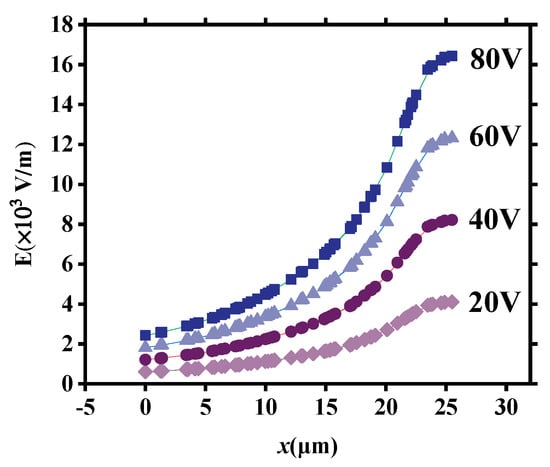
Figure 11.
The distribution of E within the tapered microchannel in the OP direction under different applied voltages.
Comparing the three cases shown in Figure 5, it can be found that the velocity of DNA molecules near the wall of the large microchannels (Figure 5c) in region I is smaller than that of the other two cases (Figure 5a,b). This difference might have another influence, i.e., the interaction between the DNA molecules and the channel wall besides the EDL has an effect on the DNA molecule. The surface of the PDMS channel is not completely smooth, thus the tangled-mass-thread DNA molecules around the channel wall interact with the rough part of the surface. The interactions between DNA molecules and the microchannel wall and the adsorption of the EDL led to a decrease in the velocity.
5. Conclusions
In this study, we first fabricated highly uniform chips consisting of five sets of tapered microchannels by soft lithography, of which the major tapered structure is 13 µm in length and gradually changed from 5 µm to 20 µm in width. Microchannels with widths of 5 µm and 120 µm were connected at two sides of the tapered structure, respectively. Then, by using single-molecule fluorescence imaging, we systematically investigated the dynamic characteristics (such as the trajectories and velocities) of λ-DNA molecules translocating the tapered microchannels driven by an external DC electric field and found some meaningful phenomena.
The velocities of DNA molecules are relatively slow as DNA molecules translocate through large channels, and they increase as DNA molecules translocate tapered microchannels and reach the same maximum value at the place that connects tapered microchannels and small channels and then stabilized in the small channels. The velocity characteristics of DNA molecules in large channels are complicated. DNA molecules near the large channel walls translocate slowly and fluctuate, while the velocity of the DNA molecules translocating along the microchannel axis direction remains almost constant. DNA molecules between two neighboring tapered microchannels translocate the fastest, and the velocity of DNA molecules in these places decreases first but increases immediately as they approach the tapered channels. The velocity of the DNA molecule is inversely proportional to the diameter of the tapered channel, and the velocity of DNA molecules translocating through both large and small microchannels increases with the external applied voltage. The trajectory of DNA molecules around microchannels is near the wall surface, while DNA molecules translocating along the axis of the channel move in a straight line along the axis, and DNA molecules translocating between two neighboring tapered microchannels alter their moving directions and move forward along the tapered channel wall.
All the above phenomena and characteristics can be well understood by simulating the distribution of electric field strengths when considering only the electrophoretic and electro-osmotic forces acting on DNA molecules.
This study helps in the development of DNA molecular sensors and lab-on-a-chip systems. In future research, the θ angle of the tapered microchannels can be adjusted to different degrees to guide the movement of DNA molecules. Additionally, we aim to combine the tapered microchannels and nanostructures to stretch DNA molecules and study their conformational changes in detail.
Author Contributions
Conceptualization, methodology, K.W.; software, Y.N., J.W., and Z.L.; data curation, Y.N., Y.L. (Yanjie Li), Y.L. (Yanfei Liu), J.Z., and K.W.; formal analysis, writing—original draft preparation, Y.N. and K.W.; writing—review and editing, Y.N., Y.D., J.W., J.Z., and K.W.; supervision, project administration, K.W. and D.S. All authors have read and agreed to the published version of the manuscript.
Funding
This research was supported by the National Natural Science Foundation of China (No. 62275216, 61775181), the Innovation Capability Support Program of Shaanxi Province (grant No. S2018-ZC-TD-0061, TZ0393), and the National Key Scientific Instrument and Equipment Development Projects of China (No. 51927804).
Institutional Review Board Statement
Not applicable.
Informed Consent Statement
Not applicable.
Data Availability Statement
The original contributions presented in the study are included in the article, further inquiries can be directed to the corresponding author.
Conflicts of Interest
The authors declare no conflicts of interest.
Appendix A

Figure A1.
Tapered microfluidic systems simulation model in COMSOl.
Figure A1.
Tapered microfluidic systems simulation model in COMSOl.

References
- Bleha, T.; Cifra, P. Stretching and compression of DNA by external forces under nanochannel confinement. Soft Matter 2018, 1, 1247–1259. [Google Scholar] [CrossRef]
- Sun, P.; Wu, J.; Yang, S.; Li, H.; Zhao, L.; Wang, Y.; Wang, X.; Pu, Q. Robust and easy-to-use microchip electrophoresis within sub-millimeter channels for fast and highly efficient separation. Talanta 2021, 235, 122747. [Google Scholar] [CrossRef]
- Arca, M.; Ladd, A.J.; Butler, J.E. Electro-hydrodynamic concentration of genomic length DNA. Soft Matter 2016, 12, 6975–6984. [Google Scholar] [CrossRef]
- Lin, Y.-H.; Liao, X.-J.; Chang, W.; Chiou, C.-C. Ultrafast DNA amplification using microchannel flow-through PCR device. Biosensors 2022, 12, 303. [Google Scholar] [CrossRef]
- Branton, D.; Deamer, D.W.; Marziali, A.; Bayley, H.; Benner, S.A.; Butler, T.; Di Ventra, M.; Garaj, S.; Hibbs, A.; Huang, X. The potential and challenges of nanopore sequencing. Nat. Biotechnol. 2008, 26, 1146–1153. [Google Scholar] [CrossRef]
- Gupta, C.; Liao, W.-C.; Gallego-Perez, D.; Castro, C.; Lee, L. DNA translocation through short nanofluidic channels under asymmetric pulsed electric field. Biomicrofluidics 2014, 8, 024114. [Google Scholar] [CrossRef]
- Tegenfeldt, J.O.; Prinz, C.; Cao, H.; Huang, R.L.; Austin, R.H.; Chou, S.Y.; Cox, E.C.; Sturm, J.C. Micro-and nanofluidics for DNA analysis. Anal. Bioanal. Chem. 2004, 378, 1678–1692. [Google Scholar] [CrossRef]
- Tang, J.; Doyle, P.S. Electrophoretic stretching of DNA molecules using microscale T junctions. Appl. Phys. Lett. 2007, 90, 224103. [Google Scholar] [CrossRef]
- Zeng, C.; Song, Y.; Zhou, X.; Zhang, F.; Jiao, M.; Liu, M.; Gu, H. Experimental study on heat transfer and pressure drop characteristics in a microchannel heat exchanger assembly with S-shaped fins. Appl. Therm. Eng. 2022, 210, 118406. [Google Scholar] [CrossRef]
- Yeo, L.Y.; Chang, H.C.; Chan, P.P.; Friend, J.R. Microfluidic devices for bioapplications. Small 2011, 7, 12–48. [Google Scholar] [CrossRef]
- Hsieh, S.S.; Liou, J.H. DNA molecule dynamics in converging–diverging microchannels. Biotechnol. Appl. Biochem. 2009, 52, 29–40. [Google Scholar] [CrossRef]
- Liu, Y.; Zografos, K.; Fidalgo, J.; Duchêne, C.; Quintard, C.; Darnige, T.; Filipe, V.; Huille, S.; Du Roure, O.; Oliveira, M.S. Optimised hyperbolic microchannels for the mechanical characterisation of bio-particles. Soft Matter 2020, 16, 9844–9856. [Google Scholar] [CrossRef]
- Guan, Y.; Liu, Y.; Lei, H.; Liu, S.; Xu, F.; Meng, X.; Bai, M.; Wang, X.; Yang, G. Dielectrophoresis separation of platelets using a novel zigzag microchannel. Micromachines 2020, 11, 890. [Google Scholar] [CrossRef]
- Yeh, J.-W.; Taloni, A.; Chen, Y.-L.; Chou, C.-F. Entropy-Driven Single Molecule Tug-of-War of DNA at Micro–Nanofluidic Interfaces. Nano Lett. 2012, 12, 1597–1602. [Google Scholar] [CrossRef]
- Balducci, A.; Mao, P.; Han, J.; Doyle, P.S. Double-stranded DNA diffusion in slitlike nanochannels. Macromolecules 2006, 39, 6273–6281. [Google Scholar] [CrossRef]
- Tatsumi, K.; Nishitani, K.; Fukuda, K.; Katsumoto, Y.; Nakabe, K. Measurement of electroosmotic flow velocity and electric field in microchannels by micro-particle image velocimetry. Meas. Sci. Technol. 2010, 21, 105402. [Google Scholar] [CrossRef]
- Hsieh, S.-S.; Tsai, M.-J.; Hsieh, Y.-C. DNA stretching under electrokinetically driven forces in curved microchannel flow. J. Nanosci. Nanotechnol. 2017, 17, 8731–8741. [Google Scholar] [CrossRef]
- Goudoulas, T.B.; Pan, S.; Germann, N. Double-stranded and single-stranded well-entangled DNA solutions under LAOS: A comprehensive study. Polymer 2018, 140, 240–254. [Google Scholar] [CrossRef]
- Wang, H.; Wang, K.; Ma, H.; Dan, S.; Yang, F.; Wang, S.; Wang, G.; Bai, J. Electrodynamics of DNA molecules moving through microfluidic channels studied with single molecular fluorescence imaging technology. J. Nanosci. Nanotechnol. 2016, 16, 6986–6991. [Google Scholar] [CrossRef]
- Yin, S.; Huang, Y.; Wong, T.N.; Ooi, K.T. Dynamics of droplet in flow-focusing microchannel under AC electric fields. Int. J. Multiph. Flow 2020, 125, 103212. [Google Scholar] [CrossRef]
- Wang, Y.; Gao, M.; Qu, Y.; Hu, J.; Xie, Y.; Liu, Z.; Song, Z.; Xu, H.; Weng, Z.; Wang, Z. Effects of AC/DC electric fields on stretching DNA molecules. Nano 2020, 15, 2050065. [Google Scholar] [CrossRef]
- Stein, D.; van der Heyden, F.H.; Koopmans, W.J.; Dekker, C. Pressure-driven transport of confined DNA polymers in fluidic channels. Proc. Natl. Acad. Sci. USA 2006, 103, 15853–15858. [Google Scholar] [CrossRef]
- Kim, T.; Jo, K. Microfluidic device to maximize capillary force driven flows for quantitative single-molecule DNA analysis. BioChip J. 2023, 17, 384–392. [Google Scholar] [CrossRef]
- Pappaert, K.; Vanderhoeven, J.; Van Hummelen, P.; Dutta, B.; Clicq, D.; Baron, G.; Desmet, G. Enhancement of DNA micro-array analysis using a shear-driven micro-channel flow system. J. Chromatogr. A 2003, 1014, 1–9. [Google Scholar] [CrossRef]
- Li, J.; Li, D. Electroosmotic flow velocity in DNA modified nanochannels. J. Colloid Interface Sci. 2019, 553, 31–39. [Google Scholar] [CrossRef]
- Paegel, B.M.; Blazej, R.G.; Mathies, R.A. Microfluidic devices for DNA sequencing: Sample preparation and electrophoretic analysis. Curr. Opin. Biotechnol. 2003, 14, 42–50. [Google Scholar] [CrossRef]
- Karunakaran, V.; Pérez Lustres, J.L.; Zhao, L.; Ernsting, N.P.; Seitz, O. Large dynamic Stokes shift of DNA intercalation dye Thiazole Orange has contribution from a high-frequency mode. J. Am. Chem. Soc. 2006, 128, 2954–2962. [Google Scholar] [CrossRef]
- Rühle, F.; Schaaf, C.; Stark, H. Optimal control of colloidal trajectories in inertial microfluidics using the Saffman effect. Micromachines 2020, 11, 592. [Google Scholar] [CrossRef]
- Daghighi, Y.; Li, D. Numerical studies of electrokinetic control of DNA concentration in a closed-end microchannel. Electrophoresis 2010, 31, 868–878. [Google Scholar] [CrossRef]
- Jones, P.V.; Salmon, G.L.; Ros, A. Continuous separation of DNA molecules by size using insulator-based dielectrophoresis. Anal. Chem. 2017, 89, 1531–1539. [Google Scholar] [CrossRef]
- Kim, T.; Kim, S.; Noh, C.; Hwang, H.; Shin, J.; Won, N.; Lee, S.; Kim, D.; Jang, Y.; Hong, S.-J. Counting DNA molecules on a microchannel surface for quantitative analysis. Talanta 2023, 252, 123826. [Google Scholar] [CrossRef]
- Kim, P.; Kwon, K.W.; Park, M.C.; Lee, S.H.; Kim, S.M.; Suh, K.Y. Soft lithography for microfluidics: A review. Biochip J. 2008, 2, 1–11. [Google Scholar]
- Bhattacharya, S.; Datta, A.; Berg, J.M.; Gangopadhyay, S. Studies on surface wettability of poly (dimethyl) siloxane (PDMS) and glass under oxygen-plasma treatment and correlation with bond strength. J. Microelectromechanical Syst. 2005, 14, 590–597. [Google Scholar] [CrossRef]
- Xia, Y.; Whitesides, G.M. Soft lithography. Annu. Rev. Mater. Sci. 1998, 28, 153–184. [Google Scholar] [CrossRef]
- Hoelzle, D.; Lake, M.; Narciso, C.; Cowdrick, K.; Storey, T.; Zhang, S.; Zartman, J. Microfluidic device design, fabrication, and testing protocols. Protoc. Exch. 2015, 1–26. [Google Scholar] [CrossRef]
- Yang, F.; Wang, K.; Sun, D.; Zhao, W.; Wang, H.-q.; He, X.; Wang, G.-r.; Bai, J.-t. Direct observation of λ-DNA molecule reversal movement within microfluidic channels under electric field with single molecule imaging technique. Chin. Phys. B 2016, 25, 078201. [Google Scholar] [CrossRef]
- Firnkes, M.; Pedone, D.; Knezevic, J.; Doblinger, M.; Rant, U. Electrically facilitated translocations of proteins through silicon nitride nanopores: Conjoint and competitive action of diffusion, electrophoresis, and electroosmosis. Nano Lett. 2010, 10, 2162–2167. [Google Scholar] [CrossRef]


Disclaimer/Publisher’s Note: The statements, opinions and data contained in all publications are solely those of the individual author(s) and contributor(s) and not of MDPI and/or the editor(s). MDPI and/or the editor(s) disclaim responsibility for any injury to people or property resulting from any ideas, methods, instructions or products referred to in the content. |
© 2024 by the authors. Licensee MDPI, Basel, Switzerland. This article is an open access article distributed under the terms and conditions of the Creative Commons Attribution (CC BY) license (https://creativecommons.org/licenses/by/4.0/).