Abstract
In this paper, a theoretical estimation model of TBM thrust, torque, and power in the rock–soil interface (RSI) of mixed ground is developed, including a new force model for the drag cutter that accounts for chamber pressure and soil friction. A distribution model of the disc cutters and drag cutters on the cutterhead adaptable to different excavation surfaces is built in order to visualize the cutting process as the TBM cutterhead rotates, and a program is created and that runs smoothly using the Python version 3.8, which can recognize the numbers and calculate the forces of the disc cutters and drag cutters in the soft and hard strata, respectively. Then, combining with friction forces and chamber pressure calculated by the program, the variation in torque, thrust, and power are produced. Subsequently, a new index (MPPI), which considers both the thrust of the TBM and cutterhead torque, for forecasting TBM tunneling performance in composite strata is presented. The reliability of the index as well as the estimation model are validated using data from an actual project to offer recommendations for future tunneling projects.
1. Introduction
Tunnel boring machines (TBMs) are now widely used in tunnels for water conservation and hydropower projects, highways, urban subways, and other fields around the world due to their technical characteristics of fast excavation speed, high quality, low disturbance to surrounding rocks, high equipment safety, and good environmental protection []. Among the various TBM excavation grounds, mixed-face ground is one of the most difficult conditions. Within the excavation section and in the direction of the excavation extension, the mixed-face ground includes two or more separate geological strata with extremely varied geotechnical property, engineering geology, and hydrogeological properties. Modified earth pressure balance (EPB) TBMs are commonly employed in the development of composite strata to deal with complicated and changing geological conditions as well as the difficulties of excavation. The modified EPB TBM features two types of cutters installed on the front of the cutterhead (disc cutter and drag cutter), which work together to remove the rock and soil from the surface as the machine goes ahead. Many aspects influence TBM performance, including device characteristics, rock and soil properties, each cutter’s parameters, the composition of the excavation face, and the operators’ operation []. Accidents like severe cutter wear, cutterhead blockage, and jamming are common during the construction of mixed-face ground, for example, in the Shanggongshan diversion tunnel in Kunming, the Pinglin highway tunnel in Taiwan, or the Dul Hasti hydroelectric project diversion tunnel in India []. As a result, predicting TBM performance is critical for improving construction quality and minimizing construction costs.
Modeling the distribution of disc cutters and drag cutters on the cutterhead in different excavation faces can reflect the cutting process of cutters more intuitively when the cutterhead is rotating, but such models are very scarce. Geng et al. [] fixed the positions of each tool and stratum in the coordinate system, identified the types of rocks under each cutter using a ray intersection algorithm, and then utilized the Colorado School of Mines (CSM) model to determine the cutter cutting forces. However, the model was only applied to the layer-banded rock (LBR) and the random-distributed rock (RDR) conditions. Zhang et al. [] developed a dynamic torsional model for the TBM cutting system in mixed-face conditions by considering a sketch of the multiple pinion concentric drive of the TBM cutterhead. Zhao et al. [] developed a model that fixed the location of the cutter in the coordinate system, meanwhile changing the position of OXY. When the cutterhead is spinning in the rock–soil interface (RSI) of mixed ground, the parameters for the force calculation of the cutter are different.
During the design phase, estimating the thrust and torque of a TBM can offer the thrust and torque capability for commissioning the machine. Power is another critical component that can directly reflect TBM performance. Many studies have been conducted to forecast the thrust and torque of TBM under various situations. Rostami et al. [] developed a model for estimating the force of a hard rock TBM, which can also determine the thrust and torque needs of the TBM. Shi et al. [] proposed the torque composition of an EPB TBM and calculated each torque component by considering the cutterhead structure, cutting principles, and cutter–soil interaction. Ates et al. [] calculated the thrust and torque of several types of TBMs operating in soft strata. González et al. [] proposed a calculation method to estimate the thrust and torque of TBM when tunneling in soil and soft rock composite strata, but the model did not explain each component of the thrust and torque in detail. It is not too difficult to notice that there is little research about TBM power. Yang et al. [] developed the equation for the reverse torque, which was deduced from the pressure of water and soil, the weight of the shield and segments, the friction force between the support boots and the segments, and the friction force between the shield tail seal brush and the segments based on the working principle of the EPB shield. Qi et al. [] analyzed the interaction between mixed soil–rock TBMs and RSI condition and established a total load prediction model that focuses on the influence of variable rock and soil properties. Cheng et al. [] investigated the main factors influencing the excavation process, developed an approximate prediction model for the power of a hard rock TBM, and then used engineering data to identify the pending coefficients of other factors affecting the power of the equipment using regression methods. It is necessary to propose a power calculation approach for TBM in mixed-face conditions.
In the past two decades, many scholars have successively proposed performance prediction indexes for TBMs under different geological conditions. The penetration rate per revolution (PRev) and the penetration rate (PR) were presented by Rostami et al. [] and Bruland et al. [] to directly forecast hard rock TBM tunneling performance. Hassanpour et al. [] discovered a strong link between geological characteristics (UCS, joint spacing, and RDQ) and hard rock TBM performance parameters, particularly the field penetration index (FPI). Based on the model of Hassanpour et al. [], Delisio et al. [] investigated the link between the FPI and the volumetric joint count (Jv) and the intact rock uniaxial compressive strength (UCS). Based on the Norwegian University of Science and Technology in Trondheim (NTNU) TBM performance prediction model, Steingrimsson et al. [] introduced PRev, a performance index for TBM in composite grounds. Subsequently, Tóth et al. [] defined and categorized mixed-face ground and analyzed that the PR decreases when the proportion of the hard rock on the excavation surface increases. By incorporating the total thrust and torque into the penetration rate calculation, Vergara et al. [] and Zhao et al. [] proposed new TBM performance prediction indexes in the mixed-face ground, the mixed-face penetration index (MFPI), and mixed torque penetration index (MTPI). Deng et al. [] proposed the relative variation coefficient (CRV), an evaluation index of thrust suitable for sudden loads. The results show that the optimized nonuniform propulsion system has a small CRV value and a good stratum adaptability.
In this paper, the calculation model of TBM thrust, torque, and power in the rock–soil interface (RSI) of mixed ground is established. A new model is proposed, which can not only alter each tool’s position on the TBM cutterhead but also alter the percentage of soft and hard strata on the excavation face according to the actual project. Then, a new index for evaluating TBM excavation performance in mixed-face ground is developed, and the reliability of the model and the index are validated by specific project.
2. Thrust, Torque, and Power Estimation Model for Modified EPB TBM in Mixed-Face Ground
2.1. Power Model
A TBM’s operating system is split into two components: the mainframe system and the backup system. The mainframe system, which has the most significant influence on the tunneling performance of the equipment, is primarily responsible for moving the cutterhead forward and attaining cutterhead rotation. The back support system is mainly in charge of conveying residue, illumination, water supply, firefighting, etc. The TBM consumes energy in many aspects, such as excavating the ground and overcoming friction. Each portion of the energy will transform into another. In addition, there are various factors affecting the energy consumption in excavation, such as the geological parameters (uniaxial compressive strength, tensile strength, cohesion, etc.), operational parameters (penetration rate, rotational speed, excavation speed, etc.), tool parameters (tool type, number, mounting position, etc.), cutterhead structure parameters (diameter, opening ratio, etc.), etc. Therefore, establishing a power model based on energy consumption is impractical. The TBM’s energy is mainly consumed by the thrust provided by the main advance system and the torque supplied by the cutterhead rotation system, so the tunneling power prediction model can be developed based on the energy consumption theory. For TBM excavation in a hard rock formation, Cheng et al. [] proposed a model for calculating tunneling power, which can be expressed as Equation (1), and mechanical analysis models for tunneling thrust and cutterhead driving torque were developed. However, these models contain many coefficients that need to be identified in the context of specific projects. The following two parts, Section 2.2 and Section 2.3, develop theoretical models of the tunneling thrust and cutter torque of modified EPB TBM in the mixed-face stratum, which are then substituted into Equation (1) to estimate the TBM’s tunneling power.
where is the total tunneling power, is the TBM’s tunneling force, is the cutterhead driving torque, is the advance speed, and is the rotation speed of the cutterhead.
2.2. Thrust Model
When the EPB TBM tunnels in the mixed-face stratum, the front side of the cutterhead not only has friction with the excavation surface, but also suffers from the reverse resistance from the excavation surface. The shield shell encounters friction with the surrounding strata. The high-speed rotation of the soil in the chamber generates enormous earth pressure. The equipment at the end of the shield will not only have a frictional effect with the lining pipe sheet but will also generate drag resistance. The equipment is subjected to turning resistance as it turns. For some types of TBMs, the cutter ring on the cutterhead is subjected to reverse resistance from the excavation face. Therefore, its total trust has around seven components, as shown in Equation (2):
where is the total thrust of the TBM; is the frictional resistance between the TBM body and the surrounding strata; is the resistance generated by the cutters cutting the ground; is the thrust force required to overcome the chamber pressure acting on the bulkhead; is the friction between the shield tail and the segment, considering that the cutting ring of some TBMs protrudes from the cutterhead; is the penetration resistance of the cutting ring; is the resistance to change direction when the machine turns; is the hauling force of the trailing equipment. In this paper, the total thrust is simplified to Equation (3):
Here, a simplified formulation is proposed based on an amplification factor removing some of the elements from the formula, which is based on two reasons: Firstly, as previous research has shown [], , , , and are difficult to measure in practical engineering. Secondly, the engineering verification in previous works show that , , and account for much more than 90% of total thrust [,,], and the other parts are too small to be ignored. Therefore, the value of is approximately 1.1. Previous studies have tended to neglect the differences in geological paraments between different layers and lack theoretical basis when calculating each section of the thrust, which can lead to mistakes and poor confidence in the estimation model. In the following, we introduce the calculation methods of , , and in detail.
2.2.1. The Frictional Resistance between the TBM Body and the Surrounding Strata
As shown in Figure 1, this part of the frictional resistance is primarily caused by the positive force of the surrounding strata acting on the shield surface, which is composed of two major components: the force generated by the gravity of the strata and the stratigraphic reaction force generated by the machine’s self-weight. The force generated by the gravity of the strata acts on the TBM’s upper part and lower part, which are equal in size and opposite in direction, as are the forces acting on the left and right sides. The frictional resistance caused by the gravity of the stratum can be calculated by decomposing the vertical earth pressure and lateral earth pressure at a location on the side of the body into positive pressures and perpendicular to the side of the body, as shown in Figure 2. For the RSI mixed-face strata, the frictional resistance generated by the gravity of both strata on the TBM shell body needs to be calculated separately [].
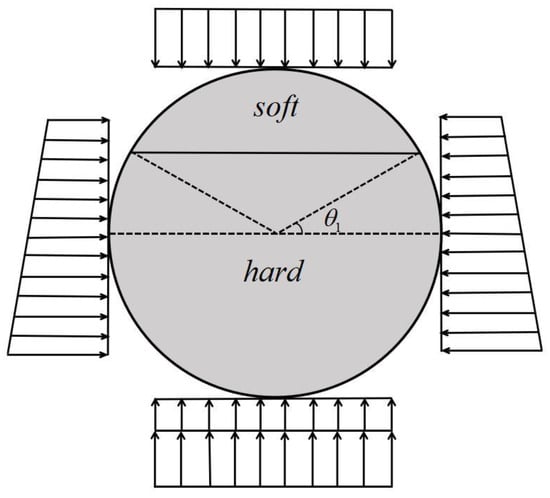
Figure 1.
The frictional force between shield and ground.
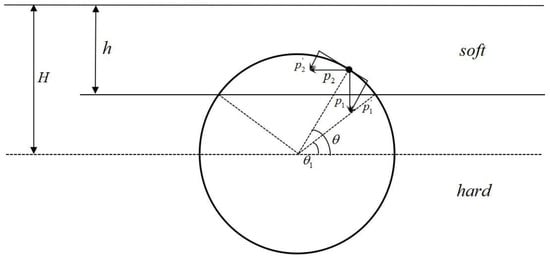
Figure 2.
Force diagram of TBM body.
In the soft strata, the vertical earth pressure and lateral earth pressure can be written as follows:
where is the volume weight of the soft ground, is the coefficient of lateral earth for soft ground, is the distance from the ground to cutterhead center, and is the diameter of excavation surface.
Decomposition of the above two forces into positive pressures and perpendicular to the side of the TBM body:
Therefore, the frictional resistance in the soft ground can be expressed as follows:
where is the coefficient of friction between the soft ground and the shield, is the length of the shield, and is the angle of the intersection (interface between two layers and the cutterhead profile) with respect to the center of the cutterhead.
In the hard strata, the vertical earth pressure and lateral earth pressure can be written as follows:
Decomposition of the above two forces into positive pressures and perpendicular to the side of the TBM body:
Therefore, the frictional resistance in the hard ground can be expressed as follows:
where is the coefficient of friction between the hard rock and the shield.
The ground reaction force created by the machine’s self-weight is supposed to act on the lower half-circumference, and this component of the frictional resistance is equal to the product of the TBM’s self-weight and the coefficient of friction of the ground and the shell []. The force includes two situations. As shown in Figure 2, when , the frictional resistance in this part is equal to the product of the self-weight of the TBM and the friction coefficient of the hard rock and the shield shell. It can be written as follows:
when , it is assumed that the frictional resistance in this part is related to the percentage of soft and hard rock in the lower half of the excavation face. It can be written as follows:
where is the self-weight of the EPB TBM and is the distance from the ground to the intersection of the two strata.
The frictional resistance between the TBM body and the surrounding strata can be written as below:
2.2.2. Cutting Resistance by Cutters
In the RSI mixed strata, the resistance of the cutterhead in the hard rock is mainly caused by the normal force for disc cutters to penetrate the rock, and the resistance of the cutterhead in the soft strata is primarily caused by the normal force of the drag cutters cutting the soil. In the following, the method for calculation normal force is explained: Figure 3 shows the normal and rolling forces of the disc cutter during the cutting process. The normal force is perpendicular to the direction of the excavation face, and the direction of the rolling force is parallel to the excavation face. Rostami et al. [] calculated the combined force of the disc cutter rolling in hard rock. It can be expressed as Equation (17):
where is the total force of a disc cutter, is a constant for the pressure distribution function, is the angle of the contact between the rock and disc cutter , is the penetration rate per revolution, is the width of the cutter tip, is the radius of the disc cutter, is the pressure of the broken zone , is a dimensionless parameter and approximately equals to 2.12, is the cutter spacing, is the uniaxial compressive strength (USC) of the rock, and is the tensile strength. The normal force () of the disc cutter can be expressed as Equation (18):
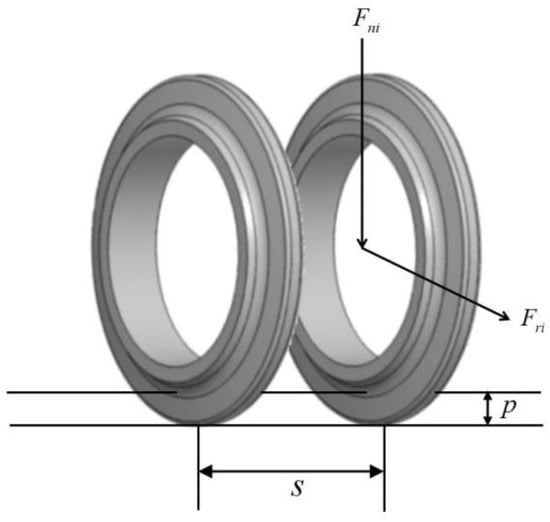
Figure 3.
Force diagram of the disc cutter during the cutting process.
Then the normal force of the disc cutter can be expressed as follows:
When the EPB TBM advances, the drag cutter penetrates the soft ground and then has a squeezing and sliding effect on the soil as the cutterhead rotates. The drag cutter calculation models of Shi et al. [] and Zhou et al. [] neglected the effect of soil friction on the cutter. The cutter calculation model of Xia et al. [] analyzed the friction between soil and cutter but ignored the impact of chamber pressure on the drag cutter and the soil. In this paper, a new model for determining the drag cutter force is developed, as shown in Figure 4. The soil being stripped is approximate as a triangular prism with ∆MIJ as the base and the width of the cutter as the height. The height of the bottom triangle represents the drag cutter’s penetration rate, d. Therefore, the gravity of the spalled soil can be expressed as Equation (20):
where is the gravity of the stripped soil, is the width of the drag cutter, is the front angle of drag cutter, and is the cutting depth per revolution of one drag cutter. According to Zhou et al. [], the cutting depth of the two types drag cutters are, respectively, and ; , , is the cutting depth when the cutterhead rotates at angle, and is the angle between the adjacent drag cutters.
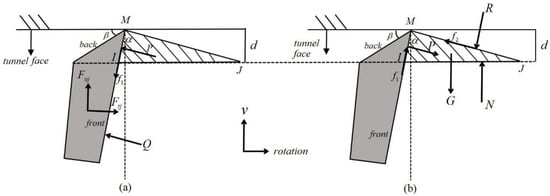
Figure 4.
Force analysis diagram of drag cutter and scraped soil: (a) force analysis diagram of drag cutter; (b) force analysis diagram of scraped soil.
We conducted a static force study of the drag cutter and the sliced soil using Coulomb’s earth pressure theory. The forces on the drag cutter are shown in Figure 4a. is the drag cutter’s normal force, which is in the same direction as the EPB TBM’s forward motion, and is the drag cutter’s cutting force, which is parallel to the excavation surface. is the force of soil acting on the front surface of the cutter. As the stripped soil slides down along the front surface of the cutter, the frictional force acting on the front surface of the cutter is directed obliquely downward. is the force of soil pressure in the chamber acting on the cutter, whose direction is perpendicular to the front surface of the cutter. The forces on the stripped soil are shown in Figure 4b. The drag cutter has a reaction force on the soil. is the soil’s normal reaction force acting on the destruction surface MJ. Since the stripped soil MIJ moves downward along the sliding surface MJ, the direction of the frictional force on the MJ surface is obliquely upward. is the gravity of the stripped soil. is the force exerted by the soil pressure in the chamber on the stripped soil.
The forces acting on the stripped soil are balanced in both vertical and horizontal directions, which can be expressed in Equations (21) and (22):
The forces acting on the drag cutter are balanced in both vertical and horizontal directions, which can be expressed in Equations (23) and (24):
where is the friction coefficient between the soil and the front surface of the drag cutter, is the friction coefficient between the soil and the tunnel face, is the length of the drag cutter, and is the pressure from the excavation chamber. As shown in Figure 5, is the distance from j-th drag cutter to the cutterhead center, and is the angle of the j-th cutter with respect to the horizontal plane [].
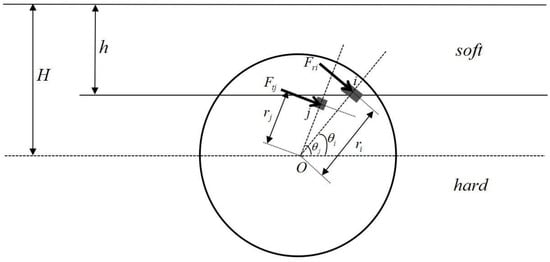
Figure 5.
Schematic diagram of the disc cutter and drag cutter on the cutterhead.
Integrating Equations (20)–(28), the normal force acting on the cutter can be expressed as the following:
Integrating Equations (19) and (29), the cutting resistance by cutters can be expressed as below:
where and are the normal force on the i-th disc cutter and j-th drag cutter, respectively. and are the number of disc cutters and drag cutters on the cutterhead.
2.2.3. Thrust Force Required to Overcome the Chamber Pressure
The chamber pressure can keep the excavation surface stable, and this part of the resistance cannot be ignored. It is expressed as in Equation (31):
2.3. Torque Model
Torque is essential in the design and manufacturing of TBMs. Nowadays, some projects refer to the empirical formula to estimate the torque of TBMs. When a lesser torque factor is employed, the torque may be insufficient, and it is difficult to get out of trouble when tunneling in mixed-face strata. A larger torque factor can raise not only the cost of the TBM drive device but also the hassle of transportation and installation. When the modified EPB TBM is tunneling in the RSI mixed strata, the cutterhead rotates under motor driving. The cutterhead generates frictional torque and against the ground on its front and sides. Subsequently, the slag enters the work chamber through an opening in the panel and generates frictional torque against the back of the cutterhead. The cutters on the cutterhead generate cutting torques . There are several more torque components, such as the clipping torque at the cutter opening, the agitating torque from the stirring bar mounted on the back of the cutterhead, the rotating torque of the main bearing, and the torque of the cutterhead closure. The EPB TBM torque mainly consists of eight components, which can be expressed as the following []:
where is the overall torque of the cutterhead. In fact, the components that have the most significant influence on the cutterhead torque are , , , and , which account for about 90% of the total torque. The remaining parts have a minimal degree of influence on the torque and can be neglected in the analysis. In this paper, we simplify the torque into four parts:
where is the torque amplification factor, which is taken as 1.1. Later, , , , and will be introduced in detail.
2.3.1. The Friction Torque of the Cutterhead
As shown in Figure 6, the cutterhead will be relatively displaced from the front strata during rotation and cutting. At the same time, the cutterhead will be subjected to the lateral pressure from the soft and hard strata in front. Therefore, frictional torque will be generated between the cutterhead and the front stratum. The side of the cutterhead is subjected to vertical earth pressure and lateral earth pressure of the surrounding strata. The frictional torque can be calculated by decomposing the two earth pressures into positive pressures perpendicular to the side of the cutterhead. In general, slag does not cover the whole chamber and has some mobility compared to the soil in front of the cutterhead. As a result, the friction coefficient between the cutterhead’s back side and the slag is lower than that between the cutterhead’s front side and the tunneling face. According to Zhou et al. [], the friction torque of the cutterhead (, , and ) is described in detail in Appendix A.
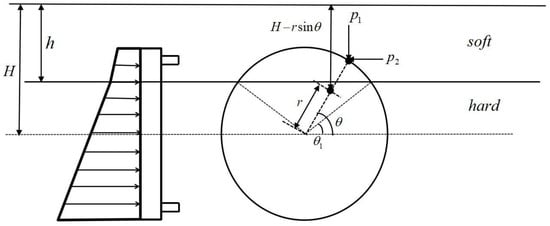
Figure 6.
Diagram of frontal and lateral forces on the cutterhead.
2.3.2. Cutting Torque
The forces acting on the disc cutter and the drag cutter are described in Section 2.2.2. As shown in Figure 3 and Figure 4, the disc cutter’s rolling force and the cutting force of the drag cutter can be expressed as Equations (34) and (36):
Substituting Equation (17) into Equation (34), the rolling force of the disc cutter can be derived:
Combining Equations (18)–(26), the cutting force of the drag cutter can be derived:
The cutting torque of the cutterhead can be expressed as follows:
where, as shown in Figure 5, is the rolling force of the disc cutter, is the cutting force of the drag cutter, is the distance of the i-th disc cutter from the center of the cutterhead, and is the distance of the j-th drag cutter from the center of the cutterhead.
3. Dynamic Cutting Model of the Cutterhead
3.1. Description of Model
In order to study the mechanical properties of the cutterhead in composite strata, a dynamic cutting model including calculations of the thrust, torque, and power is developed. The program consists of five main modules. The data reading module reads the pre-stored coordinate data from excel into the memory of Python. The plotting module displays the contour of the excavation surface, the stratigraphic boundary, and the initial position of the cutters in Python. The dynamic cutting module converts the cutting process of the TBM cutterhead on the excavation surface into a circular rotation of each cutter with the center of the cutterhead. During this module, the cutter numbers in both strata are recorded in real time. The parameter calculation module is to obtain the change in each tunneling parameter during the advance of the TBM by inputting the machine, cutter, stratum, and working parameters and combining them with the theoretical calculation model in the previous section. The data statistics output module outputs the values of tunneling parameters obtained in the previous module and uses MATLAB version 2017 to draw the change curve of tunneling parameters, and it is observed that the trend of the curve can roughly reflect the running state of the machine in the process of tunneling. The schematic representation of the basic algorithm for the program is shown in Figure 7. The program, which can simulate the EPB TBM cutterhead cutting system, is created and runs smoothly using the Python version 3.8, as shown in Figure 8. The feature of this model is that it cannot only simulate the arrangement of each tool on the TBM cutterhead used in different actual projects but also change the position and proportion of each stratum according to the geological conditions. In this research, we investigate a cutterhead equipped with 64 drag cutters and 39 disc cutters in the RSI composite strata. The cutters and stratigraphic demarcation lines are placed at the appropriate locations, and each point is numbered. As shown in Figure 8a, the red line represents the dividing line between soft and hard strata (soft strata on the left and hard rock on the right), the green points indicate the disc cutters, and the blue points indicate the drag cutters. The locations of the cutters shift when the cutterhead rotates in the different geological conditions. Figure 8b shows the cutters’ position after 10 degrees of cutterhead rotation, where the gray dots are the original positions of the cutters. The specifications of the EPB TBM and the parameters of the cutters are shown in Table 1, and the mechanical properties of the two geologies are shown in Table 2. During the program running, the system recognizes the numbers of the disc cutters and drag cutters in the soft and hard strata, respectively, and calculates the forces of all cutters during the cutting process using our theory. Combining with other partial forces (friction, chamber pressure, etc.) calculated by the system, the variation in thrust, torque, and power can be produced. The results of the model calculations are presented in the next section.
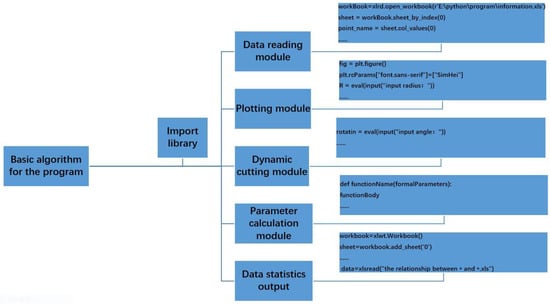
Figure 7.
The schematic representation of the basic algorithm for the program. (* represents different tunneling parameters).
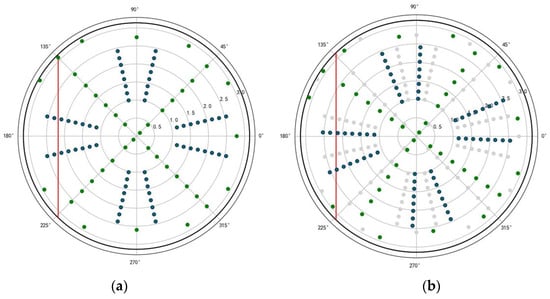
Figure 8.
Stratigraphic distribution and cutters placement: (a) original cutter position; (b) position of cutters after cutterhead rotating 10 degrees. (The red line represents the dividing line between soft and hard strata (soft strata on the left and hard rock on the right). The green points indicate the disc cutters, and the blue points indicate the drag cutters).

Table 1.
Parameters of EPB TBM specification and cutters.
Table 2.
Mechanical parameters of the two strata.
3.2. Result Analysis
3.2.1. Effect of Tunnel Surface Composition
Figure 9 depicts the variation in cutterhead torque, TBM thrust, and total power with various tunnel surface compositions when the cutterhead is spinning. In the model, the penetration rate of the cutterhead is 5 mm/rev and the uniaxial compressive strength of the hard rock is 150 MPa. Rs represents the proportion of the area occupied by the soft ground on the excavation face. The laws of torque, thrust, and power are investigated by changing Rs from 0 to 1 with a 10% interval value. The statistics illustrate that the torque, thrust, and power decrease as the value of Rs increases. When Rs is 0%, the tunnel surface is filled with hard rock, and the cutterhead requires the highest torque and effort to operate. When Rs is 100%, the tunnel surface is completely filled with soft strata, and the cutterhead is easy to operate. When Rs is 40% and 60%, the three TBM mechanical parameters change significantly. The difference in maximum and minimum of torque, thrust, and power are 227.2 kN·m, 150.1 kN, and 73.4 kW, which are the most in all situations. The results reflect strong vibration of the cutterhead when Rs is 40% and 60%. When Rs is 0%, 50%, and 100%, the values of the torque, thrust, and power hardly fluctuate. The present conclusions agree with some previous research by Geng et al. [] and Zhang et al. [], which shows the viability of our model.
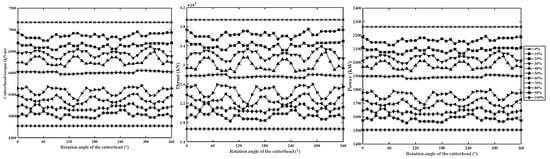
Figure 9.
Variation in torque, thrust, and power under different Rs during cutterhead rotation.
3.2.2. Effect of the Penetration Rate
Figure 10 depicts the variation of cutterhead torque, thrust, and total power with various penetrations when the cutterhead is spinning. In the model, Rs is 30% and the uniaxial compressive strength of the hard rock is 150 MPa. The results show that when the Rs and rock mechanical parameters are constant, the torque, thrust, and power rise as the cutterhead penetration rate increases. Moreover, the penetration rate has little effect on the amplitude of thrust, while the amplitudes of torque and power grow as the cutterhead penetration rate increases. In the actual project, the TBM should not pursue a penetration rate too high because it would increase cutterhead vibration.
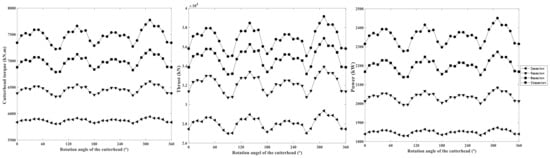
Figure 10.
Variation in torque, thrust, and power under different penetration rate during cutterhead rotation.
3.2.3. Effect of Mechanical Properties of Hard Rock
Here, different types of hard rocks are researched by varying uniaxial compressive strength. Figure 11 depicts the variation in cutterhead torque, thrust, and total power with various rock mechanical properties when the cutterhead is spinning. In the model, Rs is 30% and the penetration rate of the cutterhead is 5 mm/rev. The results show that when the Rs and penetration rate are constant, the values and amplitudes of the torque, thrust, and power rise as the USC increases. Therefore, when planning the excavation routes, rock strata with relatively small uniaxial compressive strength is selected as much as possible.
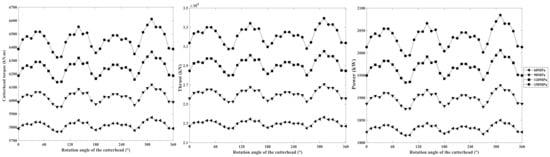
Figure 11.
Variation of torque, thrust and power under different USC during cutterhead rotation.
3.3. Normal and Rolling Forces of Disc Cutters on the Interface between Soft and Hard Strata
In previous studies, the models of cutterhead torque and thrust only, respectively, calculate the force on the disc cutter in soft and hard strata, and there is no research analyzing the force of the cutter at the interface. However, when the cutter is at the interface of soft and hard strata, the calculation method of the cutter force should be different and is difficult to calculate theoretically. Using linear cutting test to study the law of the force may prove a wonderful method. The normal and rolling force data in the cutting process from hard rock to soft rock were recorded in previous linear cutting test [], with penetration rates of 1 mm, 2 mm, 2.5 mm, 3 mm, and 3.5 mm. The test results are used to analyze the evolution of rolling force and normal force when the cutter ratio in soft strata increases at the interface. When penetration is constant, normal force and rolling force both resemble quadratic functions with the ratio of cutter in soft rock, as shown in Figure 12 and Figure 13, and the fitted equations are provided in Equations (38) and (39), which are highly correlated.
where represents the ratio of disc cutter in soft strata; represents the force.
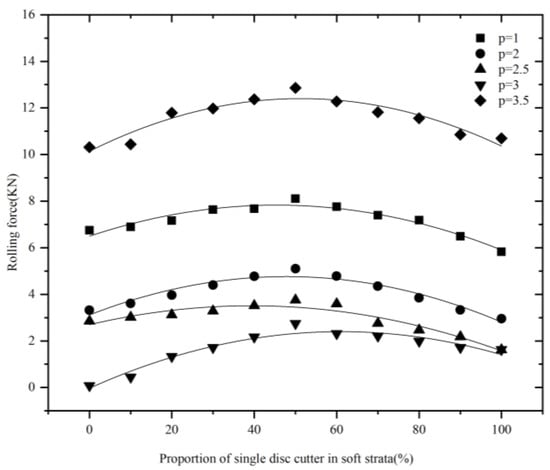
Figure 12.
Relation between proportion of single disc cutter in soft strata and normal force.
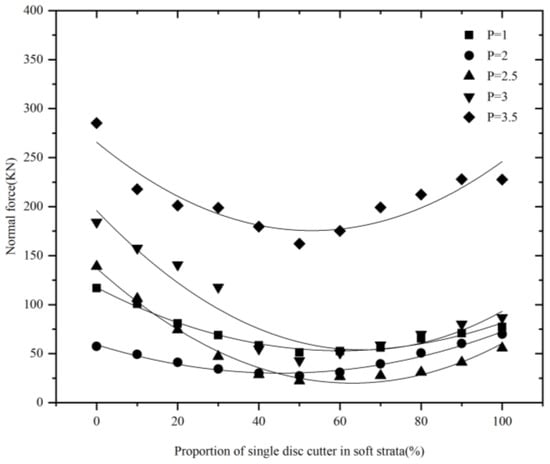
Figure 13.
Relation between proportion of single disc cutter in soft strata and rolling force.
It should be noted that the aforementioned equations are only analyzed based on the test of a composite rock made of granite and sandstone. For specific projects, it is necessary to conduct tests according to different geological conditions to determine the relationship between the proportion of disc cutter in soft rock and the force.
4. Prediction of TBM’s Tunneling Performance
4.1. Building the Relationship between Rs and Power
Figure 14 shows the approximate linear relationship between the percentage of soft ground in the excavation face and the total power. The total power of the TBM gradually decreases with the portion of soft strata growing. We can use Equation (40) to express the relationship:
where is the total power of the EPB TBM; is the percentage of soft strata; it is obvious that the drag cutter is responsible for cutting the strata when the excavation surface is all soft strata, and the disc cutter is responsible for cutting the strata when the excavation surface is all hard strata; the values of and can be calculated using Equation (41).
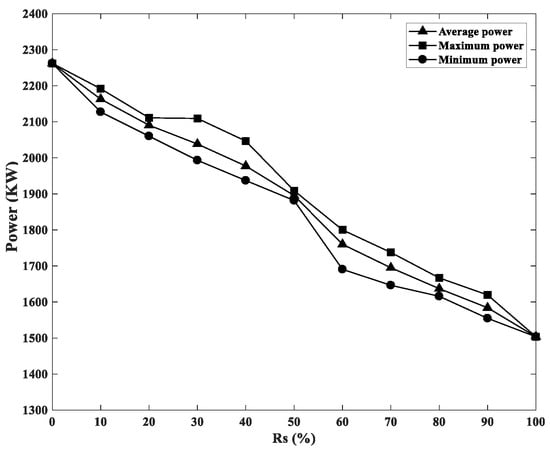
Figure 14.
Relation between soft strata percentage and maximum power, average power, and minimum power.
Substituting Equations (1), (3), and (33) into Equations (40) and (41), the power can be expressed as follows:
where , , , and are the coefficients related to , , , , , , and .
4.2. Performance Prediction Index (MPPI)
There are many indicators available to estimate TBM tunneling performance. Some indices (PRev and PR) are derived from enormous datasets, and such indexes can only be used in some projects. Some indices (for example, FPI and MFPI) are based on the cutting force of a single tool rather than the total cutting force of the cutterhead. As the cutter’s distribution varies with different types of TBM, such indices frequently make mistakes. A new index, the MPPI (mixed-face strata power penetration index), for forecasting TBM tunneling performance in composite strata is proposed, which can be represented as follows:
where is the total tunneling power; is the penetration rate.
Different from previous research, the thrust of both the TBM and cutterhead torque are considered in the MPPI, which can more accurately forecast the tunneling capacity of different types of TBMs under diverse composite stratums. Furthermore, the index is appropriate to RSI composite strata and may be used for multi-layered composite strata, which will be researched in the future.
When MPPI is used to anticipate a machine’s tunneling performance, a low value suggests that the TBM is in a good condition, which indicates relatively easy penetration into the stratum and the machine’s low power consumption. When the value is high, the device may consume a lot of power, or the depth of cutterhead penetration is not sufficient.
4.3. Model Validation
In this part, the data from the 17th section of Guangzhou Metro Line 21 from Zhao et al. [] are used to validate the power model and the index. This section’s 470th to 484th rings are RSI composite stratum; the parameters are taken to the model for predicting power. As shown in Figure 15, the predicted power coincides with the actual power in different strata. Figure 16 depicts the variation in MPPI when the proportion of soft strata takes a different value. When Rs are 52.68% and 54.63%, the values of MPPI are obviously maximum, which fits the practical condition. This result is consistent with that in Zhao et al. [].
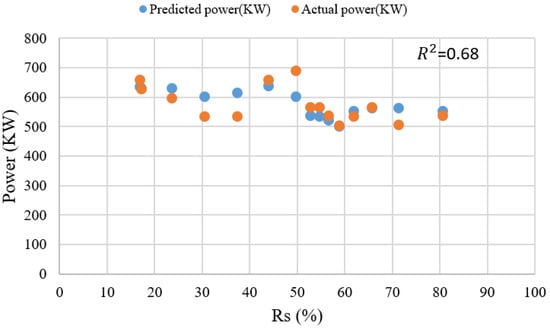
Figure 15.
Actual and predicted power from the 470th ring to the 484th ring.
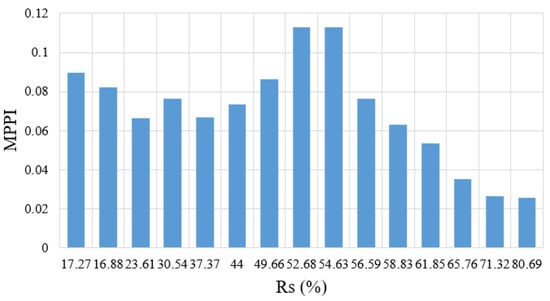
Figure 16.
Relationship between actual MPPI and the percentage of soft strata.
5. Conclusions
In this paper, a theoretical estimation model of TBM thrust, torque, and power in the rock–soil interface (RSI) of mixed ground is developed. In the estimation model, the forces on the drag cutter and spalled soil are analyzed by considering the soil’s frictional forces on the cutter as well as the influence of the chamber pressure on the cutter and soil. Then, a dynamic cutting model including calculations of the thrust, torque, and power is developed. The feature of this model is that it cannot only simulate the arrangement of each tool on the TBM cutterhead used in different actual projects but also change the position and proportion of each stratum according to the geological conditions. The program is created and runs smoothly using the Python platform, which can recognize the numbers and calculate the forces of the disc cutters and drag cutters in the soft and hard strata, respectively. Combining with friction forces and chamber pressure calculated by the program, the variation in torque, thrust, and power are produced.
Subsequently, the MPPI is proposed for predicting TBM performance in composite strata, which considers both the thrust of the TBM and cutterhead torque. It was found that the MPPI can more comprehensively and accurately forecast the tunneling capacity of different types of TBMs under diverse composite stratum circumstances. When the MPPI is used to anticipate a machine’s tunneling performance, a low value suggests that the TBM is in a good condition, which indicates relatively easy penetration into the stratum and the machine’s low power consumption. When the value is high, the device may consume a lot of power, or the depth of cutterhead penetration is not sufficient. The reliability of the index is validated using data from an actual project to offer recommendations for future tunneling projects.
Author Contributions
Conceptualization, S.Z.; Formal analysis, H.T.; Funding acquisition, S.Z.; Project administration, S.Z.; Software, Y.S.; Validation, Y.S.; Writing—original draft, Y.S.; Writing—review & editing, S.Z. All authors have read and agreed to the published version of the manuscript.
Funding
This work was supported by the Tackle Key Problems in Science and Technology Project of Henan Province of China (grant no. 212102210228), and the Cultivation Program for Young Backbone Teachers in Henan University of Technology (grant no. 21420101).
Institutional Review Board Statement
Not applicable.
Informed Consent Statement
Not applicable.
Data Availability Statement
The data presented in this study are available on request from the corresponding author. The data are not publicly available due to private.
Acknowledgments
We wish to thank the Lianyuan Chang for his valuable suggestions and guidance.
Conflicts of Interest
The authors declare no conflicts of interest.
Appendix A
- 1.
- Friction torque acting on frontal surface:
- 2.
- Friction torque acting on circumference surface:
- 3.
- Friction torque acting on back surface:
References
- Zhou, X.P.; Zhai, S.F. Estimation of the cutterhead torque for earth pressure balance TBM under mixed-face conditions. Tunn. Undergr. Space Technol. 2018, 74, 217–229. [Google Scholar] [CrossRef]
- Zhao, Y.; Gong, Q.M.; Tian, Z.Y. Torque fluctuation analysis and penetration prediction of EPB TBM in rock-soil interface mixed ground. Tunn. Undergr. Space Technol. 2019, 91, 103002. [Google Scholar] [CrossRef]
- Song, T.T.; Chen, X.S. A mechanical model of EPB-TBM tunnelling in mixed face strata. Appl. Mech. Mater. 2012, 204–208, 1472–1479. [Google Scholar] [CrossRef]
- Geng, Q.; Wei, Z.; Meng, H. Mechanical performance of TBM cutterhead in mixed rock ground conditions. Tunn. Undergr. Space Technol. 2016, 57, 76–84. [Google Scholar] [CrossRef]
- Zhang, K.Z.; Yu, H.D.; Liu, Z.P.; Lai, X.M. Dynamic characteristic analysis of TBM tunnelling in mixed-face conditions. Simul. Model. Pract. Theory 2012, 18, 1019–1031. [Google Scholar] [CrossRef]
- Rostami, J.; Ozdemir, L. A new model for performance prediction of hard rock TBMs. Proc. RETC 1993, 13–17, 793–809. [Google Scholar]
- Shi, H.; Yang, H.Y.; Gong, G.F.; Wang, L.T. Determination of the cutterhead torque for EPB shield tunneling machine. Autom. Constr. 2011, 20, 1087–1095. [Google Scholar] [CrossRef]
- Ates, U.; Bilgin, N.; Copur, H. Estimating torque, thrust and other design parameters of different type TBMs with some criticism to TBMs used in Turkish tunneling projects. Tunn. Undergr. Space Technol. 2014, 40, 46–63. [Google Scholar] [CrossRef]
- González, C.; Arroyo, M.; Gens, A. Thrust and torque components on mixed-face EPB drives. Tunn. Undergr. Space Technol. 2016, 57, 47–54. [Google Scholar] [CrossRef]
- Yang, Z.; Qi, W.; Jiang, Y. Calculation and Analysis of Reverse Torque of the Earth Pressure Balance Shield. Soil Mech. Found. Eng. 2022, 59, 354–361. [Google Scholar] [CrossRef]
- Qi, W.C.; Wang, L.H.; Zhou, S.Y. Total loads modeling and geological adaptability analysis for mixed soil-rock tunnel boring machines. Undergr. Space 2022, 7, 337–351. [Google Scholar] [CrossRef]
- Cheng, Z.F.; Wang, L.H.; Su, C.X. Mechanical Analysis and Power Modeling on Load of TBM, Mechanical Science and Technology foe Aerospace Engineering. Mech. Sci. Technol. Aerosp. Eng. 2017, 36, 1810–1815. [Google Scholar]
- Rostami, J. Development of a Force Estimation Model for Rock Fragmentation with Disc Cutters Through Theoretical Modeling and Physical Measurement of Crushed Zone Pressure. Ph.D. Thesis, Colorado School of Mines, Golden, CO, USA, 1997. [Google Scholar]
- Bruland, A. Hard Rock Tunnel Boring. Ph.D. Thesis, Norwegian University of Science and Technology (NTNU), Trondheim, Norway, 1998. [Google Scholar]
- Hassanpour, J.; Rostami, J.; Zhao, J. A new hard rock TBM performance prediction model for project planning. Tunn. Undergr. Space Technol. 2011, 26, 595–603. [Google Scholar] [CrossRef]
- Delisio, A.; Zhao, J.; Einstein, H. Analysis and prediction of TBM performance in blocky rock conditions at the Lötschberg base tunnel. Tunn. Undergr. Space Technol. 2013, 33, 131–142. [Google Scholar] [CrossRef]
- Steingrimsson, J.H.; Grov, E.; Nilsen, B. The significance of mixed-face conditions for TBM performance. World Tunn. Congr. 2002, 15, 435–441. [Google Scholar]
- Tóth, Á.; Gong, Q.; Zhao, J. Case studies of TBM tunneling performance in rock–soil interface mixed ground. Tunn. Undergr. Space Technol. 2013, 38, 140–150. [Google Scholar] [CrossRef]
- Vergara, I.M.; Saroglou, C. Prediction of TBM performance in mixed-face ground conditions. Tunn. Undergr. Space Technol. 2017, 69, 116–124. [Google Scholar] [CrossRef]
- Deng, K.S.; Li, Y.Y.; Zhang, X.M. Optimal Layout Design for Thrust Systems in Earth Pressure Balance Shield Machines Under Sudden Loads. Arab. J. Sci. Eng. 2021, 46, 2793–2802. [Google Scholar] [CrossRef]
- Li, Z. Study on the Correlation between 7 m Shield Tunneling Parameters in Shenzhen Composite Formation. Master’s Thesis, Beijing Jiaotong University, Bejing, China, 2016. [Google Scholar]
- Wang, H. Study on Tunneling Parameters of Shield Construction in Upper Soft and Lower Hard Composite Formation. Master’s Thesis, Anhui Institute of Architecture and Technology, Hefei, China, 2012. [Google Scholar]
- Guan, H.S. Calculation Model Study of Key Parameters and Mechanical Behavior of Earth Pressure Balance Shield Machine. Ph.D. Thesis, Southwest Jiaotong University, Chengdu, China, 2007. [Google Scholar]
- Xia, Y.M.; Yang, M. Effect of Blade Angles on the Shovel Muck Capacity and Wear Characteristics for TBM Scraper. Arab. J. Sci. Eng. 2021, 46, 5203–5218. [Google Scholar] [CrossRef]
- Zhou, X.P.; Zhai, S.F. Experimental Study of the Mechanism of TBM Disk Cutter Penetration in MixedFaced Grounds under Confining Pressure. J. Test. Eval. 2020, 48, 2270–2294. [Google Scholar] [CrossRef]
Disclaimer/Publisher’s Note: The statements, opinions and data contained in all publications are solely those of the individual author(s) and contributor(s) and not of MDPI and/or the editor(s). MDPI and/or the editor(s) disclaim responsibility for any injury to people or property resulting from any ideas, methods, instructions or products referred to in the content. |
© 2024 by the authors. Licensee MDPI, Basel, Switzerland. This article is an open access article distributed under the terms and conditions of the Creative Commons Attribution (CC BY) license (https://creativecommons.org/licenses/by/4.0/).