Abstract
A deficit in short-term memory (STM) functions characterizes many neurodevelopmental disorders, in particular, specific learning disorders. Hence, there is a need to develop a web-based platform capable of testing specific variables and administration conditions in a controlled manner. The platform herein presented allows for the assessment of short-term memory (STM) items and order components in a series of different conditions. Stimulus types, presentation, and response modalities were appropriately selected to assess the impact of those variables on memory performances. The usefulness of such a systematic, fine-grained analysis of STM functions was tested by applying the complete assessment in a group of 100 school-age children (47 Typically Developing children and 53 children with learning disorders) and evaluating the capacity of the software to highlight different specific memory processes activated during reading, writing, and calculation. A cluster analysis was applied to the learning performances of the whole group, and a four-cluster solution representing the best division into subgroups of learning disorders (affecting reading, writing, and mathematical skills, variously combined) also showed clear-cut differences in the children’s STM profiles. This confirms the potential and the usefulness of the tool for the characterization of STM in school-age children.
1. Introduction
The aim of the present study was to investigate the utility of software specifically designed to test a wide range of short-term memory (STM) abilities in children with learning disorders. More specifically, the focus was on the capacity of the tool to highlight different STM profiles for different subgroups of learning disorders.
Many tasks or activities of daily life involve short-term memory (STM) and working memory (WM). In fact, there is hardly a task that can be completed without the involvement of these systems, making them critical components of cognition. The processes that create and operate on representations include encoding and maintenance activities and rehearsal and retrieval mechanisms [1]. In addition, it is necessary to account also for forgetting processes, caused by either rapid information decay or interference [2,3].
Different approaches and theoretical models have been developed to study the processes involved with STM and WM. The definitions of, and distinctions between, STM and WM vary depending on the theoretical approach and on the wide variety of techniques that can be used to explore WM (see [4]). It could be argued that WM and STM significantly overlap, and might even be the same thing, especially if we consider the existence of similar decay and capacity limits in both. The term “working memory” became much more dominant in the field after Baddeley and Hitch [5] demonstrated that a single module could not account for all kinds of temporary memory. The concept of modality-specific buffers for the temporary storage of information (see [5,6]) refers to two stores (the “phonological loop” for auditory information and the “visuospatial sketchpad” for visual information) governed by a “central executive” that controls and mediates between these two components, processes information, directs attention, sets goals, and makes decisions. This model of separate memory systems has been the subject of several discussions that led to multiple alternative frameworks, each of which is supported by empirical evidence [7,8,9].
Some approaches emphasize the synergic effect of both attention and memory to store the pieces of information that are relevant to the current task and keep them active, while simultaneously stopping the non-relevant ones. Other approaches consider WM as the activated portion of long-term memory (LTM) and emphasize the role of attention resources and control processes [10,11,12]. As well described by Cowan [13], WM has been conceived and defined in three different, slightly discrepant ways as follows: as STM applied to cognitive tasks, as a multi-component system that holds and manipulates information in STM, and as the use of attention to manage STM. The main distinction is that WM refers to the ability to use, manipulate, and apply memory for a period of time (for example, recalling a set of instructions as you complete a task), while STM refers only to the temporary storage of information in memory [13]. Moreover, the attentional and executive components should be involved mainly in WM activities and significantly less in simple, passive short-term storage tasks [4].
The present study more specifically addresses STM, viewed as the capacity to store a small amount of information, keep it readily available for a short period of time, and release it without any manipulation.
To start with, the processing and storage of verbal and visual materials occur in different buffers and have distinct neural correlates. Verbal STM is especially supported by the left hemisphere, in particular, by the left inferior frontal and the left parietal cortices [14]. Visual short-term memory (V-STM), involved in the brief storage of visual information, consists of two components. Spatial information includes information about the spatial positions of stimuli while object information includes the storage of non-spatial visual features related to object identity. Although no consensus has been reached as to where V-STM resides in the human brain, there is evidence indicating that the posterior parietal and inferior temporal regions are involved in the retention of visual information (see [14,15,16]).
In contrast to the wealth of data and theoretical progress relating to verbal STM, there has been comparatively less research exploring the issue of serial order in the visuospatial domain [17]. Moreover, there is now increased interest in visual STM for serial order for various kinds of nonverbal stimuli.
Several experiments investigated the involvement of STM in its variants depending on (i) different sensory input and output modalities (e.g., auditory–verbal, visual–verbal), (ii) the presence/absence of either articulatory suppression or distractors, (iii) the request to remember not only the items shown (STM for item, henceforth, MI) but also the order in which they were presented (STM for order, henceforth, MO) [18,19,20,21].
Item and order are two critical dimensions of STM. MI usually consists of the units that define the information to be retained. On the other hand, serial order information (MO) concerns information about the temporal sequence of units within a list of stimuli. Forward serial order seems to be the preferred mechanism of memory to recall information, even when the tasks do not require it [22,23].
Neuroimaging studies also reveal the involvement of distinct neural substrates for the retention of item and serial order information and possibly shared neural substrates for the retention of serial order information in verbal and visual–spatial modalities [20]. There is evidence supporting the existence of an STM network in retaining an abstract representation of serial order information, independently of content information, namely, the nature of the item to be remembered, which is stored separately [24]. Serial order has been specifically studied to explain how verbal items are encoded in the phonological loop system. These verbal codes, being sound-based and inherently sequential, represent information about individual phonemes as well as about their serial order by keeping track of the associations among temporally adjacent items. Behavioural, neuropsychological, and neuroimaging evidence was discussed by Majerus [25].
The aforementioned evidence points to (i) two separate buffers of verbal and visual-spatial short-term memory subsystems [5,26], (ii) distinct neural substrates for the retention of item and serial order information, and (iii) shared neural substrates for the retention of serial order information in verbal and visual–spatial modalities [20]. This provides new interpretation keys to better understand the processes involved in learning and, more importantly, in specific learning disorders.
Memory and working memory are involved in fluid reasoning [18,27,28] and in a variety of academic problems and clinical conditions that affect children and adolescents (e.g., [29,30,31]). Indeed, there is substantial evidence that WM and STM impairments play a critical role in mediating some of the academic problems in children with Reading Disabilities (RDs) and Math Disabilities (MDs) (for a review, see [32,33,34]). More specifically, serial order STM is responsible for the storage and retrieval of the phonemes constituting a new word in the correct order and thus contributes to the development of long-term phonological representations [35,36,37]. Moreover, sequential processing abilities recruited in serial order STM tasks play a critical role in language development and vocabulary learning (see [35,36]). Other studies have shown a correlational relationship between measures of phonological loop function and both first and second language acquisition [37,38,39].
Crucially, STM in its various expressions is a factor that may increase or decrease the likelihood of co-occurring reading, spelling, and calculation difficulties in children with specific learning disorders [40]. Indeed, STM can be easily viewed as both a distal (as a general process) and a proximal cause [41,42,43] of learning disorders, because of to its many components and facets, which can be linked to specific components of learning abilities. Indeed, although deficits in memory skills have been consistently reported in individuals with specific learning disorders including dyslexia, dysgraphia, dyscalculia, and dysorthography, it is far from clear which memory systems are affected [33]. Moreover, visual–spatial STM, as well as phonological STM, have been shown to play a role in learning mathematics. In this domain, visual–spatial skills are involved in several tasks, such as quantity judgements and mental calculation [44,45,46].
2. Assessment of Item and Serial Order Memory
Verbal memory is typically assessed through repetition of a series of presented items (usually letters or digits) in the same or reversed order, i.e., forward and backward memory span. There is evidence that the type of verbal material used in the span tasks may lead to significant differences in individuals’ spans. In particular, the effects typically described in STM tasks have to do with stimulus length (“length effect”: [47]), phonological similarity, and lexicality [48]. Similarly, visual short-term memory is measured through tasks that require the subject to recognize and retain a small amount of visual information (letters, shapes, colours, etc.) over a short period of time. Tasks generally used to measure STM are serial recall or serial reconstruction, in which the items in the sequence are simultaneously represented in a random arrangement and the participant must sort them back into their presentation order. When the task of recalling items in a visual presentation is accompanied by articulatory suppression, performance becomes more difficult [49,50]. The effect of articulatory suppression [49] hampers the possibility of recoding visual material in a phonological form. Therefore, articulatory suppression is widely interpreted as disrupting the translation into the verbal form of visually presented items for temporary memory prior to recall. In other terms, it can be considered as a means to obtain information on purely visual memory functions.
Order information (i.e., the sequential order in which the items are presented) and item information (i.e., the items, such as words/nonwords, digits, and objects presented orally or visually, to be recalled after presentation) are typically not separated in STM assessment tasks, but, as discussed above, they may provide important information on which processes have an impact on learning abilities in children [51].
Summing up, the scientific literature provides sufficient evidence suggesting that measuring several different components of memory may be important since each one is related to different but equally relevant aspects of cognitive functioning and learning. In order to design and develop a digital application that would allow for the assessment of the relevant STM variables, we analysed the assessment tools that were already available, both at the international and national levels. The focus of the analysis was the possibility of assessing different components of memory and the accuracy with which differences among components could be highlighted.
Several tools have been designed to measure memory functions. The Wechsler Intelligence Scale for Children Fifth Edition [52] has increased the breadth of construct coverage by including a visual working memory subtest. Within the Working Memory Index (WMI), the Picture Span (PS) subtest requires one to memorize one or more pictures presented on a stimulus page and then identify the correct pictures (in sequential order, if possible) from a series of options on a response page. The discrepancy scores on the Digit Span and the Picture Span subtests can be clinically meaningful [53] and inform the interpretation of the WMI. Ancillary index scores such as the Auditory Working Memory Index (AWMI—derived from Digit Span and Letter–Number Sequencing subtests) are also provided.
A revision (TOMAL-2 Second Edition, published by PRO-ED 2007) of the Test of Memory and Learning (TOMAL; [54]) is regarded as the single most comprehensive memory battery available for a wide range of ages (ages 5 to 59). The TOMAL-2 [54] assesses memory verbal and nonverbal memory functions. As acknowledged in the manual, the assessment of memory takes place following various theoretical approaches [55]. The Digits Forward subtest is a traditional digit recall subtest; however, unlike most digit recall subtests (which typically assign a point for each correctly recalled series), a point is awarded for the correct recall of each digit within the series where it was presented. The same scoring rule applies to the Digits Backward subtest, but the correct placement of a digit in reverse order is required in this case (see review by [55]). The point is assigned if the digit is reported in exactly the same position as in the target sequence (or in the reversed sequence), but no correction is foreseen for the case in which a single item is missing or added, causing all the other items to be misplaced in the sequence. This was considered a crucial issue in the present study, and special procedures were considered for the correct assignment of each item to a specific position and thus, the correct scoring of each item.
In the Italian context, the Visual–Spatial Working Memory (VSWM) battery [56] is designed to investigate visuospatial working memory abilities with respect to the active and passive nature of the tasks. It also distinguishes among the visual, spatial–sequential, and spatial–simultaneous subcomponents of VSWM [57]. Also, the Childhood Memory and Learning Abilities Battery (PRO-MEA by [58]) evaluates verbal and visual STM in children. More specifically, it provides a CD-Rom allowing for the evaluation of visual span and spatial span with figurative materials.
Several tests are available in computerized form. Existing assessment tools may include different variants of STM in various target domains. For instance, the Cambridge Neuropsychological Test Automated Battery (CANTAB®; Cambridge Cognition 2012) is often used to evaluate visual short-term memory (VSTM) in children. CANTAB is a computerized system of neuropsychological tasks based on the presentation of images on a touch-sensitive computer screen. The subject responds directly to stimulus images on the screen, thus making verbal responses unnecessary. The battery includes typical memory tasks originally developed in manual/verbal form in adult neuropsychology, as well as some original tasks such as the Pattern Recognition Memory—PRM task. A series of visual patterns is presented to the subject, one at a time, in the centre of the screen. These patterns are designed so that they cannot be easily verbalized. In the recognition phase, the participant is required to choose between a pattern they have already seen and a novel pattern. Additional tasks are the spatial span (SSP) task and the Paired Associates Learning (PAL) task, measuring different aspects of VSTM including spatial memory and visual–spatial memory, respectively.
Another example of a computerized platform is the Cognitive Assessment Battery (CAB) for Memory (CAB-ME) from CogniFit, which is a personalized, online cognitive assessment and training program (https://www.cognifit.com/it/en/memory-test) (accessed on 24 April 2024). This tool consists of a series of tests and a variety of tasks designed to evaluate the presence of symptoms, traits, and dysfunctions in the cognitive processes associated with memory and short-term memory. The test is intended for children over seven years old, adolescents, and adults. The following cognitive skills are included: phonological short-term memory, short-term visual memory, short-term memory, working memory, and non-verbal memory. The Recognition Test WOM-REST requires, for example, the user to memorize the order in which the objects appear (a trio of figures) on the screen. The trio of figures is then removed from the screen and four trios of figures are displayed, but only one of them is identical to the one previously shown. The user has to identify which of the options is identical to the original trio.
Some tools have the twofold purpose of testing and training memory functions.
TrainingCognitivo, an Italian computer-based online tool, includes more than 30 freely accessible web apps (https://www.trainingcognitivo.it/GC/funzioniesecutive/) (accessed on 24 April 2024) and several games involving different components of STM and attention, both for serial and for item information, where serial order refers to whole sequences and not to single items. The web apps can be used to design personal memory empowerment plans.
CogniFit (http://www.cognifit.com/) (accessed on 24 April 2024) is a digital tool for the assessment (https://www.cognifit.com/it/en/cognitive-test) (accessed on 24 April 2024) and empowerment of several cognitive functions including memory. The tool has been validated on participants with various disorders, including students with dyslexia [59]. Different game targets are provided to retain visual information for a short period of time or to encode, store, and retrieve information from memory about sensory stimuli without verbal content. CogniFit’s memory games are designed for adults and kids and automatically adjust the type and difficulty of the memory games to each user’s specific characteristics (like age, cognitive damage, deficits, etc.). On this platform, typical tasks to train visual memory require recognition of a target figure among a set of distractors that show visual features similar to the target stimulus. For example, the user is asked to recognize visual stimuli presented in the centre of the screen for a given time lapse by repeating their order of presentation or clicking on the target figure among a set of figures that appear in cascade on the screen for a given interval of time. On the platform, sequential memory is trained through activities characterized by the presentation of stimuli (visual or auditory) one after the other. The respondent must reproduce the provided sequence by (i) clicking on the items either according to the order they were presented or in reverse order or (ii) recognizing the proposed sequence (auditory or visual) between performed sequences composed of the same elements. In contrast, simultaneous memory is enhanced through activities in which sets of items (e.g., geometric shapes, fruits, or animals) are presented simultaneously: the user then must recognize the set of elements among other sets in which the same elements are randomly positioned.
Jungle Memory JungleTM (2008) is a memory training program that is available on the web to improve working memory. JM is designed for children from 7 to 16 years old and involves memorizing words and word endings, mental rotation of letters, and sequential memory of mathematical solutions. Each game provides training with increasing levels of difficulty and provides feedback on progress. User motivation is stimulated by positive verbal feedback, a display of the user’s best scores, percentile rankings, and the number of “super Monkeys” collected as a result of successfully completing the training levels.
Table 1 presents a summary of the main characteristics of some of the most common tests used for STM assessment in children, highlighting available information about the effects related to the manipulation of relevant design variables, including information retrieval (recall vs. recognition), presentation modality (auditory vs. visual), sequentiality (sequential vs. simultaneous presentation), and STM type (item vs. order). The STM domain is described as visual (recall of visual stimuli, including shapes, images, and colours retained briefly within our cognitive system [60]), verbal (related to encoding, storing, and retrieving verbal information [61]), spatial (pertaining to the storage and recall of spatial information, such as the locations or layout of objects within an environment [62]), or sensory (relating to the capacity to retain impressions of sensory information after the original stimulus has ceased [63]). Please note that the list is not exhaustive and that it only includes tools available in either English or Italian. Regarding the type of retrieval, recall refers to tasks where items can be remembered without any binding order, whereas recognition refers to the request to identify information as having been encountered previously.

Table 1.
Characteristics of commonly used STM assessment tools.
Overall, despite the large variety of computerized tests available for STM assessment in children, none of the available tools provides the possibility to test simultaneously all the variables that have proved to play a role in STM for order and in STM for item for both experimental and clinical purposes. Moreover, the measures derived from the tests are often not very fine-grained (e.g., recall or recognition of whole series, forward and backward spans, etc.), which is of course justified for the sake of simplicity and ease of administration if the test is manually delivered and scored but becomes unnecessary in the case of computerized assessment. Hence, there is a need to develop a computerized platform capable of manipulating design variables and administration conditions in a controlled manner. The ultimate purpose of the platform is to enable the assessment of the specific memory processes involved in children’s educational performances, i.e., in reading, writing, and calculation processes (for a review, see [32,33,34]). Although the software has already been validated with dyslexic children [51], its application in other types of learning disorders has not been investigated.
The aim of the present study is thus to assess the utility of testing multiple memory processes (by systematically manipulating variables such as stimuli, sequential or simultaneous presentation, auditory or visual modality of presentation and feedback, articulatory suppression, and the presence/absence of distractors) and the possibility of identifying associations with different learning processes (reading, writing, and calculation). More precisely, the research question is whether the various subtests and sub-scores that have been designed for the software (STM Suite) v.1. are useful to characterize different types of cognitive processes linked to different academic domains. This can be crucial for the design of personalized, tailor-made treatment programs for children with learning disorders.
3. Methods
3.1. Participants
One hundred participants were included in this study (NB: “the 20 children with dyslexia and 20 one-to-one-matched TD children described in the previous paper by Giorgetti and Lorusso [51] were taken from the sample of 100 children described in the present manuscript”). Of these, 47 children had been diagnosed with SLD at the Scientific Institute “E. Medea” and other clinical centres and 53 were recruited in schools of the Milan area (both from the city centre and from the periphery, so as to represent wide-ranging SES profiles as the ones observed in the clinical sample). All children attended school on a regular basis (grades from the 3rd year of primary school to the 3rd year of middle school: 3–8) and were L1 Italian speakers. All parents signed informed consent.
3.2. Materials and Procedures
The participants were administered a set of clinical tests of literacy skills and an extensive battery of computerized STM tasks. The children were tested individually in a quiet room in their school or at the clinician’s office. Administration of all tests followed a fixed order and required two non-consecutive one-hour sessions (no more than one week apart). The STM battery was divided into two pre-programmed sequences allowing us to counterbalance the order of STM conditions across sessions. Each session included both learning-related tasks and STM tasks. The STM battery was administered through a laptop computer (ASUS, Lenovo, Taipei, Taiwan).
3.2.1. Standardized Learning Tasks
Reading of single words and nonwords. This test is included in the “Batteria per la Valutazione della Dislessia e Disortografia Evolutiva, DDE-2” (Battery for the assessment of Developmental Reading and Spelling Disorders) by Sartori, Job, and Tressoldi [69,70]. This test assesses speed and accuracy (expressed in number of errors) in reading word lists (4 lists of 24 words) and nonword lists (3 lists of 16 non-words). In the word reading subtest, special attention is given to words with irregular (less frequent) stress assignments, in order to assess the lexical route to reading specifically.
Writing of single words and nonwords (spelling tests). These tests were also obtained from the DDE-2 battery, which includes three dictation tasks, giving accuracy scores in writing words (48), non-words (24), and sentences (12) from the second grade to the last grade of junior high school.
Number reading and writing, counting, and calculation. The following subtests of the BDE—Batteria per la Discalculia Evolutiva (Battery for developmental dyscalculia [71])—were used to assess mathematical skills:
- i.
- Mental calculation: the children were asked to perform mental addition and subtraction calculations below 10, orally presented.
- ii.
- Multiplications: the children were asked to solve simple calculations verbally. The items consist of Multiplication Tables (e.g., 7 × 4, 8 × 3), orally presented.
- iii.
- Counting backwards: the children were asked to count backwards aloud from 100 to 50.
- iv.
- Number writing: the children were asked to write dictated numbers in Arabic form on a sheet of paper. The numbers could be 2 to 4 digits long.
- v.
- Number reading: the children were asked to read aloud three or four lists of numbers (the same used in the number writing subtest) depending on grade.
The time and number of errors for each of the above tasks were manually recorded by an experienced and trained experimenter.
Z-scores were calculated for each test based on age norms.
3.2.2. The Web-Based Assessment Platform “STM Suite”
In order to assess STM for item and order, a dedicated (tailor-made) program was developed and implemented on the LAMP platform, with the use of the library “jquery”, which is available both as an online and desktop application, either through the use of a local web server on different operating systems or by means of “portable web server” applications.
The online version and the desktop version are comparable in terms of their interface, reaction time function, and measurement precision, as detected in the “client” part of the program. Hence, they are independent of network transmission latency times.
The platform provides 18 testing conditions, resulting from the possible combinations of design variables. Each condition consists of 10 trials and an additional example (trial 0) to allow participants to familiarize themselves with the task. The full design structure is illustrated in Table 2.

Table 2.
Design variables and software structure (STM Suite).
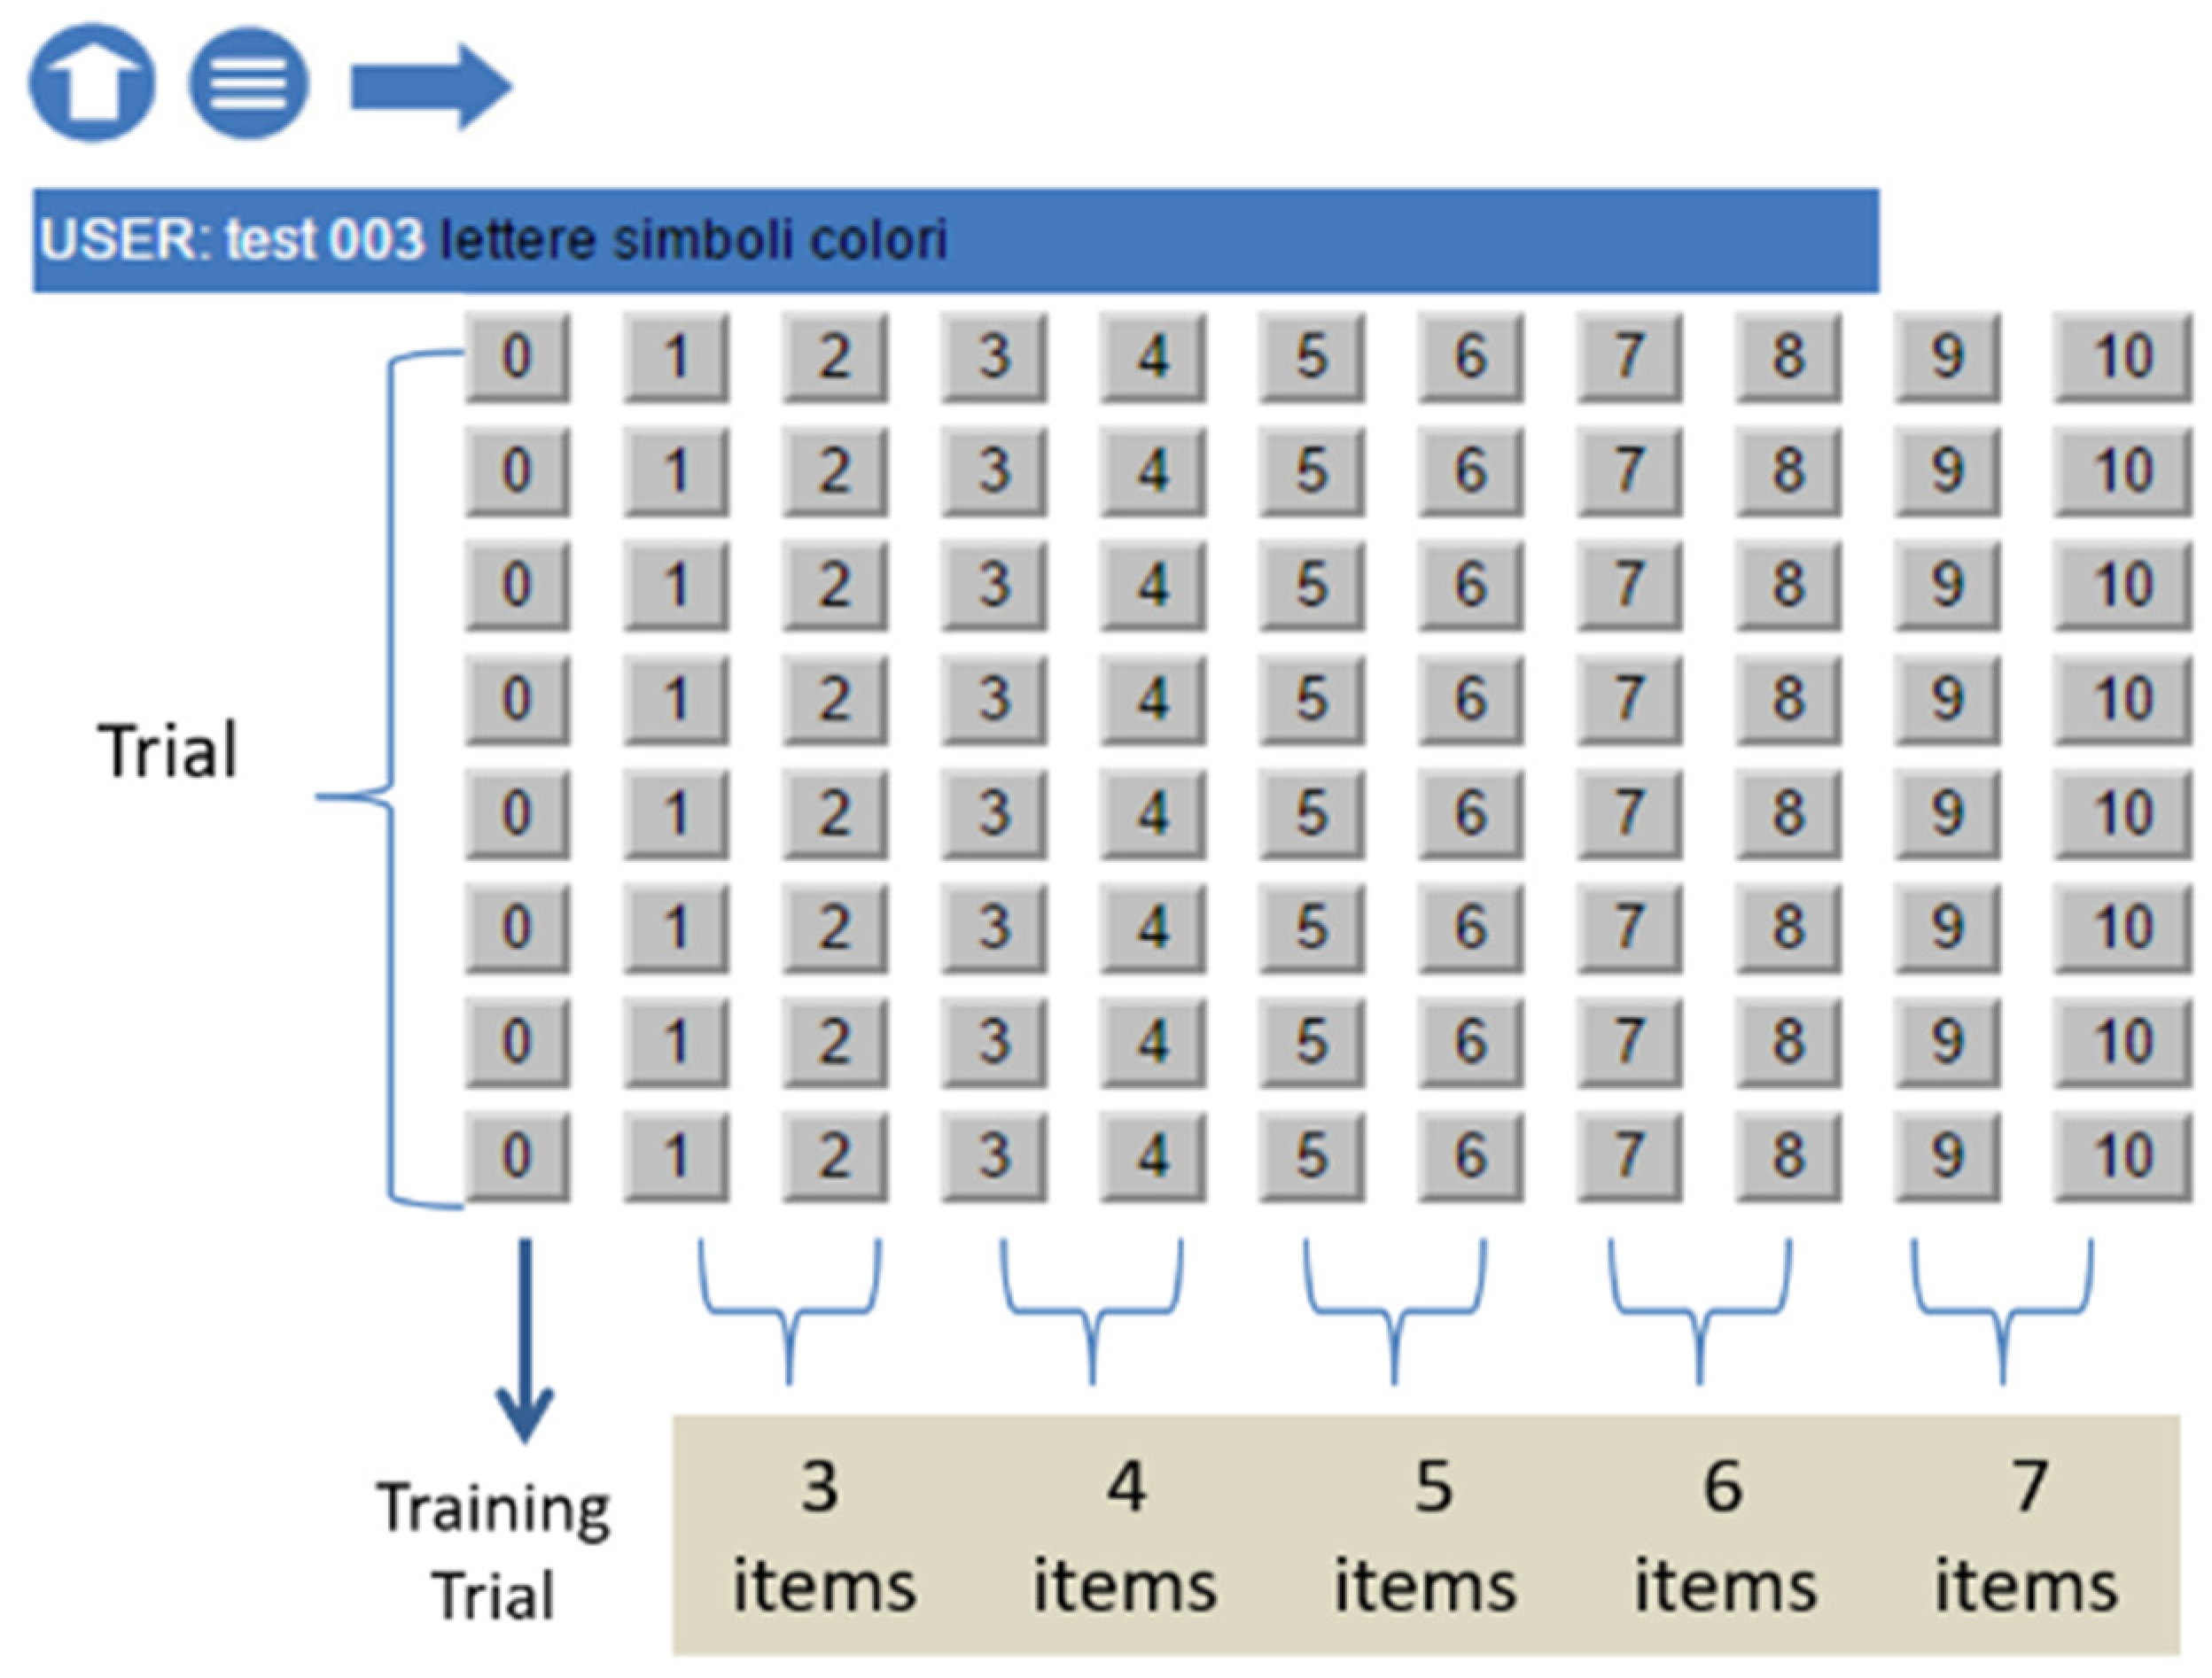
The two lists of the first trial pair contain 3 items, the second pair 4 items, and so on, adding one item per trial pair until the last one with 7 items. There are thus five discontinuities in difficulty, from 3 to 7 items (see Figure 1).
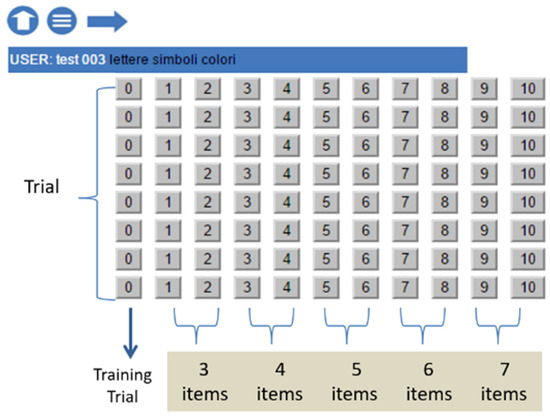
Figure 1.
“STM Suite”: trial and item structures.
The combination of input/output variables produces the following four possible conditions: visual–visuomotor (reconstruction), visual–oral (verbal retrieval), auditory–oral (verbal retrieval), and auditory–visual (visual reconstruction). This inevitably entails a high number of levels and conditions.
Letter stimuli were B, C, D, F, G, H, L, M, N, P, Q, R, S, T, V, and Z (consonants to avoid lexicalization), shown as capital black letters in white rectangles in the visual presentation. Colour stimuli included 15 coloured rectangles (pink, blue, black, purple, green, grey, orange, yellow, brown, sand, fuchsia, blue, gold, white, and red), the same size as the ones containing letters.
Letters and colours are discrete units whose visual representation, contrary to words, does not require any scanning from left to right. This should allow for a certain degree of comparability between the two types of stimuli. Furthermore, letters and colours have a lexical equivalent and also a unique visual representation. Letters and colours are additionally comparable in terms of the ease of naming and approximate range of possible elements, and, as such, they can easily be used in the auditory presentation modality.
On each list, the order of both letters and colours was carefully checked in order to avoid the occurrence of highly frequent combinations, e.g., special bigrams (corresponding to single phonemes, e.g., CH, SC, or GN) or combinations of letters that are very frequent in the Italian orthography (e.g., CL, MP, TR). An attempt was made to avoid sequences of similar colours (e.g., sand/pink; grey/sand; light blue/grey; sand/gold, etc.) or combinations of culturally salient colours (i.e., sequences of colours that are reminiscent of football teams or familiar national flags, or of frequently opposed elements such as black and white) (see [72]). Furthermore, an effort was made to ensure that consecutive colours were not phonologically similar (e.g., rosa–rosso [pink–red]) and that letters always differed by more than one single phonetic trait to avoid phonological interference between consecutive items.
In all conditions, two lists were presented for each length (number of items). For conditions with visual presentation, lists of the same length belonging to a pair had identical characteristics except for the presence/absence of AS, and they were administered in the same block in an alternating pattern. Thus, the first list was the 3-item one without AS, followed by the 3-item one with AS, followed by the 4-item one without AS, followed by the 4-item one with AS, and so on, with the last possible list being the 7-item one with AS. Since no AS could be applied in auditory input conditions, the alternation schema was preserved through the use of parallel (no-AS) lists of identical lengths. Hence, in the case of auditory presentation, the initial 3-item list was followed by another different 3-item list, then by a 4-item list, then by a different 4-item list, and so on (all without AS). Before the start of the first list of a new block, a training trial was administered to facilitate task comprehension.
Letters were presented visually, printed in capital, Lucida Handwriting fonts, while their auditory/oral counterpart was their own exact spelling. Colour stimuli included 15 nuances, chosen from those considered most familiar and recognizable by children (pink, #FFC0CB; blue, #0000FF; black, #000000; violet, #EE82EE; green, #008000; dark grey, #A9A9A9; orange-red, #FF4500; Yellow, #FFFF00, saddle brown, #8B4513; beige, #F5F5DC; fuchsia, #FF00FF; powder blue, #B0E0E6; gold #FFD700; white, #FFFFFF; red, #FF0000). The whole set of stimuli along with their names (used in the auditory presentation condition) is provided in the Supplementary Materials (Figure S1).
All stimuli could be presented in either the visual or the auditory/verbal modality. Stimuli presented in the visual modality could appear either in sequential presentation (one after the other, with a 500 ms interval) or in simultaneous presentation mode (altogether, with an exposure time equal to 1000 ms for each presented item). The presentation sequence was as follows: (a) appearance of a point of fixation; (b) appearance of the stimuli to be memorized in the upper half of the screen (in sequential or simultaneous modality); (c) disappearance of the previously presented stimuli; and (d) the subsequent reappearance of the same items, but in a different order, with or without distractors.
In the visual stimulus presentation modality, stimuli (coloured rectangles or letters) appeared on the screen, either at the centre of the screen (sequential modality: each stimulus lasted for 0.5 s, with ISI = 0.5 s) or in a horizontal row (simultaneous modality: the full list was displayed for N s, with N = list length). In the auditory stimulus presentation modality, stimuli were colour names or letter names previously recorded with an Italian mother-tongue female voice lacking any inflexion or specific intonation, presented sequentially via headphones (ISI = 0.5 s).
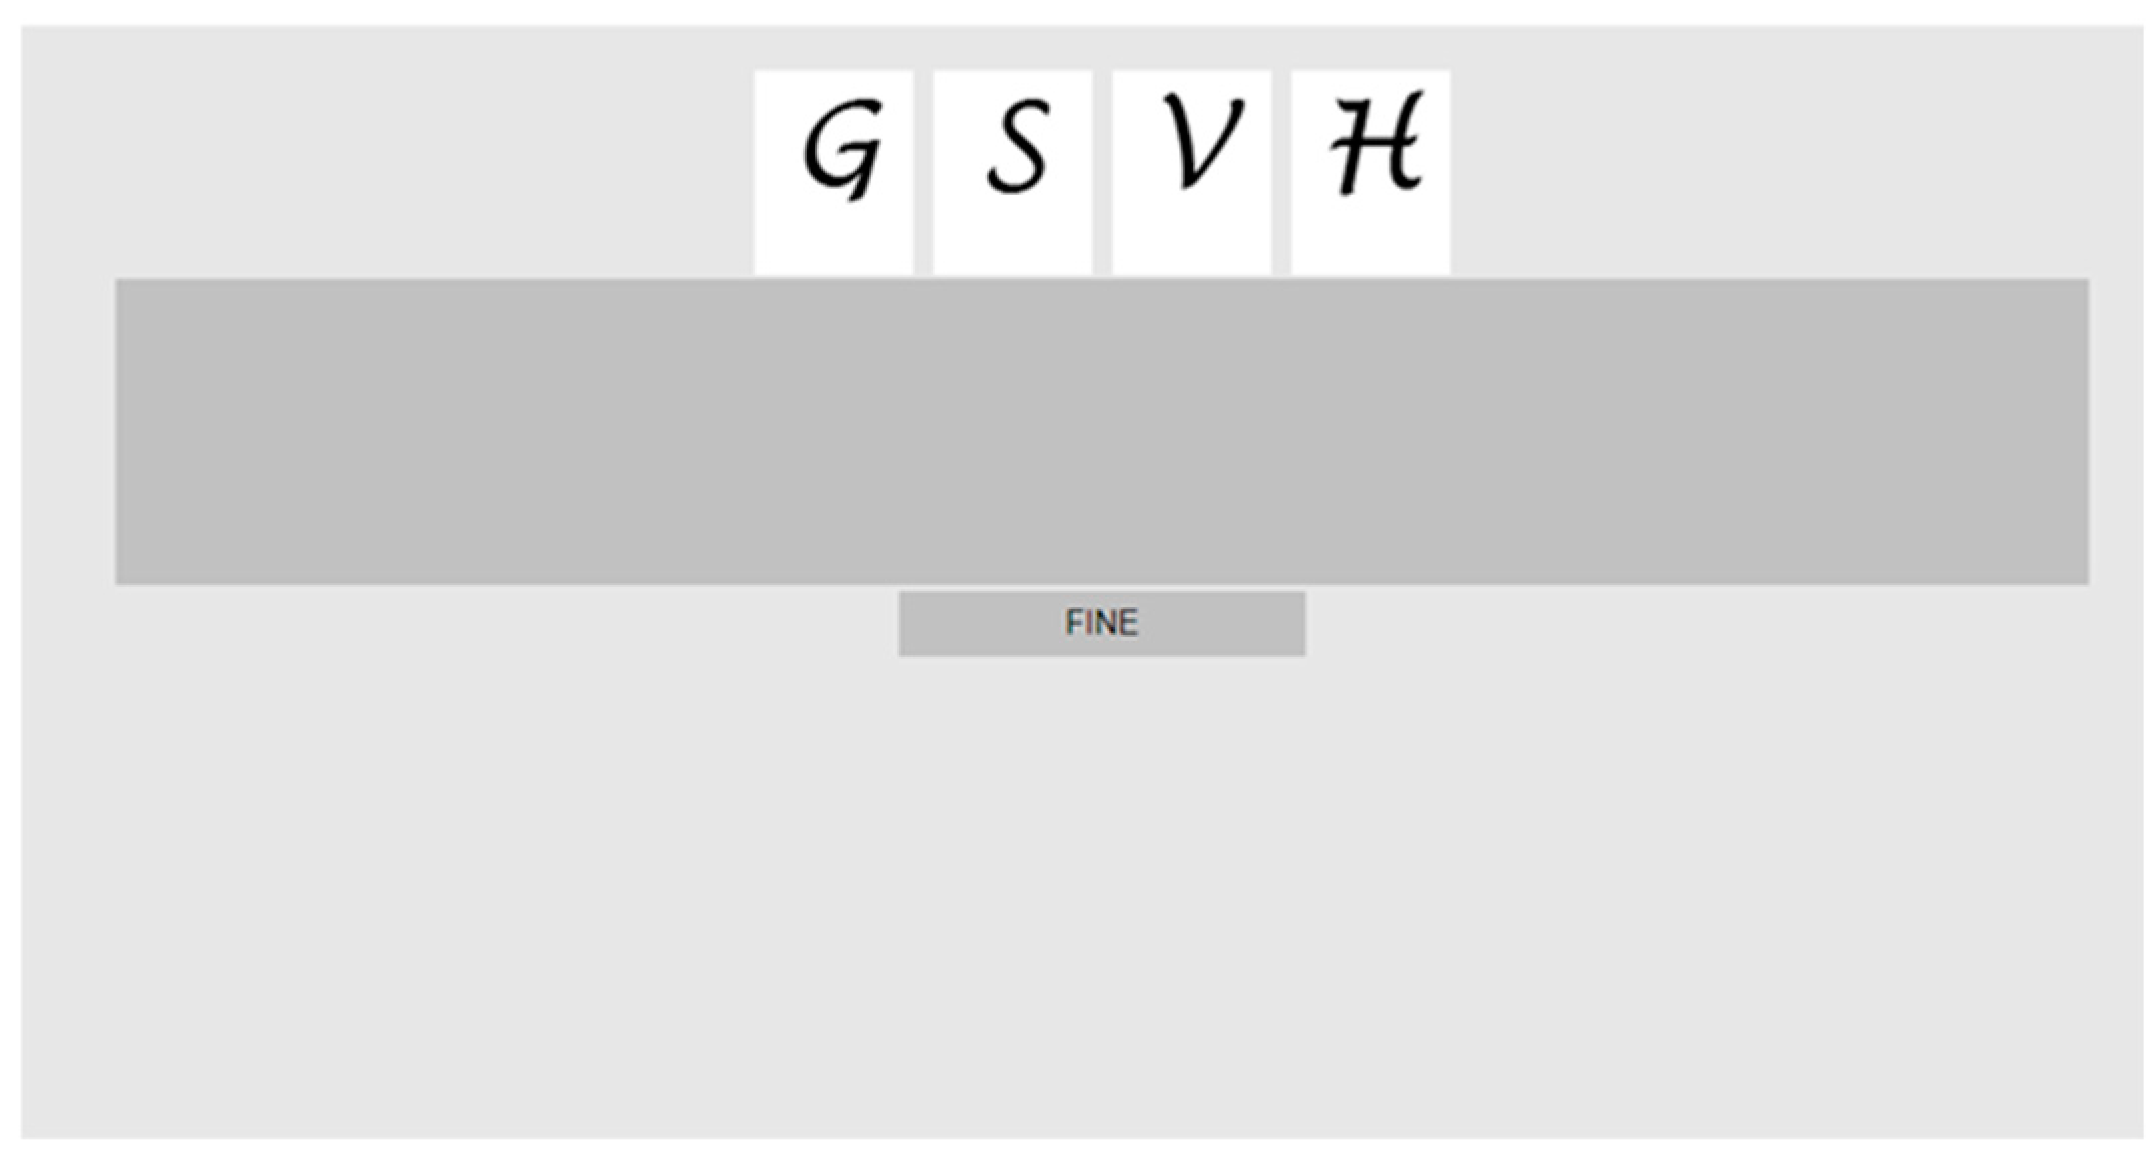
The response could be either oral or visual–motor. In the “oral response” modality, participants simply had to repeat the list of items they had just been presented with, in the correct order. By contrast, in the “visual–motor” response modality, after having been administered a stimulus list, the subjects were shown a set of (random order) candidate items on the screen and had to reconstruct the original list by dragging them with the mouse pointer, dropping them (one by one) in a horizontal row within an empty, standard dark grey rectangle (the response list space), and, finally, clicking “end” to indicate that response was complete and they were satisfied with the provided sequence (Figure 2).
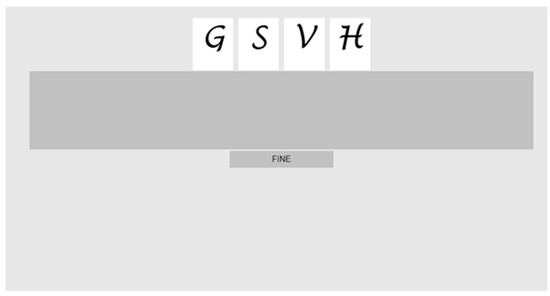
Figure 2.
Visual–motor response. Screenshot representing the display with the letter stimuli to be rearranged in the correct sequence by clicking and dragging them in the area below defined by the dark grey stripe. Below the response space is a grey button that is pressed to indicate that the response is complete (“FINE” = end).
When the lists contained distractors, the items that were initially presented reappeared on the screen for the response, mixed with other items. There were four distractors for each list (Figure 3). The presence of distractors during recognition/reconstruction (visual–motor response) was introduced so as to allow for the simultaneous assessment of item and order STM. Indeed, when no distractors were provided, pure information about memory for order was collected. This procedure further allowed for relatively comparable information to be collected from the oral (free recall, where distractors are virtually present in the set of all possible, non-target responses) and from the visual–motor response modality.

Figure 3.
Example of a visual code trial with distractors. (a) Presentation of the items (colours) to remember and (b) presentation of the items (colours) to be recognized and ordered, with distractors.
In addition to structural data (subject, date, trial, trial type), the software records data related to the sequences reconstructed by the participants and the time used to complete the trial. An example of output from the software could be the following sequence of information: (1) the number of selected items (A); (2) the number of selected distractors (B); (3) the total number of selected items (A + B); (4) the number of items correctly selected for identity and position (C); (5) the number of items correctly selected for identity but in the wrong position (D); the number of correct items (C + D); (6) the number of correct triplets; (7) the total time taken to run the trial; (8) the total time taken to run all trials of the same test; (9) the partial time in item placement; and (10) the ratio total time/the number of trials performed (average time per trial).
Triplets are sequences of three consecutive elements (stimulus, antecedent, consequent). This score is the number of triplets found in both the provided sequence and the reconstructed sequence but not in the same absolute position (i.e., moved forward or backward in the sequence). One additional point is given if the last two elements of the reconstructed sequence are equal to the last two elements of the correct sequence but the total number of items in the correct sequence is different from the total number of items in the reconstructed sequence (F). This scoring procedure was developed and adjusted so as to allow for the assignment of appropriate scores to any recalled item whose order does not exactly correspond to the input order but is deemed likely to result from the absence/addition/misplacing of other items rather than from erroneous recall of its own position. This rule was designed to avoid considering all items following a missing, reversed, or added item in the sequence as wrong responses (this is true both for span-based procedures and for “correct-item-in-correct-position” procedures).
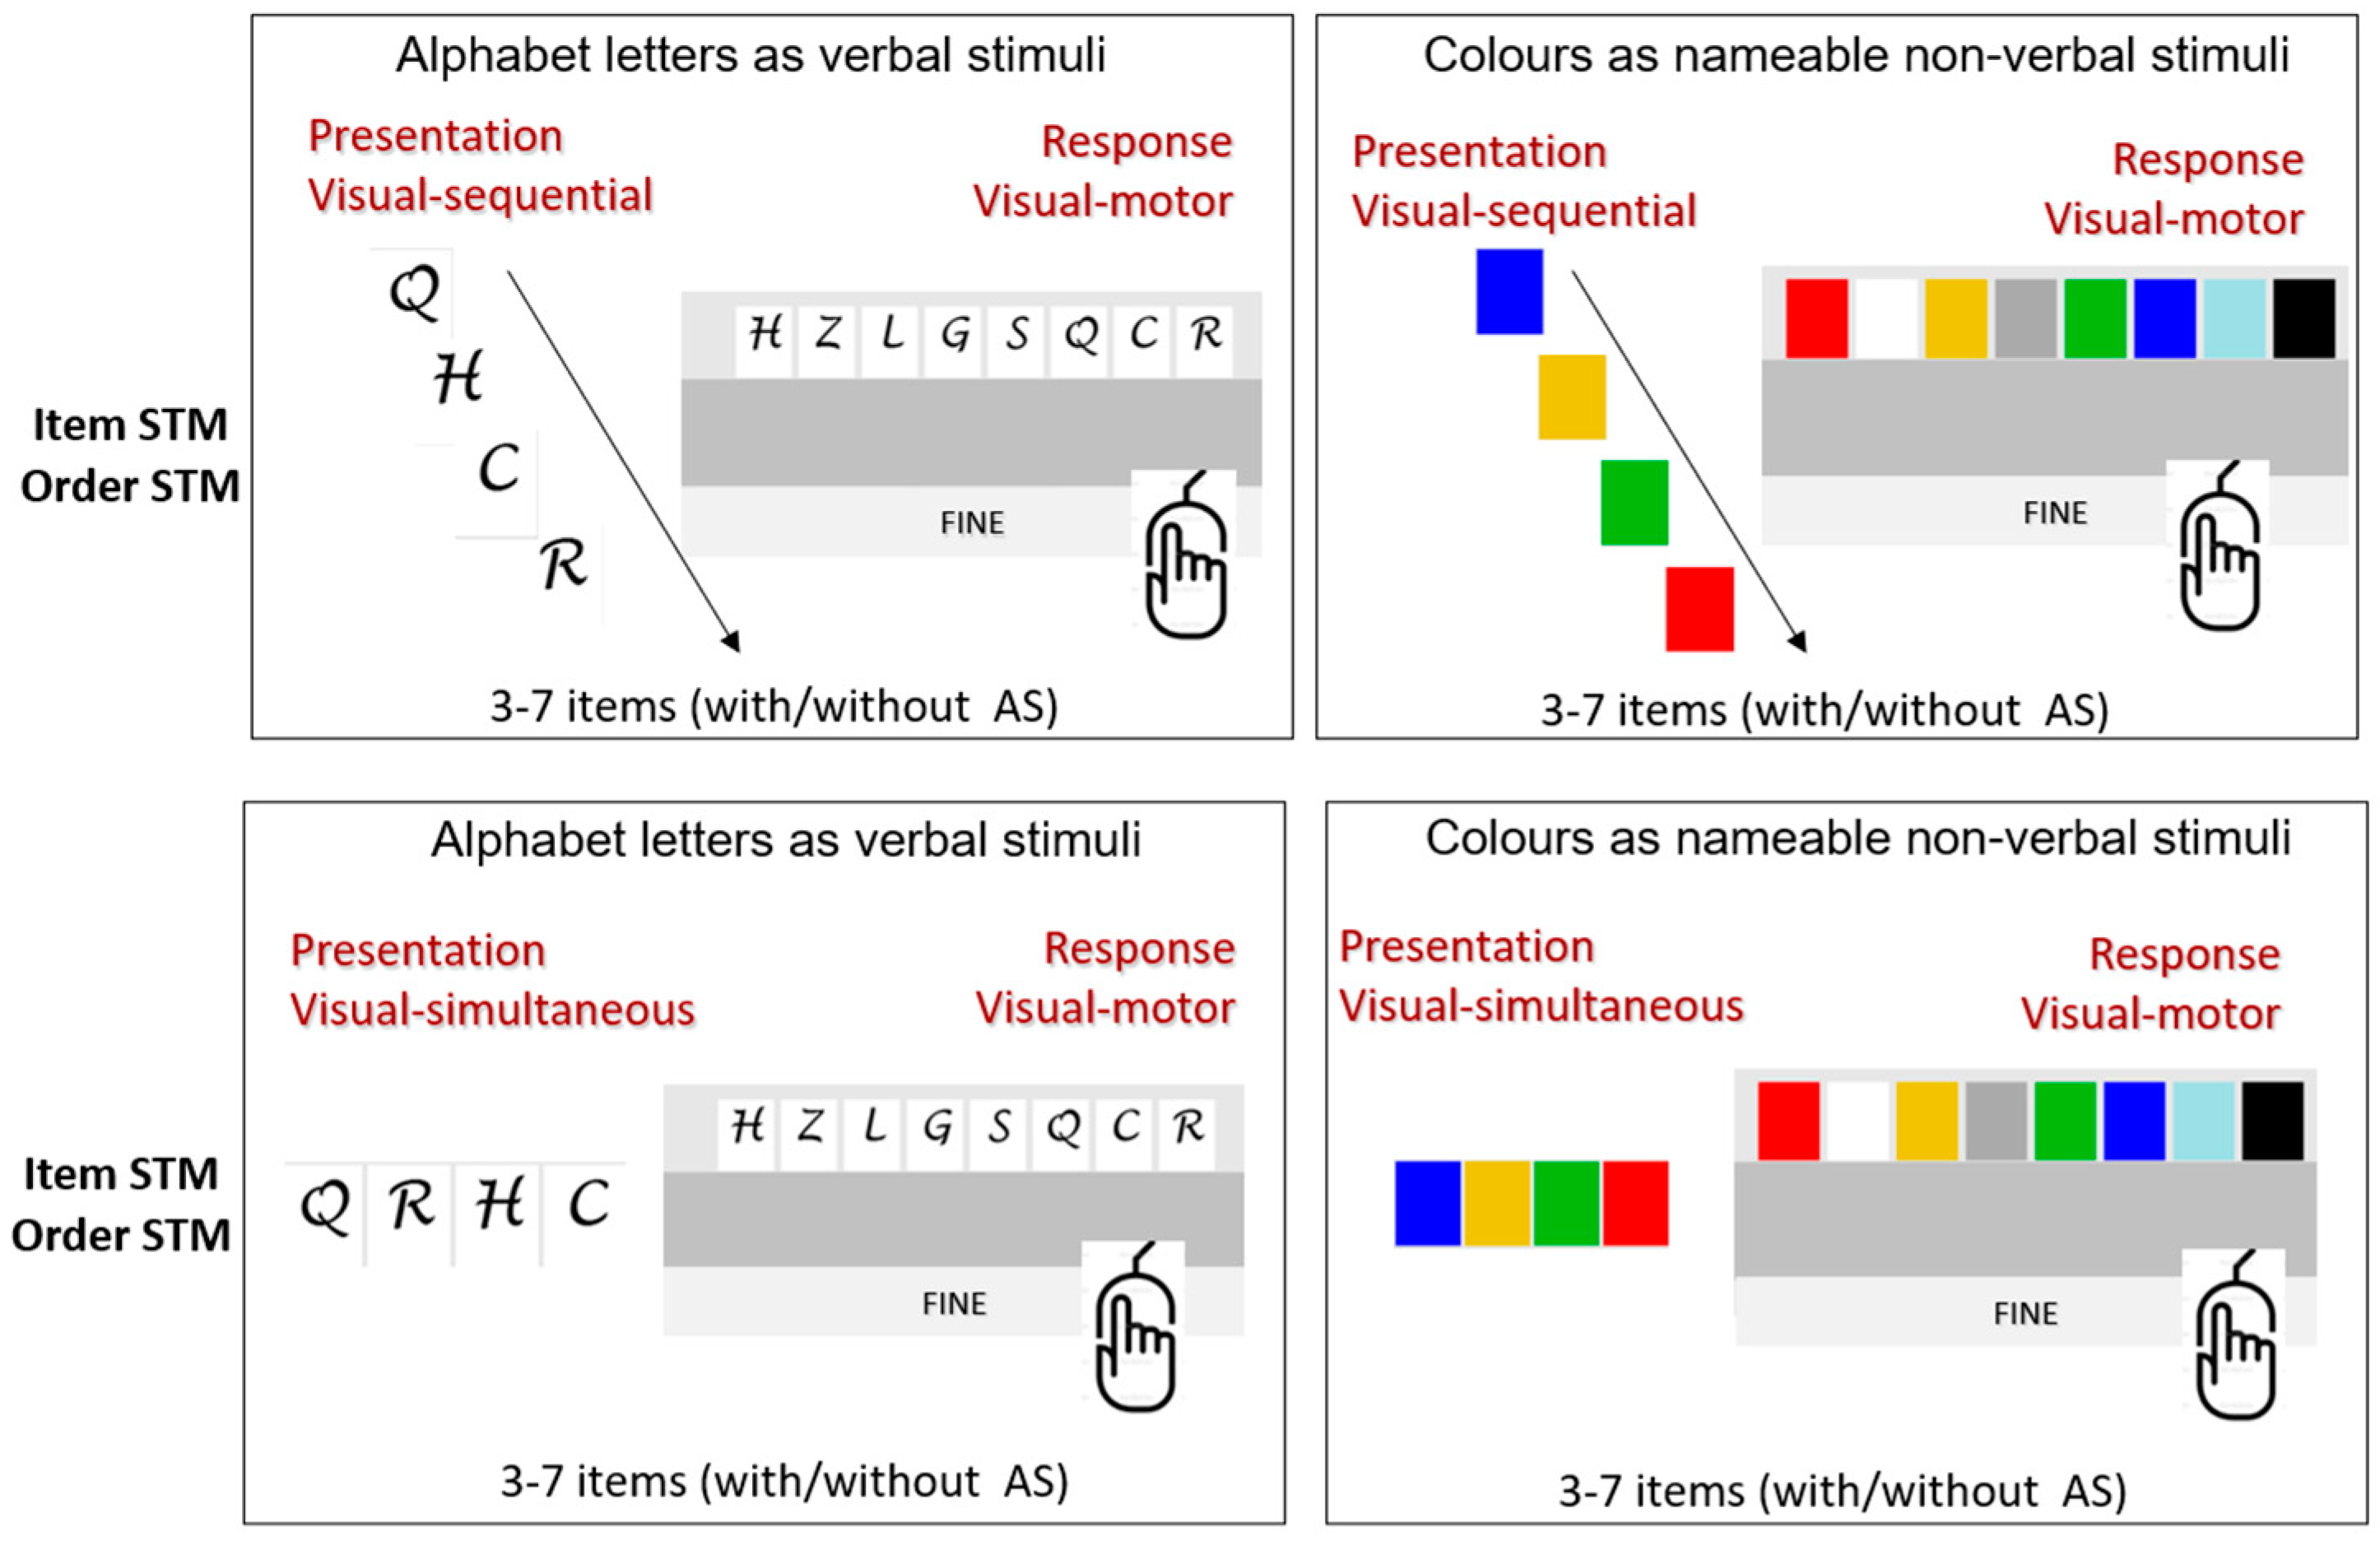
Based on these data, distinct indices can be calculated through specific algorithms, separately expressing memory for order and memory for item and additionally indicating the specific strategy used to reconstruct the sequence of stimuli. Examples of the tasks are reported in Figure 4, whereas a video showing how the tasks are performed is available in the Supplementary Materials.
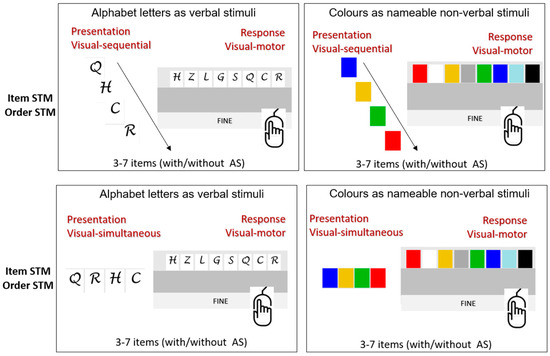
Figure 4.
Examples of tasks in STM Suite for the condition with visual input and visual–motor output. For this condition, all the design variables are applicable.
In order to avoid fatigue and frustration in the participant children, a specific algorithm was applied for each experimental condition to define an interruption rule. According to this rule, the test could be discontinued (following software instructions) before reaching the final list if performance did not improve across two consecutive lists (see [51] for greater detail). In the case of oral responses, which were noted manually by the examiner, the software could not suggest discontinuation, and the procedure always reached the final 7-item list.
A pilot study was conducted on a small number of children, including males and females, of the same age as the reference sample. This pilot study explored the validity of the interruption rule on a small group of participants (the discontinuation algorithm was applied after completion of the test to investigate the equivalence of the resulting score with and without the application of the rule) and showed that in 87% of the cases, no further improvement was present after two consecutive trials with no improvement.
Albeit necessary for ethical reasons, the interruption rule added some extra variability to the scores, which could be eliminated mathematically. This was performed by adding the points that subjects would have likely obtained if they had been administered all the lists (also those after the interruption). This imputation technique is described in Appendix A.
4. Data Analysis
The developed platform intends to control for several components (stimuli, modality of presentation stimuli, visual–verbal presentation of input and output, and activation processes such as recall and recognition) that are likely to be involved at various levels in reading, writing, and calculation processes. In other words, we assume that different, identifiable patterns of short-term memory (verbal, visual, item or order STM, etc.) underlie specific learning disabilities.
First, a hierarchical cluster analysis was applied by adopting a proximity-based approach [73]. The hierarchical cluster analysis was performed using SPSS statistical software, version 29 (see [74]). and was based on a set of scores expressing achievement in the various domains of academic skills, encompassing reading speed (text, word and nonword reading), reading accuracy (text, word and nonword reading), writing/spelling (word, nonword and sentence writing accuracy), and mathematical abilities (number reading accuracy and speed, number writing accuracy, counting speed and accuracy, addition and subtraction accuracy, multiplication accuracy), all expressed as Z-scores according to age norms. The number of clusters was set to range between two and seven.
Subsequently, we took the STM variables, which had been pre-processed (through imputation of post-interruption lists and Logit transformation to normalize their distributions, see Appendix A for details), and averaged them in order to obtain eight overall STM variables (MO_VV, MI_VV, MO_AV, MI_AV, MO_VO, MI_VO, MO_AO, MI_AO). These eight variables resulted from the combination of type (item vs. order), input (visual—V vs. auditory—A) and output (oral—O vs. visual–motor—V), averaging further distinctions such as the type of stimulus (letters—Ls vs. colours—Cs) articulatory suppression (AS) (with vs. without), presentation (sequential—SEQ vs. simultaneous—SIM), and distractors—Ds (presence vs. absence). Then, the identified clusters were compared to the overall variables by means of a multivariate ANOVA with group as the between-subject factor and age as a covariate. Bonferroni correction was applied in this case, setting alpha at 0.05/8 = 0.006. For each of the overall variables that turned out to significantly differ among clusters, a repeated-measures analysis of variance (GLM) was conducted, setting all the variables that were distinctively assessed for the overall variable (e.g., sequential vs. simultaneous presentation, presence vs. absence of distractors, etc.) as within-subjects factors, and cluster as the between-subjects factor. Post hoc tests assessing differences between specific pairs of clusters were performed by applying Tukey’s correction. Finally, for each factor that turned out to significantly interact with the cluster variable, a further post hoc analysis was performed comparing the different levels of the variable that was significantly different among clusters. For this purpose, the other within-subject factors were averaged each time in a single compound variable (e.g., in order to compare sequential vs. simultaneous presentation for the MO_VV variable, letters and colours, as well as with/without AS, with/without distractors were averaged into two main variables expressing all instances of sequential and simultaneous presentation).
It should be highlighted that STM for items was computed considering only the trials including distractors (when no distractors were present, all—and only—relevant information was available at the moment of responding; therefore, errors were very unlikely to occur when identifying presented items, although they could occur when identifying their order). All the other variables (simultaneous vs. sequential presentation, presence vs. absence of articulatory suppression) were collapsed and averaged.
5. Results
Cluster Analysis
From the 100 participants in the initial sample, because of sporadic missing data (due to the non-recoverable absence of children on one of the two dates scheduled with the schools for testing each individual child or—less frequently—insufficient motivation or collaboration to complete the test), only 82 could be included in the cluster analysis based on the whole set of scores from the learning tests. In total, 41 (equal to 50%) of the 82 final participants were from the Typically Developing group, whose mean age was 11.22 years (SD = 1.62, range 8–14), and 41 from the SLD group (50%), whose mean values were similar (mean age = 11.80, SD = 1.76). No statistically significant differences in gender, age, or sample were observed between the two groups.
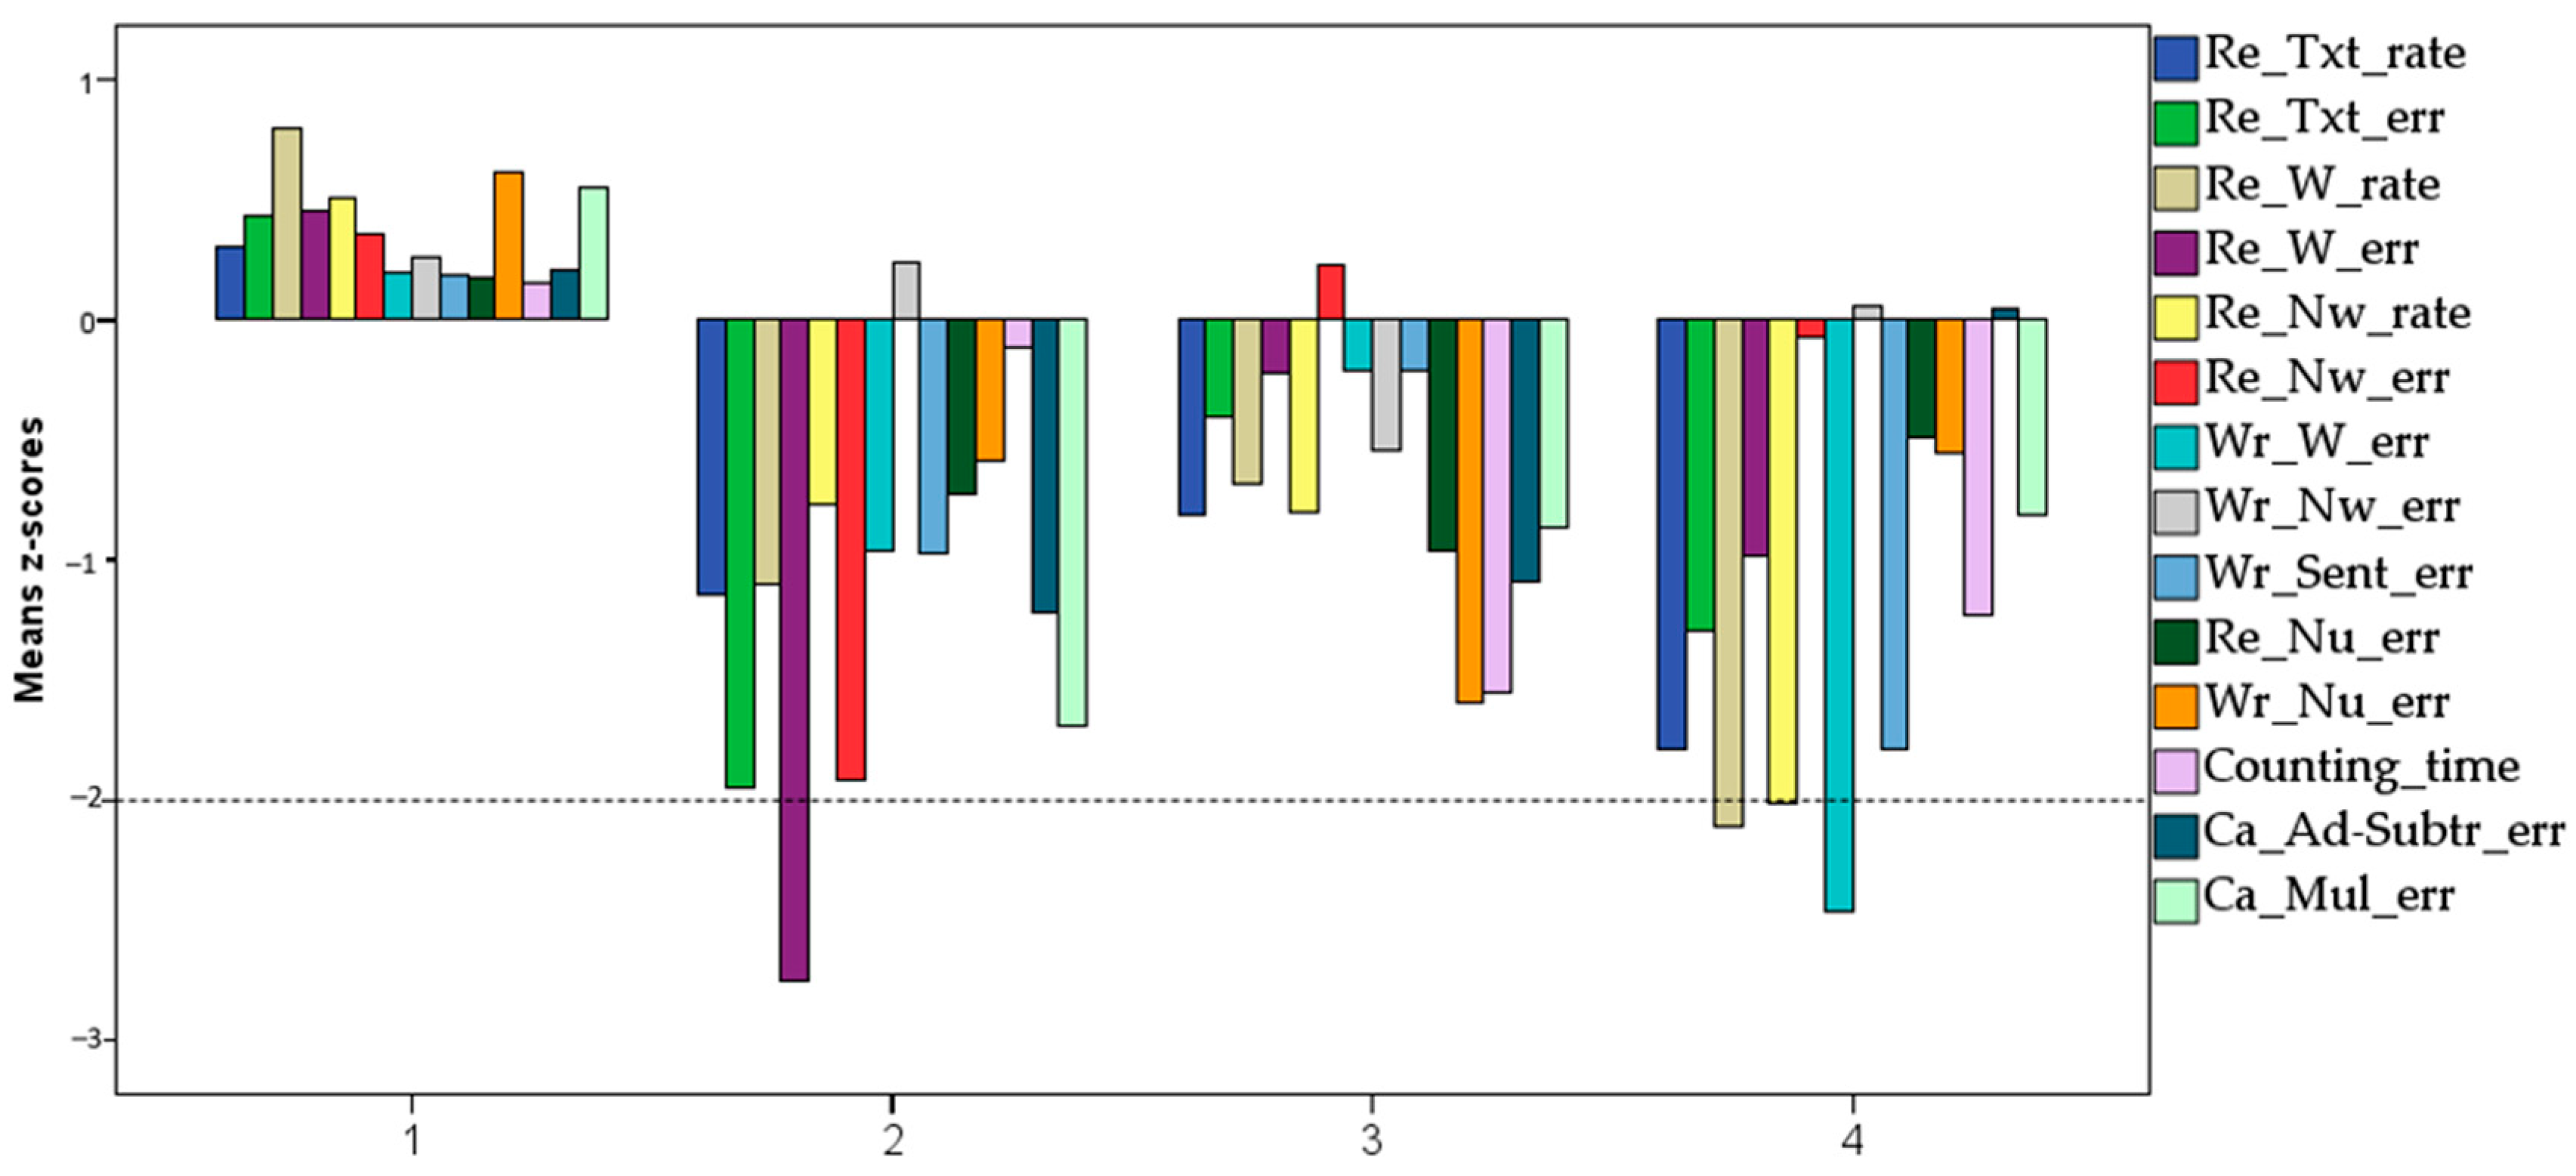
After a thorough visual analysis of the different patterns emerging from the cluster analysis, the clusters emerging from the seven-group analysis were selected as the subdivision that maximized the distinctiveness and interpretability of the patterns. Three of the seven clusters were single-case clusters, indicating individuals who could not be classified as belonging to any of the other clusters. These three individuals were not taken into consideration for further analyses, thus restricting all subsequent analyses to a four-cluster solution. Indeed, as shown in Figure 5, the remaining four clusters could easily be put into correspondence with a cluster of Typically Developing children (TD, Cluster 1, n = 41) having all learning scores in the positive range; a reading disordered group (RD, Cluster 2, n = 12) with low scores, especially in reading accuracy but also, although less marked, in calculation (number facts and addition and subtraction); a mathematical skills disordered group (MD, Cluster 3, n = 17), with low scores, especially in the number skills scores and in number reading and writing (but also, less markedly, in the reading tasks); and a reading and writing disordered group (RD + WR, Cluster 4, n = 12) with low scores in both reading (especially speed) and writing tasks (but also, although less markedly, in number counting speed).
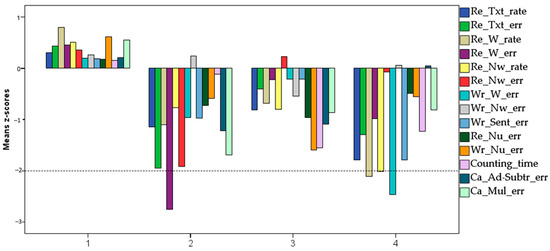
Figure 5.
Mean Z-scores obtained in the reading (text, word, non-word), writing (word, non-word, sentences), and calculation (number reading, number writing, counting, addition and subtraction, multiplication) tasks in the 4 different clusters.
As shown in Table 3, the four clusters differ in all variables except the score expressing non-word writing, as expected in a language as transparent as Italian.

Table 3.
Mean Z-scores obtained at the re-reading (W—word, Nw—non-word, text), Wr—writing (W—word, Nw—non-word, Sent—sentence), and Ca—calculation (Nu—number reading and writing, counting, Ad—addition and Subtr—subtraction, Mul—multiplication) tasks in the 4 different clusters.
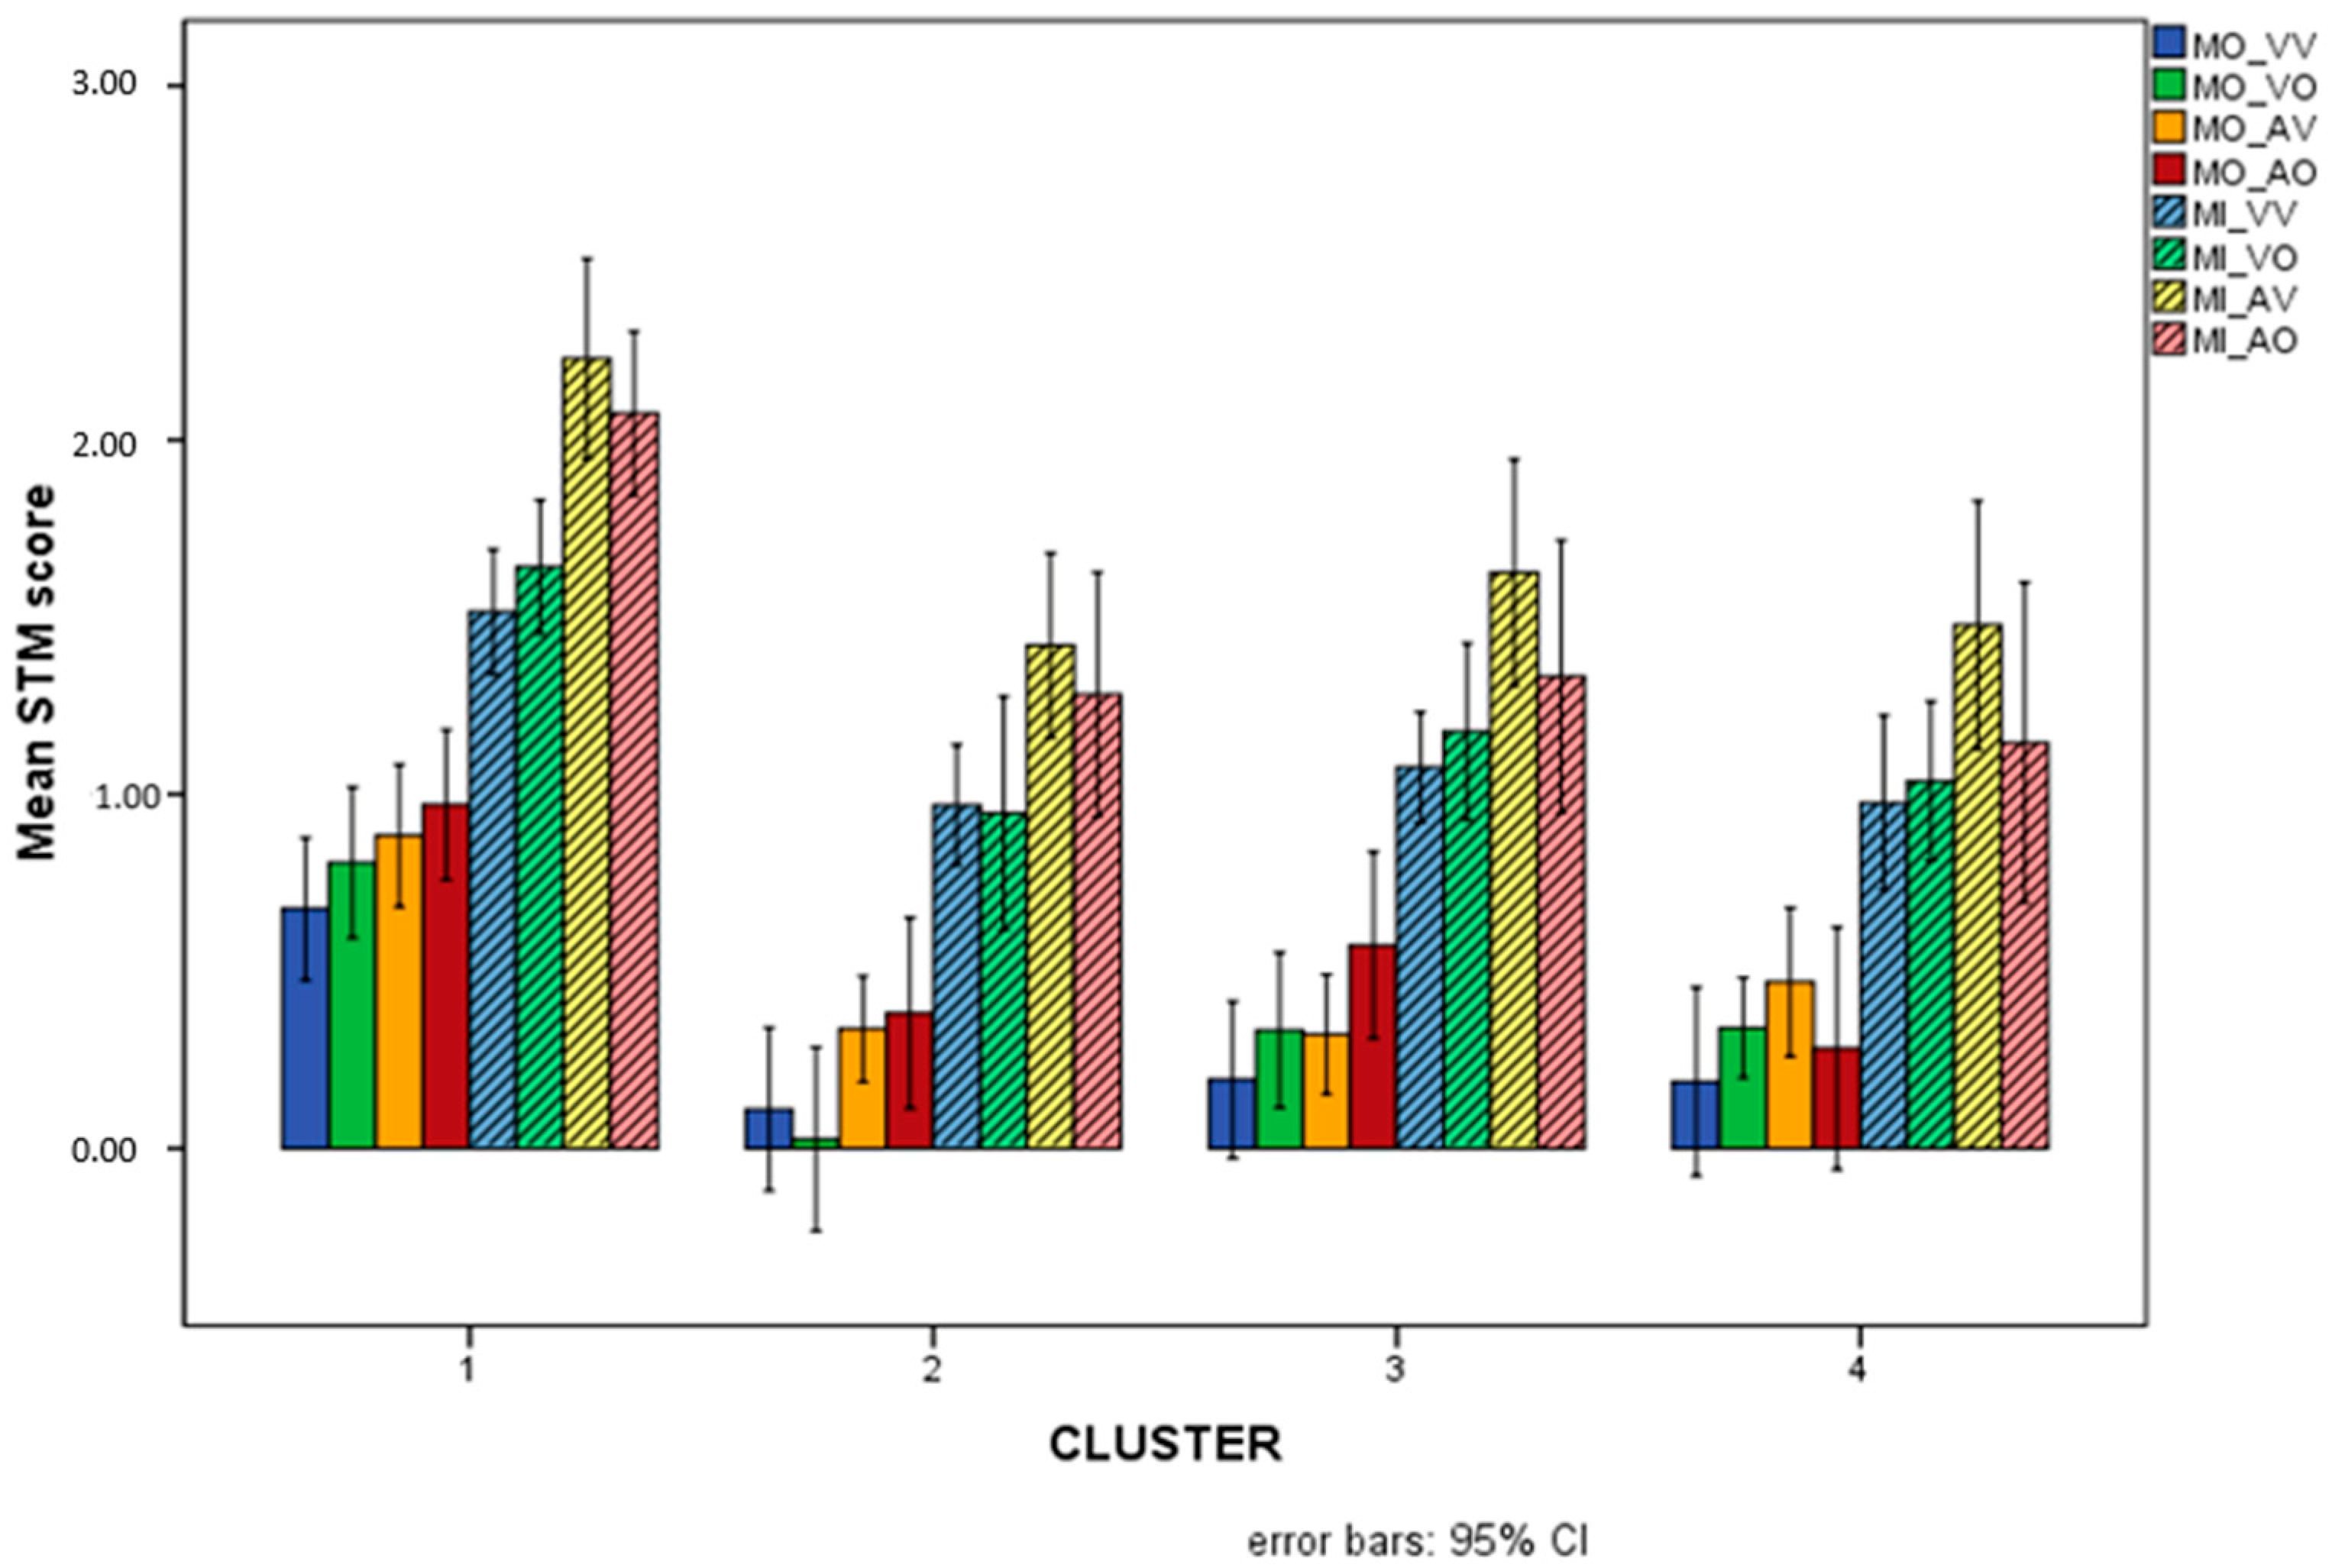
The multivariate ANOVA on the eight overall STM variables revealed a significant multivariate effect (Wilks’ Lambda = 0.535): F(24, 203.623) = 2.236, p = 0.001, Partial eta2 = 0.202. The results related to each single STM variable along with post hoc tests indicating specific differences among clusters are shown in Table 4. It can immediately be observed that all overall STM variables, with the only exception being MI_VV, showed significant differences among clusters, generally indicating that the cluster of TD children performed at a higher level compared with some or all of the SLD clusters. No significant differences with respect to overall STM variables emerged among any of the SLD clusters. Nonetheless, not all the SLD clusters turned out to be significantly different from TD for all the variables, indicating varying degrees of impairment for the different clusters. Particularly, it could be observed that the MD cluster (number 3) was not significantly impaired on MO_AO, while the RD + WD cluster (number 4) was not significantly impaired on either MO_VO or MO_AV.

Table 4.
Results of the multivariate GLM ANOVA comparing overall STM variables in the 4 clusters. The last two columns refer to differences related to the overall STM variable in the 4 clusters. Tukey’s correction was applied to post hoc significance values.
The profiles of the four clusters on the overall STM variables are illustrated in Figure 6.
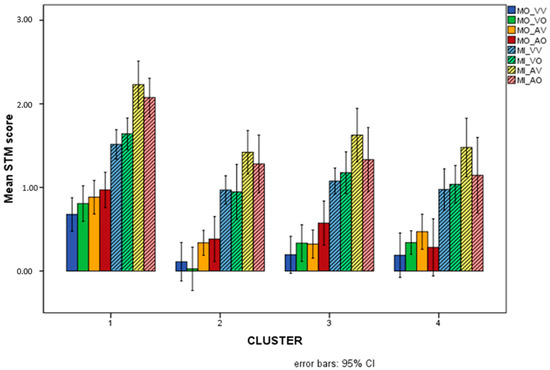
Figure 6.
Mean scores (Logit-transformed) obtained for the eight overall STM variables in the 4 different clusters. The Logit scale gives a score of −3.89 to the lowest possible performance (raw = 0/25 = 0%), and +3.89 to the highest (raw = 100% = 25/25). Intermediate performances obtain (e.g.) Logit = 0 for raw = 50%, Logit = +1.1 for raw = 75%, Logit = +2.2 for raw = 90%, etc. See Appendix A for details.
The next step involved the analysis of the effects related to all factors characterizing each of the overall STM variables. The results indicated that the number of factors ranged between four (for the two VV variables, involving stimulus, presentation, suppression, and distractors) and one (for the two AO variables, involving stimulus only as all other factors were constrained by the nature of the variable, necessarily sequential, allowing for no suppression and no distractors).
Table 5 shows the results of the series of repeated-measures ANOVA conducted on each of the overall STM variables. The post hoc analyses refer to differences in clusters for the overall variables. Significant interactions with cluster mainly concern stimulus (differences between colours and letters emerging for MO_VV, MO_VO, MO_AV, MI_VV, and MI_VO), but also presentation (sequential versus simultaneous) turned out to interact with cluster for MO_VO and for MI_VO, while the presence of distractors significantly impacted cluster-related differences in MI-VV. A triple interaction stimulus by articulatory suppression by cluster emerged for MO_AV.

Table 5.
Results of the repeated-measures ANOVA assessing the interactions between all involved factors and clusters for each of the overall STM variables.
The results show the presence of significant interactions with cluster for most MO variables (with the exception of MO_AO) and for two of the four MI variables, namely, the ones with visual presentation (MI_VV and MI_VO). None of the two auditory–oral tasks MO-AO or MI_AO (roughly similar to traditional span tasks with letter and colour stimuli) showed any interaction with cluster. As planned, for each of the factors that had shown significant interactions with cluster, a further repeated-measures ANOVA was conducted in order to disentangle the interaction and clarify different effects among clusters. The results of these analyses are reported in Table 6.

Table 6.
Results of the ANOVA assessing the interactions between all involved factors and clusters for each of the overall STM variables.
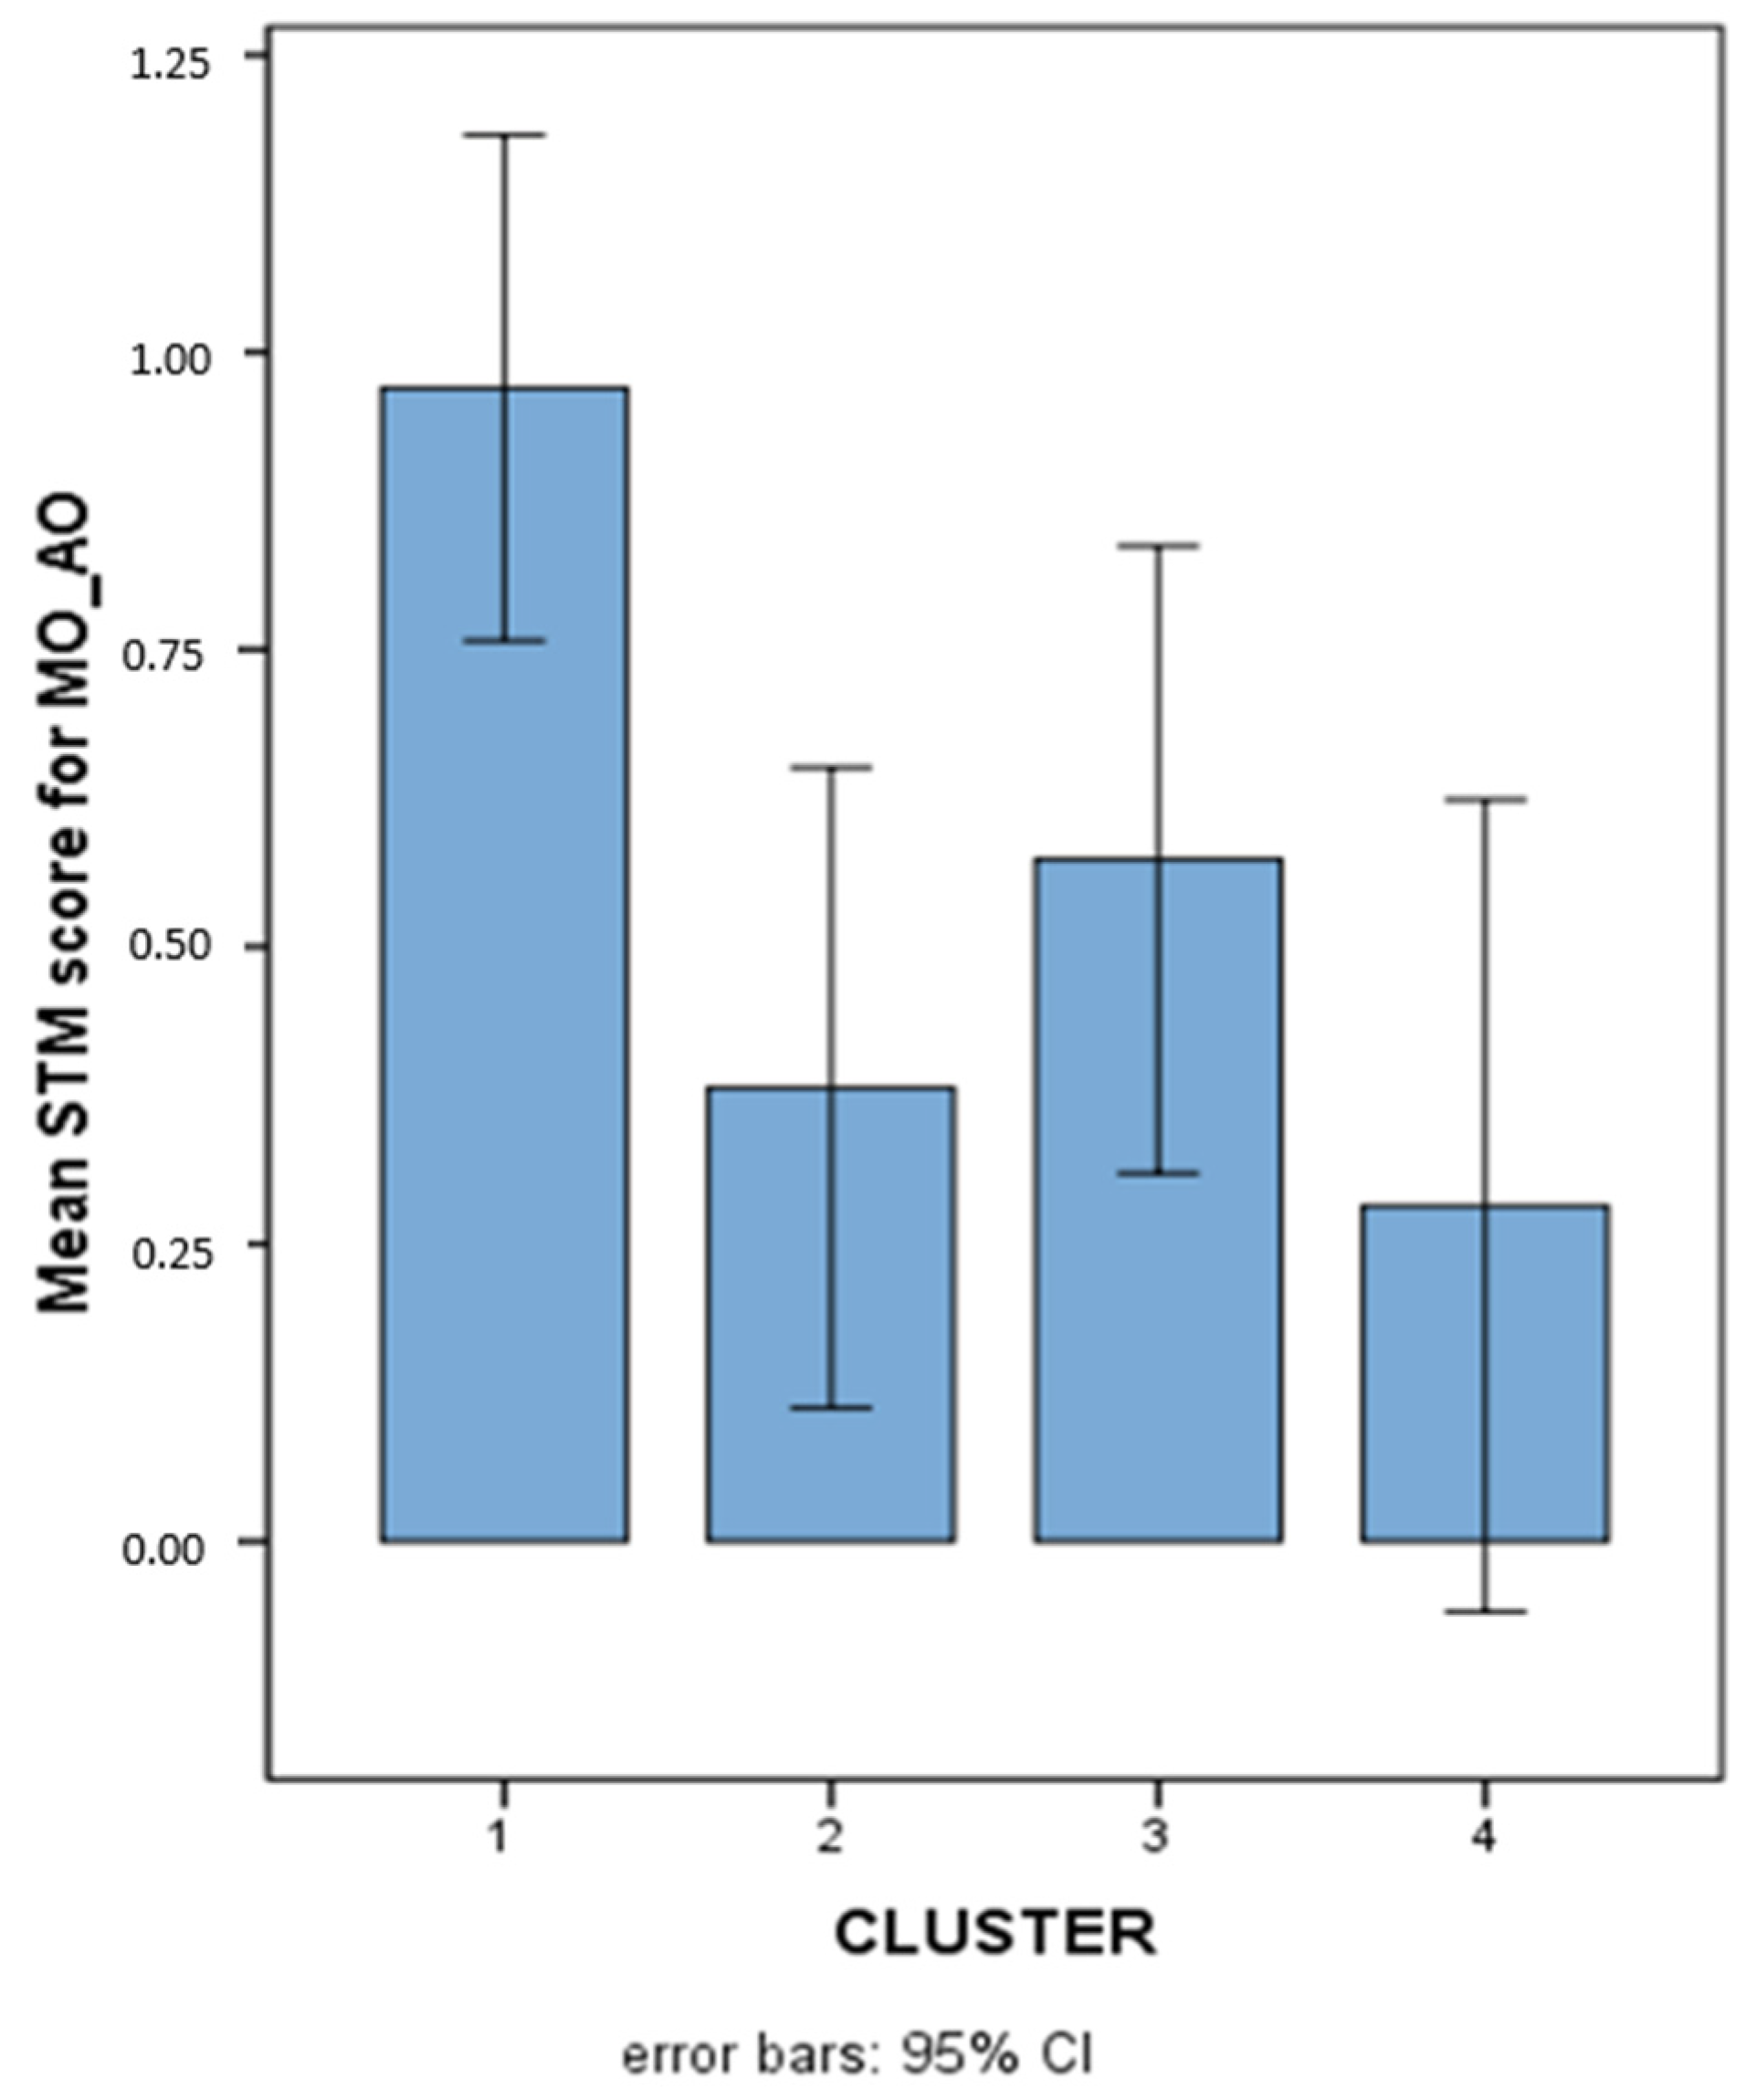
Since no interaction emerged among MO_AO, MI_AV, and MI_AO. It was concluded that the significant differences among clusters were not modulated by any factor and could be considered as differences related to the characteristics of the AO task (in its two item and order components), regardless of its content, and the AV task. The pattern of results for the various clusters on MO_AO (where cluster 3 showed no significant difference with respect to TD) is illustrated in Figure 7.
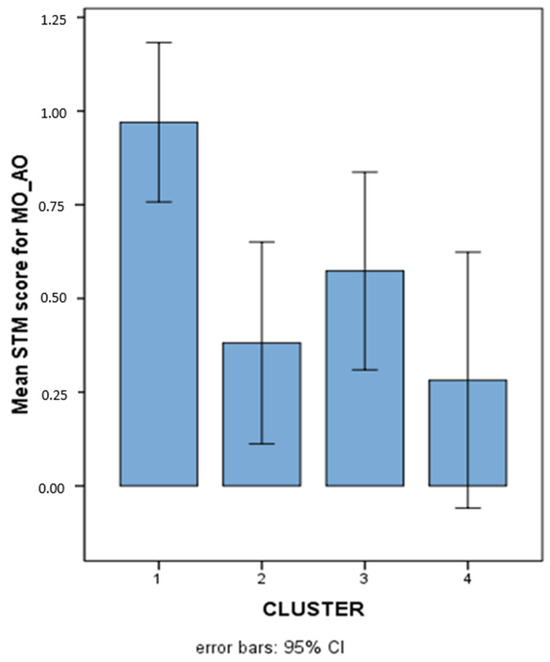
Figure 7.
Mean STM scores (Logit-transformed, see Figure 6 and Appendix A) obtained on the overall MO-AO variable in the 4 different clusters.
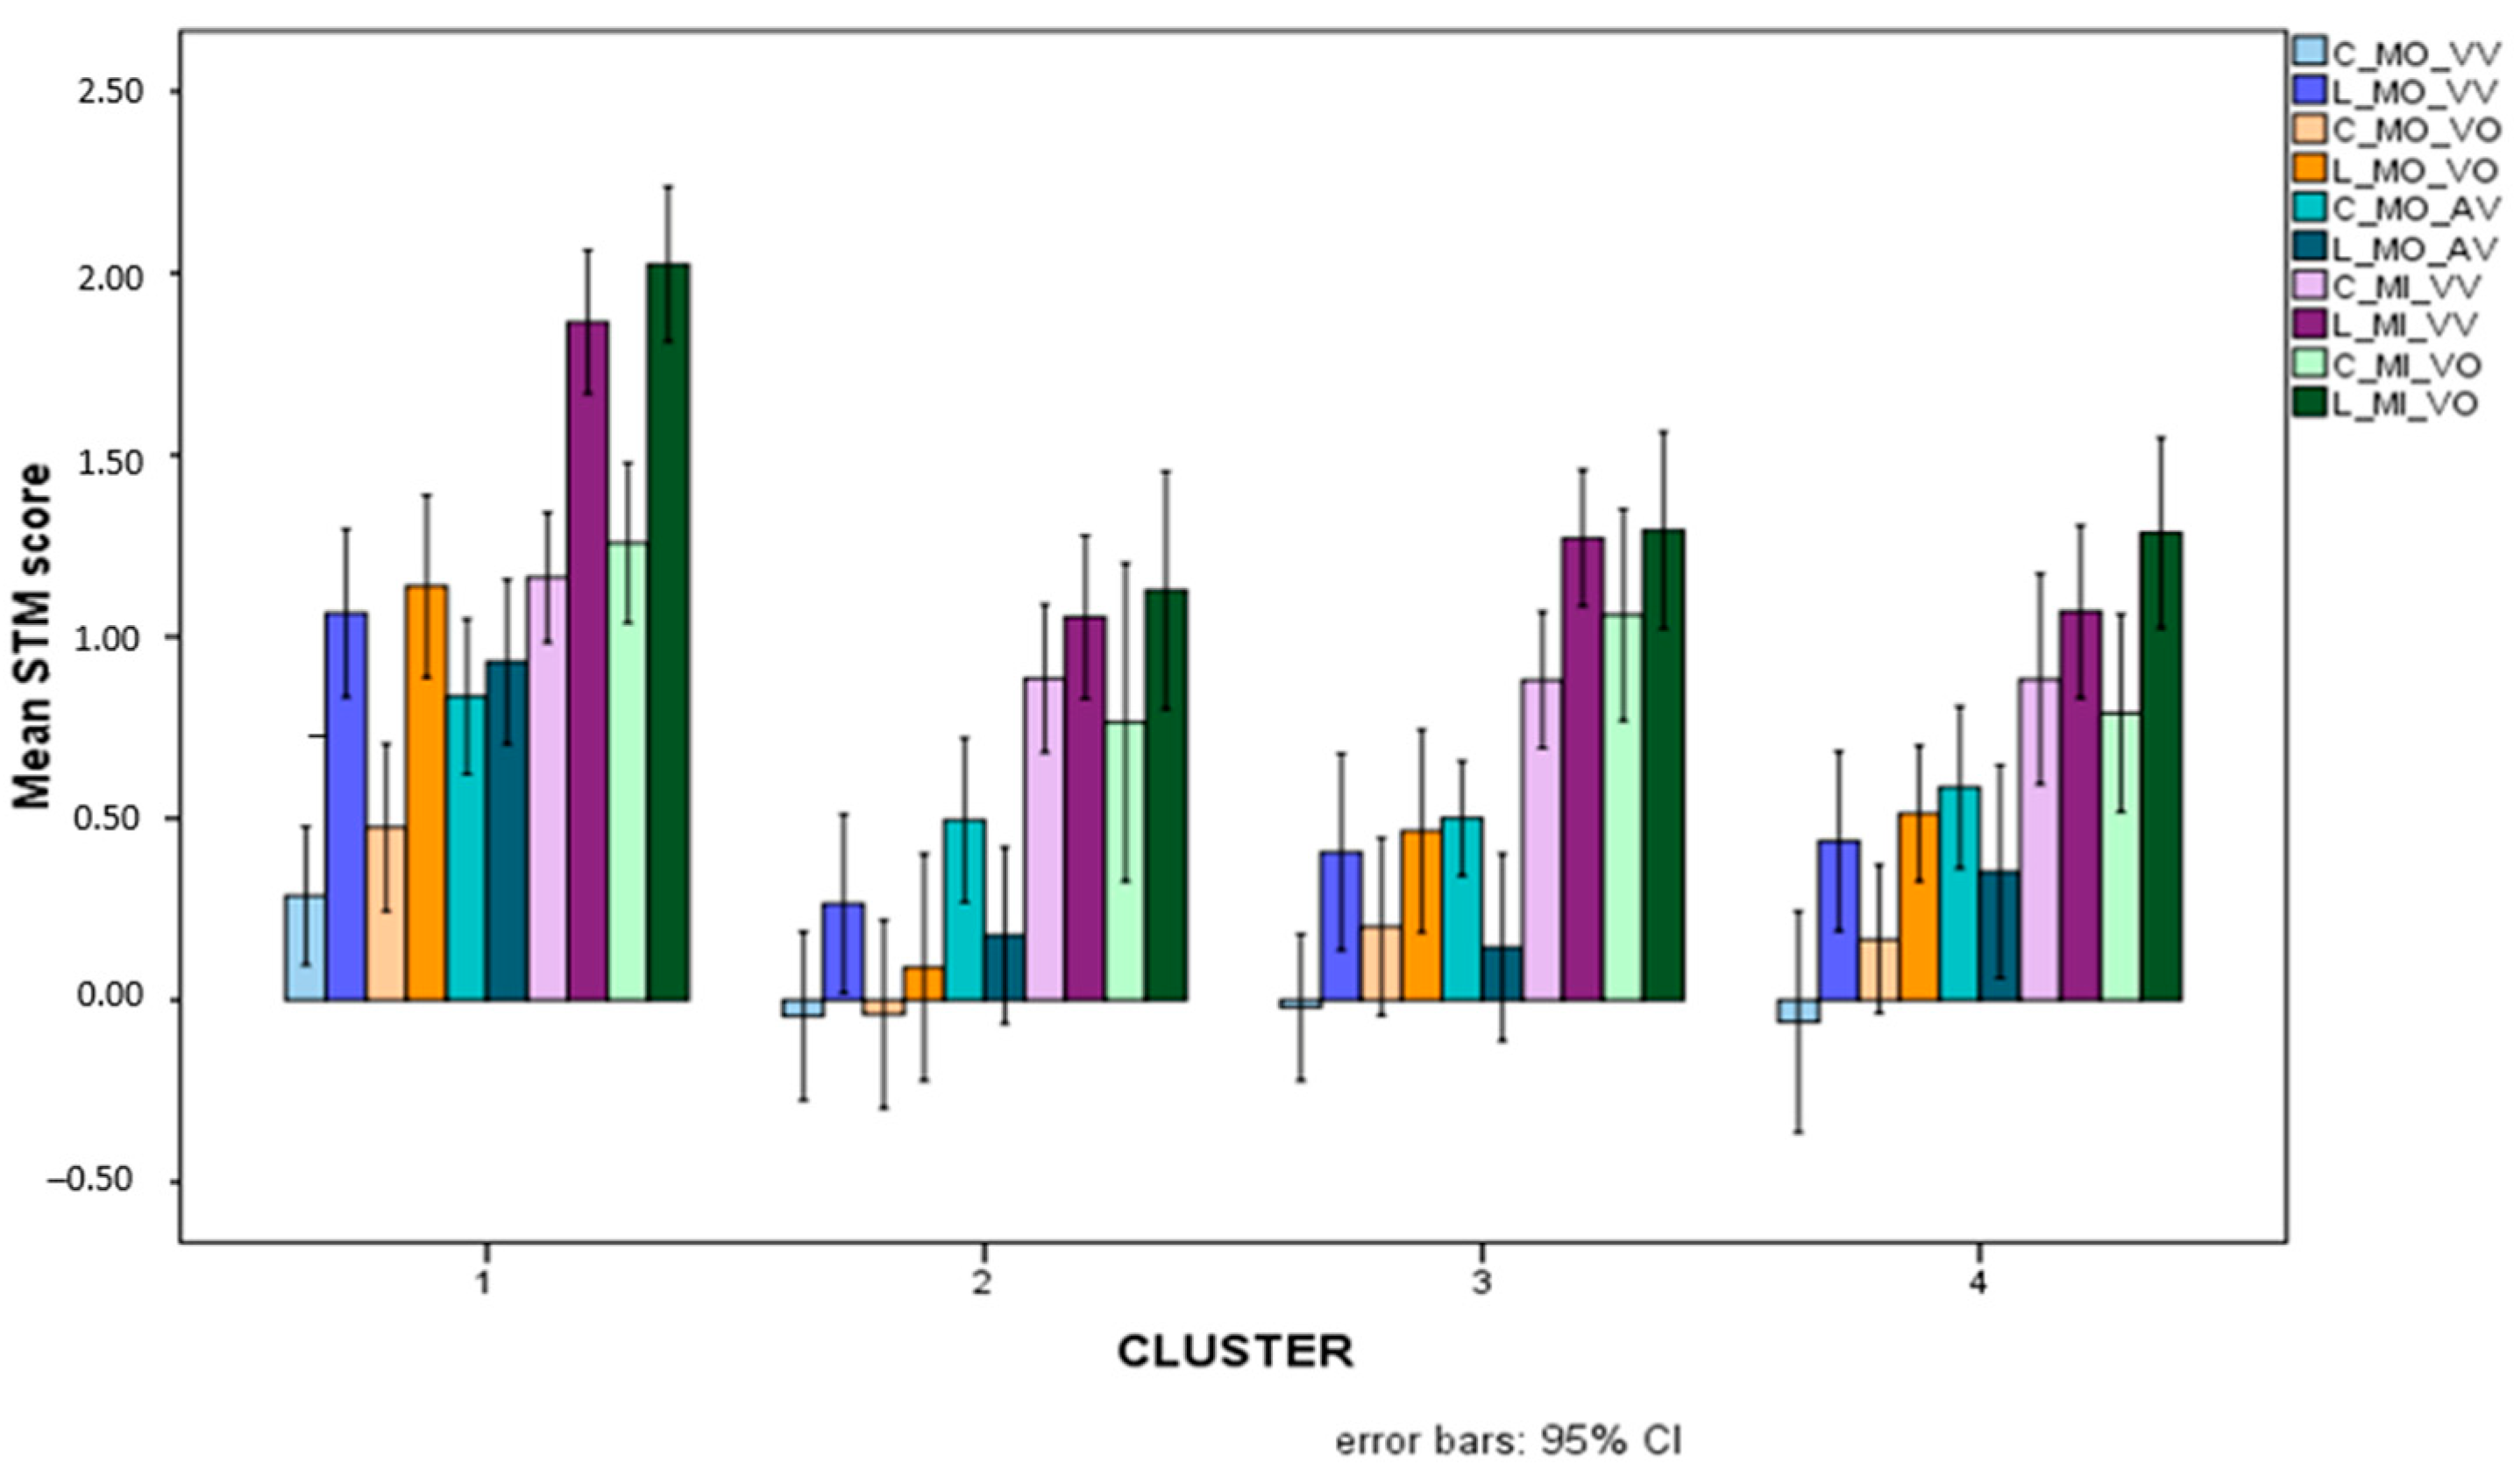
Significant differences between colours and letters involved in interactions with cluster differences for the various overall STM variables are illustrated in Figure 8.
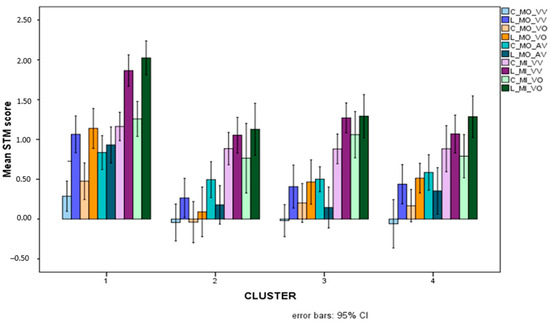
Figure 8.
Mean scores (Logit-transformed, see Figure 6 and Appendix A) obtained for colours (light-coloured bars) and letters (dark-coloured bars) for the five overall STM variables that showed significant interactions between stimulus and cluster.
In general, it can be seen that letters are processed and retrieved more easily than colours, and this is especially true for children in the TD cluster. For all children with SLD, indeed, the advantage of letters over colours is actually reversed for MO_AV STM scores. In order to check for stimulus-based differences within each cluster, a series of t-tests for dependent groups (paired t-tests) was conducted comparing letters and colours. The tests showed a significant advantage for colours over letters in the MD group only (t(16) = 2.878, p = 0.011), and non-significant advantages for colours in the other SLD clusters (p > 0.07) and a nonsignificant advantage of letters over colours for the TD group (p = 0.287).
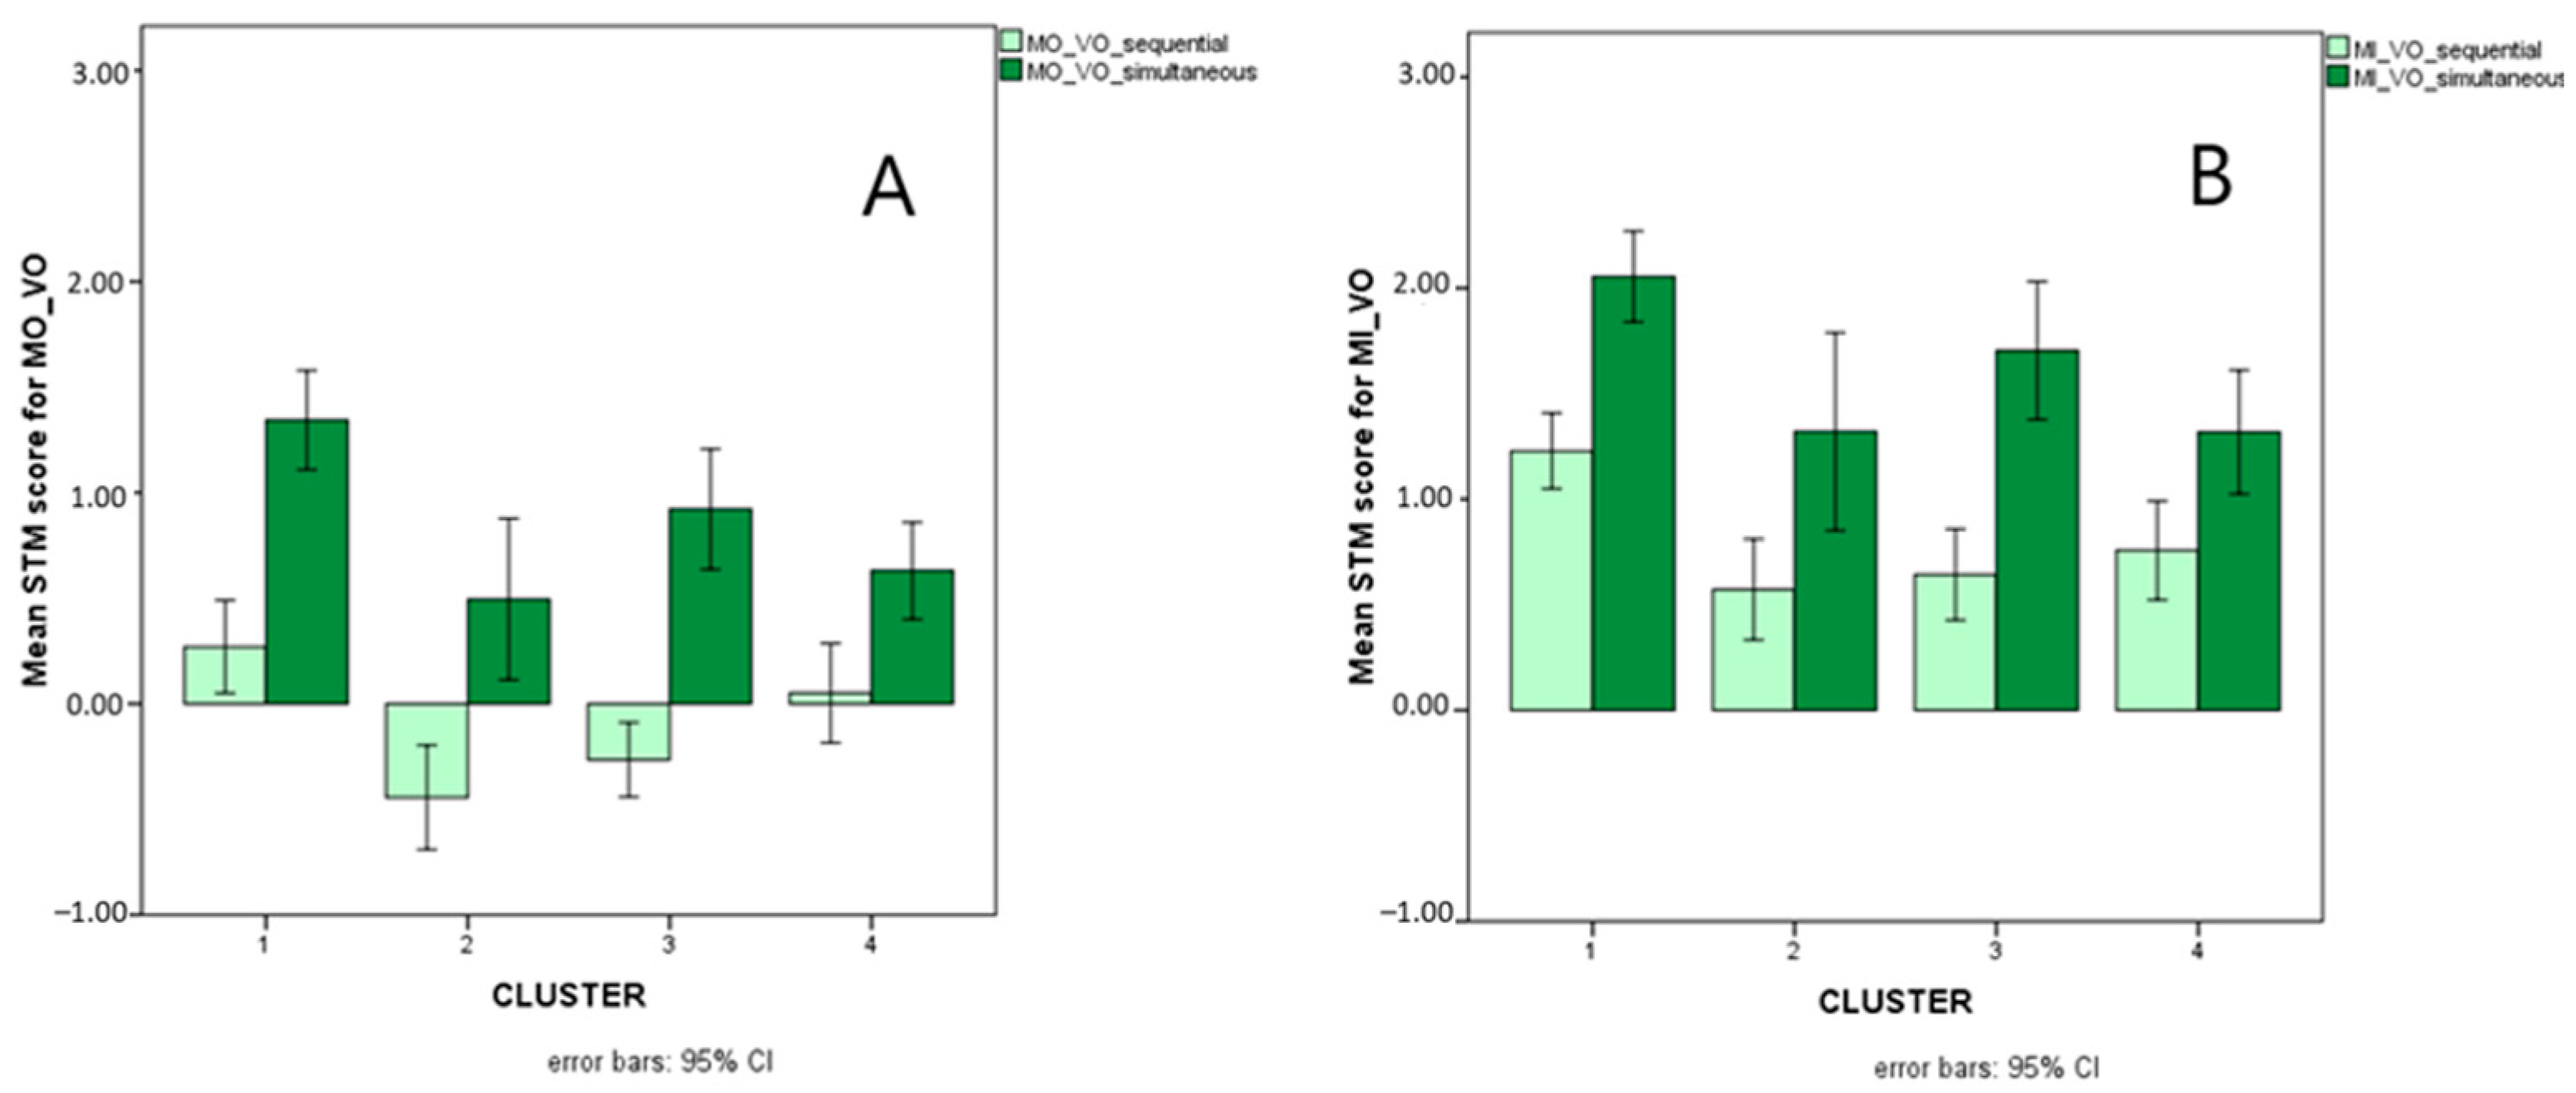
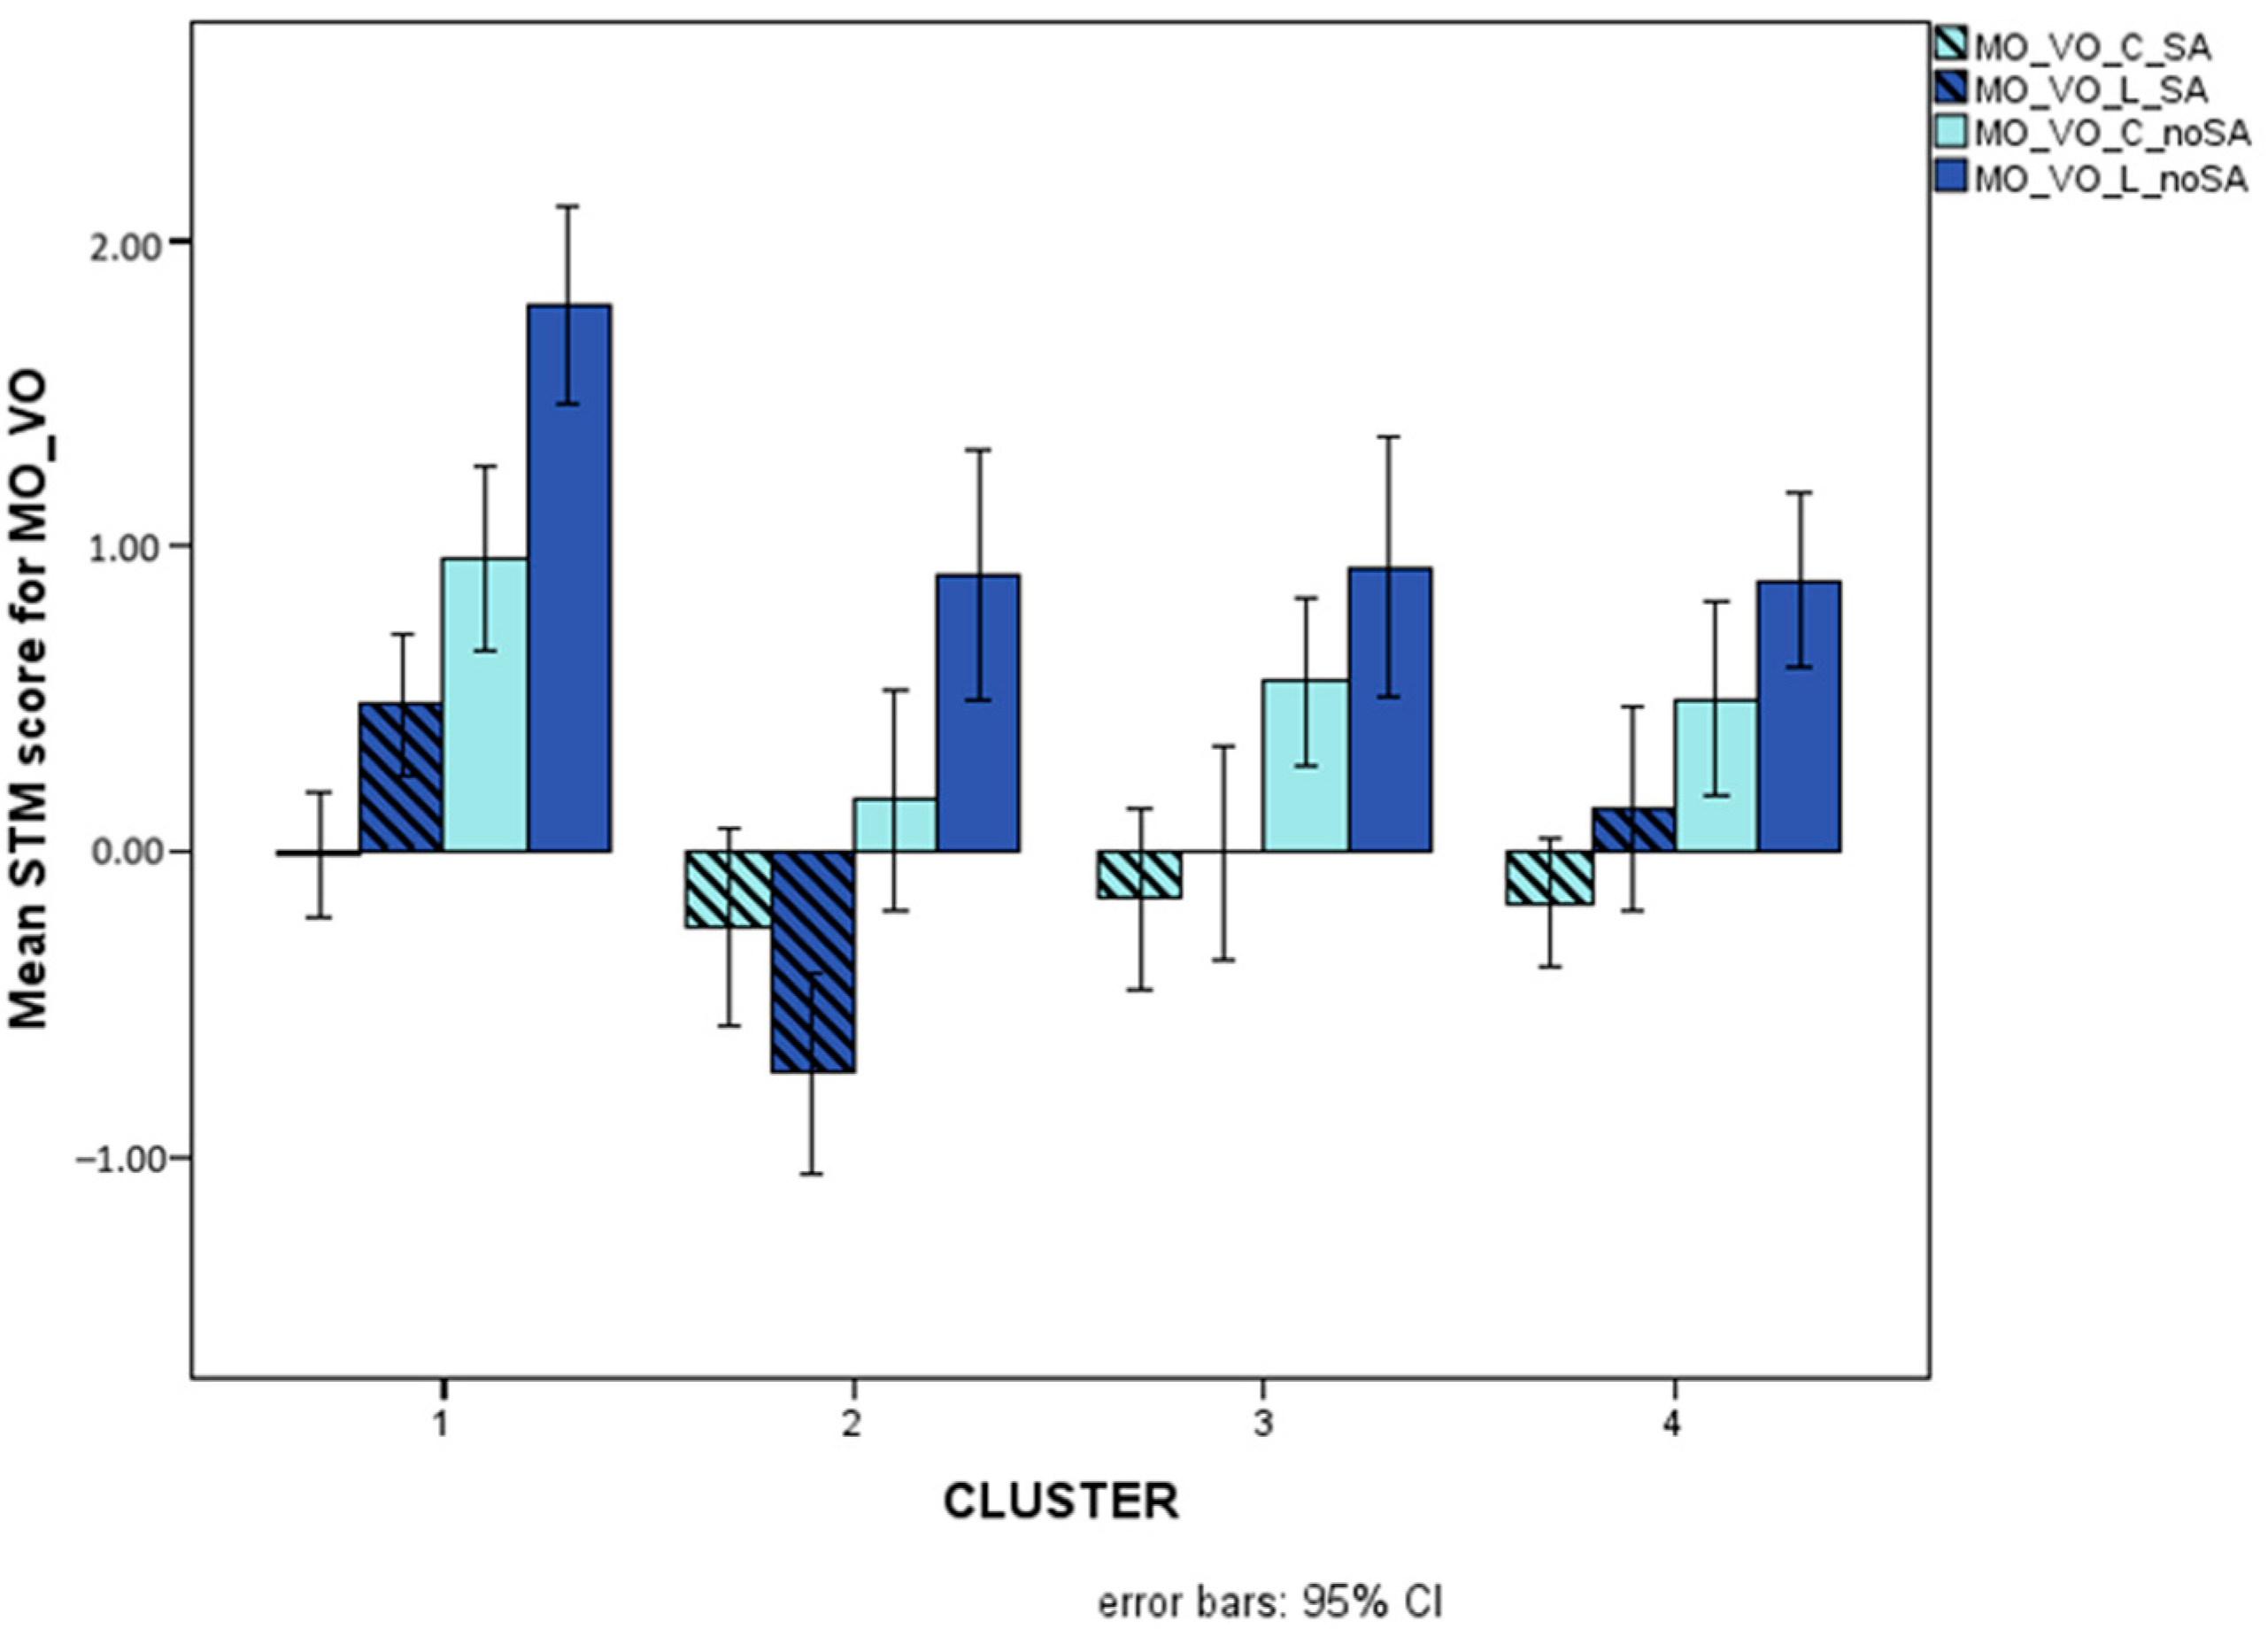
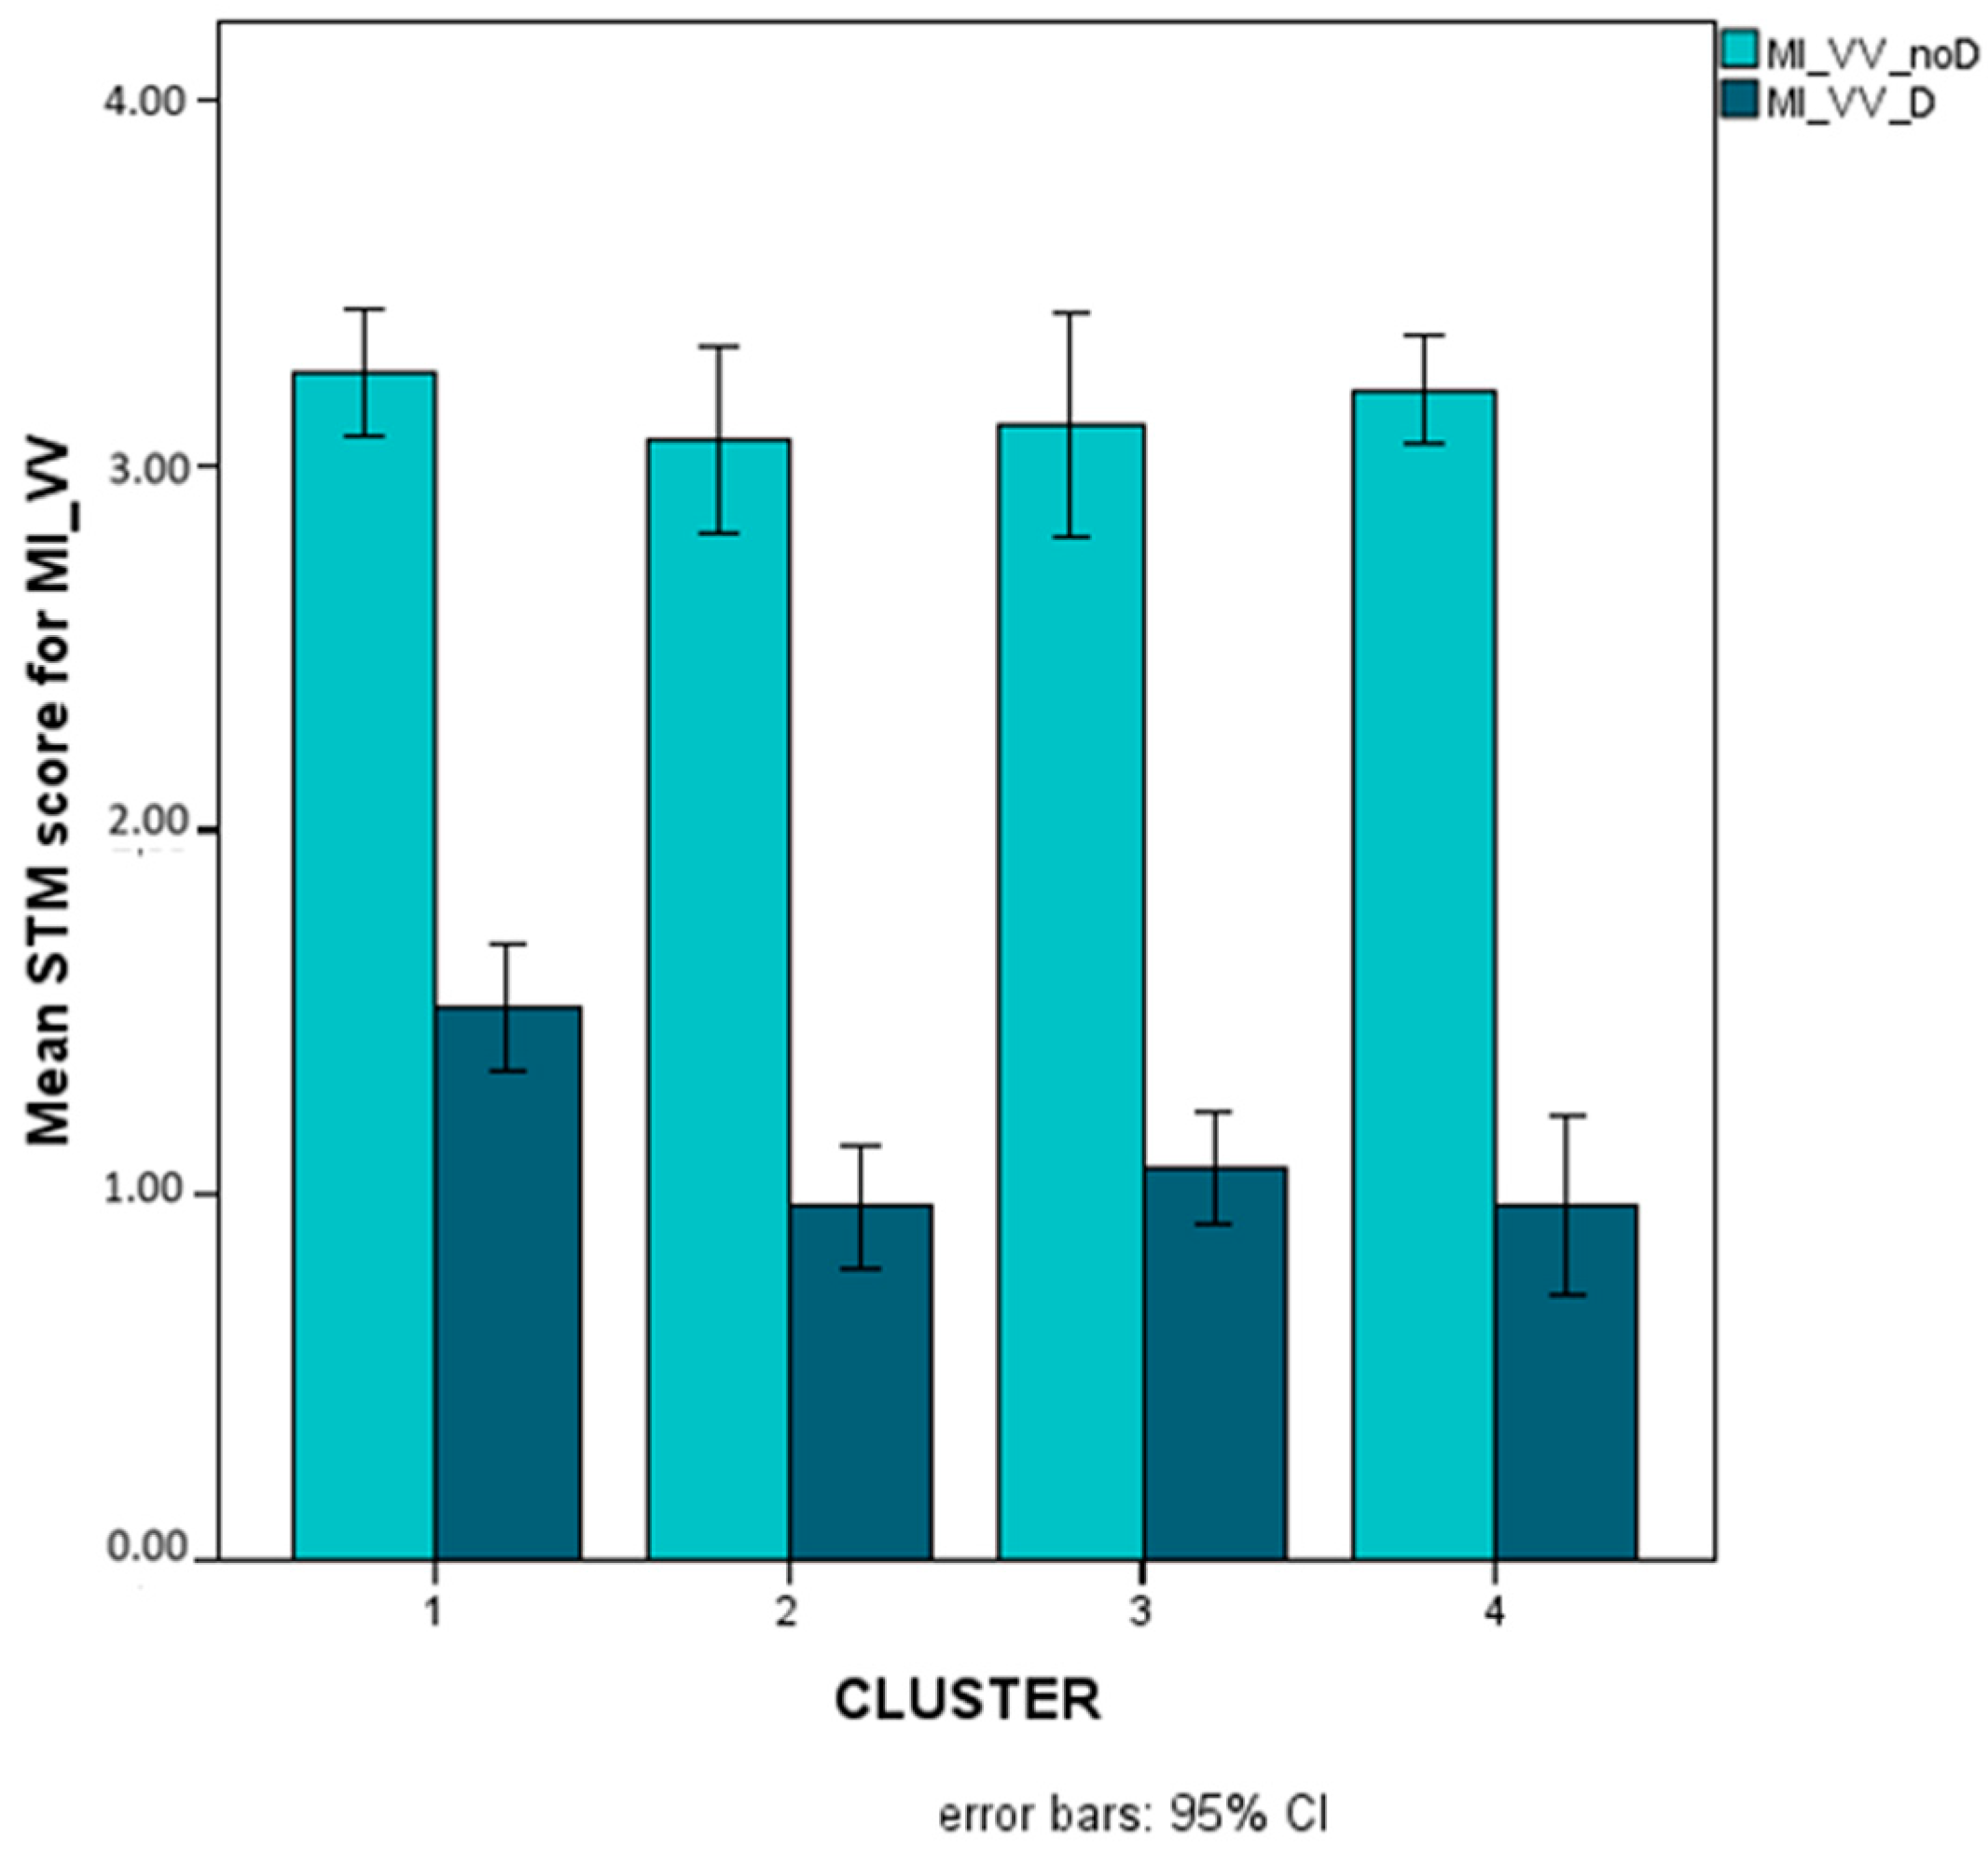
Figure 9 illustrates presentation-related interactions for MO_VO and for MI_VO, Figure 10 illustrates the triple interaction stimulus x AS x cluster for MO_VO, and Figure 11 illustrates distractor-related interactions for MI_VV.
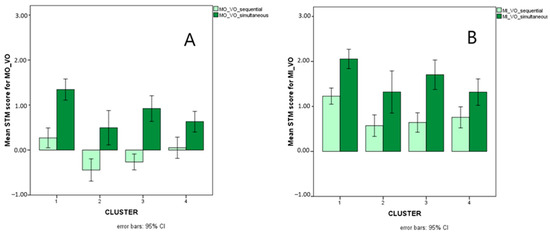
Figure 9.
Mean scores (Logit-transformed, see Figure 5 and Appendix A) obtained for sequential (light green bars) and simultaneous (dark green bars) presentation on the MO_VO (A) and MI_VO (B) STM variables.
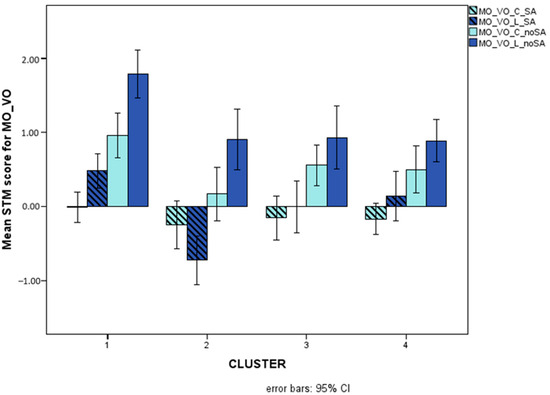
Figure 10.
Mean scores (Logit-transformed, see Figure 6 and Appendix A) obtained for colours (light blue bars) and letters (dark blue bars) on the MO_VO and STM variables with (striped bars) and without (plainly coloured bars) articulatory suppression.
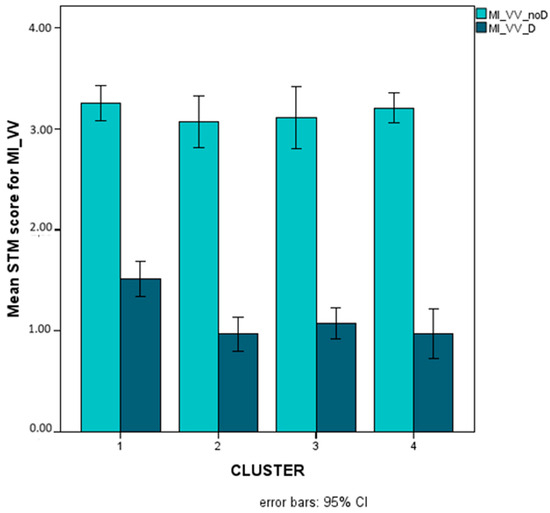
Figure 11.
Mean scores (Logit-transformed, see Figure 6 and Appendix A) obtained for trials without (light turquoise bars) and with (dark turquoise bars) distractors on the MI_VV STM variables (NB, the condition without distractors is not to be considered as an appropriate measure of MI but only as a reference point).
6. Discussion
The present study describes the application of new software for the assessment of STM in a wide set of different conditions (varying for stimulus type, input, and response modality, sequential versus simultaneous presentation, with and without concurrent articulation to suppress phonological coding, and with or without the presence of distractors in visual–motor response).
First, a number of meaningful subgroups of learning disorders were identified through a proximity-based cluster analysis. Cluster analysis was judged preferable to actual diagnoses in order to study the distribution of STM scores in subgroups defined in a transdiagnostic perspective, not strictly following the cut-off approach on which specific diagnoses of different SLD types would necessarily be based. Indeed, individuals assigned to the same nosographic category (dyslexia, dyscalculia, etc.) usually show large variability as they may have different difficulties (e.g., speed vs. accuracy in reading; number system or number sense). Moreover, there is extensive overlap between disorders that are assigned to different diagnostic categories (homotypic comorbidity). An approach based on cluster analysis allowed us to study subgroups that were as distinct as possible at the functional level, irrespective of categorical labels. It is noteworthy that the cluster analysis, beyond a group with normal performance in all domains (TD), revealed three subtypes of learning disorders that could be characterized as follows: (a) a predominant disorder of reading accuracy (cluster 2) accompanied by a less evident impairment of mathematical abilities, especially affecting number fact retrieval; (b) a predominant disorder of mathematical skills (cluster 3), especially evident in coding (number writing) and number fact retrieval, along with a moderate degree of more general writing difficulties; and (c) a mixed disorder of reading and writing skills (cluster 4), with reading speed more affected than accuracy and writing impairments, especially evident in word spelling, i.e., with a strong orthographic component. These clusters are highly representative of the literature on comorbidity in specific learning disorders (see [75,76]). Subsequently, the different subgroups were compared with respect to their performance profile in the various STM conditions assessed through the computerized platform.
For all the overall STM variables, with the exception of MI_VV, TD children performed at a higher level compared with some or all of the SLD clusters. No significant differences with respect to overall STM variables emerged among any of the SLD clusters. However, not all children with SLD showed significantly lower performances compared with TD on all variables, whereby different degrees of impairment could be observed in the different clusters. More precisely, the group with mathematical disorders (cluster 3) was not significantly impaired on MO with auditory input and oral response (the “span-like” task), while the group with reading and writing disorders (cluster 4) was not significantly impaired on MO with either visual input and oral response or with auditory input and the visuomotor response. This might suggest that children with mathematical disorders are not particularly impaired in purely verbal memory (indeed, children in this cluster have greater difficulties in processes related to the number system than to the calculation system, and they especially struggle with number reading and number writing, possibly pointing to a problem in coding, i.e., in the use of cross-modal translation). The results further suggest that children with reading (especially in the speed component) and writing disorders somehow exploit double-coding (visual and verbal) and transcoding processes to improve their performance, compared with completely verbal and completely visual conditions. Indeed, reading and spelling performance have a significant correlation with number transcoding, which is the ability to establish a relationship between the verbal and Arabic representations of numbers, when a conversion of numerical symbols from one notation to the other is necessary [77]. As discussed in [78], phonological STM is among the variables associated with reading/spelling and arithmetic performance (see [79]. More specifically, phonological STM, together with phonemic awareness, appears to be associated with word reading [80] and WM with both reading/spelling and math learning [81]. However, it still remains to be clarified whether verbal and non-verbal WM differentially impact reading/spelling and math performance [82].
It can be observed that the group with reading disorder (especially affecting accuracy) (cluster 2) and the group with mixed reading speed and writing disorders (cluster 4) tend to be most different from the TD group in most STM variables. In contrast, the group with mathematical disorder (cluster 3) tends to be not too dissimilar from the TD group in STM performances, both in terms of absolute scores and in terms of general profile. This could be due to the fact that an impairment in phonological (auditory–verbal) STM has a larger impact on the encoding, storing, and retrieval of information (being the main modality for verbal stimuli and an additional modality for visual stimuli) compared with an impairment in visual STM, where additional verbal coding may help overcome the resulting deficits [83].
The differences among clusters turned out to be influenced by a series of task-related factors, such as stimulus type (letters vs. colours), presentation modality (sequential vs. simultaneous), presence or absence of articulatory suppression, and presence or absence of distractors during response. Significant interactions with cluster mainly concerned differential effects between colours and letters, emerging especially for MO in all combinations (with the exception of the auditory input–oral response modality), but also for MI with visual input and either the visual–motor or oral response. In all cases, the interaction originated from a reduced advantage of letters over colours in SLD clusters compared with TD children, which was even reversed in the case of MO with auditory input and the visual–motor response (this advantage for colours was present in all clusters, but it was significant for the MD group—cluster 3—only). The advantage of letters over colours was observed previously by Giorgetti and Lorusso [51] and was interpreted as possibly being due to the fact that alphabetic stimuli are more prone to activate associated visual and verbal representations (as they do in everyday reading contexts), which may favour memorization. Also in that previous study, the effect was greater for TD children and less marked for children with dyslexia, probably because of the reduced automaticity with which dyslexic children activate letter-related representations [51]. The reversal of such an effect in children with SLD—especially those with mathematical difficulties—in the case of auditory input and the visual–motor response could tentatively be explained by the greater difficulty in activating visual representations of letters starting from purely auditory information (which is less trained than the usual visual–oral condition characterizing reading) for children with SLD, especially when a transcoding deficit is present, as in the case of children in the MD group. In a seminal study by [84], it was shown that, while picture recall data reflected verbal STM characteristics, picture recognition results could not be incorporated within a verbal STM framework, and a visual coding system had to be postulated to account for the data. However, the specific status of colours for STM is a debated one. Older studies suggested that colours have a special status, where coding is essentially verbal ([85]), but then more recent studies [86] have proposed alternative accounts highlighting the importance of several moderating variables and a shift from a dichotomous verbal–visual perspective to a continuous dimension describing the involvement of language in the storage and retrieval of visual information [87]. Indeed, the very clear-cut differences that emerged between letter and colour STM in the present study seem to confirm that the coding systems for the two types of stimuli are distinct and that they are differentially affected by SLD.
Presentation (sequential versus simultaneous) also turned out to interact with cluster for both MO and MI with visual input and auditory response. More precisely, the group of children with reading (speed) and writing impairments (cluster 4) was impaired with respect to TD only with simultaneous presentation, whereas children with mathematical disorders (cluster 3) were impaired only with sequential presentation. Children with disorders limited to the accuracy component of reading (cluster 2), on the other hand, showed difficulties with both presentation modalities. This pattern of results could suggest that memorizing strings of items simultaneously presented is a specific challenge for children who have spelling disorders, i.e., who struggle with the storage and retrieval of orthographic, whole-word representations [76,88]. Children with mathematical disorders, in contrast, struggle with the sequential processing of information, and this difficulty is reflected in their impaired performances on counting tasks, number reading and writing (requiring sequential analysis of position-based codes), and number facts (retrieval of sequences of results or combinations of operations and their results—such as multiplication tables, learned by heart like phonological strings and no longer computed as new operations) (see [89,90]). Finally, children who are inaccurate in both reading and number fact retrieval (cluster 2)—not surprisingly—are impaired with both sequential and simultaneous presentation: they seem to have difficulties in memorizing visual input and accurately converting it to oral (phonological) output, regardless of the specific presentation modality. This subtype indeed resembles L-type dyslexics in Bakker’s Balance Model [91] and Shany and Share’s [92] inaccurate but not slow subtype, which is usually characterized by an impairment in visual–spatial processing but also low scores on phonemic awareness tasks [93,94]. The same group of children showing inaccurate reading and number fact retrieval has an atypical pattern of performance with respect to the effects of articulatory suppression. Indeed, while all children with and without SLD perform better with letters than with colours regardless of articulatory suppression, children in the inaccurate group perform better with colours than with letters only if articulatory suppression is requested (i.e., if purely visual storage is allowed, not permitting phonological recoding of the stimuli). This is in line with the visual–spatial impairment just described for this group, but it further suggests that if all the children profit from a greater familiarity with letter sequences (even if only as visual clusters), this facilitation is not present for this group because of its impairment in coding and storing visual clusters of familiar stimuli (letters in this case) [74,75].
The presence of distractors significantly impacted cluster-related differences in MI with visual input and the visual–motor response. Indeed, all children with SLD were more disturbed by the presence of distractors as compared with TD children. This result points to the presence of general impairments in executive functions (supporting the inhibition of interference and resistance to distraction) in all subtypes of SLD [95,96,97]. Actually, the influence of distractors (in consideration of the proneness to interference usually described for dyslexic children) was shown in a former study [51] on a homogeneous group of children with specific reading disorders, emerging in the case of visual presentation and the visual–motor response.
The results further show that cluster-specific effects of intra-task variations (the various factors in the task) emerged for most MO variables and for two of the four MI variables, namely, the ones with visual presentation. The role of memory for order as a specific marker of SLD was highlighted by Majerus [17]. None of the two auditory–oral tasks (roughly similar to traditional span tasks with letter and colour stimuli) showed any differences among clusters in the effects of task characteristics. Since the children in all clusters showed impairments on auditory–oral tasks similar to other tasks, this result does not suggest that auditory–oral tasks are any easier for children with SLD, but rather that they are equally difficult for all of them, regardless of the specific functional profiles. Difficulties related to STM with visual presentation, in contrast, showed greater variability from group to group.
The limitations of this study relate to the relatively small size of the subgroups, suggesting that generalization of the results requires caution. Nonetheless, the general consistency and redundancy in the results confirm a sufficient degree of reliability in the results and the differences emerging from the analyses.
The main aim of this study was to provide evidence that a very detailed characterization of STM performance patterns (such as that offered by STM Suite) in children with learning disorders can be useful for clinical purposes. Possible applications of the present findings include better functional characterization of SLD subgroups as well as a better understanding of the bases of specificity and comorbidity in learning disorders. A special note should be given to intervention. It has been clearly shown that WM and STM training (although fewer studies exist on the latter) produce detectable improvements which, however, do not generalize to near or, especially, to far-related contents and tasks [98,99,100,101,102]. Some studies, however, do suggest that training different types of contents and tasks at the same time (as indirectly suggested by [103]) and adding explicit training on strategies [104,105] to facilitate learning of new routines [106] and possibly also brain stimulation (TDCS) [107] might help overcome the problem of reduced transfer at least to a certain extent. From this perspective, the tasks of the testing battery might provide a rich set of tasks and contents that could easily be accompanied by a set of effective, explicitly trained strategies (specific to subsets of tasks or stimulus types) and thus allow for an easy and direct switch from testing to training. Clearly, such applications are purely speculative at the moment and should be validated by future studies. A further possibility to exploit the results of the STM assessment for rehabilitation is more indirect and relates to the use of individual STM profiles for the design of patient-centred, personalized intervention strategies taking into account strengths and weaknesses (see [108]), suggesting specific pathways through which compensation of observed deficits would more easily occur as opposed to other possible pathways.
7. Conclusions
The results of the present study show that measuring STM scores in different conditions can be an informative and effective strategy. Indeed, very specific patterns of STM profiles have been found to characterize different subtypes of specific learning disorders. Furthermore, they show that the digital platform developed for STM assessment in the various conditions is able to capture relevant differences that can help describe the strengths and difficulties of children and identify appropriate goals for intervention, capitalizing on memory when advantageous and setting memory as a possible target for specific intervention when needed.
The software design was focused on the identification and selection of the variables, the administration procedure, and the interruption and scoring rules.
In this phase, our goal was to develop a tool capable of detecting performance behaviours that were modulated by the involved process variables. The scope was primarily experimental with a binding, highly controlled administration to the subjects. However, the technical characteristics make this tool suitable for use on touchscreen tablets or with remote administration. The software can be customized (“format”) to set a sequence of trial sessions tailored to a specific user or group of users. For instance, it is possible to select and prepare/foresee a sequence of exercises dedicated to the user’s specific features (reading, calculating, and writing impairments). Moreover, a child’s performance on the task can be monitored in synchronous remote modality. This functionality can be implemented and managed by using software dedicated to this purpose. As a result, the operator can take control or stop the trial from remote. It is also possible to create scoring summaries easily accessible to users and/or clinicians/trainers.
The possible use of the platform as an intervention tool still has to be experimentally assessed, but the structure of the software makes it a very flexible instrument that could be easily adapted to the specific rehabilitation needs of each particular child, in a personalization-oriented approach.
Supplementary Materials
The following supporting information can be downloaded at: https://www.mdpi.com/article/10.3390/app14135891/s1, Figure S1: STMsuite_Stimuli; Video S1: Performance of tasks.
Author Contributions
Conceptualization, M.L.L. and M.G.; methodology, M.L.L., M.G. and A.T.; software, R.B.; validation, M.G. and M.L.L.; formal analysis, M.L.L. and M.G.; investigation, M.G.; resources, M.L.L. and M.G.; data curation, M.G.; writing—original draft preparation, M.G. and M.L.L.; writing—review and editing, M.G., A.T. and M.L.L.; visualization, M.G., A.T. and M.L.L.; supervision, M.L.L.; project administration, M.G. and M.L.L.; funding acquisition, M.L.L. and M.G. All authors have read and agreed to the published version of the manuscript.
Funding
This research was funded by the Italian Ministero della Salute, grant number RC2023 to M.L.L.
Institutional Review Board Statement
This study was conducted in accordance with the Declaration of Helsinki and approved by the Institutional Review Board (or Ethics Committee) of Scientific Institute IRCCS E. Medea (protocol Approved 11 March 2014) for studies involving humans.
Informed Consent Statement
Informed consent was obtained from all subjects involved in this study (children’s parents).
Data Availability Statement
The original data presented in this study (only de-identified data related to STM memory scores) were uploaded to Zenodo (https://doi.org/10.5281/zenodo.12588119) and are publicly available.
Conflicts of Interest
The authors declare no conflicts of interest.
Appendix A
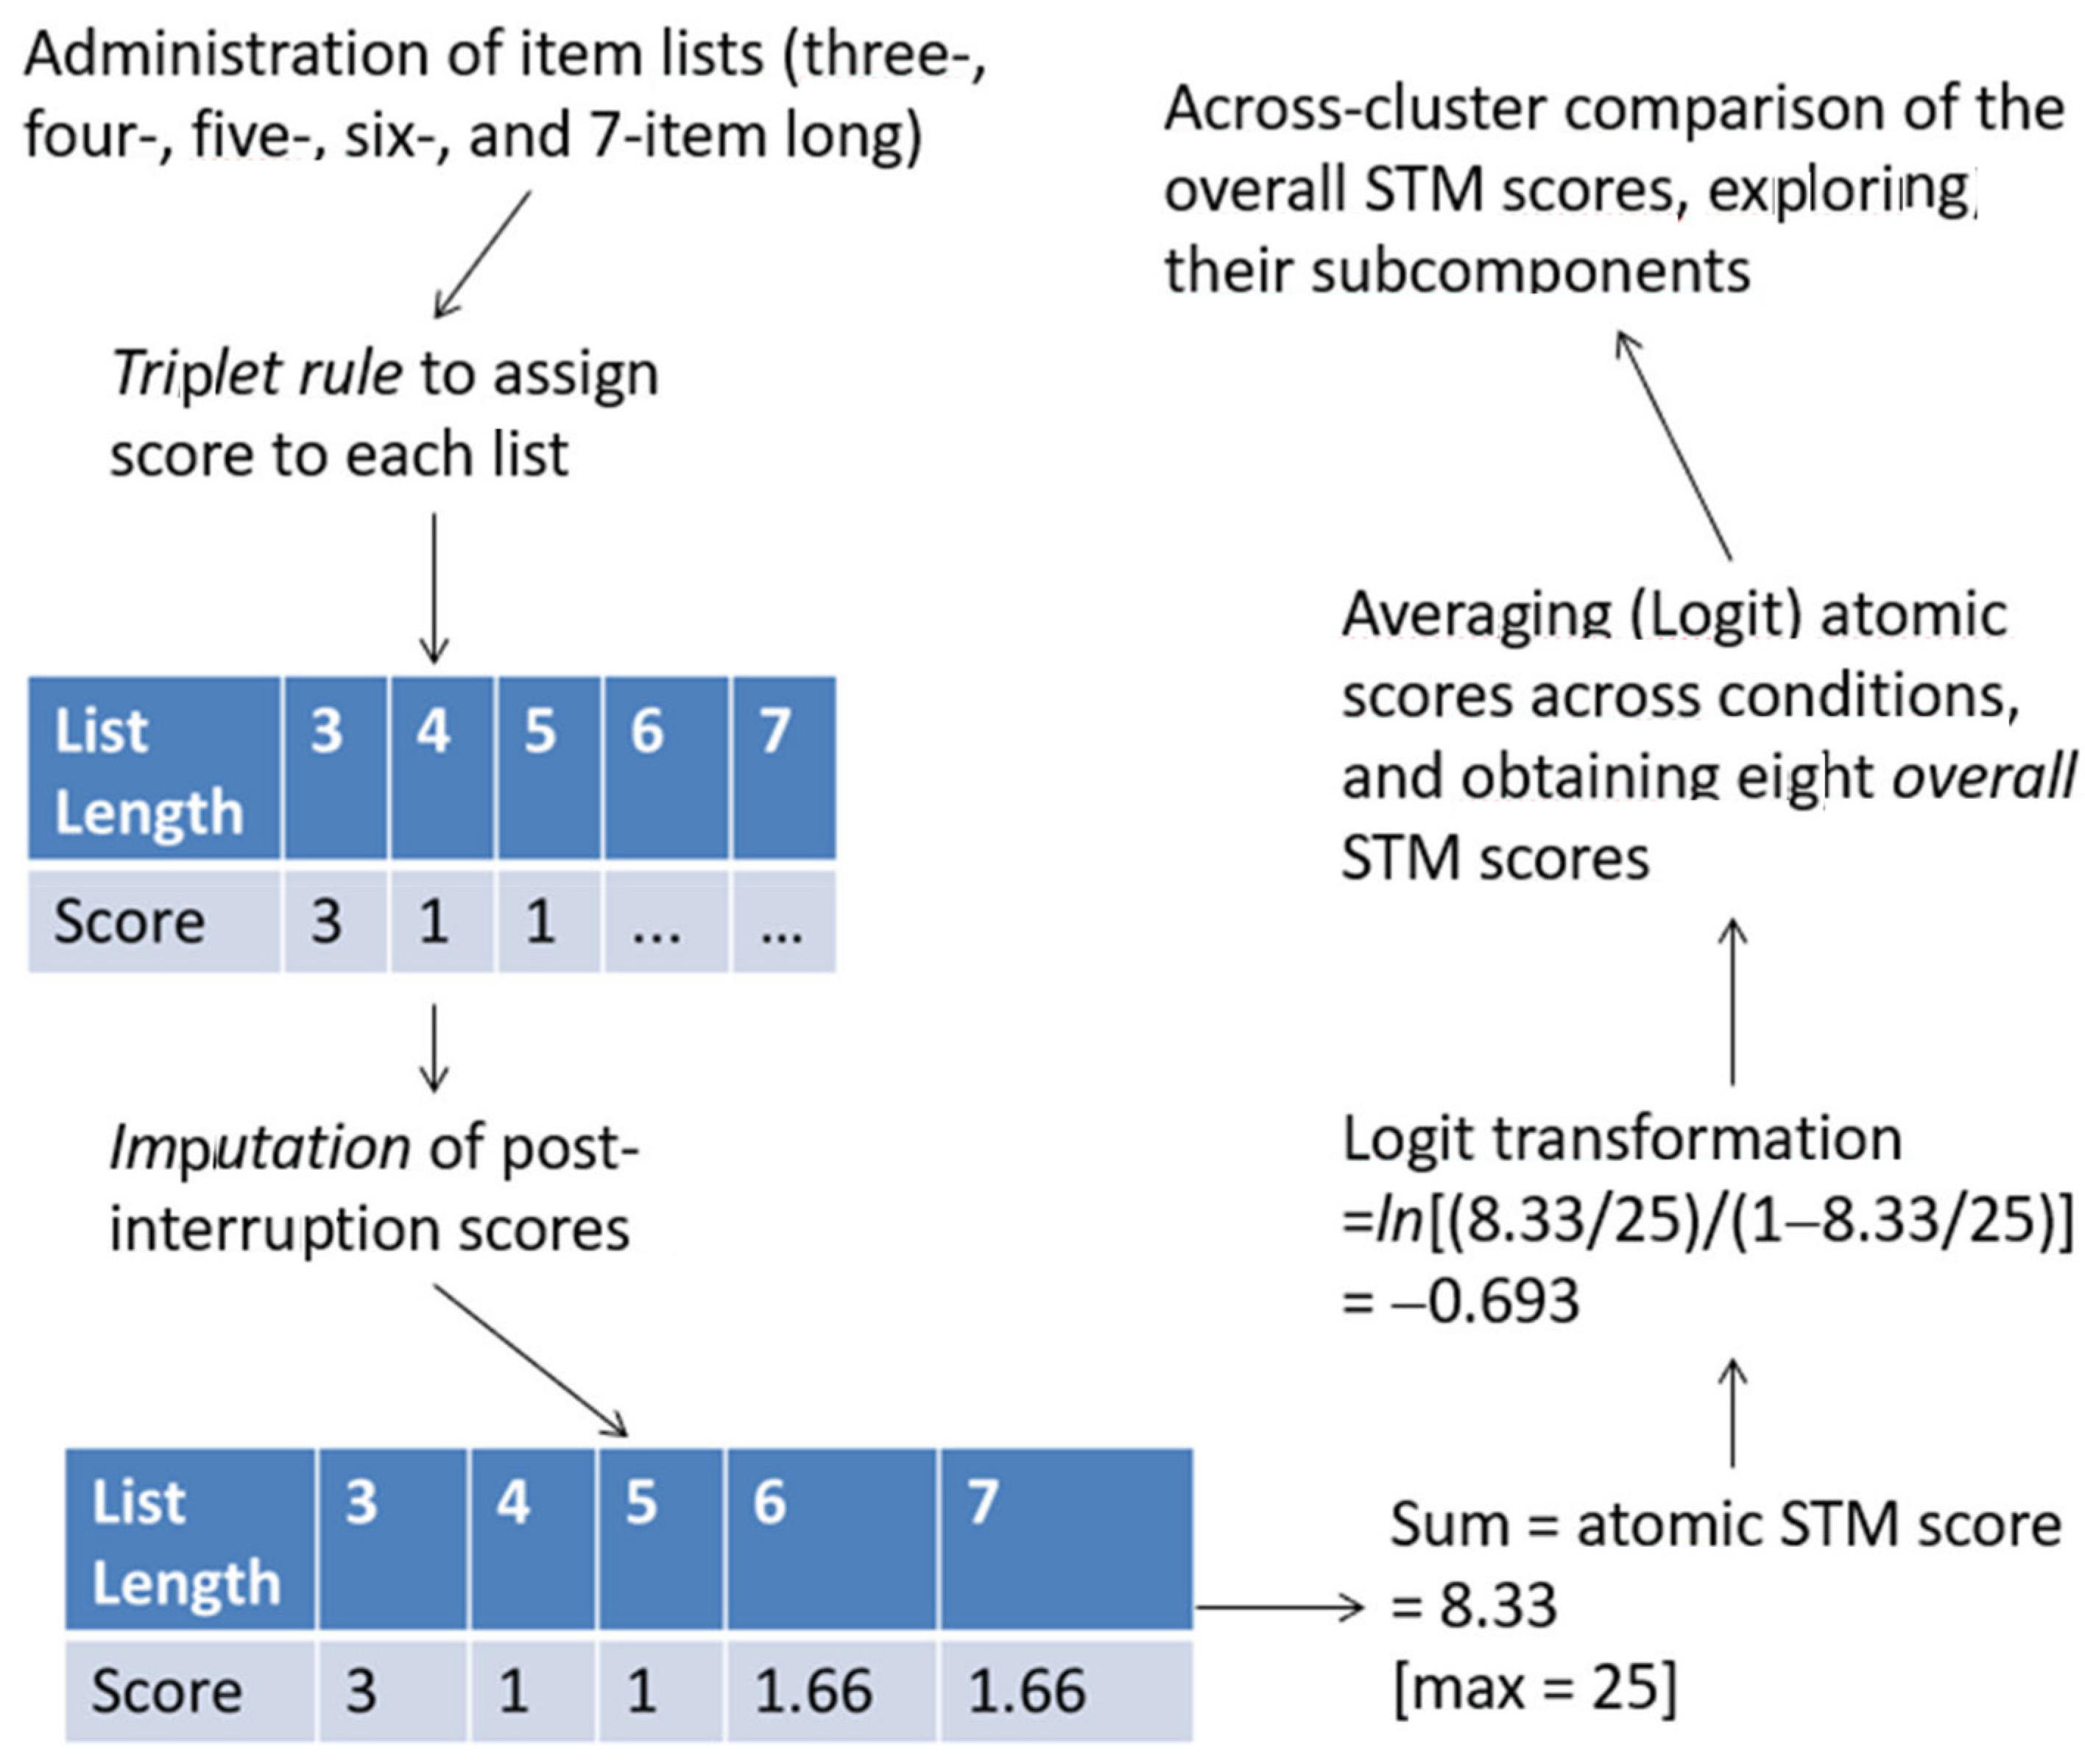
Figure A1 illustrates and exemplifies the full processing applied to the STM scores. The details of the procedure are reported in the sections below.
- 1.
- Computation of Short-Term Memory (STM) scores.
Each list was given two scores, one reflecting the number of correctly recalled items, regardless of their order (memory for item, MI), and another reflecting the number of correct items recalled in the correct order (memory for order, MO), as detailed in [51]. When computing MO, a correct item was granted 1 point even when it was recalled in a wrong position, provided that it was preceded and followed by correct items (including empty spaces on initial and final positions). Per-condition MI and MO raw scores were, respectively, the simple sums of the MI and MO scores for all the lists that were administered. These sums could range from 0 to 25, with the top score corresponding to the full recall of the three-, four-, five-, six-, and seven-item-long lists (3 + 4 + 5 + 6 + 7 = 25). A discontinuation rule (whose mathematical details are reported in [51]) was applied in order to avoid unnecessary frustration in children. Discontinuation could occur after the four-, five-, or six-item list. Because of this discontinuation, the raw MI and MO scores did not always reflect the fraction of recalled items out of a constant number of administered items, as the latter varied across trials from 12 to 18 to 25 (according to whether, and where, a discontinuation occurred). This extra variability would detract from the stability of the scores; hence, we validated a method to adjust those scores and compensate for the missing values in an optimal way. This imputation method is detailed below.
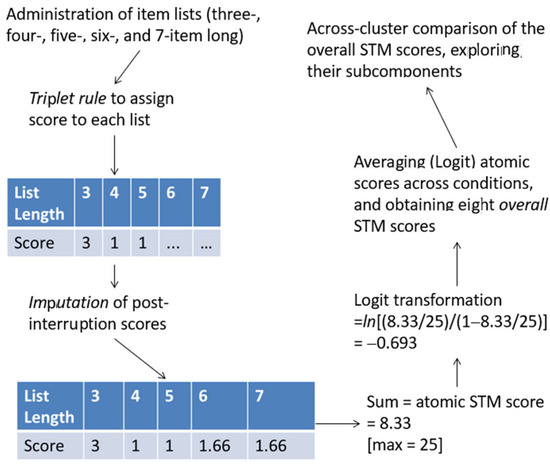
Figure A1.
Flowchart summarizing how STM scores were processed. In the example, an MO trial is shown in which the administration was discontinued after the five-item-long list, and the three-, four-, and five-item lists obtained scores = 3, 1, and 1.
Figure A1.
Flowchart summarizing how STM scores were processed. In the example, an MO trial is shown in which the administration was discontinued after the five-item-long list, and the three-, four-, and five-item lists obtained scores = 3, 1, and 1.
- 2.
- Validation of the imputation criteria for STM scores.
Following [[109], Ch. 25], we imputed scores from missing lists, i.e., those that were never administered because of the discontinuation rule. Suppose that a subject’s scores on the three-, four-, five-, six-, and seven-item lists are 3, 1, 1, 2, and 4. By applying the discontinuation rule, the procedure would have stopped after the third list, i.e., after the 3, 1, and 1 scores. We studied four imputation solutions. Solution (i) takes the top score, max(3,1,1) = 3, and imputes (3,3) for the last two scores; solution (ii) takes the last score, last(3,1,1) = 1, thus imputing (1,1); solution (iii) takes the mean score, mean (3,1,1) = 1.66, thus imputing (1.66,1.66); solution (iv) takes the mean only from lists that are five or six items long—in this case, we only have the five-item list before discontinuation, whose score is 1, so imputation is (1,1). Clearly, the best imputation technique is the one producing an imputed score that is the closest to the real, full score of 11 (3 + 1 + 1 + 2 + 4). Operationally, we decided to choose the imputation technique that produced the highest correlation between the imputed and the real scores (with the latter being used as a gold standard). These correlations could indeed be computed because we had a subset of trials in which the discontinuation rules could not be applied (all those requiring an oral response; on them, responses were not entered online via a keyboard, so the software could not apply the complex discontinuation rules and give a warning signal to the experimenter). So, for these trials, we had both the full scores (gold standard) and the scores that would have been obtained if discontinuation had been applied; thus, we had all the elements necessary for the correlations to be derived.
N = 581 data points were used in the analyses (all available scores from all subjects in all oral output conditions). Imputation solution (iii) showed the highest correlation with the gold standard for the MO measure, r = 0.9832; imputation solution (iv) showed the highest correlation with the gold standard for the MI measure, r = 0.98. Hence, techniques (iii) and (iv) were applied to impute discontinuation-related missing sub-scores (MO and MI, respectively). In order to obtain a perfectly homogeneous dataset, we applied the same imputation to all conditions, even to the oral output ones (in which no imputation would have been necessary because no discontinuation was ever applied).
- 3.
- Normalizing transformations for the STM indices.
The distributions of atomic STM scores were often very skewed, either way in the 0–25 bounded scale. The Logit transformation [110], pp. 284–285; ref. [111], offers a theoretically founded, common solution for distributions lying anywhere along a closed scale. Indeed, in our set, there were several variables whose peak was close to, or at, ceiling = 25 and some whose peak was relatively close to floor = 0. Thus, we took each atomic STM score (0–25, after imputation), replaced 0 and 25 with 0.5 and 24.5 to avoid infinities, computed proportions p = STM/25, and, finally, obtained Logit(p) = ln[p/(1 − p)]. This normalizing transformation was applied to all atomic STM measures, leading to much more symmetrical distributions. These new Logit-transformed variables were used in all subsequent analyses. Figure A2 and Figure A3 below report the distributions of the eight overall STM variables (obtained by averaging across multiple atomic scores), showing that the ceiling/floor effects disappeared (thanks to the Logit transformation and averaging procedure), leaving quite symmetrical patterns. The skewness values are reported in Table A1.
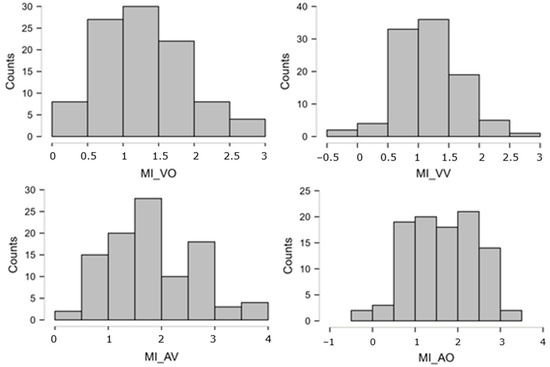
Figure A2.
Distributions of the STM overall scores (MI). These are expressed on the Logit scale, which gives a score of −3.89 to the lowest possible performance (raw = 0/25 = 0%) and +3.89 to the highest (raw = 100% = 25/25). Intermediate performances obtain (e.g.) Logit = 0 for raw = 50%, Logit = +1.1 for raw = 75%, Logit = +2.2 for raw = 90%, etc.
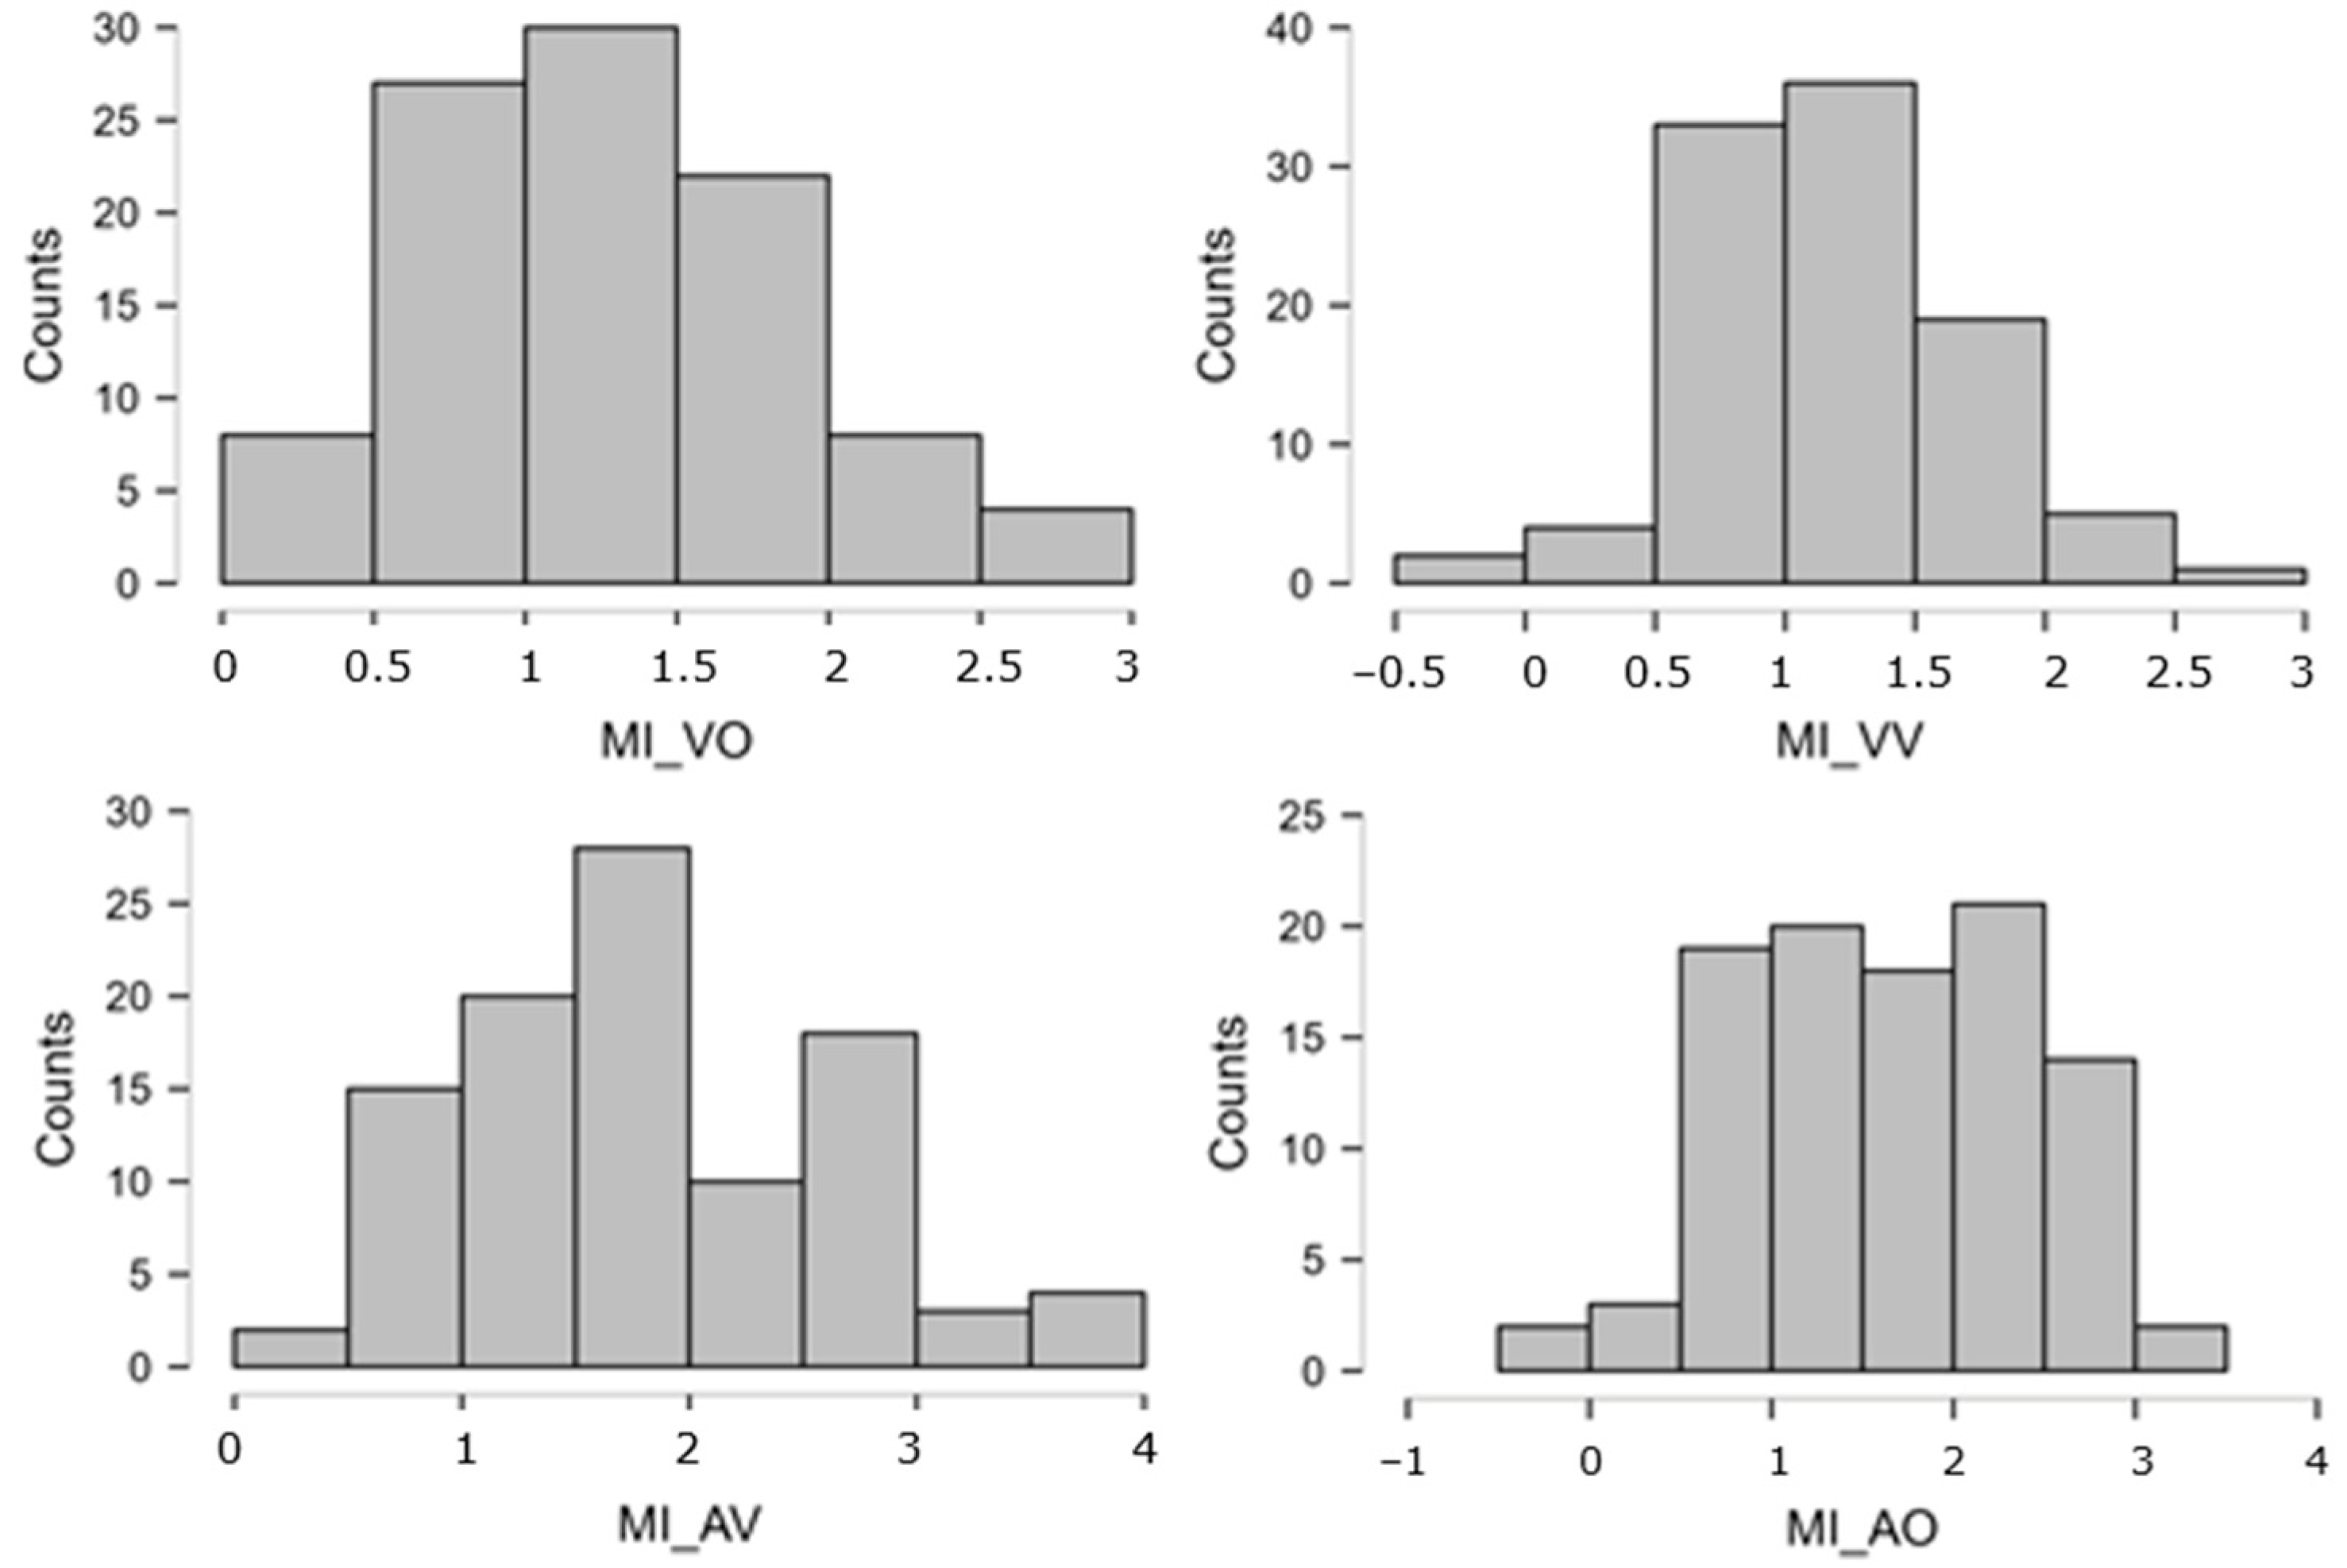
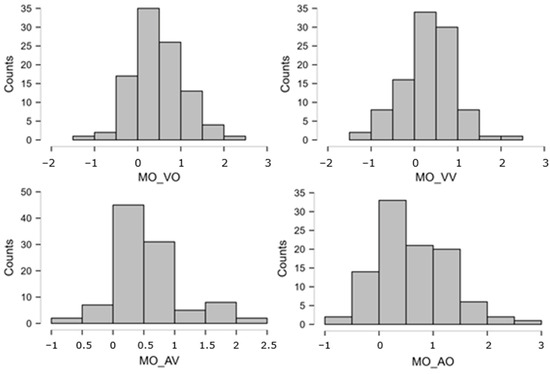
Figure A3.
Distributions of the STM overall scores (MO). See the caption to Figure A2 for an explanation of the Logit scale.
Figure A3.
Distributions of the STM overall scores (MO). See the caption to Figure A2 for an explanation of the Logit scale.
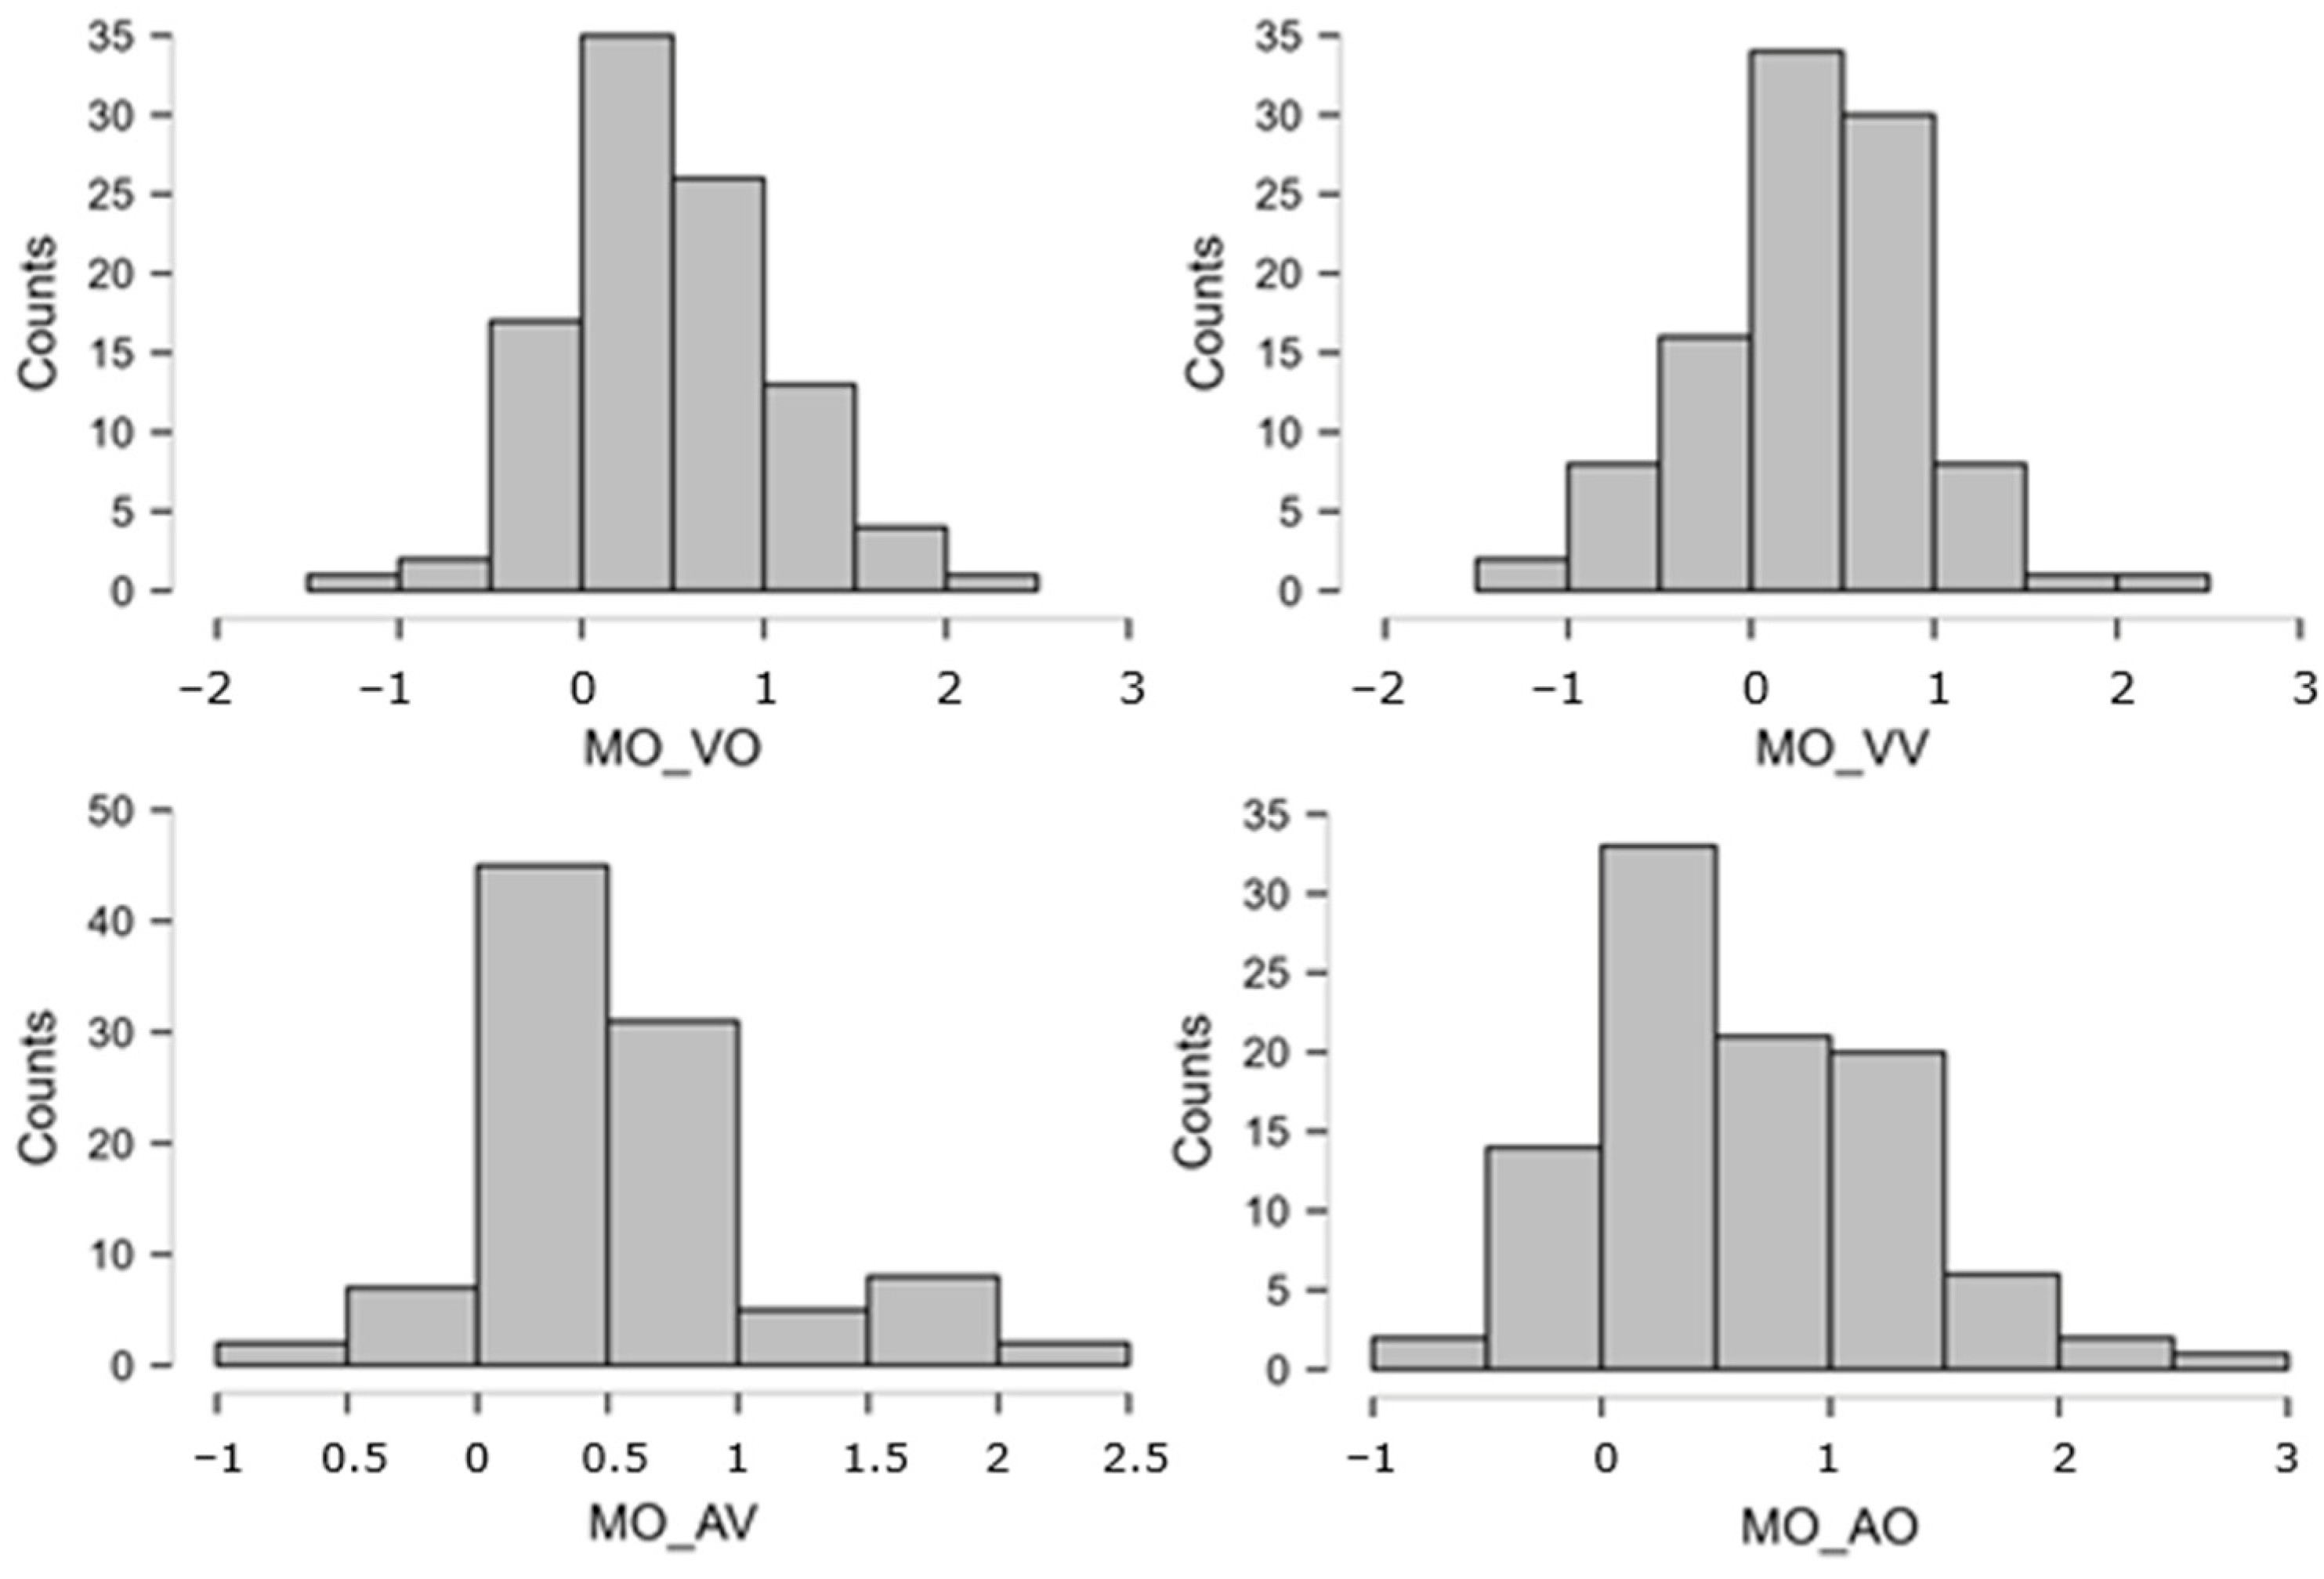

Table A1.
Skewness values for the eight overall STM variables.
Table A1.
Skewness values for the eight overall STM variables.
| Variable | Skewness |
|---|---|
| MI_VO | 0.377 |
| MI_AV | 0.433 |
| MI_VV | 0.02 |
| MI_AO | −0.09 |
| MO_VO | 0.489 |
| MO_AV | 0.95 |
| MO_VV | 0.159 |
| MO_AO | 0.467 |
- 4.
- Reliability of the eight overall STM scores.
Given that the STM battery (a rather long procedure) was administered only once, we could not directly estimate the test–retest reliability level. However, we did have conditions which were empirically quite similar, so we could provide lower-bound estimates of the reliability coefficients. The logic is that the reliability coefficient of any given variable must be higher than the highest correlation coefficient recorded among a set of “similar” variables, under the statistical notion that the removal of any experimental difference (that is, the replacement of “similarity” with “identity”) should increase that top correlation. We performed this computation on the eight “overall” variables, and for each of them, we took the set of “similar” variables as the ones belonging to the same family, MO or MI. The lower-bound estimates of reliability coefficients ranged from 0.612 to 0.778 and are reported in Table A2.

Table A2.
Correlation matrix for the eight overall STM variables and lower-bound estimates of the reliability coefficient (i.e., the maximum correlations with any variable of the same set, MO or MI, reported in bold).
Table A2.
Correlation matrix for the eight overall STM variables and lower-bound estimates of the reliability coefficient (i.e., the maximum correlations with any variable of the same set, MO or MI, reported in bold).
| MO_VO | MO_AV | MO_VV | MO_AO | MI_VO | MI_AV | MI_VV | MI_AO | Max | ||
|---|---|---|---|---|---|---|---|---|---|---|
| MO_VO | 0.739 | 0.778 | 0.612 | 0.918 | 0.728 | 0.708 | 0.637 | MO_VO | 0.778 | |
| MO_AV | 0.739 | 0.695 | 0.585 | 0.673 | 0.798 | 0.637 | 0.620 | MO_AV | 0.739 | |
| MO_VV | 0.778 | 0.695 | 0.566 | 0.728 | 0.721 | 0.887 | 0.611 | MO_VV | 0.778 | |
| MO_AO | 0.612 | 0.585 | 0.566 | 0.614 | 0.593 | 0.525 | 0.808 | MO_AO | 0.612 | |
| MI_VO | 0.918 | 0.673 | 0.728 | 0.614 | 0.739 | 0.728 | 0.675 | MI_VO | 0.739 | |
| MI_AV | 0.728 | 0.798 | 0.721 | 0.593 | 0.739 | 0.723 | 0.687 | MI_AV | 0.739 | |
| MI_VV | 0.708 | 0.637 | 0.887 | 0.525 | 0.728 | 0.723 | 0.599 | MI_VV | 0.728 | |
| MI_AO | 0.637 | 0.620 | 0.611 | 0.808 | 0.675 | 0.687 | 0.599 | MI_AO | 0.687 |
References
- Jonides, J.; Lewis, R.L.; Nee, D.E.; Lustig, C.A.; Berman, M.G.; Moore, K.S. The Mind and Brain of Short-Term Memory. Annu. Rev. Psychol. 2008, 59, 193–224. [Google Scholar] [CrossRef] [PubMed]
- Hardt, O.; Nader, K.; Nadel, L. Decay Happens: The Role of Active Forgetting in Memory. Trends Cogn. Sci. 2013, 17, 111–120. [Google Scholar] [CrossRef] [PubMed]
- Berman, M.G.; Jonides, J.; Lewis, R.L. In Search of Decay in Verbal Short-Term Memory. J. Exp. Psychol. Learn. Mem. Cogn. 2009, 35, 317–333. [Google Scholar] [CrossRef] [PubMed]
- Cowan, N. The Many Faces of Working Memory and Short-Term Storage. Psychon. Bull. Rev. 2017, 24, 1158–1170. [Google Scholar] [CrossRef] [PubMed]
- Baddeley, A.D.; Hitch, G. Working Memory. In Psychology of Learning and Motivation; Academic Press: New York, NY, USA, 1974; Volume 8, pp. 47–89. [Google Scholar]
- Baddeley, A.D. Working Memory; Oxford University Press: Oxford, UK, 1986. [Google Scholar]
- Cowan, N. Working Memory Capacity; Hove, E.S., Ed.; Psychology Press: London, UK, 2005. [Google Scholar]
- Kane, M.J.; Engle, R.W. The Role of Prefrontal Cortex in Working-Memory Capacity, Executive Attention, and General Fluid Intelligence: An Individual-Differences Perspective. Psychon. Bull. Rev. 2002, 9, 637–671. [Google Scholar] [CrossRef] [PubMed]
- Klingberg, T.; Forssberg, H.; Westerberg, H. Increased Brain Activity in Frontal and Parietal Cortex Underlies the Development of Visuospatial Working Memory Capacity during Childhood. J. Cogn. Neurosci. 2002, 14, 1–10. [Google Scholar] [CrossRef] [PubMed]
- Cowan, N.; Elliott, E.M.; Saults, S.J.; Morey, C.C.; Mattox, S.; Hismjatullina, A.; Conway, A.R.A. On the Capacity of Attention: Its Estimation and Its Role in Working Memory and Cognitive Aptitudes. Cogn. Psychol. 2005, 51, 42–100. [Google Scholar] [CrossRef] [PubMed]
- Engle, R.W. Working Memory Capacity as Executive Attention. Curr. Dir. Psychol. Sci. 2002, 11, 19–23. [Google Scholar] [CrossRef]
- Kane, M.J.; Conway, A.R.A.; Hambrick, D.Z.; Engle, R.W. Variation in Working Memory Capacity as Variation in Executive Attention and Control. Var. Work. Mem. 2012, 1, 21–48. [Google Scholar] [CrossRef]
- Cowan, N. Chapter 20 What Are the Differences between Long-Term, Short-Term, and Working Memory? Prog. Brain Res. 2008, 169, 323–338. [Google Scholar] [PubMed]
- Wager, T.D.; Smith, E.E. Neuroimaging Studies of Working Memory: A Meta-Analysis. Cogn. Affect. Behav. Neurosci. 2003, 3, 255–274. [Google Scholar] [CrossRef] [PubMed]
- Todd, J.J.; Marois, R. Capacity Limit of Visual Short-Term Memory in Human Posterior Parietal Cortex. Nature 2004, 428, 751–754. [Google Scholar] [CrossRef] [PubMed]
- Bettencourt, K.C.; Xu, Y. Decoding the Content of Visual Short-Term Memory under Distraction in Occipital and Parietal Areas. Nat. Neurosci. 2015, 19, 150–157. [Google Scholar] [CrossRef] [PubMed]
- Majerus, S.; D’Argembeau, A.; Perez, T.M.; Belayachi, S.; Van Der Linden, M.; Collette, F.; Salmon, E.; Seurinck, R.; Fias, W.; Maquet, P. The Commonality of Neural Networks for Verbal and Visual Short-Term Memory. J. Cogn. Neurosci. 2010, 22, 2570–2593. [Google Scholar] [CrossRef] [PubMed]
- Martinez Perez, T.; Majerus, S.; Poncelet, M. The Contribution of Short-Term Memory for Serial Order to Early Reading Acquisition: Evidence from a Longitudinal Study. J. Exp. Child Psychol. 2012, 111, 708–723. [Google Scholar] [CrossRef] [PubMed]
- Henson, R.; Hartley, T.; Burgess, N.; Hitch, G.; Flude, B. Selective Interference with Verbal Short-Term Memory for Serial Order Information: A New Paradigm and Tests of a Timing-Signal Hypothesis. Q. J. Exp. Psychol. Sect. A Hum. Exp. Psychol. 2003, 56, 1307–1334. [Google Scholar] [CrossRef] [PubMed]
- Hurlstone, M.J.; Hitch, G.J.; Baddeley, A.D. Memory for Serial Order across Domains: An Overview of the Literature and Directions for Future Research. Psychol. Bull. 2014, 140, 339–373. [Google Scholar] [CrossRef] [PubMed]
- Hachmann, W.M.; Cashdollar, N.; Postiglione, F.; Job, R. The relationship of domain-general serial order memory and reading ability in school children with and without dyslexia. J. Exp. Child Psychol. 2020, 193, 104789. [Google Scholar] [CrossRef] [PubMed]
- Ward, G.; Tan, L.; Grenfell-Essam, R. Examining the Relationship between Free Recall and Immediate Serial Recall: The Effects of List Length and Output Order. J. Exp. Psychol. Learn. Mem. Cogn. 2010, 36, 1207–1241. [Google Scholar] [CrossRef] [PubMed]
- Bhatarah, P.; Ward, G.; Tan, L. Examining the Relationship between Free Recall and Immediate Serial Recall: The Serial Nature of Recall and the Effect of Test Expectancy. Mem. Cognit. 2008, 36, 20–34. [Google Scholar] [CrossRef] [PubMed][Green Version]
- Guidali, G.; Pisoni, A.; Bolognini, N.; Papagno, C. Keeping Order in the Brain: The Supramarginal Gyrus and Serial Order in Short-Term Memory. Cortex 2019, 119, 89–99. [Google Scholar] [CrossRef] [PubMed]
- Majerus, S. Verbal Working Memory and the Phonological Buffer: The Question of Serial Order. Cortex 2019, 112, 122–133. [Google Scholar] [CrossRef] [PubMed]
- Baddeley, A.D.; Logie, R.H. Working Memory: The Multicomponent Model. In Models of Working Memory: Mechanisms of Active Maintenance and Executive Control; Cambridge University Press: Cambridge, UK, 1999. [Google Scholar]
- Burgess, G.C.; Braver, T.S. Neural Mechanisms of Interference Control in Working Memory: Effects of Interference Expectancy and Fluid Intelligence. PLoS ONE 2010, 5, e12861. [Google Scholar] [CrossRef] [PubMed]
- Hornung, C.; Brunner, M.; Reuter, R.A.P.; Martin, R. Children’s Working Memory: Its Structure and Relationship to Fluid Intelligence. Intelligence 2011, 39, 210–221. [Google Scholar] [CrossRef]
- Archibald, L.M.D.; Gathercole, S.E. Visuospatial Immediate Memory in Specific Language Impairment. J. Speech Lang. Hear. Res. 2006, 49, 265–277. [Google Scholar] [CrossRef]
- Archibald, L.M.D.; Gathercole, S.E. The Complexities of Complex Memory Span: Storage and Processing Deficits in Specific Language Impairment. J. Mem. Lang. 2007, 57, 177–194. [Google Scholar] [CrossRef]
- Borella, E.; Carretti, B.; Pelegrina, S. The Specific Role of Inhibition in Reading Comprehension in Good and Poor Comprehenders. J. Learn. Disabil. 2010, 43, 541–552. [Google Scholar] [CrossRef] [PubMed]
- Alloway, T.P.; Gathercole, S.E.; Pickering, S.J. Verbal and Visuospatial Short-Term and Working Memory in Children: Are They Separable? Child Dev. 2006, 77, 1698–1716. [Google Scholar] [CrossRef] [PubMed]
- Swanson, H.L.; Zheng, X.; Jerman, O. Working Memory, Short-Term Memory, and Reading Disabilities: A Selective Meta-Analysis of the Literature. J. Learn. Disabil. 2009, 42, 260–287. [Google Scholar] [CrossRef]
- Swanson, H.L.; Zheng, X. Memory Difficulties in Children and Adults with Learning Disabilities. In Handbook of Learning Disabilities, 2nd ed.; The Guilford Press: New York, NY, USA, 2014. [Google Scholar]
- Leclercq, A.L.; Majerus, S. Serial-Order Short-Term Memory Predicts Vocabulary Development: Evidence from a Longitudinal Study. Dev. Psychol. 2010, 46, 417–427. [Google Scholar] [CrossRef] [PubMed]
- Majerus, S.; Boukebza, C. Short-Term Memory for Serial Order Supports Vocabulary Development: New Evidence from a Novel Word Learning Paradigm. J. Exp. Child Psychol. 2013, 116, 811–828. [Google Scholar] [CrossRef] [PubMed]
- Gathercole, S.E. Nonword Repetition and Word Learning: The Nature of the Relationship. Appl. Psycholinguist. 2006, 27, 513–543. [Google Scholar] [CrossRef]
- Martin, K.I.; Ellis, N.C. The Roles of Phonological Short-Term Memory and Working Memory in L2 Grammar and Vocabulary Learning. Stud. Second. Lang. Acquis. 2012, 34, 379–413. [Google Scholar] [CrossRef]
- French, L.M.; O’Brien, I. Phonological Memory and Children’s Second Language Grammar Learning. Appl. Psycholinguist. 2008, 29, 463–487. [Google Scholar] [CrossRef]
- Majerus, S.; Cowan, N. The Nature of Verbal Short-Term Impairment in Dyslexia: The Importance of Serial Order. Front. Psychol. 2016, 7, 1522. [Google Scholar] [CrossRef] [PubMed]
- Coltheart, M. What Kinds of Things Cause Children’s Reading Difficulties? Aust. J. Learn. Diffic. 2015, 20, 103–112. [Google Scholar] [CrossRef]
- Zoccolotti, P.; De Luca, M.; Marinelli, C.V.; Spinelli, D. Predicting Individual Differences in Reading, Spelling and Maths in a Sample of Typically Developing Children: A Study in the Perspective of Comorbidity. PLoS ONE 2020, 15, e0231937. [Google Scholar] [CrossRef] [PubMed]
- Agostini, F.; Zoccolotti, P.; Casagrande, M. Domain-General Cognitive Skills in Children with Mathematical Difficulties and Dyscalculia: A Systematic Review of the Literature. Brain Sci. 2022, 12, 239. [Google Scholar] [CrossRef]
- Landerl, K.; Fussenegger, B.; Moll, K.; Willburger, E. Dyslexia and Dyscalculia: Two Learning Disorders with Different Cognitive Profiles. J. Exp. Child. Psychol. 2009, 103, 309–324. [Google Scholar] [CrossRef]
- Rubinsten, O.; Henik, A. Double Dissociation of Functions in Developmental Dyslexia and Dyscalculia. J. Educ. Psychol. 2006, 98, 854–867. [Google Scholar] [CrossRef]
- Ashkenazi, S.; Rubinsten, O.; Henik, A. Attention, automaticity, and developmental dyscalculia. Neuropsychology 2009, 23, 535. [Google Scholar] [CrossRef] [PubMed]
- Baddeley, A.D.; Thomson, N.; Buchanan, M. Word Length and the Structure of Short-Term Memory. J. Verbal Learn. Verbal Behav. 1975, 14, 575–589. [Google Scholar] [CrossRef]
- Hulme, C.; Maughan, S.; Brown, G.D.A. Memory for Familiar and Unfamiliar Words: Evidence for a Long-Term Memory Contribution to Short-Term Memory Span. J. Mem. Lang. 1991, 30, 685–701. [Google Scholar] [CrossRef]
- Baddeley, A.; Lewis, V.; Vallar, G. Exploring the Articulatory Loop. Q. J. Exp. Psychol. Sect. A 1984, 36, 233–252. [Google Scholar] [CrossRef]
- Murray, D.J. Articulation and Acoustic Confusability in Short-Term Memory. J. Exp. Psychol. 1968, 78, 679–684. [Google Scholar] [CrossRef]
- Giorgetti, M.; Lorusso, M.L. Specific Conditions for a Selective Deficit in Memory for Order in Children with Dyslexia. Child Neuropsychol. 2019, 25, 742–771. [Google Scholar] [CrossRef] [PubMed]
- Wechsler, D. Wechsler Intelligence Scale for Children, 5th ed.; NCS Pearson: Toronto, ON, Candida, 2014. [Google Scholar]
- Reynolds, M.R.; Keith, T.Z. Multi-Group and Hierarchical Confirmatory Factor Analysis of the Wechsler Intelligence Scale for Children—Fifth Edition: What Does It Measure? Intelligence 2017, 62, 31–47. [Google Scholar] [CrossRef]
- Reynolds, C.R.; Voress, J.K. Test of Memory and Learning (TOMAL 2), 2nd ed.; Pro-Ed.: Austin, TX, USA, 2007. [Google Scholar]
- Schmitt, A.J.; Decker, S.L. Test Reviews: Reynolds, C., & Voress, J.K. (2007). Test of Memory and Learning: Second Edition. Austin, TX: PRO-ED. J. Psychoeduc. Assess. 2009, 27, 157–166. [Google Scholar] [CrossRef]
- Mammarella, I.C.; Toso, C.; Pazzaglia, F.; Cornoldi, C. BVS-Corsi—Batteria per La Valutazione Della Memoria Visiva e Spaziale; [Bvs-Corsi—Battery for the Evaluation of Spatial and Visual Memory]; Edizioni Erickson: Trento, Italy, 2008. [Google Scholar]
- Cornoldi, C.; Vecchi, T. Visuo-Spatial Working Memory and Individual Differences; Psychology Press: London, UK, 2003; ISBN 9781135431228. [Google Scholar]
- Vicari, S. PROMEA: Prove Di Memoria e Apprendimento per l’Età Evolutiva: Manuale; Giunti O.S. Organizzazioni Speciali: Firenze, Italy, 2007. [Google Scholar]
- Horowitz-Kraus, T.; Breznitz, Z. Can the Error Detection Mechanism Benefit from Training the Working Memory? A Comparison between Dyslexics and Controls—An ERP Study. PLoS ONE 2009, 4, e7141. [Google Scholar] [CrossRef]
- Schurgin, M.W. Visual Memory, the Long and the Short of It: A Review of Visual Working Memory and Long-Term Memory. Atten. Percept. Psychophys. 2018, 80, 1035–1056. [Google Scholar] [CrossRef] [PubMed]
- Reema; King, T.Z.; Morris, R.; Na, S. Hippocampal Volume and Auditory Attention on a Verbal Memory Task with Adult Survivors of Pediatric Brain Tumor. Neuropsychology 2015, 29, 303. [Google Scholar]
- Olton, D.S. Characteristics of Spatial Memory. In Cognitive Processes in Animal Behavior; Routledge: London, UK, 2018; pp. 341–373. [Google Scholar]
- Coltheart, M. Iconic Memory and Visible Persistence. Percept. Psychophys. 1980, 27, 183–228. [Google Scholar] [CrossRef] [PubMed]
- Korkman, M.; Kirk, U.; Kemp, S. NEPSY-Second Edition (NEPSY-II); Harcourt Assessment: San Antonio, TX, USA, 2007. [Google Scholar]
- Sherman, E.M.S.; Brooks, B.L. Child and Adolescent Memory Profile (ChAMP); Psychological Assessment Resources, Inc.: Lutz, FL, USA, 2015. [Google Scholar]
- Cohen, M.J. CMS-Children’s Memory Scale Manual; Harcourt Brace & Company: San Antonio, TX, USA, 1997. [Google Scholar]
- Adams, W.; Sheslow, D. Wide Range Assessment of Memory and Learning, 3rd ed.; WRAML3; NCS Pearson: Toronto, ON, Canada, 2021. [Google Scholar]
- Alloway, T.P. Automated Working Memory Assessment-II (AWMA-II); Pearson Assessment: London, UK, 2012. [Google Scholar]
- Sartori, G.; Job, R.; Tressoldi, P.E. Batteria per la Valutazione della Dislessia e Della Disortografia Evolutiva: Manuale; [Battery for the Assessment of Developmental Dyslexia and Dysorthographia]; Giunti OS: Firenze, Italy, 1995. [Google Scholar]
- Sartori, G.; Job, R.; Tressoldi, P. DDE-2, Batteria per La Valutazione Della Dislessia e Della Disortografia Evolutiva-2; [Battery for the Assessment of Developmental Dyslexi a and Dysorthographia]; Giunti, O.S.: Firenze, Italy, 2007. [Google Scholar]
- Biancardi, A.; Nicoletti, C. BDE, Batteria per La Valutazione Della Discalculia Evolutiva; [Developmental Dyscalculia Battery: Test for Diagnosing Numerical Processing and Calculation Disorders in Childhood—8–13 y.o.]; Centro Studi Erickson: Torino, Italy, 2004. [Google Scholar]
- Jones, G.; Macken, B. Questioning Short-Term Memory and Its Measurement: Why Digit Span Measures Long-Term Associative Learning. Cognition 2015, 144, 1–13. [Google Scholar] [CrossRef] [PubMed]
- Puzicha, J.; Hofmann, T.; Buhmann, J.M. A Theory of Proximity Based Clustering: Structure Detection by Optimization. Pattern Recognit. 2000, 33, 617–634. [Google Scholar] [CrossRef]
- Yim, O.; Ramdeen, K.T. Hierarchical Cluster Analysis: Comparison of Three Linkage Measures and Application to Psychological Data. Quant. Methods Psychol. 2015, 11, 8–21. [Google Scholar] [CrossRef]
- Morsanyi, K.; van Bers, B.M.C.W.; McCormack, T.; McGourty, J. The Prevalence of Specific Learning Disorder in Mathematics and Comorbidity with Other Developmental Disorders in Primary School-Age Children. Br. J. Psychol. 2018, 109, 917–940. [Google Scholar] [CrossRef] [PubMed]
- Willcutt, E.G.; Petrill, S.A.; Wu, S.; Boada, R.; DeFries, J.C.; Olson, R.K.; Pennington, B.F. Comorbidity Between Reading Disability and Math Disability: Concurrent Psychopathology, Functional Impairment, and Neuropsychological Functioning. J. Learn. Disabil. 2013, 46, 500–516. [Google Scholar] [CrossRef] [PubMed]
- Lopes-Silva, J.B.; Moura, R.; Júlio-Costa, A.; Wood, G.; Salles, J.F.; Haase, V.G. What Is Specific and What Is Shared Between Numbers and Words? Front. Psychol. 2016, 7, 22. [Google Scholar] [CrossRef] [PubMed]
- Barrouillet, P.; Camos, V.; Perruchet, P.; Seron, X. ADAPT: A Developmental, Asemantic, and Procedural Model for Transcoding From Verbal to Arabic Numerals. Psychol. Rev. 2004, 111, 368–394. [Google Scholar] [CrossRef]
- Ashkenazi, S.; Black, J.M.; Abrams, D.A.; Hoeft, F.; Menon, V. Neurobiological Underpinnings of Math and Reading Learning Disabilities. J. Learn. Disabil. 2013, 46, 549–569. [Google Scholar] [CrossRef] [PubMed]
- Melby-Lervåg, M.; Lyster, S.A.H.; Hulme, C. Phonological Skills and Their Role in Learning to Read: A Meta-Analytic Review. Psychol. Bull. 2012, 138, 322–352. [Google Scholar] [CrossRef]
- Swanson, H.L.; Jerman, O. Xinhua Zheng Math Disabilities and Reading Disabilities. J. Psychoeduc. Assess. 2009, 27, 175–196. [Google Scholar] [CrossRef]
- Peng, P.; Fuchs, D. A Meta-Analysis of Working Memory Deficits in Children with Learning Difficulties: Is There a Difference Between Verbal Domain and Numerical Domain? J. Learn. Disabil. 2016, 49, 3–20. [Google Scholar] [CrossRef] [PubMed]
- Pellegrino, J.W.; Siegel, A.W.; Dhawan, M. Short-Term Retention of Pictures and Words: Evidence for Dual Coding Systems. J. Exp. Psychol. Hum. Learn. 1975, 1, 95–102. [Google Scholar] [CrossRef]
- Ternes, W.; Yuille, J.C. Words and Pictures in an STM Task. J. Exp. Psychol. 1972, 96, 78–86. [Google Scholar] [CrossRef]
- Roberson, D.; Davidoff, J. The Categorical Perception of Colors and Facial Expressions: The Effect of Verbal Interference. Mem. Cognit 2000, 28, 977–986. [Google Scholar] [CrossRef] [PubMed]
- Pilling, M.; Wiggett, A.; Özgen, E.; Davies, I.R.L. Is Color “Categorical Perception” Really Perceptual? Mem. Cognit 2003, 31, 538–551. [Google Scholar] [CrossRef] [PubMed]
- Lupyan, G. Linguistically Modulated Perception and Cognition: The Label-Feedback Hypothesis. Front. Psychol. 2012, 3, 54. [Google Scholar] [CrossRef] [PubMed]
- Romani, C.; Tsouknida, E.; Olson, A. Encoding Order and Developmental Dyslexia: A Family of Skills Predicting Different Orthographic Components. Q. J. Exp. Psychol. 2015, 68, 99–128. [Google Scholar] [CrossRef] [PubMed]
- Adams, J.W.; Hitch, G.J. Children’s Mental Arithmetic and Working Memory. In The Development of Mathematical Skills; Taylor & Francis Group: London, UK, 1999. [Google Scholar]
- Noel, M.-P.; Fias, W.; Brysbaert, M. About the Influence of the Presentation Format on Arithmetical-Fact Retrieval Processes. Cognition 1997, 63, 335–374. [Google Scholar] [CrossRef]
- Bakker, D.J. Treatment of Developmental Dyslexia: A Review. Pediatr. Rehabil. 2006, 9, 3–13. [Google Scholar] [CrossRef] [PubMed]
- Shany, M.; Share, D.L. Subtypes of Reading Disability in a Shallow Orthography: A Double Dissociation between Accuracy-Disabled and Rate-Disabled Readers of Hebrew. Ann. Dyslexia 2011, 61, 64–84. [Google Scholar] [CrossRef]
- Licht, R. Reading Disability Subtypes: Cognitive and Electrophysiological Differences. In Learning Disabilities; Swets & Zeitlinger Ed.: Lisse, The Netherlands, 1989; Volume 1, pp. 81–103. [Google Scholar]
- Licht, R.; van Onna, J. Differences in Components of Word Recognition between P- and L-Type Reading Disability. In Developmental and Acquired Dyslexia: Neuropsychological and Neurolinguistic Perspectives; Springer: Dordrecht, The Netherlands, 1995; pp. 41–50. [Google Scholar]
- Brosnan, M.; Demetre, J.; Hamill, S.; Robson, K.; Shepherd, H.; Cody, G. Executive Functioning in Adults and Children with Developmental Dyslexia. Neuropsychologia 2002, 40, 2144–2155. [Google Scholar] [CrossRef] [PubMed]
- Cassim, R.; Talcott, J.B.; Moores, E. Adults with Dyslexia Demonstrate Large Effects of Crowding and Detrimental Effects of Distractors in a Visual Tilt Discrimination Task. PLoS ONE 2014, 9, e106191. [Google Scholar] [CrossRef] [PubMed]
- Facoetti, A.; Paganoni, P.; Lorusso, M. The spatial distribution of visual attention in developmental dyslexia. Exp. Brain Res. 2000, 132, 531–538. [Google Scholar] [CrossRef]
- Norris, D.G.; Hall, J.; Gathercole, S.E. Can Short-Term Memory Be Trained? Mem. Cognit. 2019, 47, 1012–1023. [Google Scholar] [CrossRef] [PubMed]
- Melby-Lervåg, M.; Hulme, C. Is Working Memory Training Effective? A Meta-Analytic Review. Dev. Psychol. 2013, 49, 270–291. [Google Scholar] [CrossRef] [PubMed]
- Melby-Lervåg, M.; Redick, T.S.; Hulme, C. Working Memory Training Does Not Improve Performance on Measures of Intelligence or Other Measures of “Far Transfer”: Evidence From a Meta-Analytic Review. Perspect. Psychol. Sci. 2016, 11, 512–534. [Google Scholar] [CrossRef] [PubMed]
- Sala, G.; Gobet, F. Working Memory Training in Typically Developing Children: A Multilevel Meta-Analysis. Psychon. Bull. Rev. 2020, 27, 423–434. [Google Scholar] [CrossRef] [PubMed]
- Himi, S.A.; Stadler, M.; von Bastian, C.C.; Bühner, M.; Hilbert, S. Limits of Near Transfer: Content and Operation-Specific Effects of Working Memory Training. J. Exp. Psychol. Gen. 2022, 152, 1305–1333. [Google Scholar] [CrossRef] [PubMed]
- Cai, Y.; Yang, C.; Wang, S.; Xue, G. The Neural Mechanism Underlying Visual Working Memory Training and Its Limited Transfer Effect. J. Cogn. Neurosci. 2022, 34, 2082–2099. [Google Scholar] [CrossRef] [PubMed]
- Peijnenborgh, J.C.A.W.; Hurks, P.M.; Aldenkamp, A.P.; Vles, J.S.H.; Hendriksen, J.G.M. Efficacy of Working Memory Training in Children and Adolescents with Learning Disabilities: A Review Study and Meta-Analysis. Neuropsychol. Rehabil. 2016, 26, 645–672. [Google Scholar] [CrossRef] [PubMed]
- Alloway, T.P.; Bibile, V.; Lau, G. Computerized Working Memory Training: Can It Lead to Gains in Cognitive Skills in Students? Comput. Human. Behav. 2013, 29, 632–638. [Google Scholar] [CrossRef]
- Qi, X.; Fu, J.; Gu, Y.; Xue, G.; Cai, Y. The Nature of Visual Short-Term Memory Training Transfer: Evidence from A Systematical Transfer Test. PsychArchives 2024. [Google Scholar] [CrossRef]
- Pergher, V.; Au, J.; Alizadeh Shalchy, M.; Santarnecchi, E.; Seitz, A.; Jaeggi, S.M.; Battelli, L. The Benefits of Simultaneous TDCS and Working Memory Training on Transfer Outcomes: A Systematic Review and Meta-Analysis. Brain Stimul. 2022, 15, 1541–1551. [Google Scholar] [CrossRef] [PubMed]
- Grigorenko, E.L.; Compton, D.L.; Fuchs, L.S.; Wagner, R.K.; Willcutt, E.G.; Fletcher, J.M. Understanding, Educating, and Supporting Children with Specific Learning Disabilities: 50 Years of Science and Practice. Am. Psychol. 2020, 75, 37–51. [Google Scholar] [CrossRef]
- Gelman, A.; Hill, J. Data Analysis Using Regression and Multilevel/Hierarchical Models; Cambridge University Press: Cambridge, UK, 2006. [Google Scholar]
- McElreath, R. Statistical Rethinking A Bayesian Course with Examples in R and Stan, 1st ed.; Chapman and Hall/CRCL: New York, NY, USA, 2016. [Google Scholar]
- Vanbelle, S.; Lesaffre, E. Modeling Agreement on Bounded Scales. Stat. Methods Med. Res. 2018, 27, 3460–3477. [Google Scholar] [CrossRef] [PubMed]
Disclaimer/Publisher’s Note: The statements, opinions and data contained in all publications are solely those of the individual author(s) and contributor(s) and not of MDPI and/or the editor(s). MDPI and/or the editor(s) disclaim responsibility for any injury to people or property resulting from any ideas, methods, instructions or products referred to in the content. |
© 2024 by the authors. Licensee MDPI, Basel, Switzerland. This article is an open access article distributed under the terms and conditions of the Creative Commons Attribution (CC BY) license (https://creativecommons.org/licenses/by/4.0/).

