Abstract
The orange (Citrus sinensis) is a fruit of the Citrus genus, which is part of the Rutaceae family. The orange has gained considerable importance due to its extensive range of applications, including the production of juices, jams, sweets, and extracts. The consumption of oranges confers several nutritional benefits, including flavonoids, vitamin C, potassium, beta-carotene, and dietary fiber. It is crucial to acknowledge that the primary quality criterion employed by consumers and producers is maturity, which is correlated with the visual quality associated with the color of the epicarp. This study proposes the implementation of a computer vision system that estimates the degree of ripeness of oranges Valencia using fuzzy logic (FL); the soluble solids content was determined by refractometry, while the firmness of the fruit was evaluated through the fruit firmness test. The proposed method was divided into five distinct steps. The initial stage involved the acquisition of RGB images. The second stage presents the segmentation of the fruit, which entails the removal of extraneous noise and backgrounds. The third and fourth steps involve determining the centroid of the fruit, and five regions of interest were obtained in the centroid of the fruit of the Citrus Color Index (CII), ranging from 3 × 3 to 11 × 11 pixels. Finally, in the fifth step, a model was created to estimate maturity, °Brix, and firmness using Matlab 2024 and the Fuzzy Logic Designer and Neuro-Fuzzy Designer applications. Consequently, a statistically significant correlation was established between maturity, degree Brix, and firmness, with a value greater than 0.9, using the Citrus Color Index (CII), which reflects the physical–chemical changes that occur in the orange.
1. Introduction
According to the Food and Agriculture Organization of the United Nations (FAO), Mexico is a leading producer of citrus fruits, including lemons, limes, grapefruits, tangerines, mandarins, clementines, and oranges. In 2022, it ranked fourth in the world for orange production, with 4,850,083.04 tons. About 88% of this production is for domestic consumption, while the remaining is exported to other countries [1]. The demand for this fruit is attributed to its versatility in various forms, such as juices, jams, essential oils, concentrated formulas, and pastes [2,3,4,5]. Additionally, this citrus is considered a functional food due to its nutritional benefits, including flavonoids, vitamin C, phenolic compounds, carotenoids, and sugars. It also has protective effects against cardiovascular diseases, hypertension, type 2 diabetes, various types of cancer, asthma, obesity, cognitive impairment, and depression [6,7,8,9,10,11]. The agri-food industry gives priority to measuring the quality criteria set by the consumer, as color is generally considered to be a quality attribute associated with ripeness and freshness, and consumers prefer fruits and vegetables that are uniform in appearance and vivid color [12,13,14,15,16].
Furthermore, the agri-food sector is required to evaluate the organoleptic characteristics of oranges through sensory analysis. This type of analysis is linked to consumer perception since food is analyzed through the senses using organoleptic properties, such as appearance, smell, aroma, texture, sound, and flavor [17,18]. In addition, the physical–chemical properties are analyzed to assess the nutritional value of the orange. This includes the content of nutrients such as fats, vitamins, carbohydrates, proteins, and total acidity, which is an effective indicator of the quality of the fruit [19,20,21,22,23]. The quality of the orange fruit is also influenced by climatic conditions and production methods, with the latter being particularly significant [24]. Traditionally, the quality of oranges was typically assessed in laboratories using invasive devices, such as high-performance liquid chromatography (HPLC), refractometers, penetrometers, pH meters, and durometers [25]. These devices offer versatility, sensitivity, and the ability to separate and identify mixtures, as well as determine sugar content, acidity, color, and firmness. However, one disadvantage of these devices is that they require operation by specialized personnel under controlled conditions, as some devices require the use of solvents for sample analysis, which can be inconvenient and potentially hazardous [25,26,27,28,29,30].
Currently, non-invasive methods have been proposed to determine the quality of oranges based on their color. Therefore, computer vision (CV) is a technique used to measure color, which is a perceptual phenomenon resulting from the stimulation of the visual system by the visible spectrum of light reflected or emitted by the sample. It is important to note that color is not an intrinsic property of the sample, and its perception is sensitive to changes in the incident light source, which can be used to determine the ripeness of various fruits, including persimmon, strawberry, pomegranate, tomato, bell pepper, pineapple, and orange [15,31,32,33,34]. These methods have also been used to measure physicochemical properties, such as pH, total soluble solids (TSS), titratable acidity (TA), maturity index (MI), total anthocyanin content (TAC), and carotenoids [14,28,35,36,37,38]. These properties can be determined using the color space models RGB, HSV, CIE L*a*b*, and CIE XYZ, along with the indices CI = a/b, CCI = (1.00 × a)/(L × b), CR = 200[(1.277X − 0.213Z)/Y − 1]. It should be noted that the CII is one of the most important indicators as to when the crop should be harvested or what treatment should be applied to it [14].
The agri-food industry is confronted with the necessity to integrate low-cost, precision technology that enables the identification of quality criteria such as the maturity of fruits. In this context, a methodology is proposed that determines the degree of maturity, firmness, and °Brix content of orange fruit using various thresholds of the Citrus Color Index (CCI) and non-invasive methods. The determination of these will be carried out through computer vision and a fuzzy inference system (FIS).
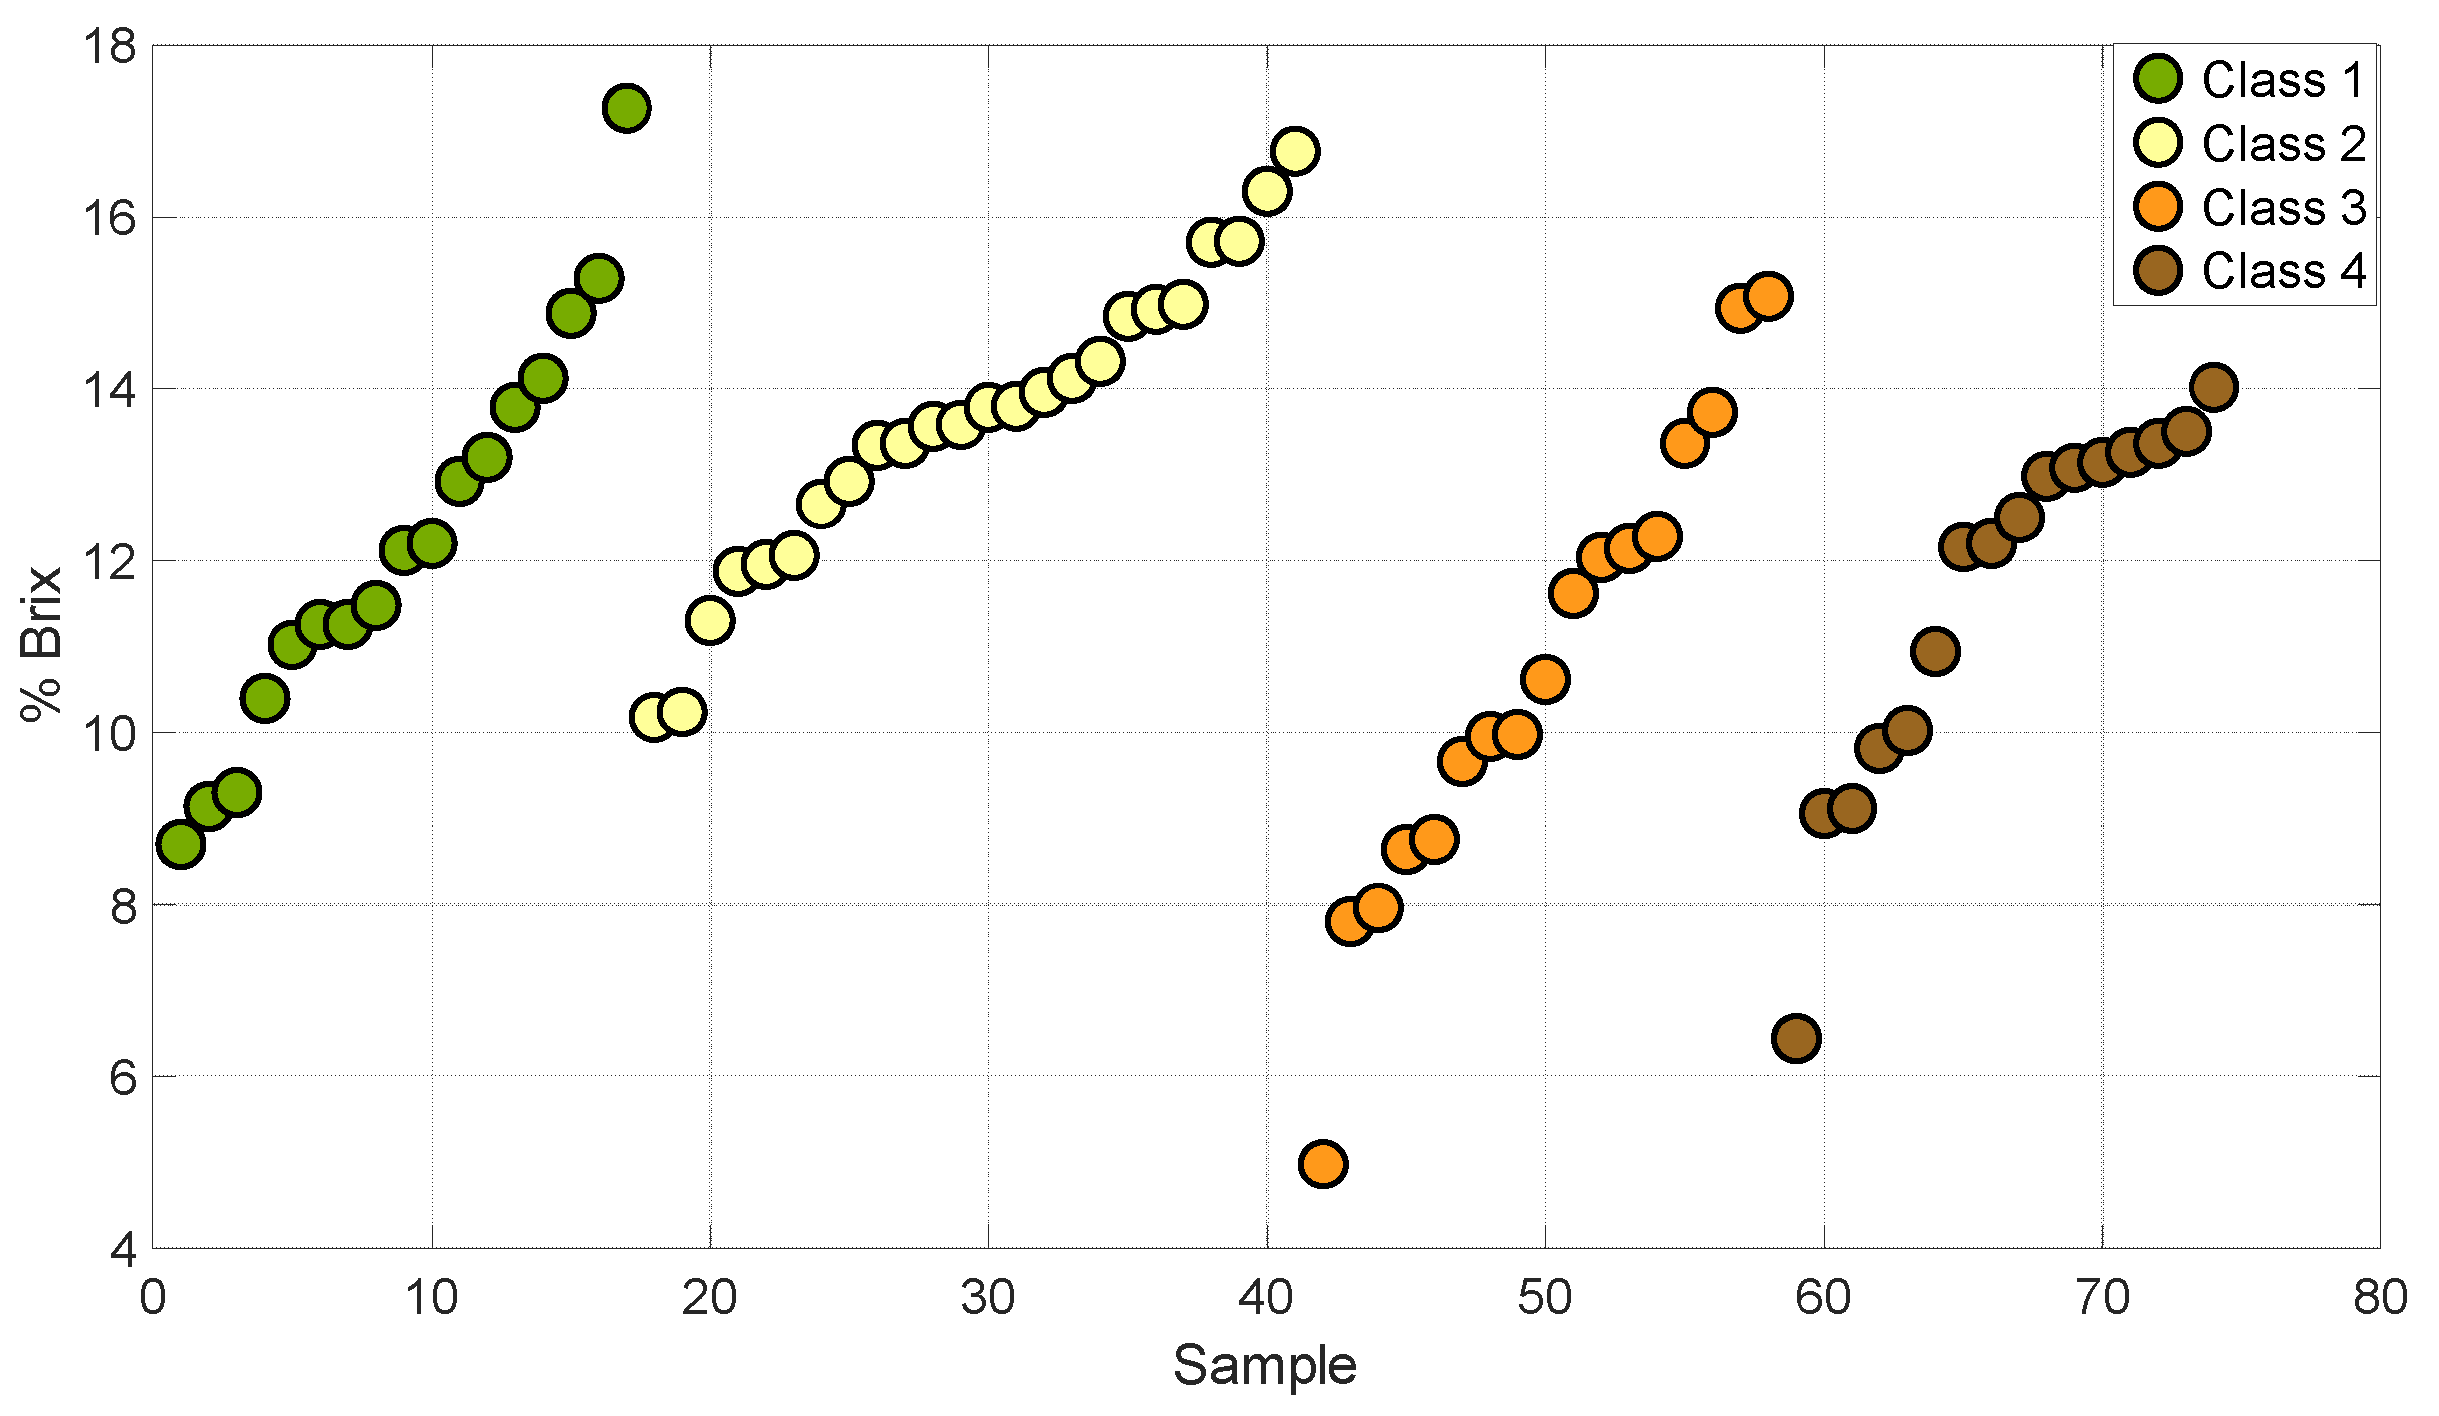
Figure 1 and Figure 2 show the distribution of degrees Brix and firmness in the four stages of maturity of the set of samples used for the development of this work. This analysis allowed us to establish that the grouping of the samples encompasses different stages of maturity of the Valencia orange. This describes a variation in sugars and firmness at different stages of ripeness.

Figure 1.
Samples of oranges in different degrees of °Brix.
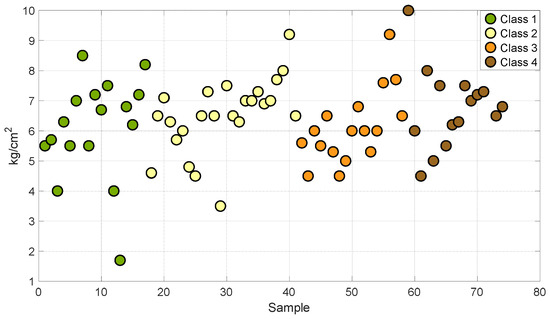
Figure 2.
Samples of oranges in different degrees of firmness.
2. Materials and Methods
2.1. Samples
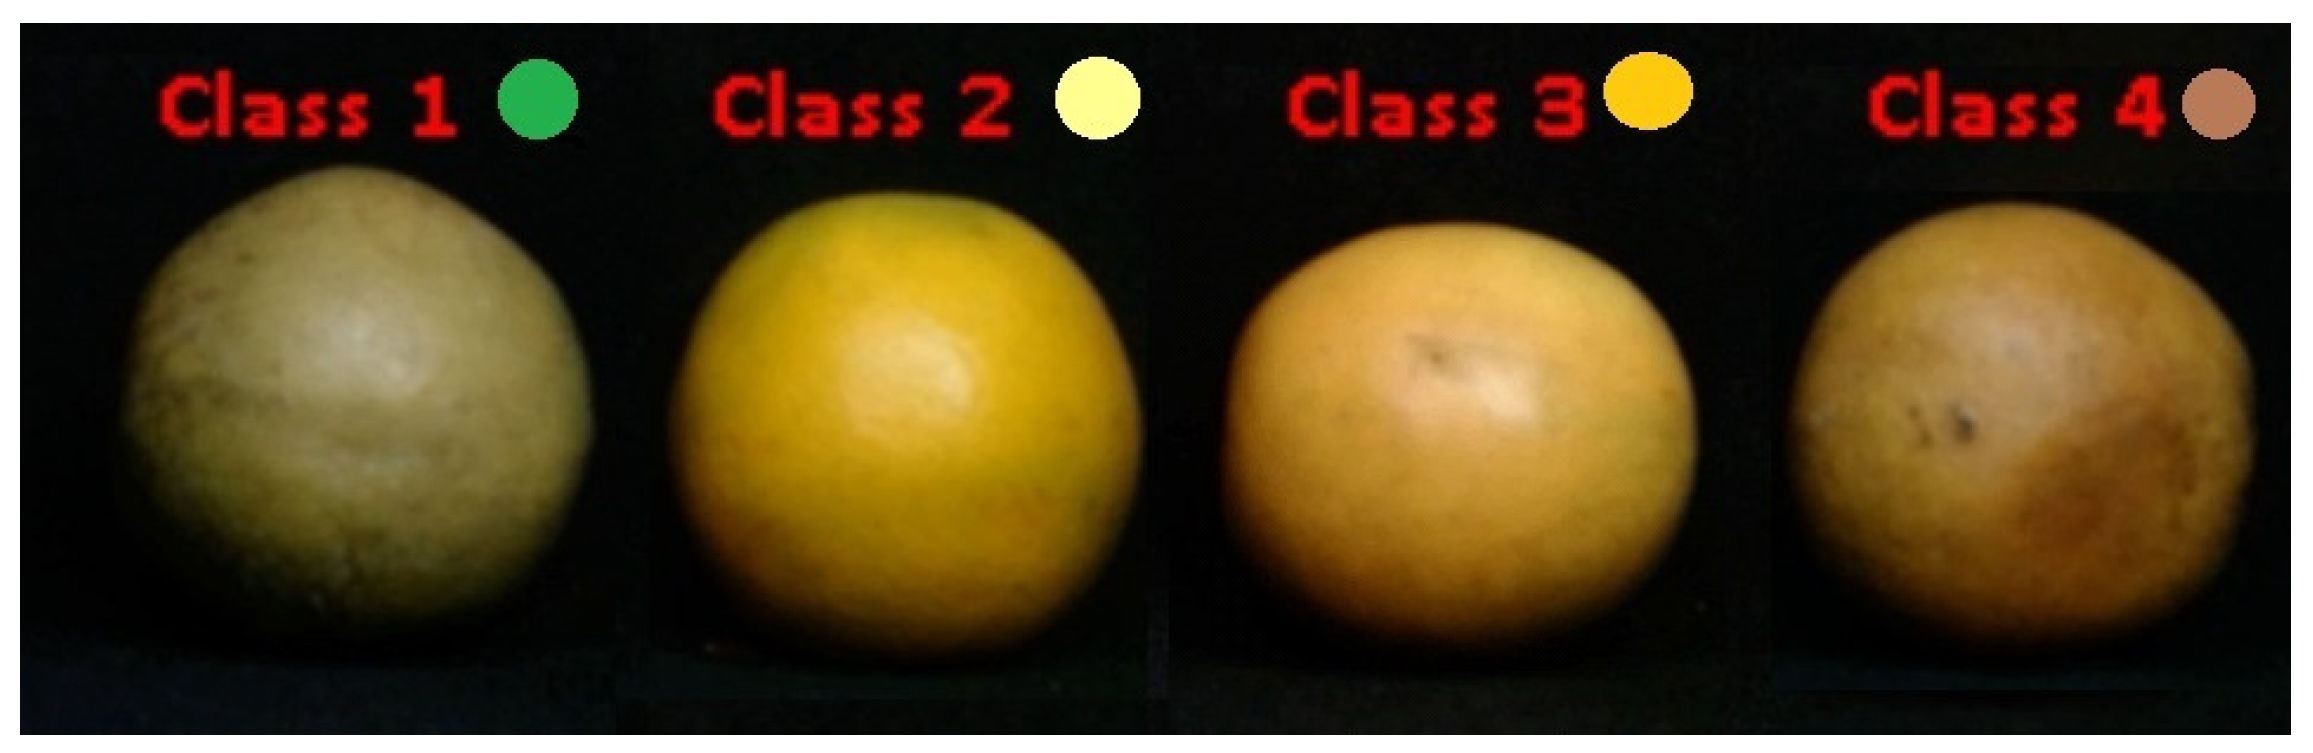
A total of 75 samples of oranges Valencia were purchased from a local store in Irapuato, Guanajuato, Mexico. The citrus fruits were selected for their color and size in order to have samples at different stages of maturity. The oranges were classified into four classes according to the color present in their epicarp, as shown in Figure 3: Class 1 was composed of 17 green samples; Class 2 of 24 samples with green and yellowish-green regions; Class 3 consisted of 17 fruits with pale yellow to bright orange regions. In Class 4, 17 samples were identified, displaying a bright orange to dull orange region. This classification facilitates the development of the implementation of computer vision systems with artificial intelligence (IA) through the use of RGB, Cie-L*a*b, and HSV color space models [14]:
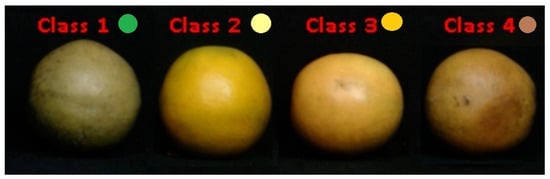
Figure 3.
Samples of oranges Valencia in different degrees of maturity.
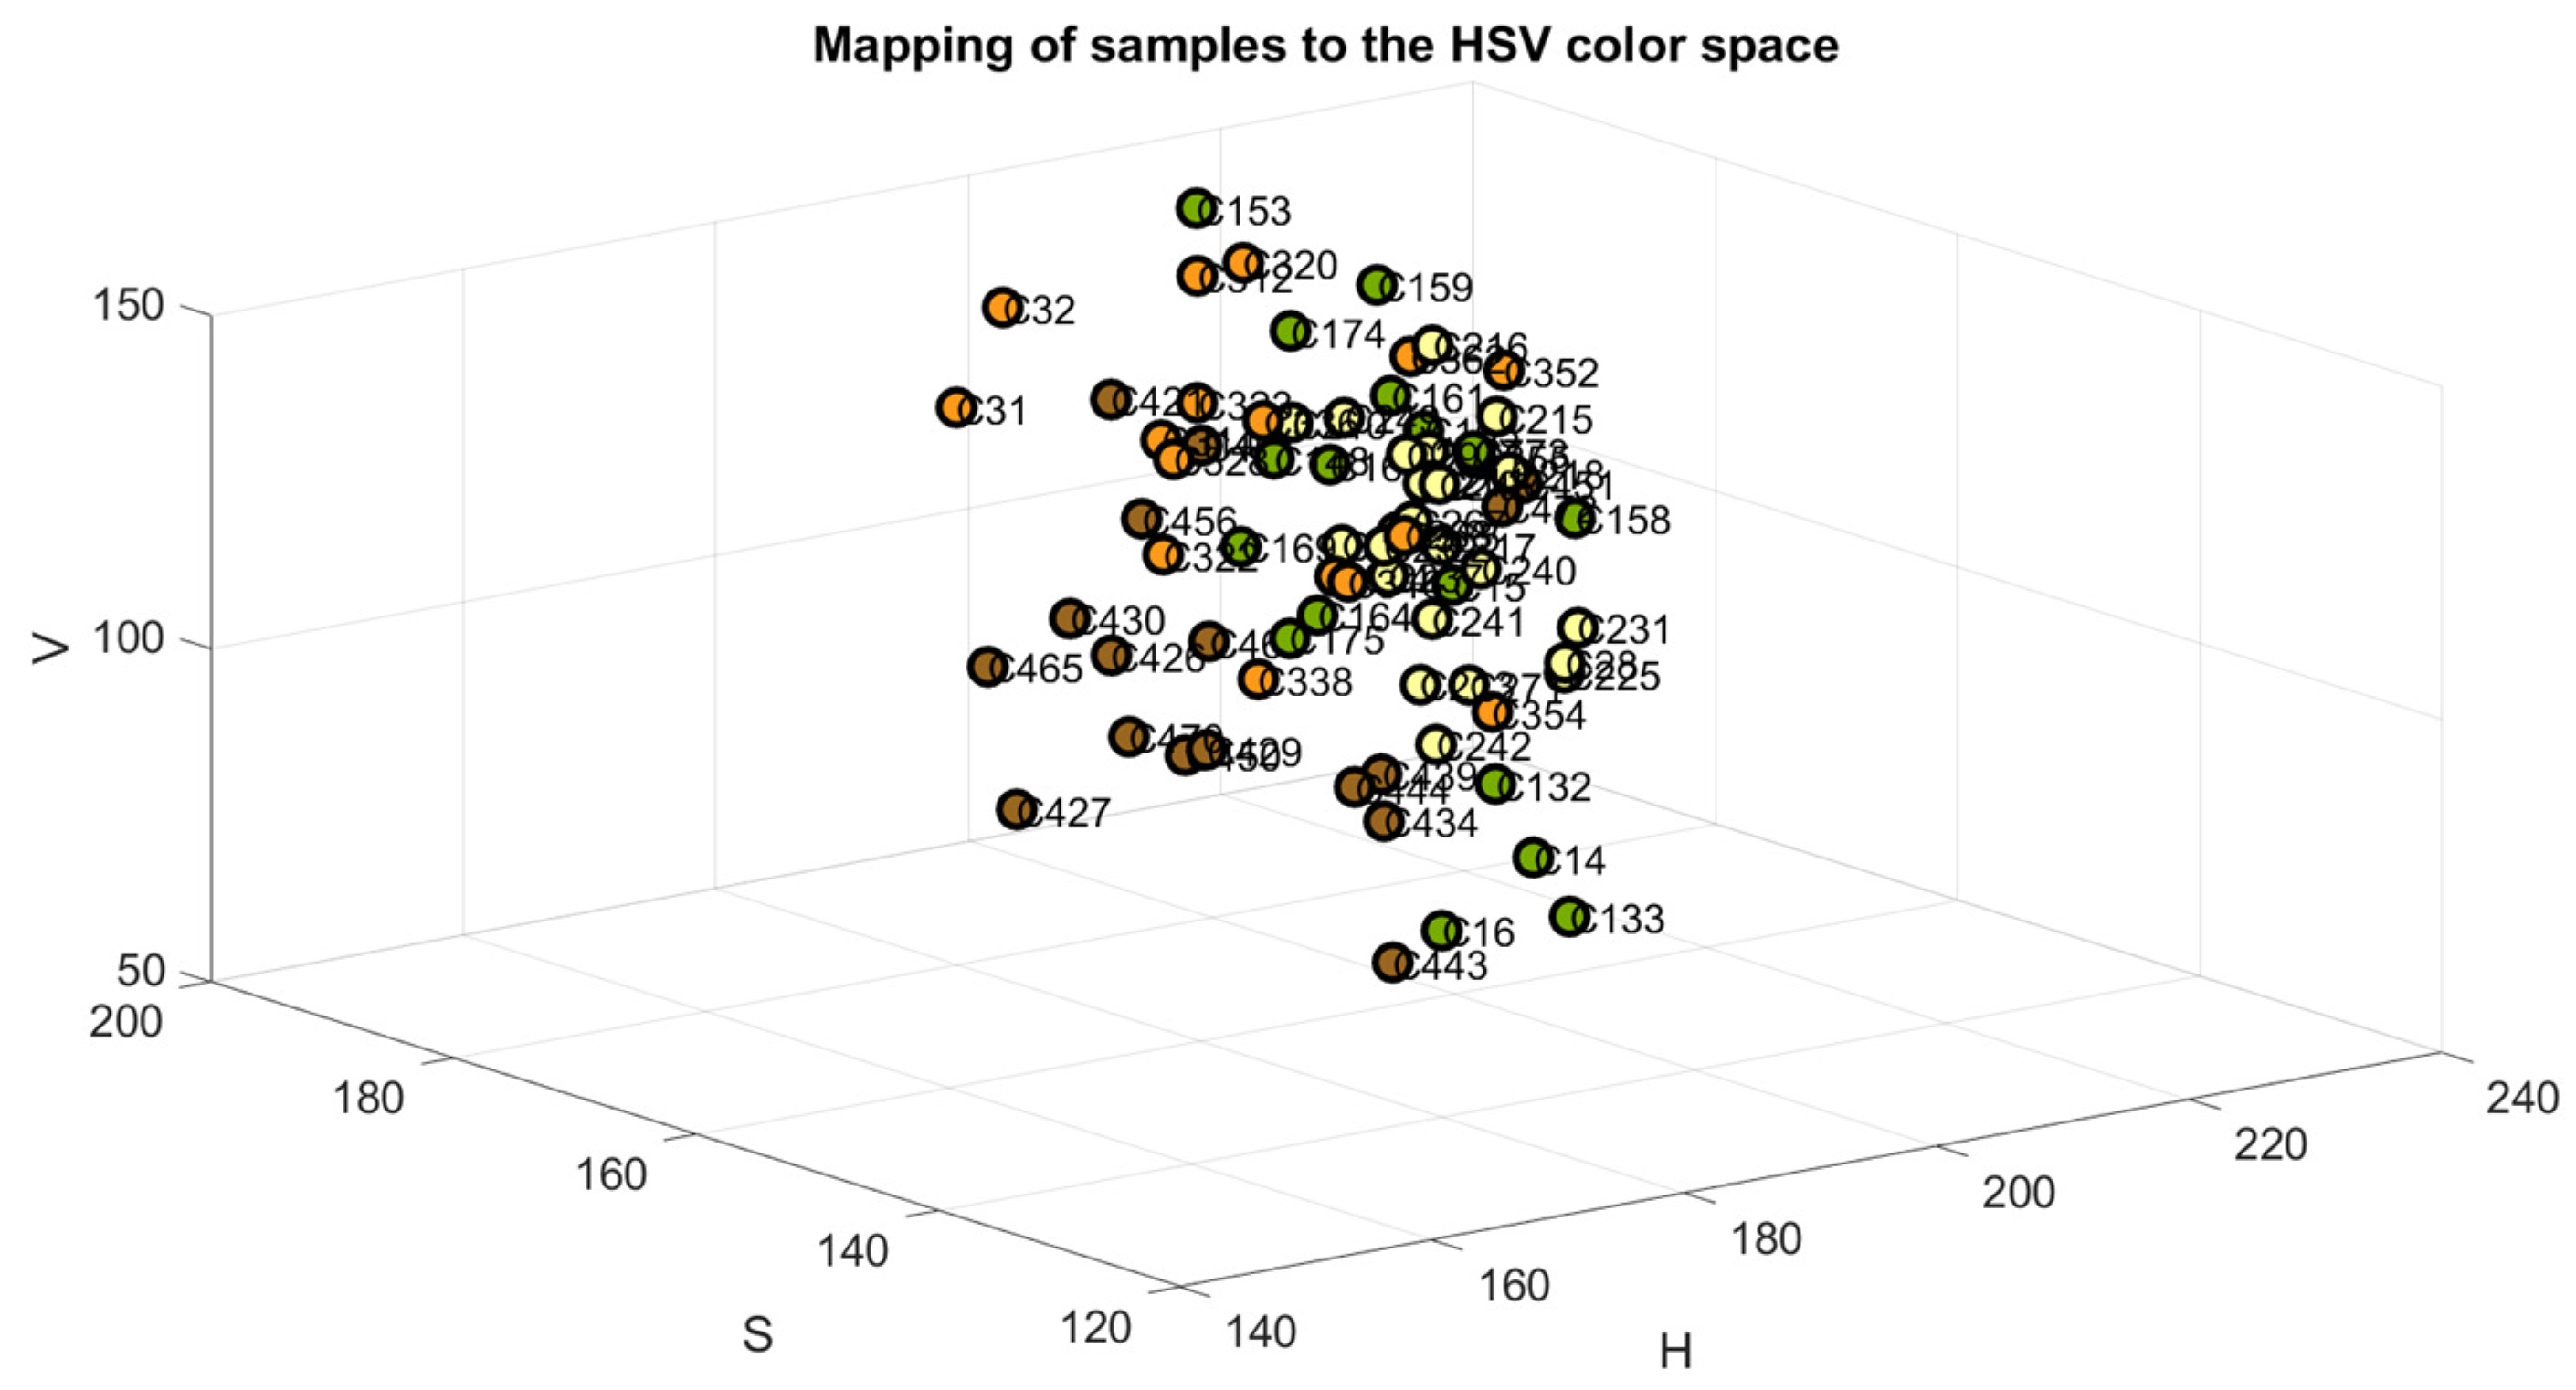
The samples were mapped in the RGB, Cielab, and HSV color space models to verify the accuracy of their classification, as shown in Figure 4, Figure 5 and Figure 6. The color green is indicative of samples belonging to Class 1, yellow to samples of Class 2, orange to samples of Class 3, and brown to the samples of Class 4.
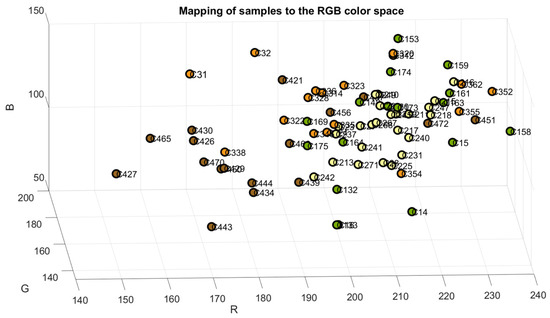
Figure 4.
Samples mapped in RGB color space.
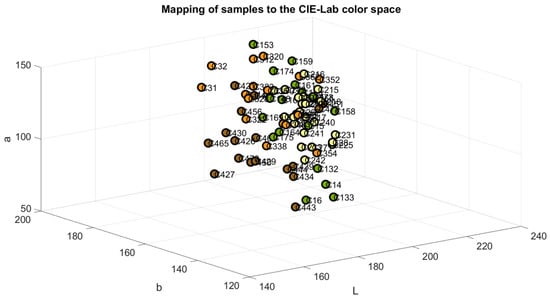
Figure 5.
Samples mapped in CIE-Lab color space.

Figure 6.
Samples mapped in HSV space.
2.2. Refractometer
In the traditional agro-food industry, the refractometer is employed as an optical instrument for measuring the degree Brix in a variety of products, including fruits. The degrees Brix is calculated based on the refractive index (RI) of the liquid sample under examination. The refractive index (RI) is defined as the ratio between the speed of light in a vacuum and the speed of light in each medium. The RI is dependent upon the wavelength of light and the temperature of the sample liquid [39,40]. Juice extraction from the samples was performed using a Black and Decker model CJ650 citrus juicer. Approximately 10 mL of juice was extracted from each sample for direct measurement of its Brix content using a digital Brix refractometer (Deosdum, mod. t1cq6gki47) with a range of 0 to 55% [41].
2.3. Fruit Penetrometer
The firmness of the fruits is highly useful in determining the ripening stages of the orange. Traditionally, this criterion is employed to ascertain the traceability of the product throughout its production, harvest, and transport. It is important to note that the proper management of firmness helps to prevent mechanical damage such as distortion, bruises, and cracks, which could otherwise affect the commercialization of the orange [42]. Firmness measurements were conducted utilizing a GY3 brand penetrometer with an 8 mm head. This instrument has a capacity of 0.5–12 kg/cm2, a resolution of 0.1 kg/cm2, an accuracy of ±2%, and a diameter of Ø 11.1 mm. The test was carried out with a 10 mm perforation of the epicarp of the fruit in the equatorial region [43].
2.4. General Structure of Computer Vision System
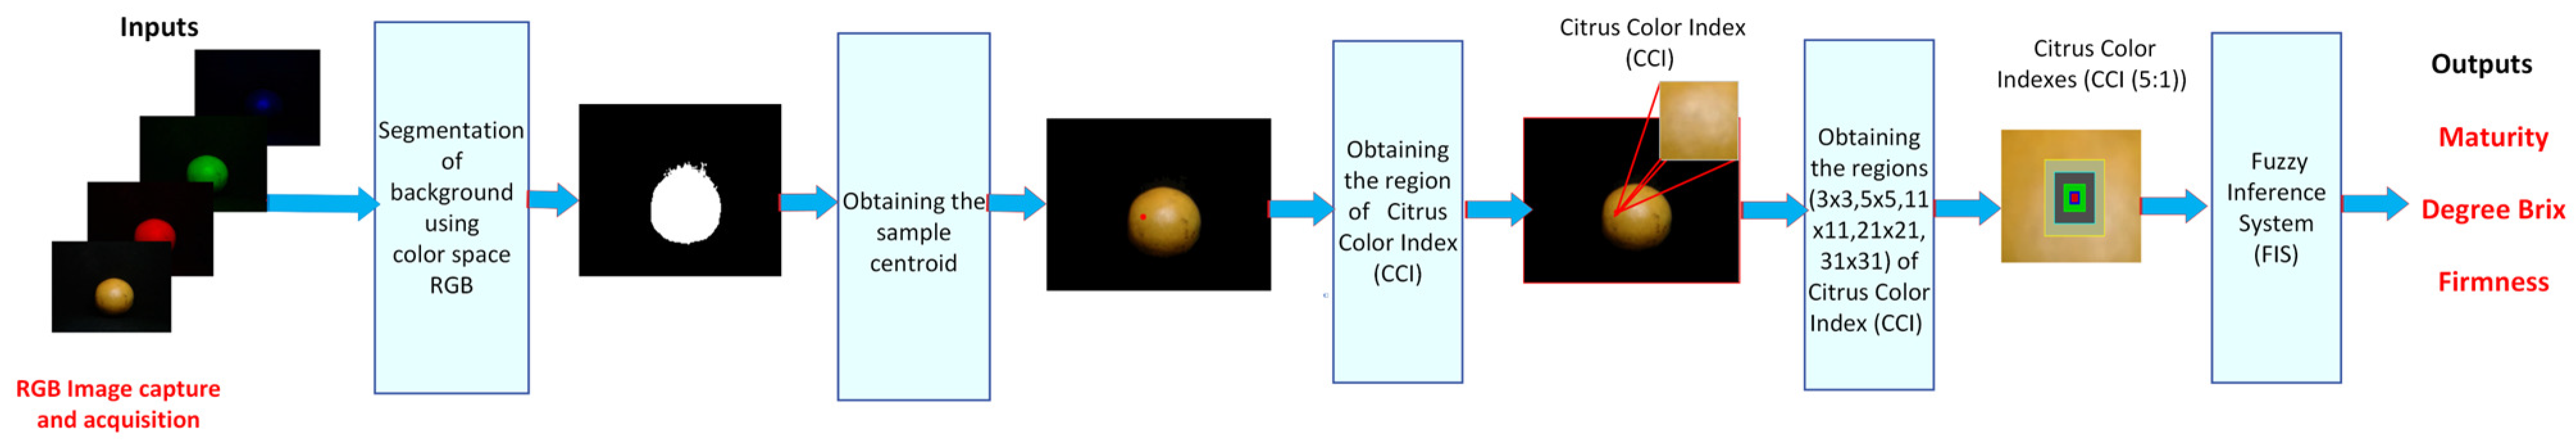
Figure 7 shows the proposed methodology for predicting the sugar content and firmness of the orange. The first step of the proposed methodology involved the acquisition of image samples utilizing a computer vision system (VCS) and software Matlab 2024. The acquired images were recorded in a resolution of 480 × 640 × 3 pixels in the JPG format using a Logitech C920 HD Pro Webcam with full high-definition resolution at 1080 p and a frame rate of 30 fps. The second step involved the segmentation of the orange and entailed the elimination of image noise that corresponded to areas smaller than 20,000 pixels. The third step was the calculation of the centroid of the sample. The fourth step is to obtain regions of CII. The fifth step was to generate the CCIs using sub-regions of 3 × 3, 5 × 5, 11 × 11, 21 × 21, and 31 × 31. The final step is to utilize the CII to generate a prediction of the Brix content and firmness.

Figure 7.
The proposed method for determining the Brix degree and firmness of orange.
2.5. Image Acquisition, Capture, and Segmentation
Figure 8 presents the proposed method for removing noise from the captured image, which was integrated into three stages. The first step is the capture of the image of the sample with a size of (480 × 640 × 3) pixels in JPG format. In the second step, the segmentation of the orange is carried out using a mask based on the RGB model with 10 <= R <= 255, 0 <= G <= 255, and 0 <= B <= 255, with a range between 0 and 255; finally, the binarization of the image sample and the identification of the connected components of the image are carried out. We identify and label all the blobs that make up the binarized image and then eliminate them, similarly to all spots with areas less than 20,000 pixels. This process is dependent on the number of regions of interest (ROI) and the image indices with a connectivity of 8.
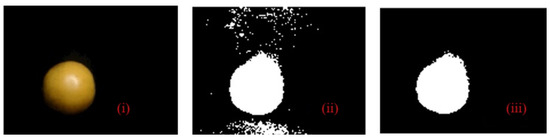
Figure 8.
The proposed method in orange fruit for the removal of small blobs from the image of the captured sample: (i) real image; (ii) binarization of the image; and (iii) segmentation of the sample and discrimination of areas.
2.6. Citrus Color Index (CII) Extraction
The Citrus Color Index employed the methodology proposed by [44,45]. This descriptor facilitated the identification of the four classes that divided the samples according to their epicarp color. The CCI values ranged from −5.8183 to 4.5321. The CII was calculated by converting the color space model from RGB to CIE-L*a*b and then applying the ratio CII = (1000 a*)/(L* b*). Figure 9 shows the ROI used to obtain each CCI, with dimensions of 3 × 3, 5 × 5, 11 × 11, 21 × 21, and 31 × 31, respectively [44]. To determine the areas, it was necessary to calculate the centroid of the fruit. This enabled the determination of the five values (CCI) for each ROI. Table 1 presents the calculated CCI for each sub-region of 3 × 3, 5 × 5, 11 × 11, 21 × 21, and 31 × 31.
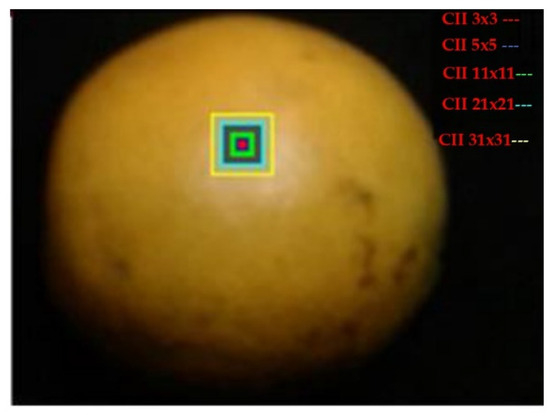
Figure 9.
Representation of the sub-regions of the Citrus Color Index (CCI) of Valencia orange fruit.

Table 1.
Comparison of sub-regions of interest (ROI) and Citrus Color Index (CCI) in orange fruit.
2.7. Fuzzy Estimator
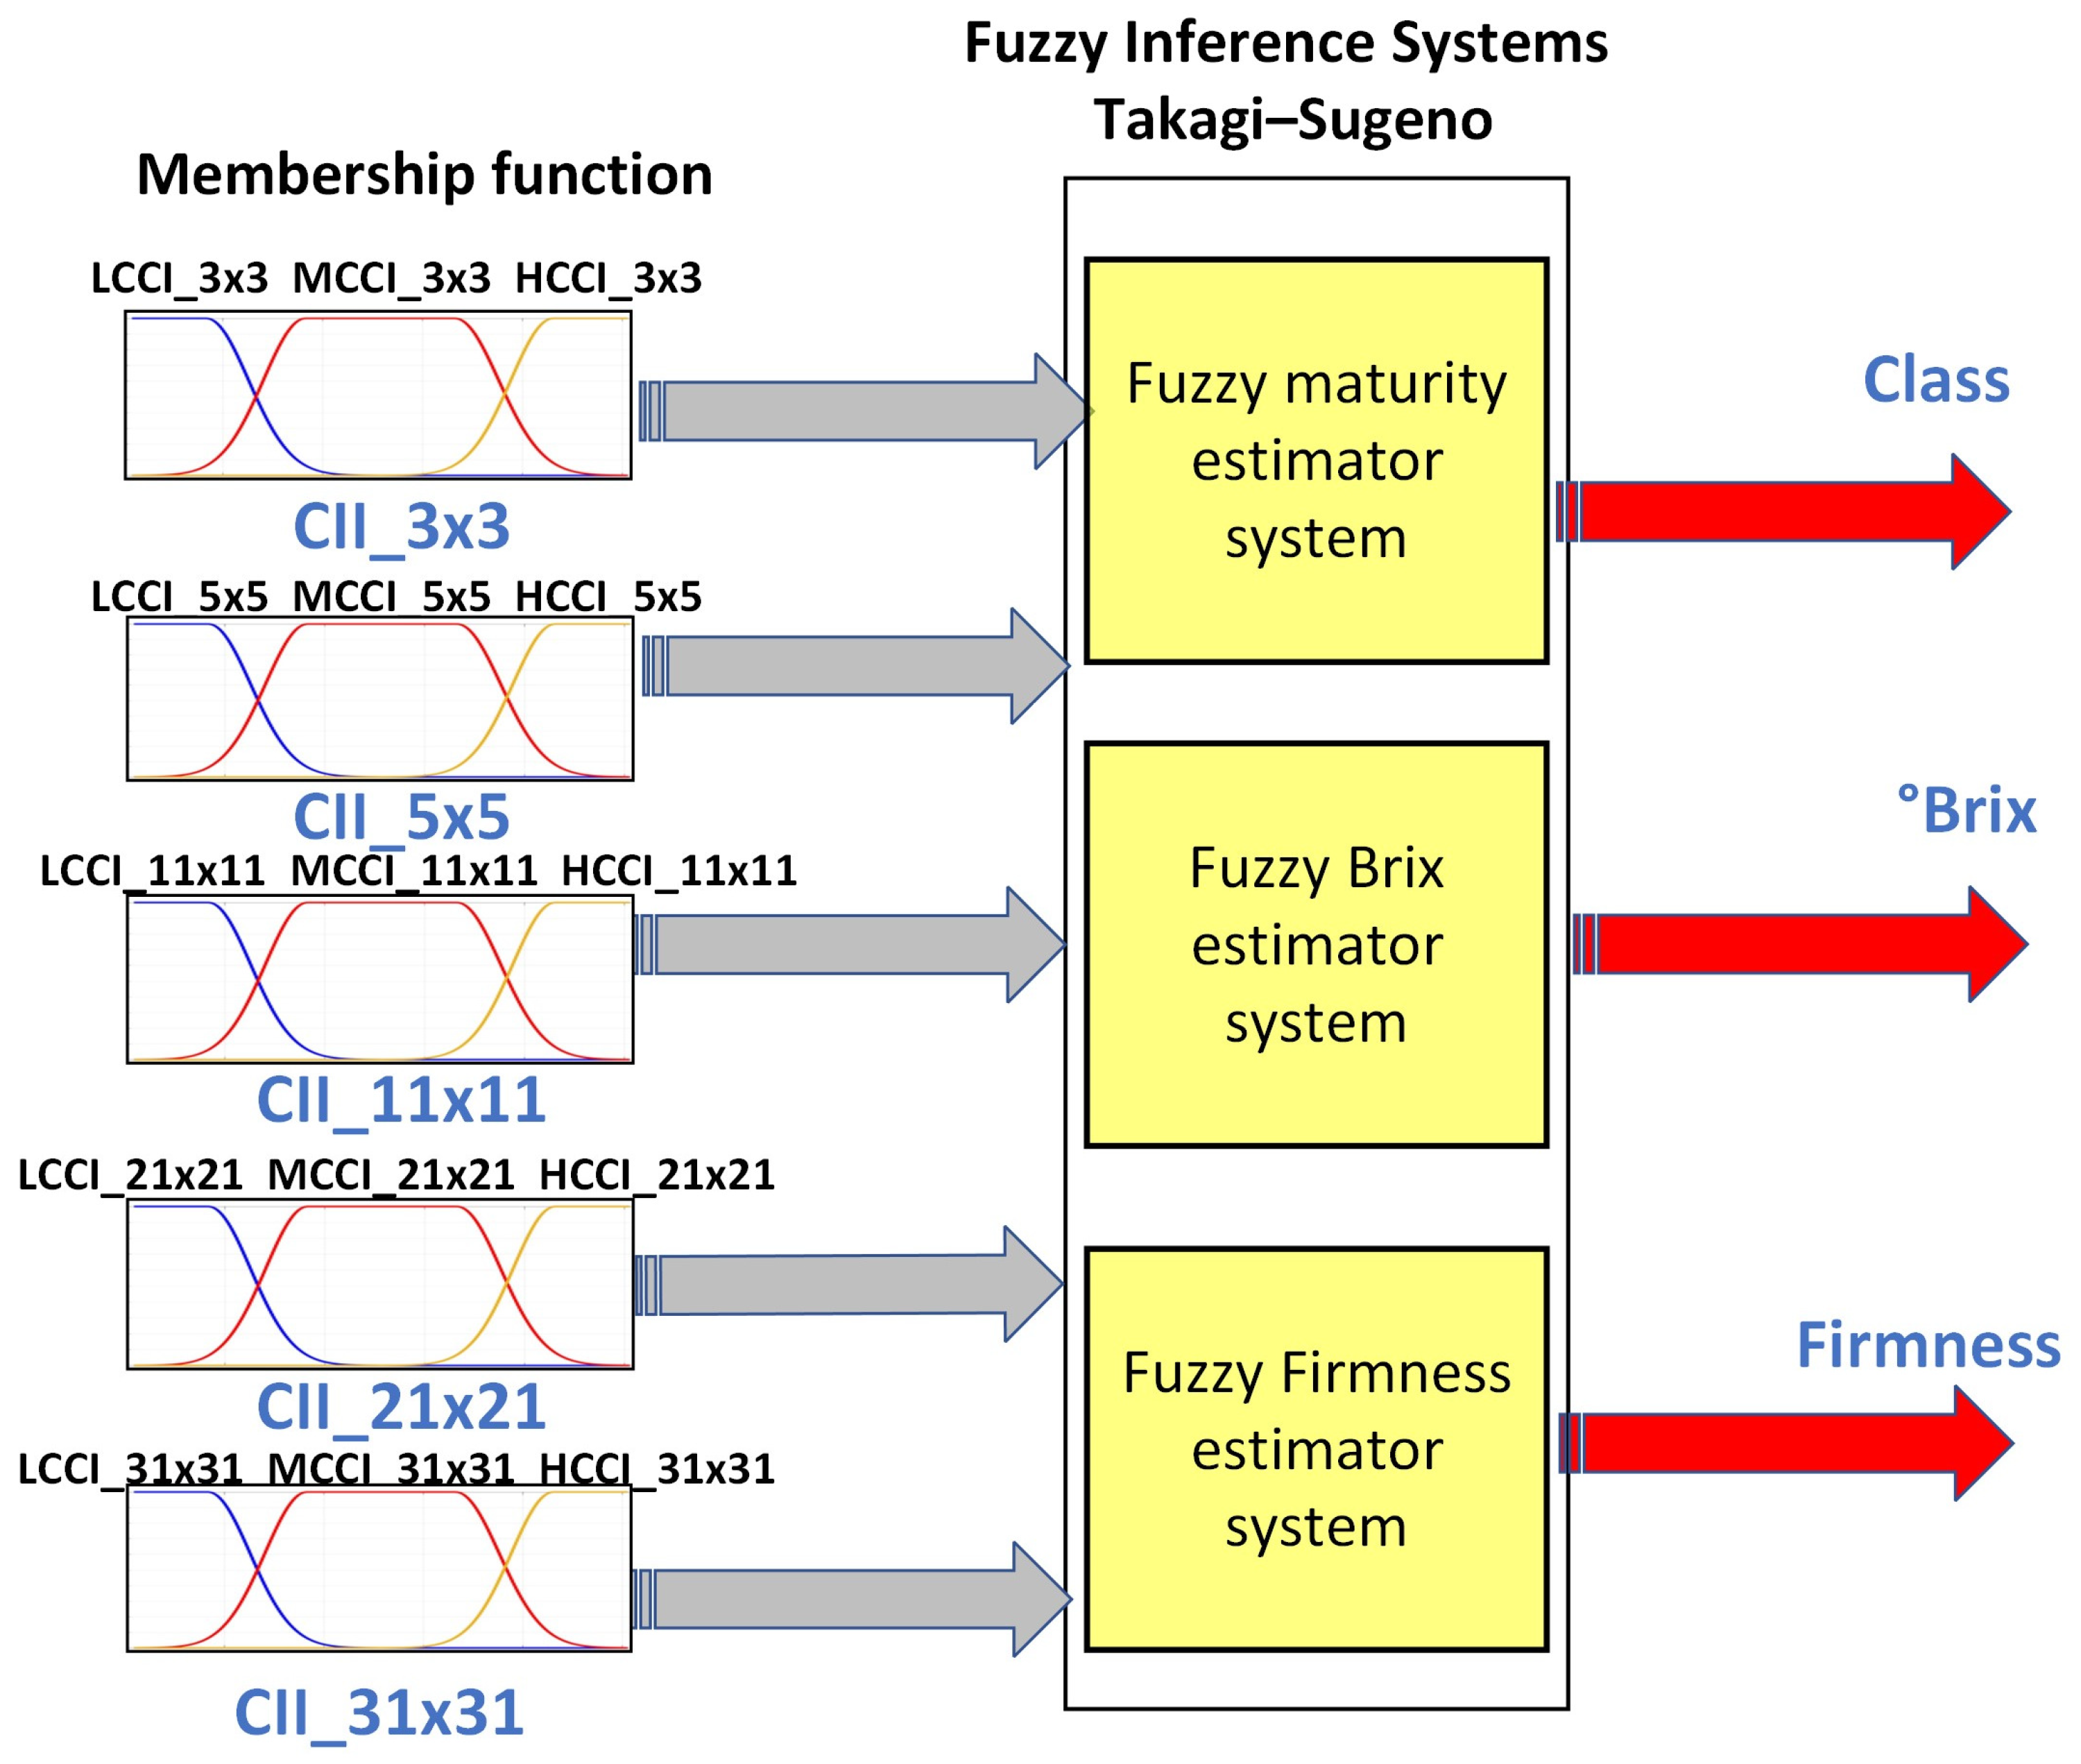
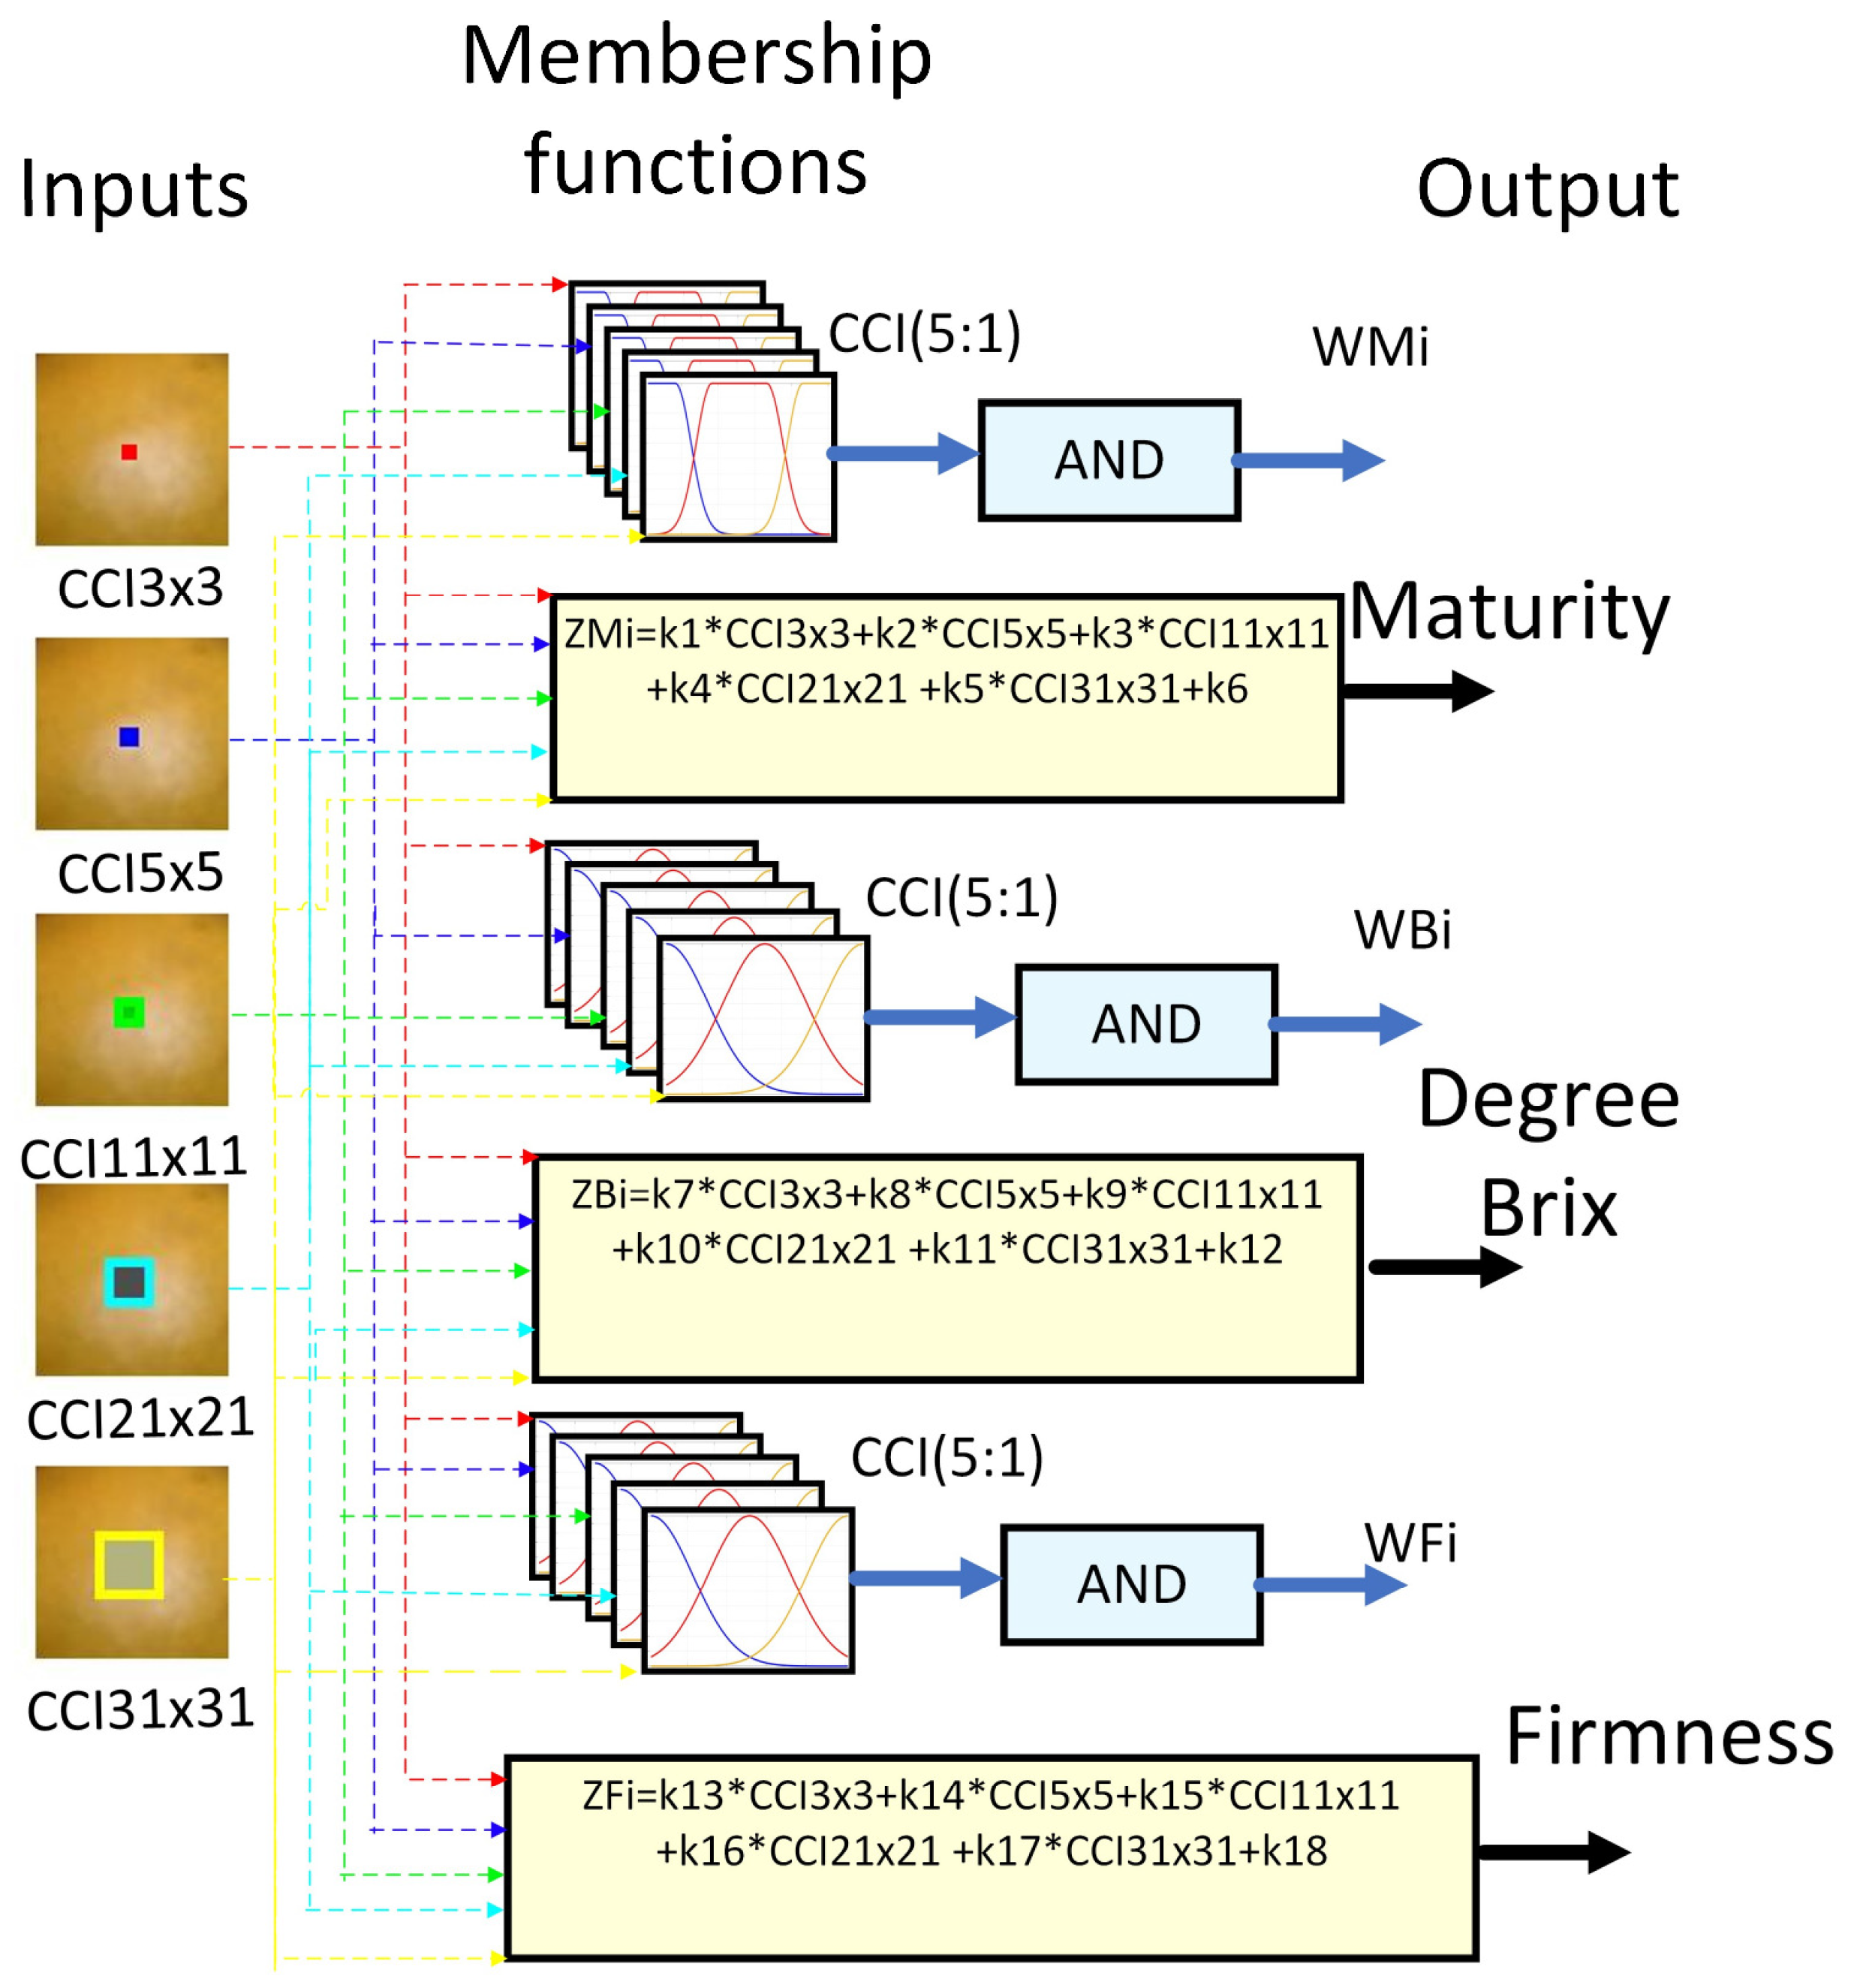
Fuzzy logic (FL) is one of the disciplines of computational intelligence that studies the adaptive mechanisms that enable or facilitate intelligent behavior in a complex and changing environment. It may be argued that it employs the value space of falsehood (0), truth (1), and multi-valued between 0 and 1 [46]. Consequently, fuzzy inference systems (FIS) have been integrated to assist in reducing uncertainty in the determination of physicochemical variables of fruits [20]. As a part of this, the following FIS architecture was proposed, which is shown in Figure 10. It uses as descriptors the orange sub-regions used to determine the different CCI and as outputs the class, sugar, and firmness. The proposed system architecture comprises three fuzzy systems that estimate the variables maturity, degrees Brix, and firmness.
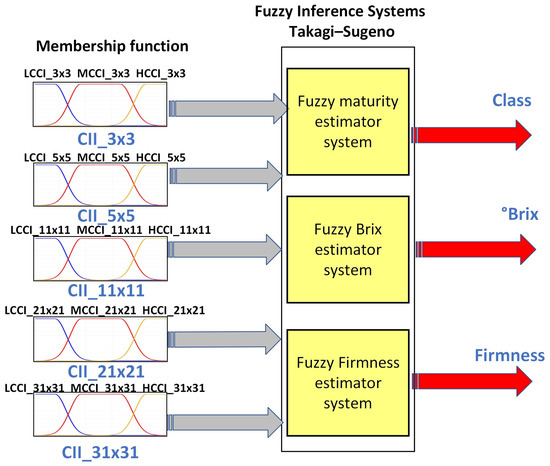
Figure 10.
Proposed fuzzy inference system.
Table 2 presents five models proposed for training with 10 epochs. The models were developed using Matlab’s Fuzzy Logic and Neuro-Fuzzy Designer Apps, which enabled us to classify the samples according to their degree of maturity. The primary distinction between the proposed models is the number of sub-regions used for input and the amount of membership function (MF) of the triangular type. Model 1 employed a 3 × 3 sub-region, three membership functions, and an error rate of 0.766. Model 2 employed a 3 × 3 and 5 × 5 sub-region, six membership functions, and an error rate of 0.705. Concerning Model 3, it is observed that it employed three different sub-region sizes, including 3 × 3, 5 × 5, and 11 × 11, in addition to nine membership functions, with an error of 0.623. Model 4 employed the aforementioned sub-regions in conjunction with 21 × 21 and 12 membership functions, resulting in an error of 0.613. Model 5 employed the 3 × 3, 5 × 5, 11 × 11, 21 × 21, and 31 × 31 sub-regions, along with 15 membership functions, resulting in an error of 0.172. The triangle membership function was selected for its simplicity of implementation and low computational cost.
Table 2.
Fuzzy models’ architecture is proposed to estimate the maturity of orange fruit.
Table 3 presents the architecture of Models 6 to 10, which predict the degree Brix of oranges. These models share similar characteristics with maturity models, including inputs and membership functions. Table 3 shows that the mean square error varies in the prediction of the physicochemical variable content using the set of oranges, Valencia.
Table 3.
Fuzzy models’ architecture proposed to estimate the Brix grade of orange Valencia.
Table 4 shows the architecture of Models 11 to 15, which predict the firmness of oranges. These models have similar characteristics to the models for maturity and Brix, including inputs and membership functions.
Table 4.
Fuzzy models’ architecture is proposed to estimate the firmness of orange Valencia.
2.8. Fuzzification
The fuzzification process involves transforming the input variables into fuzzy plane values. In other words, each input value is evaluated following the corresponding membership functions, thereby generating a degree of fuzzy set membership. Table 5 presents a comparison of the architectures, demonstrating that the fuzzy inference systems comprising 5 CCI sub-regions and 15 membership functions have the lowest errors, namely, 0.1, 0.289, and 0.250. Moreover, a strong correlation of the variables of 0.98 for maturity and degree is observed in the case of firmness, with a correlation coefficient of 0.97.
Table 5.
The selection of membership functions for the proposed architectural design.
Subsequently, an evaluation was conducted to assess the efficacy of different membership functions, including triangular, trapezoidal, bell, Gaussian, and a combination of two Gaussians, as shown in Table 5. Upon analysis of Table 5, it was determined that the Gaussian membership function is optimal for estimating the Brix content of the orange, with a mean squared error (MSE) of 0.289 and a coefficient of determination (R2) of 0.98. In contrast, the combination of two Gaussian functions is most suitable for estimating maturity and firmness. In the case of maturity, the error is 0.1, with an R2 value of 0.98. For firmness, the error was 0.25, with an R2 value of 0.97.
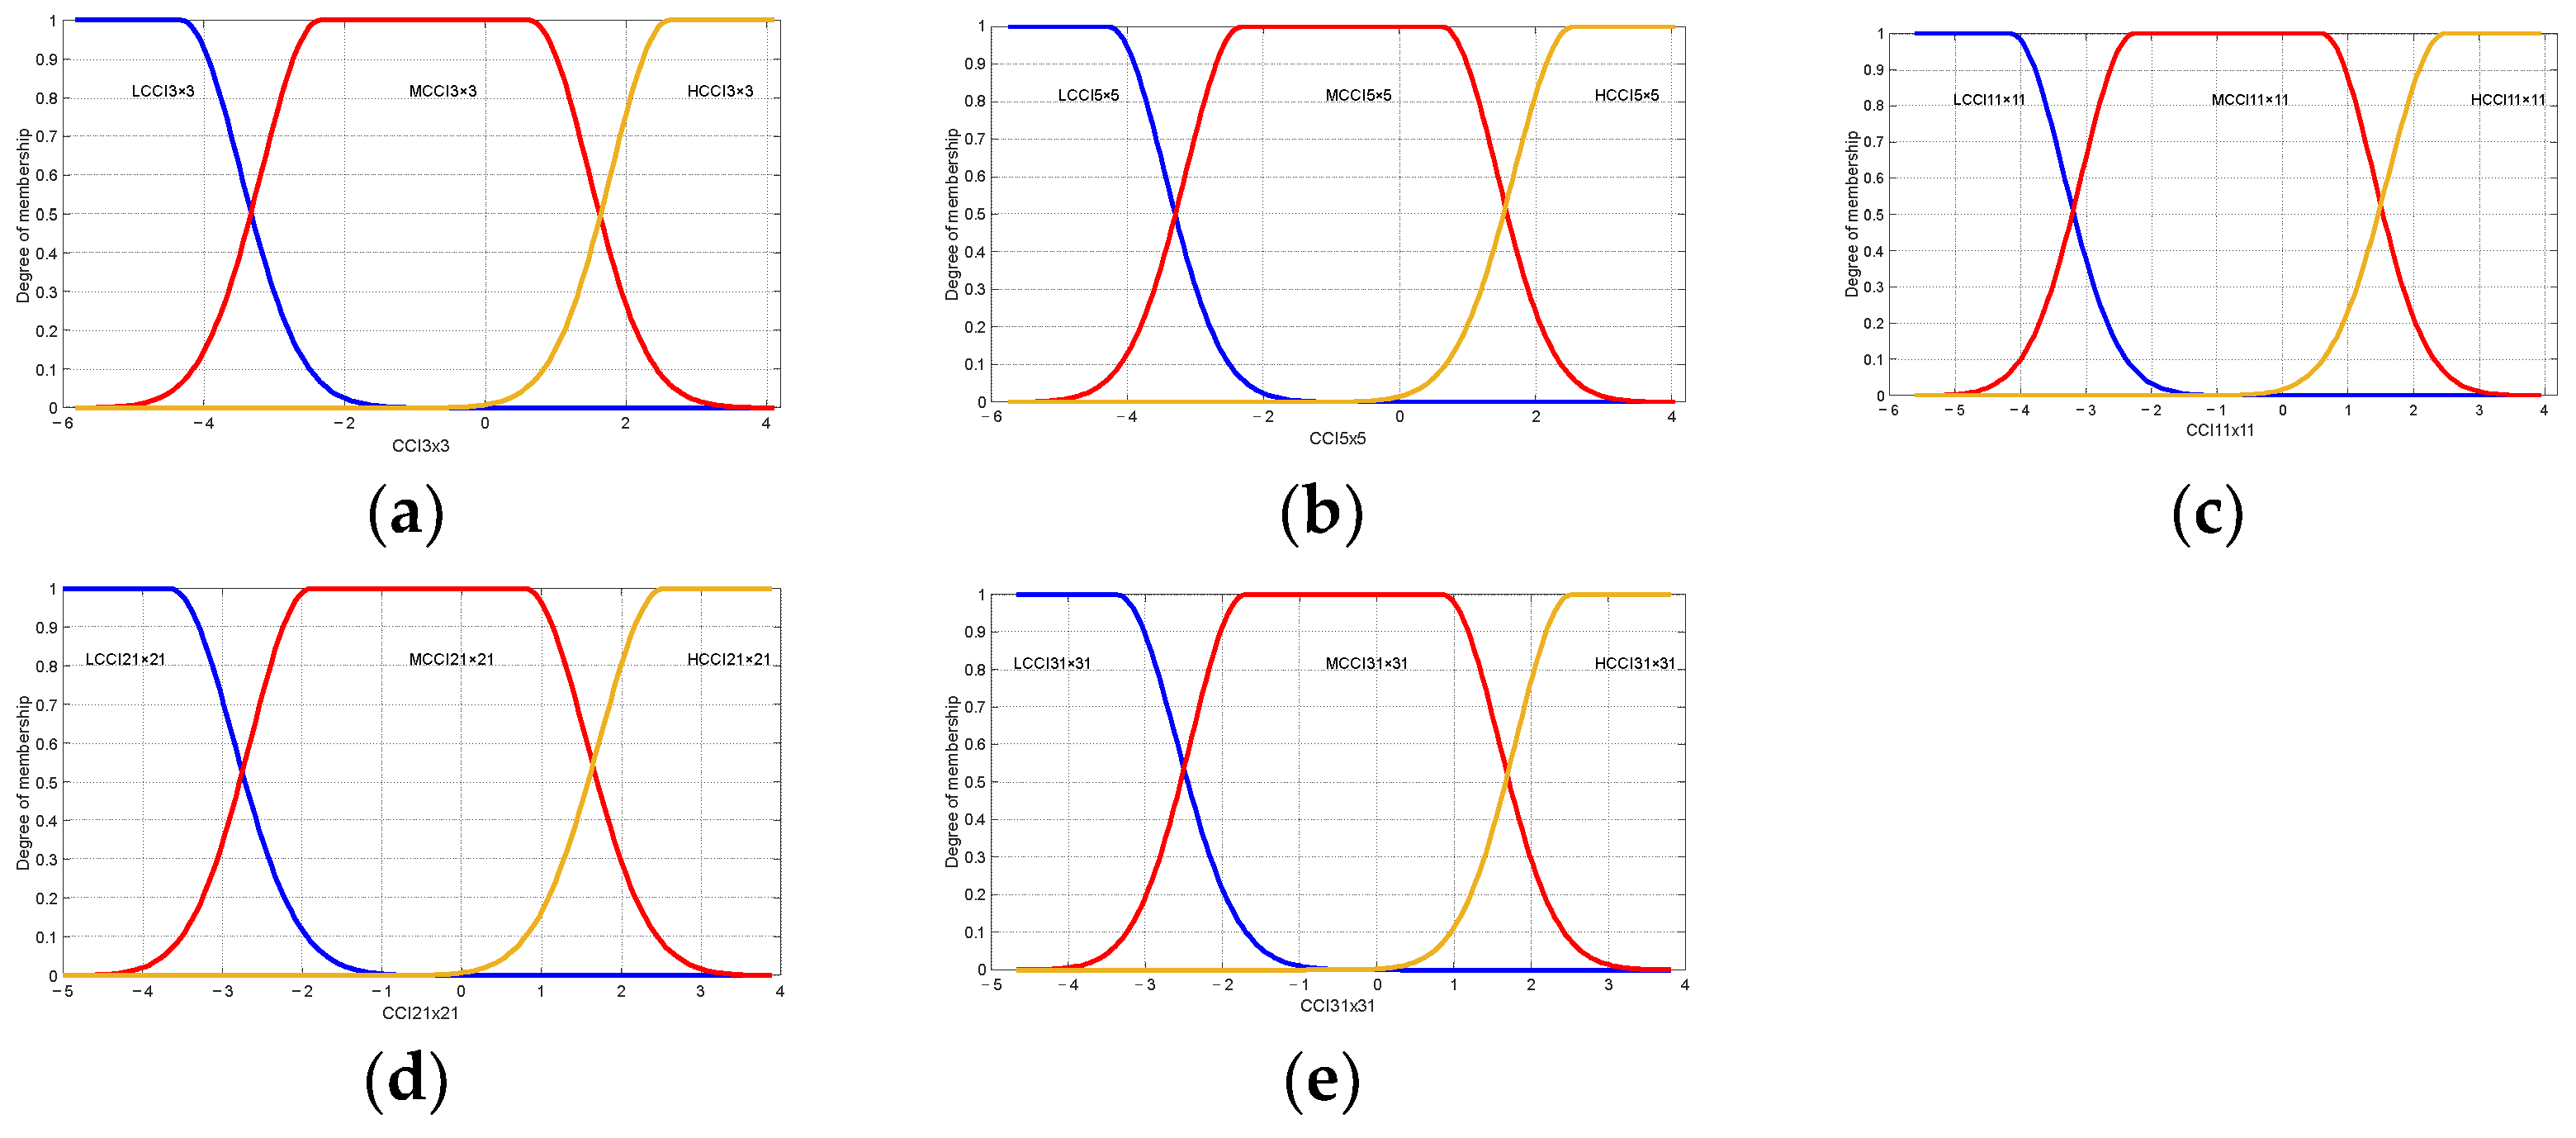
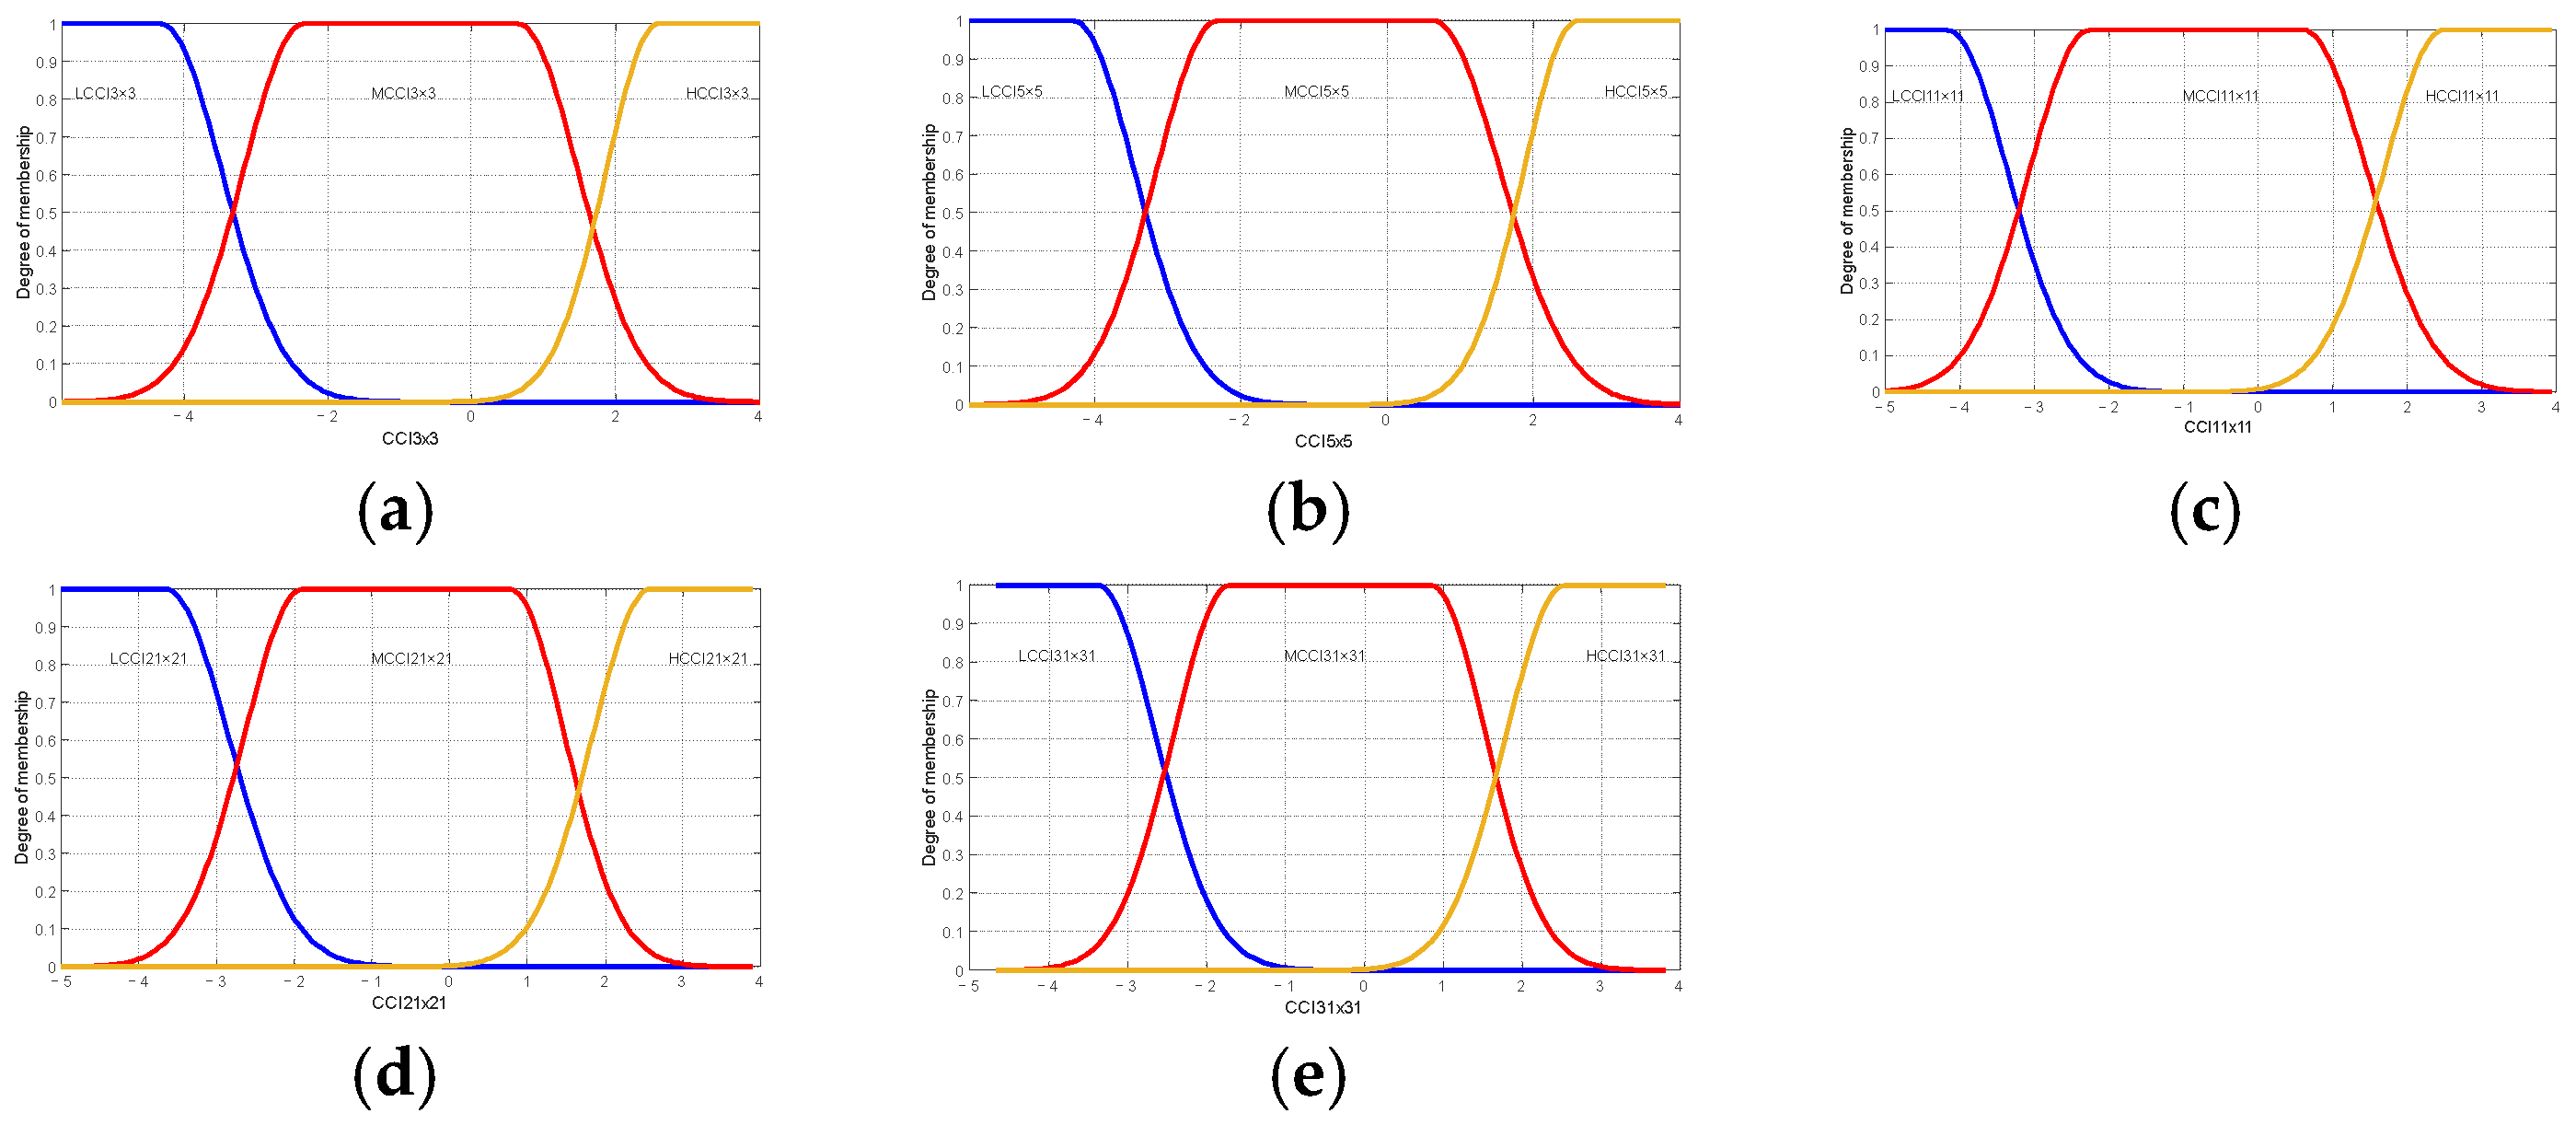
Table 6 shows the linguistic variables used by the maturity classification model; these are “LCCI 3 × 3” Low Citrus Color Index 3 × 3, “MCCI 3 × 3” Medium Citrus Color Index of 5 × 5, “HCCI 3 × 3” High Citrus Color Index of 3 × 3, “LCCI 5 × 5” Low Citrus Color Index of 5 × 5, “MCCI 5 × 5” Medium Citrus Color Index of 5 × 5, “HCCI 5 × 5” High Citrus Color Index of 5 × 5, “LCCI 11 × 11” Low Citrus Color Index of 11 × 11, “ MCCI 11 × 11” Medium Citrus Color Index of 11 × 11, “HCCI 11 × 11” High Citrus Color Index of 11 × 11, “LCCI 21 × 21” Low Citrus Color Index of 21 × 21, “MCCI 21 × 21” Medium Citrus Color Index of 21 × 21, “HCCI 21 × 21” High Citrus Color Index of 21 × 21, “LCCI 31 × 31” Low Citrus Color Index of 31 × 31, “MCCI 31 × 31” Medium Citrus Color Index of 31 × 31, and “HCCI 31 × 31” High Citrus Color Index of 31 × 31, which are shown in Figure 11.
Table 6.
Gaussian2mf membership functions parameters of maturity of oranges Valencia.
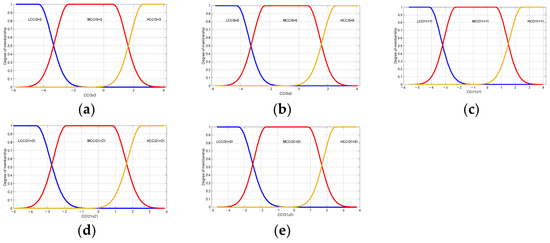
Figure 11.
Membership functions used in the proposed model maturity of oranges Valencia. Low Citrus Color Index: (a) 3 × 3, (b) 5 × 5, (c) 11 × 11, (d) 21 × 21, and (e) 31 × 31 data.
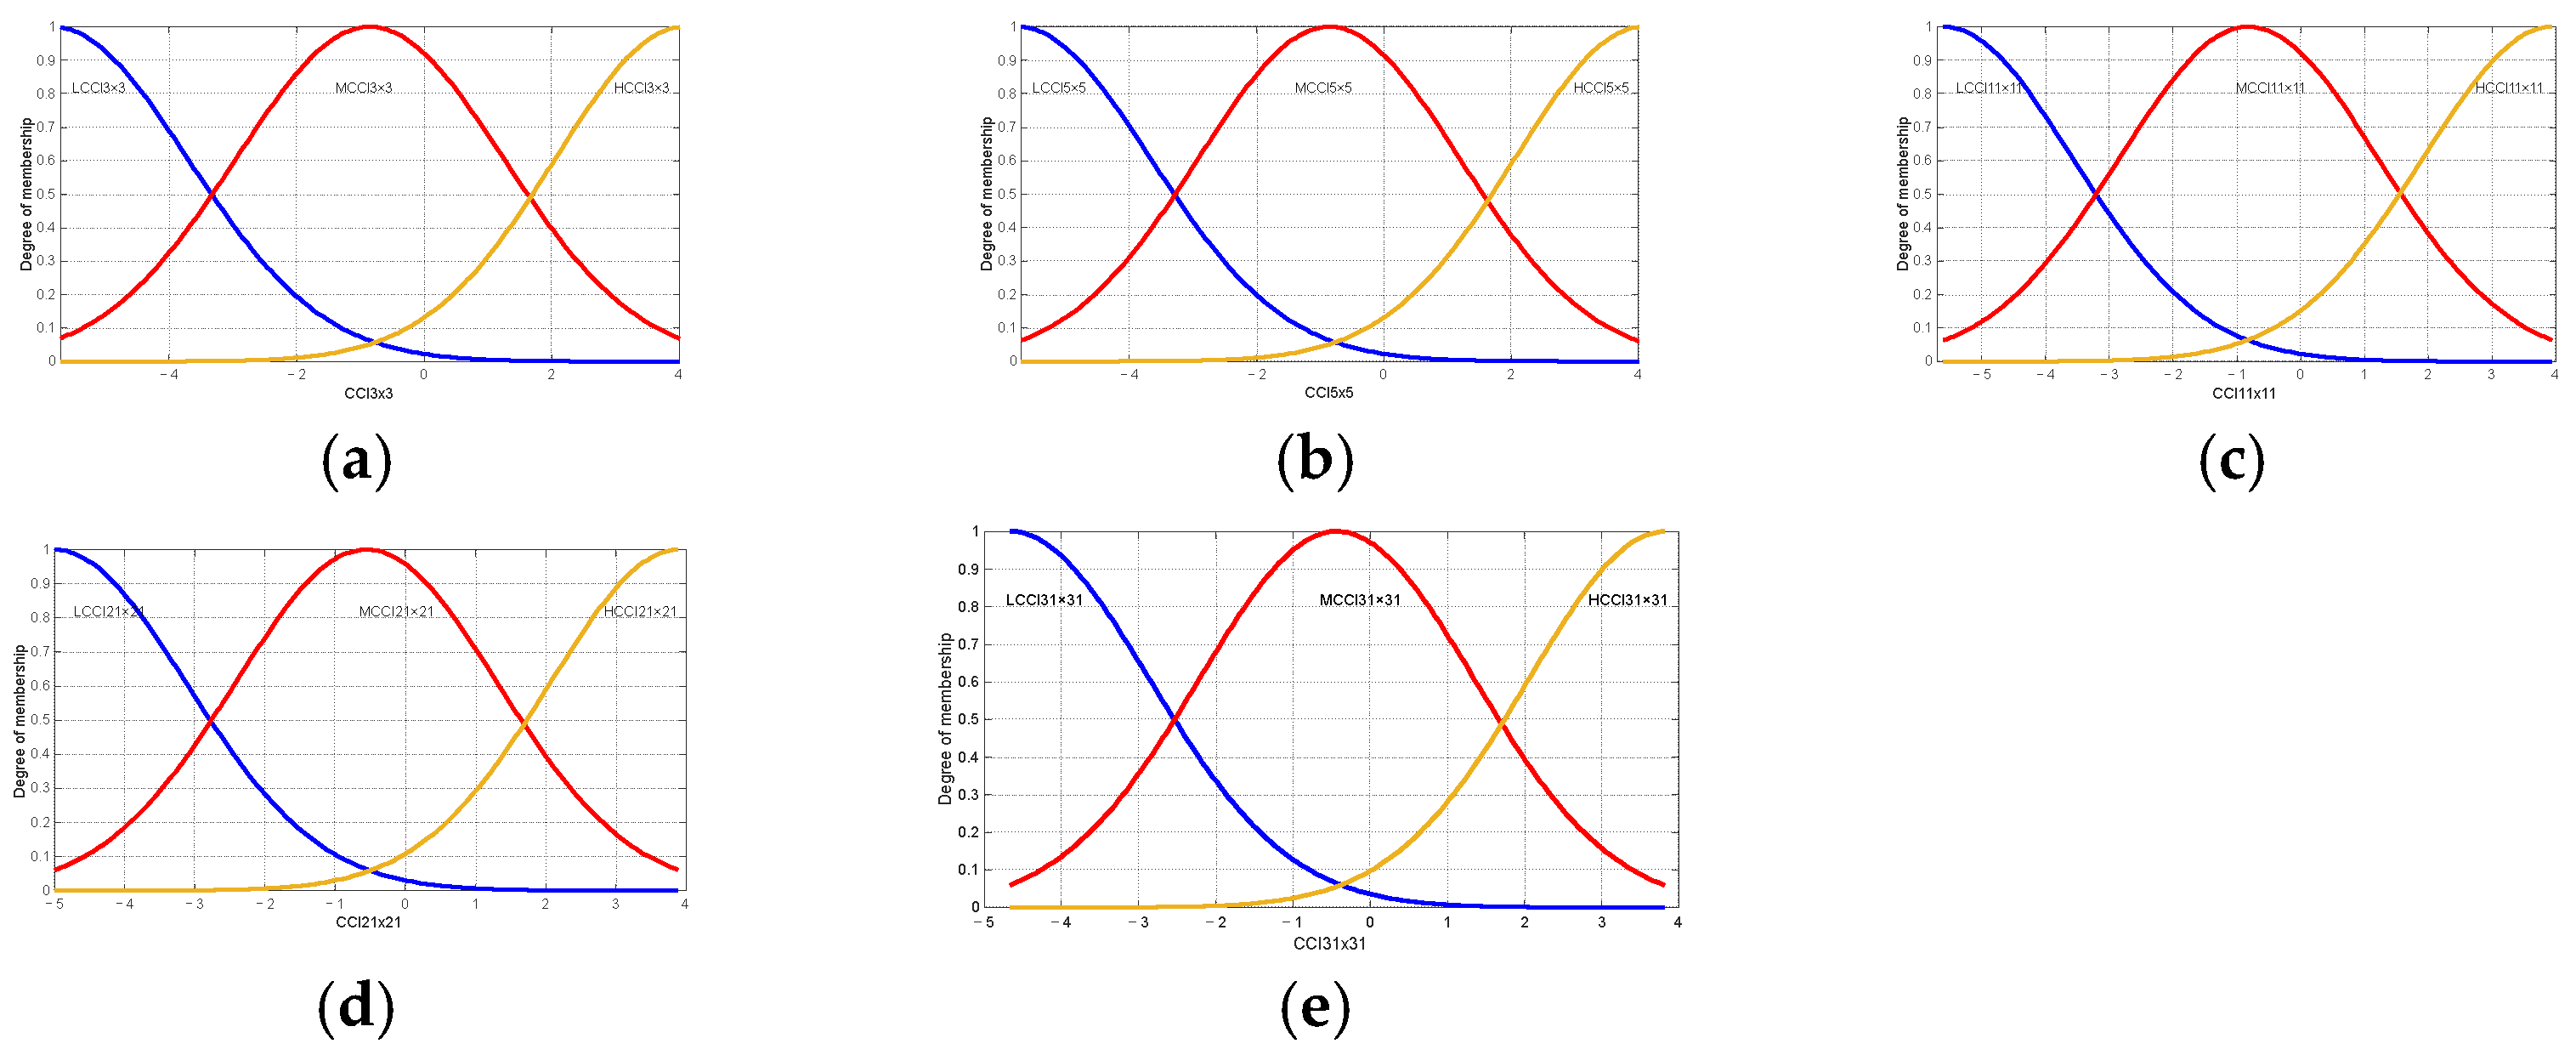
Table 7 and Table 8 present the linguistic variables employed in the Brix and firmness prediction model and are identical to those employed in the maturity prediction model. This is important to note that the principal distinction between the models is the range of values that are considered and the type of membership function, as shown in Figure 12 and Figure 13.
Table 7.
Gaussian membership functions parameters of degree Brix of oranges Valencia.
Table 8.
Gaussian2mf membership functions’ parameters of firmness of oranges Valencia.
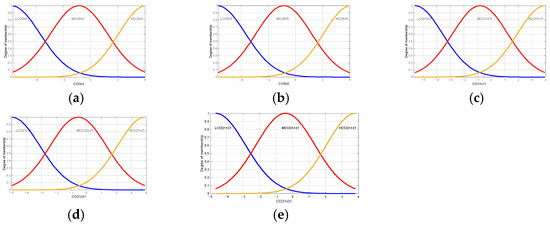
Figure 12.
Membership functions used in the proposed model degree Brix of oranges Valencia: (a) membership functions for Low Citrus Color Index 3 × 3 data; (b) membership functions for Low Citrus Color Index 5 × 5 data; (c) membership functions for Low Citrus Color Index 11 × 11 data; (d) membership functions for Low Citrus Color Index 21 × 21 data; and (e) membership functions for Low Citrus Color Index 31 × 31 data.
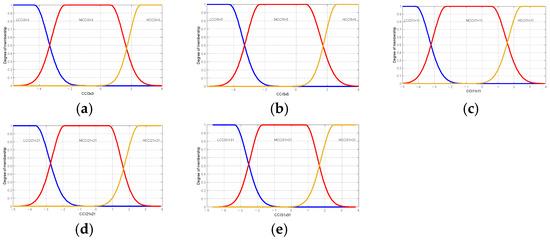
Figure 13.
Membership functions used in the proposed model firmness or oranges Valencia: (a) membership functions for Low Citrus Color Index 3 × 3 data; (b) membership functions for Low Citrus Color Index 5 × 5 data; (c) membership functions for Low Citrus Color Index 11 × 11 data; (d) membership functions for Low Citrus Color Index 21 × 21 data; and (e) membership functions for Low Citrus Color Index 31 × 31 data.
- Inference
An essential component of the FIS is the knowledge base. This is composed of rules associated with knowledge, perception, experience, and the ambiguity of the expert, which is challenging to capture with exact values. The set of rules is of the IF-Else type with AND. This was implemented with the scalar product between arguments [47,48]. The results were delivered to each output variable, corresponding to the respective output weights, WMi (weight associated with the rule of inference about the ripeness of the orange), WBi (weight associated with the inference rule on the Brix degree of the orange), and WFi (weight associated with the inference rule about the firmness of the orange).
Three rules of the 243 inference rules and their respective weights for each of the two fuzzy systems maturity, degree Brix, and firmness are shown in Appendix A.
- If (CCI 3 × 3 is LCCI 3 × 3) and (CCI 5 × 5 is LCCI 5 × 5) and (CCI 11 × 11 is LCCI 11 × 11) and (CCI 21 × 21 is LCCI 21 × 21) and (CCI 31 × 31 is LCCI 31 × 31) then (Maturity is WMi).
- If (CCI 3 × 3 is LCCI 3 × 3) and (CCI 5 × 5 is LCCI 5 × 5) and (CCI 11 × 11 is LCCI 11 × 11) and (CCI 21 × 21 is LCCI 21 × 21) and (CCI 31 × 31 is LCCI 31 × 31) then (Brix is WBi).
- If (CCI 3 × 3 is LCCI 3 × 3) and (CCI 5 × 5 is LCCI 5 × 5) and (CCI 11 × 11 is LCCI 11 × 11) and (CCI 21 × 21 is LCCI 21 × 21) and (CCI 31 × 31 is LCCI 31 × 31) then (Firmness is WFi).
2.9. Defuzzification
Defuzzification is the conversion process that results from a real value variable [48]. This conversion process was carried out using Equations (1)–(3), which used 243 inference rules. Figure 14 shows the Takagi–Sugeno fuzzy model, wherein WMi, WBi, and WFi represent the weights of the outputs fuzzy rule. ZMi is associated with output-level maturity, ZBi corresponds to output-level degree Brix, and ZFi is related to output-level firmness. It should be noted that the subscript i indicates the rule number used to calculate the weighted average of the maturity, degree Brix, and firmness using the weights and output levels. These levels depend on the input variables and the weights of the membership function. N represents the number of fuzzy rules.
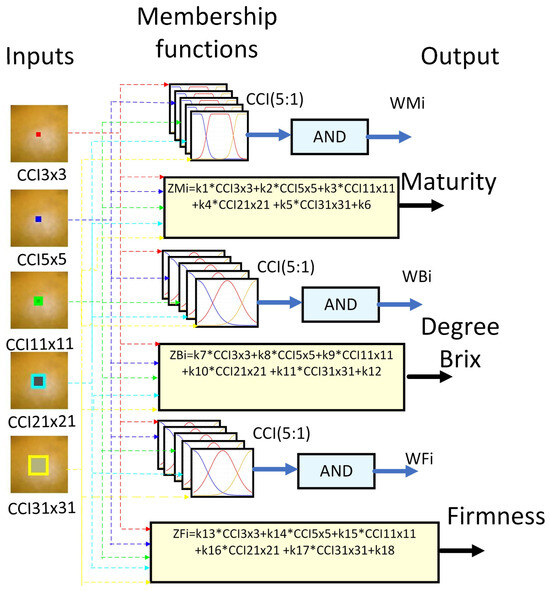
Figure 14.
Takagi–Sugeno for defuzzification.
3. Results
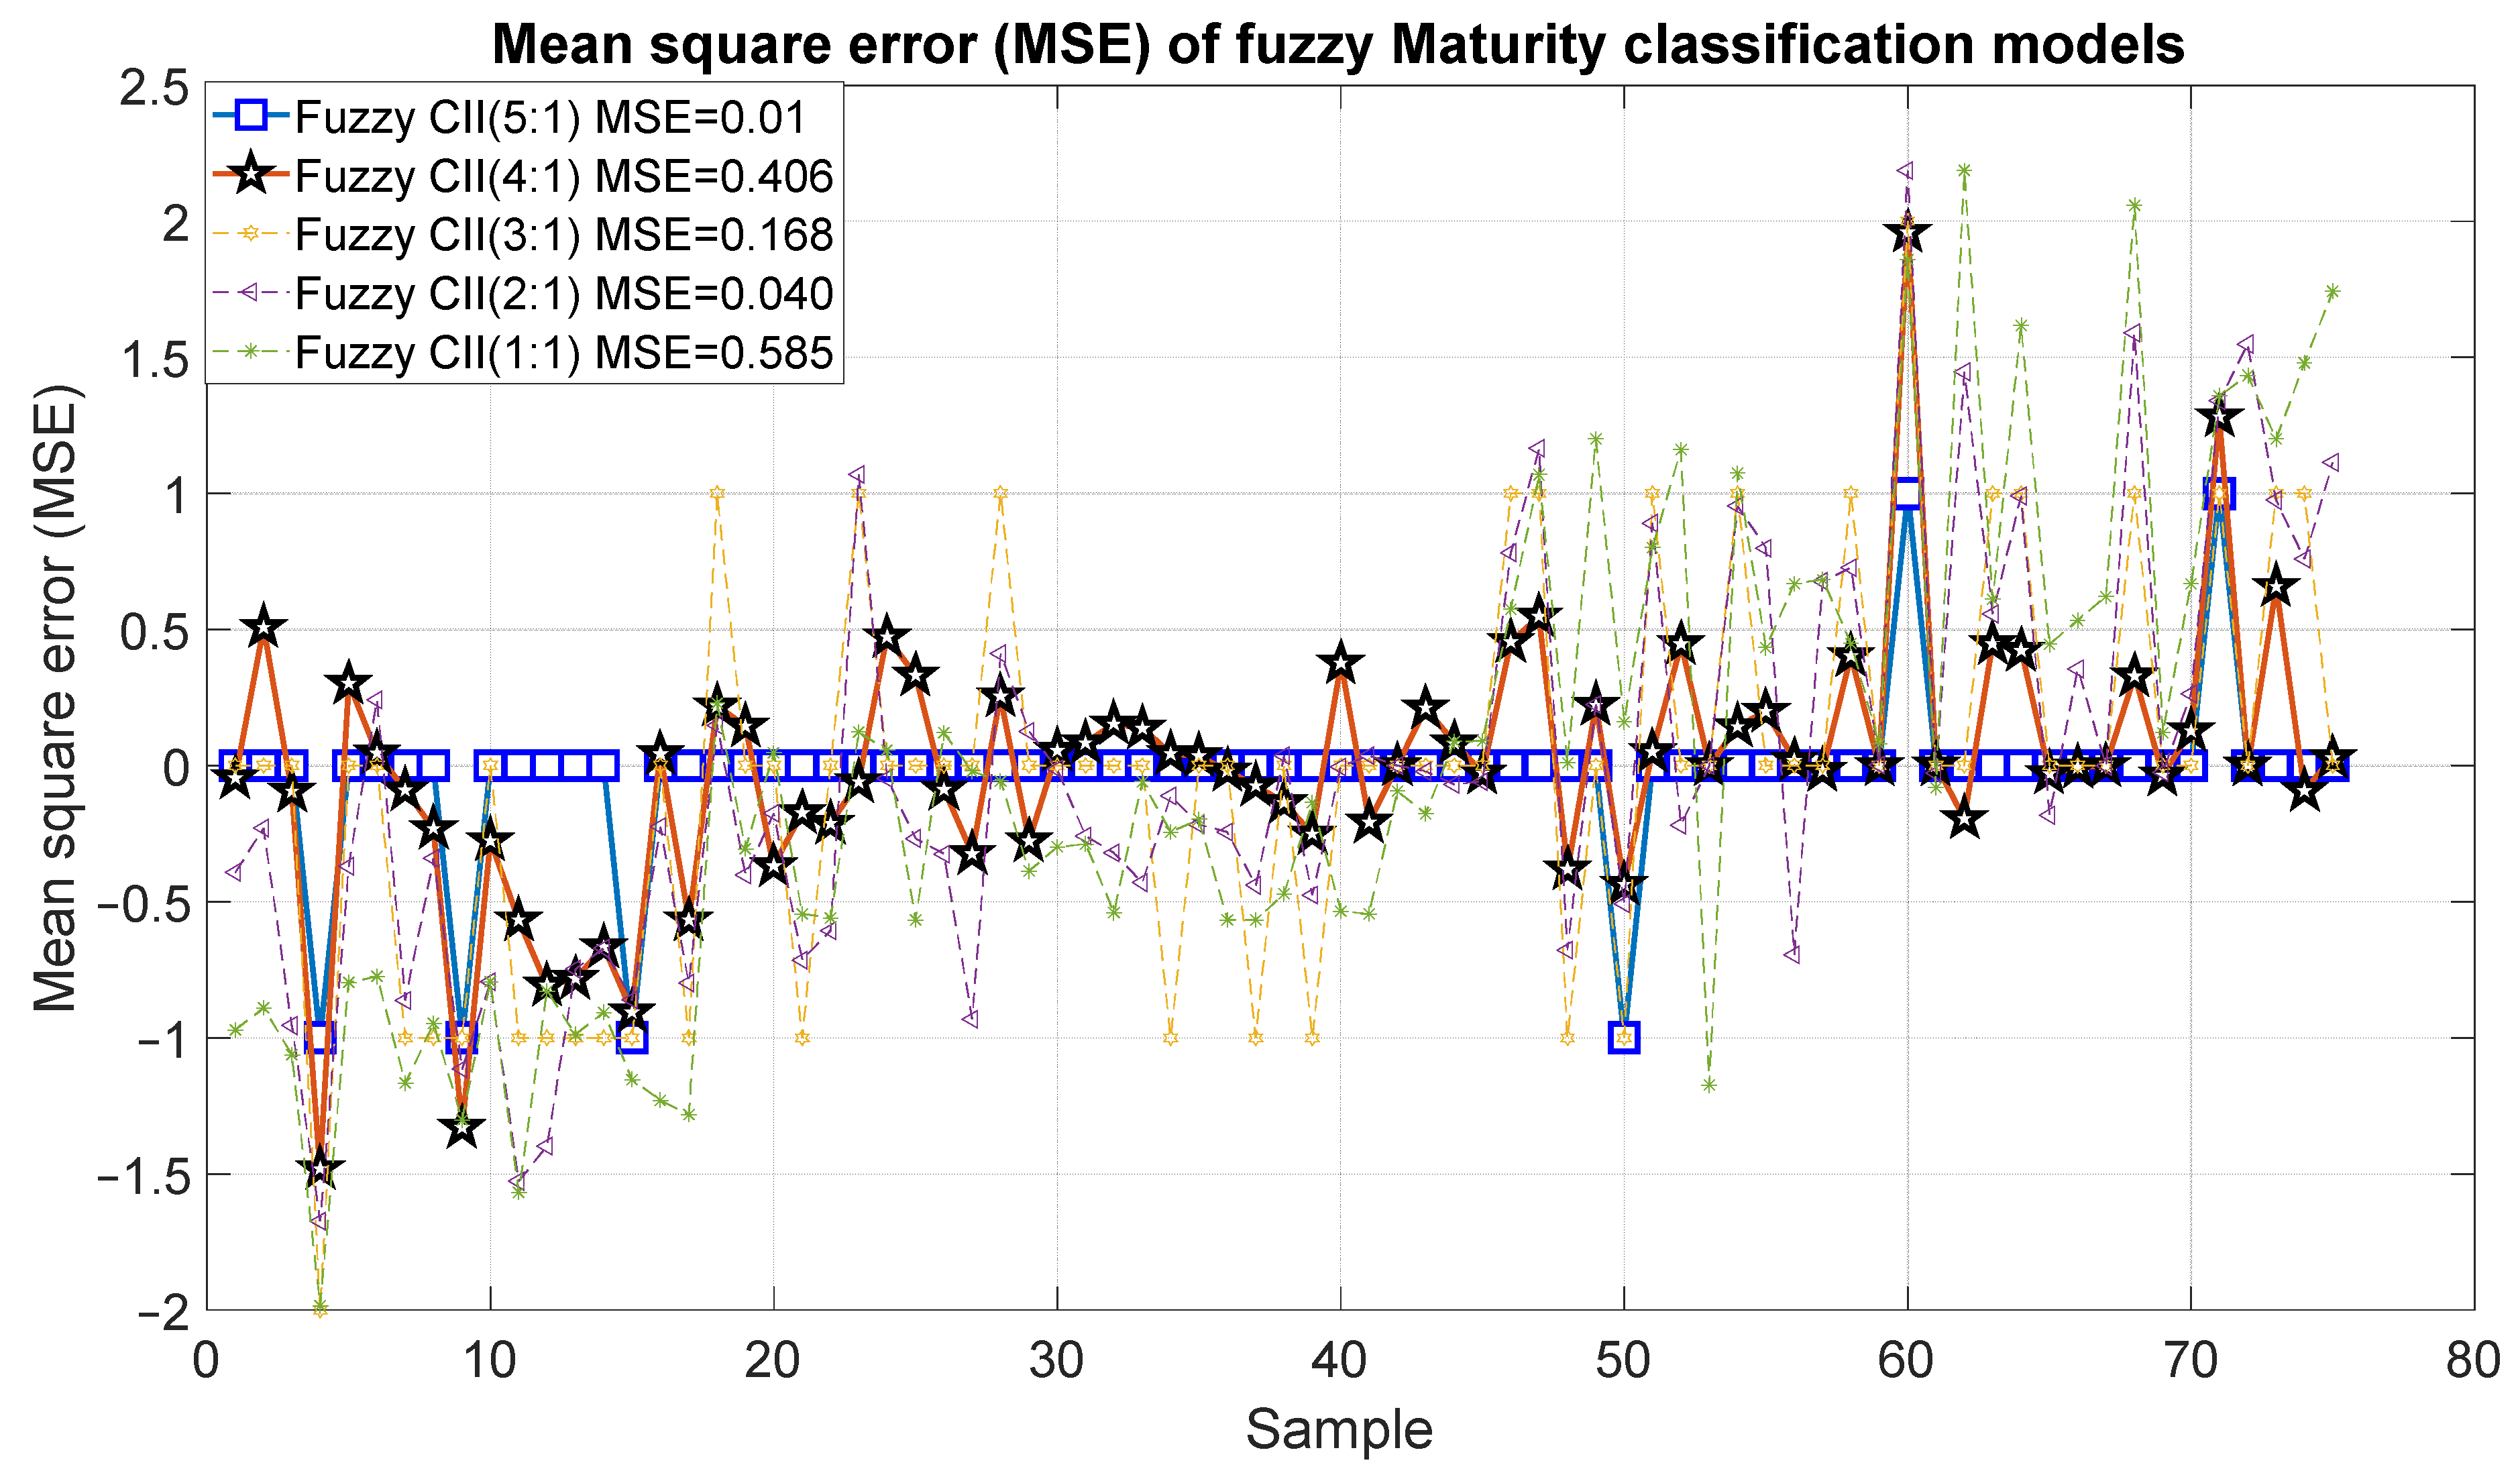
Figure 15 and Figure 16 show the outcomes of the proposed fuzzy maturity classification models. The results demonstrate that Model 5, which employed the five CCI regions, presented the highest correlation with R2 of 0.98 and an error of 0.01. It is noteworthy that Model 4, which employs only four CCI regions, exhibited a slightly inferior result, with an R2 of 0.95 and an error of 0.406. In the case of Model 3, it demonstrated a good correlation of 0.79 and errors of 0.168. The correlation coefficient for Model 2 and Model 1 was 0.51, 30 with an error of 0.40 and 0.585.
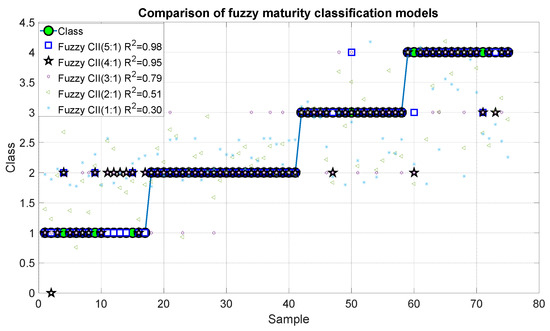
Figure 15.
Predictions of the fuzzy inference systems of maturity.
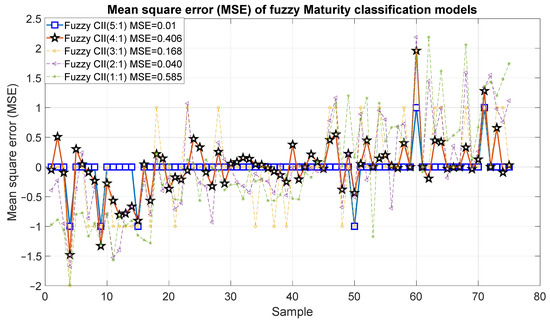
Figure 16.
Mean square error of the predictions of the fuzzy inference systems of maturity.
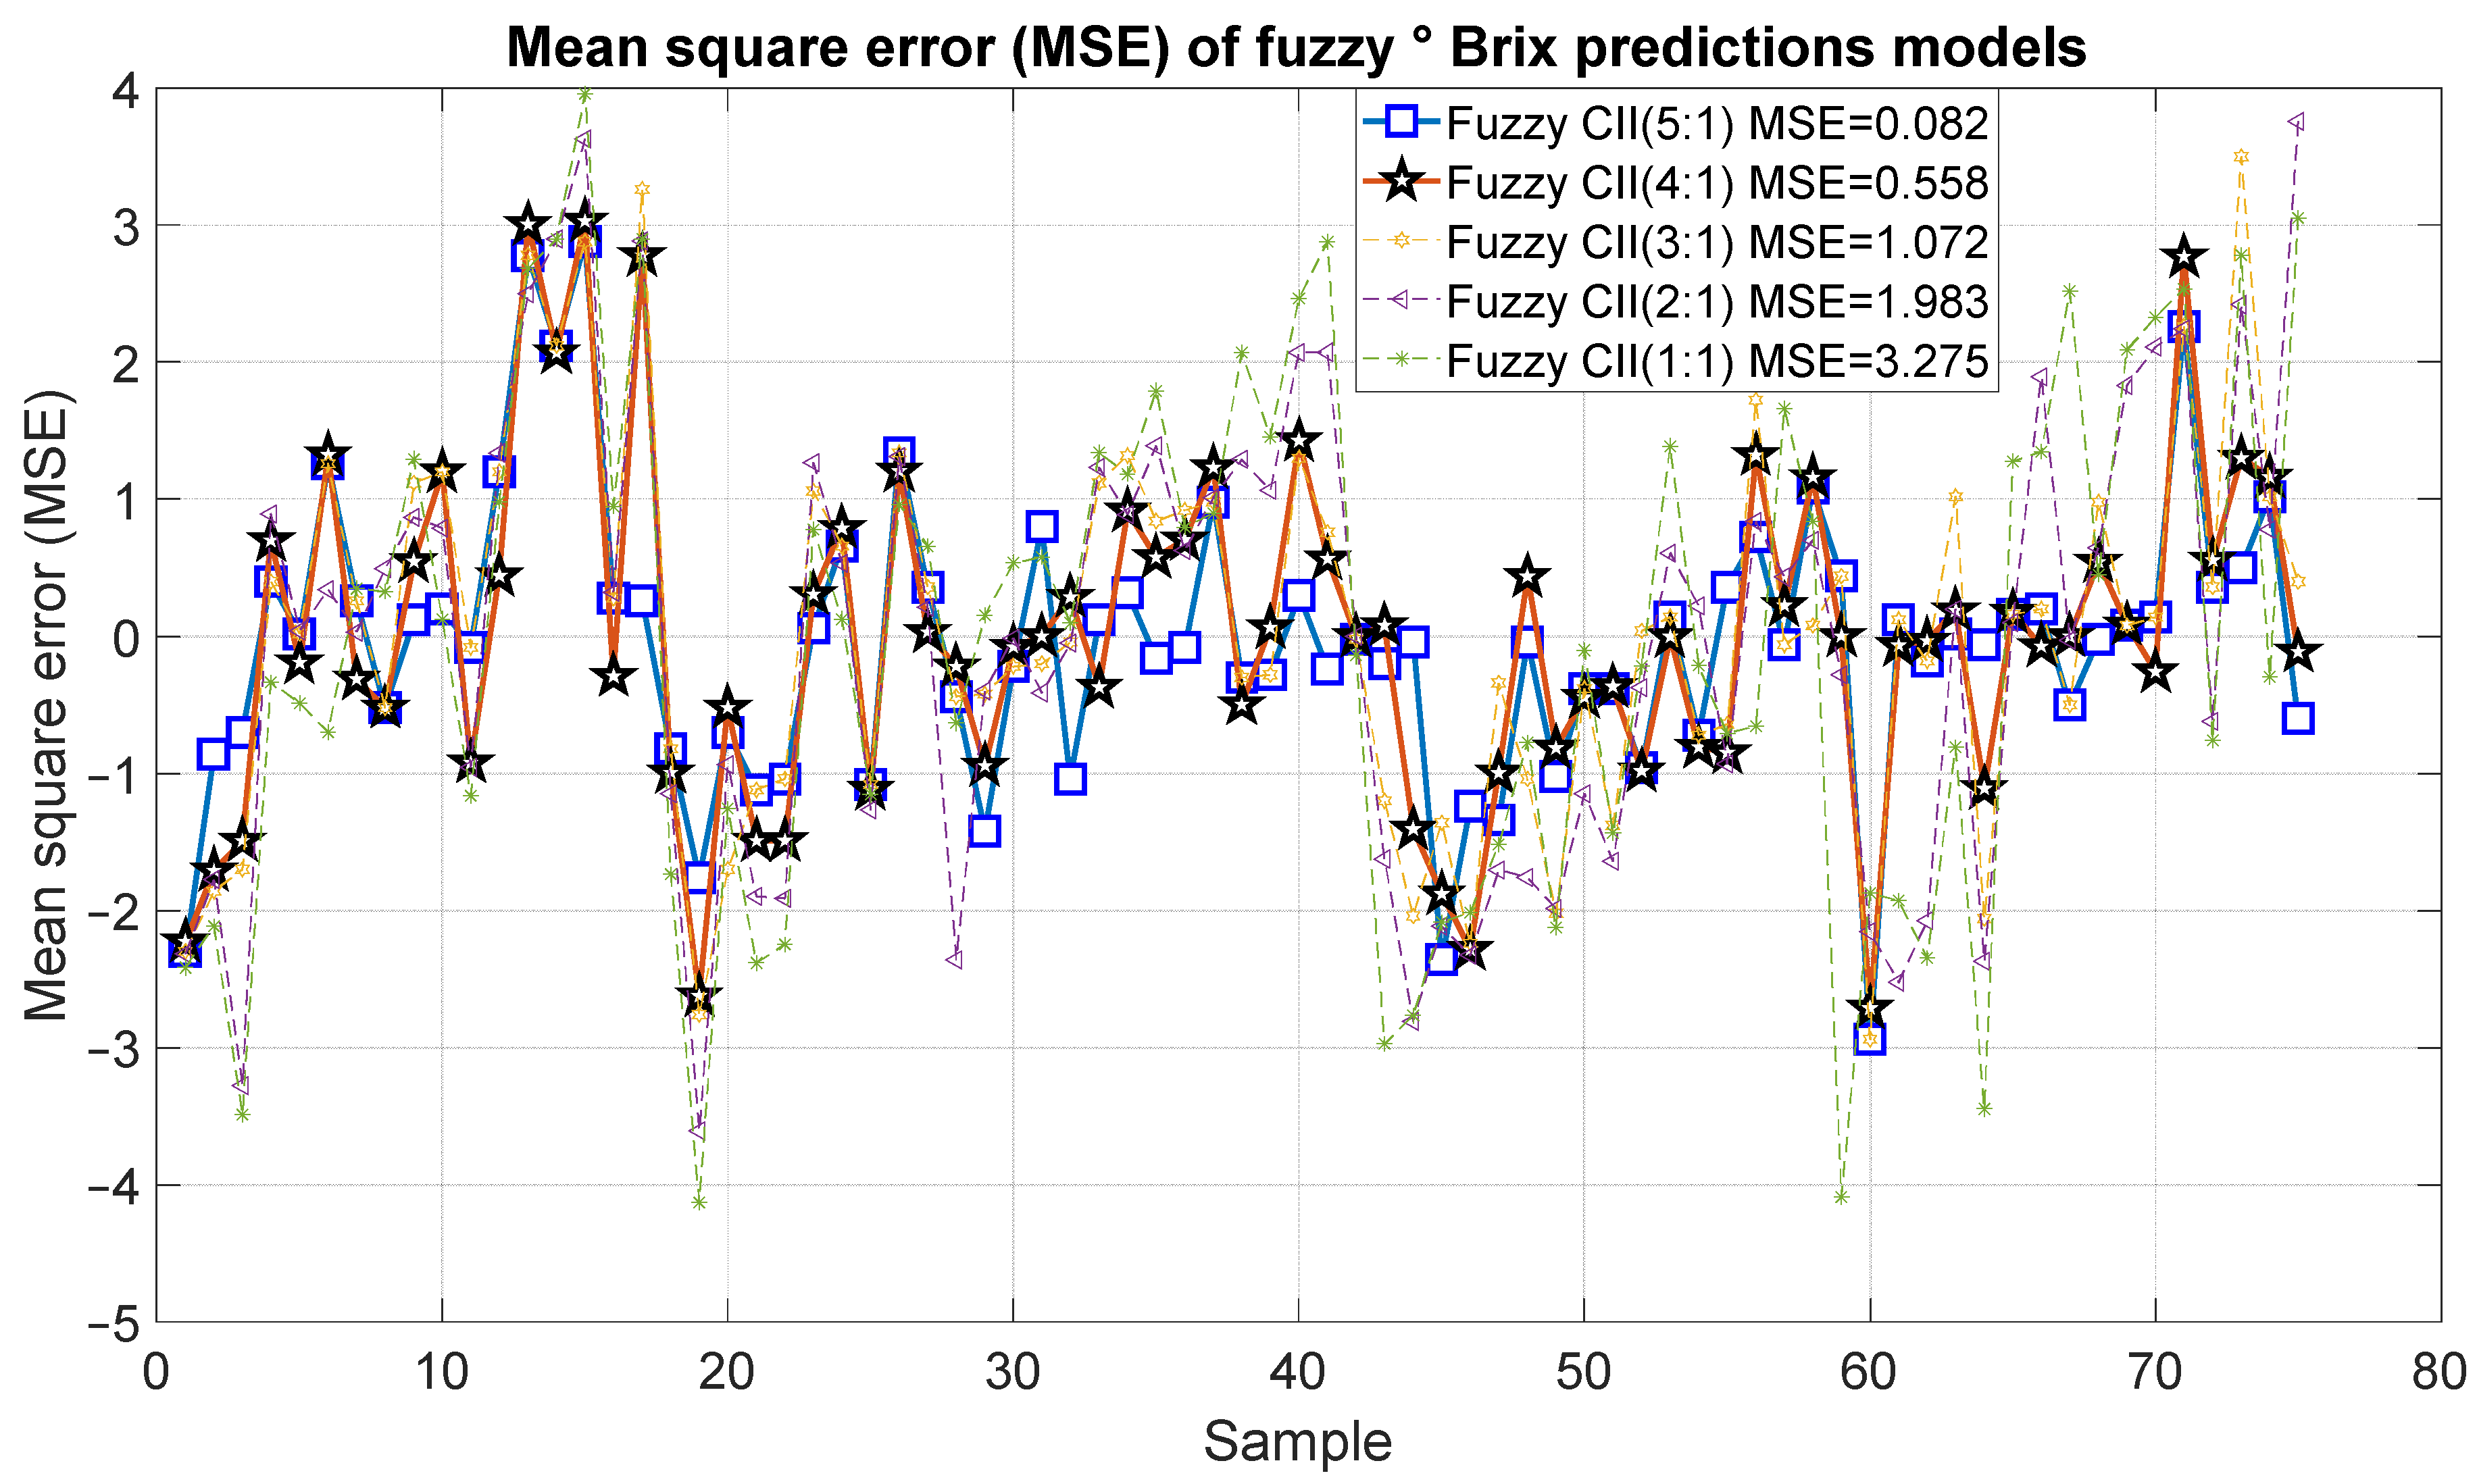
Figure 17 and Figure 18 present the results of the proposed fuzzy Brix degree prediction models. It should be noted that the strongest statistical correction was 0.98 with an error of 0.082, which corresponds to Model 10. Likewise, Model 9 presented slightly inferior results with a statistical correlation R2 of 0.92 and an error of 0.558. Alternatively, Models 7 and 8 demonstrated satisfactory correlations of 0.85 and 0.72, respectively, accompanied by relatively minor errors of 1.072 and 1983, respectively. Conversely, Model 1 exhibited a comparatively low correlation of 0.54 and an error of 3.275.
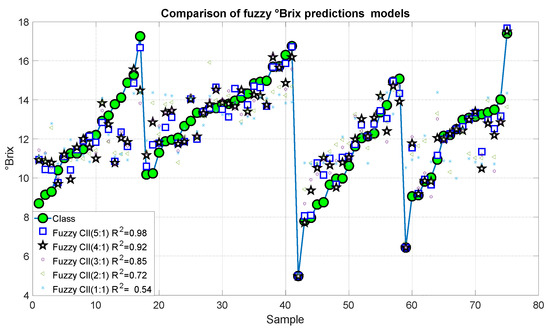
Figure 17.
Predictions of the fuzzy inference systems of degree Brix.
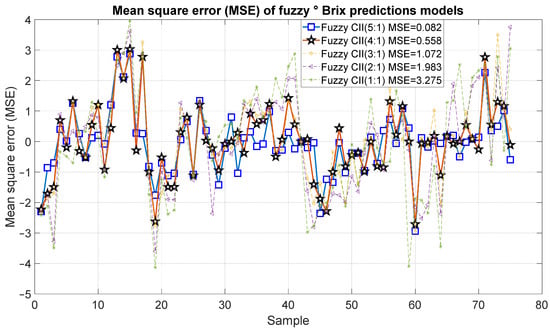
Figure 18.
Mean square error of the predictions of the fuzzy inference systems of degree Brix.
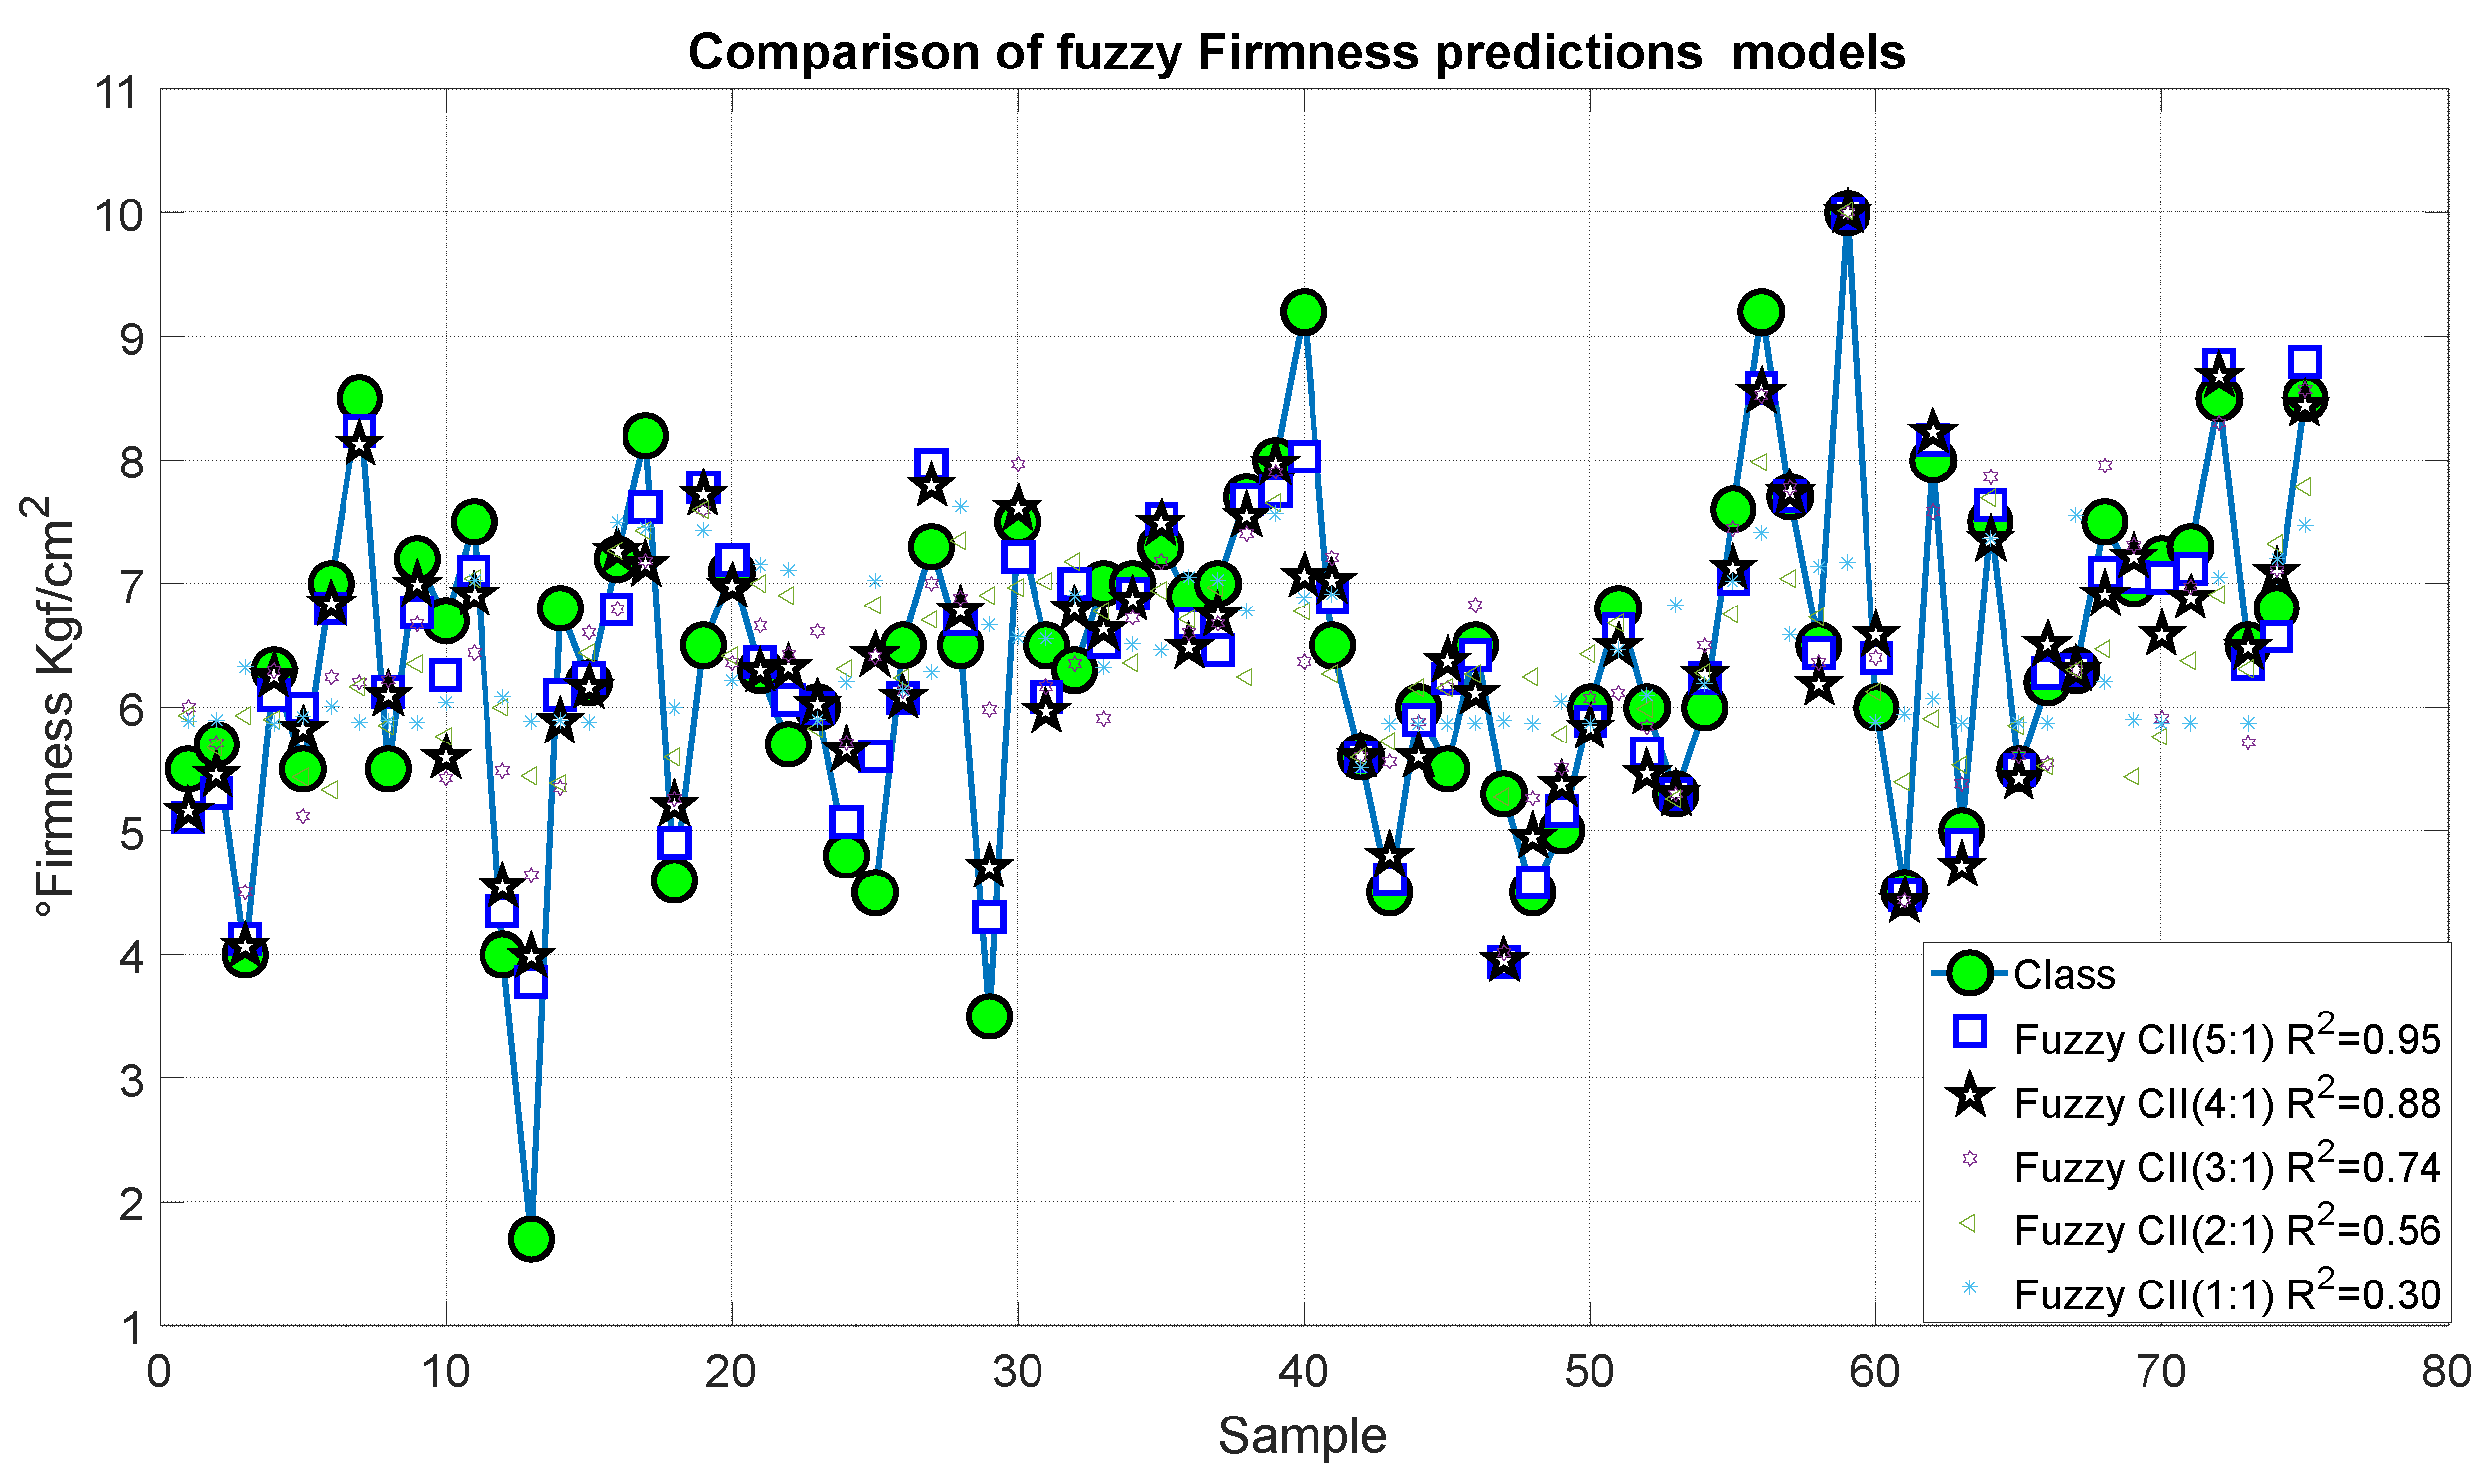
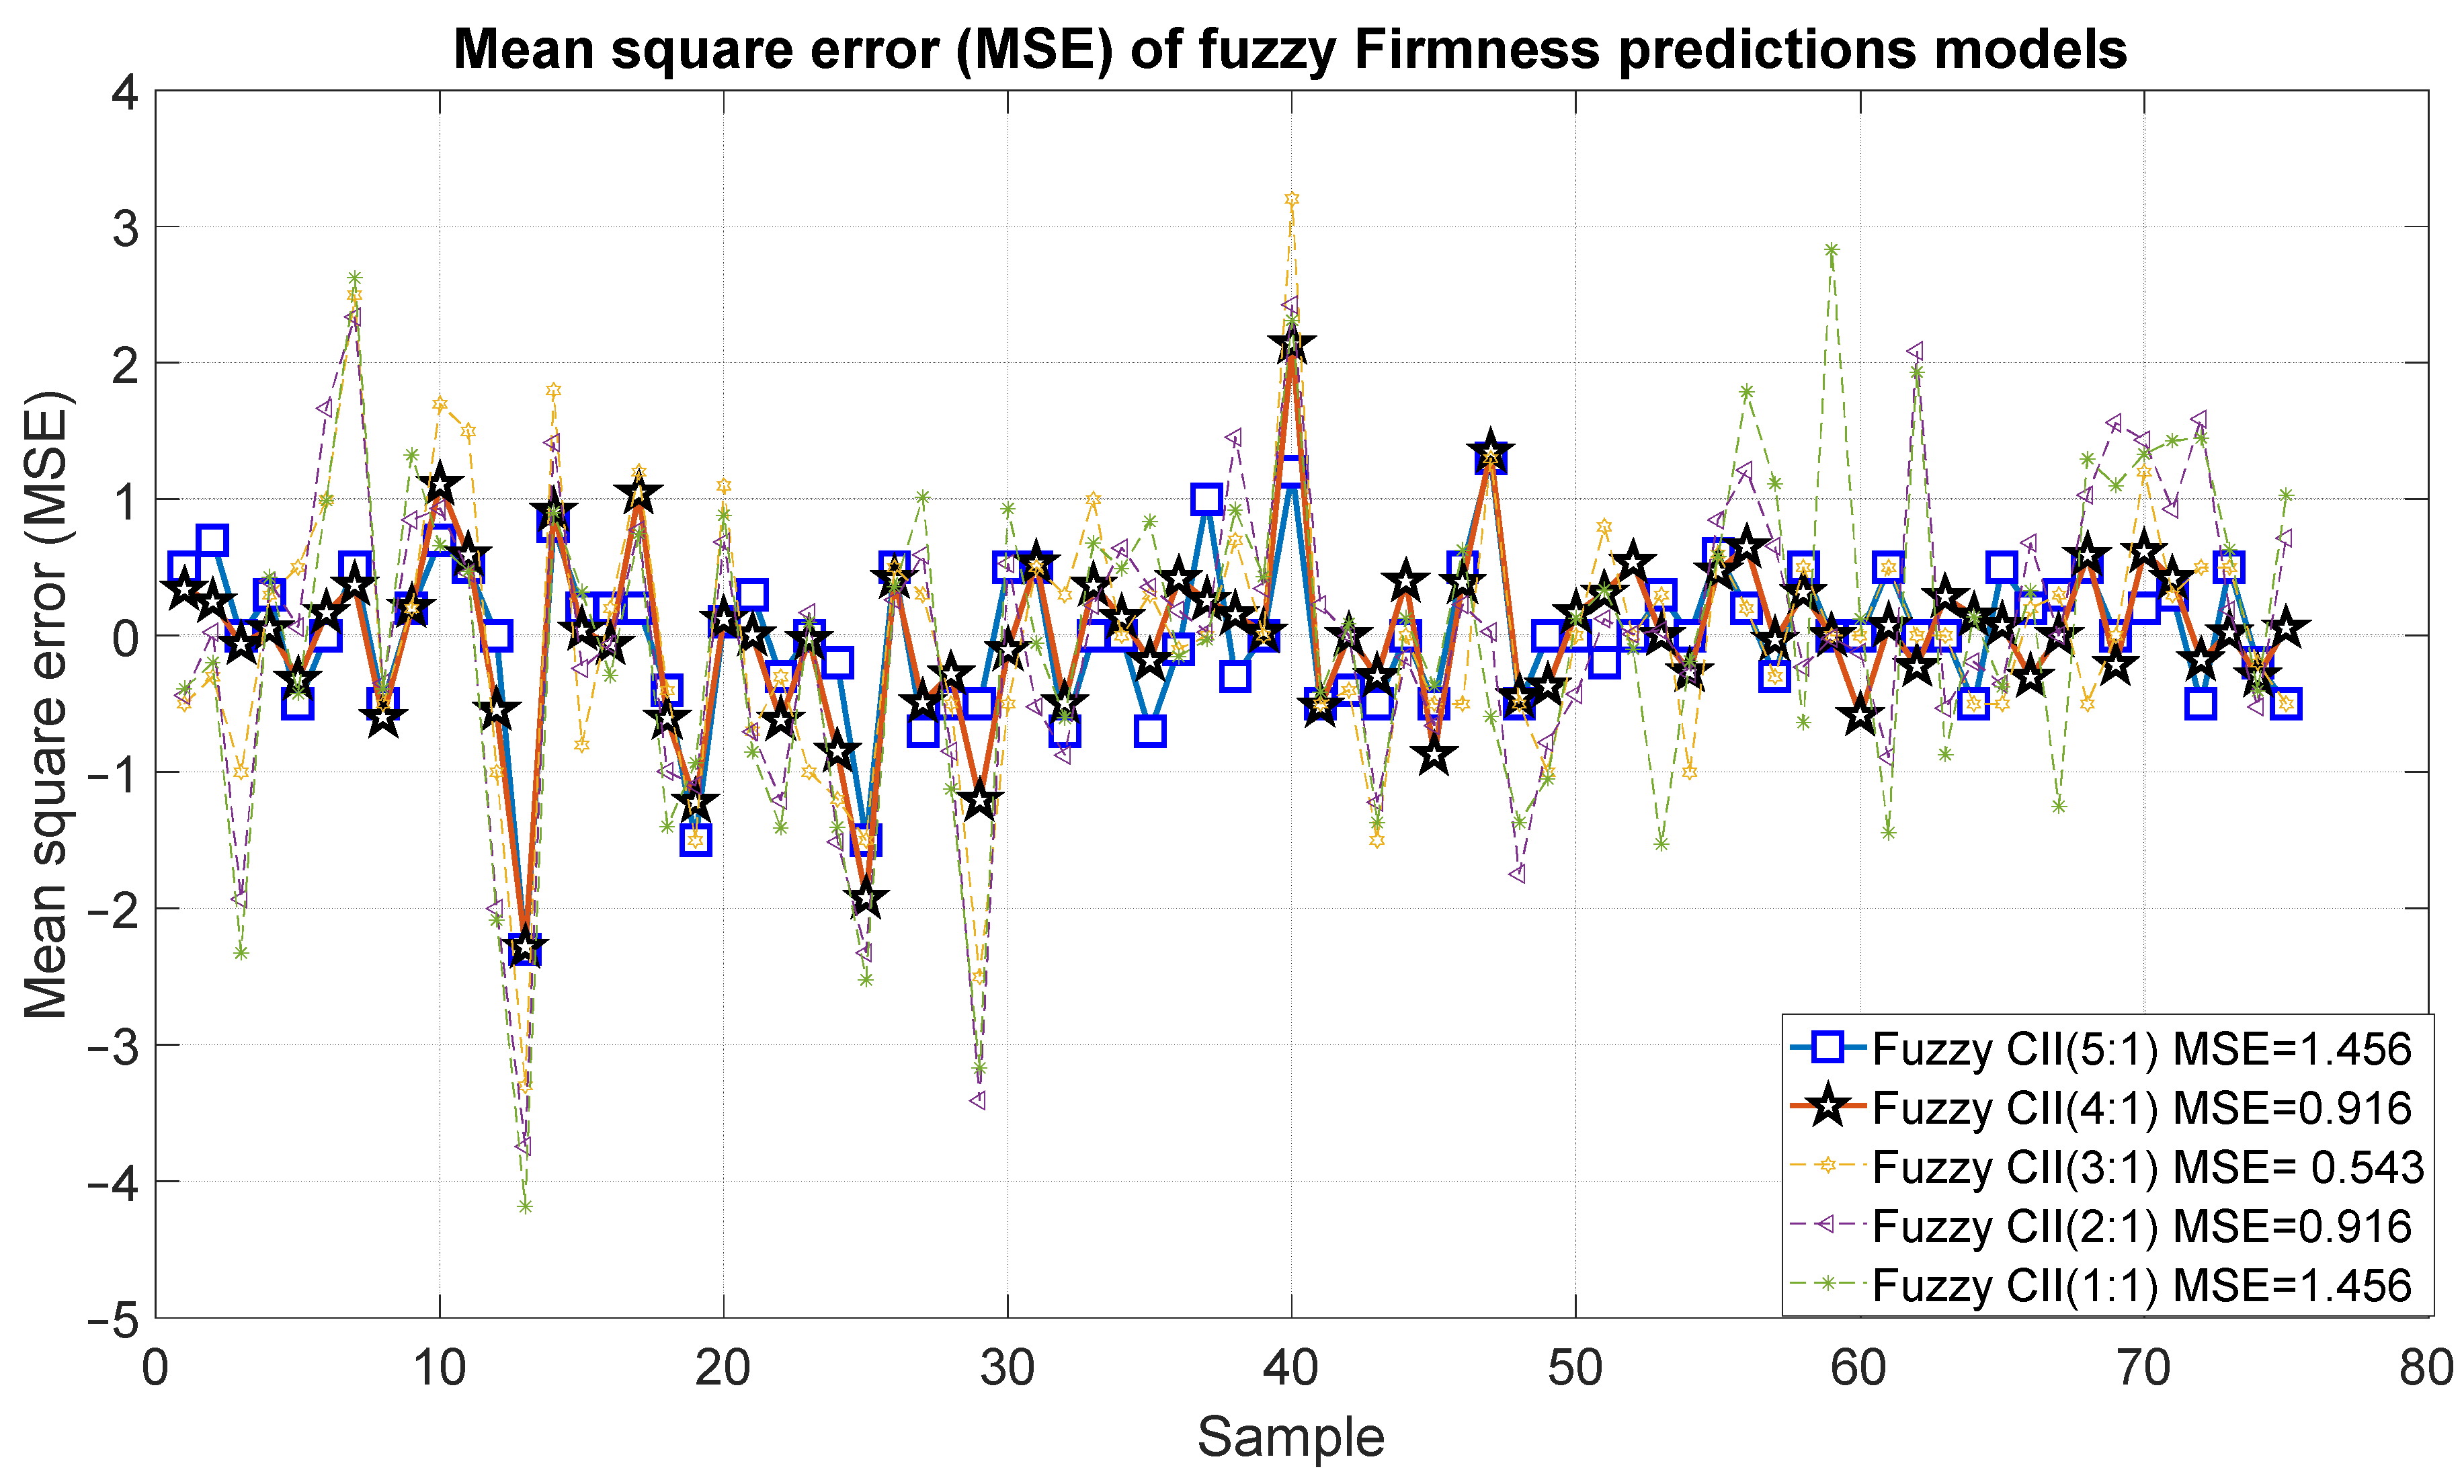
Figure 19 and Figure 20 present the outcomes of the proposed fuzzy firmness prediction models. It is noteworthy that the most significant statistical correction was 0.95, accompanied by an error of 1.456, which corresponds to Model 15. Similarly, Models 14 and 13 exhibited satisfactory correlations of 0.88 and 0.74, respectively, accompanied by relatively minor errors of 0.916 and 0.543, respectively. In the case of Models 11 and 12, the correlation was below 0.7 and the errors were 0.916 and 1.456, respectively.
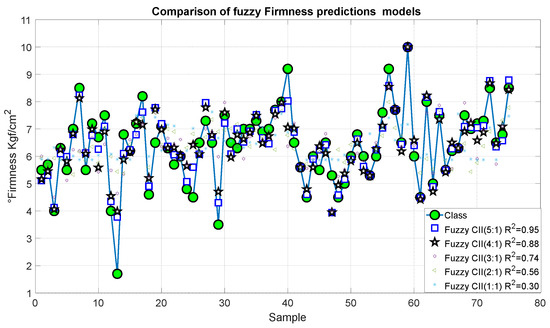
Figure 19.
Predictions of the fuzzy inference systems of firmness.
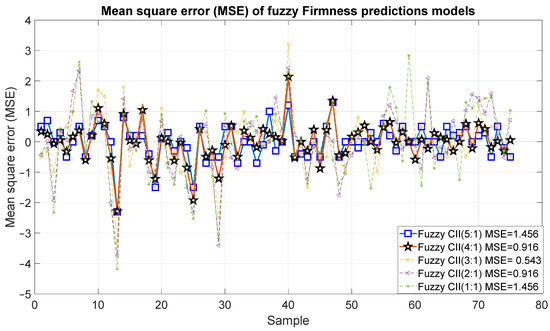
Figure 20.
Mean square error of the predictions of the fuzzy inference systems of firmness.
4. Discussion
This work makes a significant contribution by proposing the implementation of a vision system that determines maturity, firmness, and sugar content in a non-invasive manner. It should be noted that the computer vision (CV) system was calibrated using a refractometer, penetrometer, and the Citrus Color Index parameter. Table 9 shows several mathematical models proposed using fuzzy logic. From this, it can be seen that Models 5, 10, and 15 presented a statistical correlation value greater than or equal to 0.95, indicating a very strong correlation between the Citrus Color Index (CCI) and maturity, Brix degrees, and firmness. In comparison with the results proposed by [48,49], Maturity Classification Model 5 presented a better result than its proposal with fuzzy logic and slightly lower than the one proposed with neuronal. It is noteworthy that your proposal employs the pixels of the sample. In the context of Brix degree prediction, Model 10 yielded superior outcomes compared to the approach proposed by [31]. Among the methodologies that leverage spectral information, Model 10 identified a statistical correlation exceeding 0.9. Regarding firmness, the model proposed by [50] exhibited comparable results to Model 15, which utilized the weight loss and CCI variables.
Table 9.
Comparison of the different models.
5. Conclusions
This work proposes a novel classification system for evaluating the ripeness of oranges using computer vision. The proposed architecture enables the correlation of physicochemical changes in the orange, as evidenced by alterations in its epicarp color, sugar concentration, and firmness. This was reflected in the results of fuzzy models 5, 10, and 10, which used five values from the Citrus Color Index as descriptors with dimensions of 3 × 3, 5 × 5, 11 × 11, 21 × 21, and 31 × 31. For these models, a statistical correlation greater than 0.9 was achieved in determining the degree of maturity, Brix degrees, and firmness. This proposal has the advantage that it employs a low-cost camera and is a non-invasive method that can be implemented in real-time applications. In future works, it is planned to incorporate the analysis of other variables, including pH, acidity, ascorbic acid, and carotenoids.
Author Contributions
M.J.V.-A., J.A.P.-M. and A.I.B.-G.: methodology; M.C.-L.: validation; A.R.L.: formal analysis; H.R.-G.: investigation; J.A.P.-M.: writing—original draft preparation; M.C.-L. and M.J.V.-A.: writing—review and editing; A.I.B.-G. and M.J.V.-A.: supervision. All authors have read and agreed to the published version of the manuscript.
Funding
This research was funded by the government of the Guanajuato state through “IDEA GTO” under grant IDEAGTO/CONV/152/2023.
Institutional Review Board Statement
Not applicable.
Informed Consent Statement
Not applicable.
Data Availability Statement
Data supporting reported results can be found at https://drive.google.com/drive/folders/1fTN9VoPZcciL4-iZrT6RJO5F3--8Q5uu?usp=drive_link (accessed on 28 June 2024).
Acknowledgments
The authors greatly appreciate the support of Instituto de Innovación, Ciencia y Emprendimiento para la Competitividad para el Estado de Guanajuato “IDEA GTO”, TecNM, CONAHCyT, and PRODEP.
Conflicts of Interest
The authors declare no conflicts of interest.
Appendix A
Listed below are the inference rules and weights for each of the fuzzy systems, which you can consult at the following link: https://drive.google.com/file/d/1xpfRYI2tIjIHhHZss5LMV12X8VhAImax/view?usp=sharing (accessed on 28 June 2024).
References
- Available online: https://www.fao.org/faostat/en/#home (accessed on 4 March 2024).
- Teixeira, F.; dos Santos, B.A.; Nunes, G.; Soares, J.M.; Amaral, L.A.D.; de Souza, G.H.O.; de Resende, J.T.V.; Menegassi, B.; Rafacho, B.P.M.; Schwarz, K.; et al. Addition of Orange Peel in Orange Jam: Evaluation of Sensory, Physicochemical, and Nutritional Characteristics. Molecules 2020, 25, 1670. [Google Scholar] [CrossRef]
- Mak, K.K.; Tan, J.J.; Marappan, P.; Balijepalli, M.K.; Choudhury, H.; Ramamurthy, S.; Pichika, M.R. Galangin’s Potential as a Functional Food Ingredient. J. Funct. Foods 2018, 46, 490–503. [Google Scholar] [CrossRef]
- de Castro, L.A.; Lizi, J.M.; das Chagas, E.G.L.; de Carvalho, R.A.; Vanin, F.M. From Orange Juice By-Product in the Food Industry to a Functional Ingredient: Application in the Circular Economy. Foods 2020, 9, 593. [Google Scholar] [CrossRef] [PubMed]
- Mahajan, M.; Sadana, R. Citrus Based Food Products and Their Shelf Life. In vBook Recent Advances in Citrus Fruits, 1st ed.; Singh, S., Punia, S., Eds.; Recent Advances in Citrus Fruits; Springer: Cham, Switzerland; Berlin/Heidelberg, Germany, 2023; pp. 367–393. [Google Scholar]
- Mahajan, M.; Sadana, R.; Ayala, J.R.; Montero, G.; Coronado, M.A.; García, C.; Curiel-Alvarez, M.A.; León, J.A.; Sagaste, C.A.; Montes, D.G. Characterization of Orange Peel Waste and Valorization to Obtain Reducing Sugars. Molecules 2021, 26, 1348. [Google Scholar] [CrossRef]
- Escobedo-Avellaneda, Z.; Gutiérrez-Uribe, J.; Valdez-Fragoso, A.; Torres, J.A.; Welti-Chanes, J. Phytochemicals and antioxidant activity of juice, flavedo, albedo and comminuted orange. J. Funct. Foods 2014, 6, 470–481. [Google Scholar] [CrossRef]
- Chen, X.; Tait, A.R.; Kitts, D.D. Flavonoid composition of orange peel and its association with antioxidant and anti-inflammatory activities. Food Chem. 2017, 218, 15–21. [Google Scholar] [CrossRef] [PubMed]
- Kowalska, M.; Konopska, J.; Feszterová, M.; Zbikowska, A.; Kowalska, B. Quality Assessment of Natural Juices and Consumer Preferences in the Range of Citrus Fruit Juices. Appl. Sci. 2023, 13, 765. [Google Scholar] [CrossRef]
- Yang, C.; Chen, H.; Chen, H.; Zhong, B.; Luo, X.; Chun, J. Antioxidant and Anticancer Activities of Essential Oil from Gannan Navel Orange Peel. Molecule 2017, 22, 1391. [Google Scholar] [CrossRef]
- Al-Dairi, M.; Pathare, P.B.; Al-Mahdouri, A. Effect of storage conditions on postharvest quality of tomatoes: A case study at market-level. J. Agric. Marine Sci. 2021, 26, 13–20. [Google Scholar]
- Campbell, B.L.; Nelson, R.G.; Ebel, C.E.; Dozier, W.A.; Adrian, J.L.; Hockema, B.R. Fruit quality characteristics that affect consumer preferences for satsuma mandarins. HortScience 2004, 39, 1664–4669. [Google Scholar] [CrossRef]
- Barrett, D.M.; Beaulieu, J.C.; Shewfelt, R.; Barrett, D.M.; Beaulieu, J.C.; Color, R.S.; Barrett, D.M.; Beaulieu, J.C.; Shewfelt, R.O.B. Color, Flavor, Texture, and Nutritional Quality of Fresh-Cut Fruits and Vegetables: Desirable Levels, Instrumental and Sensory Measurement, and the Effects of Processing Nutritional Quality of Fresh-Cut Fruits and Vegetables: Desirable Levels, Instrumenta. Crit. Rev. Food Sci. Nutr. 2010, 50, 369–389. [Google Scholar] [CrossRef]
- Pathare, P.B.; Opara, U.L.; Al-Said, F.A. Colour measurement and analysis in fresh and processed foods: A review. Food Bioprocess Technol. 2013, 6, 36–60. [Google Scholar] [CrossRef]
- Fashi, M.; Naderloo, L.; Javadikia, H. The relationship between the appearance of pomegranate fruit and color and size of arils based on image processing. Postharvest Biol. Technol. 2019, 154, 52–57. [Google Scholar] [CrossRef]
- Castro, W.; Oblitas, J.; De-La-Torre, M.; Cotrina, C.; Bazán, K.; Avila-George, H. Classification of Cape Gooseberry Fruit According to its Level of Ripeness Using Machine Learning Techniques and Different Color Spaces. IEEE Access 2019, 7, 27389–27400. [Google Scholar] [CrossRef]
- Mariod, A.A. Effect of essential oils on organoleptic (smell, taste, and texture) properties of food. In Essential Oils in Food Preservation, Flavor and Safety, 1st ed.; Preedy, V.R., Ed.; Academic Press: London, UK, 2016; pp. 131–137. [Google Scholar]
- Choi, K.-O.; Hur, Y.Y.; Park, S.J.; Lee, D.H.; Kim, S.J.; Im, D. Relationships between Instrumental and Sensory Quality Indices of Shine Muscat Grapes with Different Harvesting Times. Foods 2022, 11, 2482. [Google Scholar] [CrossRef]
- Cui, J.; Zhao, C.; Feng, L.; Han, Y.; Du, H.; Xiao, H.; Zheng, J. Pectins from fruits: Relationships between extraction methods, structural characteristics, and functional properties. Trends Food Sci. Technol. 2021, 110, 39–54. [Google Scholar] [CrossRef]
- Saini, R.K.; Ranjit, A.; Sharma, K.; Prasad, P.; Shang, X.; Gowda, K.G.M.; Keum, Y.-S. Bioactive Compounds of Citrus Fruits: A Review of Composition and Health Benefits of Carotenoids, Flavonoids, Limonoids, and Terpenes. Antioxidants 2022, 11, 239. [Google Scholar] [CrossRef]
- Villaseñor-Aguilar, M.-J.; Padilla-Medina, J.-A.; Prado-Olivarez, J.; Botello-Álvarez, J.-E.; Bravo-Sánchez, M.-G.; Barranco-Gutiérrez, A.-I. Low-Cost Sensor for Lycopene Content Measurement in Tomato Based on Raspberry Pi 4. Plants 2023, 12, 2683. [Google Scholar] [CrossRef]
- Feng, L.; Xu, Y.; Xiao, Y.; Song, J.; Li, D.; Zhang, Z.; Liu, C.; Chunju, L.; Jiang, N.; Zhang, M.; et al. Effects of pre-drying treatments combined with explosion puffing drying on the physicochemical properties, antioxidant activities and flavor characteristics of apples. Food Chem. 2021, 338, 128015. [Google Scholar] [CrossRef]
- Harker, F.R.; Gunson, F.A.; Jaeger, S.R. The case for fruit quality: An interpretive review of consumer attitudes, and preferences for apples. Postharvest Biol. Technol. 2003, 28, 333–347. [Google Scholar] [CrossRef]
- Ali, M.M.; Anwar, R.; Yousef, A.F.; Li, B.; Luvisi, A.; De Bellis, L.; Aprile, A.; Chen, F. Influence of Bagging on the Development and Quality of Fruits. Plants 2021, 10, 358. [Google Scholar] [CrossRef]
- Jaywant, S.A.; Singh, H.; Arif, K.M. Sensors and Instruments for Brix Measurement: A Review. Sensors 2022, 22, 2290. [Google Scholar] [CrossRef]
- Pupin, A.M.; Dennis, M.J.; Toledo, M.C.F. HPLC analysis of carotenoids in orange juice. Food Chem. 1999, 64, 269–275. [Google Scholar] [CrossRef]
- Omoba, O.S.; Obafaye, R.O.; Salawu, S.O.; Boligon, A.A.; Athayde, M.L. HPLC-DAD Phenolic Characterization and Antioxidant Activities of Ripe and Unripe Sweet Orange Peels. Antioxidants 2015, 4, 498–512. [Google Scholar] [CrossRef]
- Sabzi, S.; Javadikia, H.; Arribas, J.I. A three-variety automatic and non-intrusive computer vision system for the estimation of orange fruit pH value. Measurement 2020, 152, 107298. [Google Scholar] [CrossRef]
- Padda, M.S.; do Amarante, C.V.; Garcia, R.M.; Slaughter, D.C.; Mitcham, E.J. Methods to analyze physico-chemical changes during mango ripening: A multivariate approach. Postharvest Biol. Technol. 2011, 62, 267–274. [Google Scholar] [CrossRef]
- Wagare, D.S.; Shirsath, S.E.; Shaikh, M.; Netankar, P. Sustainable solvents in chemical synthesis: A review. Environ. Chem. Lett. 2021, 19, 3263–3282. [Google Scholar] [CrossRef]
- Wu, C.; Xiao, H.J.; Wang, S.W.; Tang, M.S.; Tang, Z.L.; Xia, W.; Li, W.F.; Cao, Z.; He, W.M. Natural deep eutectic solvent-catalyzed selenocyanation of activated alkynes via an intermolecular H-bonding activation process. ACS Sustain. Chem. Eng. 2019, 7, 2169–2175. [Google Scholar] [CrossRef]
- Villaseñor-Aguilar, M.J.; Botello-Álvarez, J.E.; Pérez-Pinal, F.J.; Cano-Lara, M.; León-Galván, M.F.; Bravo-Sánchez, M.G.; Barranco-Gutierrez, A.I. Fuzzy classification of the maturity of the tomato using a vision system. J. Sens. 2019, 2019, 3175848. [Google Scholar] [CrossRef]
- Constante, P.; Gordon, A.; Chang, O.; Pruna, E.; Acuna, F.; Escobar, I. Artificial Vision Techniques to Optimize Strawberrys Industrial Classification. IEEE Lat. Am. Trans. 2016, 14, 2576–2581. [Google Scholar] [CrossRef]
- Villaseñor-Aguilar, M.-J.; Bravo-Sánchez, M.-G.; Padilla-Medina, J.-A.; Vázquez-Vera, J.L.; Guevara-González, R.-G.; García-Rodríguez, F.-J.; Barranco-Gutiérrez, A.-I. A Maturity Estimation of Bell Pepper (Capsicum annuum L.) by Artificial Vision System for Quality Control. Appl. Sci. 2020, 10, 5097. [Google Scholar] [CrossRef]
- Al-Sammarraie, M.A.J.; Gierz, Ł.; Przybył, K.; Koszela, K.; Szychta, M.; Brzykcy, J.; Baranowska, H.M. Predicting Fruit’s Sweetness Using Artificial Intelligence—Case Study: Orange. Appl. Sci. 2022, 12, 8233. [Google Scholar] [CrossRef]
- Muhammad Zahir, S.A.; Yahaya, O.K.; Omar, A.F. Correlating the natural color of tropical fruit juice with its pH. Color Res. Appl. 2021, 46, 467–476. [Google Scholar] [CrossRef]
- Wu, D.; Sun, D.W. Colour measurements by computer vision for food quality control—A review. Trends Food Sci. Technol. 2013, 29, 5–20. [Google Scholar] [CrossRef]
- Tarancón, P.; Cebrián, B.; Fernández-Serrano, P.; Besada, C. Relation between Rind Pigmentation and Internal Quality of Blood Orange ‘Sanguinelli’: Physicochemical and Sensory Studies. Horticulturae 2022, 8, 448. [Google Scholar] [CrossRef]
- Habibi, F.; Guillén, F.; Serrano, M.; Valero, D. Physicochemical Changes, Peel Colour, and Juice Attributes of Blood Orange Cultivars Stored at Different Temperatures. Horticulturae 2021, 7, 320. [Google Scholar] [CrossRef]
- Dongare, M.; Buchade, P.; Shaligram, A. Refractive index based optical Brix measurement technique with equilateral angle prism for sugar and Allied Industries. Optik 2015, 126, 2383–2385. [Google Scholar] [CrossRef]
- Ugwu, K.; Mbajiorgu, C.; Okonkwo, W.; Ani, A. Design, fabrication and performance evaluation of a portable hand-held refractometer.Niger. J. Technol. 2018, 37, 537–542. [Google Scholar]
- Altemimi, A.B.; Al-Hilphy, A.R.S.; Abedelmaksoud, T.G.; Aboud, S.A.; Badwaik, L.S.; G, L.; Noore, S.; Pratap-Singh, A. Infrared Radiation Favorably Influences the Quality Characteristics of Key Lime Juice. Appl. Sci. 2021, 11, 2842. [Google Scholar] [CrossRef]
- Rungpichayapichet, P.; Nagle, M.; Yuwanbun, P.; Khuwijitjaru, P.; Mahayothee, B.; Müller, J. Prediction mapping of physicochemical properties in mango by hyperspectral imaging. Biosyst. Eng. 2017, 159, 109–120. [Google Scholar] [CrossRef]
- Cevher, E.Y.; Yıldırım, D. Using Artificial Neural Network Application in Modeling the Mechanical Properties of Loading Position and Storage Duration of Pear Fruit. Processes 2022, 10, 2245. [Google Scholar] [CrossRef]
- Domingues, A.R.; Marcolini, C.D.M.; Gonçalves, C.H.d.S.; Gonçalves, L.S.A.; Roberto, S.R.; Carlos, E.F. Fruit Ripening Development of Valencia Orange Trees Grafted on Different ‘Trifoliata’ Hybrid Rootstocks. Horticulturae 2021, 7, 3. [Google Scholar] [CrossRef]
- Wan, P.; Toudeshki, A.; Tan, H.; Ehsani, R. A methodology for fresh tomato maturity detection using computer vision. Comput. Electron. Agric. 2018, 146, 43–50. [Google Scholar] [CrossRef]
- Konar, A. Computational Intelligence: Principles, Techniques and Applications; Springer: Berlin/Heidelberg, Germany, 2005; ISBN 3-540-20898-4. [Google Scholar]
- Zadeh, L.A. Fuzzy sets. Inf. Control 1965, 8, 338–353. [Google Scholar] [CrossRef]
- Li, P.; Li, S.; Du, G.; Jiang, L.; Liu, X.; Ding, S.; Shan, Y. A simple and nondestructive approach for the analysis of soluble solid content in citrus by using portable visible to near-infrared spectroscopy. Food Sci. Nutr. 2020, 8, 2543–2552. [Google Scholar] [CrossRef] [PubMed]
- Li, Y.; Jin, G.; Jiang, X.; Yi, S.; Tian, X. Non-destructive determination of soluble solids content using a multi-region combination model in hybrid citrus. Infrared Phys. Technol. 2020, 104, 103138. [Google Scholar] [CrossRef]
- Olmo, M.; Nadas, A.; García, J.M. Nondestructive Methods to Evaluate Maturity Level of Oranges. Sens. Nutr. Qual. Food Nondestruct. 2000, 65, 365–369. [Google Scholar] [CrossRef]


Disclaimer/Publisher’s Note: The statements, opinions and data contained in all publications are solely those of the individual author(s) and contributor(s) and not of MDPI and/or the editor(s). MDPI and/or the editor(s) disclaim responsibility for any injury to people or property resulting from any ideas, methods, instructions or products referred to in the content. |
© 2024 by the authors. Licensee MDPI, Basel, Switzerland. This article is an open access article distributed under the terms and conditions of the Creative Commons Attribution (CC BY) license (https://creativecommons.org/licenses/by/4.0/).