
State-of-the-Art Research on Loess Microstructure Based on X-ray Computer Tomography


Abstract
1. Introduction
2. The Development History of CT Technology
2.1. The Origin of X-ray CT
2.2. The Detection Principle of CT Technology
2.3. Development of CT Equipment
2.4. Development of CT Technology
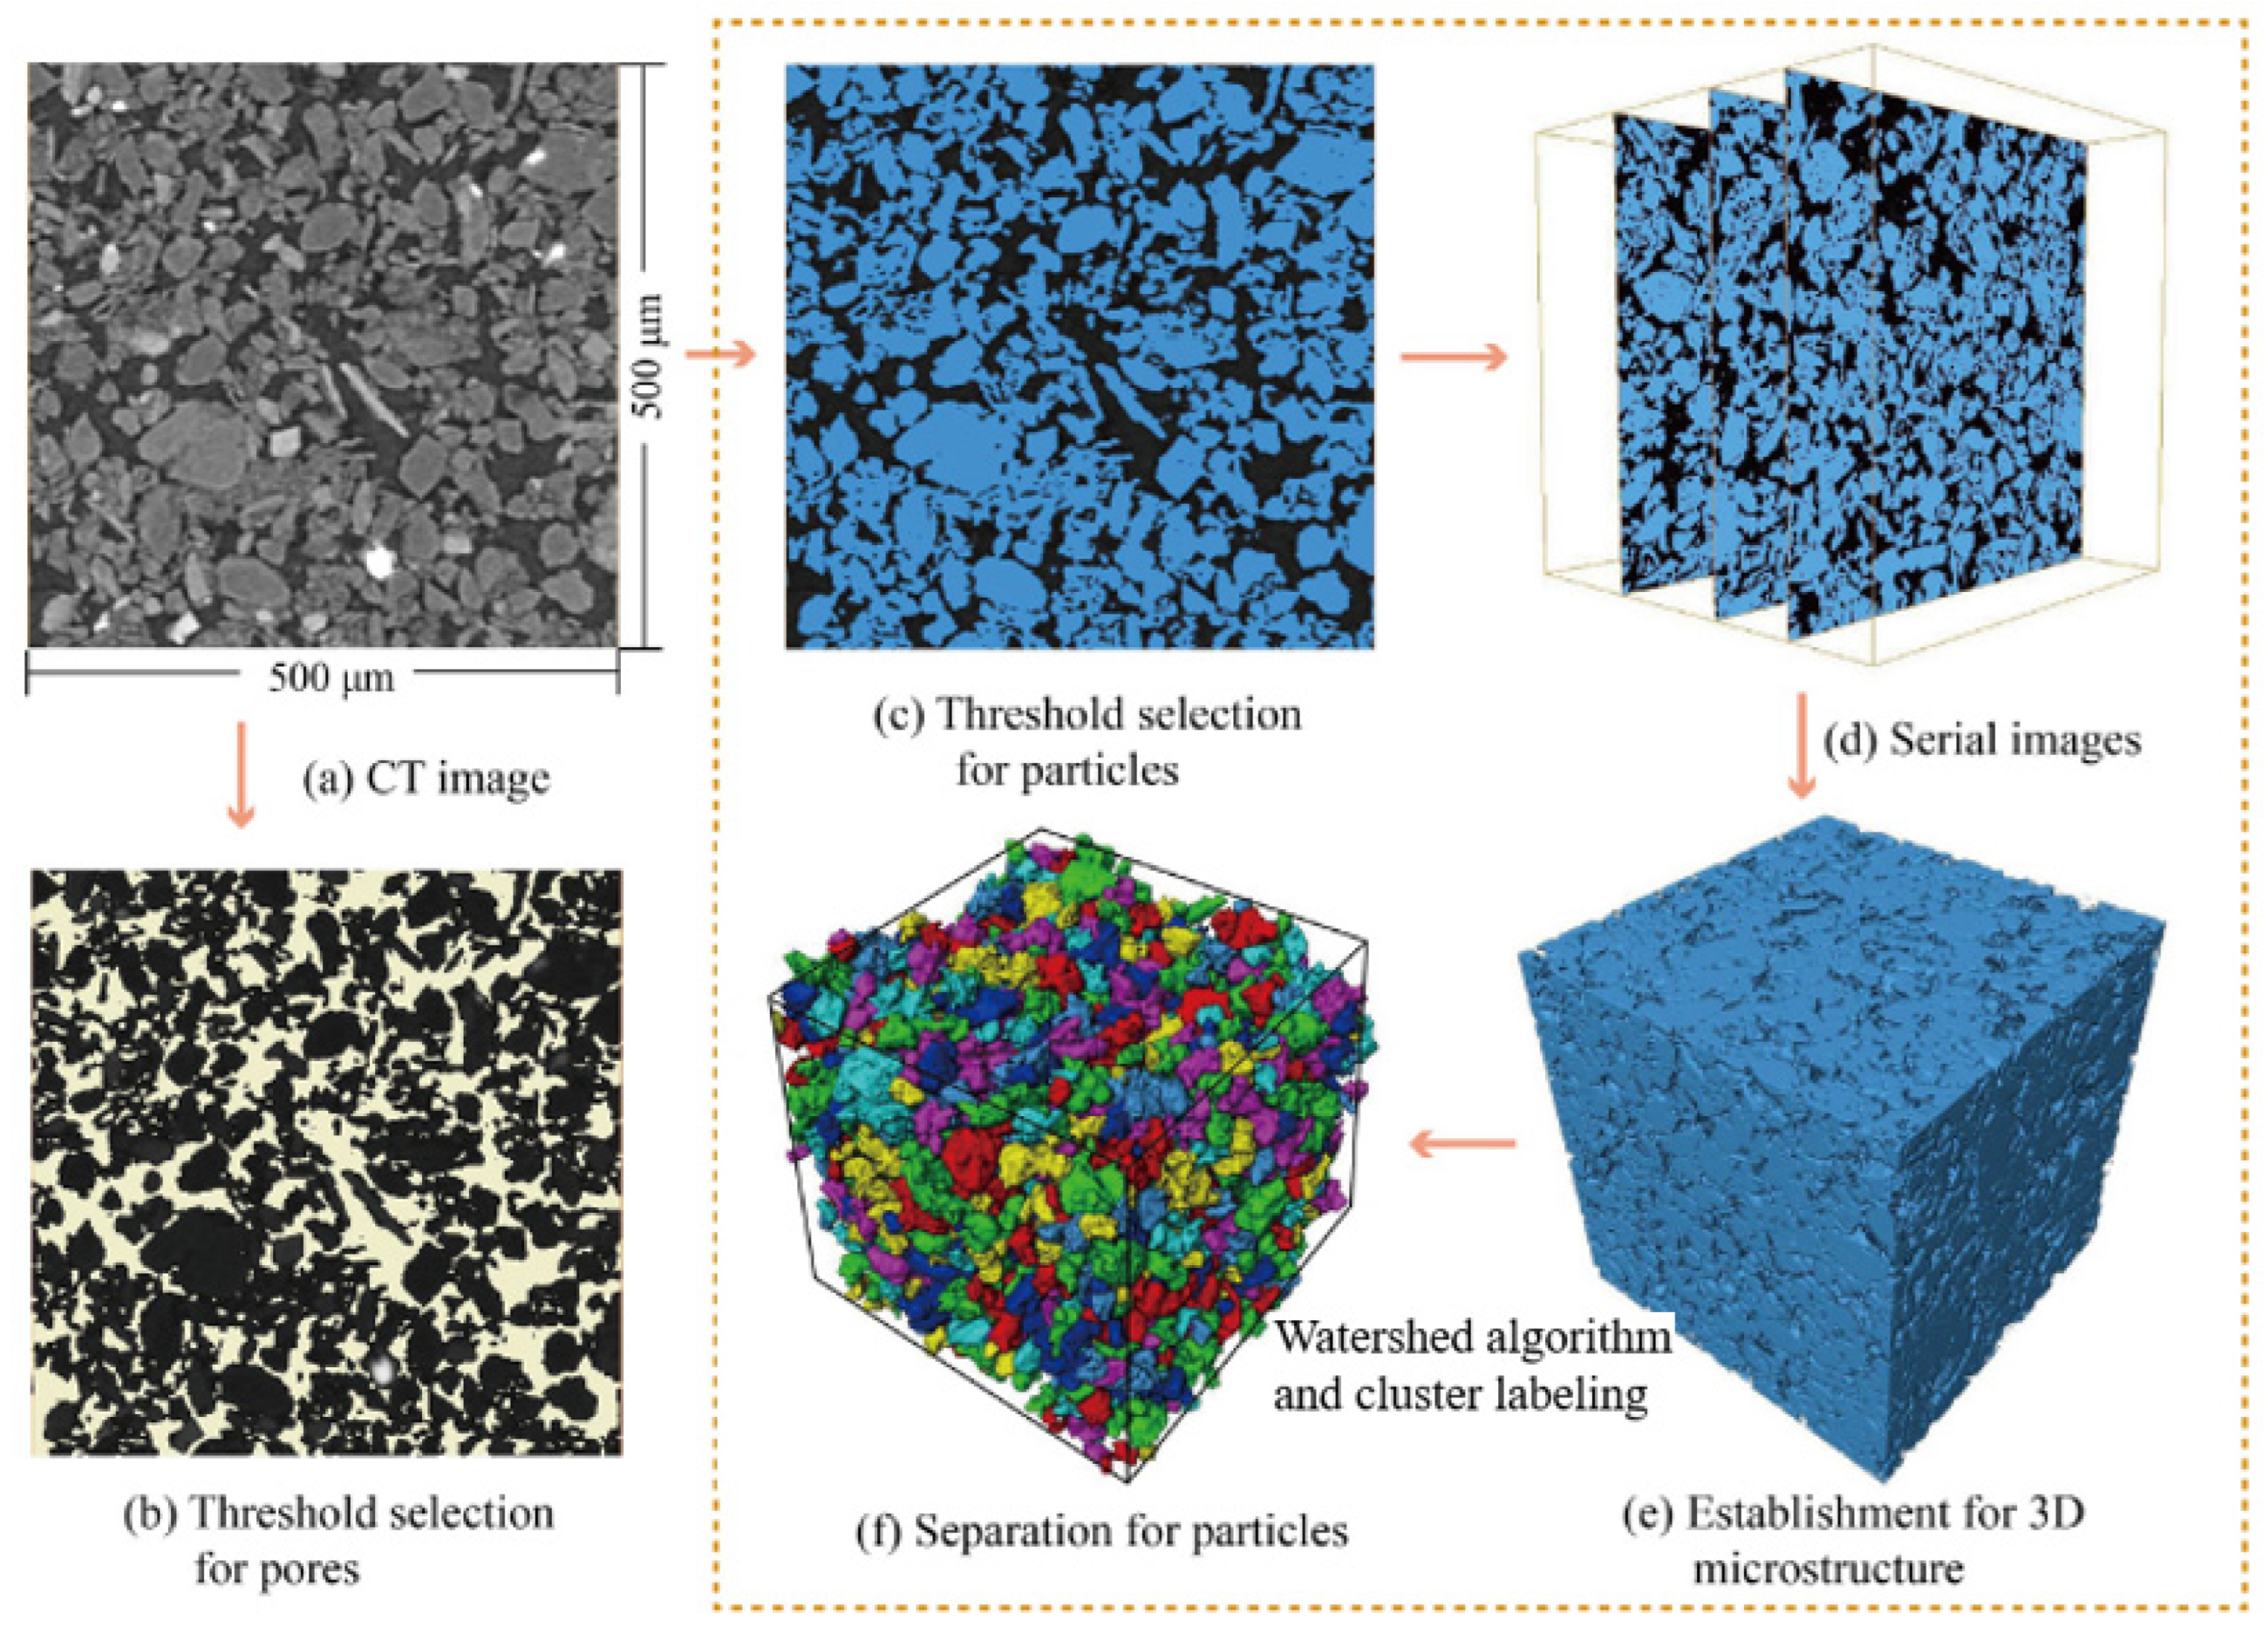
2.5. CT Image Processing and Analysis
3. Bibliometric Analysis
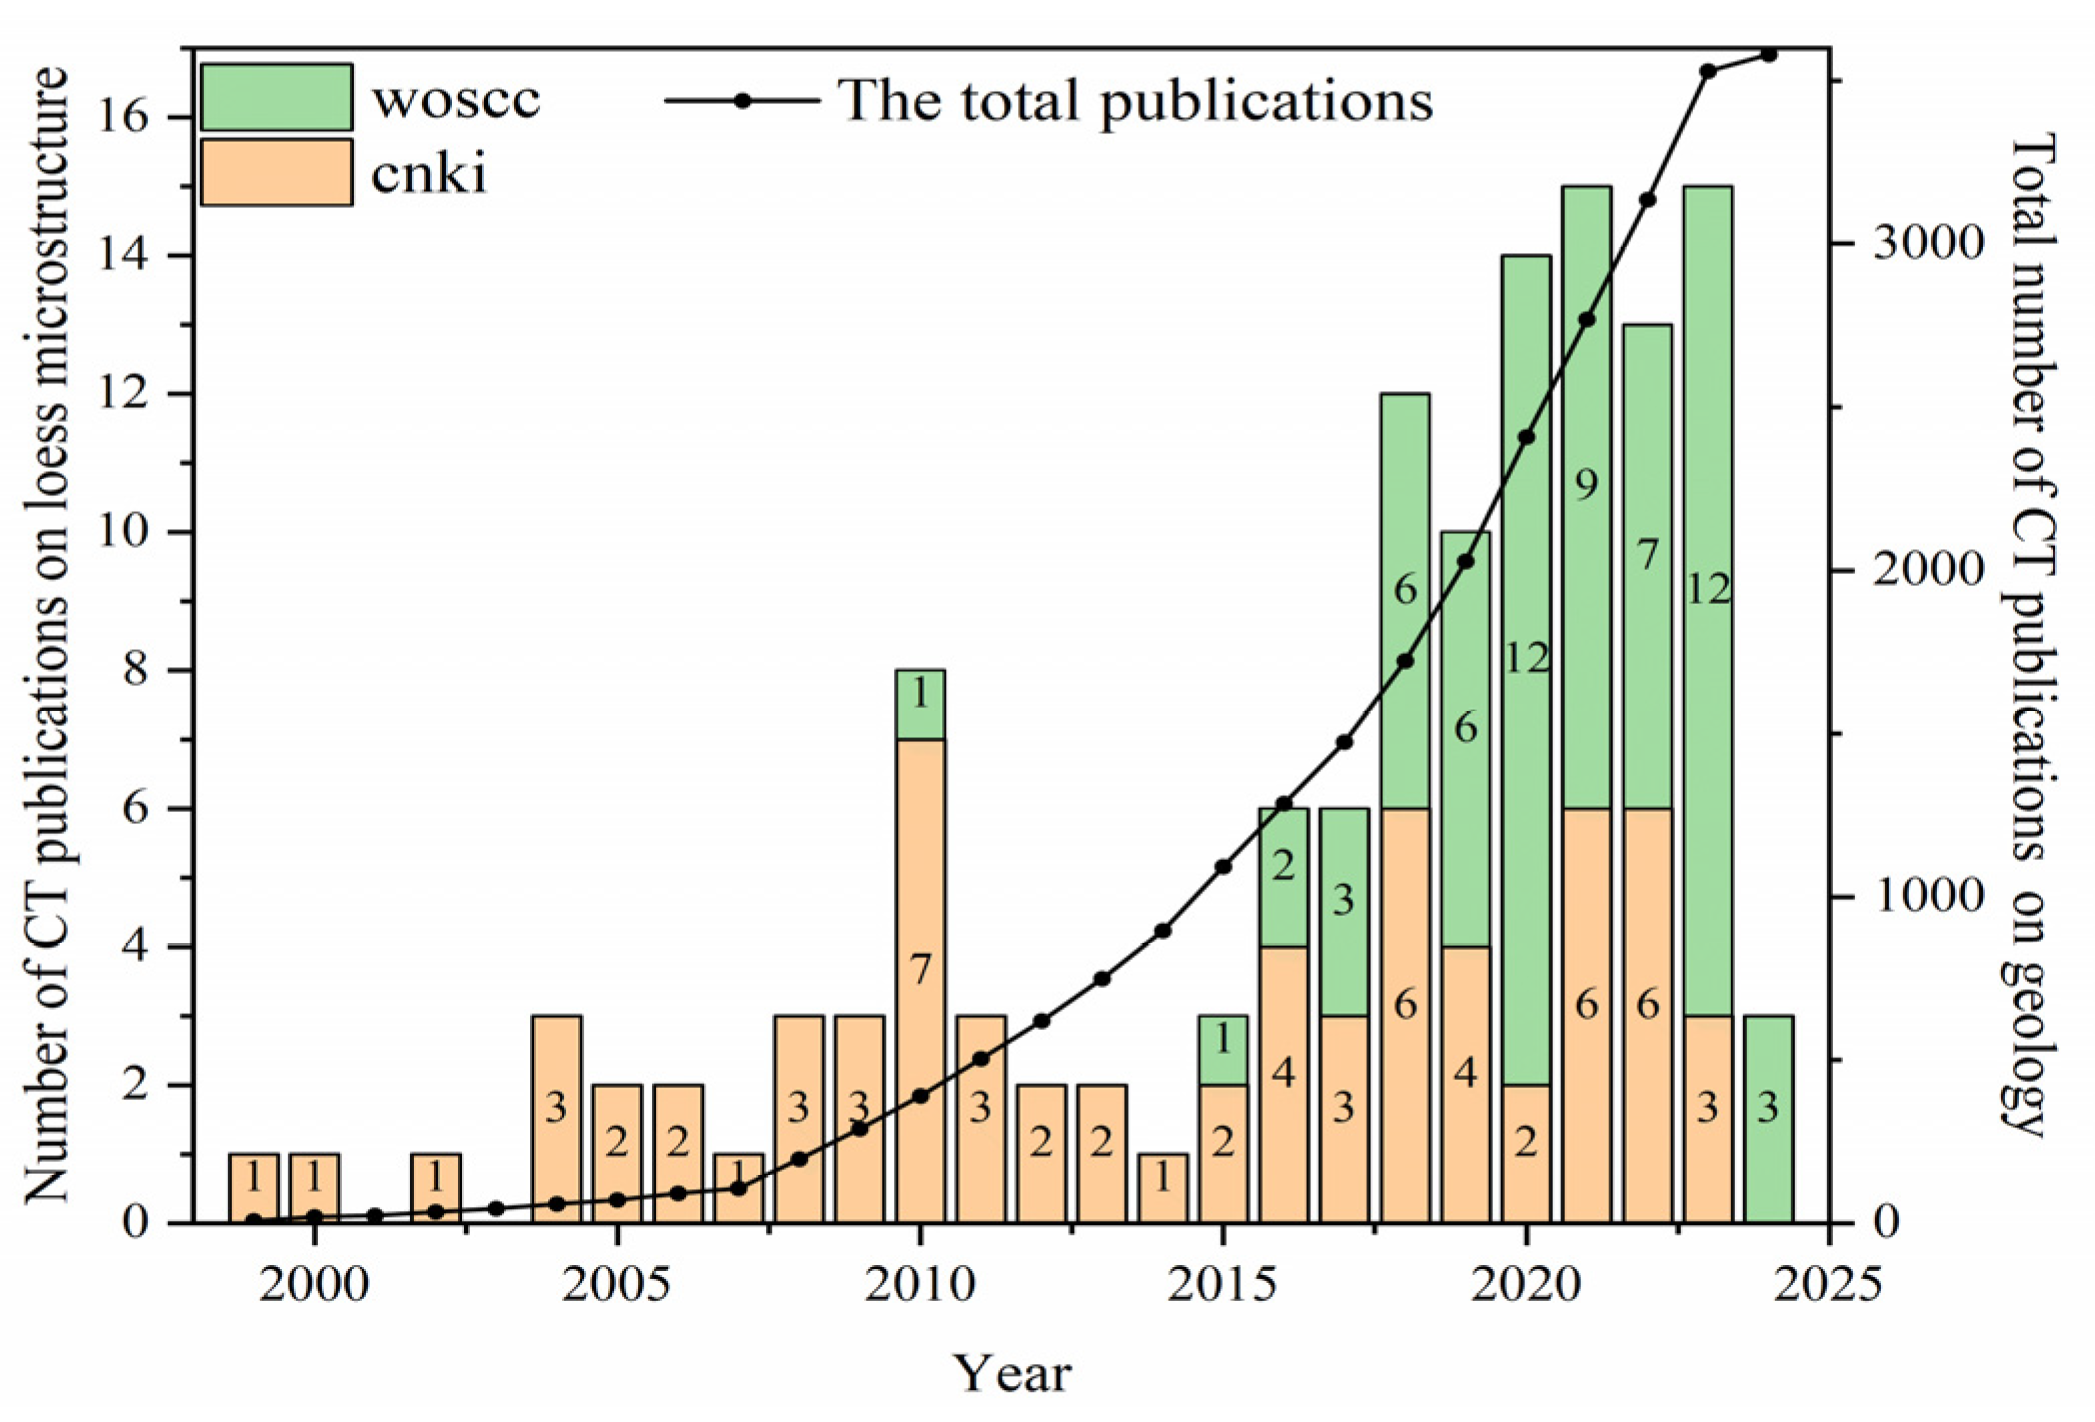
3.1. Trends of Annual Publication
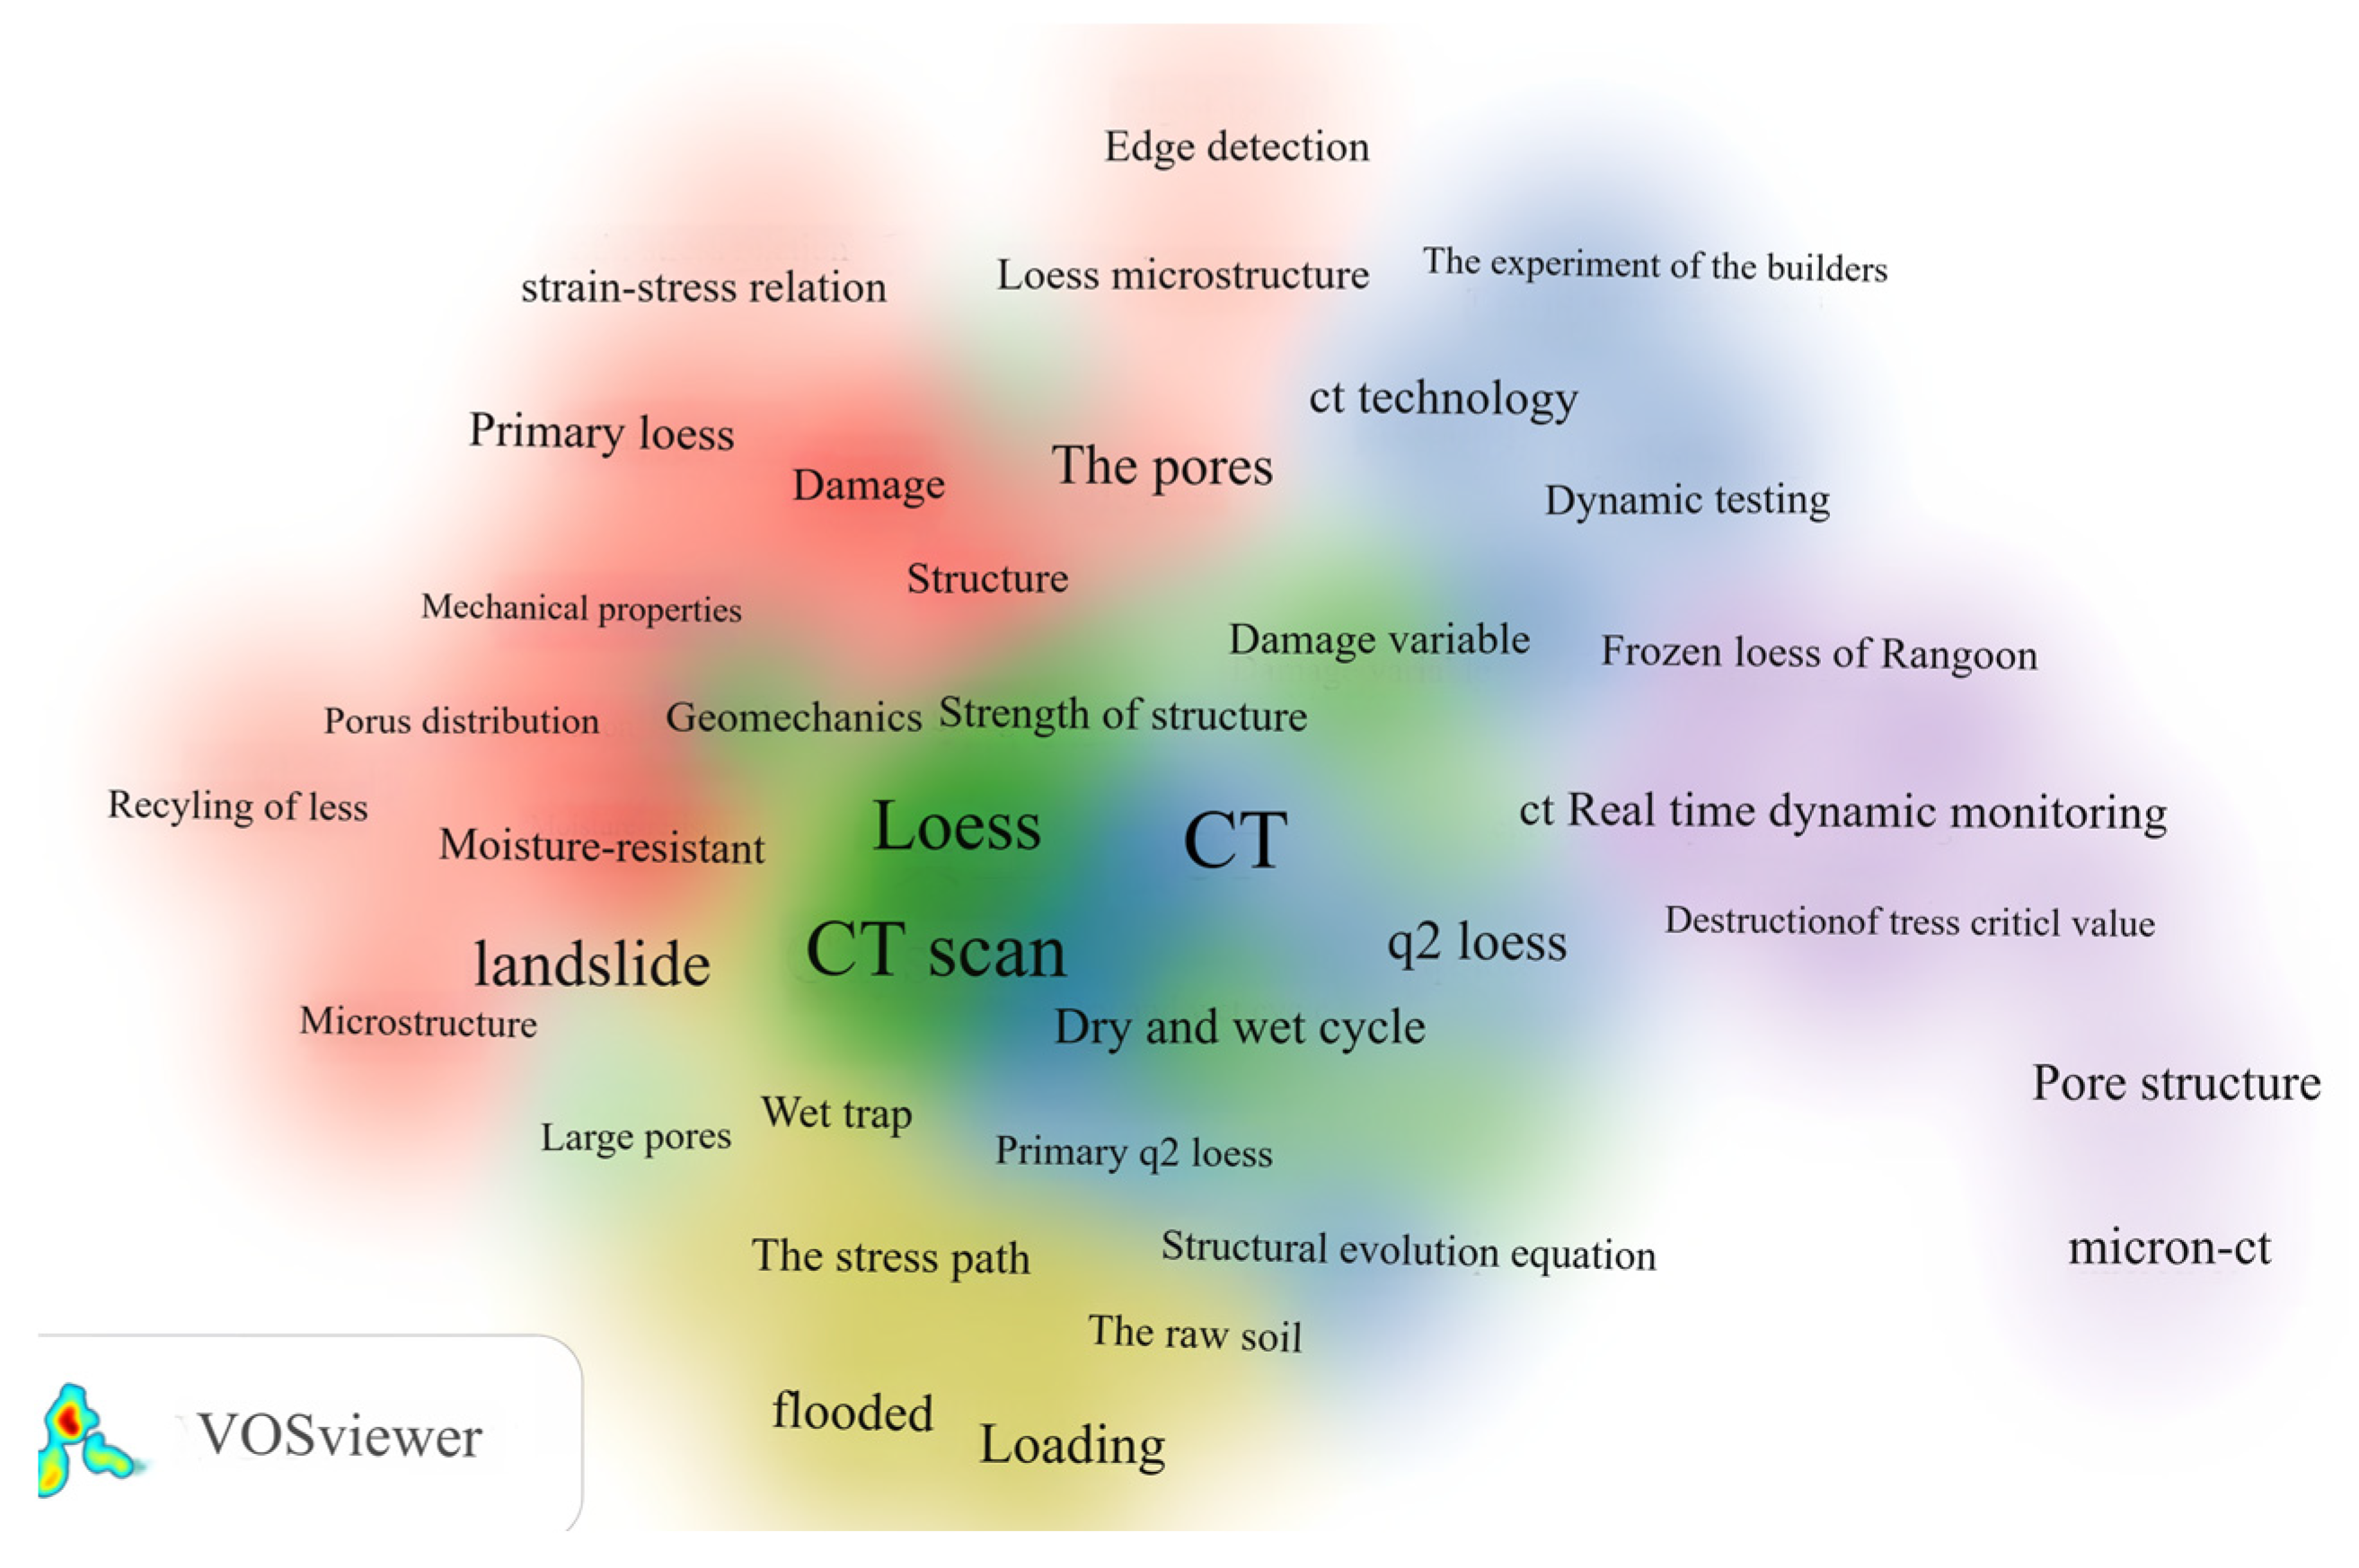
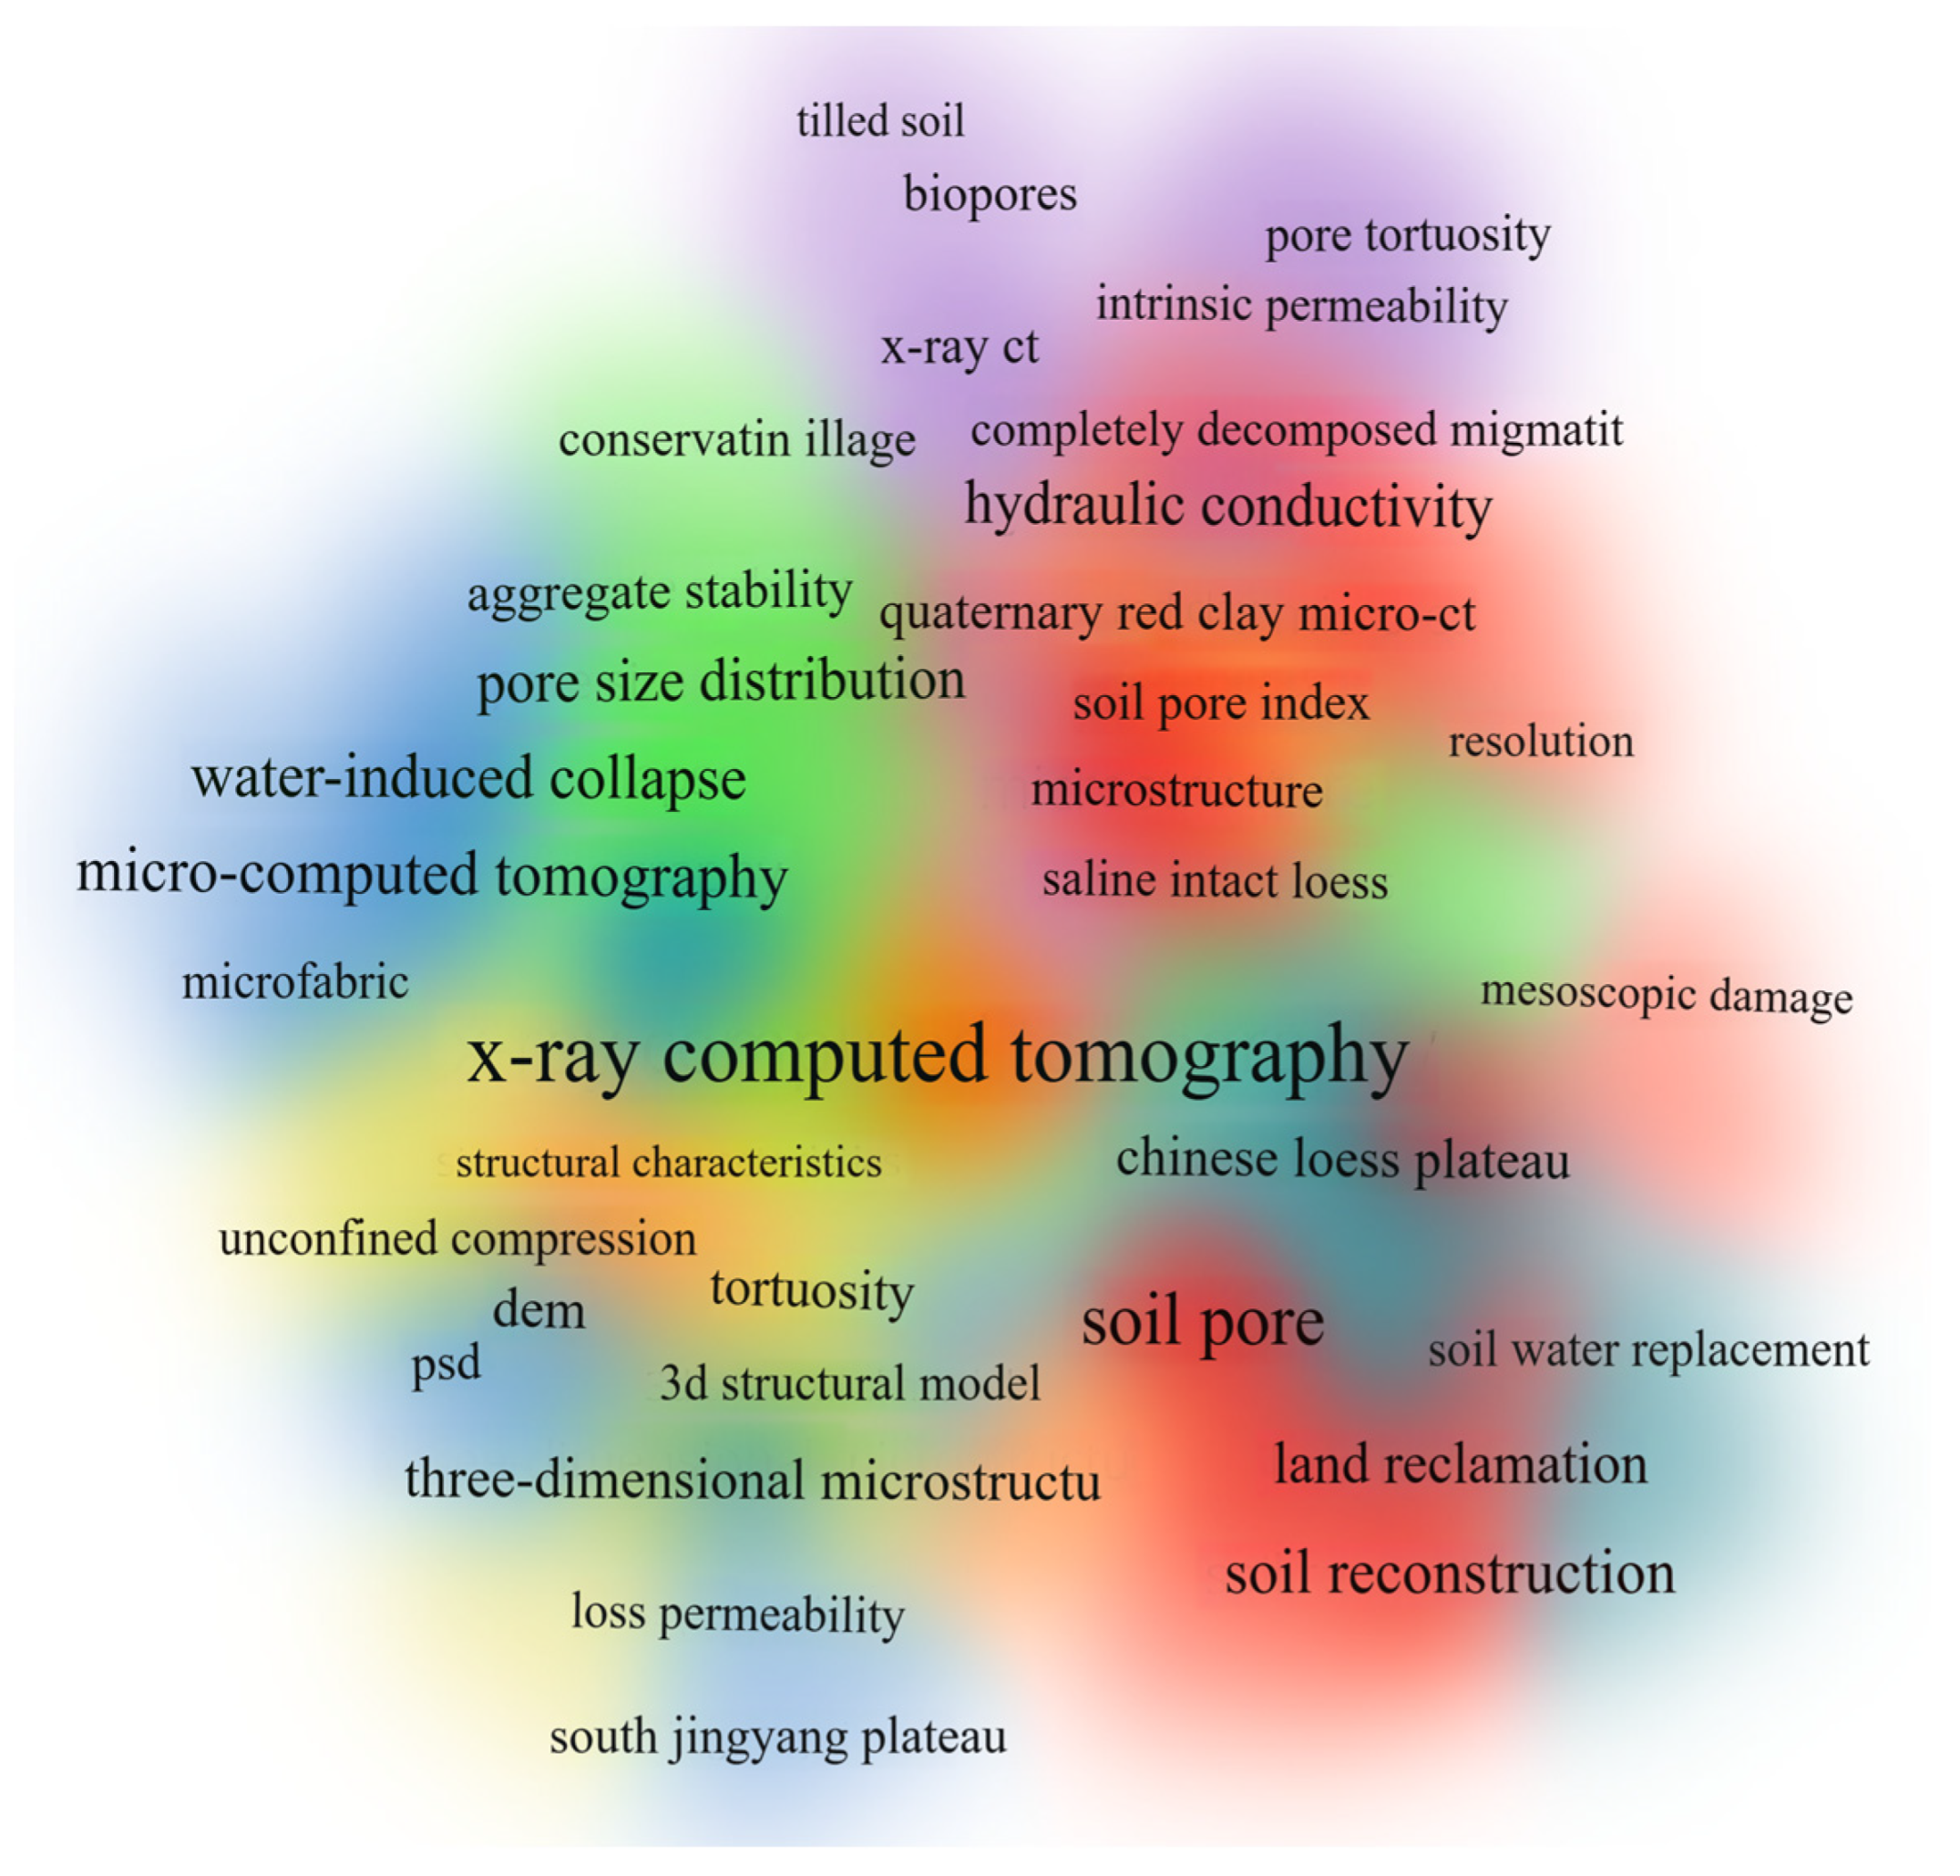
3.2. Co-Occurrence Analysis of Keyword
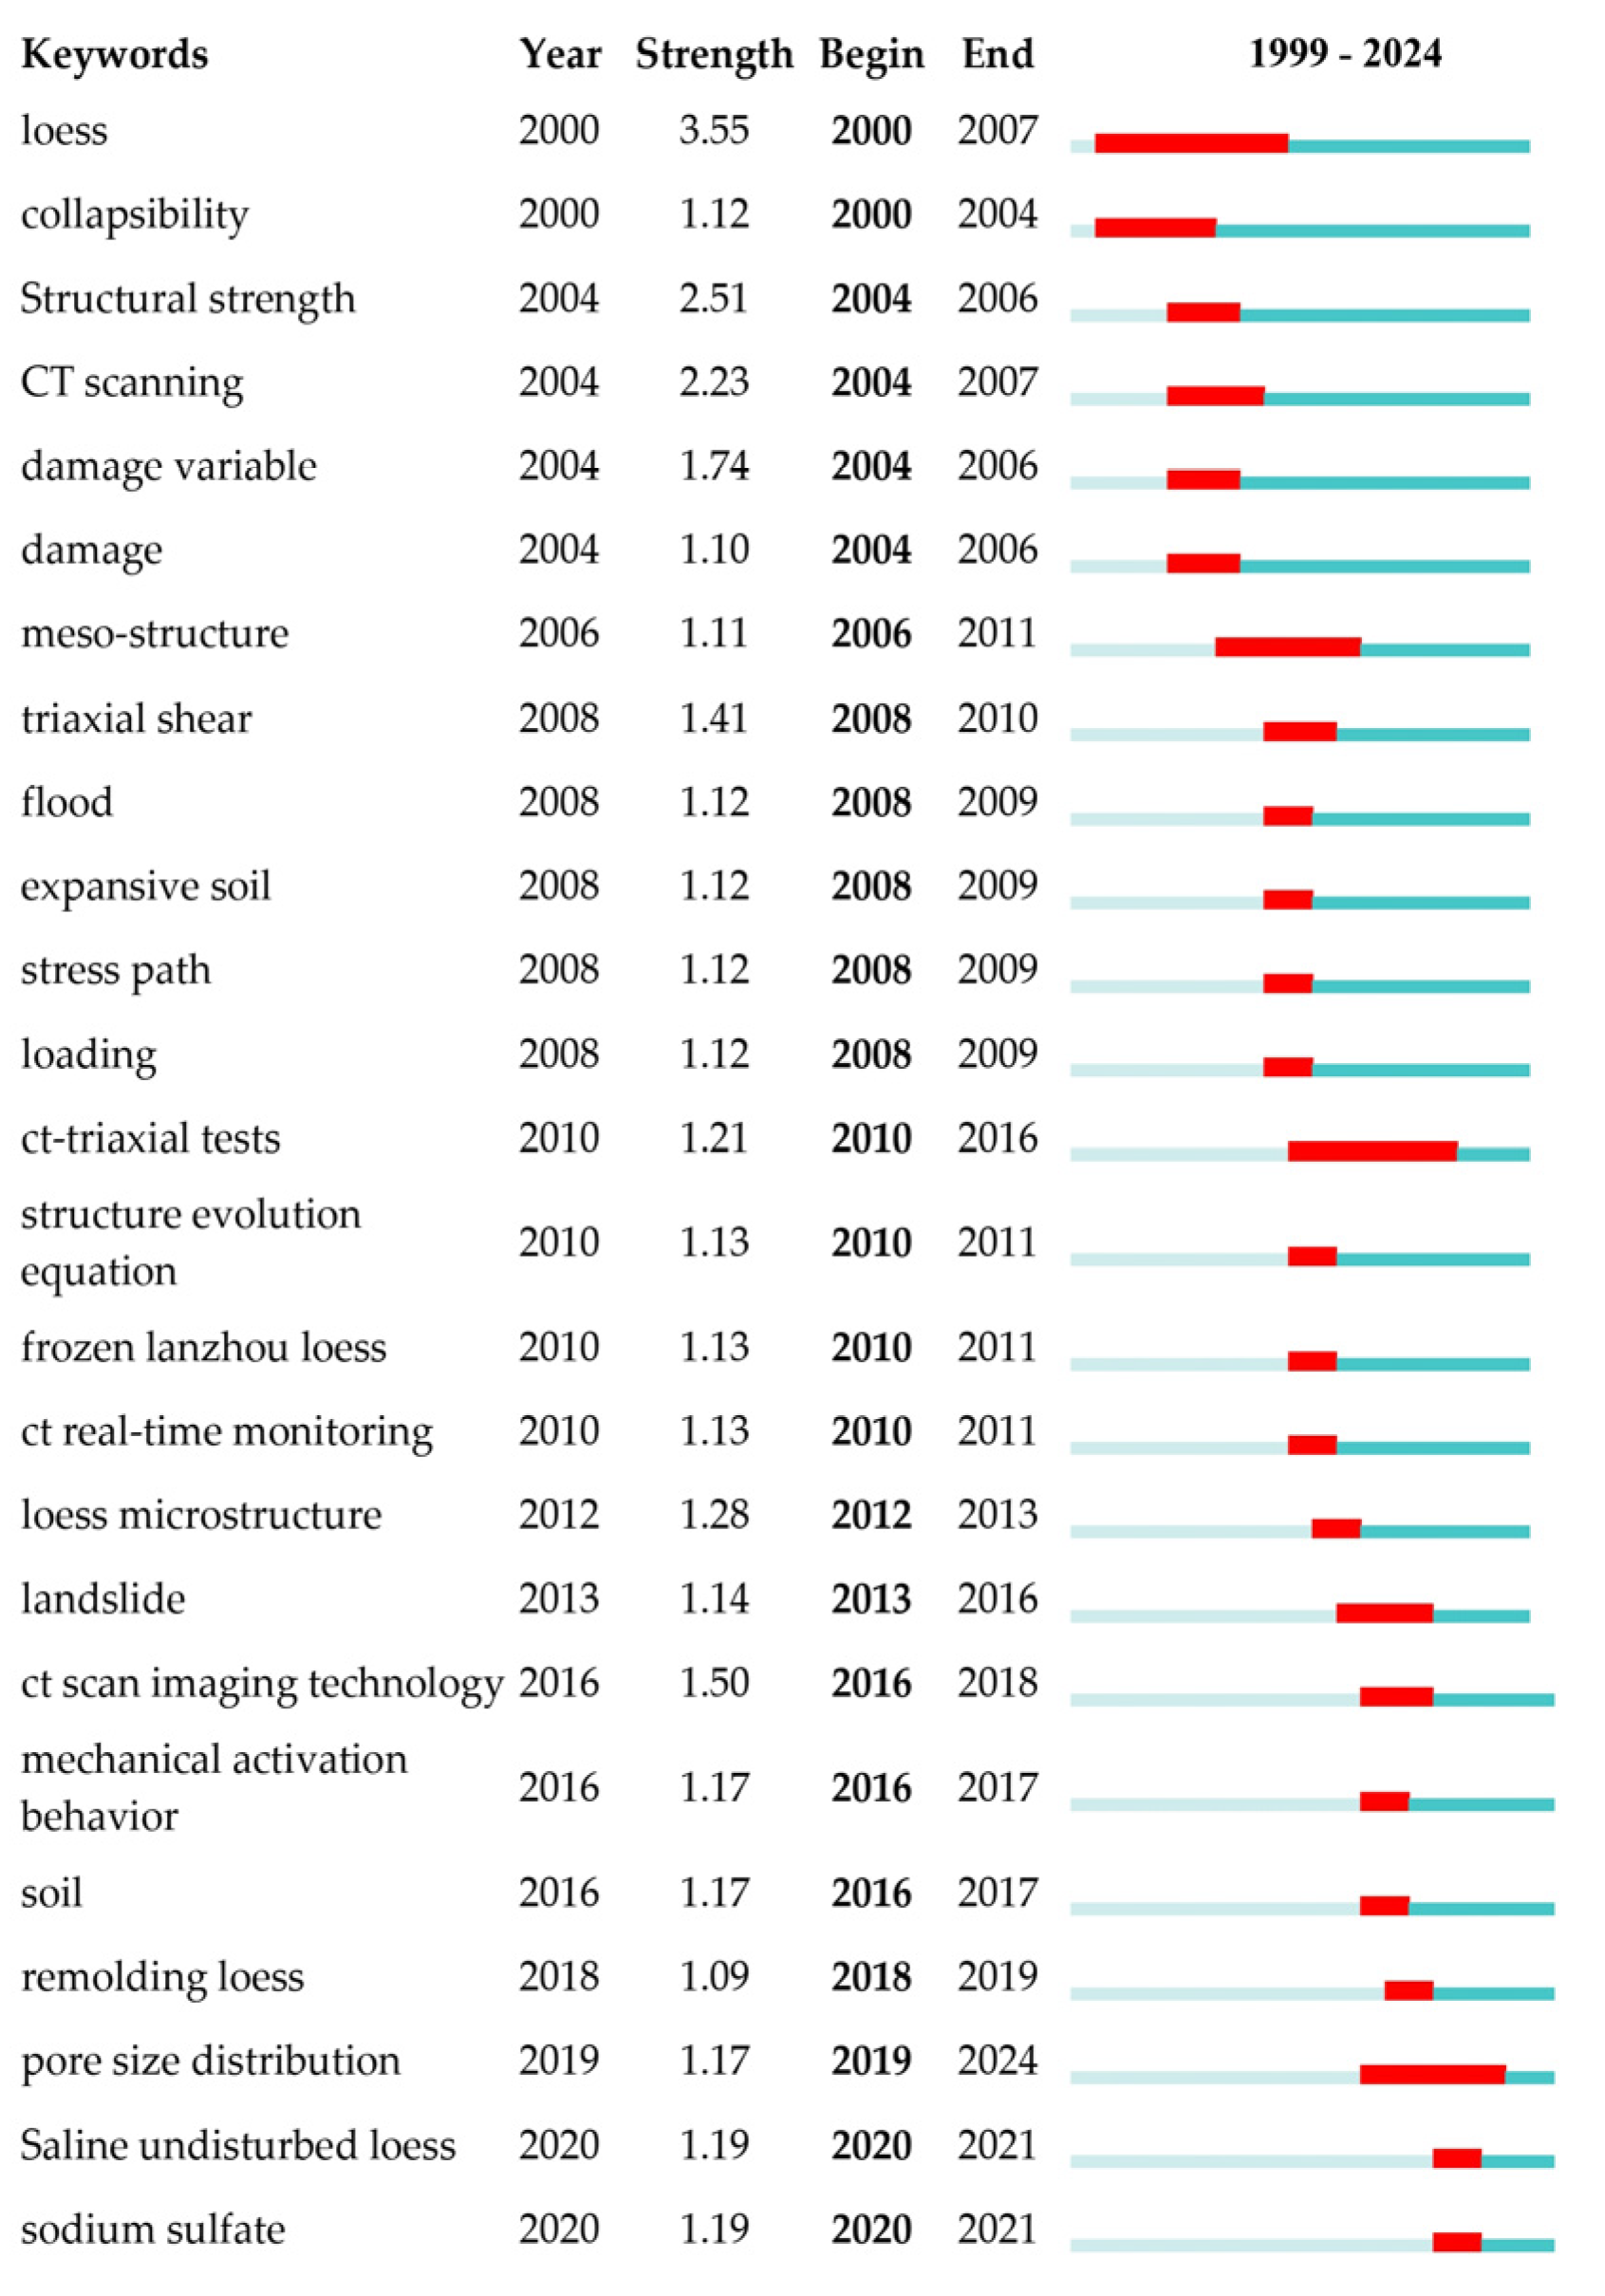
3.3. Burst Analysis of Keyword
4. The Application of CT in Loess Microstructure
4.1. Initial Stage: Exploration and Foundation
4.2. The 3D Characterization of Loess Microstructure
4.3. Relationship between Microstructure and Macroscopic Mechanical Behavior of Loess
5. Conclusions
Author Contributions
Funding
Conflicts of Interest
References
- Xu, Z.J.; Lin, Z.G.; Zhang, M.S. Loess in China and loess landslides. Chin. J. Rock Mech. Eng. 2007, 26, 1297–1312. (In Chinese) [Google Scholar]
- Chen, Z.H.; Xu, Z.H.; Liu, Z.D. Several issues concerning the collapse of loess. Chin. Civ. Eng. J. 1986, 03, 86–94. (In Chinese) [Google Scholar]
- Li, T.C.; Shao, M.A.; Jia, Y.H. Application of X-ray tomography to quantify macropore characteristics of loess soil under two perennial plants. Eur. J. Soil Sci. 2016, 67, 266–275. [Google Scholar] [CrossRef]
- Zhao, J.P.; Cui, L.K.; Chen, H. Quantitative characterization of rock microstructure of digital core based on CT scanning. Geoscience 2020, 34, 1205–1213. (In Chinese) [Google Scholar]
- Kak, A.C.; Slaney, M. Principles of Computerized Tomographic Imaging; IEEE Press: New York, NY, USA, 1988; pp. 86–92. [Google Scholar]
- Kak, A.C.; Slaney, M. Principles of Computerized Tomographic Imaging; Society for Industrial and Applied Mathematics: Philadelphia, PA, USA, 2001. [Google Scholar]
- Duliu, O.G. Computer axial tomography in geosciences: An overview. Earth-Sci. Rev. 1999, 48, 265–281. [Google Scholar] [CrossRef]
- Carlson, W.D. Three-dimensional imaging of earth and planetary materials. Earth Planet. Sci. Lett. 2006, 249, 133–147. [Google Scholar] [CrossRef]
- Baveye, P.C.; Otten, W.; Kravchenko, A.; Balseiro-Romero, M.; Beckers, É.; Chalhoub, M.; Darnault, C.; Eickhorst, T.; Garnier, P.; Hapca, S.; et al. Emergent Properties of Microbial Activity in Heterogeneous Soil Microenvironments: Different Research Approaches Are Slowly Converging, Yet Major Challenges Remain. Front. Microbiol. 2018, 9, 1929. [Google Scholar] [CrossRef] [PubMed]
- Pires, L.F.; Borges, J.A.; Bacchi, O.O. Twenty-five years of computed tomography in soil physics: A literature review of the Brazilian contribution. Soil Tillage Res. 2010, 110, 197–210. [Google Scholar] [CrossRef]
- Downie, H.F.; Adu, M.O.; Schmidt, S.; Otten, W.; Dupuy, L.X.; White, P.J.; Valentine, T.A. Challenges and opportunities for quantifying roots and rhizosphere interactions through imaging and image analysis. Plant Cell Environ. 2014, 38, 1213–1232. [Google Scholar] [CrossRef]
- Piovesan, A.; Vancauwenberghe, V.; Van De Looverbosch, T.; Verboven, P.; Nicolaï, B. X-ray computed tomography for 3D plant imaging. Trends Plant Sci. 2021, 26, 1171–1185. [Google Scholar] [CrossRef]
- Tang, C.; Cheng, Q.; Gong, X.; Shi, B.; Inyang, H.I. Investigation on microstructure evolution of clayey soils: A review focusing on wetting/drying process. J. Rock Mech. Geotech. Eng. 2023, 15, 269–284. [Google Scholar] [CrossRef]
- Zhang, H.; He, H.; Gao, Y.; Mady, A.; Filipović, V.; Dyck, M.; Lv, J.; Liu, Y. Applications of Computed Tomography (CT) in environmental soil and plant sciences. Soil Tillage Res. 2023, 226, 105574. [Google Scholar] [CrossRef]
- Ghosh, T.; Maity, P.P.; Rabbi, S.M.F.; Das, T.K.; Bhattacharyya, R. Application of X-ray computed tomography in soil and plant: A review. Front. Environ. Sci. 2023, 11, 1216630. [Google Scholar] [CrossRef]
- Ketcham, R.A.; Carlson, W.D. Acquisition, optimization, and interpretation of X-ray computed tomographic imagery: Applications to the geosciences. Comput. Geosci. 2001, 27, 381–400. [Google Scholar] [CrossRef]
- Helliwell, J.R.; Sturrock, C.J.; Grayling, K.M.; Tracy, S.R.; Flavel, R.J.; Young, I.M.; Whalley, W.R.; Mooney, S.J. Applications of X-ray computed tomography for examining biophysical interactions and structural development in soil systems: A review. Eur. J. Soil Sci. 2013, 64, 279–297. [Google Scholar] [CrossRef]
- Carmignato, S.; Dewulf, W.; Leach, R. Industrial X-ray Computed Tomography; Springer International Publishing: Cham, Switzerland, 2018. [Google Scholar]
- Li, X.J.; Zhang, D.L. Application of CT in analysis of structure of compacted soil. Rock Soil Mech. 1999, 02, 62–66. (In Chinese) [Google Scholar]
- Yang, G.S.; Xie, D.Y.; Zhang, C.Q.; Pu, Y.B. The Creep Compliance Method for Viscoelastic Analysis of Surrounding Rock Supporting System. Rock Soil Mech. 1997, 02, 29–34. (In Chinese) [Google Scholar]
- Lei, S.Y.; Tang, W.D. Analysis of microstructure change for loess in the process of loading and collapse with CT scanning. Chin. J. Rock Mech. Eng. 2004, 24, 4166–4169. (In Chinese) [Google Scholar]
- Pu, Y.B.; Chen, W.Y.; Liao, Q.R. Research on CT structure changing for damping process of loess in Longdong. J. Geotech. Eng. 2000, 22, 52–57. (In Chinese) [Google Scholar]
- Li, J.G.; Chen, Z.H.; Huang, X.F. CT-triaxial test for collapsibility of undisturbed Q3 loess. J. Rock Mech. Eng. 2010, 29, 1288–1296. (In Chinese) [Google Scholar]
- Wang, H.N.; Ni, W.K. Quantitative analysis of loess microstructure based on CT and SEM images. Rock Soil Mech. 2012, 33, 243–247, 254. (In Chinese) [Google Scholar]
- Yuan, W.; Fan, W. Quantitative study on the microstructure of loess soils at micrometer scale via X-ray computed tomography. Powder Technol. 2022, 408, 11771. [Google Scholar] [CrossRef]
- Wei, T.; Fan, W.; Zhou, Y.; Deng, L.; Wu, Z.; Wei, Y.-N. Quantification of the spatial-temporal evolution of loess microstructure from the Dongzhi tableland during shearing. Eng. Geol. 2023, 323, 107213. [Google Scholar] [CrossRef]
- Fang, L.L. Study on Mechanism of Freeze-Thaw Induced Changes in Soil Strength. Master’s Thesis, Graduated School of the Chinese Academy of Sciences, Beijing, China, 2012. (In Chinese). [Google Scholar]
- Yang, G.S.; Xie, D.Y.; Zhang, C.Q.; Pu, Y.S. CT identification of rock damage properties. Chin. J. Rock Mech. Eng. 1996, 01, 48–54. (In Chinese) [Google Scholar]
- Wu, Z.W.; Ma, W.; Pu, Y.B.; Chang, X. Monitoring the change of structures in frozen soil in uniaxial creep process by CT. J. Glaciol. Geocryol. 1996, 4, 306–311. (In Chinese) [Google Scholar]
- Cnudde, V.; Masschaele, B.; Dierick, M.; Vlassenbroeck, J.; Van Hoorebeke, L.; Jacobs, P. Recent progress in X-ray CT as a geosciences tool. Appl. Geochem. 2006, 21, 826–832. [Google Scholar] [CrossRef]
- China National Standardization Management Committee. Non-Destructive Testing—Industrial Computed Tomography (CT) Guide; China Standards Press: Beijing, China, 2013. (In Chinese) [Google Scholar]
- Plessis, A.D.; Roux, S.G.L.; Guelpa, A. Comparison of medical and industrial X-ray computed tomography for non-destructive testing. Case Stud. Nondestruct. Test. Eval. 2016, 6, 17–25. [Google Scholar] [CrossRef]
- Li, X. Research on Micro and Meso Void Structure and Preferential Flow Characteristics of Loess Based on CT; Chang’an University: Xi’an, China, 2020. (In Chinese) [Google Scholar]
- Reedy, C.L.; Reedy, C.L. High-resolution micro-CT with 3D image analysis for porosity characterization of historic bricks. Herit. Sci. 2022, 10, 83. [Google Scholar] [CrossRef]
- Mueller, D.; Fella, C.; Altmann, F.; Graetz, J.; Balles, A.; Ring, M.; Gambino, J. Characterization of electrically stressed power device metallization using nano-CT imaging. Microelectron. Reliab. 2022, 135, 114589. [Google Scholar] [CrossRef]
- Velthuis, B.O.; Williams, M.; Nakagawa, M.; Sawicki, M.; Kolla, N.J.; Nemec, U. Advances in Computed Tomography; Scientific Research Publishing Inc.: Irvine, CA, USA, 2019. [Google Scholar]
- Wei, Q.; Leblon, B.; La Rocque, A. On the use of X-ray computed tomography for determining wood properties: A review. Can. J. For. Res. 2011, 41, 2120–2140. [Google Scholar] [CrossRef]
- Tang, W.D.; Lei, S.Y.; Liu, B.L. Collapsibility of original loess in triaxial compression test is analysed with CT scanning. J. Xi’an Technol. Univ. 2007, 03, 284–286, 296. (In Chinese) [Google Scholar]
- Pu, Y.B. Introduction to the Use of CT in Experimental Research of Frozen Soil. J. Glaciol. Geocryol. 1993, 01, 196–198. (In Chinese) [Google Scholar]
- Pu, Y.B.; Wu, Z.W.; Chang, X.X.; Liao, Q.R. The digital analysis of soil experiment using CT. CT Theory Appl. 1994, 3, 8–12. (In Chinese) [Google Scholar]
- Yang, G.S.; Xie, D.Y.; Zhang, C.Q.; Pu, Y. CT analysis on mechanic characteristics of damage propagation of rock. Chin. J. Rock Mech. Eng. 1999, 18, 250–254. (In Chinese) [Google Scholar]
- Li, X.; Li, L. Quantification of the pore structures of Malan loess and the effects on loess permeability and environmental significance, Shaanxi Province, China: An experimental study. Environ. Earth Sci. 2017, 76, 523. [Google Scholar] [CrossRef]
- Cheng, Y.N.; Liu, J.L.; Lv, F.; Zhang, J.B. Three-dimensional reconstruction of soil pore structure and prediction of soil hydraulic properties based on CT images. Trans. Chin. Soc. Agric. Eng. 2012, 28, 115–122. (In Chinese) [Google Scholar]
- Li, T.; Shao, M.; Jia, Y.; Jia, X.; Huang, L. Using the X-ray computed tomography method to predict the saturated hydraulic conductivity of the upper root zone in the Loess Plateau in China. Soil Sci. Soc. Am. J. 2018, 82, 1085–1092. [Google Scholar] [CrossRef]
- Chen, Y.H.; Zhao, D.M. Fracture parameters in cores as determined by X-ray CT techniques. Pet. Expoloration Dev. 1990, 17, 82–86. (In Chinese) [Google Scholar]
- Feng, J.; Yu, J.Y. Determination fractal dimension of soil macropore using computed tomography. J. Irrig. Drain. 2005, 24, 26–28, 40. (In Chinese) [Google Scholar]
- Xu, Z.H.; Xu, Z.M.; Li, L.X. Soil macropores quantification study and3D reconstruction in vadose zones of hillslope based on x-ray computed tomography. Bull. Soil Water Conserv. 2015, 35, 133–138. (In Chinese) [Google Scholar]
- Xu, Z.H.; Xu, Z.M.; Wang, Z.L. Application of lattice Boltzmann method in macropore flows in unsaturated zone soil of slopes. Chin. J. Geotech. Eng. 2017, 39, 178–184. (In Chinese) [Google Scholar]
- Yang, G.S.; Sun, J.; Xie, D.Y.; Zhang, C.Q. Analysis of the relation between the damage variable and CT value of rock material. Mech. Eng. 1998, 20, 48–50. (In Chinese) [Google Scholar]
- Ding, W.H.; Wu, Y.Q.; Pu, Y.B.; Cao, G.Z.; Cui, Z.X. Measurement of crack width in rock interior based on X-ray CT. Chin. J. Rock Mech. Eng. 2003, 22, 1421–1425. (In Chinese) [Google Scholar]
- Zhu, H.G.; Xie, H.P.; Yi, C.; Liu, Z.; Liu, H.; Wang, H. CT identification of microcracks evolution for rock materials. Chin. J. Rock Mech. Eng. 2011, 30, 1230–1238. (In Chinese) [Google Scholar]
- Zhao, J.; Feng, Z.C.; Yang, D.; Kang, Z. Study on distribution characteristics of pores and fissures inside oil shale under the CT experiment. J. Liaoning Tech. Univ. (Nat. Sci.) 2013, 32, 1044–1049. (In Chinese) [Google Scholar]
- Li, X.C.; Chen, D.F.; Kang, Y.L.; Meng, X. Characterization of pores and fractures of coal based on CT scan. Coal Geol. Explor. 2016, 44, 58–62, 70. (In Chinese) [Google Scholar]
- Liu, X.J.; Xiong, J.; Liang, L.X.; Yuan, W. Study on the characteristics of pore structure of tight sand based on micro-CT scanning and its influence on fluid flow. Prog. Geophys. 2017, 32, 1019–1028. (In Chinese) [Google Scholar]
- Zhou, G.; Qiu, L.; Wang, J.Y. Simulation analysis on seepage characteristics of low pressure gas based on micro CT Technology. Coal Sci. Technol. 2018, 46, 120–126. (In Chinese) [Google Scholar]
- Li, X.; Lu, Y.D.; Fan, W.; Pan, W.; Zhang, X.; Lu, Y. Current status and prospects of research on mechanism of preferential flow-induced sliding in loess slope. Bull. Soil Water Conserv. 2019, 39, 294–301, 324. (In Chinese) [Google Scholar]
- Li, X.; Lu, Y.D.; Zhang, X.Z.; Lu, Y.; Yang, Y. Pore-fissure identification and characterization of paleosol based on X-ray computed tomography. Bull. Soil Water Conserv. 2018, 38, 224–230, 239. (In Chinese) [Google Scholar]
- Fan, W.; Wei, Y.N.; Yu, B.; Deng, L.S.; Yu, N.Y. Research progress and prospect of loess collapsible mechanism in micro-level. Hydrogeol. Eng. Geol. 2022, 49, 144–156. (In Chinese) [Google Scholar]
- Schmitt, R.H.; Buratti, A.; Grozmani, N.; Voigtmann, C.; Peterek, M. Model-based optimisation of CT imaging parameters for dimensional measurements on multimaterial workpieces. CIRP Ann. 2018, 67, 527–530. [Google Scholar] [CrossRef]
- Villarraga-Gómez, H.; Thousand, J.D.; Smith, S.T. Empirical approaches to uncertainty analysis of X-ray computed tomography measurements: A review with examples. Precis. Eng. 2020, 64, 249–268. [Google Scholar] [CrossRef]
- Lin, Q.; Yang, M.; Meng, F.; Sun, L.; Tang, B. Calibration method of center of rotation under the displaced detector scanning for industrial CT. Nucl. Instrum. Methods Phys. Res. Sect. A 2019, 922, 326–335. [Google Scholar] [CrossRef]
- Villarraga-Gómez, H.; Körner, L.; Leach, R.; Smith, S.T. Amplitude-wavelength maps for X-ray computed tomography systems. Precis. Eng. 2020, 64, 228–242. [Google Scholar] [CrossRef]
- Villarraga-Gómez, H.; Amirkhanov, A.; Heinzl, C.; Smith, S.T. Assessing the effect of sample orientation on dimensional X-ray computed tomography through experimental and simulated data. Measurement 2021, 178, 109343. [Google Scholar] [CrossRef]
- Jacobson, F.L.; Judy, P.F.; Feldman, U.; Seltzer, S.E. Perceived features reported as nodules: Interpretation of spiral chest CT scans. Acad. Radiol. 2000, 7, 77–82. [Google Scholar] [CrossRef] [PubMed]
- Houston, A.; Schmidt, S.; Tarquis, A.; Otten, W.; Baveye, P.C.; Hapca, S.M. Effect of scanning and image reconstruction settings in X-ray computed microtomography on quality and segmentation of 3D soil images. Geoderma 2013, 207–208, 154–165. [Google Scholar] [CrossRef]
- Gao, H.; Zhang, T.; Bennett, N.R.; Wang, A.S. Densely sampled spectral modulation for X-ray CT using a stationary modulator with flying focal spot: A conceptual and feasibility study of scatter and spectral correction. Med. Phys. 2021, 48, 1557–1570. [Google Scholar] [CrossRef]
- Zhang, T.; Chen, Z.; Zhou, H.; Bennett, N.R.; Wang, A.S.; Gao, H. An analysis of scatter characteristics in X-ray CT spectral correction. Phys. Med. Biol. 2021, 66, 075003. [Google Scholar] [CrossRef]
- Zhu, L.; Han, Y.; Li, L.; Xi, X.; Zhu, M.; Yan, B. Metal artifact reduction for X-ray computed tomography using U-net in image domain. IEEE Access 2019, 7, 98743–98754. [Google Scholar] [CrossRef]
- Franck, C.; Zhang, G.; Deak, P.; Zanca, F. Preserving image texture while reducing radiation dose with a deep learning image reconstruction algorithm in chest CT: A phantom study. Phys. Med. 2021, 81, 86–93. [Google Scholar] [CrossRef] [PubMed]
- Kawahara, D.; Saito, A.; Ozawa, S.; Nagata, Y. Image synthesis with deep convolutional generative adversarial networks for material decomposition in dual-energy CT from a kilovoltage CT. Comput. Biol. Med. 2021, 128, 104111. [Google Scholar] [CrossRef] [PubMed]
- Wang, Y.; Zhang, W.; Cai, A.; Wang, L.; Tang, C.; Feng, Z.; Yan, B. An effective sinogram inpainting for complementary limited-angle dual-energy computed tomography imaging using generative adversarial networks. J. X-ray Sci. Technol. 2021, 29, 37–61. [Google Scholar] [CrossRef] [PubMed]
- Zhang, Z.; Yu, L.; Zhao, W.; Xing, L. Modularized data-driven reconstruction framework for nonideal focal spot effect elimination in computed tomography. Med. Phys. 2021, 48, 2245–2257. [Google Scholar] [CrossRef] [PubMed]
- Yan, M.; Ma, B.; Tian, B.; Hu, G.; Wu, R.; Wang, S. Design, simulation and reconstruction for a fast speed two-phase flow CT with 241Am gamma ray sources. Ann. Nucl. Energy 2021, 151, 107970. [Google Scholar] [CrossRef]
- Hegazy, M.A.; Cho, M.H.; Lee, S.Y. Half-scan artifact correction using generative adversarial network for dental CT. Comput. Biol. Med. 2021, 132, 104313. [Google Scholar] [CrossRef] [PubMed]
- Kobayashi, T.; Yoshida, M.; Numano, T.; Shiotani, S.; Saitou, H.; Tashiro, K.; Hayakawa, H. Noise reduction effect of computed tomography by image summation method (fused CT): Phantom study. Forensic Imaging 2020, 23, 200418. [Google Scholar] [CrossRef]
- Aslan, N.; Ceylan, B.; Koç, M.M.; Findik, F. Metallic nanoparticles as X-Ray computed tomography (CT) contrast agents: A review. J. Mol. Struct. 2020, 1219, 128599. [Google Scholar] [CrossRef]
- Inose, T.; Kitamura, N.; Takano-Kasuya, M.; Tokunaga, M.; Une, N.; Kato, C.; Tayama, M.; Kobayashi, Y.; Yamauchi, N.; Nagao, D.; et al. Development of X-ray contrast agents using single nanometer-sized gold nanoparticles and lactoferrin complex and their application in vascular imaging. Colloids Surf. B Biointerfaces 2021, 203, 111732. [Google Scholar] [CrossRef]
- Ojeda-Magaña, B.; Quintanilla-Domínguez, J.; Ruelas, R.; Tarquis, A.M.; Gómez-Barba, L.; Andina, D. Identification of Pore Spaces in 3D CT Soil Images Using PFCM Partitional Clustering. Geoderma. 2014, 217, 90–101. [Google Scholar] [CrossRef]
- Schlüter, S.; Sheppard, A.; Brown, K.; Wildenschild, D. Image processing of multiphase images obtained via X-ray microtomography: A review. Water Resour. Res. 2014, 50, 3615–3639. [Google Scholar] [CrossRef]
- Gackiewicz, B.; Lamorski, K.; Sławiński, C. Saturated water conductivity estimation based on X-ray CT images-evaluation of the impact of thresholding errors. Int. Agrophysics 2019, 33, 49–60. [Google Scholar] [CrossRef]
- Sezgin, M.; Sankur, B.L. Survey over image thresholding techniques and quantitative performance evaluation. J. Electron. Imaging 2004, 13, 146–168. [Google Scholar]
- Tang, C.S.; Lin, L.; Cheng, Q.; Zhu, C.; Wang, D.W.; Lin, Z.Y.; Shi, B. Quantification and characterizing of soil microstructure features by image processing technique. Comput. Geotech. 2020, 128, 103817. [Google Scholar] [CrossRef]
- Lavrukhin, E.V.; Gerke, K.M.; Romanenko, K.A.; Abrosimov, K.N.; Karsanina, M.V. Assessing the fidelity of neural network-based segmentation of soil XCT images based on pore-scale modelling of saturated flow properties. Soil Tillage Res. 2021, 209, 104942. [Google Scholar] [CrossRef]
- Iassonov, P.; Gebrenegus, T.; Tuller, M. Segmentation of X-ray computed tomography images of porous materials: A crucial step for characterization and quantitative analysis of pore structures. Water Resour. Res. 2009, 45, W09415. [Google Scholar] [CrossRef]
- Houston, A.N.; Otten, W.; Baveye, P.C.; Hapca, S. Adaptive-window indicator kriging: A thresholding method for computed tomography images of porous media. Comput. Geosci. 2013, 54, 239–248. [Google Scholar] [CrossRef]
- Wang, H.; Qian, H.; Gao, Y. Characterization of macropore structure of remolded loess and analysis of hydraulic conductivity anisotropy using X-ray computed tomography technology. Environ. Earth Sci. 2021, 80, 197. [Google Scholar] [CrossRef]
- Gerke, K.M.; Karsanina, M.V. How pore structure non-stationarity compromises flow properties representativity (REV) for soil samples: Pore-scale modelling and stationarity analysis. Eur. J. Soil Sci. 2020, 72, 527–545. [Google Scholar] [CrossRef]
- Higo, Y.; Oka, F.; Sato, T.; Matsushima, Y.; Kimoto, S. Investigation of localized deformation in partially saturated sand under triaxial compression using microfocus X-ray CT with digital image correlation. Soils Found. 2013, 53, 181–198. [Google Scholar] [CrossRef]
- Sun, Q.; Zheng, J.; Li, C. Improved watershed analysis for segmenting contacting particles of coarse granular soils in volumetric images. Powder Technol. 2019, 356, 295–303. [Google Scholar] [CrossRef]
- Chauhan, S.; Rühaak, W.; Khan, F.; Enzmann, F.; Mielke, P.; Kersten, M.; Sass, I. Processing of rock core microtomography images: Using seven different machine learning algorithms. Comput. Geosci. 2016, 86, 120–128. [Google Scholar] [CrossRef]
- Wang, X.; Yang, Y.; Lv, J.; He, H. Past, present and future of the applications of machine learning in soil science and hydrology. Soil Water Res. 2023, 18, 67–80. [Google Scholar] [CrossRef]
- Houston, A.N.; Otten, W.; Falconer, R.; Monga, O.; Baveye, P.C.; Hapca, S.M. Quantification of the pore size distribution of soils: Assessment of existing software using tomographic and synthetic 3D images. Geoderma 2017, 299, 73–82. [Google Scholar] [CrossRef]
- Mukunoki, T.; Miyata, Y.; Mikami, K.; Shiota, E. X-ray CT analysis of pore structure in sand. Solid Earth 2016, 7, 929–942. [Google Scholar] [CrossRef]
- Lucas, M.; Vetterlein, D.; Vogel, H.J.; Schlüter, S. Revealing pore connectivity across scales and resolutions with X-ray CT. Eur. J. Soil Sci. 2021, 72, 546–560. [Google Scholar] [CrossRef]
- Koestel, J. SoilJ: An ImageJ plugin for the semiautomatic processing of three-dimensional X-ray images of soils. Vadose Zone J. 2018, 17, 1–7. [Google Scholar] [CrossRef]
- Zhao, Y.; Han, Q.; Zhao, Y.; Liu, J. Soil pore identification with the adaptive fuzzy C-means method based on computed tomography images. J. For. Res. 2019, 30, 1043–1052. [Google Scholar] [CrossRef]
- Weller, U.; Albrecht, L.; Schlüter, S.; Vogel, H.J. An open soil structure library based on X-ray CT data. Soil 2022, 8, 507–515. [Google Scholar] [CrossRef]
- Zheng, J.; Zhuang, J.Q.; Kong, J.X.; Fu, Y.; Mou, J.; Wang, J. Study of loess pore structure characteristics based on CT scanning. Bull. Geol. Sci. Technol. 2022, 41, 211–222. (In Chinese) [Google Scholar]
- Wei, Y.N.; Fan, W.; Yu, B.; Deng, L.S.; Wei, T. Characterization and Evolution of Three-Dimensional Microstructure of Malan Loess. Catena 2020, 192, 104585. [Google Scholar] [CrossRef]
- Chen, S.J.; Sun, Q.; Chen, W.P.; Yang, J.H. Bibliometric analysis of studies relating gut microbiota to hepatocellular carcinoma. Microbiol. Chin. 2024, 1–32. (In Chinese) [Google Scholar]
- Liao, S.J. The comparative study on the scientific knowledge mapping tools: VOSviewer and Citespace. J. Libr. Inf. Sci. 2011, 21, 137–139. (In Chinese) [Google Scholar]
- Zhang, W.L.; Su, R. Overseas Hot Spots, Trends and Enlightenments in the Research of Project-based Learning: Data Visualization Analysis by CiteSpace. J. Distance Educ. 2018, 36, 91–102. (In Chinese) [Google Scholar]
- Shao, S.J.; Zhou, F.F.; Long, J.Y. Structural properties of loess and its quantitative parameter. Chin. J. Geotech. Eng. 2004, 26, 531–536. (In Chinese) [Google Scholar]
- Lei, S.Y.; Tang, W.D. Experimental investigation on hardened yield damage for the original loess. Chin. J. Civ. Eng. 2006, 39, 73–77. (In Chinese) [Google Scholar]
- Fang, X.W.; Chen, Z.H.; Shen, C.N.; Zhang, W. Meso-testing research on structure damage evolution of natural Q2 loess. J. Hydraul. Eng. 2008, 39, 940–946. (In Chinese) [Google Scholar]
- Zhu, Y.Q.; Chen, Z.H. Experimental study on dynamic evolution of meso-structure of intact Q3 loess during loading and collapse using CT and triaxial apparatus. Chin. J. Geotech. Eng. 2009, 31, 1219–1228. (In Chinese) [Google Scholar]
- Wang, F.; Deng, N.D.; Ma, F.Q.; Wang, C.; Jiang, X. Study on 3D Fractal of Loess Large Pore Based on CT. Comput. Eng. 2014, 40, 217–220. (In Chinese) [Google Scholar]
- Liu, Z.Q.; Song, J.; Yang, Y.S.; Ren, Y. Three-dimensional pores evolution characteristics during consolidation process of saturated fine-grained soil. J. Eng. Geol. 2016, 24, 931–940. (In Chinese) [Google Scholar]
- Yan, K.; Gu, T.F.; Wang, J.D.; Liu, Y.M.; Wang, X.; Wang, C.X. A study of the micro-configuration of loess based on micro-CT images. Hydrogeol. Eng. Geol. 2018, 45, 71–77. (In Chinese) [Google Scholar]
- Li, Y.; He, S.; Deng, X.; Xu, Y. Characterization of Macropore Structure of Malan Loess in NW China Based on 3D Pipe Models Constructed by Using Computed Tomography Technology. J. Asian Earth Sci. 2018, 154, 271–279. [Google Scholar] [CrossRef]
- Li, Y.; Zhang, T.; Zhang, Y.; Xu, Q. Geometrical Appearance and Spatial Arrangement of Structural Blocks of the Malan Loess in NW China: Implications for the Formation of Loess Columns. J. Asian Earth Sci. 2018, 158, 18–28. [Google Scholar] [CrossRef]
- Wei, T.; Fan, W.; Yuan, W.; Wei, Y.N.; Yu, B. Three-Dimensional Pore Network Characterization of Loess and Paleosol Stratigraphy from South Jingyang Plateau, China. Environ. Earth Sci. 2019, 78, 333. [Google Scholar] [CrossRef]
- Zhang, L.; Qi, S.; Ma, L.; Guo, S.; Li, Z.; Li, G.; Yang, J.; Zou, Y.; Li, T.; Hou, X. Three-Dimensional Pore Characterization of Intact Loess and Compacted Loess with Micron Scale Computed Tomography and Mercury Intrusion Porosimetry. Sci. Rep. 2020, 10, 8511. [Google Scholar] [CrossRef]
- Meng, J.; Li, X.A.; Zhao, X.K.; Liu, J.Y.; Wang, J.X. Uniformity of remoulded loess samples based on high precision μCT scanning. Yangtze River Sci. Acad. 2019, 36, 125–130. (In Chinese) [Google Scholar]
- Ning, R.H.; Leng, Y.Q.; He, Z.Y.; Li, Z.K.; Ma, Z. Pore scale preferential flow characteristics of loess based on CT. Sci. Technol. Eng. 2022, 22, 9927–9936. (In Chinese) [Google Scholar]
- Yu, B.; Fan, W.; Fan, J.H.; Dijkstra, T.A.; Wei, Y.N.; Wei, T.T. X-ray Micro-Computed Tomography (μ-CT) for 3D Characterization of Particle Kinematics Representing Water-Induced Loess Micro-Fabric Collapse. Eng. Geol. 2020, 279, 105895. [Google Scholar] [CrossRef]
- Deng, L.S.; Fan, W.; Chang, Y.P.; Yu, B.; Wei, Y.N.; Wei, T.T. Microstructure Quantification, Characterization, and Regional Variation in the Ma Lan Loess on the Loess Plateau in China. Int. J. Geomech. 2021, 21, 04021143. [Google Scholar] [CrossRef]
- Wei, T.; Fan, W.; Yu, N.; Wei, Y.N. Three-Dimensional Microstructure Characterization of Loess Based on a Serial Sectioning Technique. Eng. Geol. 2019, 261, 105265. [Google Scholar] [CrossRef]
- Yang, G.H.; Li, C.; Shang, Y.; Zhang, Z.G.; Gao, Y.; Li, S.H. Experimental study on improving loess pore properties by slag powder based on CT scanning technology. Water Resour. Hydropower Eng. 2023, 54, 201–209. (In Chinese) [Google Scholar]
- Zhang, Z.Y.; Xia, B.; Hao, W.L.; Wang, R.Y.; Xie, Y.; Xu, M.X. Pore distribution characteristics of layered soil profile in dam land of Loess Plateau. J. Soil Water Conserv. 2023, 37, 83–90. (In Chinese) [Google Scholar]
- Feng, X.R.; Zhu, X.H.; Sun, H.F.; Ju, L.; We, R.X. Meso and micro pore structure test of Jingyang shallow loess. Hydrogeol. Eng. Geol. 2024, 51, 1–11. (In Chinese) [Google Scholar]
- Zhou, Y.F.; Xiao, Z.W.; Zhao, N. Meso-evolution of shear band of loess under triaxial loading process. Yangtze River Sci. Acad. 2019, 36, 79–83. (In Chinese) [Google Scholar]
- Shao, S.; Shao, S.J.; Zhu, D.D.; Li, P. Evolution of micro-structure and macro-structural property of loess. Chin. J. Geotech. Eng. 2021, 43, 64–70. (In Chinese) [Google Scholar]
- Yuan, W.N.; Fan, W.; Deng, L.S.; Li, W.W.; Zhou, Y.Y. Particle structure characteristics of loess and their effects on shear behavior. J. Eng. Geol. 2021, 29, 871–878. (In Chinese) [Google Scholar]
- Wei, Y.N.; Fan, W.; Yu, N.; Deng, L.S.; Wei, T. Permeability of loess from the South Jingyang Plateau under different consolidation pressures in terms of the three-dimensional microstructure. Bull. Eng. Geol. Environ. 2020, 79, 4841–4857. [Google Scholar] [CrossRef]
- Wei, Y.N.; Fan, W.; Ma, G.L. Characteristics of Microstructure and Collapsible Mechanism of Malan Loess in Loess Plateau, China. J. Earth Sci. Environ. 2022, 44, 581–592. (In Chinese) [Google Scholar]
- Zhou, Y.Y.; Yu, B.; Fan, W.; Dijkstra, T.A.; Wei, Y.N.; Deng, L.S. 3D characterization of localized shear failure in loess subject to triaxial loading. Eng. Geol. 2023, 322, 107174. [Google Scholar] [CrossRef]
- Li, X.; Li, Y.; Li, Q.; Zhang, X.; Shi, X.; Lu, Y.; Zhang, L. The Seepage Evolution Characteristics in Undisturbed Loess under Dynamic Preferential Flow: New Insights from X-ray Computed Tomography. Water 2023, 15, 2963. [Google Scholar] [CrossRef]


| CT Category | Resolution | Common Current | Common Voltage | Equipment Schematic | Scanning Time |
|---|---|---|---|---|---|
| Medical CT | 600 um | 10~600 mA | 120~140 KV |  | 1~10 s |
| Industrial CT | 50~500 um | 10~1000 mA | 225~600 KV | 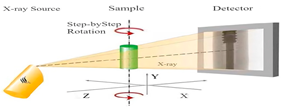 | 5~60 min or longer |
| Micro-CT | 0.5~50 um | 5~100 mA | 30~160 KV | 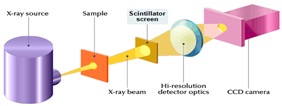 | 15~60 min or longer |
| Nano-CT | 50~0.5 um | 30 uA~50 mA | 8~150 KV | 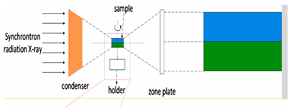 | 1~60 min or longer |
Disclaimer/Publisher’s Note: The statements, opinions and data contained in all publications are solely those of the individual author(s) and contributor(s) and not of MDPI and/or the editor(s). MDPI and/or the editor(s) disclaim responsibility for any injury to people or property resulting from any ideas, methods, instructions or products referred to in the content. |
© 2024 by the authors. Licensee MDPI, Basel, Switzerland. This article is an open access article distributed under the terms and conditions of the Creative Commons Attribution (CC BY) license (https://creativecommons.org/licenses/by/4.0/).
Share and Cite
Yao, X.; Yu, L.; Ke, Y.; Jin, L.; Wang, W. State-of-the-Art Research on Loess Microstructure Based on X-ray Computer Tomography. Appl. Sci. 2024, 14, 6402. https://doi.org/10.3390/app14156402
Yao X, Yu L, Ke Y, Jin L, Wang W. State-of-the-Art Research on Loess Microstructure Based on X-ray Computer Tomography. Applied Sciences. 2024; 14(15):6402. https://doi.org/10.3390/app14156402
Chicago/Turabian StyleYao, Xiaoliang, Lin Yu, Yixin Ke, Long Jin, and Wenli Wang. 2024. "State-of-the-Art Research on Loess Microstructure Based on X-ray Computer Tomography" Applied Sciences 14, no. 15: 6402. https://doi.org/10.3390/app14156402
APA StyleYao, X., Yu, L., Ke, Y., Jin, L., & Wang, W. (2024). State-of-the-Art Research on Loess Microstructure Based on X-ray Computer Tomography. Applied Sciences, 14(15), 6402. https://doi.org/10.3390/app14156402