Article

Anti-Obesity and Antidiabetic Effects of Fig (Ficus carica L.) Fermented Extract Using Lactobacillus plantarum BT-LP-01

1
Department of Laboratory Animal Medicine, College of Veterinary Medicine, Jeonbuk National University, 79 Gobong-ro, Iksan-si 54596, Republic of Korea
2
Alldayorganic Co., Ltd., 30-39 Gojeong 1-ro 82 beon-gil, Gimpo-si 10009, Republic of Korea
3
R&D Team, Food & Supplement Health Claims, Vitech Co., Ltd., #602 Giyeon B/D 141 Anjeon-ro, Iseo-myeon, Wanju-gun 55365, Republic of Korea
4
School of Liberal Studies, Regulatory Science Major, Kunsan National University, 558 Daehak-ro, Gunsan-si 54150, Republic of Korea
*
Authors to whom correspondence should be addressed.
Appl. Sci. 2024, 14(15), 6412; https://doi.org/10.3390/app14156412
Submission received: 30 May 2024 / Revised: 16 July 2024 / Accepted: 19 July 2024 / Published: 23 July 2024

Abstract

:
This study aimed to assess the effect of fermented fig (Ficus carica L., FF) on obesity and diabetes in a mouse model. FF was cultured with the lactic acid bacterium Lactobacillus plantarum BT-LP-01 and isolated from fig peels. The antioxidant results demonstrated that FF exhibited DPPH and ABTS radical scavenging activities. In addition, FF showed high levels of total polyphenol and total flavonoids. Body and organ weight and dietary intake were significantly decreased in the FF groups compared to the HFD group. The FF group showed improved recovery in lipid metabolism and liver function compared to the HFD group. In addition, the FF group showed a significant decrease in serum C-P and insulin concentrations compared to the HFD group. FF-administered mice showed a dose-dependent recovery of fasting blood glucose and IPGTT and AUC levels compared to the HFD group. Furthermore, FF groups showed a decreased expression in FAS, C/EBPα, and FABP4, as well as significantly increased expression in ACC in the liver. This study demonstrates that FF is effective in reducing and inhibiting adipogenesis as well as lowering body weight, the blood glucose level, and lipid-related factors. These research findings demonstrate that FF is effective in treating obesity and diabetes.

1. Introduction

Obesity is a global health problem with multifactorial origins, encompassing genetic, environmental, and lifestyle factors. The worldwide panorama reflects a considerable upswing in the age-standardized prevalence of obesity, signaling a notable and concerning escalation in the incidence of this health condition on a global scale. The prevalence of obesity among women rose from 0.7% in 1975 to 5.6% in 2016 and from 0.7% to 7.8% for men, with prevalence exceeding 30% in several countries [1]. The primary factor contributing to obesity is the excessive accumulation of intracellular triglyceride (TG) resulting from the activation of adipogenesis [2]. Adipogenesis is the process of undifferentiated preadipocytes developing into mature preadipocytes and involves transcriptional factors like a CCATT/enhancer-binding protein (C/EBP). These transcriptional factors orchestrate the promotion of fatty acid synthesis and transport, playing a crucial role in the eventual buildup of TG [3]. The activation of these transcription factors increases the expression of important genes involved in fat metabolism and adipocyte function, including genes such as fatty acid synthase (FAS), fatty acid binding protein 4 (FABP4), and adipose TG lipase [4]. Moreover, obesity is caused by preadipocyte differentiation and adipogenesis, and adipocytes secrete various adipokines, which can affect insulin sensitivity and glucose regulation [5,6].
Obesity can contribute to various diseases, such as type 2 diabetes, non-alcoholic fatty liver disease (NAFLD), hypertension, and cancer [7,8]. The primary risk factor leading to these complications is often associated with insulin resistance (IR) [9]. IR increases blood glucose levels, mediating various metabolic disorders and resulting in complications related to these metabolic conditions [10]. Obesity induced by a high-fat diet (HFD) leads to an excessive or abnormal accumulation of lipids in adipose tissue, resulting in increases in lipid metabolism parameters such as total cholesterol (TC) and TG. Such changes lead to inflammation due to the elevation of factors such as inflammatory cytokines [11]. Currently, there are several types of medication for obesity treatment, including orlistat, lorcaserin, and liraglutide [12]. However, medication may result in various physiological side effects, digestive problems, constipation, and diarrhea [13]. According to recent studies, the consumption of lactic acid bacteria (LAB) in mice induced with obesity through HFD has been reported to have anti-obesity effects by suppressing hepatic fat accumulation and regulating genes related to fat synthesis in adipose tissue [14]. Based on this, research and development are needed to identify natural products with reduced side effects for safer prevention and treatment.
Figs are fruits belonging to the Moraceae family and grow widely in the European Mediterranean region and the Middle East [15]. Figs contain dietary carbohydrates, anthocyanins, and phytosterols [16,17]. With these active substances, figs are considered functional foods with excellent pharmacological activity, attracting a lot of attention due to their various biological activities, such as hyperglycemia, antioxidant, anti-cancer, anti-tumor, neuroprotective, anti-inflammatory, and anti-viral activities [16,18,19,20,21].
Probiotics are microorganisms that benefit health when consumed in appropriate amounts. Several studies are being conducted on the anti-obesity, cholesterol control, and anti-cancer effects of probiotics [22,23,24]. Many probiotics that have been reported to have anti-obesity effects belong to the Lactobacillus genus [25]. Lactobacillus plantarum (L. plantarum) has been receiving significant attention for a long time as it is recognized as safe for use in food [26]. L. plantarum is a commonly reported probiotic that can exert a variety of benefits, such as reducing the serum cholesterol level and regulating the immune system in an HFD-induced mouse model [27,28]. Also, various studies have demonstrated the anti-obesity effect of probiotics, which vary depending on the strain [29].
Fermentation refers to the anaerobic metabolism of substrates through the action of enzymes or microorganisms, resulting in the production of various functional substances [30]. Nutrients are contained in the raw materials, which are known to contribute not only to taste and flavor but also to enhancing the beneficial functional effects of food [31,32]. Fresh figs are among the most perishable fruits and, depending on conditions can remain in a palatable state for about two days in ambient conditions and for 1–2 weeks under refrigeration (2–4 °C) [33]. The effect of figs fermented with lactic acid bacteria has been demonstrated in various studies [34,35,36]. Additionally, the anti-obesity and antidiabetic effects of foods fermented with L. plantarum have been confirmed in various studies [37,38,39,40]. Therefore, in this study, we aimed to assess the positive effects of fermented figs using L. plantarum BT-LP-01, which was isolated and identified from fig peels, on mice fed an HFD diet as a model of obesity and diabetes.

2. Materials and Methods

2.1. Preparation of Samples

2.1.1. Non-Fermented Fig Preparation

Figs were obtained from Slow Famer (Yeongam-gun, Republic of Korea). Figs were freeze-dried into powder and then extracted for 24 h two times in a mixture of 70% ethanol at a ratio of 10:1. The extract was filtered using filter paper (NO. 6, ADVANTEC, Tokyo, Japan) and concentrated under reduced pressure in a rotary evaporator (N-1000, EYELA, Tokyo, Japan), freeze-dried, and stored at −80 °C until use.

2.1.2. Fermented Fig Preparation

L. plantarum BT-LP-01, used for fermentation, was isolated from fig peels. Strain samples were cultured at 37 °C in MRS broth, and the fig puree was mixed with the culture solution and fermented at 37 °C for 8 h. The cultured figs were collected, freeze-dried into powder, and then extracted for 24 h two times in a mixture of 70% ethanol at a ratio of 10:1. The extract was filtered using filter paper (NO. 6, ADVANTEC, Tokyo, Japan) and concentrated under reduced pressure in a rotary evaporator (N-1000, EYELA, Tokyo, Japan), freeze-dried, and stored at −80 °C until use.

2.2. Determination of Antioxidant Capacity

2.2.1. DPPH Radical Scavenging Assay

After mixing 200 μL of a 0.2 mM 2,2-diphenyl-1-picryl-hydrazyl (DPPH, Sigma-Alrich Co., Ltd., St. Louis, MO, USA) solution with 50 μL of FF, the mixture was allowed to incubate at room temperature for 30 min, and the absorbance was measured at 517 nm. L-ascorbic acid (Sigma-Aldrich Co., Ltd., St. Louis, MO, USA) was used as the control. DPPH radical scavenging was measured with the following formula:
DPPH radical scavenging (%) = {1 − (Sample absorbance − Sample blank absorbance)/Control absorbance} × 100

2.2.2. ABTS Radical Scavenging Assay

After mixing 7.4 mM 2,2′-azino-bis (3-ethylbenzothiazoline-6-sulfonic acid) diammonium salt (ABTS, Sigma-Aldrich Co., Ltd., St. Louis, MO, USA) with 2.6 mM potassium persulfate (Sigma-Aldrich Co., Ltd., St. Louis, MO, USA) at a 1:1 ratio, the solution was stored for 24 h to generate radicals prior to the experiment, and the solution was diluted with distilled water (DW) to achieve absorbance. Then, 50 μL of each concentration of FF and 200 μL of diluted ABTS solution were added and allowed to incubate for 10 min, followed by an absorbance measurement at 760 nm. L-ascorbic acid (Sigma-Aldrich Co., Ltd., St. Louis, MO, USA) was used as the control. ABTS radical scavenging was measured with the following formula:
ABTS radical scavenging (%) = {1 − (Sample absorbance − Sample blank absorbance)/Control absorbance} × 100

2.3. Total Phenol Content Analysis

After adding 20 μL of FF and 80 μL of DW to a 96-well plate, 40 μL of Folin–Ciocalteu’s phenol reagent (Sigma-Aldrich Co., Ltd., St. Louis, MO, USA) was added, and the mixture was incubated at room temperature for 3 min. After adding 10 μL of NA2CO3, the mixture was incubated at room temperature for 2 h, and the absorbance was measured at 725 nm. A standard solution was prepared using gallic acid (DAEJUNG CHEMICALS & METAL Co., Ltd., Siheung-si, Republic of Korea) to construct a standard curve and determine the polyphenol content.

2.4. Total Flavonoid Content Analysis

After adding 20 μL of 10% aluminum nitrite (DAEJUNG CHEMICALS & METAL Co., Ltd., Siheung-si, Republic of Korea) and 100 μL of the sample, followed by 860 μL of methanol, the mixture was incubated for 30 min, and the absorbance was measured at 415 nm. A standard solution of kaempferol (Sigma-Aldrich Co., Ltd., St. Louis, MO, USA) diluted in DMSO was used to construct a standard curve and determine the flavonoid content.

2.5. Animals and Experimental Design

Male ICR mice (27–29 g of 4 weeks old) were purchased from Damool science (Daejeon, Republic of Korea) and were housed under a 12 h light–dark cycle with a temperature range of 22–24 °C and humidity of 50–60%. The mice had a one-week period to acclimate to the environment before being used in experiments. The mice were divided into six groups (n = 8).
  • Normal-Fat Diet group (NFD): Standard diet (10% kcal fat diet, D12450B, research Diets, New Brunswick, NJ, USA) + D·W
  • High-Fat Diet group (HFD): High-fat diet (60% kcal fat diet, D12492, research Diets, New Brunswick, NJ, USA) + D·W
  • Green tea extract group (GTE): High-fat diet (60% kcal fat diet, D12492, research Diets, New Brunswick, NJ, USA) + green tea extract 50 mg/kg
  • Fermented fig 50 mg/kg group (FF 50): High-fat diet (60% kcal fat diet, D12492, research Diets, New Brunswick, NJ, USA) + fermented fig 50 mg/kg
  • Fermented fig 125 mg/kg group (FF 125): High-fat diet (60% kcal fat diet, D12492, research Diets, New Brunswick, NJ, USA) + fermented fig 125 mg/kg
  • Fermented fig 250 mg/kg group (FF 250): High-fat diet (60% kcal fat diet, D12492, research Diets, New Brunswick, NJ, USA) + fermented fig 250 mg/kg
Each diet’s composition is represented in Table 1. Body weight and food intake changes were recorded once a week for eight weeks. We evaluated the food efficiency ratio (FER) calculated as the ratio of weight gain to dietary intake over the eight weeks (FER = body weight gain/food intake). The animal experiments were approved by the Institutional Animal Experimentation Ethics Committee of the Jeonbuk National University Animal Care and Use Committee (Approval Number: 2023-051).

2.6. Measure of Fasting Blood Glucose and IPGTT

The fasting blood glucose and intraperitoneal glucose tolerance test (IPGTT) was assessed after a 12 h fast. Fasting blood glucose levels were measured at four and eight weeks, and IPGTT was measured at eight weeks of the experiment. The fasting blood glucose levels and IPGTT were measured by collecting blood from the tail vein. IPGTT levels were measured at 0, 30, 60, 90, and 120 min after i.p. administration of glucose at 2 g/kg (Sigma Aldrich Co., Ltd., St. Louis, MO, USA). Both analyses were carried out using a blood glucose meter (Accu-Check, Roche Diabetes Care GmbH, Mannheim, Germany). The measured area under the curve (AUC) was used as a trapezoidal approximation of blood glucose. Blood glucose at x min is defined as BG(x), and AUC was calculated as the following formula:
AUC (mg ∗ h/Dl) = {BG (0) + BG (30)}/2 + {BG (30) + BG (60)}/2 + {BG (60) + BG (90)}/2 + {BG (90) + BG (120)}/2

2.7. Blood Biochemical Analysis

After eight weeks of administration, the mice were anesthetized using isoflurane (Hana Pharm. Co., Ltd., Hwaseong, Republic of Korea). Blood samples were collected from the abdominal vein and then centrifuged at 800× g for 15 min to obtain serum samples, which were stored frozen at −80 °C until the biochemical analysis. An automatic chemical analyzer (VetTest 8008, IDEXX Laboratory, Westbrook, MI, USA) was employed for the analysis of serum alanine transaminase (ALT) and aspartate transaminase (AST). The serum low-density lipoprotein (LDL) and high-density lipoprotein (HDL) concentrations were analyzed using the PicoSensTM HDL, LDL/VLDL Assay kit (BM-CDL-100, Biomax, Guri, Republic of Korea). The serum TC concentration was analyzed using the PicoSensTM Total Cholesterol Assay kit (BM-CHO-100, Biomax, Guri, Republic of Korea), the serum TG concentration was analyzed using the PicoSensTM Triglyceride Assay kit (BM-TGR-100, Biomax, Guri, Republic of Korea), the serum insulin concentration was analyzed using the Mouse Insulin ELISA kit (80-INSMS-E01, ALPCO, Salem, NH, USA), and the serum C-P concentration was analyzed using the Mouse C-P ELISA kit (MBS2508536, MyBioSource, San Diego, CA, USA). All experiments were conducted in accordance with the manufacturer’s protocol.

2.8. Histopathological

After blood collection, euthanasia was confirmed by cessation of heart and breath activity in the mice, and a portion of the liver tissue was extracted. These liver tissues were fixed in 4% paraformaldehyde for 24 h at room temperature. The fixed tissues were processed through the paraffin embedding procedure, and 5-μm-thick sections were prepared and mounted on glass slides. The sectioned tissues were stained with hematoxylin and eosin (H&E) and imaged at high power (×400) using a light microscope (Zeiss, Jena, Germany). Liver steatosis was scored according to the methods of Bedossa et al. [41] as follows: 0, No hepatocytes affected; 0.5, Slight damage (0–5%); 1, Mild damage (5–20%); 2, Moderate damage (20–50%); 3, Severe damage (>50%).

2.9. Western Blot Analysis

The collected mouse liver samples were washed three times with phosphate-buffered saline (PBS). Protein extraction was carried out for 1 h using a RIPA buffer (GenDEPOT, Katy, TX, USA) and a duo inhibitor cocktail (GenDEPOT, Katy, TX, USA). The sample was centrifuged at 15,000× g for 20 min, and the protein concentration was determined using a bicinchoninic acid (BCA) reagent. The proteins were electrophoresed on a 10% sodium dodecyl sulfate-polyacrylamide gel after heat treatment at 100 °C for 5 min. After loading, the proteins were transferred onto a polyvinylidene difluoride membrane (PVDF, 182989A 10, Bio-Rad, Hercules, CA, USA) and blocked with 5% skimmed milk for 1 h at room temperature. After blocking, the membranes were incubated overnight at 4 °C with primary antibodies (IL-6, IL-1β, iNOS, ACC, p-ACC, C/EBPα, FABP4, FAS, and β-actin, Cell Signaling, Beverly, MA, USA) in 5% skimmed milk. The primary antibodies were diluted to 1:1000 in 5% skimmed milk. Then, the samples were washed three times with PBS-T and incubated with a secondary antibody (goat anti-mouse or anti-rabbit HRP-conjugated IgG, GenDEPOT, Katy, TX, USA) and diluted to 1:2000 in 5% skimmed milk at room temperature for 1 h. Membranes were detected using the SuperSignal West Dura Extended Duration Substrate (Thermo Fisher Scientific, Waltham, MA, USA) and visualized with a WSE-6200 luminograph II (ATTO, Tokyo, Japan). All Western blot data were quantified by Image J software version 1.54j (NIH Iage, Bethesda, MD, USA).

2.10. Statistical Analysis

All data were statistically analyzed using GraphPad Prism Software version 5.0 (GraphPad Software, San Diego, CA, USA). The experimental results are presented as the mean ± SEM (n = 8). The significance assessment between experimental groups was carried out using a one-way analysis of variance (ANOVA) and Tukey’s multiple range test, and significance was considered at p < 0.05.

3. Results

3.1. Effects of FF on Antioxidant

In this study, we compared the antioxidant effects of Fig and FF by measuring the DPPH radical scavenging activity, ABTS radical scavenging activity, TP, and TF (Figure 1). The results of the DPPH radical scavenging activity measurements showed a dose-dependent increase from 46.9% (1 mg/mL) to 76.2 (20 mg/mL) for Fig and from 49.1 (1 mg/mL) to 82.6% (20 mg/mL) for FF. Additionally, the results of the ABTS radical scavenging activity measurements indicated a dose-dependent increase from 15.9% (1 mg/mL) to 78.3 (20 mg/mL) for Fig and from 18.5% (1 mg/mL) to 94.0 (20 mg/mL) for FF. The TP results showed a dose-dependent increase from 14.8 μg ± 0.4 GAE/g (1 mg/mL) to 230.4 ± 3.6 μg GAE/g (20 mg/mL) for Fig and from 43.8 μg ± 1.1 GAE/g (1 mg/mL) to 465.3 ± 6.9 μg GAE/g (20 mg/mL) for FF. The TF results showed a dose-dependent increase from 0.72 μg ± 0.01 KFE/g (1 mg/mL) to 9.62 ± 0.02 μg KFE/g (20 mg/mL) for Fig and from 1.78 μg ± 0.02 KFE/g (1 mg/mL) to 18.62 ± 0.04 μg KFE/g (20 mg/mL) (Figure 1) for FF. This study demonstrates that FF exhibits superior antioxidant effects compared to Fig.

3.2. Effects of FF on Body Weight and Food Intake

In this study, we investigated the effect of dietary fat content on body weight gain and dietary efficiency in mice over an eight-week period. Body weight changes and food intake were measured to assess these effects (Table 2). Our results indicate that, after eight weeks, mice on the HFD exhibited significant weight gain compared to those on the NFD. A daily weight gain of 1.99 ± 0.15 g/day was observed in the NFD group, whereas the HFD group showed a significant increase of 4.02 ± 0.18 g/day (p < 0.05). Additionally, administration with FF led to a dose-dependent reduction in body weight gain, particularly in the FF 250 group, which showed a significant decrease to 2.89 ± 0.24 g/day. Evaluation of the food efficiency ratio (FER) revealed a significant increase in HFD-consumption groups compared to the NFD group. Significantly, administration with FF 250 resulted in a significant decrease in FER compared to the HFD group. These findings indicate the potential of FF to reduce obesity by reducing weight gain compared to dietary fat intake alone [42].

3.3. Effect of FF on Macroscopic Aspects and Organ Weight

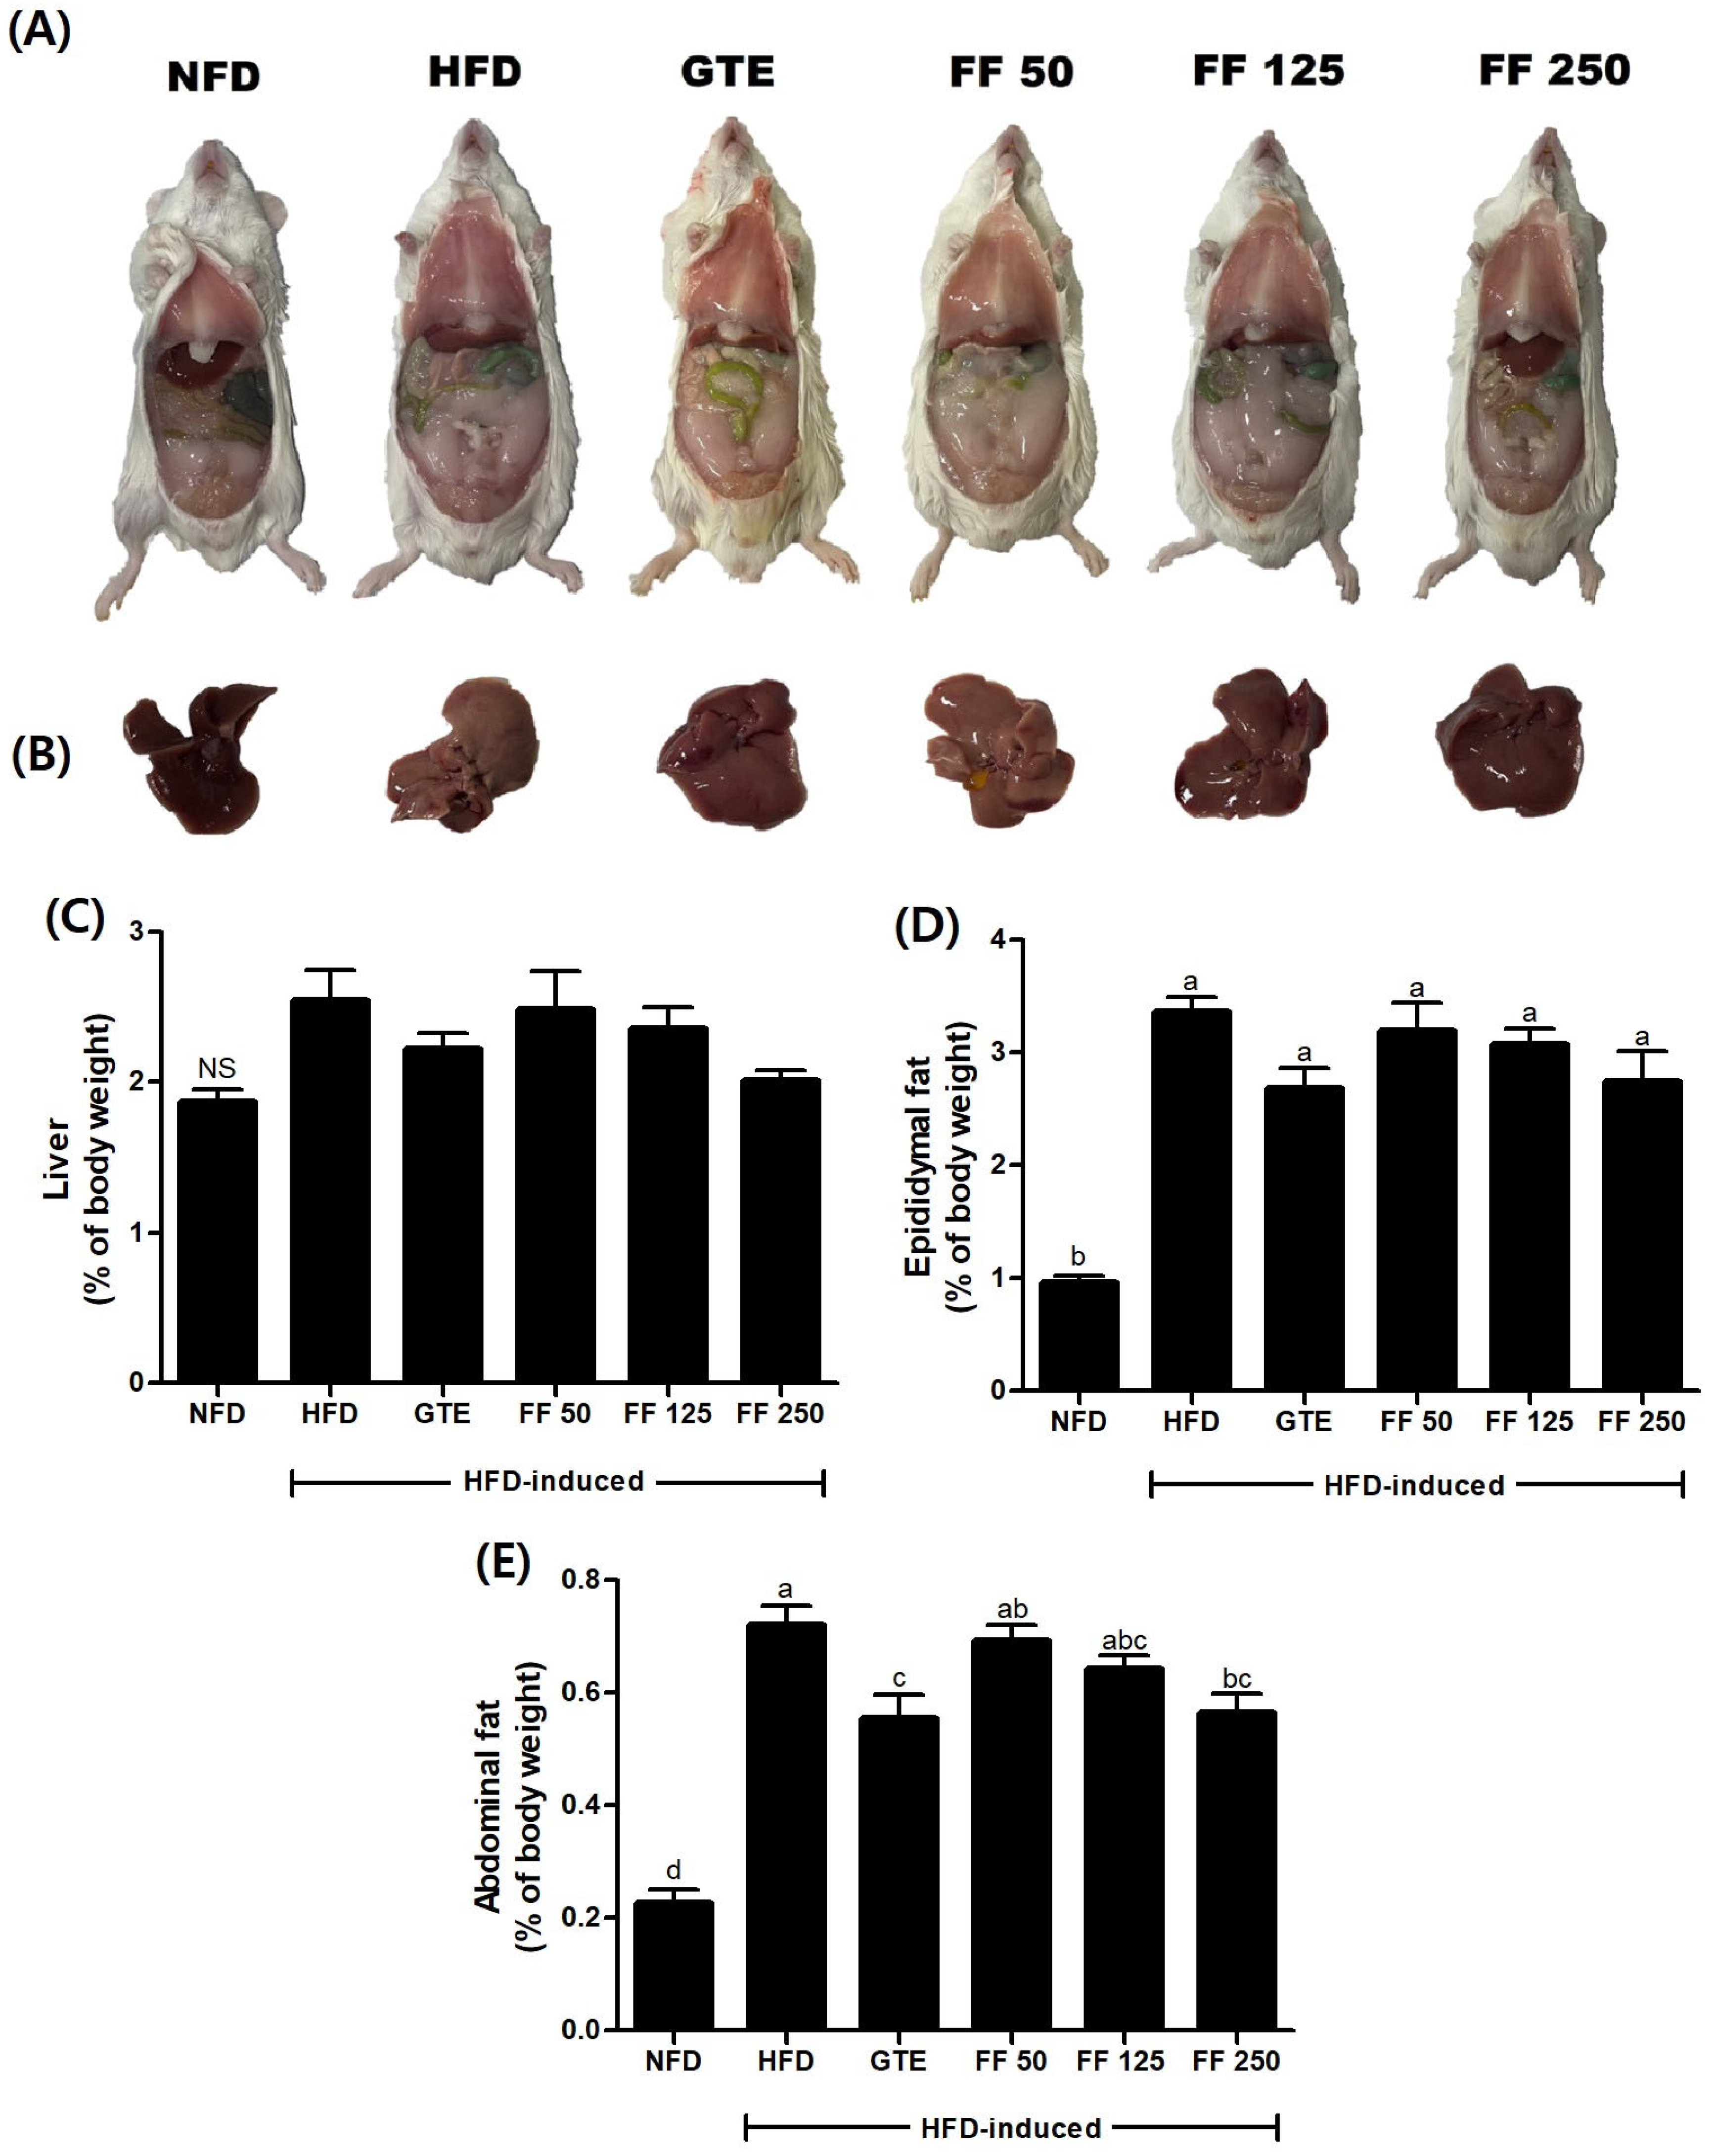
After eight weeks of administration, the assessment of abdominal fat and liver macroscopic aspects (Figure 2B) and measurement of changes in tissue weight due to FF were conducted (Figure 2C–E) in the mice. Substantial abdominal fat accumulation was observed in mice fed the HFD, with a dose-dependent reduction observed in FF-administered groups (Figure 2A). Livers of mice on the HFD exhibited a pale appearance (Figure 2B); although there was no significant increase in all HFD groups compared with the NFD group, a dose-dependent decrease was observed in FF-administered groups (Figure 2D). Similarly, abdominal fat weight showed a significant increase in all HFD-fed groups, with a notable decrease observed in the GTE and FF 250 group (Figure 2E), decreasing to 1.08 ± 0.04% and 1.16 ± 0.03%, respectively. Overall, these findings suggest that an HFD induced significant abdominal fat accumulation. FF administration showed the potential to attenuate this effect, although further investigation is needed to explain the underlying mechanism.

3.4. Effects of FF on Fasting Blood Glucose Levels

We investigated the effects of FF on fasting blood glucose regulation in mice fed HFDs, where fasting blood glucose levels were measured at four and eight weeks of the experiment (Table 3). At four weeks, fasting blood glucose levels significantly increased in the HFD group compared to the NFD (p < 0.05). Similarly, at eight weeks, a significant increase in fasting blood glucose was noted from 80.4 ± 5.8 mg/dL in the NFD group to 124.4 ± 3.4 mg/dL in the HFD group (p < 0.05). Compared to the HFD group, the GTE group showed significant differences, with fasting blood glucose levels measured at 90.2 ± 4.2 mg/dL and 96.3 ± 4.8 mg/dL at four and eight weeks, respectively. Furthermore, the FF 125 and 250 groups exhibited significant reductions in fasting blood glucose levels compared to the HFD group (p < 0.05). Specifically, at four weeks, fasting blood glucose levels decreased to 98.2 ± 1.4 mg/dL and 96.4 ± 2.0 mg/dL in the FF 125 and FF 250 groups, respectively. Similarly, at eight weeks, significant reductions were observed, with fasting blood glucose levels of 114.2 ± 3.9 mg/dL and 104.4 ± 3.3 mg/dL in the FF 125 and FF 250 groups, respectively (Table 3).

3.5. Effects of FF on IPGTT and AUC

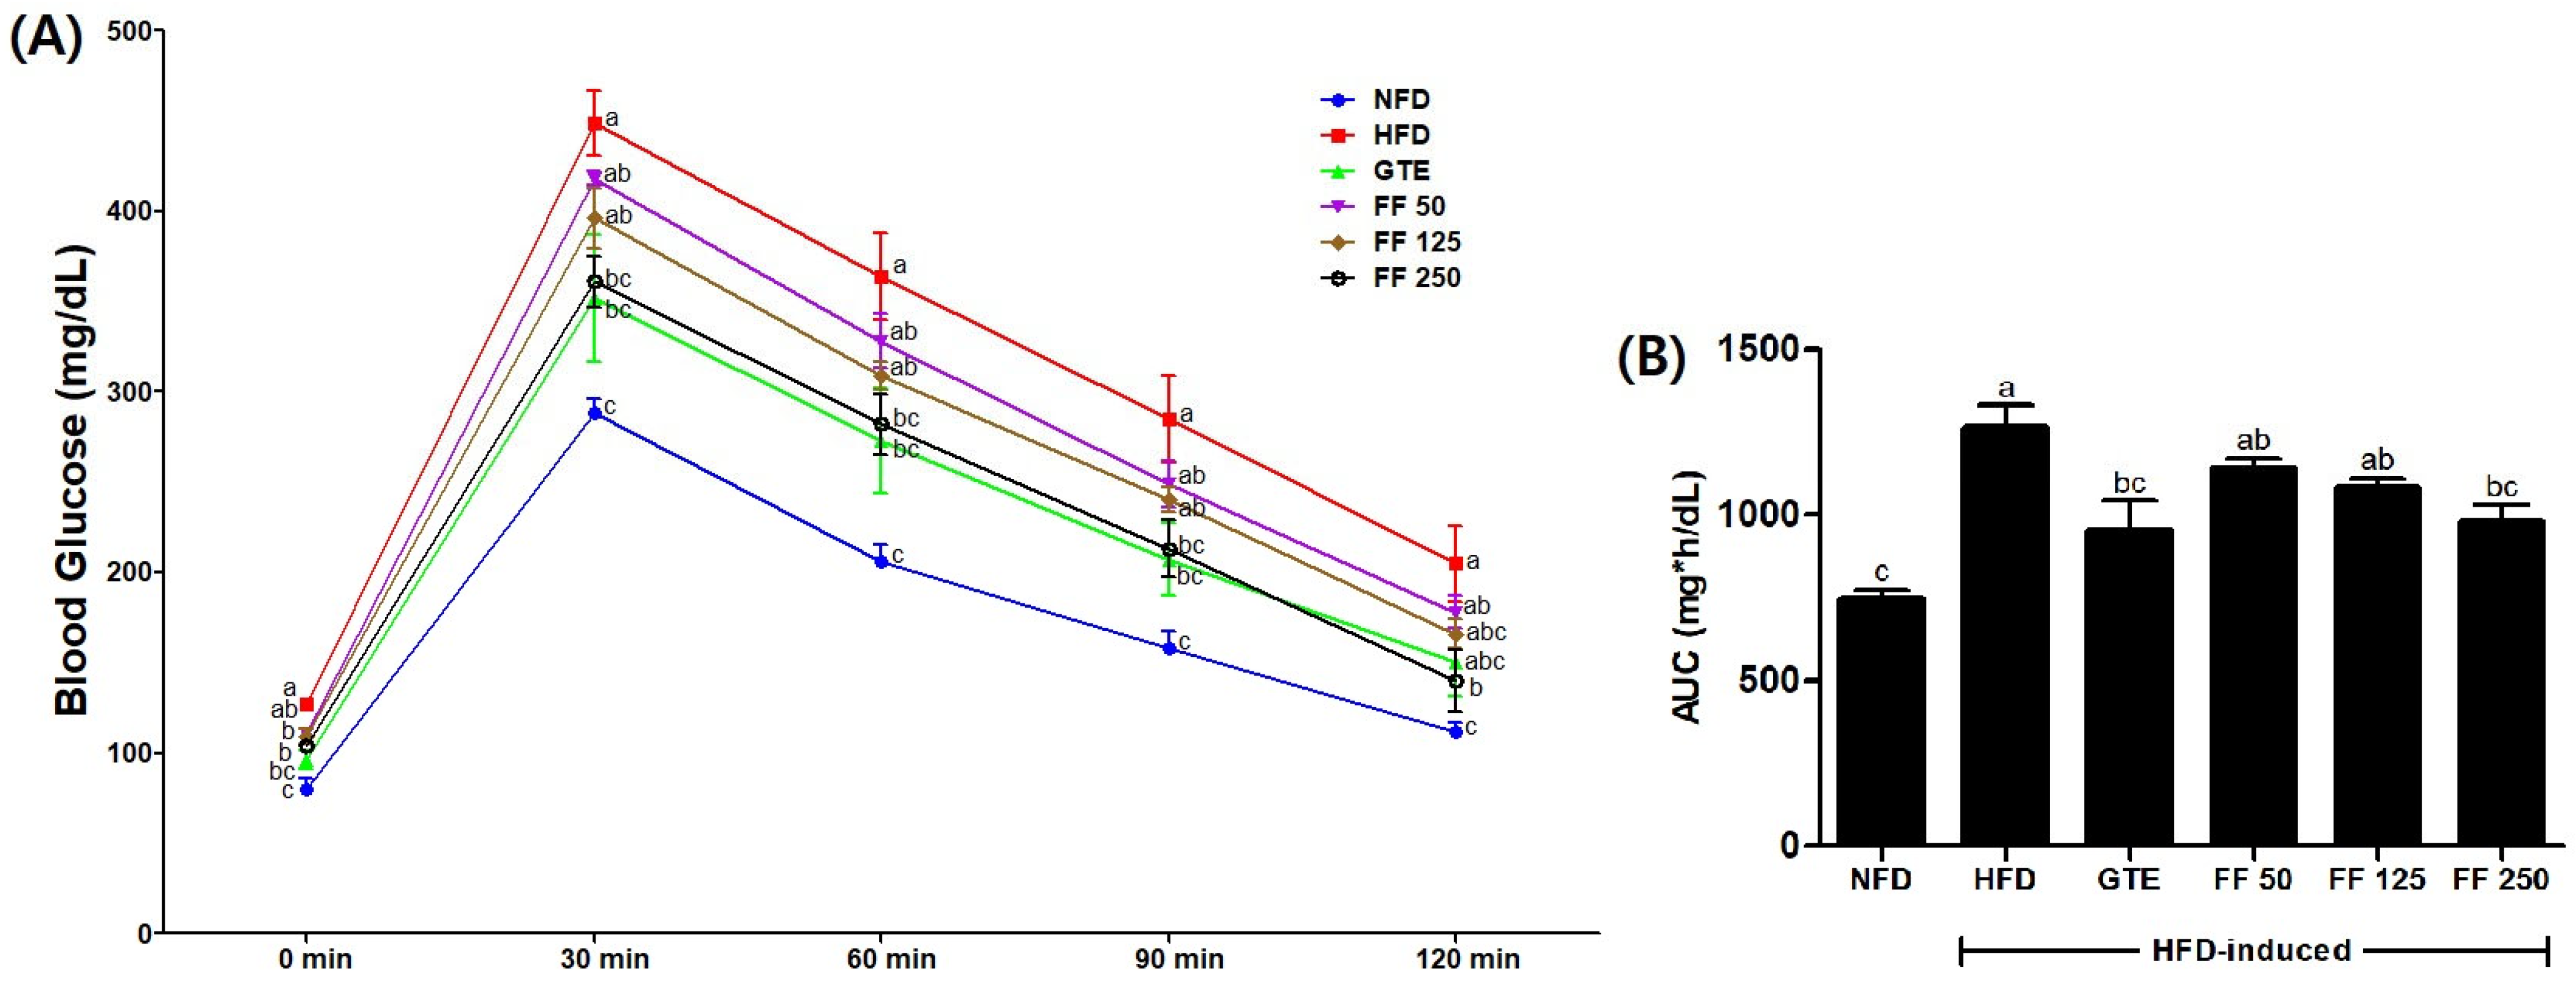
To assess glucose tolerance in each experimental group, IPGTT was measured at eight weeks. The results are presented as IPGTT change curves over time and an area under the curve (AUC) graph (Figure 3). According to the IPGTT results, a significant increase in blood glucose levels was observed in all groups 30 min after glucose injection (Figure 3A). The FF 250 group consistently exhibited significant differences compared with the HFD group throughout the test, with the GTE group showing significant differences at 30, 60, 90, and 120 min. Additionally, the FF group showed a dose-dependent difference from the HFD group across all time points, with the FF 250 group demonstrating significant differences in blood glucose levels throughout the test duration (Figure 3A). Analysis of the AUC graph for the IPGTT blood glucose curve revealed a dose-dependent decrease in the FF administration group. Furthermore, significant reductions were observed in the GTE and FF 250 groups compared to the HFD group (Figure 3B). These findings suggest that FF administration contributes to the improvement of blood glucose levels in HFD-induced obese mice.

3.6. Effects of FF on Histopathology and Steatosis Score

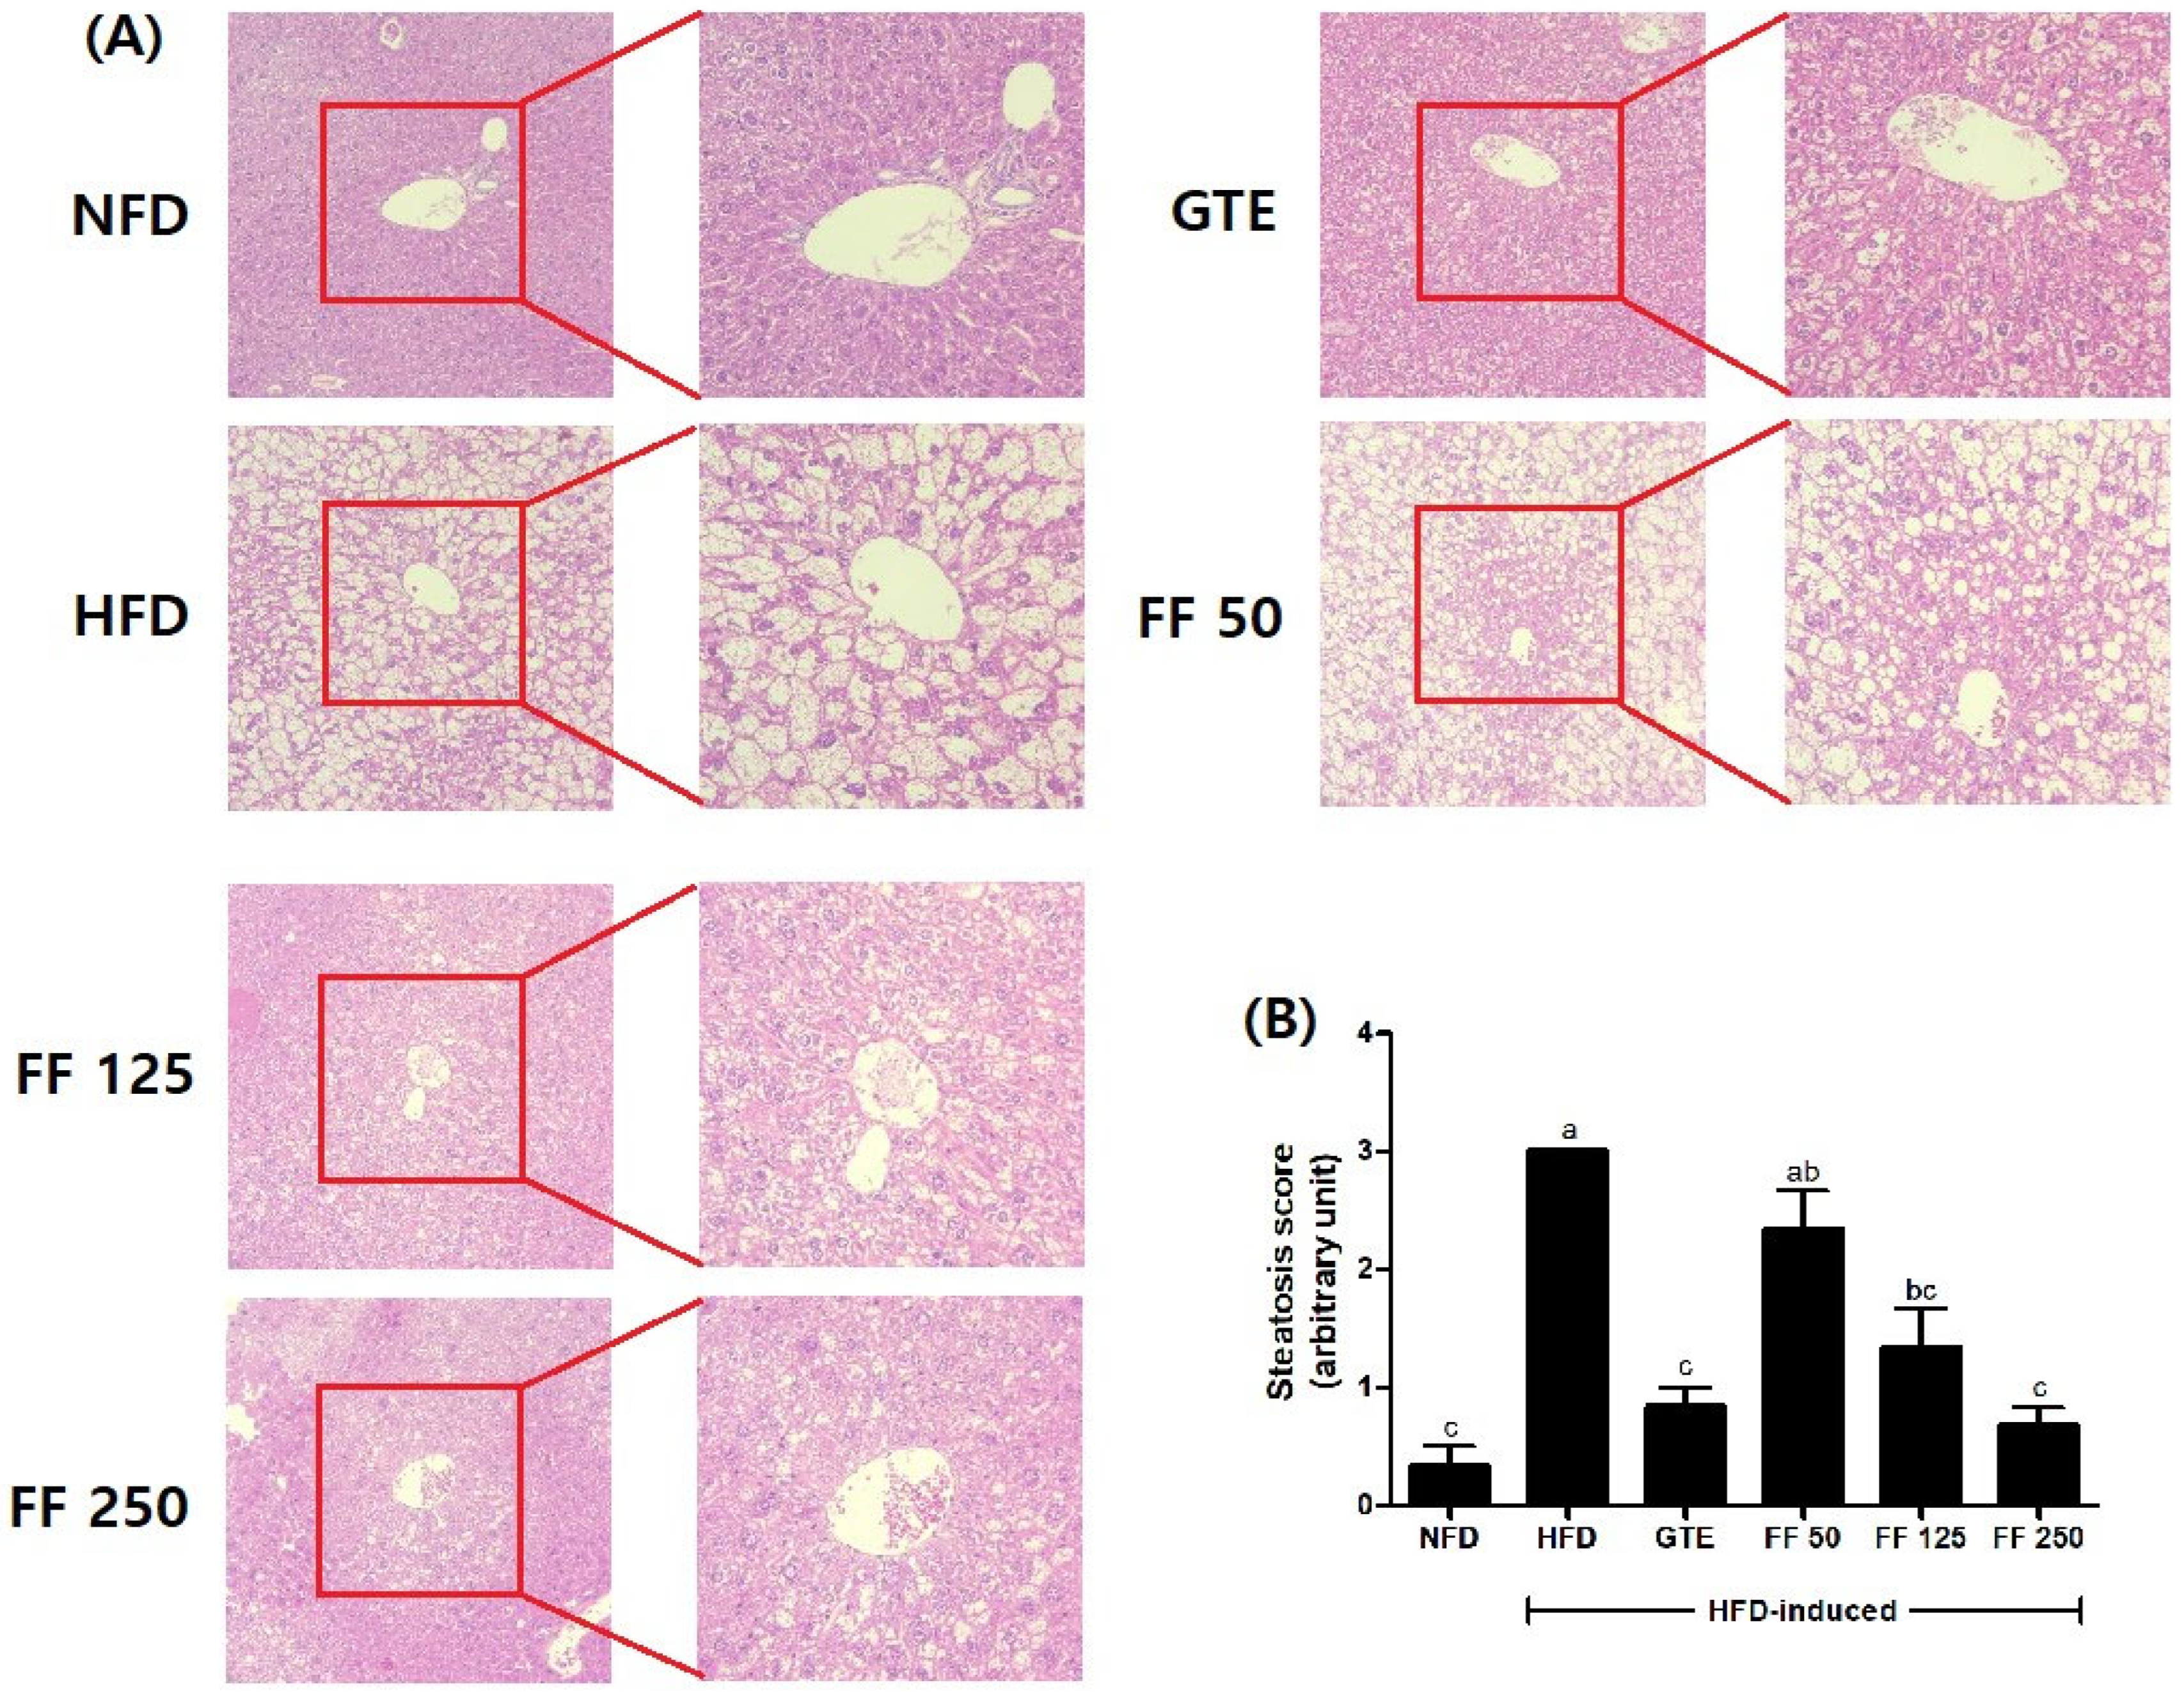
To histopathologically evaluate the effect of FF on liver tissue, samples were observed under a microscope following H&E staining (Figure 4). At eight weeks of the experiment period, lipid droplets were evident in all groups fed the HFD, indicating lipid accumulation. However, dose-dependent decreases in both the size and number of lipid droplets were observed in the FF administration groups. In particular, significant reductions were observed in the FF 250 and GTE groups (Figure 4A,B). Compared to the HFD group, FF 250 resulted in a reduction in both the size and quantity of lipid droplets, suggesting an ameliorative effect on lipid accumulation and potential therapeutic utility in metabolic diseases.

3.7. Effects of FF on Serum C-P, Insulin, and Glucose Levels

Serum C-P, insulin, and glucose levels were assessed to investigate the improvement of IR in HFD-induced obese mice. Serum C-P levels in the HFD group exhibited a significant increase to 5.51 ± 0.62 ng/mL compared to the NFD group at 3.67 ± 0.10 ng/mL. Notably, significant decreases to 3.68 ± 0.13 ng/mL in the GTE group and to 3.81 ± 0.37 ng/mL in the FF 250 group were observed compared to the HFD group (Figure 5A). In addition, serum insulin levels in the HFD group showed a significant increase of 2.48 ± 0.33 ng/mL compared to the NFD group at 0.83 ± 0.09 ng/mL. However, the FF administration groups showed dose-dependent decreases to 1.83 ± 0.27 ng/mL (FF 50), 1.59 ± 0.33 ng/mL (FF 125), and 1.41 ± 0.28 ng/mL (FF 250) (Figure 5B). Moreover, the glucose concentration was significantly lower in the FF 250 group at 163.5 ± 6.5 mg/dL compared to the HFD group at 216.5 ± 12.1 mg/dL (Figure 5C). These findings indicate the potential of FF supplementation in improving IR in HFD-induced mice.

3.8. Effects of FF on Serum Lipid Metabolism

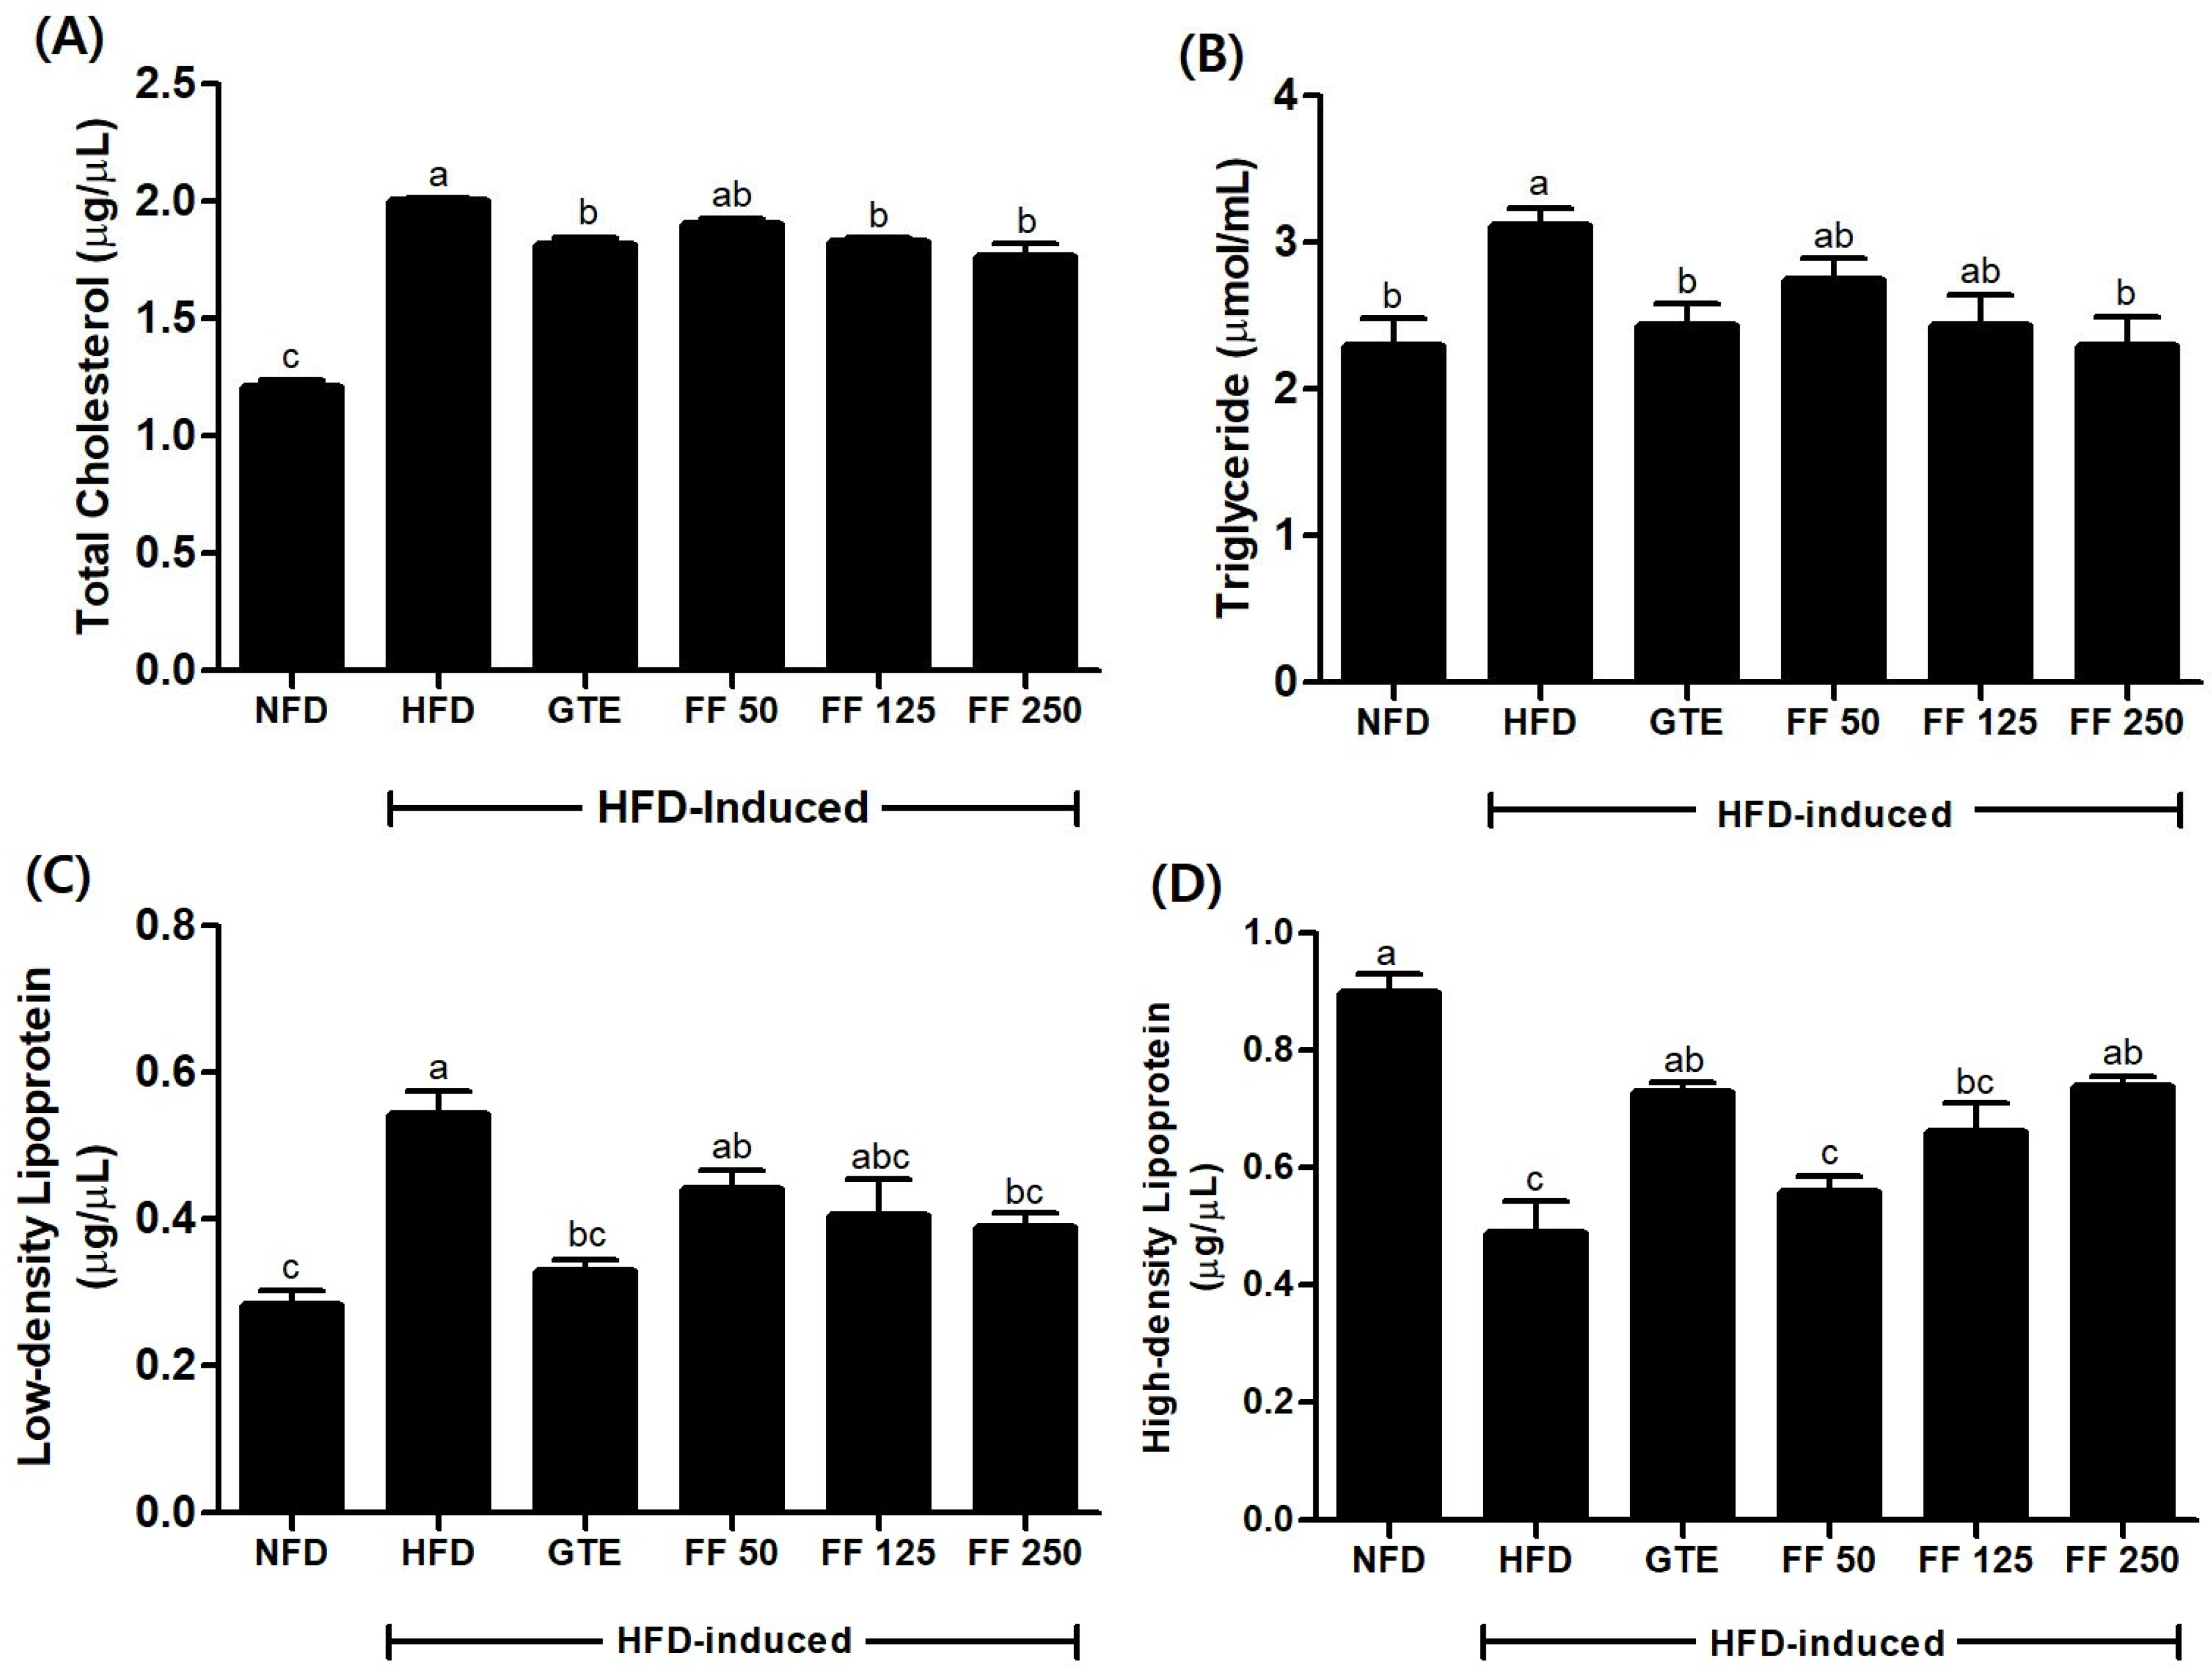
Consumption of HFD is widely recognized to contribute to elevated serum TC levels [43]. Moreover, increased visceral fat accumulation resulting from HFD consumption influences serum TG concentration, further exacerbating lipid metabolism disturbances [44]. In this study, serum TC and TG levels were significantly increased in the HFD group compared to the NFD group, with TC levels significantly increasing from 1.21 ± 0.06 μg/μL (NFD) to 2.00 ± 0.02 μg/μL (HFD). However, TC levels exhibited a decrease in the FF group, with values of 1.90 ± 0.04 μg/μL (FF 50), 1.82 ± 0.04 μg/μL (FF 125), and 1.77 ± 0.09 μg/μL (FF 250) (Figure 6A). The TG levels exhibited a significant increase from 2.29 ± 0.34 μg/μL (NFD) to 3.11± 0.21 μg/μL (HFD). However, a significant dose-dependent decrease was observed in the FF 250 group (2.29 ± 0.35 μg/μL) (Figure 6B). In the FF groups, LDL levels decreased in a dose-dependent manner to 0.44 ± 0.04 μg/μL (FF 50), 0.41 ± 0.07 μg/μL (FF 125), and 0.39 ± 0.03 μg/μL (FF 250) (Figure 6C). HDL levels showed a significant decrease in the HFD (0.49 ± 0.08 μg/μL) group compared to the NFD (0.90 ± 0.05 μg/μL) group. With FF, HDL levels increased in a dose-dependent manner to levels of 0.56 ± 0.04 μg/μL (FF 50), 0.66 ± 0.07 μg/μL (FF 125), and 0.74 ± 0.02 μg/μL (FF 250) (Figure 6D). These findings indicate the effectiveness of FF administration in improving lipid metabolism imbalances in the HFD-induced mice model.

3.9. Effects of FF on Liver Function

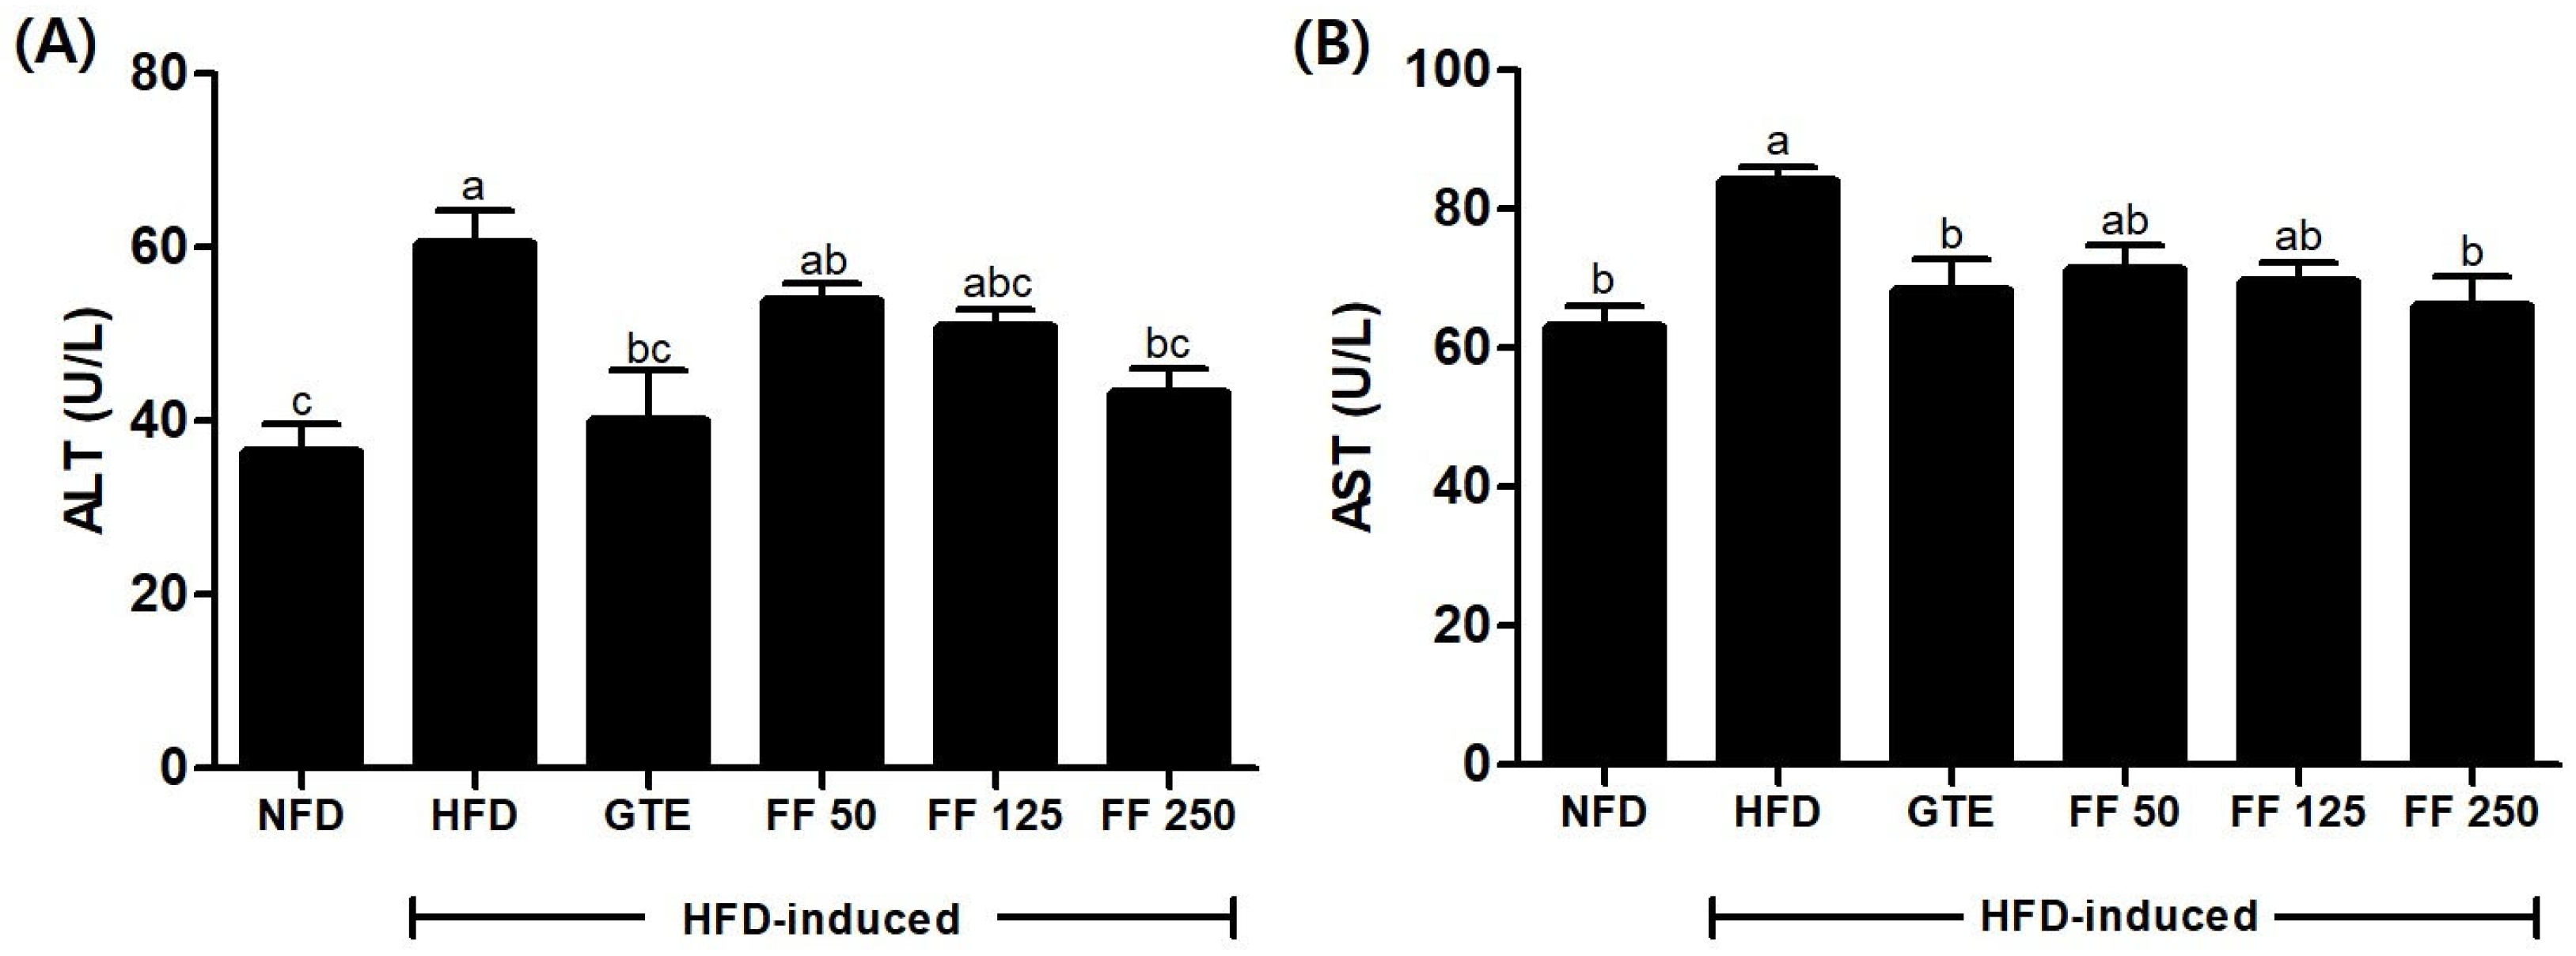
To assess liver function improvements due to FF, serum ALT and AST levels were measured in HFD-induced mice (Figure 7). Serum ALT levels showed a significant increase in the HFD group to 60.5 ± 7.6 U/L compared to the NFD (36.5 ± 6.2 U/L) group, with a dose-dependent decrease observed in the FF administration group. The GTE (40.0 ± 11.6 U/L) and FF 250 (43.3 ± 5.4 U/L) groups showed significant decreases compared to the HFD group (Figure 7A). Additionally, serum AST levels decreased in a dose-dependent manner with FF administration. The GTE and FF 250 groups showed significant decreases to 68.3 ± 8.9 U/L and 66.0 ± 8.5 U/L, respectively, compared to the HFD (84.0 ± 4.1 U/L) group (Figure 7B). These findings indicate the potential of FF to improve liver function in HFD-induced mice.

3.10. Effects of FF on Protein Expression

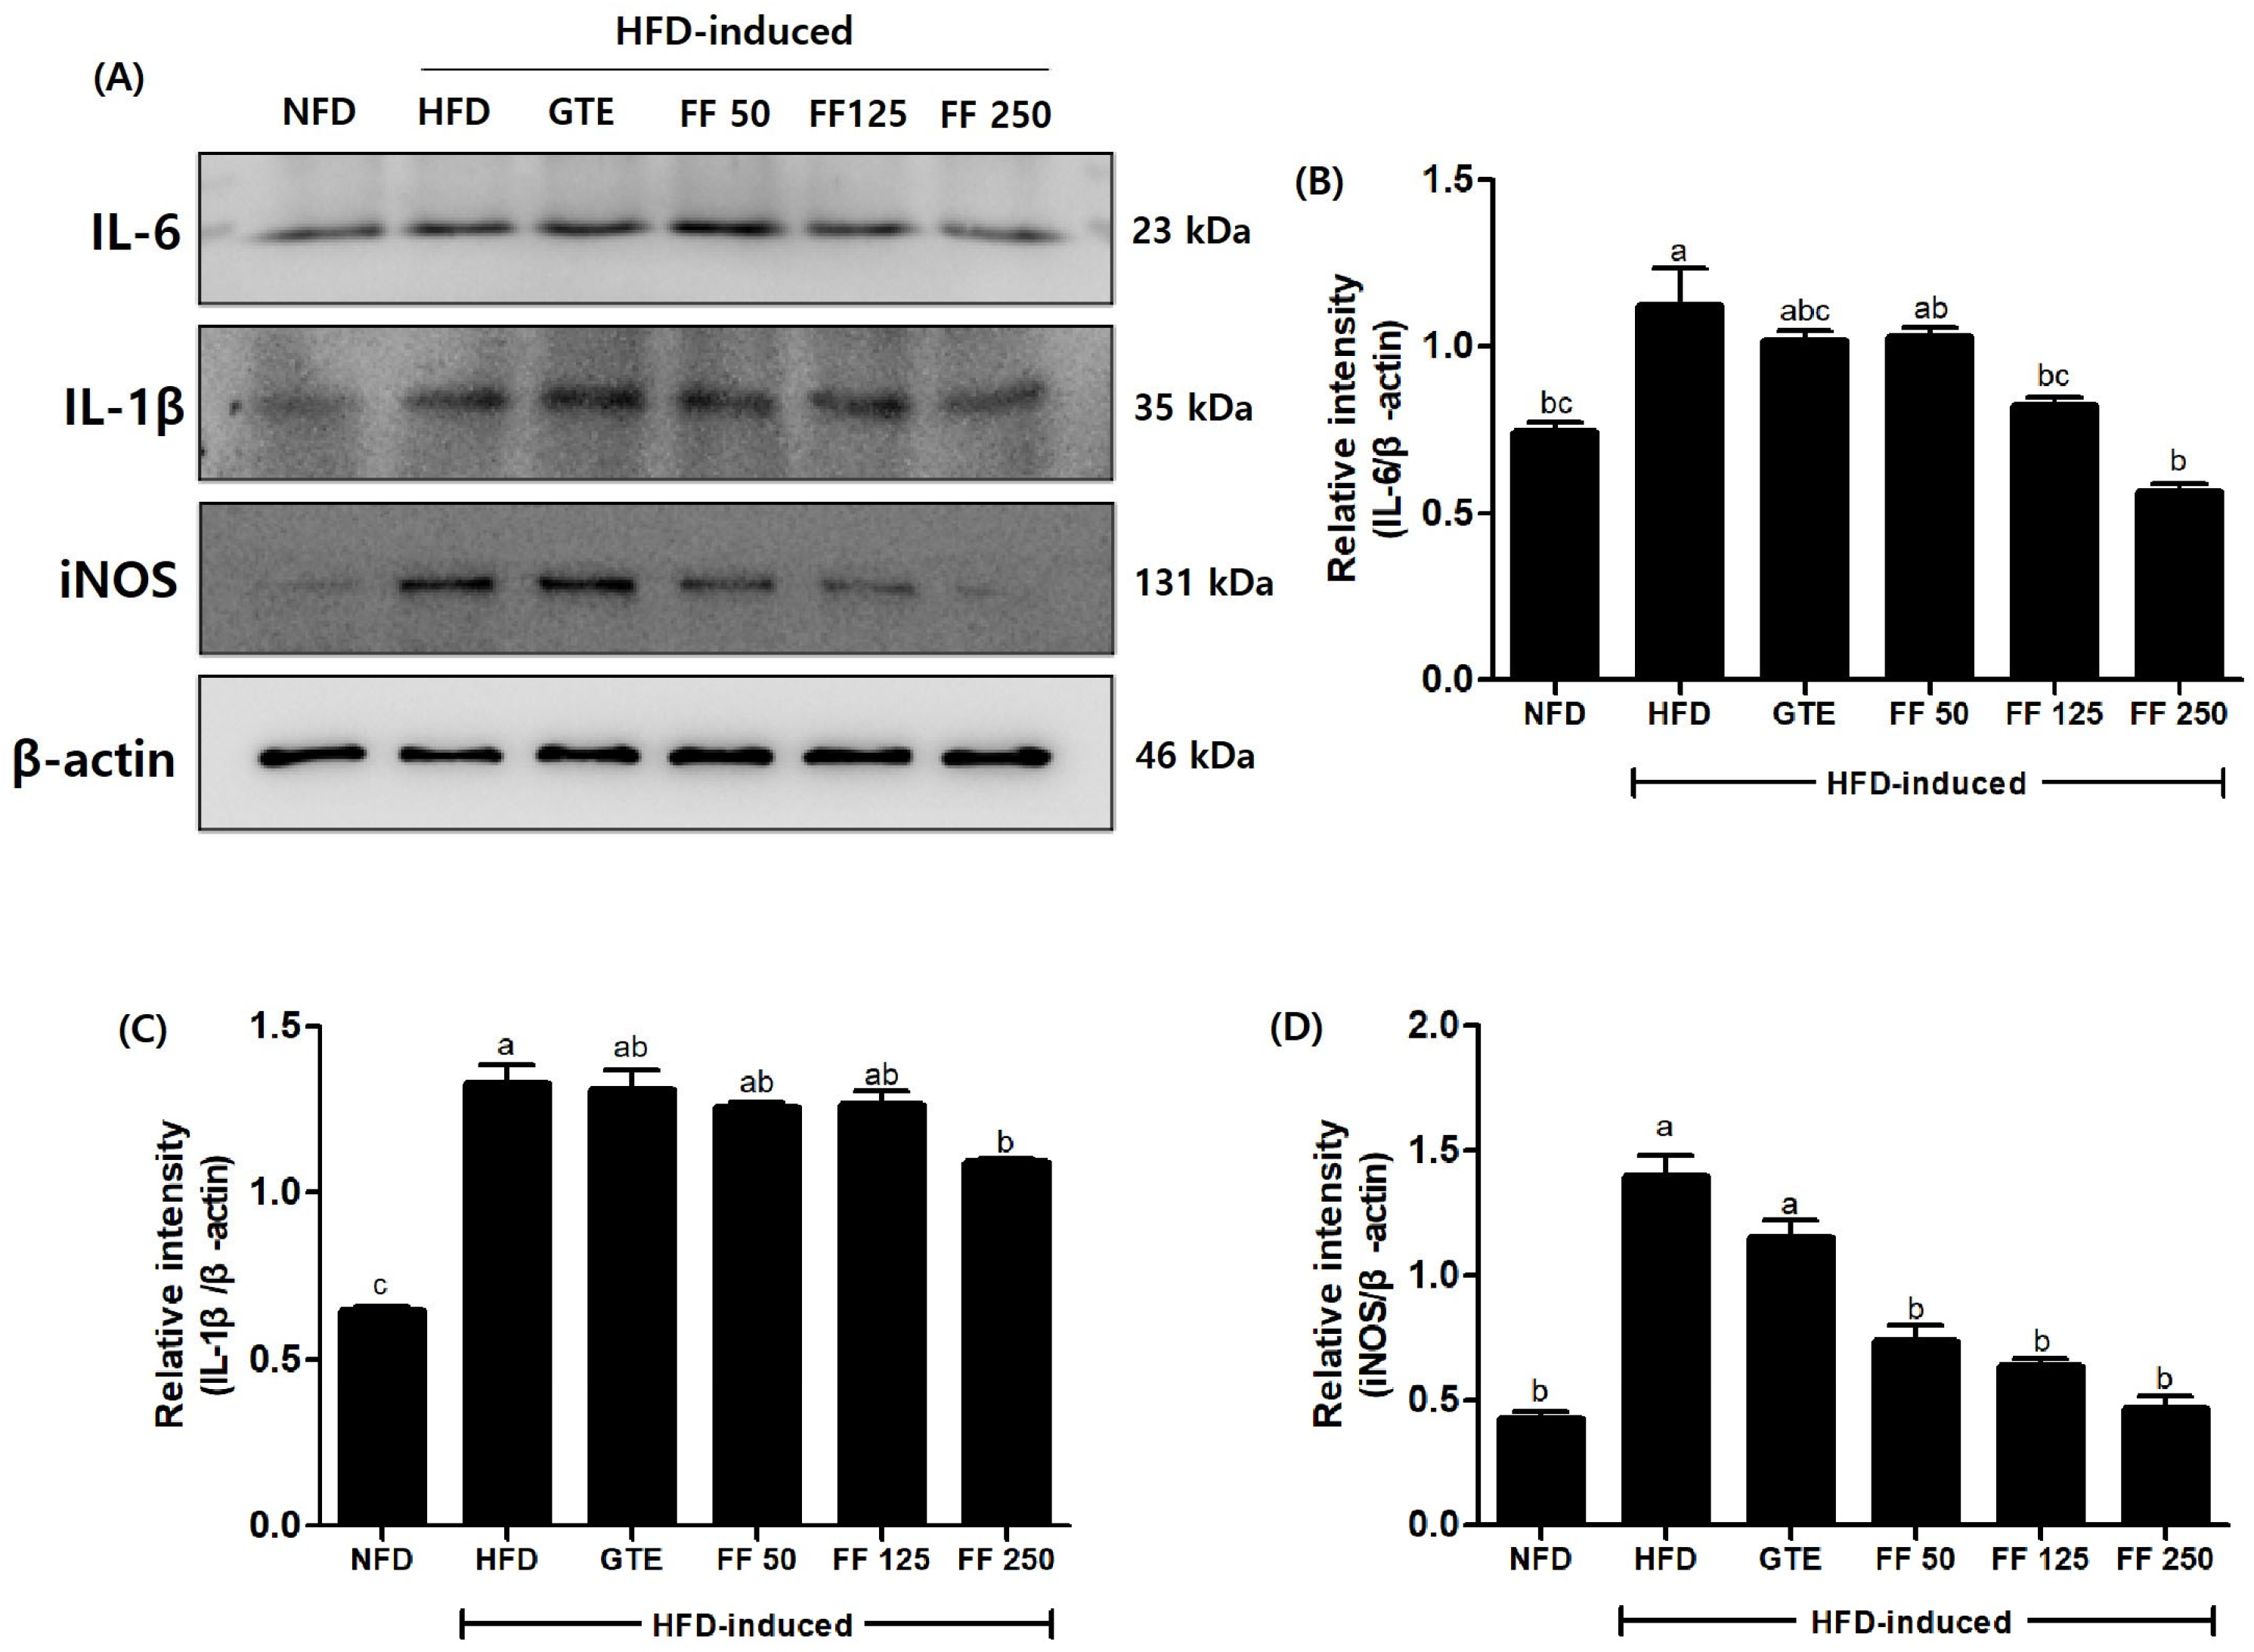
This study aimed to assess the impact of FF on inflammation and adipogenesis factors in the liver of HFD mice by performing a Western blot analysis (Figure 8 and Figure 9). Continuously administered HFD activates inflammation in liver tissue, leading to the release of various inflammatory cytokines, including IL-6 and IL-1β [45,46,47]. The HFD administration significantly increased the expression levels of IL-6, IL-1β, and iNOS by 51.8%, 105.9%, and 225.5% compared to NFD, respectively. IL-6 expression significantly decreased in the FF 125 (40.7%) and FF 250 (75.6%) groups compared to the HFD group, while IL-1β decreased by 11.2% (FF 50), 10.0% (FF 125), and 36.3% (FF 250) in the FF groups compared to the HFD group. The expression of iNOS decreased by 151.5% (FF 50), 176.4% (FF 125), and 216.1% (FF 250) in the FF groups compared to the HFD group (Figure 8).
The HFD administration resulted in increases of 105.9% (FAS), 66.3% (FABP4), and 32.8% (C/EBPα) compared to the NFD group, and ACC decreased by 72.85% in the HFD group. FAS decreased by 221.2% (FF 50), 206.3% (FF 125), and 238.9% (FF 250) compared to the HFD group. FABP4 exhibited dose-dependent decreases of 108.6% (FF 50), 111.9% (FF 125), and 116.2% (FF 250) compared to the HFD group. Additionally, C/EBPα showed a significant decrease in the FF 250 group (68.17%) compared to the HFD group. ACC showed increases of 25.9% (FF 50), 19.4% (FF 125), and 47.5% (FF 250) compared to the HFD group (Figure 9). These findings indicate liver damage induced by HFD, demonstrating the anti-inflammatory effects of FF in HFD-induced obese mice and suggesting that FF reduces lipid synthesis inhibition and adipogenesis expression.

4. Discussion

Obesity is the result of excessive weight gain due to an imbalance between energy intake and expenditure [48]. Obesity is mainly caused by HFD and has characteristics such as weight gain, lipid accumulation, elevated blood lipids, and inflammation, along with the closely associated increasing prevalence of type 2 diabetes [49,50,51]. About 90% of type 2 diabetes cases are caused by being overweight [52]. Feeding mice HFD causes obesity, hyperglycemia, increased glucose levels, increased serum insulin levels, and insulin resistance [53], potentially leading to the development of type 2 diabetes. Mice fed an HFD may experience body weight gain and increased adipose tissue mass, with ICR mice being the most suitable among the tested strains in terms of obesity-related factors [54]. For this reason, we used ICR mice in this experiment. In this study, the body weight of mice fed an HFD increased by 33.95% compared with mice fed an NFD, confirming the establishment of an obesity animal model (Table 2). In addition, the diabetes animal model was verified by an increase in blood glucose levels (Table 3, Figure 3A).
In our study, FF showed control serum ALT and AST levels. The elevation of these liver markers indicates that HFD induced severe liver damage, and these results show that FF significantly protected against liver damage (Figure 7). Lipid accumulation in the liver is a typical feature of obesity [55]. Additionally, hepatic fatty infiltration is a sign of hepatic steatosis, and the reduction of lipid droplets in the liver may improve hepatic steatosis [56,57]. Lipid droplets serve as a hallmark of lipid accumulation and signify early pathological changes in liver metabolism [58]. Excessive lipid accumulation within these droplets is implicated in metabolic disorders such as obesity and diabetes [59]. A histopathological examination showed that FF helps in reducing lipid droplets in the liver (Figure 4A). Additionally, as depicted in Figure 2B, the color of the liver in the FF administration group appeared dark red, similar to that of the NFD group, which was visible to the naked eye. This suggests that FF can help improve liver steatosis.
Obesity is a major risk factor for various metabolic disorders, including hyperglycemia, elevated serum lipid levels, type 2 diabetes, and atherosclerosis [60]. Obesity is associated with increased levels of TC, TG, and LDL in the serum and concurrently decreased levels of HDL [61]. Long-term HFD consumption leads to an excess of calories in the body, resulting in the excessive production of fatty acids, which are converted into TG and accumulate in adipose tissue, leading to increases in serum TC and TG levels [62]. HFD is a contributing factor to elevated TC levels [43], and increased visceral fat accumulation due to HFD consumption influences the TG concentration, exacerbating lipid metabolism disorders [44]. The Lactobacillus genus as a probiotic has been demonstrated in various studies [63,64]. Obesity has various causes, but the primary factor is the excessive accumulation of intracellular TC resulting from the activation of adipogenesis [2]. L. plantarum positively affects insulin sensitivity and reduces TC levels in the obese mice model [65]. As in Figure 6, serum TC and TG levels increased due to an HFD. In this study, we utilized fermented figs produced using L. plantarum BT-LP-01 isolated and identified from figs. The FF was administered to obese and diabetic model mice fed an HFD, resulting in weight reduction and the inhibition of increases in TC, TG, and LDL while promoting an increase in HDL (Table 2, Figure 6). LDL is a lipoprotein and serves as an important transporter of cholesterol in the bloodstream [63]. Obesity is commonly associated with low HDL levels and an increase in abundant lipoproteins. One of the primary functions of HDL is to assist transportation to the liver for excretion [64,65]. These results confirmed that the administration of FF improved weight and lipid accumulation decrease rates.
Several current studies are investigating various methods, including functional foods and probiotics, to prevent obesity and diabetes. Previous studies on diabetes have demonstrated that probiotics can help reduce blood glucose levels [64,65,66,67]. In addition, Lactobacillus has the potential to inhibit α-glucosidase and can suppress postprandial hyperglycemia by alleviating carbohydrate digestion and absorption [68]. The association between obesity and type 2 diabetes is well known, with a key premise that obesity causes IR [69]. IR and insulin secretion dysfunction affect the entire process of type 2 diabetes, and the treatment of type 2 diabetes begins with reducing IR and secretion dysfunction [70]. C-P is a reliable marker of pancreatic β-cell function and can be measured within a stable range, as it is eliminated from the peripheral circulation at a constant rate [71,72]. Based on these findings, the improvement in C-P and insulin levels, as well as reductions in fasting blood glucose and IPGTT levels, suggest potential benefits for the treatment and prevention of type 2 diabetes. In our study, we confirmed that FF can help reduce fasting blood glucose and IPGTT levels and improve C-peptide and insulin levels (Table 3, Figure 3 and Figure 5). These results demonstrate the potential of FF to improve IR.
Chronic HFD administration activates inflammation in liver tissue, leading to the release of various inflammatory cytokines, including IL-6 and IL-1β [45,46,47]. These are commonly known pro-inflammatory cytokines and are considered general markers of inflammation associated with obesity [73,74]. In our study, IL-6 and IL-1β increased with an HFD, and inflammation was confirmed to be inhibited by FF. Additionally, a decrease in iNOS expression was also observed (Figure 8). Expression of iNOS is a feature of inflammation, as it is an enzyme that affects the production of inflammatory cytokines [75,76]. Lipid accumulation functions as a factor in obesity and is regulated by various adipose-specific proteins, including C/EBPα, as well as lipid-synthesizing enzymes, such as FABP4 and FAS [77]. ACC functions as a rate-limiting enzyme in fatty acid biosynthesis, inhibiting FAS and increasing fatty acid oxidation [78]. In our study, we observed a decrease in the expression of FAS, FABP4, and C/EBPα, along with an increase in ACC expression due to FF (Figure 9). These results indicate that FF has an anti-inflammatory effect in obese mice by suppressing inflammatory factors and reducing the expression of key adipogenesis factors of lipid formation, suggesting its potential to inhibit lipid accumulation.

5. Conclusions

Our research findings demonstrate that FF administration reduces body weight, blood glucose levels, and lipid metabolism while also regulating the expression of inflammatory markers and adipogenesis markers in the liver. In this study, FF administration in HFD-fed mice demonstrated the potential to regulate obesity and diabetes-related factors. FF has shown potential for diabetes prevention by regulating blood glucose and IR, and our results indicate FF’s potential for obesity treatment by modulating adipogenesis markers. Therefore, fermented figs are considered to have high potential as functional food ingredients that can help treat obesity and diabetes. Additionally, further research on fermented fig for metabolic diseases such as hyperlipidemia is expected to establish its use as an excellent functional food ingredient.

Author Contributions

Conceptualization, S.K. and J.K.; methodology, J.C., S.K. and J.K.; validation, H.C., J.C. and Y.J.; formal analysis, H.C.; investigation, H.C.; resources, H.-S.K.; data curation, H.C.; writing—original draft preparation, H.C.; writing—review and editing, J.C., S.K. and J.K.; supervision, Y.-M.L., M.-H.K. and J.K.; project administration, J.K.; funding acquisition, Y.-M.L. and M.-H.K. All authors have read and agreed to the published version of the manuscript.

Funding

This work was supported by the Starting Growth Technological R&D Program (RS-2023-00264645) funded by the Ministry of SMEs and Startups (MSS, Republic of Korea).

Institutional Review Board Statement

The animal study protocol was approved by the Institutional Ethics Committee of Jeonbuk National University (protocol code NON2023-051 and date of approval 2 May 2023).

Informed Consent Statement

Not applicable.

Data Availability Statement

The data presented in this study are available on request from the corresponding author. The data are not publicly available due to ethical restrictions.

Acknowledgments

The authors thank to Slow Farmer’s Farm for giving for Fig materials.

Conflicts of Interest

Authors Young-Min Lee and Myoung-Hak Kang are employed by the company Alldayorganic Co., Ltd. and Hyuck-Se Kwon is employed by the company Vitech Co., Ltd. The remaining authors declare that the research was conducted in the absence of any commercial or financial relationships that could be construed as a potential conflict of interest.

References

  1. NCD Risk Factor Collaboration (NCD-RisC). Worldwide trends in body-mass index, overweight, and obesity from 1975 to 2016: A pooled analysis of 2416 population-based measurement studies in 128.9 million children, adolescents, and adults. Lancet 2017, 390, 2627–2642. [Google Scholar] [CrossRef]
  2. Chen, H.C.; Farese, R.V., Jr. Inhibition of triglyceride synthesis as a treatment strategy for obesity: Lessons from DGAT1-deficient mice. Arterioscler. Thromb. Vasc. Biol. 2005, 25, 482–486. [Google Scholar] [CrossRef] [PubMed]
  3. White, U.A.; Stephens, J.M. Transcriptional factors that promote formation of white adipose tissue. Mol. Cell Endocrinol. 2009, 318, 10–14. [Google Scholar] [CrossRef]
  4. Rosen, E.D.; MacDougald, O.A. Adipocyte differentiation from the inside out. Nat. Rev. Mol. Cell Biol. 2006, 7, 885–896. [Google Scholar] [CrossRef]
  5. Alessi, M.C.; Lijnen, H.R.; Bastelica, D.; Juhan-Vague, I. Adipose tissue and atherothrombosis. Pathophysiol. Haemost. Thromb. 2003, 33, 290–297. [Google Scholar] [CrossRef] [PubMed]
  6. Lakota, K.; Wei, J.; Carns, M.; Hinchcliff, M.; Lee, J.; Whitfield, M.L.; Sodin-Semrl, S.; Varga, J. Levels of adiponectin, a marker for PPAR-gamma activity, correlate with skin fibrosis in systemic sclerosis: Potential utility as biomarker? Arthritis Res. Ther. 2012, 14, R102. [Google Scholar] [CrossRef]
  7. Singh, S.; Dulai, P.S.; Zarrinpar, A.; Ramamoorthy, S.; Sandborn, W.J. Obesity in IBD: Epidemiology, pathogenesis, disease course and treatment outcomes. Nat. Rev. Gstroenterol. Hepatol. 2017, 14, 110–121. [Google Scholar] [CrossRef]
  8. Lumeng, C.N.; Saltiel, A.R. Inflammatory links between obesity and metabolic disease. J. Clin. Investig. 2011, 121, 2111–2117. [Google Scholar] [CrossRef] [PubMed]
  9. Barazzoni, R.; Gortan Cappellari, G.; Ragni, M.; Nisoli, E. Insulin resistance in obesity: An overview of fundamental alterations. Eat. Weight Disord. 2018, 23, 149–157. [Google Scholar] [CrossRef]
  10. Wu, H.; Ballantyne, C.M. Metabolic inflammation and insulin resistance in obesity. Circ. Res. 2020, 126, 1549–1564. [Google Scholar] [CrossRef]
  11. Montserrat-de la Paz, S.; Pérez-Pérez, A.; Vilariño-García, T.; Jiménez-Cortegana, C.; Muriana, F.J.G.; Millán-Linares, M.C.; Sánchez-Margalet, V. Nutritional modulation of leptin expression and leptin action in obesity and obesity-associated complications. J. Nutr. Biochem. 2021, 89, 108561. [Google Scholar] [CrossRef] [PubMed]
  12. Yumuk, V.; Tsigos, C.; Fried, M.; Schindler, K.; Busetto, L.; Micic, D.; Toplak, H.; Obesity Management Task Force of the European Association for the Study of Obesity. European Guidelines for Obesity Management in Adults. Obes. Facts 2015, 8, 402–424. [Google Scholar] [CrossRef] [PubMed]
  13. Bennett, W.L.; Maruthur, N.M.; Singh, S.; Segal, J.B.; Wilson, L.M.; Catterjee, R.; Marinopoulos, S.S.; Puhan, M.A.; Ranasinghe, P.; Block, L.; et al. Comparative effectiveness and safety of medications for type 2 diabetes: An update including new drugs and 2-drug combinations. Ann. Intern. Med. 2011, 154, 602–613. [Google Scholar] [CrossRef] [PubMed]
  14. Song, W.; Song, C.; Li, L.; Wang, T.; Hu, J.; Zhu, L.; Yue, T. Lactobacillus alleviated obesity induced by high-fat diet in mice. J. Food Sci. 2021, 86, 5439–5451. [Google Scholar] [CrossRef] [PubMed]
  15. Solomon, A.; Golubowicz, S.; Yablowicz, Z.; Grossman, S.; Bergman, M.; Gottlieb, H.E.; Altman, A.; Kerem, Z.; Flaishman, M.A. Antioxidant activities and anthocyanin content of fresh fruits of common fig (Ficus carica L.). J. Agric. Food Chem. 2006, 54, 7717–7723. [Google Scholar] [CrossRef]
  16. Adisakwattana, S.; Yibchoc-Anun, S.; Charoenlertkul, P.; Wongsasiripat, N. Cyanidin-3-rutinoside alleviates postprandial hyperglycemia and its synergism with acarbose by inhibition of intestinal α-glucosidase. J. Clin. Biochem. Nutr. 2011, 49, 36–41. [Google Scholar] [CrossRef] [PubMed]
  17. Jeong, W.S.; Lachance, P.A. Phytosterols and fatty acids in fig (Ficus carica, var. Mission) fruit and tree components. J. Food Sci. 2001, 66, 278–281. [Google Scholar] [CrossRef]
  18. Abdel-Rahman, R.; Ghoneimy, E.; Abdel-Wahab, A.; Eldeeb, N.; Salem, M.; Ahmed, T. The therapeutic effects of Ficus carica extract as antioxidant and anticancer agent. S. Afr. J. Bot. 2021, 141, 273–277. [Google Scholar] [CrossRef]
  19. Soltana, H.; Pinon, A.; Limami, Y.; Zaid, Y.; Khalki, L.; Zaid, N.; Salah, D.; Sabitaliyevich, U.Y.; Simon, A.; Liagre, B.; et al. Antitumoral activity of Ficus carica L. on colorectal cancer cell lines. Cell. Mol. Biol. 2019, 65, 6–11. [Google Scholar] [CrossRef]
  20. Ayuso, M.; Carpena, M.; Taofiq, O.; Albuquerque, T.G.; Simal-Gandara, J.; Oliveira, M.B.P.; Prieto, M.A.; Ferreira, I.C.F.R.; Barros, L. Fig “Ficus carica L.” and its by-products: A decade evidence of their health-promoting benefits towards the development of novel food formulations. Trends Food Sci. Technol. 2022, 127, 1–13. [Google Scholar] [CrossRef]
  21. Purnamasari, R.; Winarni, D.; Permanasari, A.A.; Agustina, E.; Hayaza, S.; Darmanto, W. Anticancer Activity of Methanol Extract of Ficus carica Leaves and Fruits Against Proliferation, Apoptosis, and Necrosis in Huh7it Cells. Cancer Inf. 2019, 18, 1176935119842576. [Google Scholar] [CrossRef] [PubMed]
  22. Li, X.; Huang, Y.; Song, L.; Xiao, Y.; Lu, S.; Xu, J.; Li, J.; Ren, Z. Lactobacillus plantarum prevents obesity via modulation of gut microbiota and metabolites in high-fat feeding mice. J. Funct. Foods 2020, 73, 104103. [Google Scholar] [CrossRef]
  23. Wang, G.; Chen, X.; Wang, L.; Zhao, L.; Xia, Y.; Ai, L. Diverse conditions contribute to the cholesterol-lowering ability of different Lactobacillus plantarum strains. Food Funct. 2021, 12, 1079–1086. [Google Scholar] [CrossRef] [PubMed]
  24. Borgeraas, H.; Johnson, L.K.; Skattebu, J.; Hertel, J.K.; Hjelmesaeth, J. Effects of probiotics on body weight, body mass index, fat mass and fat percentage in subjects with overweight or obesity: A systematic review and meta-analysis of randomized controlled trials. Obes. Rev. 2018, 19, 219–232. [Google Scholar] [CrossRef] [PubMed]
  25. Garbacz, K. Anticancer activity of lactic acid bacteria. Semin. Cancer Biol. 2022, 86, 356–366. [Google Scholar] [CrossRef] [PubMed]
  26. Liu, Y.W.; Liong, M.T.; Tsai, Y.C. New perspectives of Lactobacillus plantarum as a probiotic: The gut-heart-brain axis. J. Microbiol. 2018, 56, 601–613. [Google Scholar] [CrossRef] [PubMed]
  27. Qu, T.; Yang, L.; Wang, Y.; Jiang, B.; Shen, M.; Ren, D. Reduction of serum cholesterol and its mechanism by Lactobacillus plantarum H6 screened from local fermented food products. Food Funct. 2020, 11, 1397–1409. [Google Scholar] [CrossRef] [PubMed]
  28. Liu, Z.; Zhao, J.; Sun, R.; Wang, M.; Wang, K.; Li, Y.; Shang, H.; Hou, J.; Jiang, Z. Lactobacillus plantarum 23-1 improves intestinal inflammation and barrier function through the TLR4/NF-κB signaling pathway in obese mice. Food Funct. 2022, 13, 5971–5986. [Google Scholar] [CrossRef] [PubMed]
  29. Ejtahed, H.S.; Angoorani, P.; Soroush, A.R.; Atlasi, R.; Hasani-Ranjbar, S.; Mortazavian, A.M.; Larijani, B. Probiotics supplementation for the obesity management; A systematic review of animal studies and clinical trials. J. Funct. Foods 2019, 52, 228–242. [Google Scholar] [CrossRef]
  30. Hur, S.J.; Lee, S.Y.; Kim, Y.C.; Choi, I.; Kim, G.B. Effect of fermentation on the antioxidant activity in plant-based foods. Food Chem. 2014, 160, 346–356. [Google Scholar] [CrossRef]
  31. Sheih, I.C.; Fang, T.J.; Wu, T.K.; Chen, R.Y. Effects of fermentation on antioxidant properties and phytochemical composition of soy germ. J. Sci. Food Agric. 2014, 94, 3163–3170. [Google Scholar] [CrossRef]
  32. Behera, S.S.; Ray, R.C.; Zdolec, N. Lactobacillus plantarum with Functional Properties: An Approach to Increase Safety and Shelf-Life of Fermented Foods. BioMed Res. Int. 2018, 2018, 9361614. [Google Scholar] [CrossRef]
  33. Saki, M.; ValizadehKaji, B.; Abbasifar, A.; Shahrjerdi, I. Effect of chitosan coating combined with thymol essential oil on physicochemical and qualitative properties of fresh fig (Ficus carica L.) fruit during cold storage. J. Food Meas. Charact. 2019, 13, 1147–1158. [Google Scholar] [CrossRef]
  34. Wang, C.; Liu, L.; Guo, J.; Jike, X.; Xu, K.; Li, B.; Liu, L.; Fang, Y.; Xu, H.; Lei, H. Phenolic profiles, antioxidant capacities and flavour volatiles in fig (Ficus carica L.) juices from five cultivars fermented by Lactobacillus plantarum and Lactobacillus acidophilus. Int. J. Food Sci. Technol. 2023, 58, 6025–6035. [Google Scholar] [CrossRef]
  35. Subramaniyan, V.; Sellamuthu, P.S.; Sadiku, E.R. Evaluation of the antifungal activity of cell-free supernatant of Lactobacillus species against the fig (Ficus carica. L) postharvest fungal pathogens through in-vitro and in-silico analysis. Sci. Hortic. 2024, 331, 113182. [Google Scholar] [CrossRef]
  36. Khezri, S.; Dehgha, P.; Mahmoudi, R.; Jafarlou, M. Fig juice fermented with lactic acid bacteria as a nutraceutical product. Pharm. Sci. 2016, 22, 260–266. [Google Scholar] [CrossRef]
  37. Long, X.; Zeng, X.; Tan, F.; Yi, R.; Pan, Y.; Zhou, X.; Mu, J.; Zhao, X. Lactobacillus plantarum KFY04 prevents obesity in mice through the PPAR pathway and alleviates oxidative damage and inflammation. Food Funct. 2020, 11, 5460–5472. [Google Scholar] [CrossRef]
  38. Park, S.Y.; Seong, K.S.; Lim, S.D. Anti-obesity Effect of Yogurt Fermented by Lactobacillus plantarum Q180 in Diet-induced Obese Rats. Korean J. Food Sci. Anim. Resour. 2016, 36, 77–83. [Google Scholar] [CrossRef]
  39. Choi, J.; Lee, S.; Park, Y.S. Anti-diabetic effect of mulberry leaf extract fermented with Lactobacillus plantarum. Korean J. Food Sci. Technol. 2020, 52, 191–199. [Google Scholar]
  40. Pan, R.; Xu, T.; Bai, J.; Xia, S.; Liu, Q.; Li, J.; Xiao, X.; Dong, Y. Effect of Lactobacillus plantarum fermented barley on plasma glycolipids and insulin sensitivity in subjects with metabolic syndrome. J. Food Biochem. 2020, 44, e13471. [Google Scholar] [CrossRef]
  41. Bedossa, P.; Poynard, T. An algorithm for the grading of activity in chronic hepatitis C. Hepatology 1996, 24, 289–293. [Google Scholar] [CrossRef] [PubMed]
  42. Park, K.J.; Lee, H.Y.; Lee, H.R.; Yoon, M.C.; Park, S.D.; Lee, Y.T.; Shen, Z.B.; Cui, H.H.; Shin, S.S. Ethyl acetate fraction of GGEx18 modulates feeding efficiency ratio and blood leptin level in high fat diet-fed obese mice. Herb. Formula Sci. 2011, 19, 219–231. [Google Scholar]
  43. Ezad, S.; Cheema, H.; Collins, N. Statin-induced rhabdomyolysis: A complication of a commonly overlooked drug interaction. Oxf. Med. Case Rep. 2018, 2018, omx104. [Google Scholar] [CrossRef] [PubMed]
  44. Kim, H.K. Obesity and fat metabolism. J. Korean Soc. Study Obes. 2000, 9, 63–65. [Google Scholar]
  45. Poret, J.M.; Souza-Smith, F.; Marcell, S.J.; Gaudet, D.A.; Tzeng, T.H.; Braymer, H.D.; Harrison-Bernard, L.M.; Primeaux, S.D. High fat diet consumption differentially affects adipose tissue inflammation and adipocyte size in obesity-prone and obesity-resistant rats. Int. J. Obes. 2018, 42, 535–541. [Google Scholar] [CrossRef] [PubMed]
  46. Sun, B.; Karin, M. Obesity, inflammation, and liver cancer. J. Hepatol. 2012, 56, 704–713. [Google Scholar] [CrossRef] [PubMed]
  47. Tung, Y.T.; Chen, H.L.; Wu, H.S.; Ho, M.H.; Chong, K.Y.; Chen, C.M. Kefir peptides prevent hyperlipidemia and obesity in high-fat-diet-induced obese rats via lipid metabolism modulation. Mol. Nutr. Food Res. 2018, 62, 1700505. [Google Scholar] [CrossRef] [PubMed]
  48. Greenway, F.L. Physiological adaptations to weight loss and factors favouring weight regain. Int. J. Obes. 2015, 39, 1188–1196. [Google Scholar] [CrossRef]
  49. Zhou, Y.; Tian, S.; Qian, L.; Jiang, S.; Tang, Y.; Han, T. DHA-enriched phosphatidylserine ameliorates non-alcoholic fatty liver disease and intestinal dysbacteriosis in mice induced by a high-fat diet. Food Funct. 2021, 12, 4021–4033. [Google Scholar] [CrossRef]
  50. de Heredia, F.P.; Gómez-Martínez, S.; Marcos, A. Obesity, inflammation and the immune system. Proc. Nutr. Soc. 2012, 71, 332–338. [Google Scholar] [CrossRef]
  51. van Herpen, N.A.; Schrauwen-Hinderling, V.B. Lipid accumulation in non-adipose tissue and lipotoxicity. Physiol. Behav. 2008, 94, 231–241. [Google Scholar] [CrossRef] [PubMed]
  52. Hossain, P.; Kawar, B.; Nahas, M.E. Obesity and diabetes in the developing world—A growing challenge. N. Engl. J. Med. 2007, 356, 213–215. [Google Scholar] [CrossRef] [PubMed]
  53. Jeoung, N.H.; Harris, R.A. Pyruvate dehydrogenase kinase-4 deficiency lowers blood glucose and improves glucose tolerance in diet-induced obese mice. Am. J. Physiol. Endocrinol. Metab. 2008, 295, E46–E54. [Google Scholar] [CrossRef] [PubMed]
  54. Li, J.; Wu, H.; Liu, Y.; Yang, L. High fat diet induced obesity model using four strains of mice: Kunming, C57BL/6, BALB/c and ICR. Exp. Anim. 2020, 69, 326–335. [Google Scholar] [CrossRef] [PubMed]
  55. Mashek, D.G.; Greenberg, A.S. Serum TAG analysis differentiates between genetic and obesity-associated NAFLD. Diabetes 2014, 63, 42–44. [Google Scholar] [CrossRef] [PubMed]
  56. Xu, K.Z.Y.; Zhu, C.; Kim, M.S.; Yamahara, J.; Li, Y. Pomegranate flower ameliorates fatty liver in an animal model of type 2 diabetes and obesity. J. Ethnopharmacol. 2009, 123, 280–287. [Google Scholar] [CrossRef] [PubMed]
  57. Song, H.; Shen, X.; Chu, Q.; Zheng, X. Pomegranate fruit pulp polyphenols reduce diet-induced obesity with modulation of gut microbiota in mice. J. Sci. Food Agric. 2022, 102, 1968–1977. [Google Scholar] [CrossRef] [PubMed]
  58. Dietrich, P.; Hellerbrand, C. Non-alcoholic fatty liver disease, obesity and the metabolic syndrome. Best Pract. Res. Clin. Gastroenterol. 2014, 28, 637–653. [Google Scholar] [CrossRef] [PubMed]
  59. Gluchowski, N.L.; Becuwe, M.; Walther, T.C.; Farese, R.V., Jr. Lipid droplets and liver disease: From basic biology to clinical implications. Nat. Rev. Gastroenterol. Hepatol. 2017, 14, 343–355. [Google Scholar] [CrossRef]
  60. Cani, P.D.; Bibiloni, R.; Knauf, C.; Waget, A.; Neyrinck, A.M.; Delzenne, N.; Burcelin, R. Changes in gut microbiota control metabolic endotoxemia-induced inflammation in high-fat diet–induced obesity and diabetes in mice. Diabetes 2008, 57, 1470–1481. [Google Scholar] [CrossRef]
  61. Tomkin, G.H. Atherosclerosis, diabetes and lipoproteins. Expert Rev. Cardiovasc. Ther. 2010, 8, 1015–1029. [Google Scholar] [CrossRef] [PubMed]
  62. Liu, Z.; Zhou, X.; Wang, W.; Gu, L.; Hu, C.; Sun, H.; Xu, C.; Hou, J.; Jiang, Z. Lactobacillus paracasei 24 attenuates lipid accumulation in high-fat deit-induced obese mice by regulating the gut microbiota. J. Agric. Food Chem. 2022, 70, 4631–4643. [Google Scholar] [CrossRef] [PubMed]
  63. Yoo, S.R.; Kim, Y.J.; Park, D.Y.; Jung, U.J.; Jeon, S.M.; Ahn, Y.T.; Huh, C.S.; McGregor, R.; Choi, M.S. Probiotics L. plantarum and L. curvatus in combination alter hepatic lipid metabolism and suppress diet-induced obesity. Obesity 2013, 21, 2571–2578. [Google Scholar] [CrossRef] [PubMed]
  64. Jang, K.O.; Choi, J.S.; Choi, K.H.; Kim, S.; Kim, H.; Chung, D.K. Anti-obesity potential of heat-killed Lactiplantibacillus plantarum K8 in 3T3-L1 cells and high-fat diet mice. Heliyon 2023, 9, e12926. [Google Scholar] [CrossRef] [PubMed]
  65. Park, S.; Ji, Y.; Jung, H.Y.; Park, H.; Kang, J.; Choi, S.H.; Shin, H.; Hyun, C.K.; Kim, K.T.; Holzapfel, W.H. Lactobacillus plantarum HAC01 regulates gut microbiota and adipose tissue accumulation in a diet-induced obesity murine model. Appl. Microbiol. Biotechnol. 2017, 101, 1605–1614. [Google Scholar] [CrossRef] [PubMed]
  66. Navarese, E.P.; Robinson, J.G.; Kowalewski, M.; Olodziejczak, M.; Andreotti, F.; Bliden, K.; Tantry, U.; Kubica, J.; Raggi, P.; Gurbel, P.A. Association between baseline LDL-C level and total and cardiovascular mortality after LDL-C lowering: A systematic review and meta-analysis. JAMA 2018, 319, 1566–1579. [Google Scholar] [CrossRef]
  67. Itskowitz, M.S. Low HDL cholesterol levels. N. Engl. J. Med. 2006, 354, 417–419. [Google Scholar] [PubMed]
  68. Ouimet, M.; Barrett, T.J.; Fisher, E.A. HDL and reverse cholesterol transport: Basic mechanisms and their roles in vascular health and disease. Circ. Res. 2019, 124, 1505–1518. [Google Scholar] [CrossRef] [PubMed]
  69. Khan, B.B.; Flier, J.S. Obesity and insulin resistance. J. Clin. Investig. 2000, 106, 473–481. [Google Scholar] [CrossRef]
  70. Pratley, R.E.; Weyer, C. The role of impaired early insulin secretion in the pathogenesis of type II diabetes mellitus. Diabetologia 2001, 44, 929–945. [Google Scholar] [CrossRef]
  71. Huang, Y.; Wang, Y.; Liu, C.; Zhou, Y.; Wang, X.; Cheng, B.; Kui, C.; Wang, Y. C-peptide, glycaemic control, and diabetic complications in type 2 diabetes mellitus: A real-world study. Diabetes Metab. Res. Rev. 2022, 38, e3514. [Google Scholar] [CrossRef] [PubMed]
  72. Leighton, E.; Sainsbury, C.A.; Jones, G.C. A practical review of C-peptide testing in diabetes. Diabetes Ther. 2017, 8, 475–487. [Google Scholar] [CrossRef]
  73. Kern, L.; Mittenbühler, M.J.; Vesting, A.J.; Ostermann, A.L.; Wunderlich, C.M.; Wunderlich, F.T. Obesity-induced TNFα and IL-6 signaling: The missing link between obesity and inflammation—Driven liver and colorectal cancers. Cancers 2018, 11, 24. [Google Scholar] [CrossRef] [PubMed]
  74. Wang, T.; He, C. Pro-inflammatory cytokines: The link between obesity and osteoarthritis. Cytokine Growth Factor Rev. 2018, 44, 38–50. [Google Scholar] [CrossRef]
  75. Tang, C.C.; Huang, H.P.; Lee, Y.J.; Tang, Y.H.; Wang, C.J. Hepatoprotective effect of mulberry water extracts on ethanol-induced liver injury via anti-inflammation and inhibition of lipogenesis in C57BL/6J mice. Food Chem. Toxicol. 2013, 62, 786–796. [Google Scholar] [CrossRef]
  76. Iwakiri, Y.; Kim, M.Y. Nitric oxide in liver diseases. Trends Pharmacol. Sci. 2015, 36, 524–536. [Google Scholar] [CrossRef] [PubMed]
  77. Kang, M.C.; King, Y.; Kim, H.S.; Jeon, Y.J.; Lee, S.H. Inhibition of adipogenesis by diphlorethohydroxycarmalol (DPHC) through AMPK activation in adipocytes. Mar. Drugs 2019, 17, 44. [Google Scholar] [CrossRef]
  78. Steinberg, G.R.; Kemp, B.E. AMPK in health and disease. Physiol. Rev. 2009, 89, 1025–1078. [Google Scholar] [CrossRef]
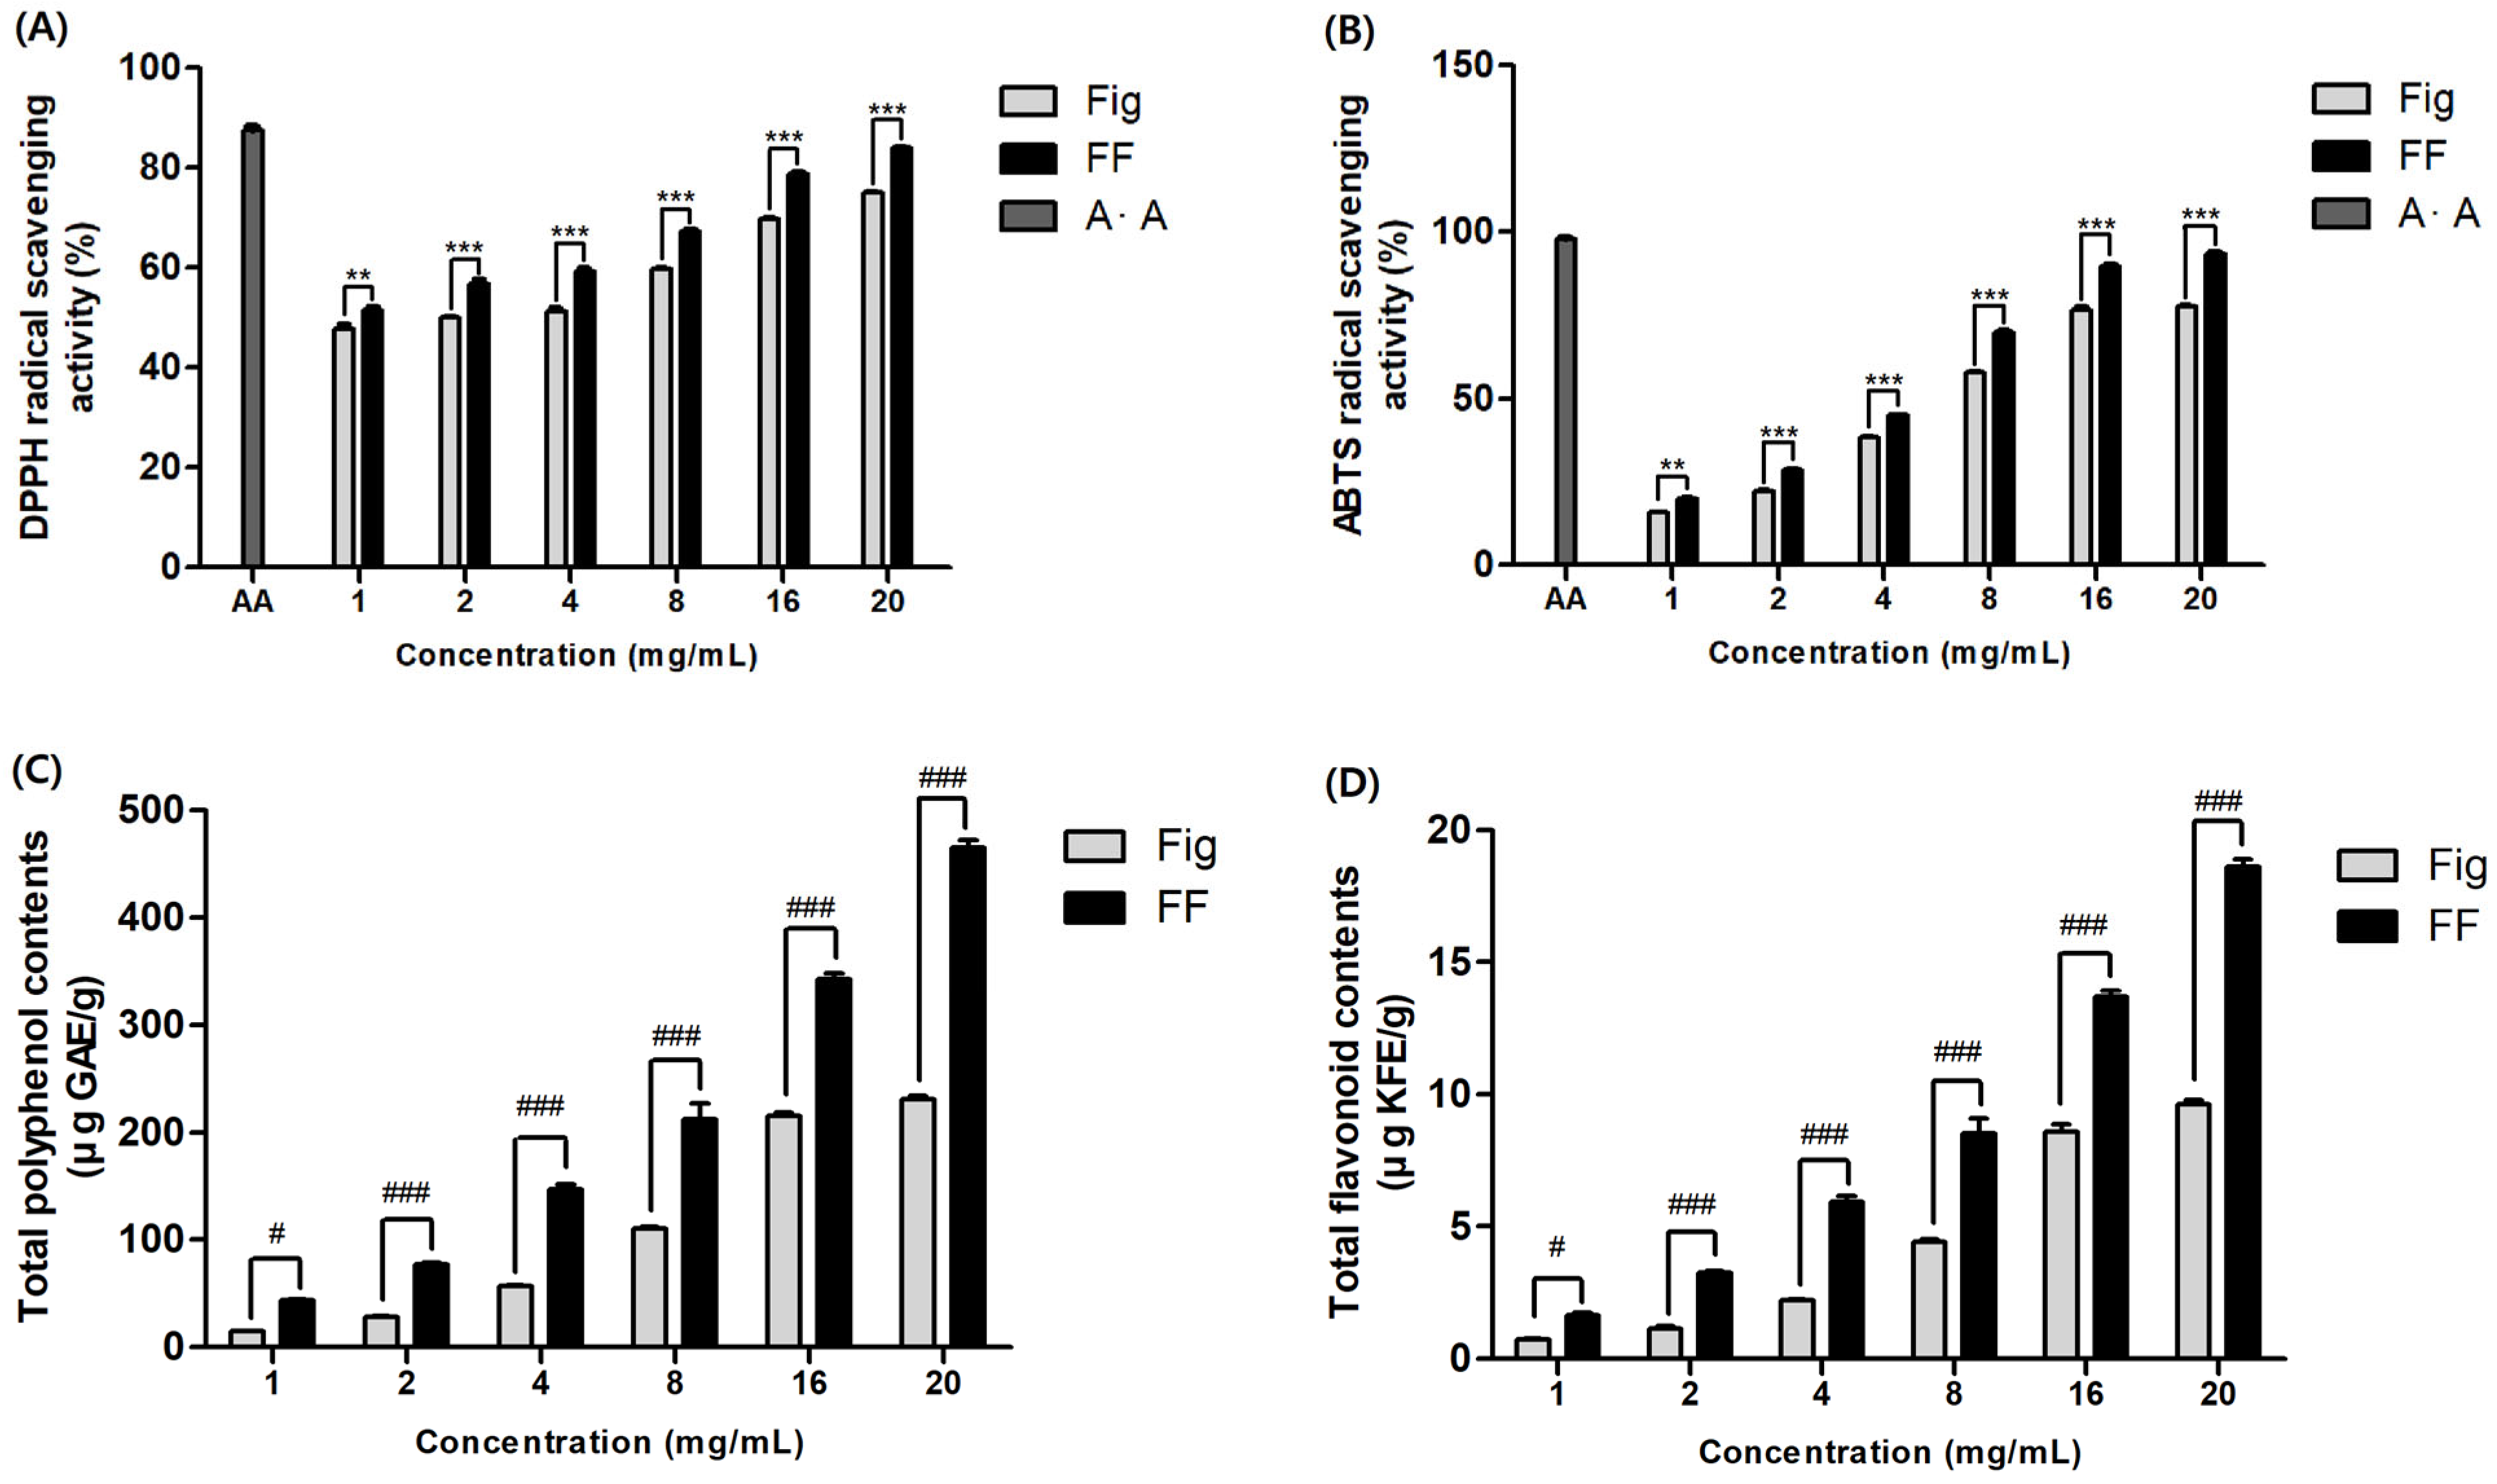
Figure 1. Effects of Fig and fermented fig (Ficus carica L., FF) on the antioxidants (A) DPPH; (B) ABTS; (C) Total polyphenol; (D) Total flavonoids. Fig and FF extracts were treated at concentration of 1–20 mg/mL. The results were expressed as mean ± SEM (n = 8). ** p < 0.01 compared with Fig and FF. *** p < 0.005 compared with Fig and FF. # p < 0.05 compared with Fig and FF. ### p < 0.005 compared with Fig and FF.
Applsci 14 06412 g001
Figure 2. Effects of fermented fig (FF) on the macroscopic aspect of the (A) abdomen, (B) liver image, (C) liver weight, (D) epididymal fat, and (E) Abdominal fat weight in HFD-fed mice. NFD, mice treated with only DW; HFD, mice treated with HFD and DW; GTE, mice treated with HFD and green tea extract (GTE) 50 mg/kg; FF, mice treated with HFD and FF (50, 125, and 250 mg/kg). a–d The different variables are significantly different at p < 0.05 among the groups, as determined by Tukey’s analysis. NS This letter did not indicate a significant difference among the groups.
Applsci 14 06412 g002
Figure 3. Effects of fermented fig (FF) on the (A) blood glucose changes in IPGTT and (B) area under the curve (AUC) in HFD-induced obese mice. NFD, mice treated with only DW; HFD, mice treated with HFD and DW; GTE, mice treated with HFD and green tea extract (GTE) 50 mg/kg; FF, mice treated with HFD and FF (50, 125, and 250 mg/kg). The results are expressed as mean ± SEM (n = 8). a–c The different variables were significantly different at p < 0.05 among the groups, as determined by Tukey’s analysis.
Applsci 14 06412 g003
Figure 4. Effects of fermented fig (FF) on (A) histopathology and (B) steatosis score in HFD-fed obese mice. NFD, mice treated with only DW; HFD, mice treated with HFD and DW; GTE, mice treated with HFD and green tea extract (GTE) 50 mg/kg; FF, mice treated with HFD and FF (50, 125, and 250 mg/kg). The results are expressed as mean ± SEM (n = 8). a–c The different variables were significantly different at p < 0.05 among the groups, as determined by Tukey’s analysis.
Applsci 14 06412 g004
Figure 5. Effects of fermented fig (FF) on serum (A) C-peptide, (B) insulin, and (C) glucose levels in HFD-fed mice. NFD, mice treated with only DW; HFD, mice treated with HFD and DW; GTE, mice treated with HFD and green tea extract (GTE) 50 mg/kg; FF, mice treated with HFD and FF (50, 125, and 250 mg/kg). The results are expressed as mean ± SEM (n = 8). a–c The different variables were significantly different at p < 0.05 among the groups, as determined by Tukey’s analysis.
Applsci 14 06412 g005
Figure 6. Effects of fermented fig (FF) on serum lipid metabolism: (A) total cholesterol, (B) triglycerides, (C) low-density lipoprotein, and (D) high-density lipoprotein in HFD-fed mice. NFD, mice treated with only DW; HFD, mice treated with HFD and DW; GTE, mice treated with HFD and green tea extract (GTE) 50 mg/kg; FF, mice treated with HFD and FF (50, 125, and 250 mg/kg). The results are expressed as mean ± SEM (n = 8). a–c The different variables were significantly different at p < 0.05 among the groups, as determined by Tukey’s analysis.
Applsci 14 06412 g006
Figure 7. Effects of fermented fig (FF) on serum (A) ALT and (B) AST levels in HFD-fed mice. NFD, mice treated with only DW; HFD, mice treated with HFD and DW; GTE, mice treated with HFD and green tea extract (GTE) 50 mg/kg; FF, mice treated with HFD and FF (50, 125, and 250 mg/kg). The results are expressed as mean ± SEM (n = 8). a–c The different variables were significantly different at p < 0.05 among the groups, as determined by Tukey’s analysis.
Applsci 14 06412 g007
Figure 8. Effects of fermented fig (FF) on liver inflammatory markers in HFD-fed mice. (A) protein expression; (B) IL-6; (C) IL-1β; (D) iNOS. NFD, mice treated with only DW; HFD, mice treated with HFD and DW; GTE, mice treated with HFD and green tea extract (GTE) 50 mg/kg; FF, mice treated with HFD and FF (50, 125, and 250 mg/kg). The results are expressed as mean ± SEM (n = 8). a–c The different variables were significantly different at p < 0.05 among the groups, as determined by Tukey’s analysis.
Applsci 14 06412 g008
Figure 9. Effects of fermented fig (FF) on liver adipogenesis markers in HFD-fed mice. (A) protein expression; (B) FAS; (C) FABP 4; (D) C/EBPα; (E) ACC. NFD, mice treated with only DW; HFD, mice treated with HFD and DW; GTE, mice treated with HFD and green tea extract (GTE) 50 mg/kg; FF, mice treated with HFD and FF (50, 125, and 250 mg/kg). The results are expressed as mean ± SEM (n = 8). a–c The different variables were significantly different at p < 0.05 among the groups, as determined by Tukey’s analysis.
Applsci 14 06412 g009
Table 1. The composition of the diets administered to the experimental mice.
DietsProteinCarbohydrateFatKcal
g %kcal %g %kcal %g %kcal %kcal/g
Normal-Fat Diet (NFD, D12450B)19.22067.3704.2103.85
High-Fat Diet (HFD, D12492)2620262035605.24
Table 2. Effects of fermented fig (FF) on body weight and food intake of the HFD-fed mice.
NFDHFDGTEFF 50FF 125FF 250
Initial body weight (g)28.5 ± 0.5 NS28.7 ± 0.528.6 ± 0.428.6 ± 0.928.5 ± 0.428.6 ± 0.4
Final body weight (g)42.4 ± 1.3 c56.9 ± 1.5 a51.3 ± 1.9 abc55.2 ± 1.5 ab53.7 ± 1.5 abc48.8 ± 1.6 bc
Body weight gain (g/day)1.99 ± 0.15 d4.02 ± 0.18 a3.25 ± 0.22 ab3.81 ± 0.16 ab3.60 ± 0.21 abc2.89 ± 0.24 c
Food intake (g/day)3.28 ± 0.30 NS3.09 ± 0.253.41 ± 1.593.03 ± 0.503.24 ± 1.242.93 ± 0.69
FER (%)0.61 ± 0.05 d1.30 ± 0.06 a0.95 ± 0.07 c1.26 ± 0.05 ab1.11 ± 0.07 abc0.99 ± 0.08 bc
The results were expressed as mean ± SEM (n = 8). NFD, mice treated with only DW; HFD, mice treated with HFD and DW; GTE, mice treated with HFD and green tea extract (GTE) 50 mg/kg; FF, mice treated with HFD and FF (50, 125, and 250 mg/kg). a–d The different variables are significantly different at p < 0.05 among the groups, as determined by Tukey’s analysis. NS This letter did not indicate a significant difference among the groups.
Table 3. Effect of fermented fig (FF) on fasting blood glucose level of the HFD-fed mice.
Fasting Blood Glucose (mg/dL)
NFDHFDGTEFF 50FF 125FF 250
4 weeks75.9 ± 5.5 c114.8 ± 4.2 a90.2 ± 4.2 bc101.0 ± 1.8 ab98.2 ± 1.4 b96.4 ± 2.0 b
8 weeks80.4 ± 5.8 c124.4 ± 3.4 a96.3 ± 4.8 bc111.0 ± 2.9 ab114.2 ± 3.9 b104.4 ± 3.3 b
The results were expressed as mean ± SEM (n = 8). NFD, mice treated with only DW; HFD, mice treated with HFD and DW; GTE, mice treated with HFD and green tea extract (GTE) 50 mg/kg; FF, mice treated with HFD and FF (50, 125, and 250 mg/kg). a–c The different variables were significantly different at p < 0.05 among the groups, as determined by Tukey’s analysis.
Disclaimer/Publisher’s Note: The statements, opinions and data contained in all publications are solely those of the individual author(s) and contributor(s) and not of MDPI and/or the editor(s). MDPI and/or the editor(s) disclaim responsibility for any injury to people or property resulting from any ideas, methods, instructions or products referred to in the content.