

Cold Nitrogen Plasma: A Groundbreaking Eco-Friendly Technique for the Surface Modification of Activated Carbon Aimed at Elevating Its Carbon Dioxide Adsorption Capacity

 ,
,  ,
, 

Abstract
:Featured Application
Abstract

1. Introduction
2. Materials and Methods
2.1. Materials
2.2. Modification of Commercial Activated Carbons
2.3. Characterization of Materials
2.4. CO2 Uptake Measurements
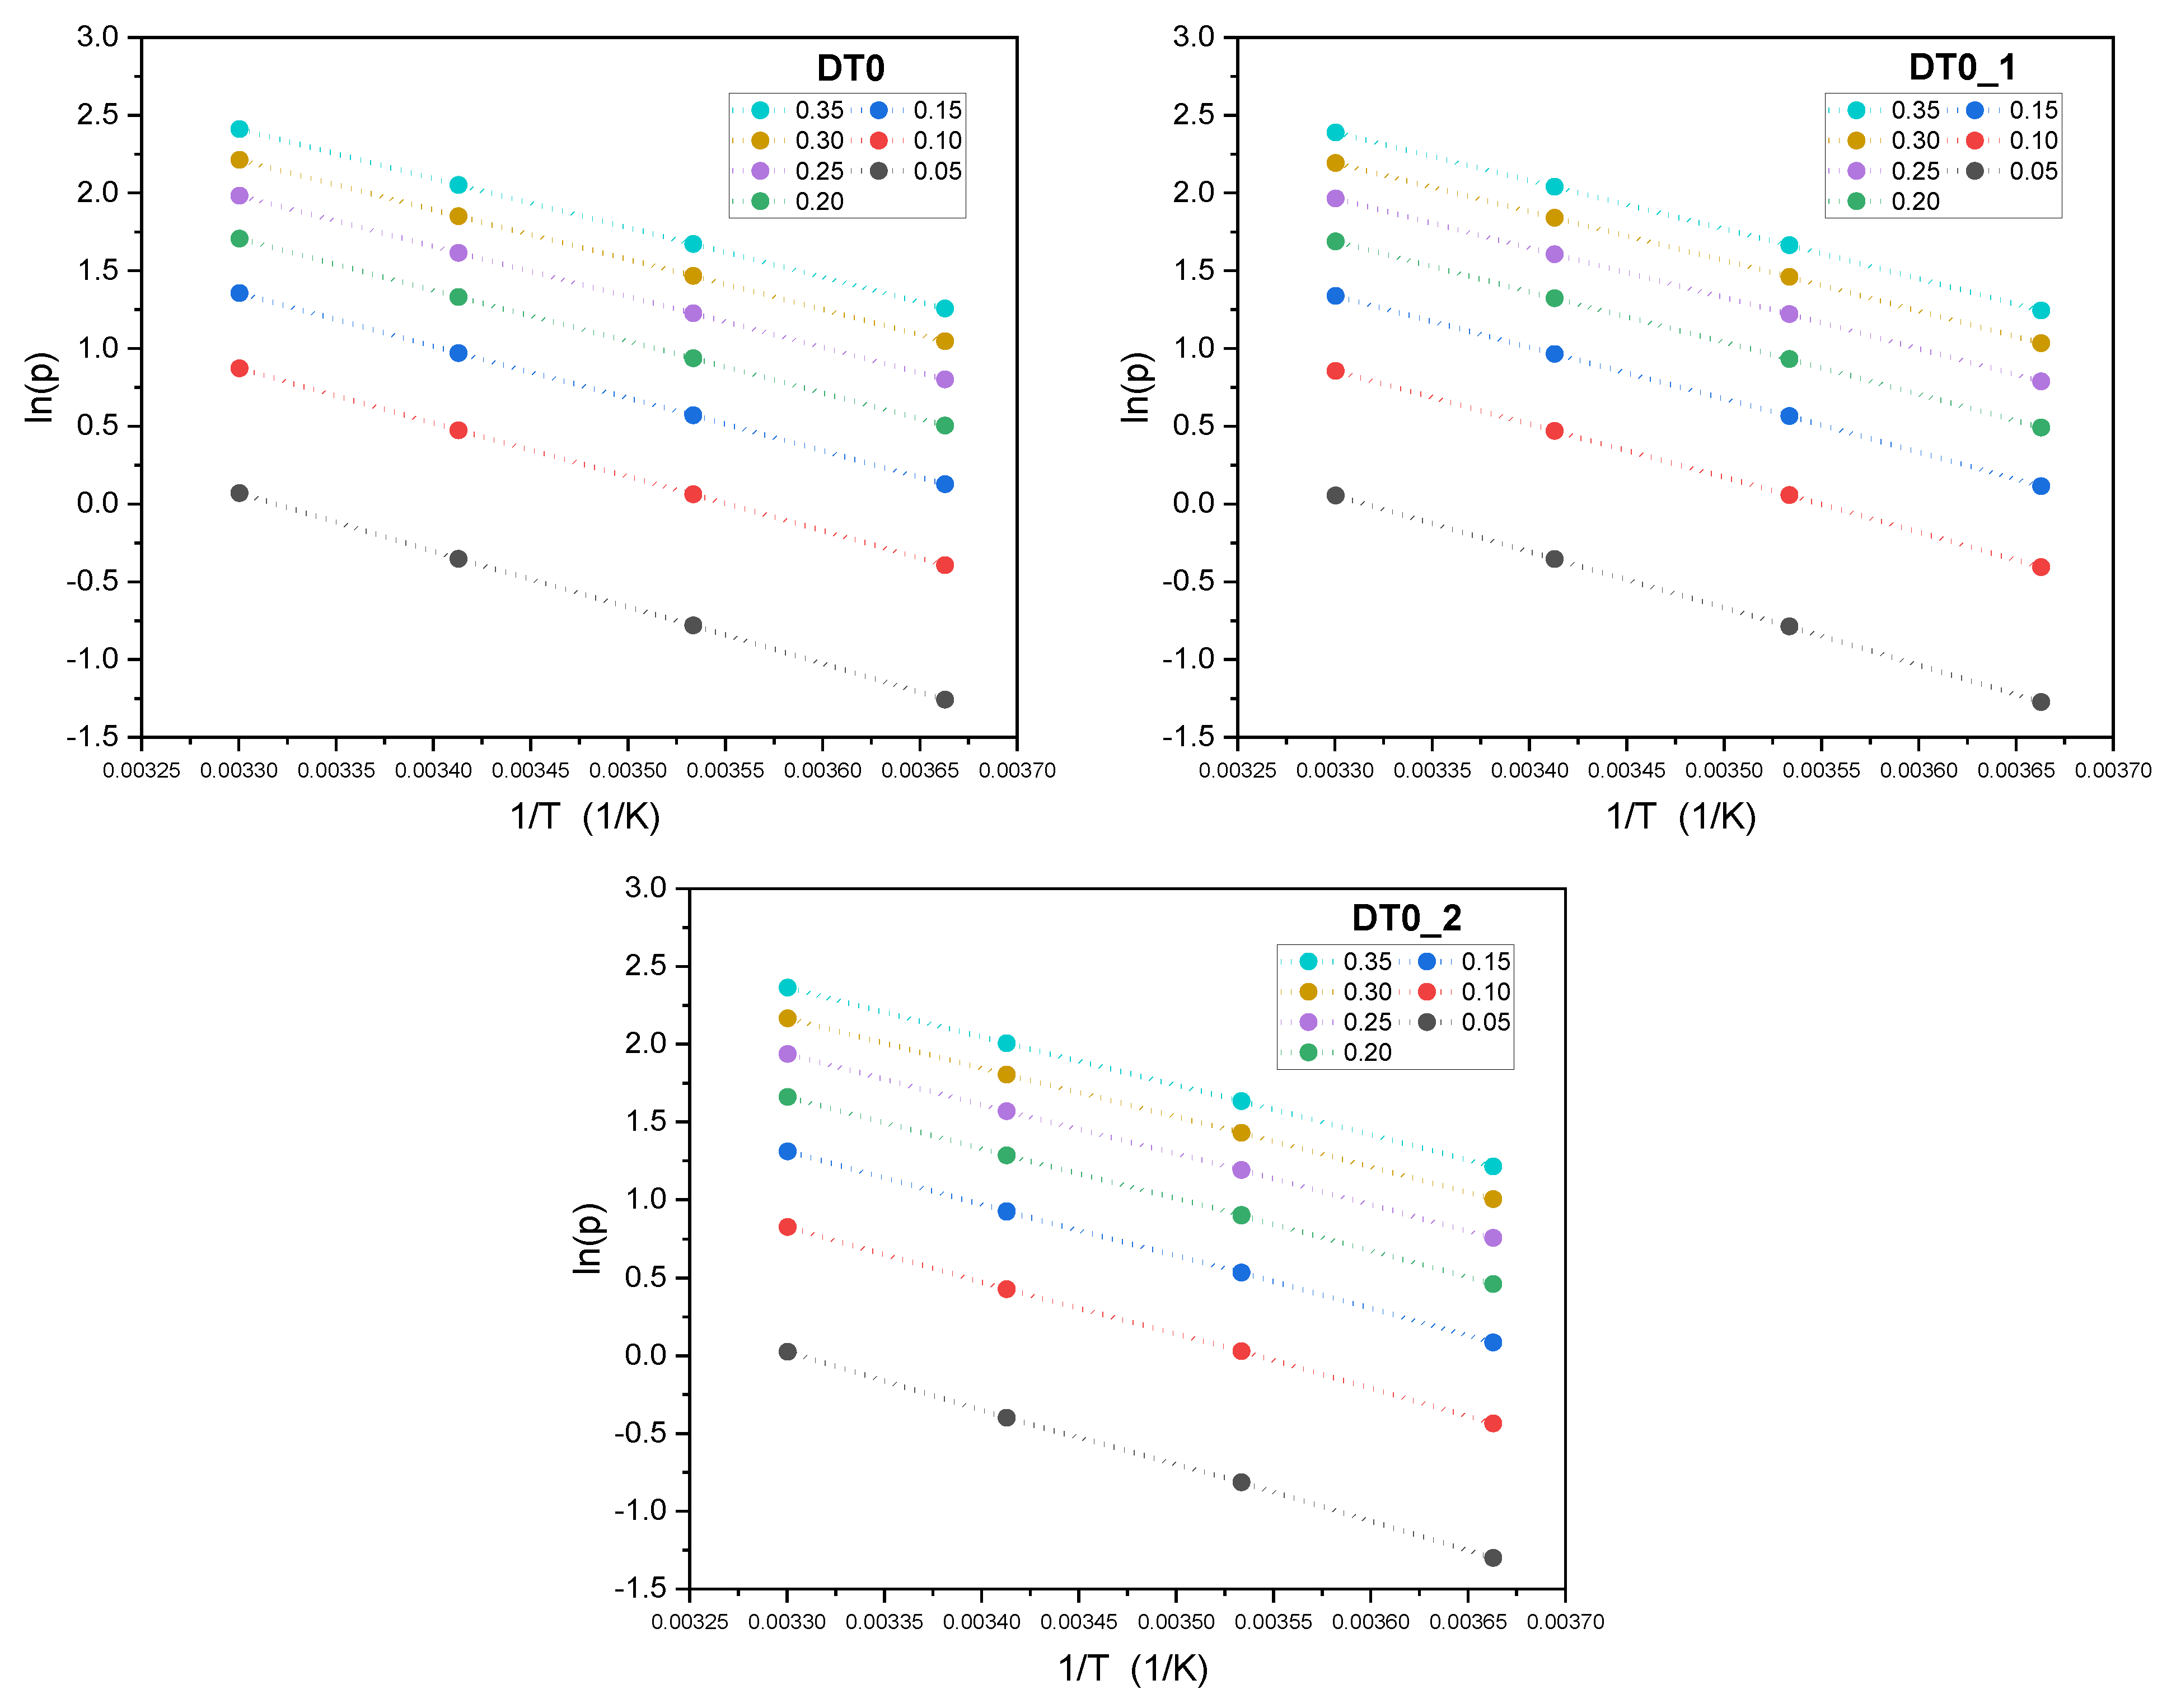
3. Theory
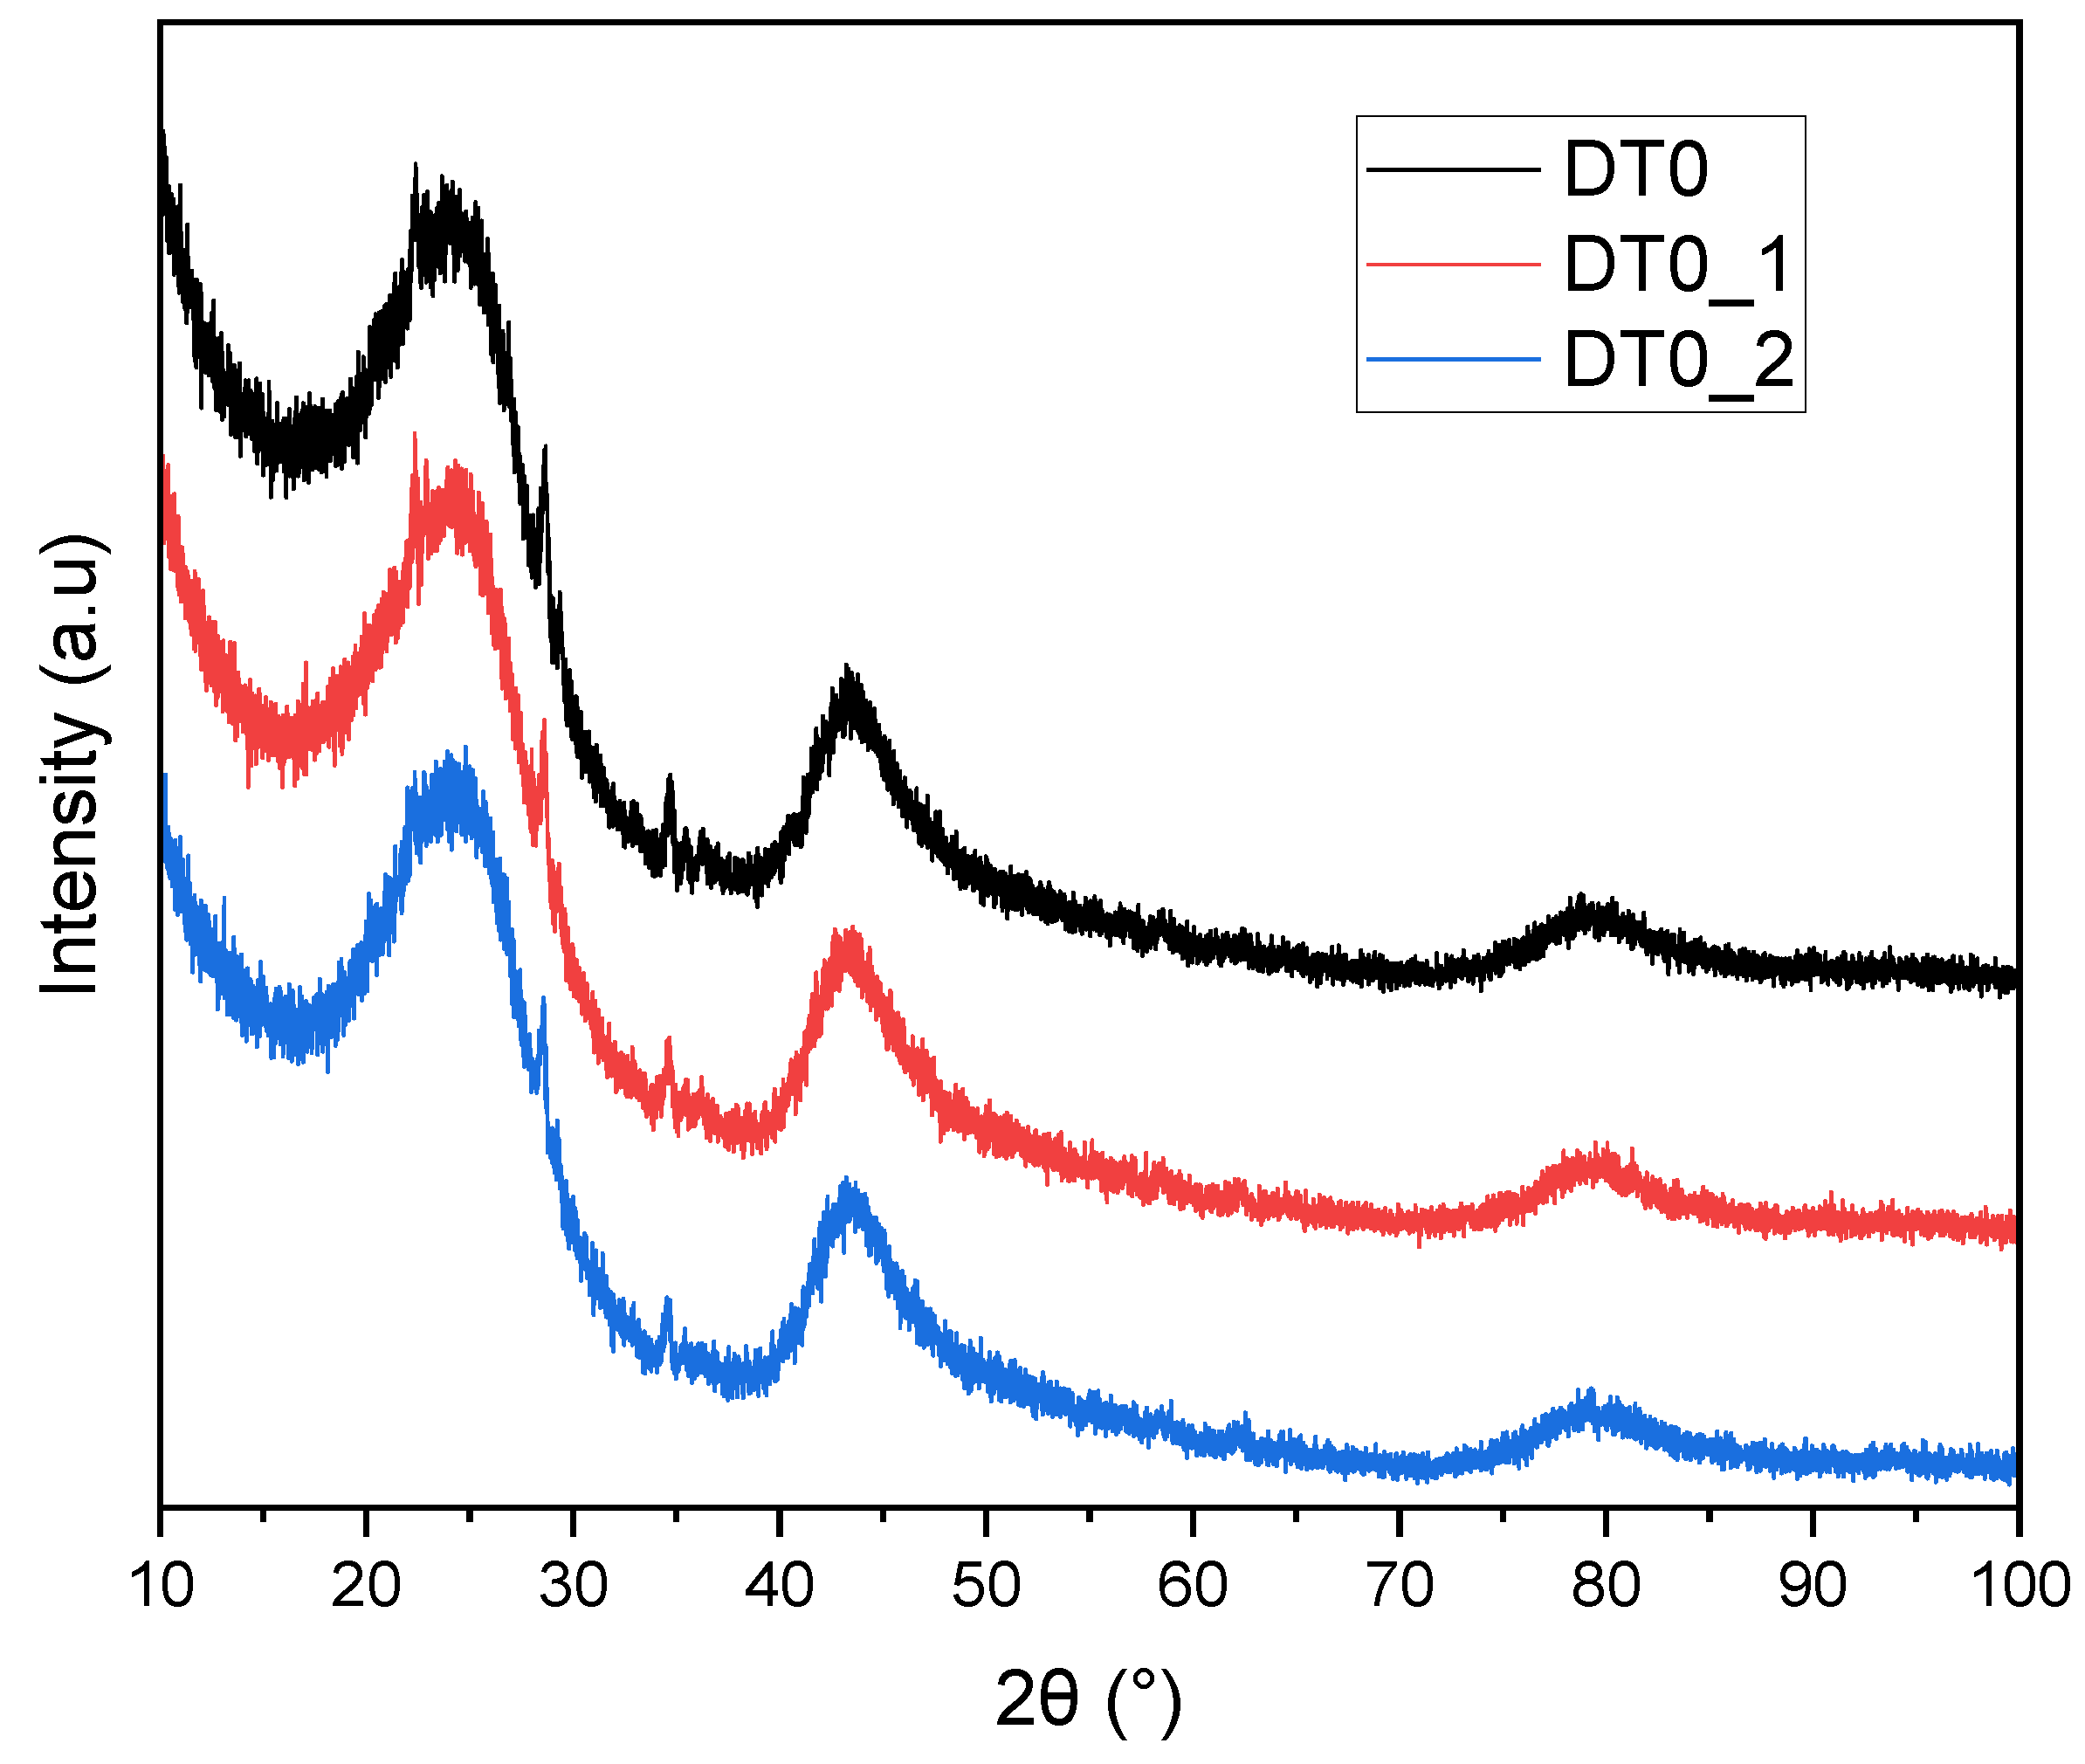
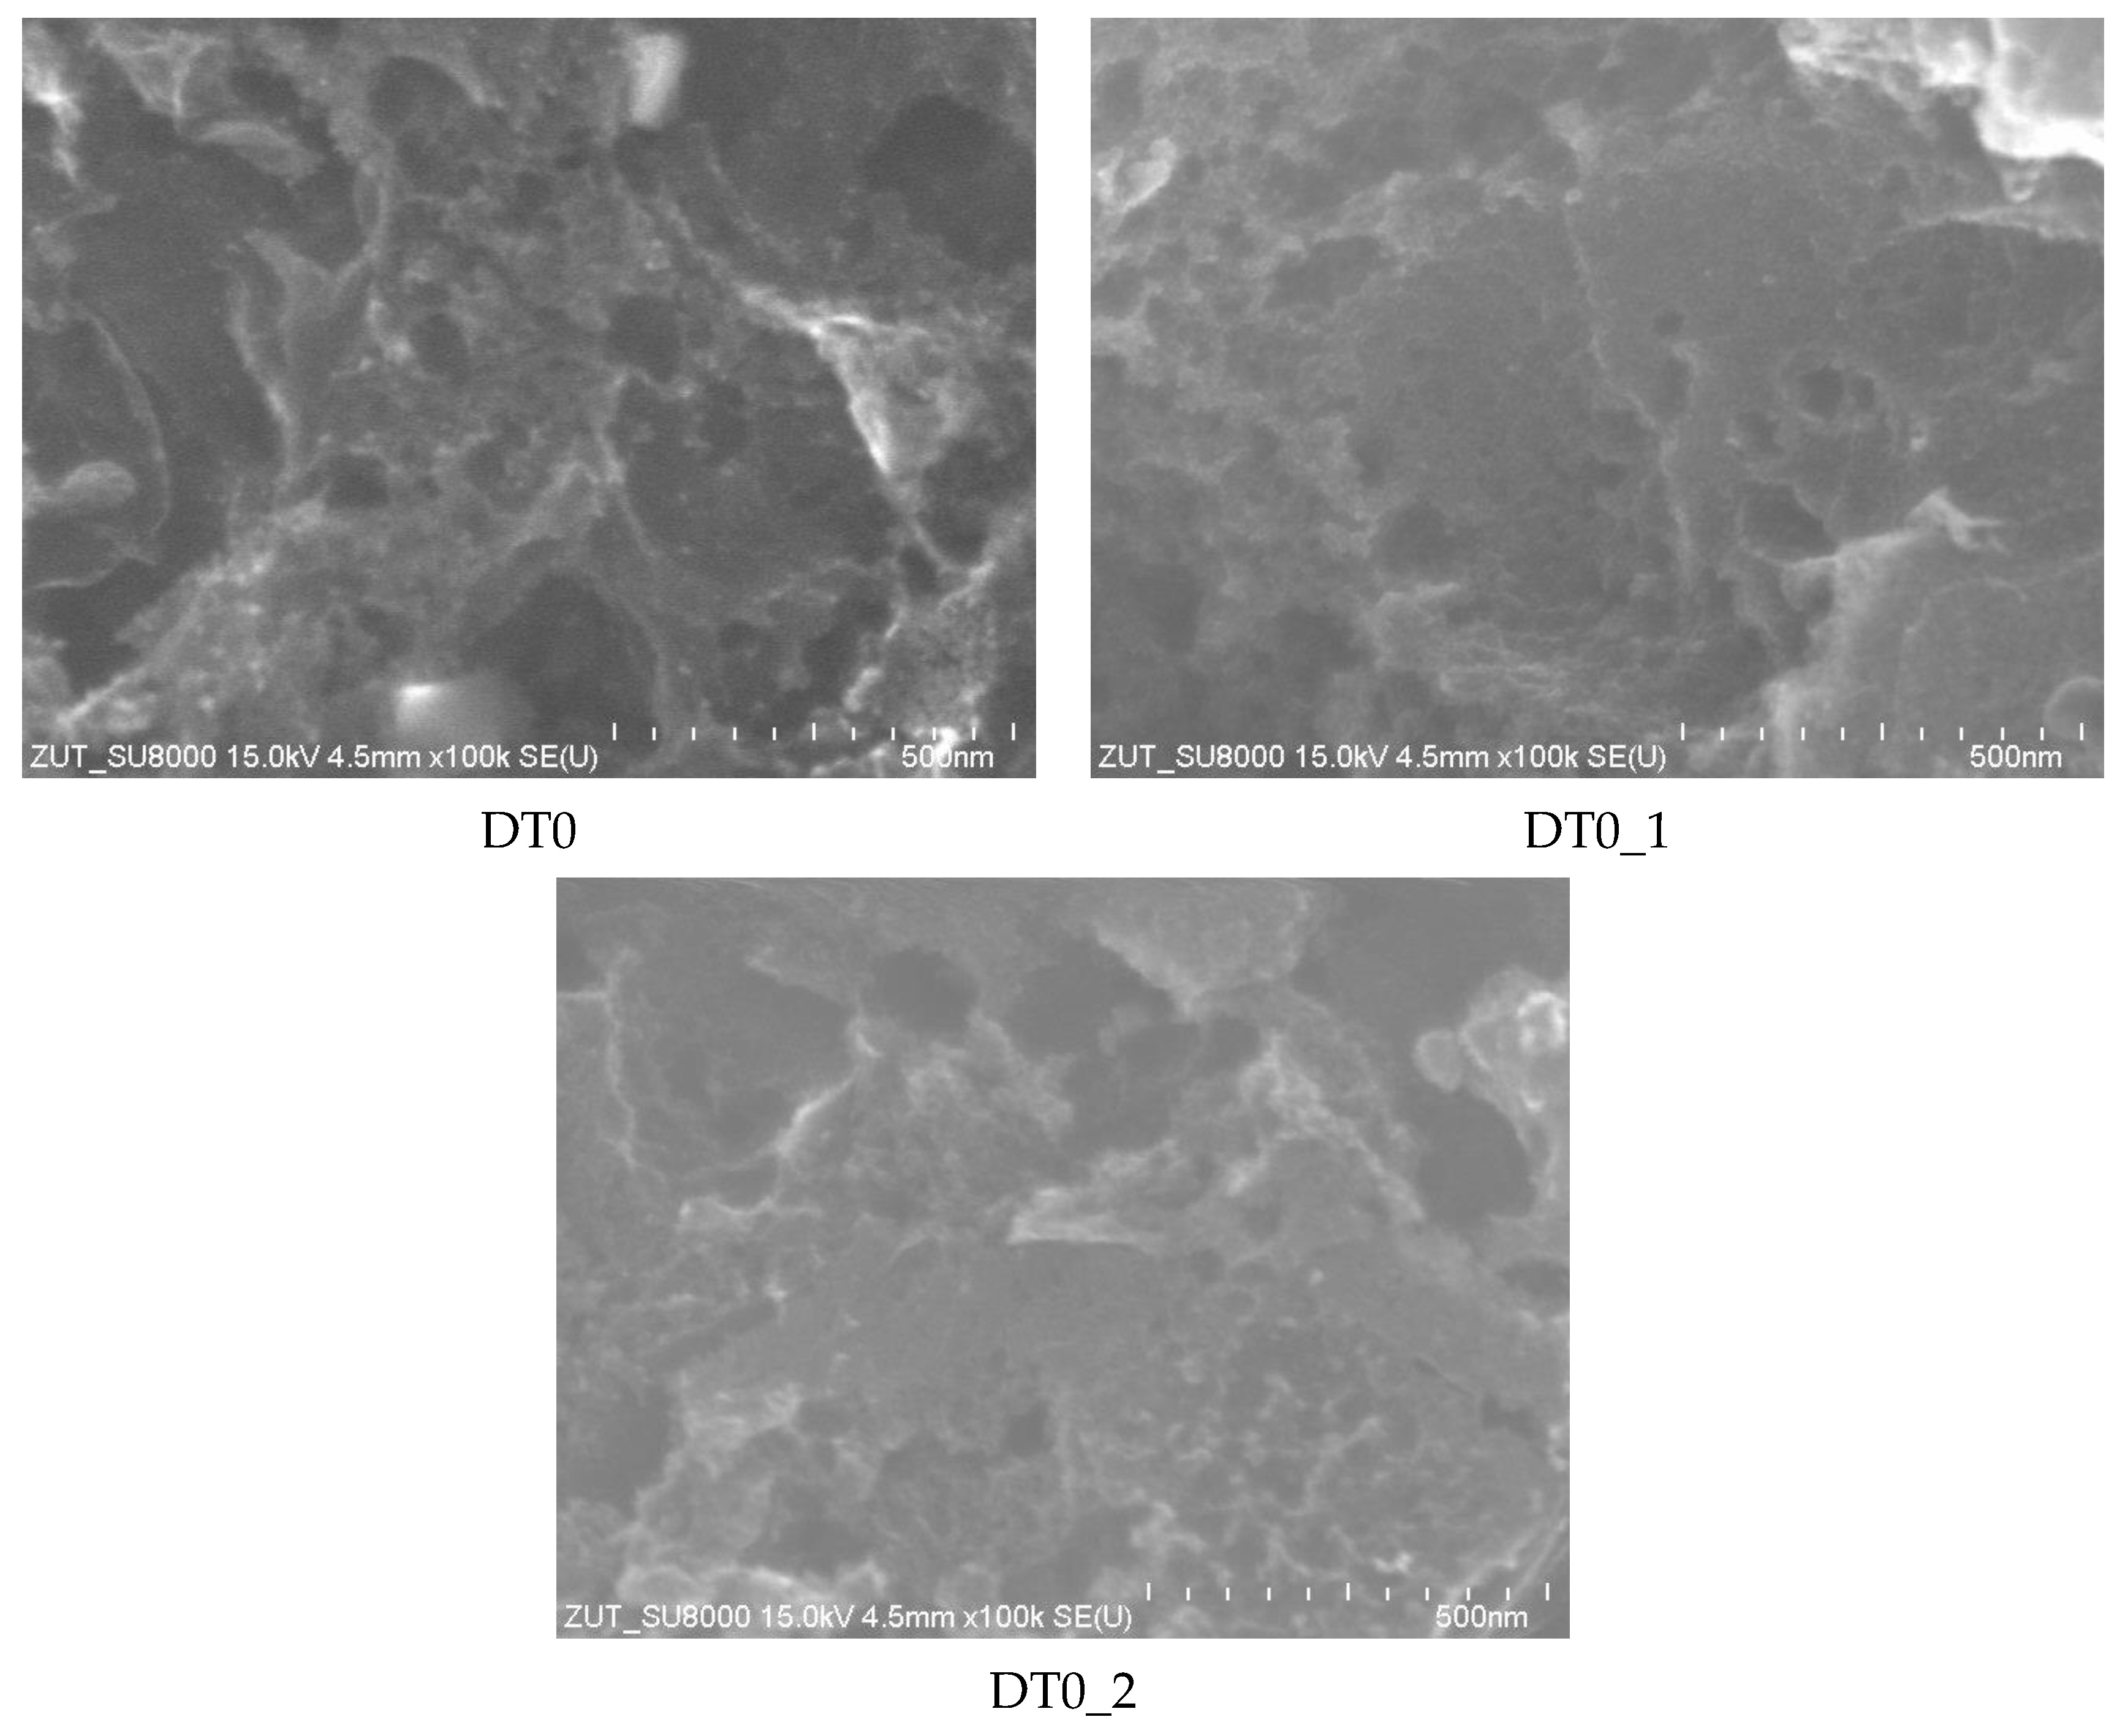
4. Results and Discussion
5. Conclusions
6. Patents
Supplementary Materials
Author Contributions
Funding
Institutional Review Board Statement
Informed Consent Statement
Data Availability Statement
Conflicts of Interest
References
- Sayari, A.; Belmabkhout, Y.; Serna-Guerrero, R. Flue Gas Treatment via CO2 Adsorption. Chem. Eng. J. 2011, 171, 760–774. [Google Scholar] [CrossRef]
- Hofmann, D.J.; Butler, J.H.; Tans, P.P. A New Look at Atmospheric Carbon Dioxide. Atmos. Environ. 2009, 43, 2084–2086. [Google Scholar] [CrossRef]
- Hu, C.; Liu, M.-T.; Sakai, A.; Yoshida, M.; Lin, K.-Y.A.; Huang, C.-C. Synergistic Effect of Cu and Ru Decoration on G-C3N4 for Electrocatalytic CO2 Reduction. J. Ind. Eng. Chem. 2022, 115, 329–338. [Google Scholar] [CrossRef]
- Magnone, E.; Lee, H.J.; Shin, M.C.; Park, J.H. A Performance Comparison Study of Five Single and Sixteen Blended Amine Absorbents for CO2 Capture Using Ceramic Hollow Fiber Membrane Contactors. J. Ind. Eng. Chem. 2021, 100, 174–185. [Google Scholar] [CrossRef]
- Mubarak, S.; Dhamodharan, D.; Byun, H.-S.; Pattanayak, D.K.; Arya, S.B. Efficient Photoelectrocatalytic Conversion of CO2 to Formic Acid Using Ag-TiO2 Nanoparticles Formed on the Surface of Nanoporous Structured Ti Foil. J. Ind. Eng. Chem. 2022, 113, 124–131. [Google Scholar] [CrossRef]
- Malik, A.S.; Zaman, S.F.; Al-Zahrani, A.A.; Daous, M.A. Turning CO2 into Di-Methyl Ether (DME) Using Pd Based Catalysts—Role of Ca in Tuning the Activity and Selectivity. J. Ind. Eng. Chem. 2021, 103, 67–79. [Google Scholar] [CrossRef]
- Trends in Atmospheric Carbon Dioxide (CO2). Available online: https://gml.noaa.gov/ccgg/trends/global.html (accessed on 1 May 2024).
- Rangel-Sequeda, J.F.; Loredo-Cancino, M.; Águeda-Maté, V.I.; Martínez-Vargas, D.X. Tailoring Nitrogen-Doped Activated Carbons: Central Composite Design for Enhanced CO2 Adsorption. ChemistrySelect 2024, 9, e202302805. [Google Scholar] [CrossRef]
- Lai, J.Y.; Ngu, L.H.; Hashim, S.S.; Chew, J.J.; Sunarso, J. Review of Oil Palm-Derived Activated Carbon for CO2 Capture. Carbon Lett. 2021, 31, 201–252. [Google Scholar] [CrossRef]
- Akeeb, O.; Wang, L.; Xie, W.; Davis, R.; Alkasrawi, M.; Toan, S. Post-Combustion CO2 Capture via a Variety of Temperature Ranges and Material Adsorption Process: A Review. J. Environ. Manag. 2022, 313, 115026. [Google Scholar] [CrossRef]
- Gopalan, J.; Buthiyappan, A.; Abdul Raman, A.A. Insight into Metal-Impregnated Biomass Based Activated Carbon for Enhanced Carbon Dioxide Adsorption: A Review. J. Ind. Eng. Chem. 2022, 113, 72–95. [Google Scholar] [CrossRef]
- Kim, M.H.; Choi, S.O.; Choo, S.T. A Role of the Microtextural and Surface Chemical Heterogeneities of Porous Carbons for the Adsorption of CO2, CO and N2. Carbon Lett. 2019, 29, 553–566. [Google Scholar] [CrossRef]
- Gomez-Delgado, E.; Nunell, G.V.; Cukierman, A.L.; Bonelli, P.R. Development of Microporous-Activated Carbons Derived from Two Renewable Precursors for CO2 Capture. Carbon Lett. 2020, 30, 155–164. [Google Scholar] [CrossRef]
- Saha, D.; Kienbaum, M.J. Role of Oxygen, Nitrogen and Sulfur Functionalities on the Surface of Nanoporous Carbons in CO2 Adsorption: A Critical Review. Microporous Mesoporous Mater. 2019, 287, 29–55. [Google Scholar] [CrossRef]
- Hosseini, Y.; Najafi, M.; Khalili, S.; Jahanshahi, M.; Peyravi, M. Assembly of Amine-Functionalized Graphene Oxide for Efficient and Selective Adsorption of CO2. Mater. Chem. Phys. 2021, 270, 124788. [Google Scholar] [CrossRef]
- Petrovic, B.; Gorbounov, M.; Masoudi Soltani, S. Influence of Surface Modification on Selective CO2 Adsorption: A Technical Review on Mechanisms and Methods. Microporous Mesoporous Mater. 2021, 312, 110751. [Google Scholar] [CrossRef]
- Presser, V.; McDonough, J.; Yeon, S.-H.; Gogotsi, Y. Effect of Pore Size on Carbon Dioxide Sorption by Carbide Derived Carbon. Energy Environ. Sci. 2011, 4, 3059. [Google Scholar] [CrossRef]
- Li, D.; Yang, J.; Zhao, Y.; Yuan, H.; Chen, Y. Ultra-Highly Porous Carbon from Wasted Soybean Residue with Tailored Porosity and Doped Structure as Renewable Multi-Purpose Absorbent for Efficient CO2, Toluene and Water Vapor Capture. J. Clean. Prod. 2022, 337, 130283. [Google Scholar] [CrossRef]
- Yuan, H.; Chen, J.; Li, D.; Chen, H.; Chen, Y. 5 Ultramicropore-Rich Renewable Porous Carbon from Biomass Tar with Excellent Adsorption Capacity and Selectivity for CO2 Capture. Chem. Eng. J. 2019, 373, 171–178. [Google Scholar] [CrossRef]
- Sreńscek-Nazzal, J.; Kiełbasa, K. Advances in Modification of Commercial Activated Carbon for Enhancement of CO2 Capture. Appl. Surf. Sci. 2019, 494, 137–151. [Google Scholar] [CrossRef]
- Rehman, A.; Park, S.-J. Comparative Study of Activation Methods to Design Nitrogen-Doped Ultra-Microporous Carbons as Efficient Contenders for CO2 Capture. Chem. Eng. J. 2018, 352, 539–548. [Google Scholar] [CrossRef]
- Lim, G.; Lee, K.B.; Ham, H.C. Effect of N-Containing Functional Groups on CO 2 Adsorption of Carbonaceous Materials: A Density Functional Theory Approach. J. Phys. Chem. C 2016, 120, 8087–8095. [Google Scholar] [CrossRef]
- Saha, D.; Van Bramer, S.E.; Orkoulas, G.; Ho, H.-C.; Chen, J.; Henley, D.K. CO2 Capture in Lignin-Derived and Nitrogen-Doped Hierarchical Porous Carbons. Carbon 2017, 121, 257–266. [Google Scholar] [CrossRef]
- Grundy, M.; Ye, Z. Cross-Linked Polymers of Diethynylbenzene and Phenylacetylene as New Polymer Precursors for High-Yield Synthesis of High-Performance Nanoporous Activated Carbons for Supercapacitors, Hydrogen Storage, and CO2 Capture. J. Mater. Chem. A 2014, 2, 20316–20330. [Google Scholar] [CrossRef]
- Singh, G.; Kim, I.Y.; Lakhi, K.S.; Srivastava, P.; Naidu, R.; Vinu, A. Single Step Synthesis of Activated Bio-Carbons with a High Surface Area and Their Excellent CO2 Adsorption Capacity. Carbon 2017, 116, 448–455. [Google Scholar] [CrossRef]
- Ludwinowicz, J.; Jaroniec, M. Potassium Salt-Assisted Synthesis of Highly Microporous Carbon Spheres for CO2 Adsorption. Carbon 2015, 82, 297–303. [Google Scholar] [CrossRef]
- Martín, C.F.; Plaza, M.G.; García, S.; Pis, J.J.; Rubiera, F.; Pevida, C. Microporous Phenol–Formaldehyde Resin-Based Adsorbents for Pre-Combustion CO2 Capture. Fuel 2011, 90, 2064–2072. [Google Scholar] [CrossRef]
- Bai, R.; Yang, M.; Hu, G.; Xu, L.; Hu, X.; Li, Z.; Wang, S.; Dai, W.; Fan, M. A New Nanoporous Nitrogen-Doped Highly-Efficient Carbonaceous CO2 Sorbent Synthesized with Inexpensive Urea and Petroleum Coke. Carbon 2015, 81, 465–473. [Google Scholar] [CrossRef]
- Sethia, G.; Sayari, A. Comprehensive Study of Ultra-Microporous Nitrogen-Doped Activated Carbon for CO2 Capture. Carbon 2015, 93, 68–80. [Google Scholar] [CrossRef]
- Sivadas, D.L.; Vijayan, S.; Rajeev, R.; Ninan, K.N.; Prabhakaran, K. Nitrogen-Enriched Microporous Carbon Derived from Sucrose and Urea with Superior CO2 Capture Performance. Carbon 2016, 109, 7–18. [Google Scholar] [CrossRef]
- Díez, N.; Álvarez, P.; Granda, M.; Blanco, C.; Santamaría, R.; Menéndez, R. CO2 Adsorption Capacity and Kinetics in Nitrogen-Enriched Activated Carbon Fibers Prepared by Different Methods. Chem. Eng. J. 2015, 281, 704–712. [Google Scholar] [CrossRef]
- Morales-Ospino, R.; Canevesi, R.L.S.; Schaefer, S.; Celzard, A.; Fierro, V. Is Heteroatom Doping of Activated Carbons Always a Good Strategy for Enhancing CO2 Adsorption? Chem. Eng. J. 2024, 479, 147638. [Google Scholar] [CrossRef]
- Gotzias, A.; Tylianakis, E.; Froudakis, G.; Steriotis, T. Adsorption in Micro and Mesoporous Slit Carbons with Oxygen Surface Functionalities. Microporous Mesoporous Mater. 2015, 209, 141–149. [Google Scholar] [CrossRef]
- Travis, C.C.; Etnier, E.L. A Survey of Sorption Relationships for Reactive Solutes in Soil. J. Environ. Qual. 1981, 10, 8–17. [Google Scholar] [CrossRef]
- Podder, M.S.; Majumder, C.B. Studies on the Removal of As(III) and As(V) through Their Adsorption onto Granular Activated Carbon/MnFe2O4 Composite: Isotherm Studies and Error Analysis. Compos. Interfaces 2016, 23, 327–372. [Google Scholar] [CrossRef]
- Tran, H.N.; Bollinger, J.-C.; Lima, E.C.; Juang, R.-S. How to Avoid Mistakes in Treating Adsorption Isotherm Data (Liquid and Solid Phases): Some Comments about Correctly Using Radke-Prausnitz Nonlinear Model and Langmuir Equilibrium Constant. J. Environ. Manag. 2023, 325, 116475. [Google Scholar] [CrossRef] [PubMed]
- Elmorsi, T.M. Equilibrium Isotherms and Kinetic Studies of Removal of Methylene Blue Dye by Adsorption onto Miswak Leaves as a Natural Adsorbent. J. Environ. Prot. 2011, 2, 817–827. [Google Scholar] [CrossRef]
- Ayawei, N.; Angaye, S.S.; Wankasi, D.; Dikio, E.D. Synthesis, Characterization and Application of Mg/Al Layered Double Hydroxide for the Degradation of Congo Red in Aqueous Solution. Open J. Phys. Chem. 2015, 05, 56–70. [Google Scholar] [CrossRef]
- Kumar, K.V.; Porkodi, K.; Rocha, F. Comparison of Various Error Functions in Predicting the Optimum Isotherm by Linear and Non-Linear Regression Analysis for the Sorption of Basic Red 9 by Activated Carbon. J. Hazard. Mater. 2008, 150, 158–165. [Google Scholar] [CrossRef] [PubMed]
- Nabais, J.M.V.; Gomes, J.A.; Suhas; Carrott, P.J.M.; Laginhas, C.; Roman, S. Phenol Removal onto Novel Activated Carbons Made from Lignocellulosic Precursors: Influence of Surface Properties. J. Hazard. Mater. 2009, 167, 904–910. [Google Scholar] [CrossRef] [PubMed]
- Shiryaev, A.A.; Voloshchuk, A.M.; Volkov, V.V.; Averin, A.A.; Artamonova, S.D. Nanoporous Active Carbons at Ambient Conditions: A Comparative Study Using X-Ray Scattering and Diffraction, Raman Spectroscopy and N2 Adsorption. J. Phys. Conf. Ser. 2017, 848, 012009. [Google Scholar] [CrossRef]
- Rouzitalab, Z.; Mohammady Maklavany, D.; Rashidi, A.; Jafarinejad, S. Synthesis of N-Doped Nanoporous Carbon from Walnut Shell for Enhancing CO2 Adsorption Capacity and Separation. J. Environ. Chem. Eng. 2018, 6, 6653–6663. [Google Scholar] [CrossRef]
- Xiong, Z.; Shihong, Z.; Haiping, Y.; Tao, S.; Yingquan, C.; Hanping, C. Influence of NH3/CO2 Modification on the Characteristic of Biochar and the CO2 Capture. BioEnergy Res. 2013, 6, 1147–1153. [Google Scholar] [CrossRef]
- Geng, Z.; Xiao, Q.; Lv, H.; Li, B.; Wu, H.; Lu, Y.; Zhang, C. One-Step Synthesis of Microporous Carbon Monoliths Derived from Biomass with High Nitrogen Doping Content for Highly Selective CO2 Capture. Sci. Rep. 2016, 6, 30049. [Google Scholar] [CrossRef] [PubMed]
- Sevilla, M.; Valle-Vigón, P.; Fuertes, A.B. N-Doped Polypyrrole-Based Porous Carbons for CO2 Capture. Adv. Funct. Mater. 2011, 21, 2781–2787. [Google Scholar] [CrossRef]
- Phan, H.H.; Nguyen, V.T.T.; Nguyen, S.T.; Huynh, H.K.P.; Phan, A.N. A Novel Method to Greener Carbon Material for CO2 Adsorption. Appl. Surf. Sci. Adv. 2023, 13, 100363. [Google Scholar] [CrossRef]


| AC | BET | Vtot | Vmicro | CN2 |
|---|---|---|---|---|
| m2/g | cm3/g | cm3/g | wt % | |
| DT0 | 1177 | 0.631 | 0.383 | 0.9 |
| DT0_1 | 1164 | 0.622 | 0.380 | 1.0 |
| DT0_2 | 1181 | 0.632 | 0.385 | 1.0 |
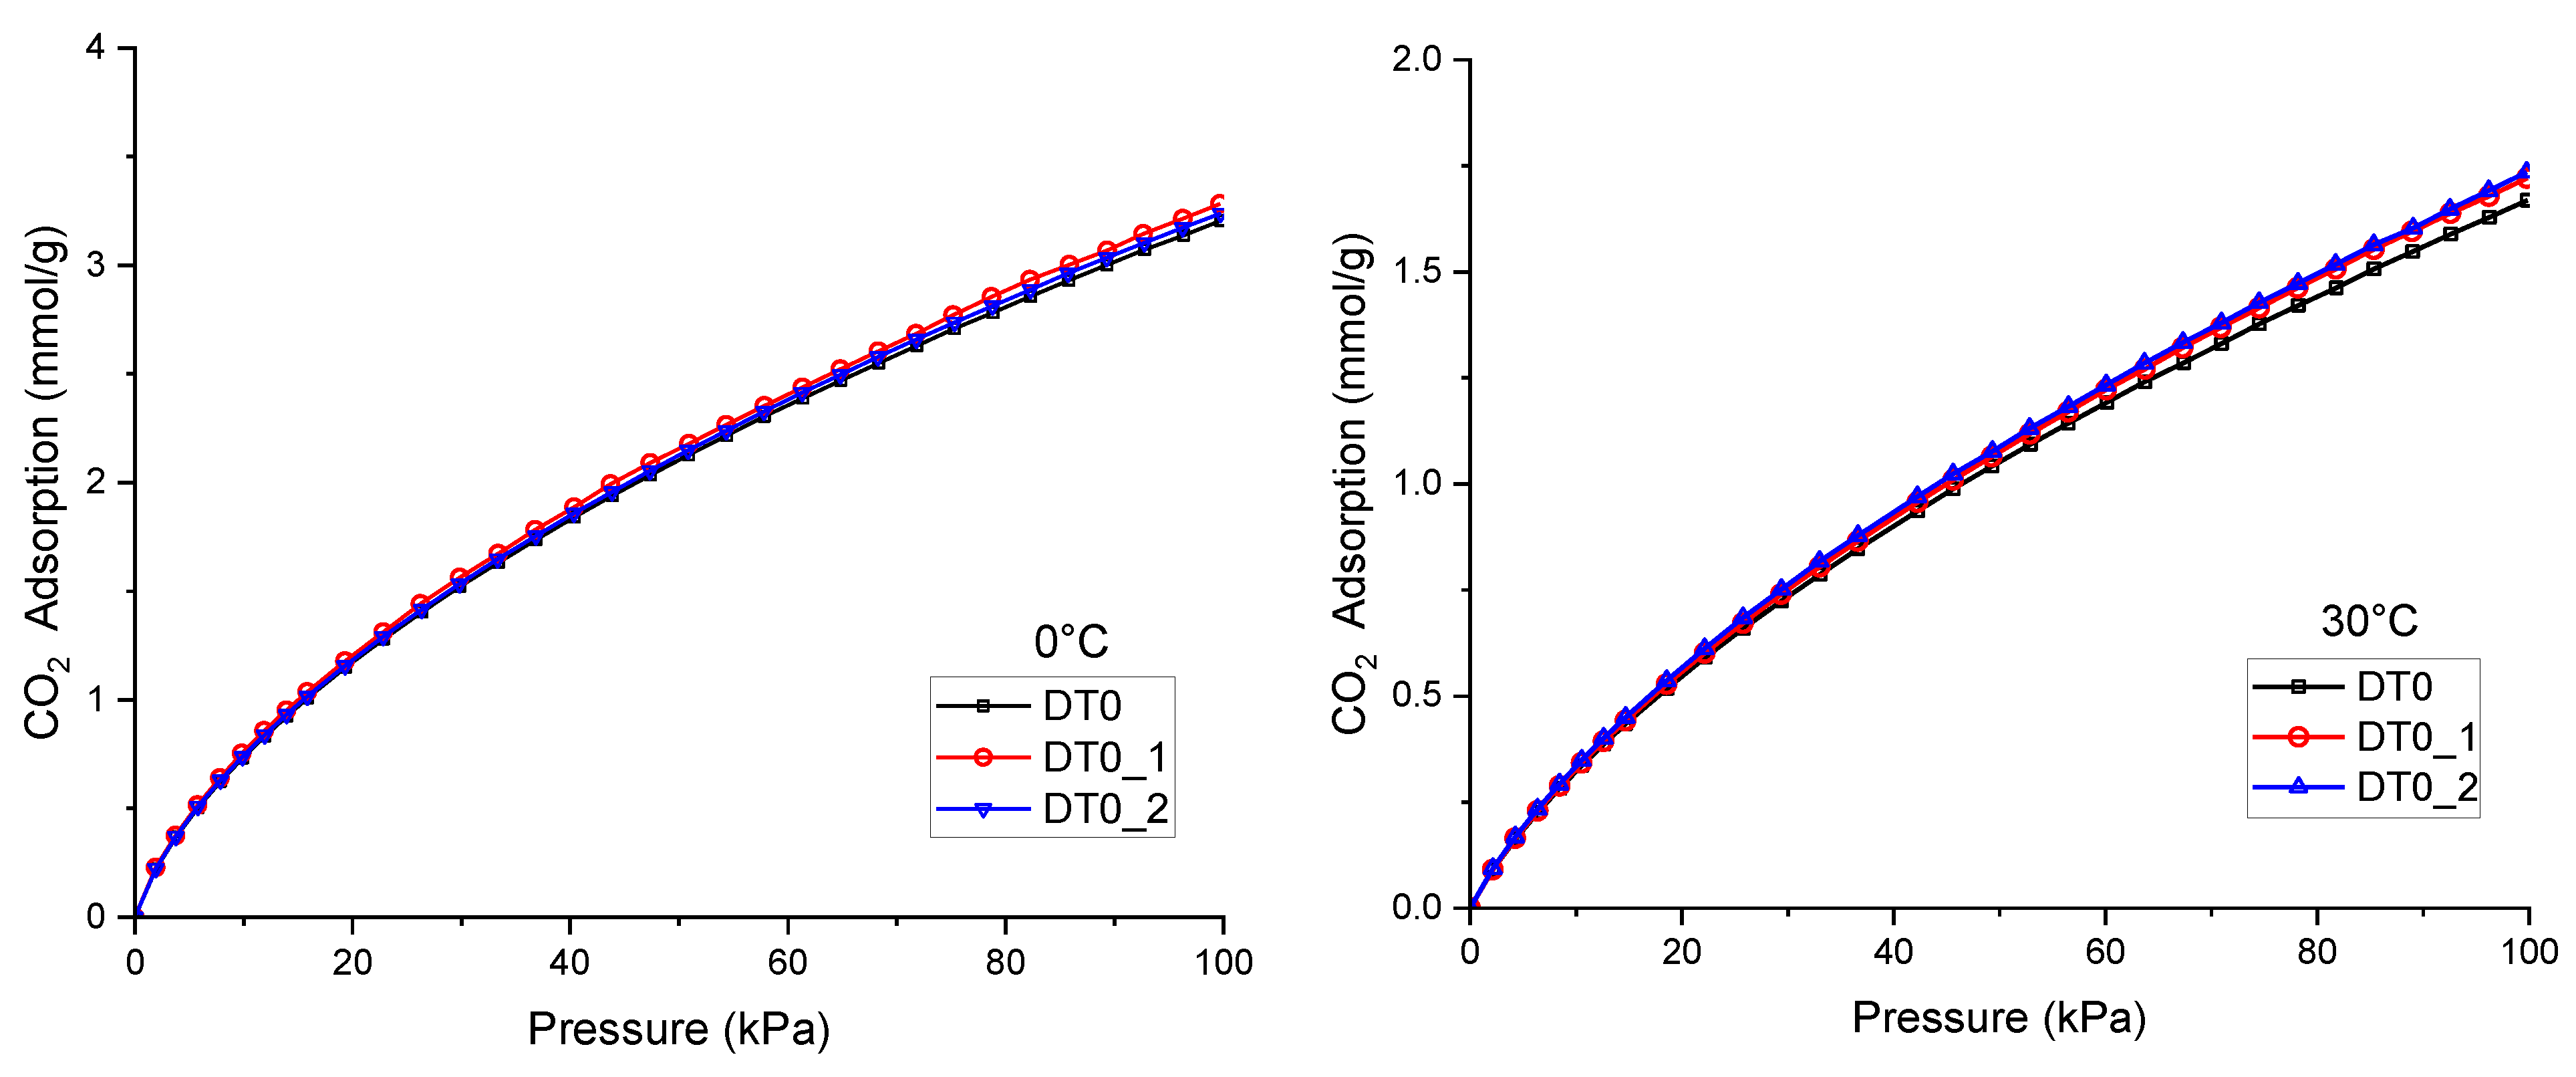
| The CO2 Adsorption at 100 kPa [mmol/g] | Percentage Increase in CO2 Adsorption | |||||||
|---|---|---|---|---|---|---|---|---|
| 0 °C | 10 °C | 20 °C | 30 °C | 0 °C | 10 °C | 20 °C | 30 °C | |
| DT0 | 3.2 | 2.6 | 2.08 | 1.67 | ||||
| DT0_1 | 3.24 | 2.65 | 2.13 | 1.72 | 1.25% | 1.92% | 2.40% | 2.99% |
| DT0_2 | 3.28 | 2.69 | 2.15 | 1.73 | 2.50% | 3.46% | 3.37% | 3.59% |
| Temperature [°C] | ||||
|---|---|---|---|---|
| 0 | 10 | 20 | 30 | |
| DT0 | ||||
| qmT | 326 | 167 | 115 | 44 |
| bT | 0.0016 | 0.0015 | 0.0012 | 0.0016 |
| nT | 0.1915 | 0.2228 | 0.2474 | 0.3104 |
| HYBRID | 3.94 × 10−05 | 3.76 × 10−05 | 1.45 × 10−05 | 5.34 × 10−06 |
| DT0_1 | ||||
| qmT | 364 | 244 | 125 | 56 |
| bT | 0.0015 | 0.0011 | 0.0011 | 0.0013 |
| nT | 0.1884 | 0.2112 | 0.2468 | 0.2996 |
| HYBRID | 3.97 × 10−05 | 2.55 × 10−05 | 1.70 × 10−05 | 1.64 × 10−05 |
| DT0_2 | ||||
| qmT | 306 | 201 | 129 | 49 |
| bT | 0.0017 | 0.0013 | 0.0011 | 0.0015 |
| nT | 0.1932 | 0.2179 | 0.2429 | 0.3059 |
| HYBRID | 1.14 × 10−04 | 5.40 × 10−05 | 2.40 × 10−05 | 1.39 × 10−05 |
Disclaimer/Publisher’s Note: The statements, opinions and data contained in all publications are solely those of the individual author(s) and contributor(s) and not of MDPI and/or the editor(s). MDPI and/or the editor(s) disclaim responsibility for any injury to people or property resulting from any ideas, methods, instructions or products referred to in the content. |
© 2024 by the authors. Licensee MDPI, Basel, Switzerland. This article is an open access article distributed under the terms and conditions of the Creative Commons Attribution (CC BY) license (https://creativecommons.org/licenses/by/4.0/).
Share and Cite
Siemak, J.; Ulejczyk, B.; Mikołajczak, G.; Pęksiński, J.; Sreńscek-Nazzal, J.; Młotek, M.; Krawczyk, K.; Michalkiewicz, B. Cold Nitrogen Plasma: A Groundbreaking Eco-Friendly Technique for the Surface Modification of Activated Carbon Aimed at Elevating Its Carbon Dioxide Adsorption Capacity. Appl. Sci. 2024, 14, 6438. https://doi.org/10.3390/app14156438
Siemak J, Ulejczyk B, Mikołajczak G, Pęksiński J, Sreńscek-Nazzal J, Młotek M, Krawczyk K, Michalkiewicz B. Cold Nitrogen Plasma: A Groundbreaking Eco-Friendly Technique for the Surface Modification of Activated Carbon Aimed at Elevating Its Carbon Dioxide Adsorption Capacity. Applied Sciences. 2024; 14(15):6438. https://doi.org/10.3390/app14156438
Chicago/Turabian StyleSiemak, Joanna, Bogdan Ulejczyk, Grzegorz Mikołajczak, Jakub Pęksiński, Joanna Sreńscek-Nazzal, Michał Młotek, Krzysztof Krawczyk, and Beata Michalkiewicz. 2024. "Cold Nitrogen Plasma: A Groundbreaking Eco-Friendly Technique for the Surface Modification of Activated Carbon Aimed at Elevating Its Carbon Dioxide Adsorption Capacity" Applied Sciences 14, no. 15: 6438. https://doi.org/10.3390/app14156438
APA StyleSiemak, J., Ulejczyk, B., Mikołajczak, G., Pęksiński, J., Sreńscek-Nazzal, J., Młotek, M., Krawczyk, K., & Michalkiewicz, B. (2024). Cold Nitrogen Plasma: A Groundbreaking Eco-Friendly Technique for the Surface Modification of Activated Carbon Aimed at Elevating Its Carbon Dioxide Adsorption Capacity. Applied Sciences, 14(15), 6438. https://doi.org/10.3390/app14156438