
Controllability of Pre-Chamber Induced Homogeneous Charge Compression Ignition and Performance Comparison with Pre-Chamber Spark Ignition and Homogeneous Charge Compression Ignition
Abstract
:1. Introduction
2. Methods
2.1. Experimental Measurements
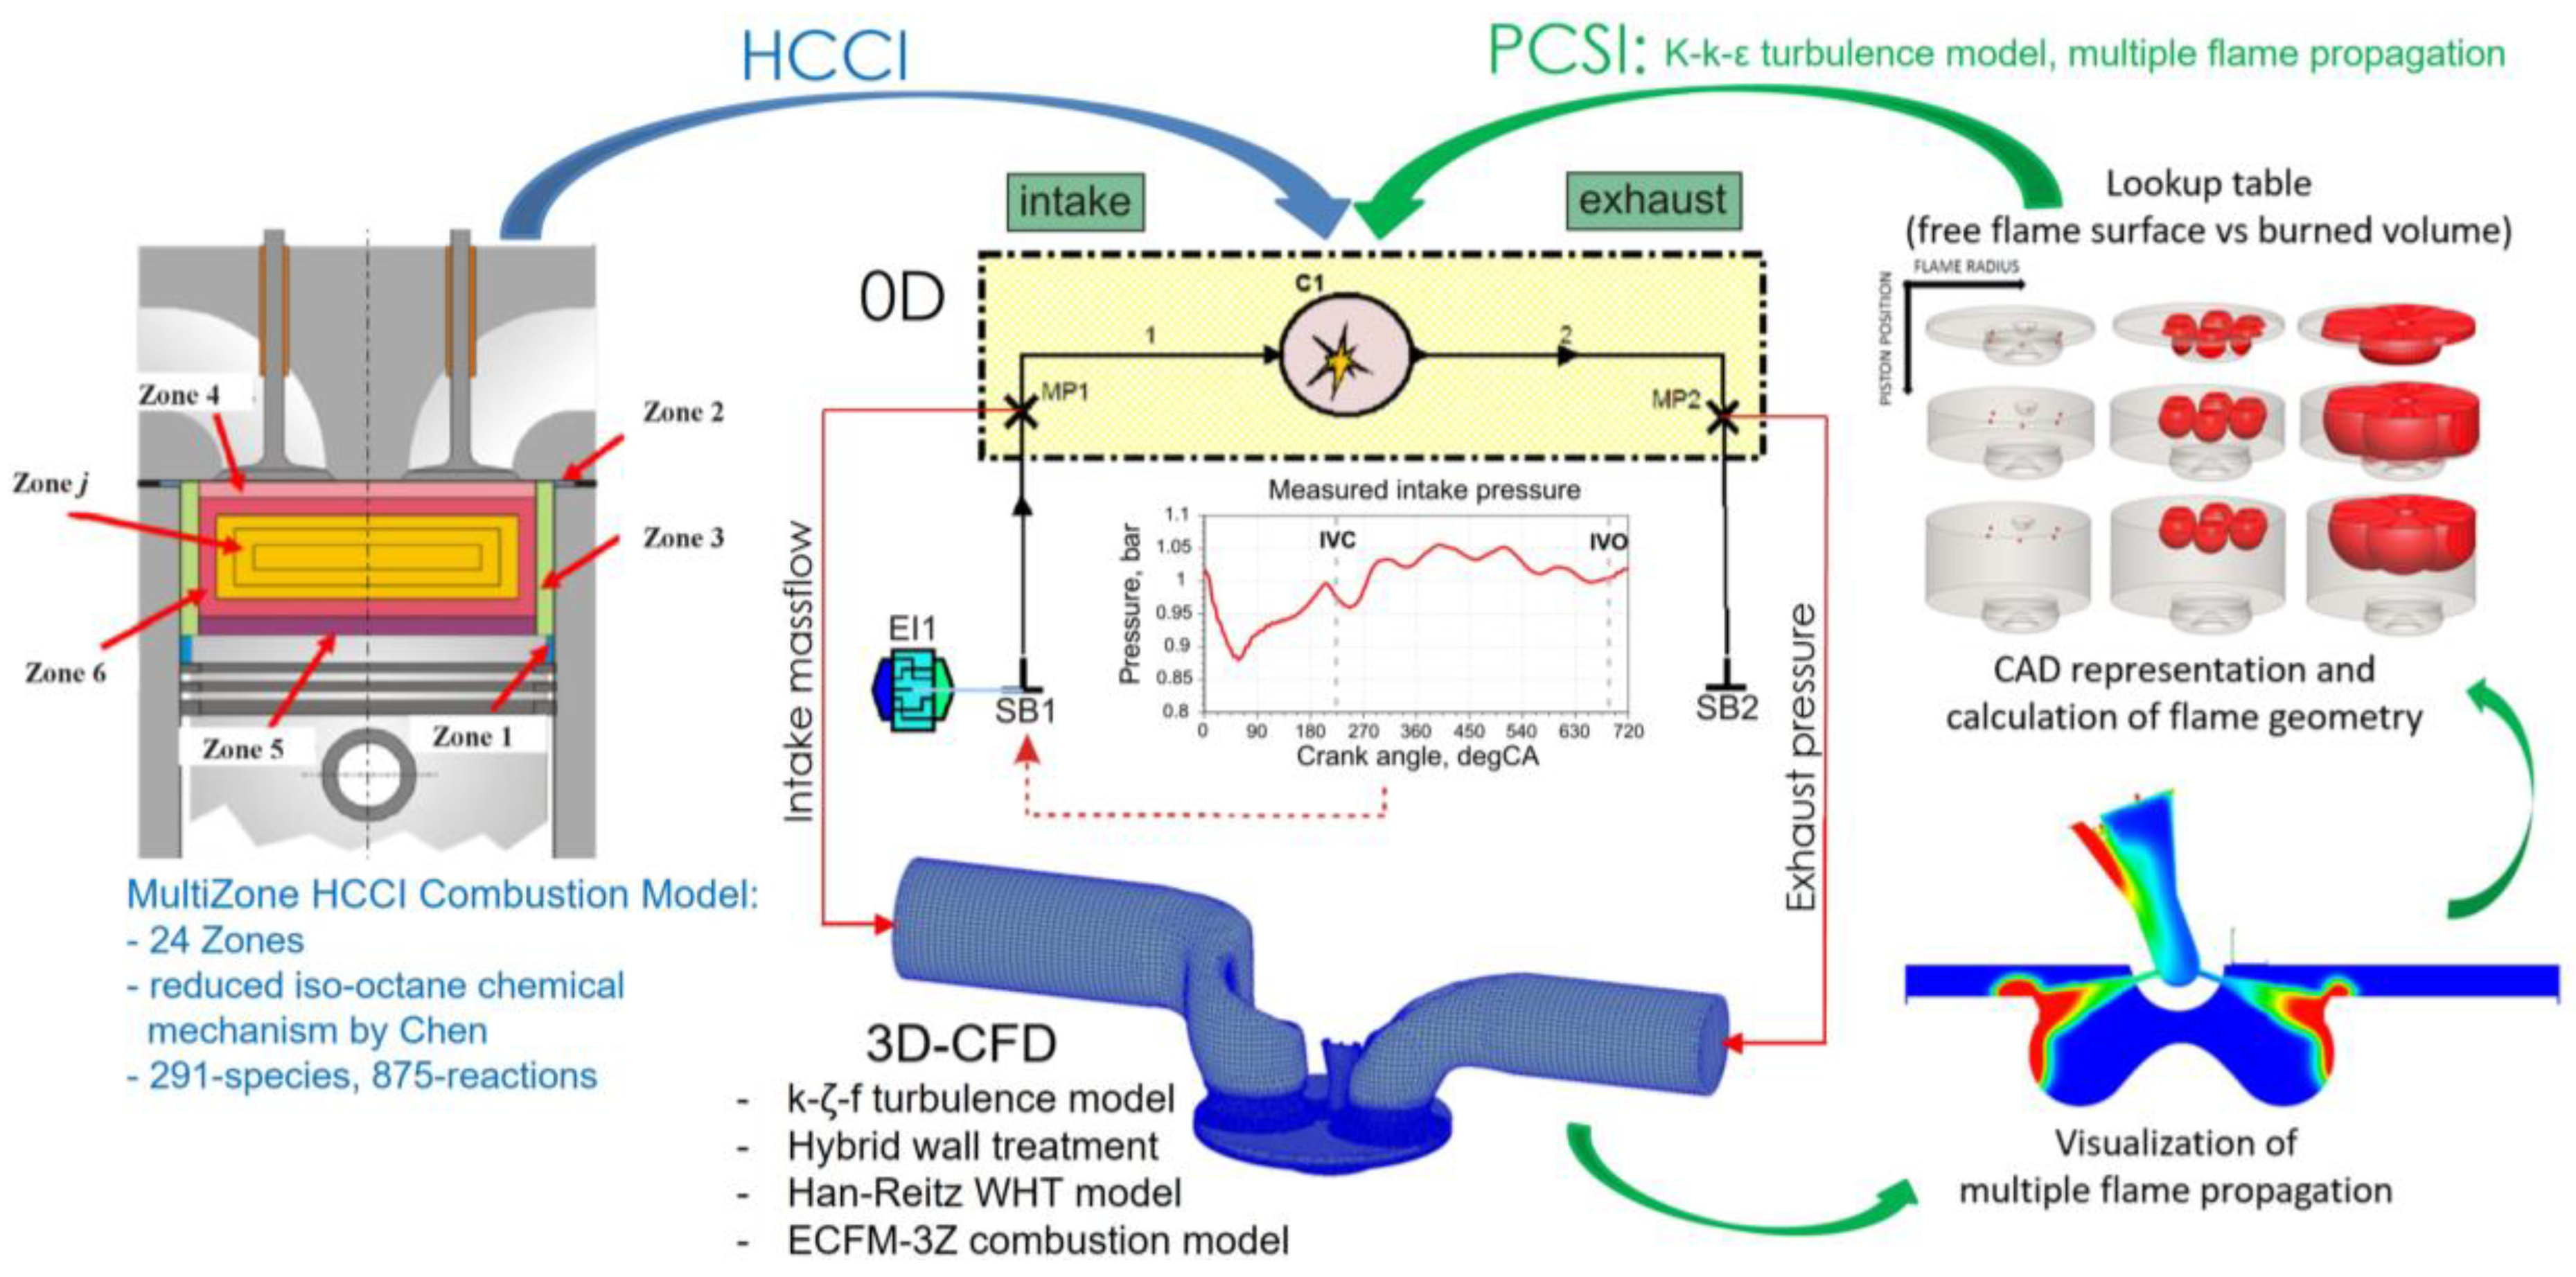
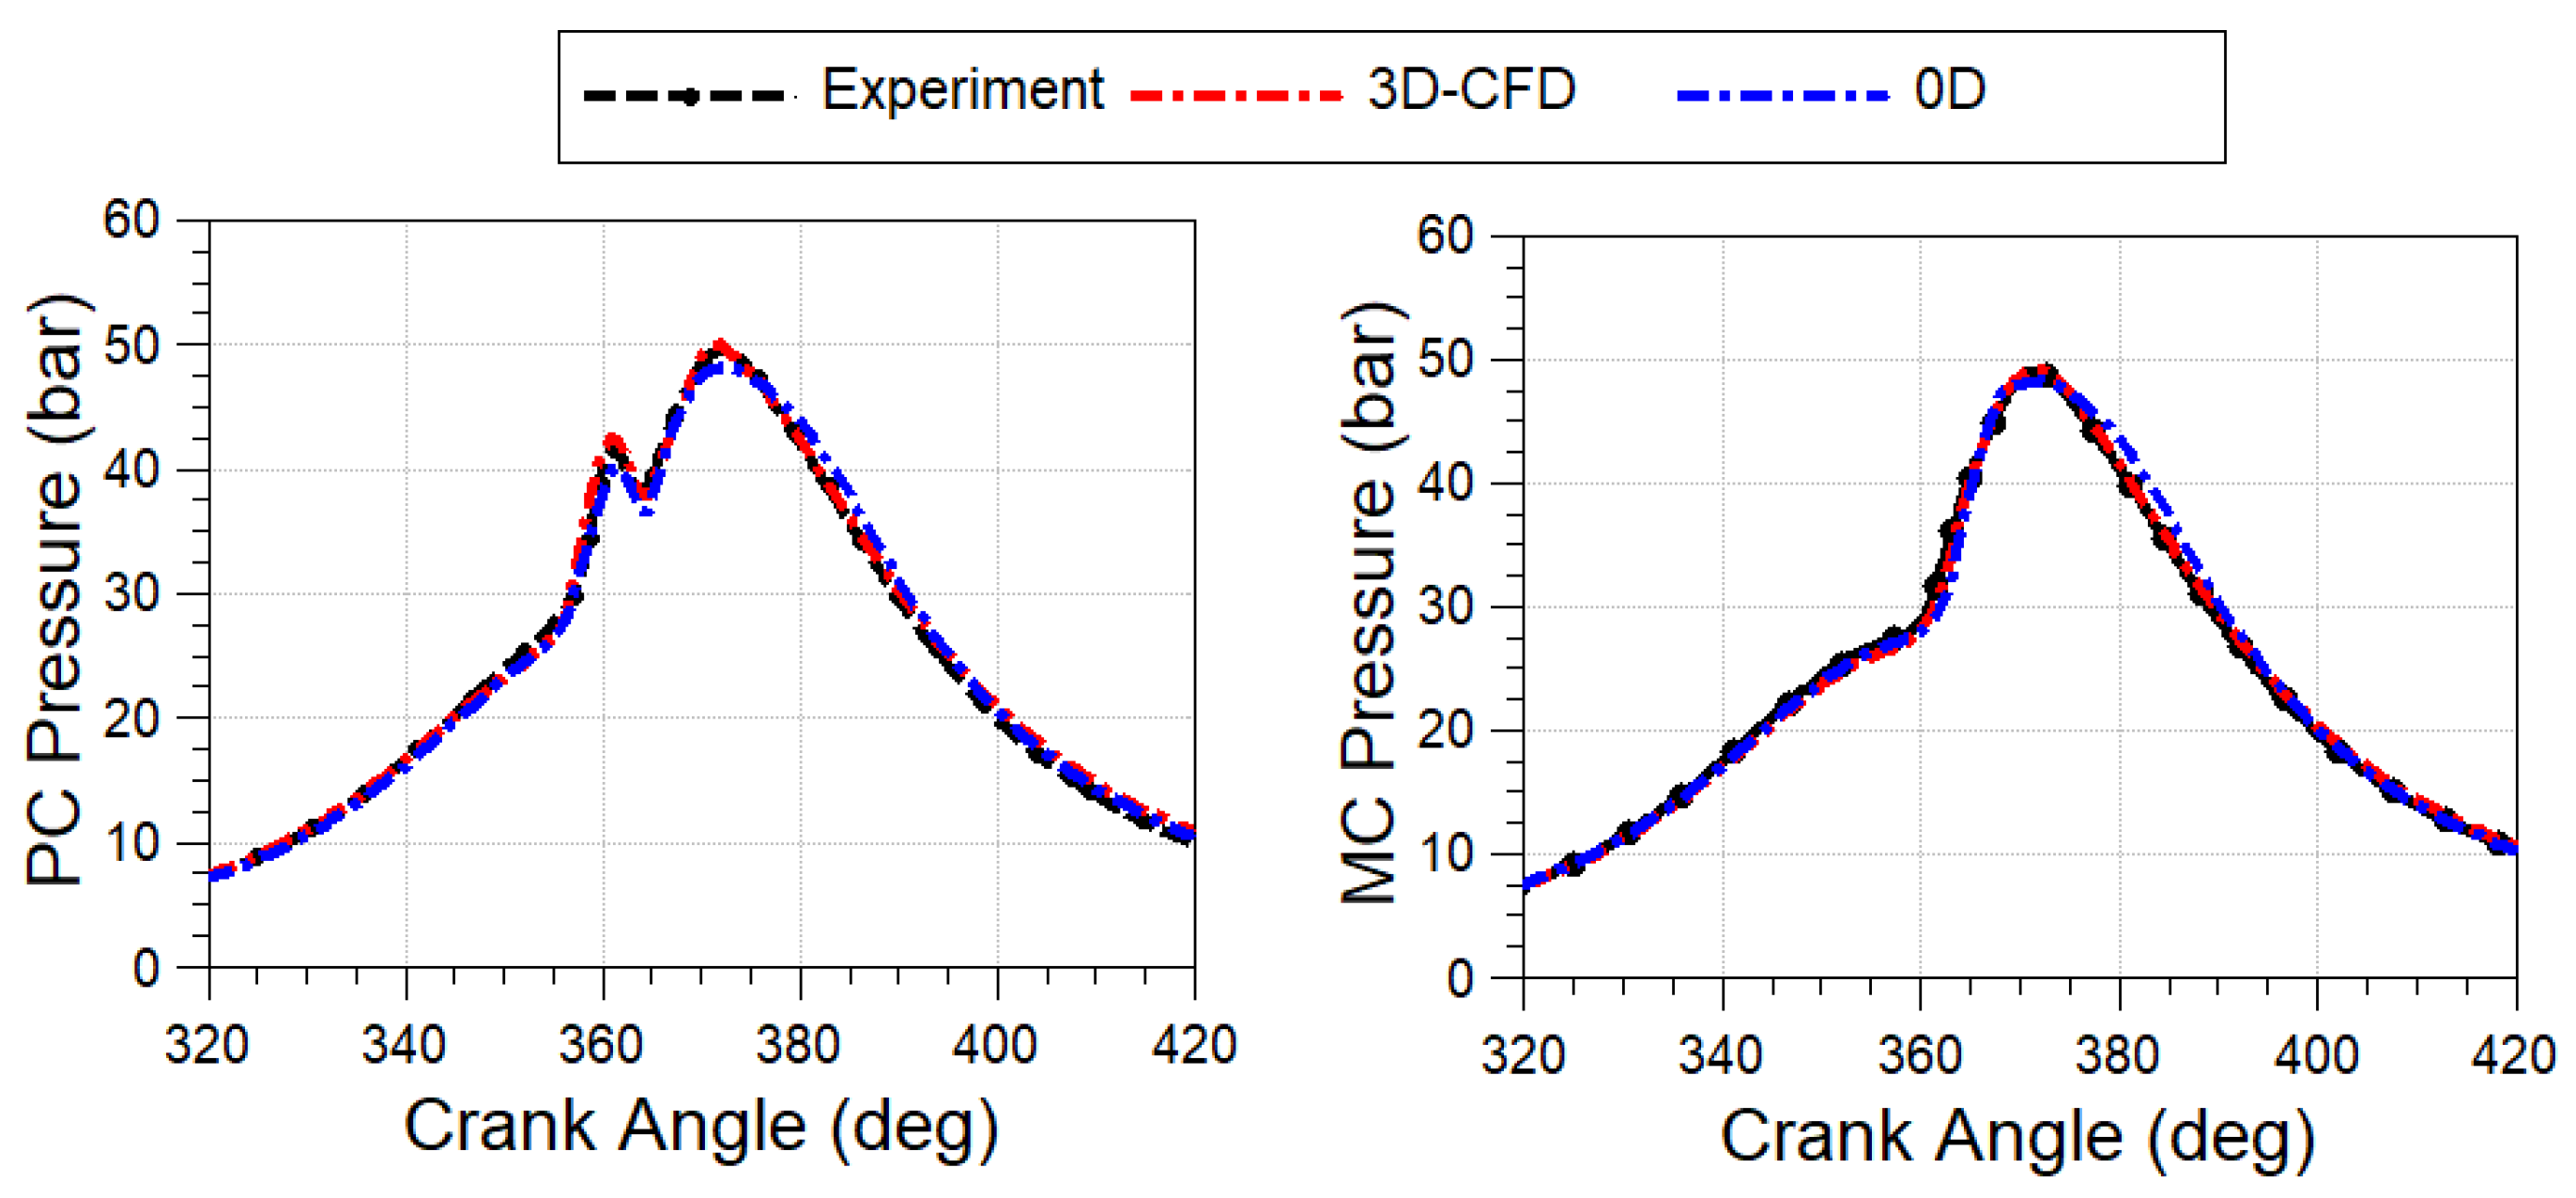
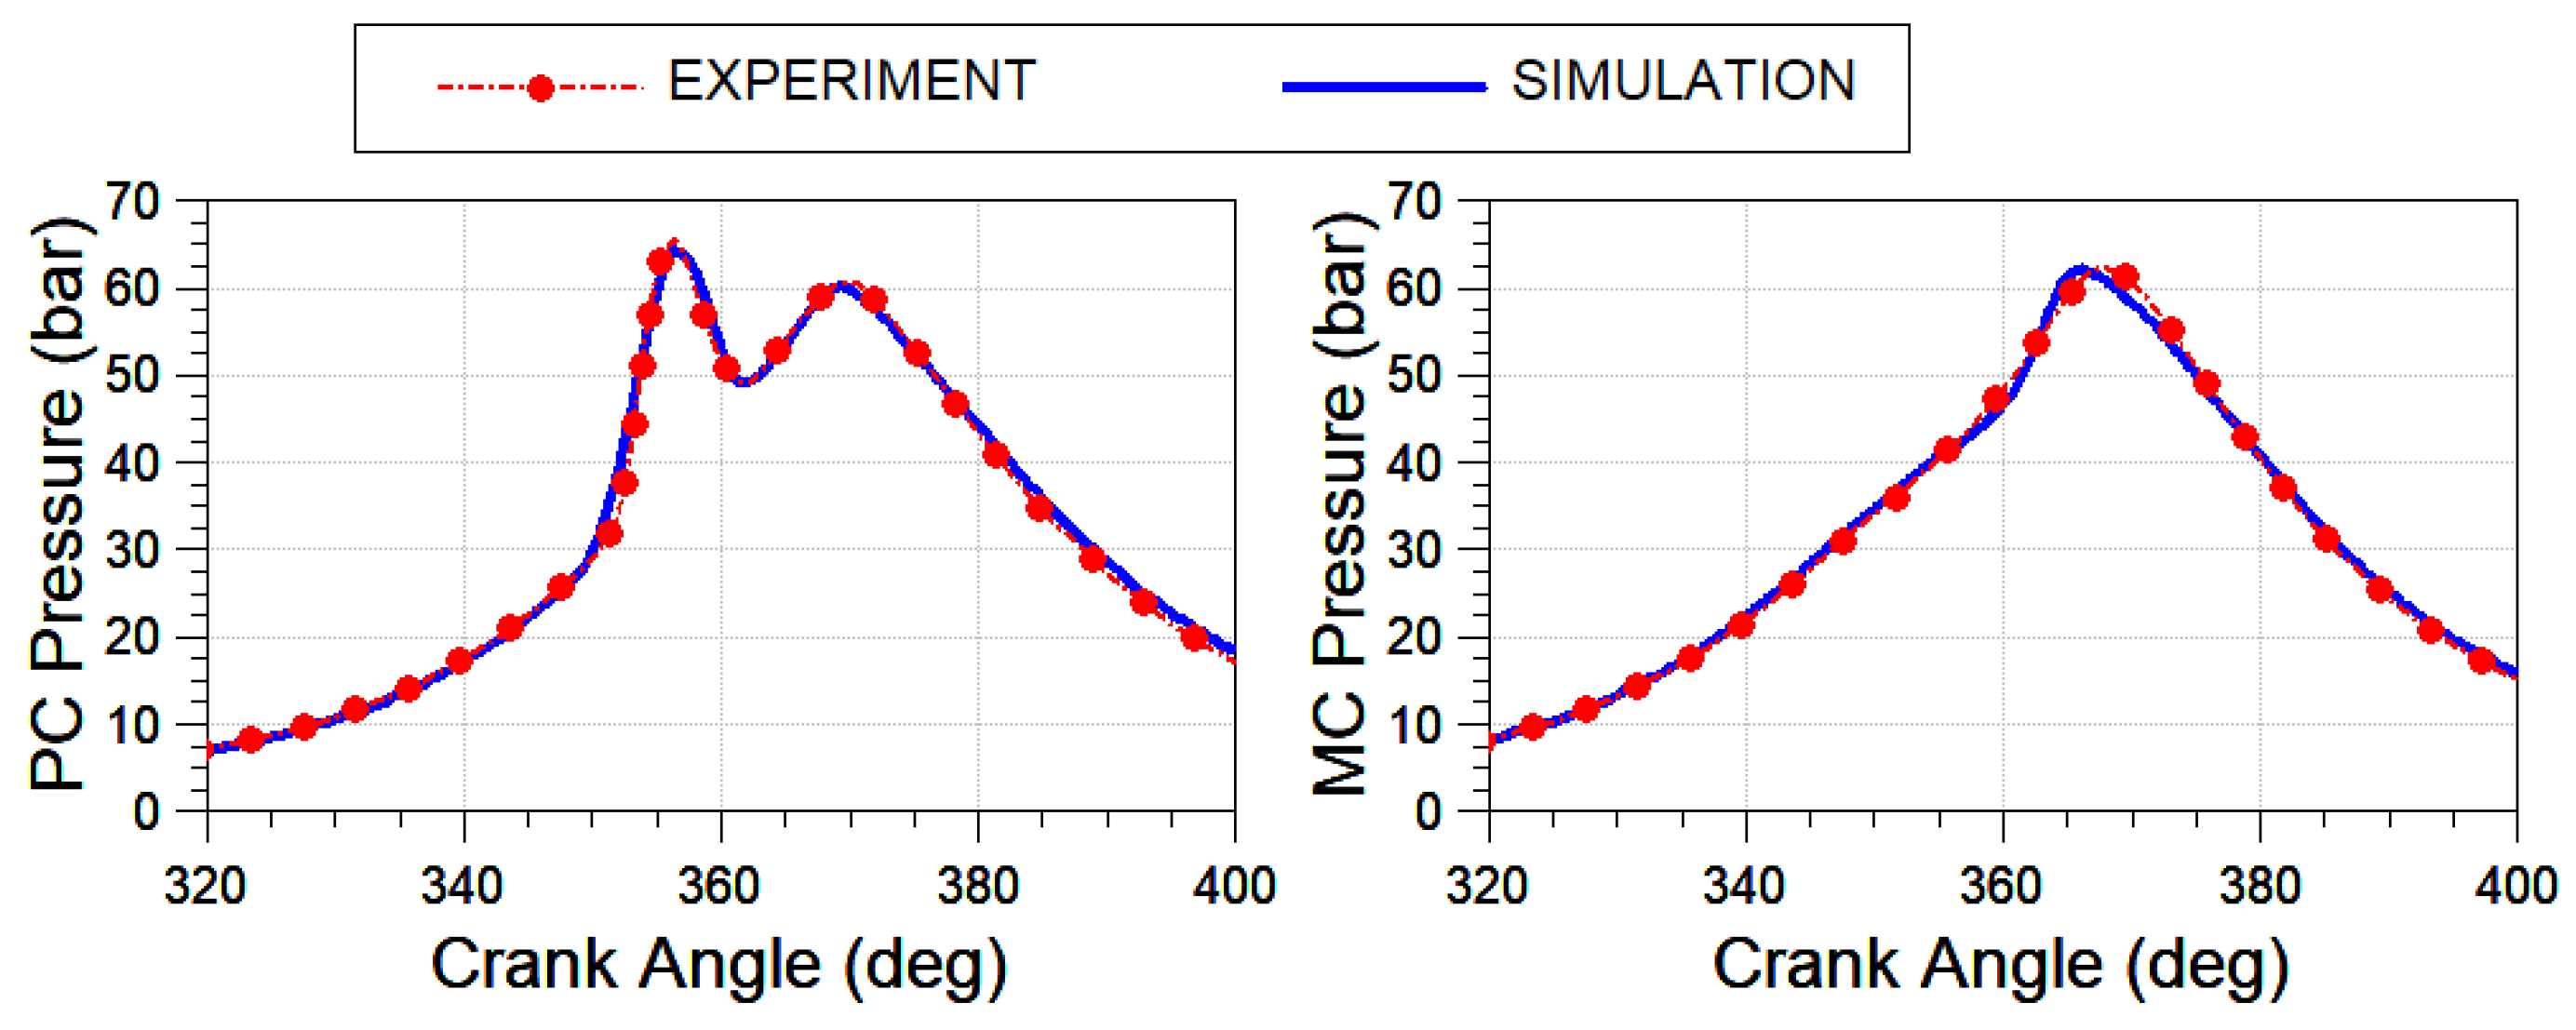
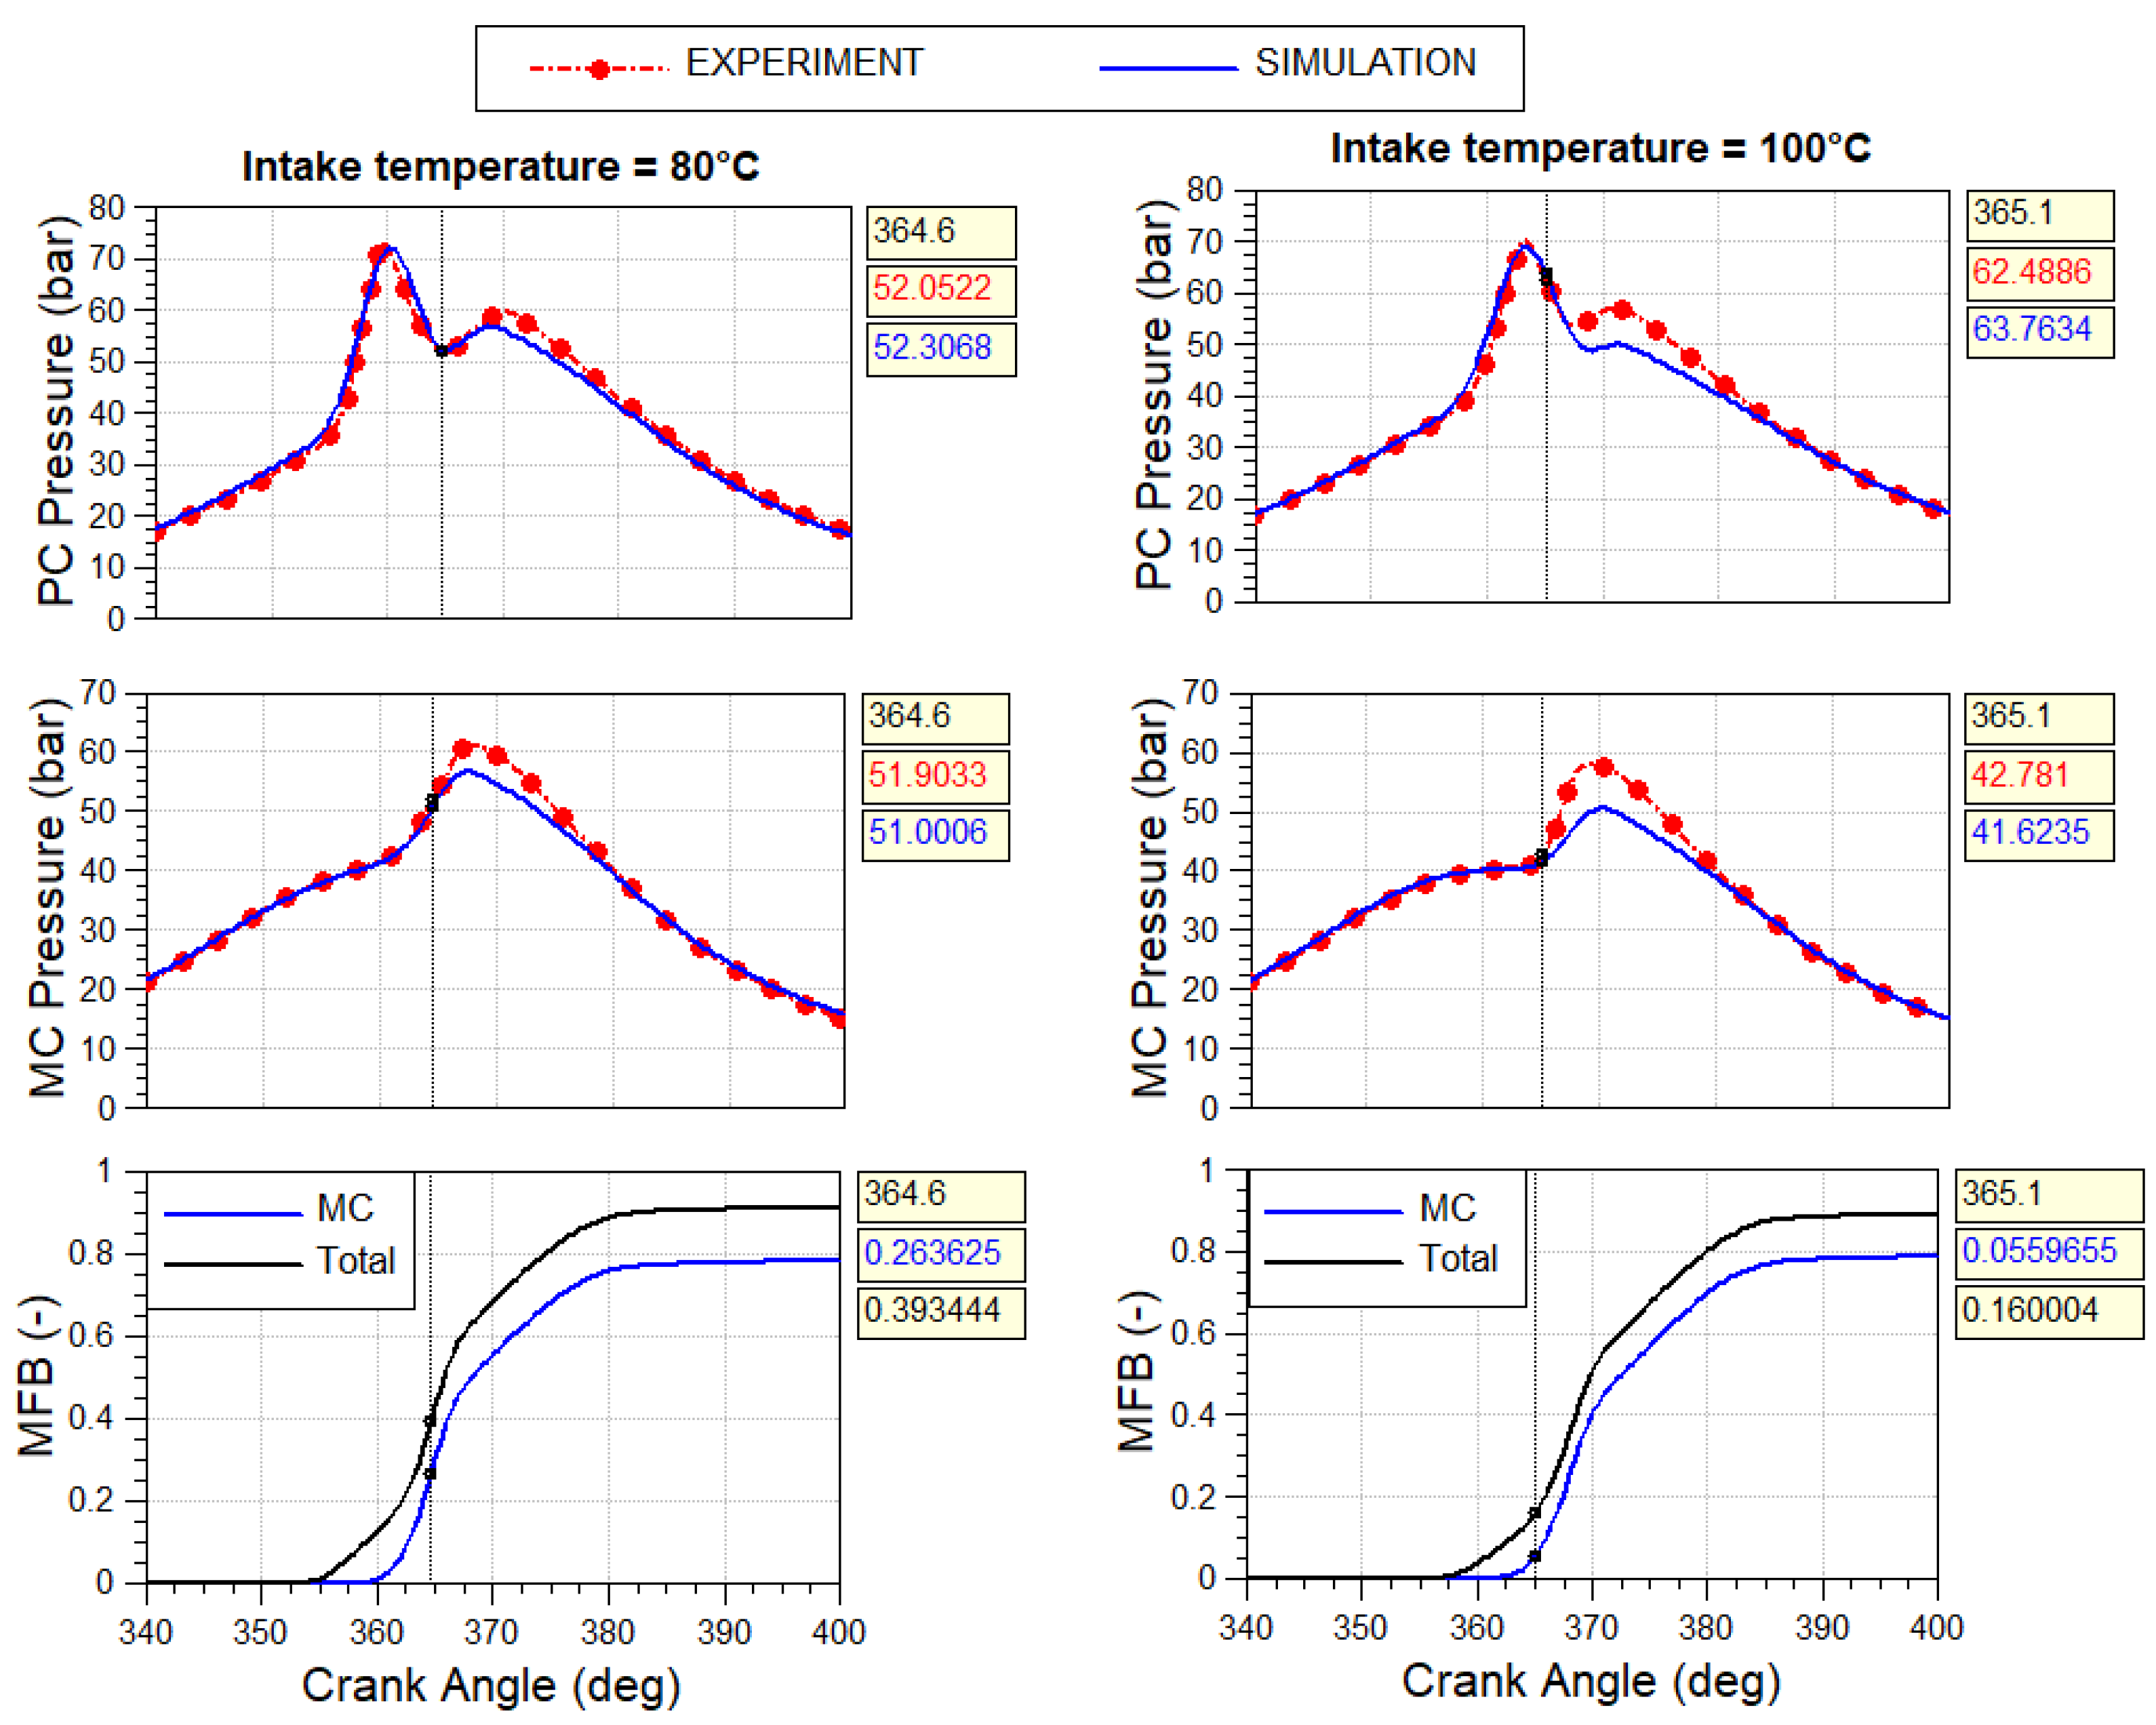
2.2. Numerical Simulations
3. Results and Discussion
3.1. DoE and New Reference Results
3.2. Analysis of Controllability and Resulting Performance
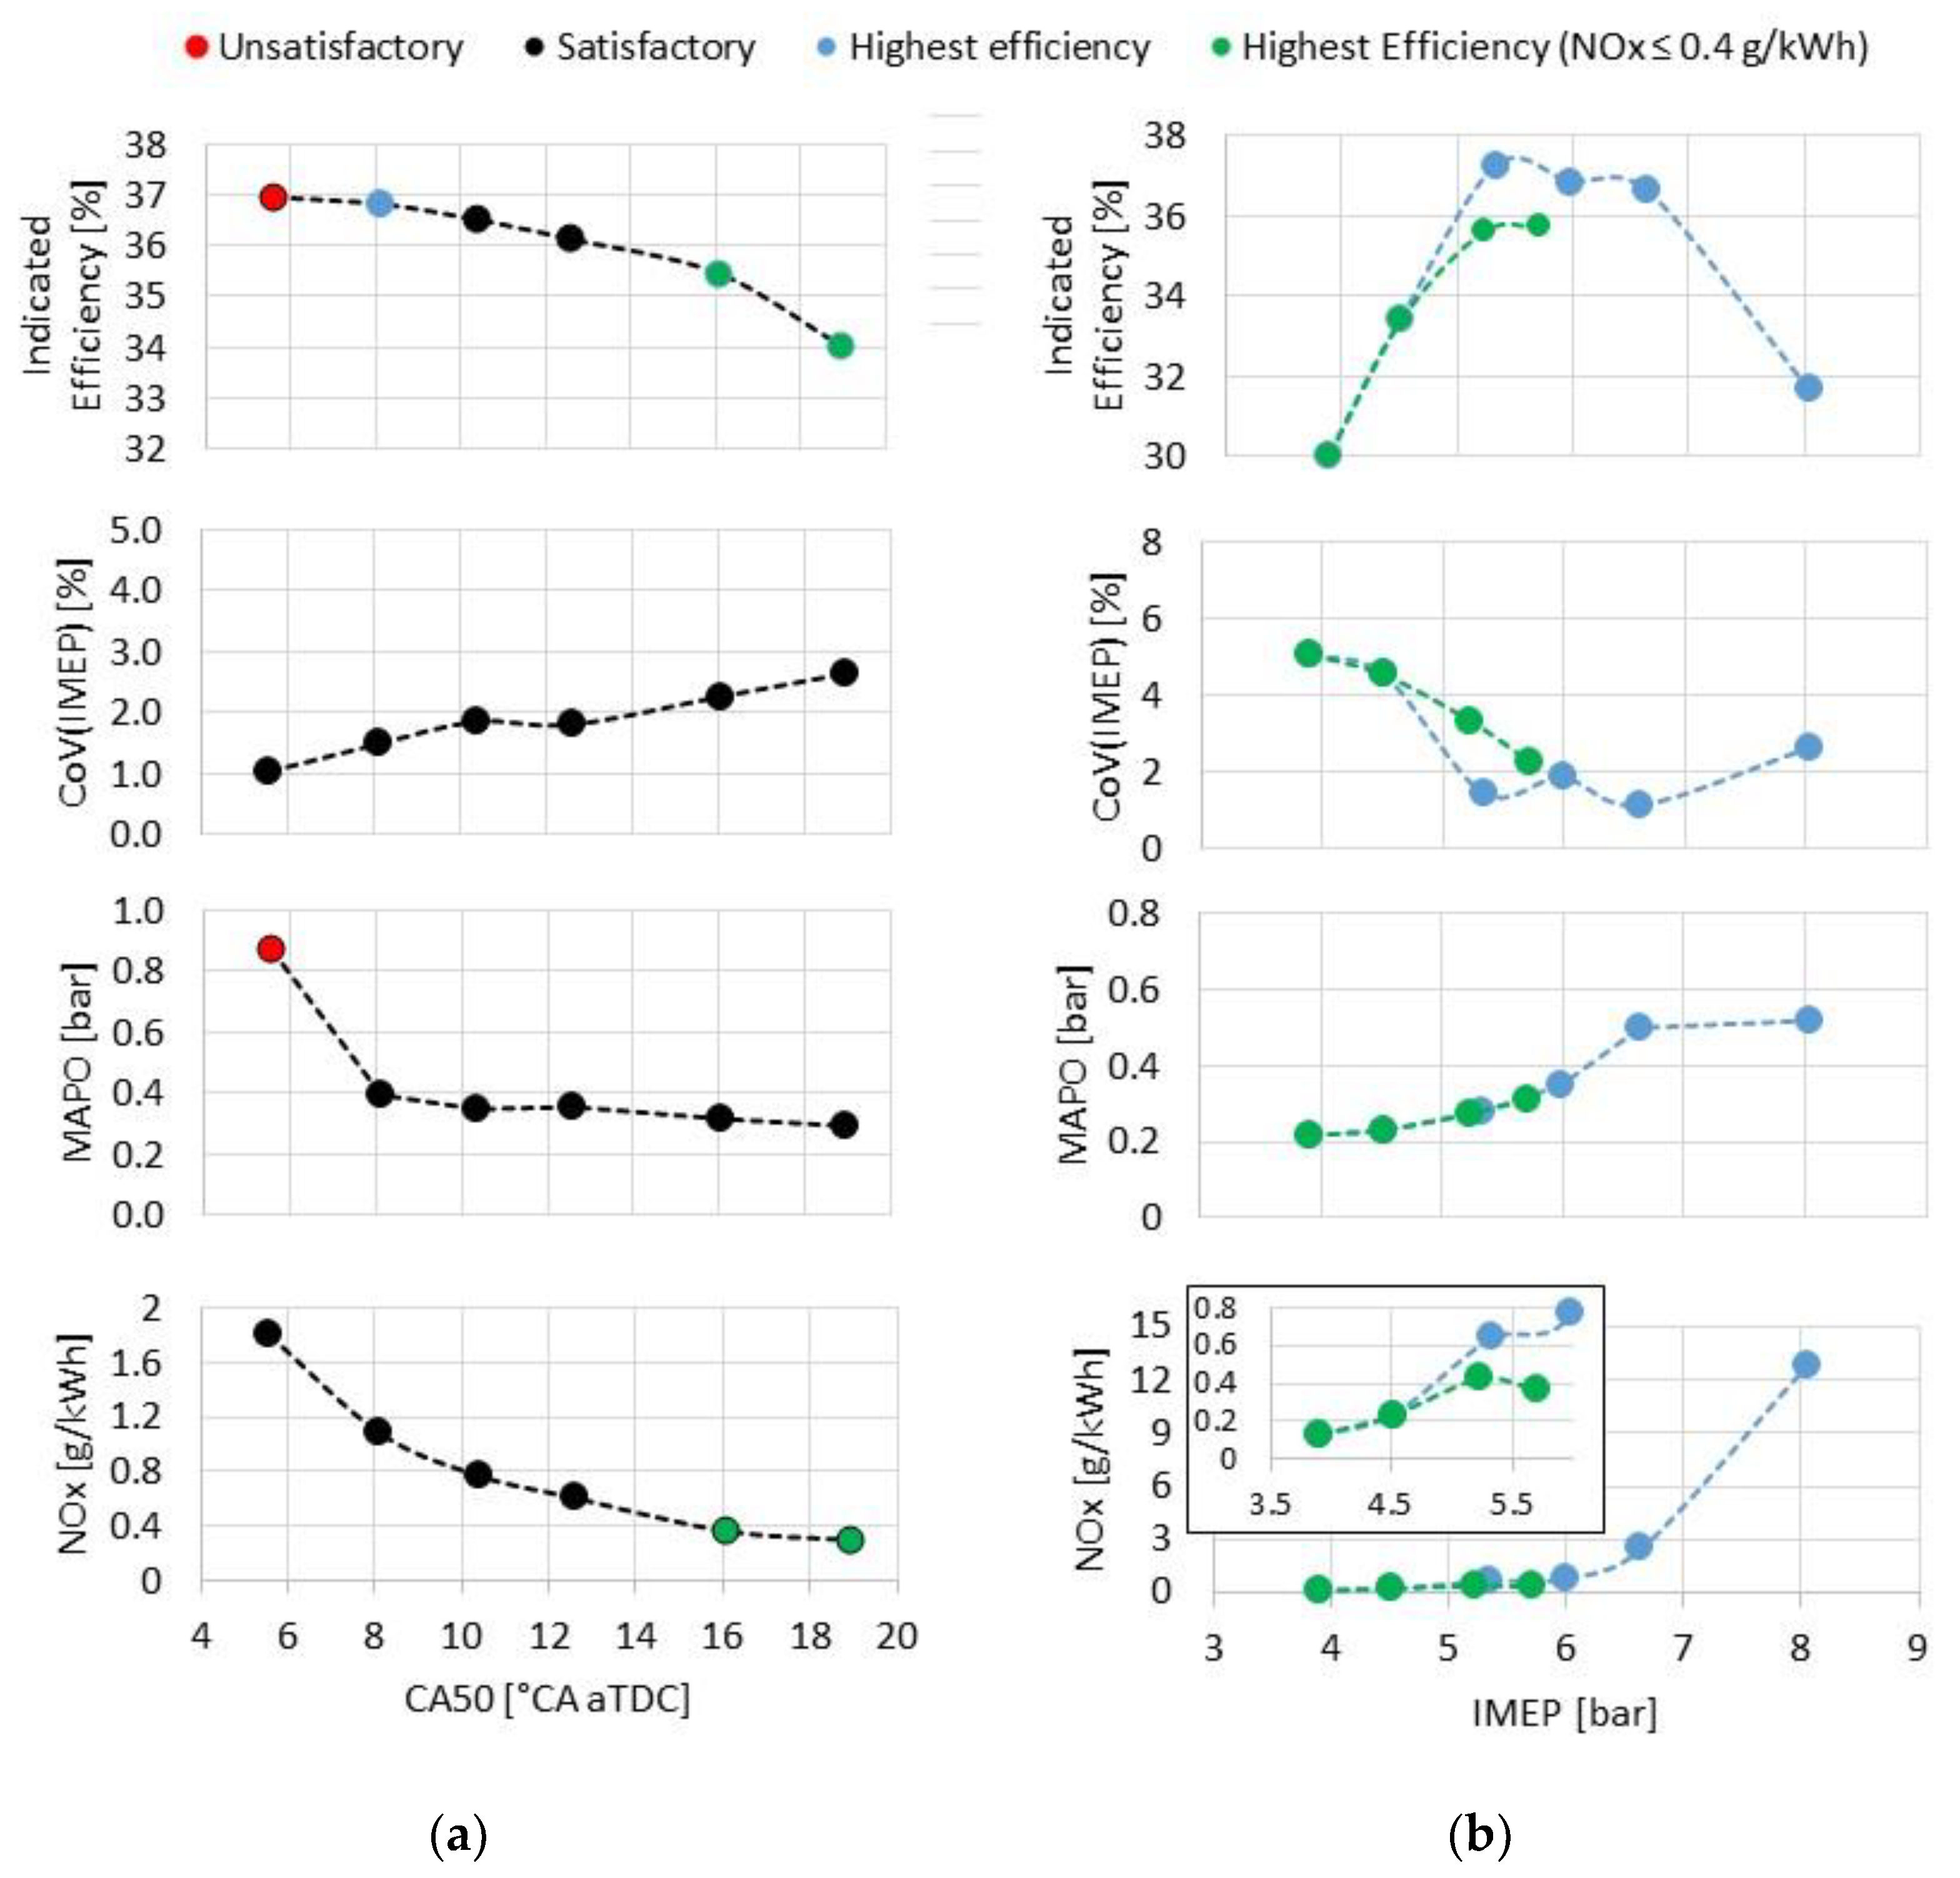
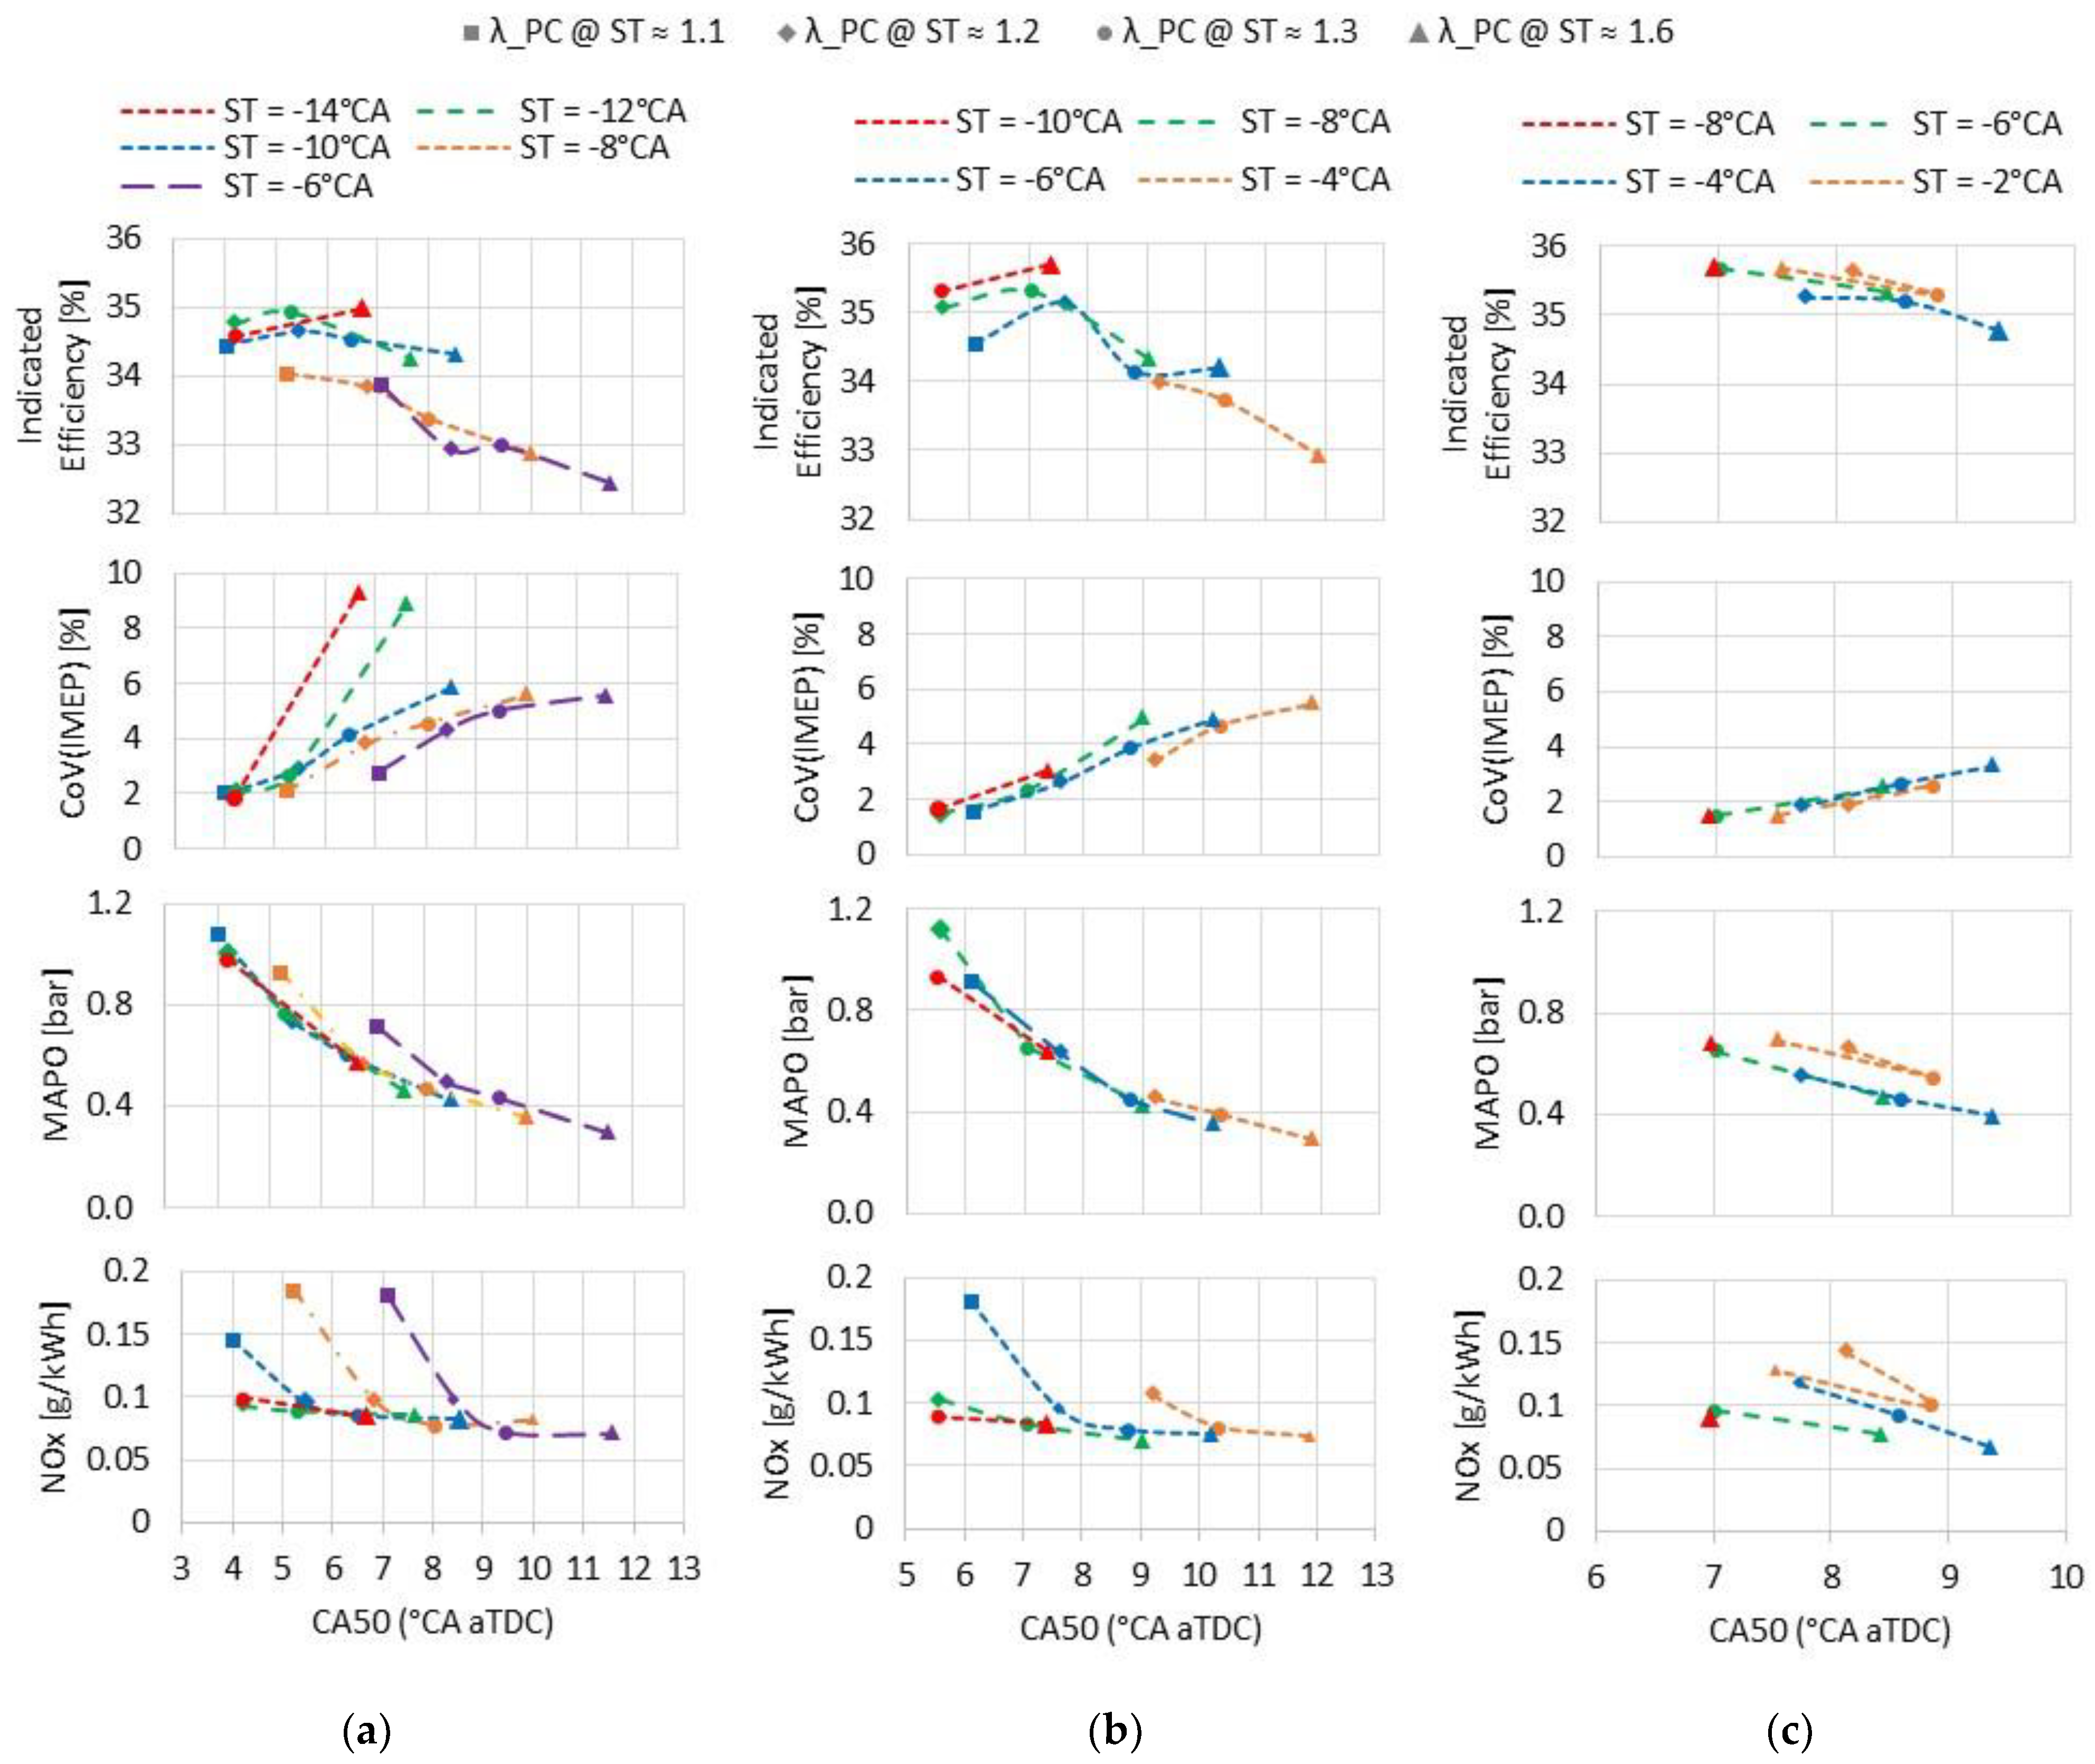
- The achievable combustion phasing range is limited on one side by the high knocking tendency and on the opposite side by combustion instability.
- For the same CA50 value, higher efficiency, more stable combustion, and lower NOX emissions are obtained with a higher intake temperature.
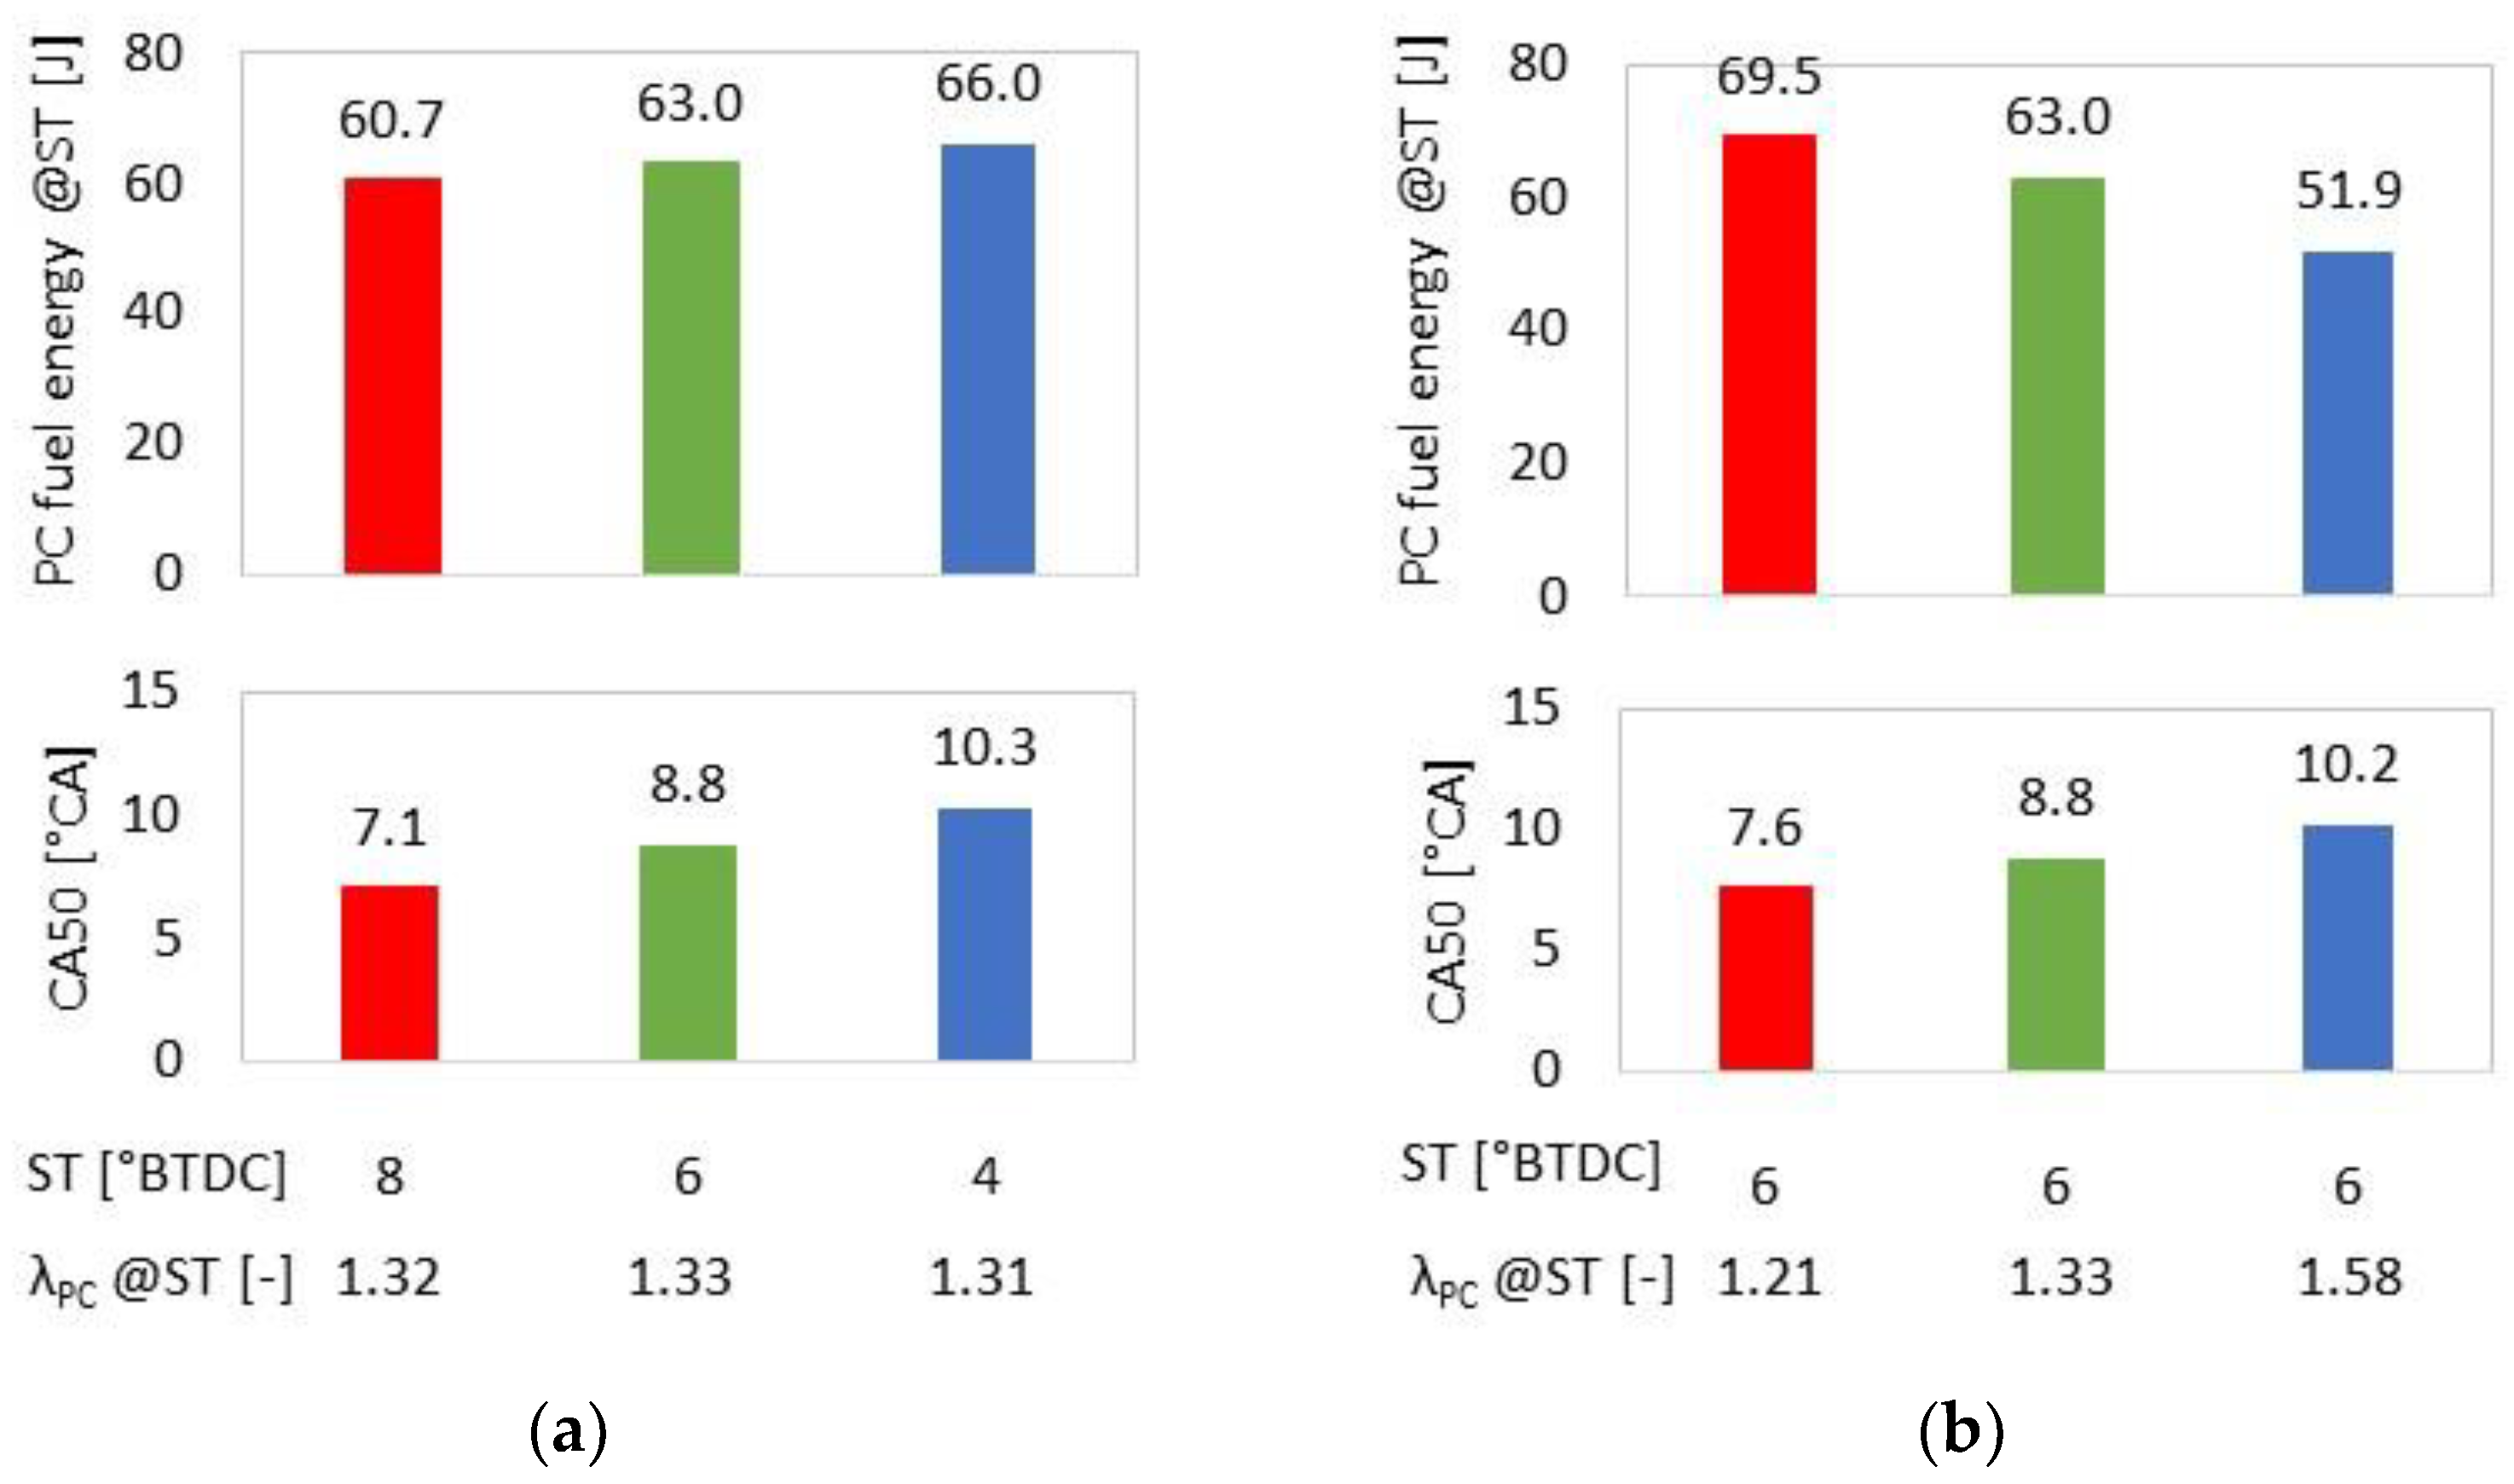
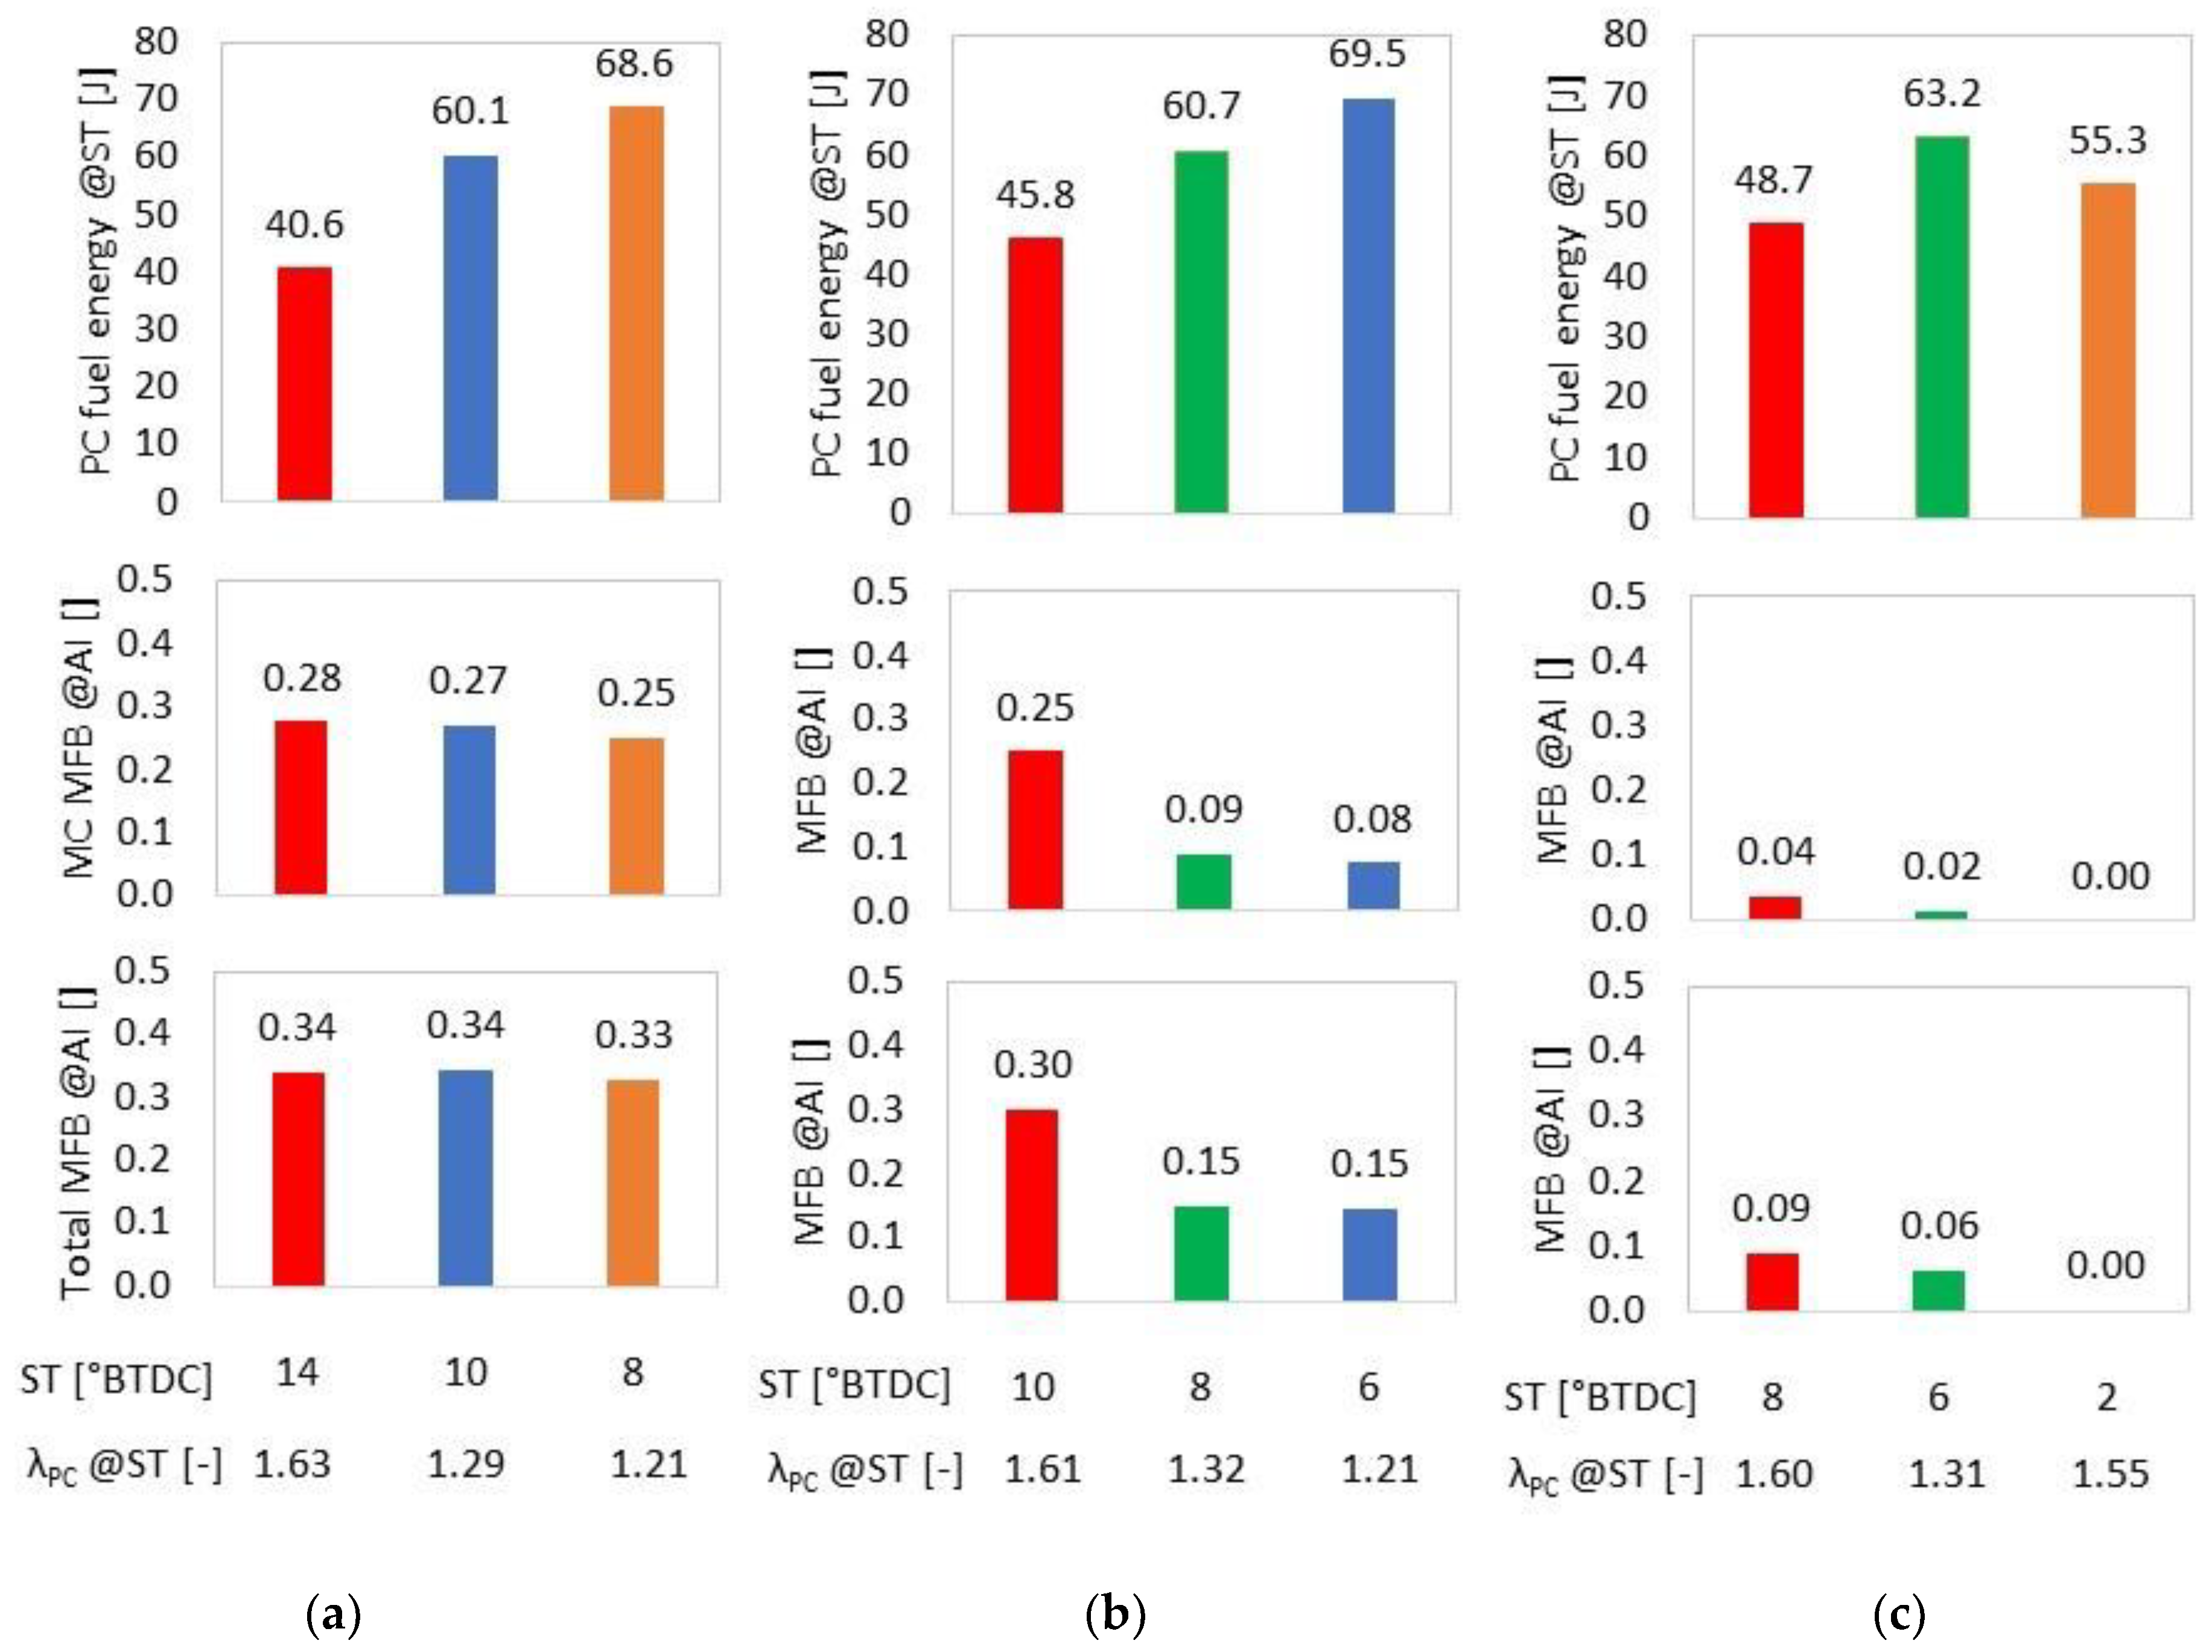
- At each of the imposed intake temperatures, for a given CA50, the combination of earlier spark timing and lower mixture reactivity in the pre-chamber leads to both higher efficiency and lower NOx emissions, at the expense of slightly higher cyclic variability.
- The optimal combustion phasing corresponds to that of the simulated HCCI combustion at the same compression ratio at each of the imposed intake temperatures.
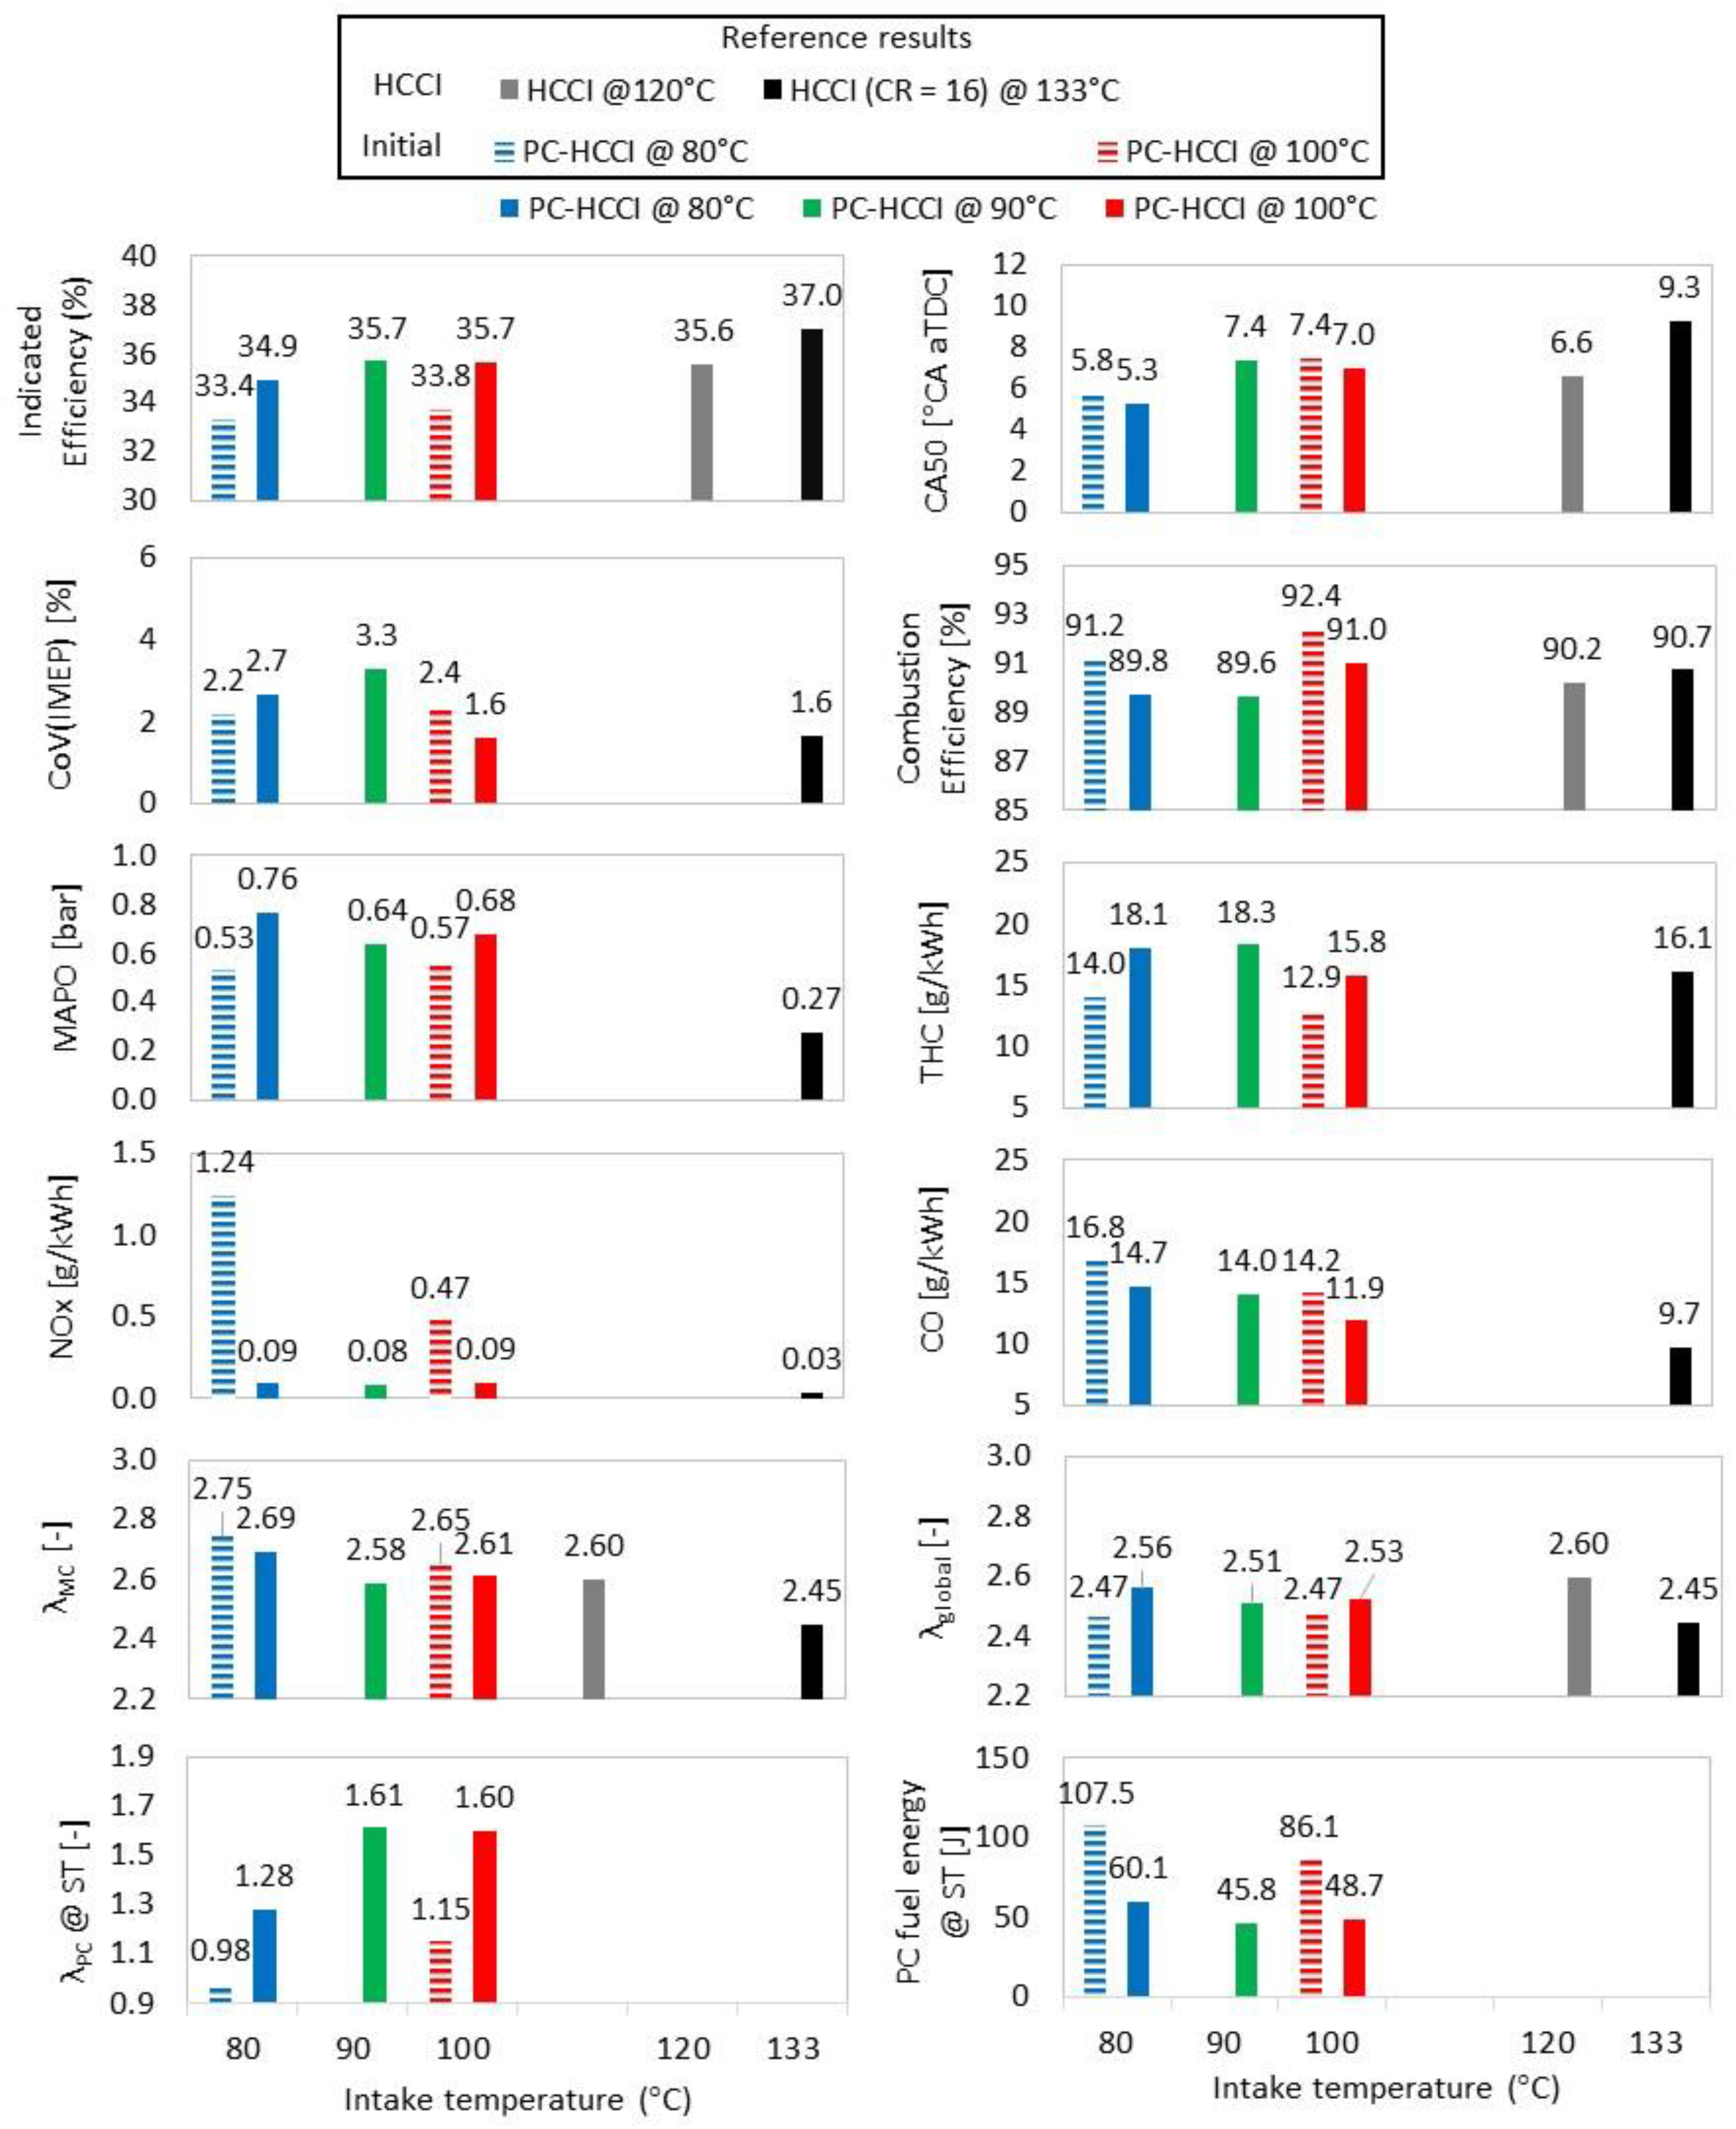
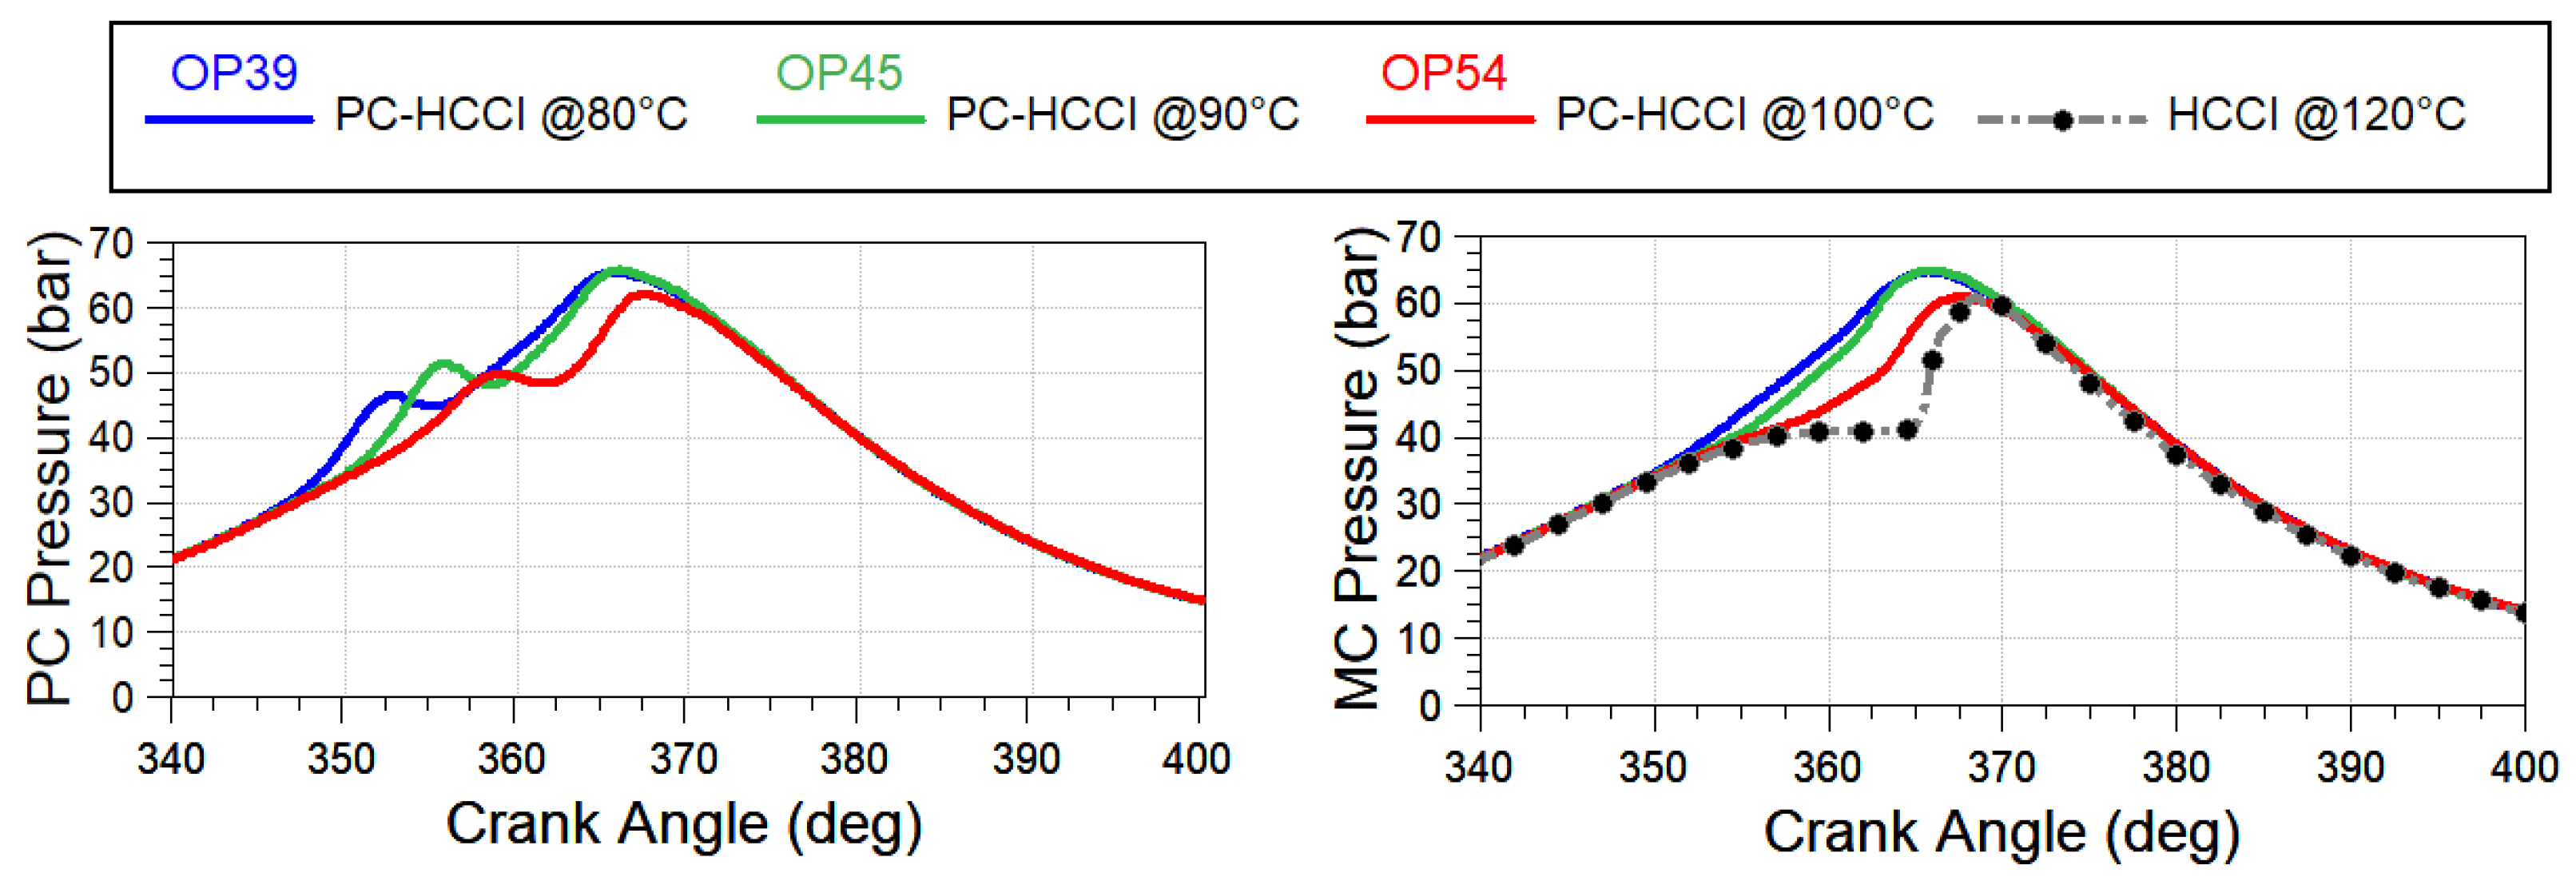
3.3. Comparison with HCCI Combustion
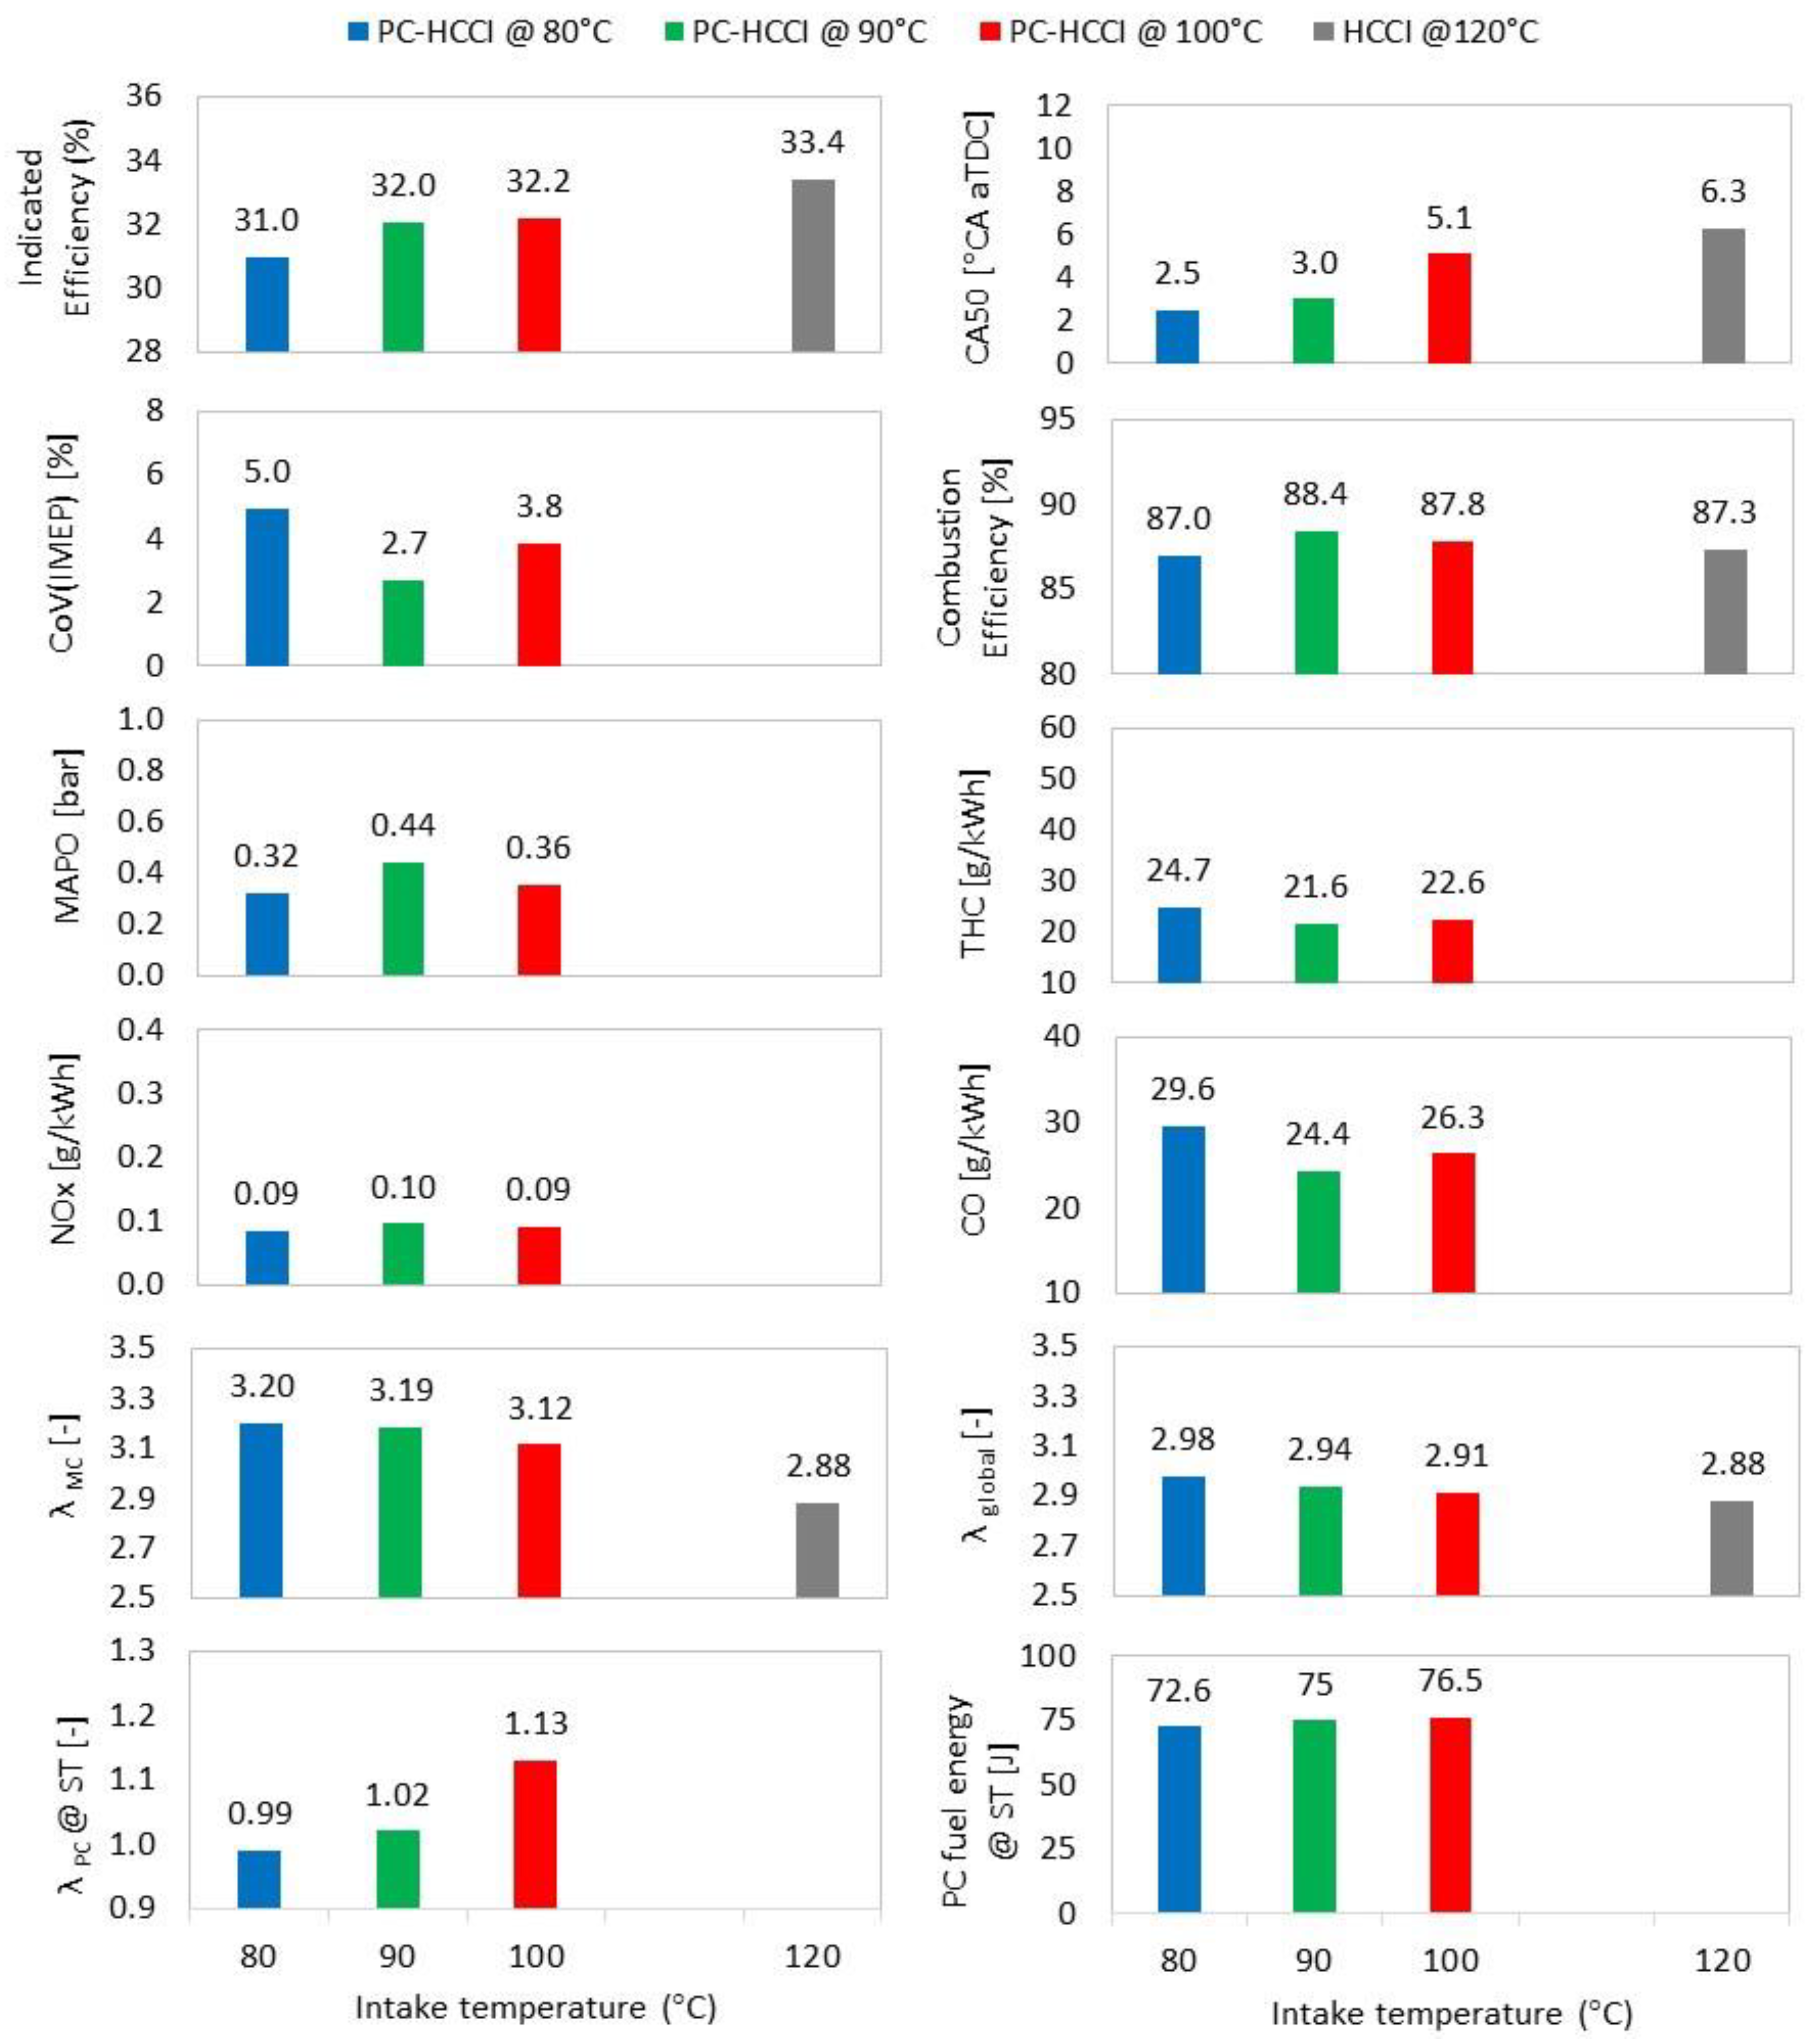
3.4. Comparison with PCSI Combustion
4. Conclusions
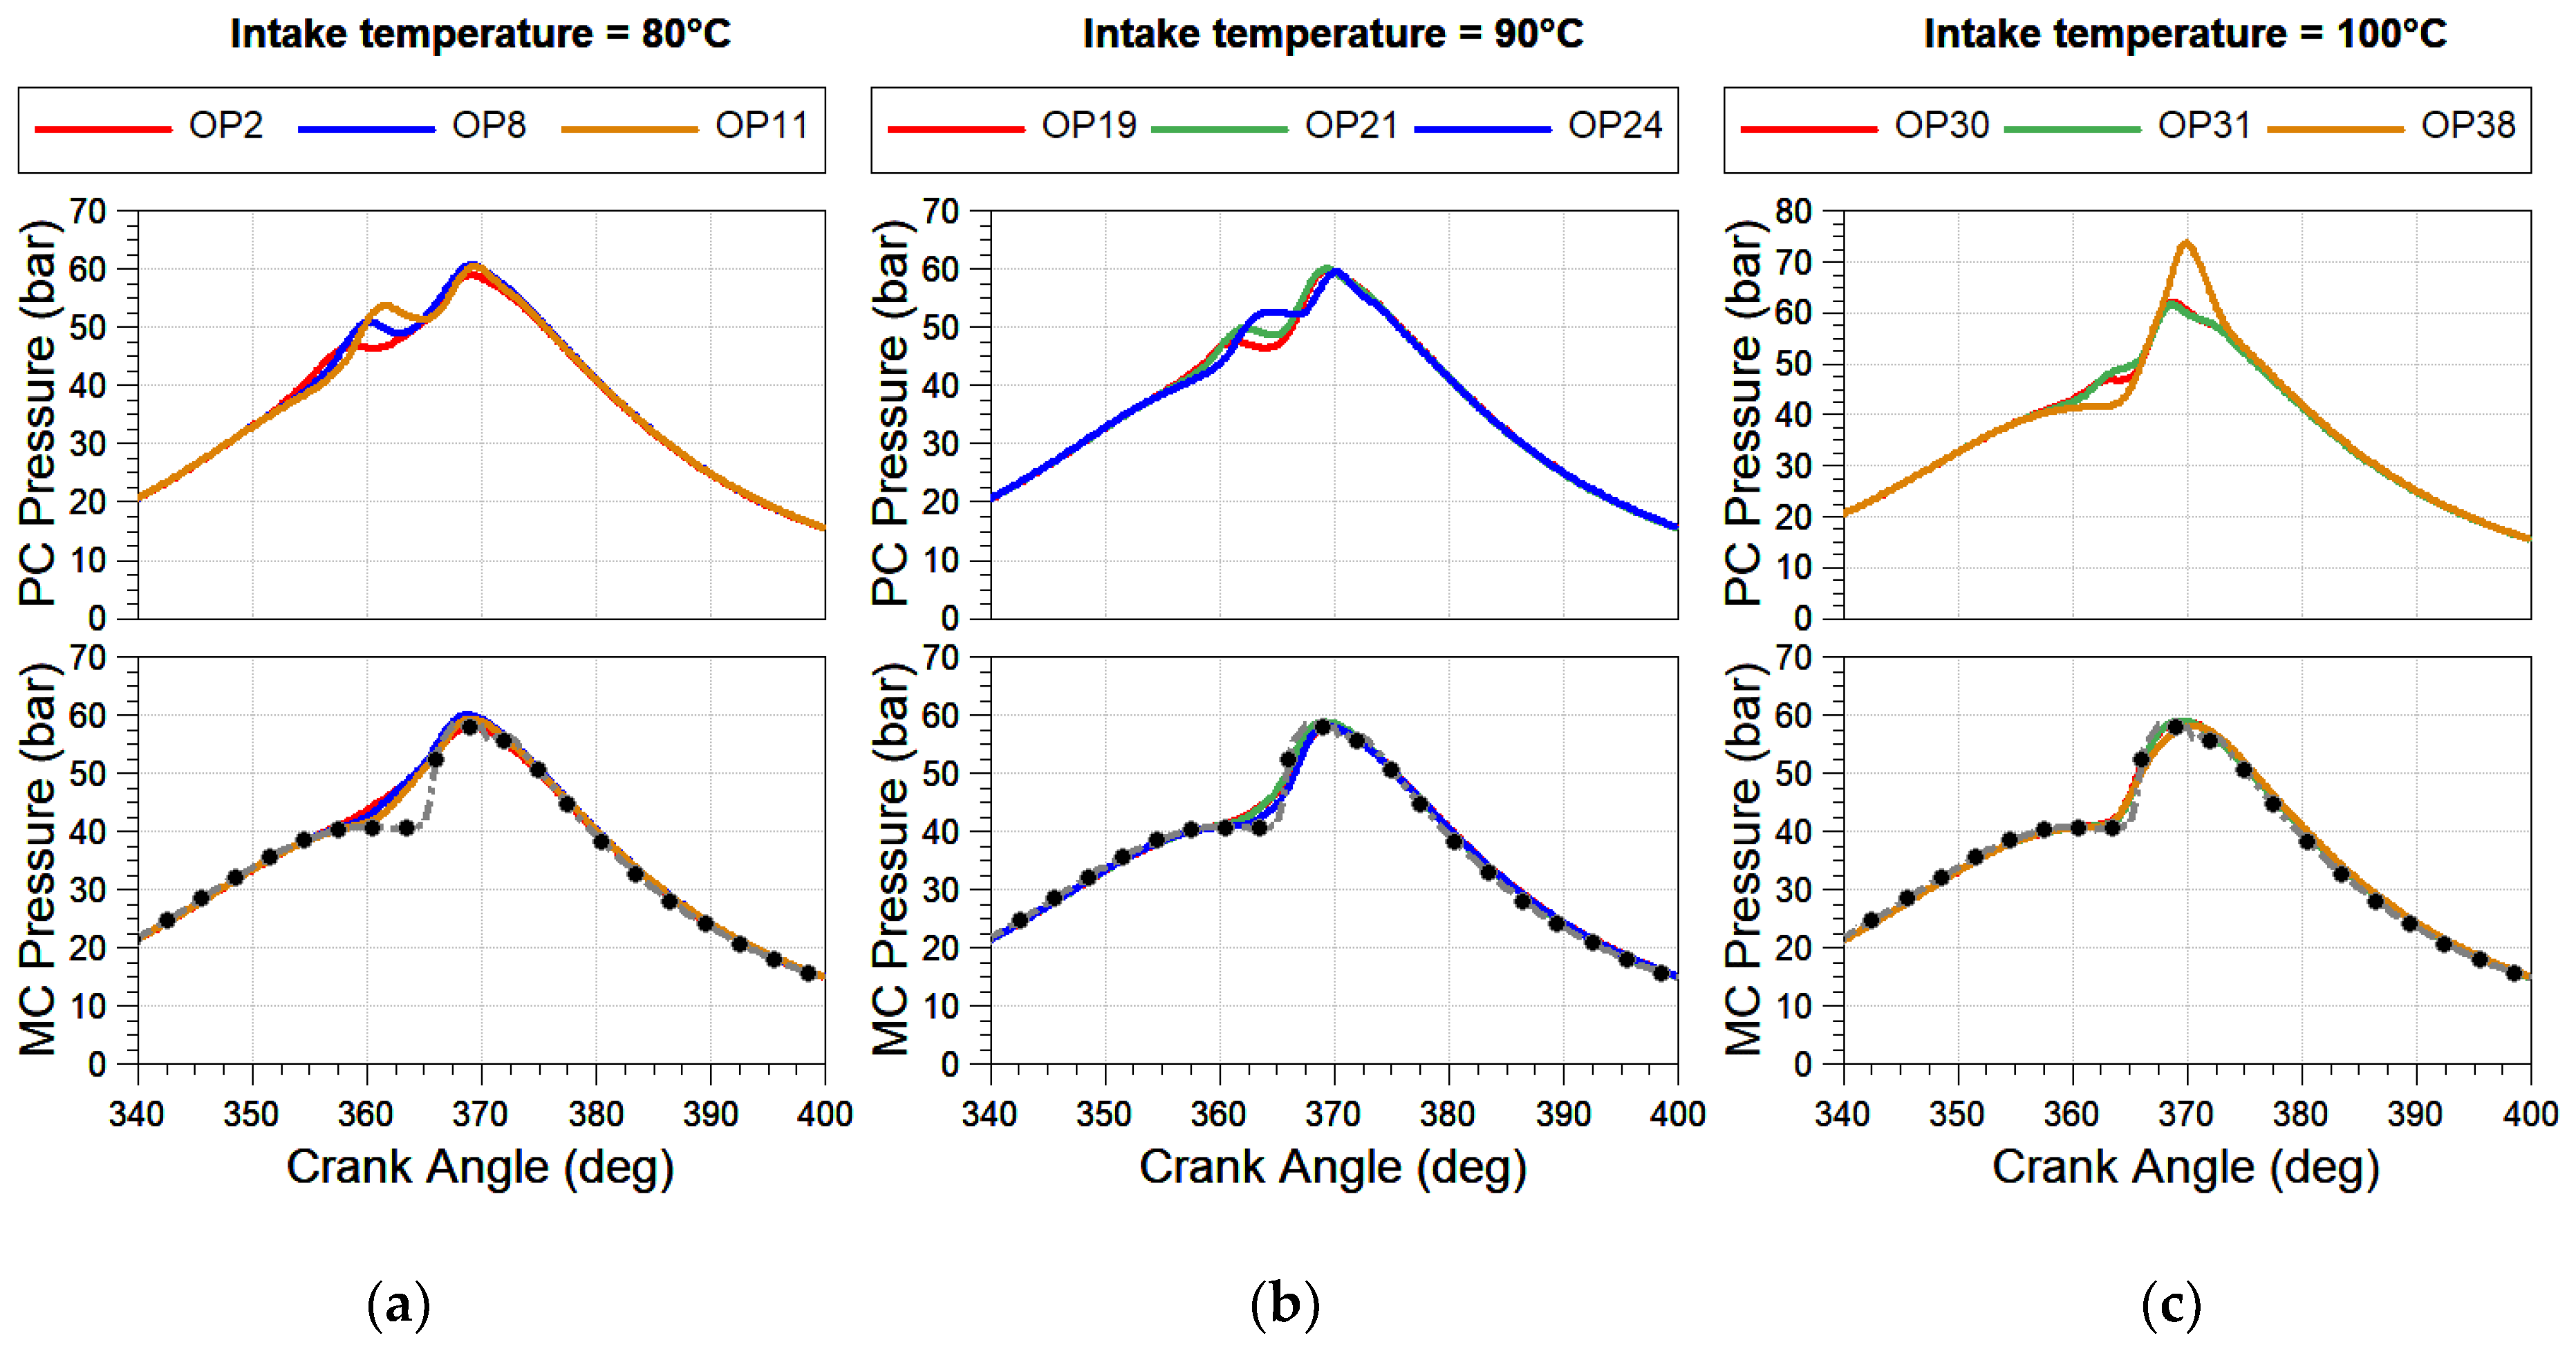
- A very similar performance is obtained with significant variations in intake temperature, proving the reliability and adaptability of this combustion concept.
- The combustion phasing can be reliably controlled by adjusting either the spark timing or the reactivity of the pre-chamber mixture. The optimal combustion phasing achieved with the combination of earlier spark timing and lower mixture reactivity in the pre-chamber leads to both higher efficiency and lower NOx emissions.
- Unlike in conventional HCCI combustion, the variations in boundary conditions during engine operation can be easily compensated for, ensuring adequate combustion stability, and eliminating potential misfires.
- A similar indicated efficiency can be obtained as with the conventional HCCI combustion, with up to 30 °C lower intake temperatures. The NOx emission levels are slightly elevated but still insignificant.
- Compared to the PCSI combustion at the same engine load, an increase of 4 percentage points in indicated efficiency and two times lower NOX emissions were achieved. Compared to the most efficient PCSI operating point, the 1 percentage point lower indicated efficiency was obtained, but the specific NOx emissions are reduced by approximately 70%. This means that the PC-HCCI combustion can achieve ultra-low NOX emissions, while at the same time maintaining the indicated efficiency at a much higher level, which was not possible with the ultra-lean PCSI combustion.
- Overall, some major individual challenges of both PCSI and HCCI combustion modes can be resolved, without some new limitations or challenges identified. This makes the PC-HCCI a feasible technology for achieving reliable, stable, and efficient operation with ultra-low NOX emissions in both new and retrofit engines.
Author Contributions
Funding
Institutional Review Board Statement
Informed Consent Statement
Data Availability Statement
Conflicts of Interest
Nomenclature
| AI | Autoignition |
| aTDC | After top dead center |
| bTDC | Before top dead center |
| CA | Crank angle |
| CFD | Computational fluid dynamics |
| CI | Compression ignition |
| CoV | Coefficient of variation |
| CO | Carbon monoxide |
| CR | Compression ratio |
| DoE | Design of experiments |
| DOI | Duration of injection |
| HCCI | Homogeneous charge compression ignition |
| IMEP | Indicated mean effective pressure |
| MAPO | Maximum amplitude of pressure oscillations |
| MC | Main chamber |
| MFB | Mass fraction burned |
| NOX | Nitrogen oxides |
| OP | Operating point |
| PC | Pre-chamber |
| PCSI | Pre-chamber spark ignition |
| RoHR | Rate of heat release |
| SACI | Spark assisted compression ignition |
| SI | Spark ignition |
| ST | Spark timing |
| THC | Total hydrocarbons |
| 0D, 1D, 3D | Zero-, one-, three-dimensional |
| λ | Excess air ratio |
| λPC | Excess air ratio in the pre-chamber |
| λMC | Excess air ratio in the main chamber |
References
- López, J.; Novella, R.; Gomez-Soriano, J.; Martinez-Hernandiz, P.; Rampanarivo, F.; Libert, C.; Dabiri, M. Advantages of the unscavenged pre-chamber ignition system in turbocharged natural gas engines for automotive applications. Energy 2021, 218, 119466. [Google Scholar] [CrossRef]
- Santos, N.D.S.A.; Alvarez, C.E.C.; Roso, V.R.; Baeta, J.G.C.; Valle, R.M. Combustion analysis of a SI engine with stratified and homogeneous pre-chamber ignition system using ethanol and hydrogen. Appl. Therm. Eng. 2019, 160, 113985. [Google Scholar] [CrossRef]
- Rohwer, J.; Han, T.; Shah, A.; Rockstroh, T. Investigations into EGR dilution tolerance in a pre-chamber ignited GDI engine. Int. J. Engine Res. 2023, 24, 1200–1222. [Google Scholar] [CrossRef]
- Yang, X.; Cheng, Y.; Wang, P. The scavenging timing of pre-chamber on the performance of a natural gas engine. Int. J. Engine Res. 2021, 22, 2919–2930. [Google Scholar] [CrossRef]
- Ju, D.; Huang, Z.; Li, X.; Zhang, T.; Cai, W. Comparison of open chamber and pre-chamber ignition of methane/air mixtures in a large bore constant volume chamber: Effect of excess air ratio and pre-mixed pressure. Appl. Energy 2020, 260, 114319. [Google Scholar] [CrossRef]
- Tomić, R.; Sjerić, M.; Krajnović, J.; Ugrinić, S. Influence of Pre-Chamber Volume, Orifice Diameter and Orifice Number on Performance of Pre-Chamber SI Engine—An Experimental and Numerical Study. Energies 2023, 16, 2884. [Google Scholar] [CrossRef]
- Ugrinić, S.; Dilber, V.; Sjerić, M.; Kozarac, D.; Krajnović, J.; Tomić, R. Experimental Study of Pre-Chamber Geometry Influence on Performance and Emissions in a Gasoline Spark Ignited Engine; SAE Technical Paper 2022-01-1008; SAE International: Warrendale, PA, USA, 2022. [Google Scholar] [CrossRef]
- Hua, J.; Zhou, L.; Gao, Q.; Feng, Z.; Wei, H. Influence of pre-chamber structure and injection parameters on engine performance and combustion characteristics in a turbulent jet ignition (TJI) engine. Fuel 2021, 283, 119236. [Google Scholar] [CrossRef]
- Gentz, G.; Gholamisheeri, M.; Toulson, E. A study of a turbulent jet ignition system fueled with iso-octane: Pressure trace analysis and combustion visualization. Appl. Energy 2017, 189, 385–394. [Google Scholar] [CrossRef]
- García-Oliver, J.; Niki, Y.; Rajasegar, R.; Novella, R.; Gomez-Soriano, J.; Martínez-Hernándiz, P.; Li, Z.; Musculus, M. An experimental and one-dimensional modeling analysis of turbulent gas ejection in pre-chamber engines. Fuel 2021, 299, 120861. [Google Scholar] [CrossRef]
- Onofrio, G.; Napolitano, P.; Tunestål, P.; Beatrice, C. Combustion sensitivity to the nozzle hole size in an active pre-chamber ultra-lean heavy-duty natural gas engine. Energy 2021, 235, 121298. [Google Scholar] [CrossRef]
- Müller, C.; Morcinkowski, B.; Schernus, C.; Habermann, K.; Uhlmann, T. Development of prechamber for SI Engines in Vehicle Applications. In Proceedings of the 4th International Conference, Berlin, Germany, 6–7 December 2018. [Google Scholar]
- Dilber, V.; Sjeric, M.; Tomić, R.; Krajnović, J.; Ugrinić, S. Optimization of Pre-Chamber Geometry and Operating Parameters in a Turbulent Jet Ignition Engine. Energies 2022, 15, 4758. [Google Scholar] [CrossRef]
- Soltic, P.; Hilfiker, T.; Hänggi, S. Efficient light-duty engine using turbulent jet ignition of lean methane mixtures. Int. J. Engine Res. 2021, 22, 1301–1311. [Google Scholar] [CrossRef]
- Bendu, H.; Murugan, S. Homogeneous charge compression ignition (HCCI) combustion: Mixture preparation and control strategies in diesel engines. Renew. Sustain. Energy Rev. 2014, 38, 732–746. [Google Scholar] [CrossRef]
- Vucetic, A.; Bozic, M.; Kozarac, D.; Lulic, Z. Characterisation of the combustion process in the spark ignition and homogeneous charge compression ignition engine. Therm. Sci. 2018, 22, 2025–2037. [Google Scholar] [CrossRef]
- Hasan, M.M.; Rahman, M.M.; Kadirgama, K.; Ramasamy, D. Numerical study of engine parameters on combustion and performance characteristics in an n-heptane fueled HCCI engine. Appl. Therm. Eng. 2018, 128, 1464–1475. [Google Scholar] [CrossRef]
- Polat, S.; Yücesu, H.S.; Uyumaz, A.; Kannan, K.; Shahbakhti, M. An experimental investigation on combustion and performance characteristics of supercharged HCCI operation in low compression ratio engine setting. Appl. Therm. Eng. 2020, 180, 115858. [Google Scholar] [CrossRef]
- Vučetić, A. Identifikacija i Karakterizacija Parametara rada HCCI Motora pri Pogonu Bioplinom. Ph.D. Thesis, Faculty of Mechanical Engineering and Naval Architecture, University of Zagreb, Zagreb, Croatia, 2018. [Google Scholar]
- Yang, Y.; Dec, J.E.; Dronniou, N.; Sjöberg, M.; Cannella, W. Partial Fuel Stratification to Control HCCI Heat Release Rates: Fuel Composition and Other Factors Affecting Pre-Ignition Reactions of Two-Stage Ignition Fuels. SAE Int. J. Engines 2011, 4, 1903–1920. [Google Scholar] [CrossRef]
- Chiodi, M.; Kaechele, A.; Bargende, M.; Wichelhaus, D.; Poetsch, C. Development of an Innovative Combustion Process: Spark-Assisted Compression Ignition. SAE Int. J. Engines 2017, 10, 2486–2499. [Google Scholar] [CrossRef]
- Ugrinić, S.; Krajnovic, J.; Sjeric, M.; Kozarac, D. Experimental Study of Combustion Characteristics and Emissions of Pre-Chamber Induced HCCI Combustion; SAE Technical Papers; SAE International: Warrendale, PA, USA, 2023. [Google Scholar] [CrossRef]
- Krajnovic, J.; Dilber, V.; Tomic, R.; Sjeric, M.; Ilincic, P.; Kozarac, D. Numerical Simulations of Pre-Chamber Induced HCCI Combustion (PC-HCCI); SAE Technical Papers; SAE International: Warrendale, PA, USA, 2023. [Google Scholar] [CrossRef]
- Krajnović, J.; Sjerić, M.; Tomić, R.; Kozarac, D. A novel concept of active pre-chamber engine with a single injector—The passive main chamber approach. Appl. Therm. Eng. 2024, 250, 123509. [Google Scholar] [CrossRef]
- Ilinčić, P. Višezonski simulacijski model HCCI motora s razdvojenim rješavačem. Ph.D. Thesis, Faculty of Mechanical Engineering and Naval Architecture, University of Zagreb, Zagreb, Croatia, 2015. [Google Scholar]
- Mulholland, E.; Miller, J.; Bernard, Y.; Lee, K.; Rodríguez, F. The role of NOx emission reductions in Euro 7/VII vehicle emission standards to reduce adverse health impacts in the EU27 through 2050. Transp. Eng. 2022, 9, 100133. [Google Scholar] [CrossRef]


| Parameter | Value |
|---|---|
| Engine type | 4 stroke, air cooled |
| Displacement | 667 cm3 |
| Stroke | 85 mm |
| Bore | 100 mm |
| Connecting Rod length | 127 mm |
| Compression ratio | 17.5 |
| Number of Valves | 2 |
| Inlet Valve Opens/Closes | 36 °CA BTDC/60 °CA ABDC |
| Exhaust Valve Opens/Closes | 54 °CA BBDC/21 °CA ATDC |
| Parameter | Value | 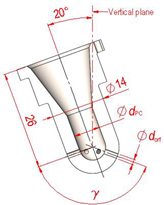 |
|---|---|---|
| Throat diameter (dPC) | 5 mm | |
| Number of Orifices (n) | 6 | |
| Orifice diameter (dorf) | 1.15 mm | |
| Pre-Chamber Volume (VPC) | 1911 mm3 | |
| Volume ratio | 4.7% | |
| Orifice area-to-volume ratio | 0.033 1/cm |
| Compression Ratio | Reference Point ID | IMEP [bar] | Intake Temperature [°C] | λglobal [-] | ST [°CA BTDC] | PC DOI [ms] | Head Temperature [°C] |
|---|---|---|---|---|---|---|---|
| 12.8 | R1 | 3.90 | 34.1 | 2.20 | 22 | 0.30 | 123.9 |
| R2 | 4.52 | 33.9 | 2.00 | 20 | 0.30 | 131.3 | |
| R3 | 5.23 | 34.6 | 1.79 | 16 | 0.30 | 140.6 | |
| R4 | 5.71 | 33.6 | 1.62 | 4 | 0.30 | 150.4 |
| Compression Ratio | Reference Point ID | IMEP [bar] | Intake Temperature [°C] | λglobal [-] | ST [°CA BTDC] | PC DOI [ms] | Head Temperature [°C] |
|---|---|---|---|---|---|---|---|
| 17.5 | R5 | 3.52 | 33.9 | 2.54 | 12 | 1.68 | 122.1 |
| R6 | 3.49 | 78.5 | 2.75 | 8 | 1.83 | 135.9 | |
| R7 | 3.45 | 100.0 | 2.65 | 6 | 1.10 | 134.1 |
| Targeted Intake Temperature [°C] | Operating Point | IMEP [bar] | Intake Temperature [°C] | λglobal [-] | ST [°CA BTDC] | PC DOI [ms] | Head Temperature [°C] |
|---|---|---|---|---|---|---|---|
| 80 | OP1 | 3.47 | 81.2 | 2.58 | 14 | 0.45 | 133.5 |
| OP2 | 3.42 | 80.2 | 2.58 | 14 | 0.23 | 131.7 | |
| OP3 | 3.48 | 81.2 | 2.57 | 12 | 0.73 | 132.4 | |
| OP4 | 3.50 | 80.7 | 2.56 | 12 | 0.49 | 132.8 | |
| OP5 | 3.45 | 80.3 | 2.54 | 12 | 0.24 | 130.2 | |
| OP6 | 3.48 | 81.2 | 2.53 | 10 | 1.05 | 129.5 | |
| OP7 | 3.50 | 82.0 | 2.54 | 10 | 0.79 | 129.2 | |
| OP8 | 3.50 | 83.0 | 2.52 | 10 | 0.52 | 128.6 | |
| OP9 | 3.50 | 83.7 | 2.50 | 10 | 0.26 | 127.1 | |
| OP10 | 3.53 | 81.7 | 2.49 | 8 | 1.11 | 132.2 | |
| OP11 | 3.49 | 79.9 | 2.50 | 8 | 0.82 | 131.5 | |
| OP12 | 3.51 | 81.0 | 2.49 | 8 | 0.55 | 130.7 | |
| OP13 | 3.59 | 81.0 | 2.42 | 8 | 0.27 | 128.8 | |
| OP14 | 3.56 | 80.2 | 2.45 | 6 | 1.14 | 133.0 | |
| OP15 | 3.47 | 80.0 | 2.47 | 6 | 0.86 | 133.5 | |
| OP16 | 3.48 | 81.8 | 2.47 | 6 | 0.57 | 132.5 | |
| OP17 | 3.47 | 81.7 | 2.44 | 6 | 0.29 | 130.6 | |
| 90 | OP18 | 3.45 | 88.7 | 2.55 | 10 | 0.52 | 137.9 |
| OP19 | 3.55 | 90.2 | 2.51 | 10 | 0.26 | 135.9 | |
| OP20 | 3.51 | 91.2 | 2.50 | 8 | 0.8 | 138.4 | |
| OP21 | 3.49 | 90.8 | 2.51 | 8 | 0.53 | 137.9 | |
| OP22 | 3.44 | 91.5 | 2.50 | 8 | 0.27 | 134.9 | |
| OP23 | 3.48 | 90.6 | 2.49 | 6 | 1.13 | 139.4 | |
| OP24 | 3.51 | 88.5 | 2.48 | 6 | 0.85 | 139.3 | |
| OP25 | 3.46 | 90.3 | 2.50 | 6 | 0.56 | 137.6 | |
| OP26 | 3.50 | 90.9 | 2.44 | 6 | 0.28 | 135.6 | |
| OP27 | 3.51 | 90.0 | 2.44 | 4 | 0.89 | 136.9 | |
| OP28 | 3.51 | 89.9 | 2.42 | 4 | 0.59 | 136.2 | |
| OP29 | 3.45 | 90.2 | 2.41 | 4 | 0.3 | 134.7 | |
| 100 | OP30 | 3.51 | 99.7 | 2.53 | 8 | 0.27 | 139.6 |
| OP31 | 3.49 | 100.6 | 2.51 | 6 | 0.57 | 141.2 | |
| OP32 | 3.48 | 100.2 | 2.51 | 6 | 0.29 | 139.2 | |
| OP33 | 3.50 | 99.1 | 2.48 | 4 | 0.91 | 140.5 | |
| OP34 | 3.47 | 100.5 | 2.50 | 4 | 0.6 | 140.3 | |
| OP35 | 3.40 | 99.4 | 2.55 | 4 | 0.3 | 139.3 | |
| OP36 | 3.55 | 100.9 | 2.46 | 2 | 0.95 | 139.1 | |
| OP37 | 3.51 | 100.8 | 2.47 | 2 | 0.63 | 138.0 | |
| OP38 | 3.54 | 101.2 | 2.46 | 2 | 0.32 | 141.4 |
| Targeted Intake Temperature [°C] | Operating Point | IMEP [bar] | Intake Temperature [°C] | λglobal [-] | ST [°CA BTDC] | PC DOI [ms] | Head Temperature [°C] |
|---|---|---|---|---|---|---|---|
| 80 | OP39 | 3.02 | 80.8 | 2.98 | 18 | 1.01 | 118.4 |
| OP40 | 3.06 | 82.4 | 2.94 | 18 | 0.81 | 118.7 | |
| OP41 | 2.99 | 82.5 | 2.97 | 16 | 1.11 | 114.0 | |
| OP42 | 2.94 | 80.4 | 2.97 | 16 | 0.89 | 115.8 | |
| OP43 | 3.00 | 79.7 | 2.96 | 14 | 1.21 | 119.4 | |
| OP44 | 3.03 | 82.0 | 2.91 | 14 | 0.97 | 118.2 | |
| 90 | OP45 | 3.04 | 91.3 | 2.94 | 14 | 1.17 | 122.5 |
| OP46 | 2.98 | 92.1 | 2.95 | 14 | 0.94 | 121.1 | |
| OP47 | 3.00 | 92.6 | 2.90 | 14 | 0.70 | 120.2 | |
| OP48 | 2.99 | 90.4 | 2.93 | 12 | 1.27 | 121.9 | |
| OP49 | 2.99 | 90.1 | 2.92 | 12 | 1.01 | 120.7 | |
| OP50 | 3.05 | 90.7 | 2.86 | 12 | 0.76 | 119.9 | |
| OP51 | 2.98 | 92.4 | 2.92 | 10 | 1.35 | 123.0 | |
| OP52 | 2.99 | 92.8 | 2.89 | 10 | 1.08 | 122.0 | |
| OP53 | 3.01 | 92.6 | 2.85 | 10 | 0.81 | 119.6 | |
| 100 | OP54 | 3.04 | 100.0 | 2.91 | 12 | 0.90 | 123.3 |
| OP55 | 3.00 | 100.0 | 2.92 | 12 | 0.72 | 122.6 | |
| OP56 | 2.98 | 99.7 | 2.89 | 10 | 1.00 | 122.4 | |
| OP57 | 2.96 | 100.2 | 2.89 | 10 | 0.80 | 122.2 | |
| OP58 | 2.97 | 99.5 | 2.91 | 8 | 1.20 | 123.8 | |
| OP59 | 3.00 | 100.3 | 2.86 | 8 | 0.96 | 122.5 |
| Compression Ratio | Reference Point ID | IMEP [bar] | Intake Temperature [°C] | λglobal [-] | ST [°CA BTDC] | PC DOI [ms] | Head Temperature [°C] |
|---|---|---|---|---|---|---|---|
| 17.5 | R8 | 2.94 | 34.1 | 2.97 | 16 | 1.17 | 110.9 |
| R9 | 3.56 | 32.6 | 2.69 | 16 | 1.13 | 119.7 | |
| R10 | 4.03 | 32.1 | 2.52 | 16 | 1.04 | 127.7 | |
| R11 | 5.63 | 31.9 | 1.89 | 4 | 0.40 | 132.3 |
| Compression Ratio | Reference Point ID | IMEP [bar] | Intake Temperature [°C] | λ [-] | Head Temperature [°C] |
|---|---|---|---|---|---|
| 16 | R12 | 3.55 | 133.35 | 2.44 | 119.49 |
| 17.5 | R13 | 3.55 | 120 | 2.60 | 119.49 |
| R14 | 3.55 | 115 | 2.60 | 119.49 | |
| - | 3.2 | 110 | 2.60 | 119.49 | |
| R15 | 3.06 | 120 | 2.88 | 119.49 | |
| R16 | 3.05 | 115 | 2.88 | 119.49 | |
| - | 2.5 | 110 | 2.88 | 119.49 |
Disclaimer/Publisher’s Note: The statements, opinions and data contained in all publications are solely those of the individual author(s) and contributor(s) and not of MDPI and/or the editor(s). MDPI and/or the editor(s) disclaim responsibility for any injury to people or property resulting from any ideas, methods, instructions or products referred to in the content. |
© 2024 by the authors. Licensee MDPI, Basel, Switzerland. This article is an open access article distributed under the terms and conditions of the Creative Commons Attribution (CC BY) license (https://creativecommons.org/licenses/by/4.0/).
Share and Cite
Krajnović, J.; Ugrinić, S.; Dilber, V.; Kozarac, D. Controllability of Pre-Chamber Induced Homogeneous Charge Compression Ignition and Performance Comparison with Pre-Chamber Spark Ignition and Homogeneous Charge Compression Ignition. Appl. Sci. 2024, 14, 6451. https://doi.org/10.3390/app14156451
Krajnović J, Ugrinić S, Dilber V, Kozarac D. Controllability of Pre-Chamber Induced Homogeneous Charge Compression Ignition and Performance Comparison with Pre-Chamber Spark Ignition and Homogeneous Charge Compression Ignition. Applied Sciences. 2024; 14(15):6451. https://doi.org/10.3390/app14156451
Chicago/Turabian StyleKrajnović, Josip, Sara Ugrinić, Viktor Dilber, and Darko Kozarac. 2024. "Controllability of Pre-Chamber Induced Homogeneous Charge Compression Ignition and Performance Comparison with Pre-Chamber Spark Ignition and Homogeneous Charge Compression Ignition" Applied Sciences 14, no. 15: 6451. https://doi.org/10.3390/app14156451