Abstract
Air pollution is a critical issue impacting urban environments, leading to severe health problems and environmental degradation. This comprehensive review examines the potential of green systems—specifically green walls, active green walls, and urban greenery systems—to mitigate atmospheric pollutants such as particulate matter (PM), volatile organic compounds (VOCs), and carbon dioxide (CO2). By systematically analyzing 44 recent studies, this review highlights the pollutant capture efficiency of various green technologies and plant species in both indoor and outdoor settings. Active green walls, particularly those utilizing plant species such as Chlorophytum comosum and Sansevieria trifasciata, were found to be highly effective, with VOC reduction efficiencies of up to 96.34%, PM reductions of 65.42%, and CO2 reduction rates reaching 4.8% under optimal conditions. This review identifies key strengths in current research, including diverse experimental setups and the use of sophisticated measurement techniques, but also notes significant limitations such as variability in experimental conditions and a lack of long-term performance data. This study underscores the importance of proper maintenance to sustain green systems’ efficacy and highlights the potential issue of pollutant resuspension, which remains under-researched. Practical implications for urban planning are discussed, advocating for the integration of effective green systems into urban infrastructure to enhance air quality and public health. Recommendations for future research include the need for standardized metrics, long-term studies, economic feasibility analyses, and real-world validation of simulation models to better understand and optimize green systems for urban air pollution mitigation.
1. Introduction
Air pollution is a critical issue impacting human health, environmental quality, and overall quality of life in urban areas worldwide [1,2]. According to the World Health Organization, air pollution is responsible for approximately 7 million premature deaths annually [3]. Rapid urbanization and industrial activities have significantly increased the concentration of pollutants such as particulate matter (PM), volatile organic compounds (VOCs), carbon dioxide (CO2), nitrogen oxides (NOx), sulfur dioxide (SO2), and ozone (O3) in the atmosphere [4,5]. These pollutants are linked to severe health problems, including respiratory and cardiovascular diseases, and contribute to climate change and environmental degradation [6]. Consequently, there is an urgent need for effective air pollution mitigation strategies in urban environments.
Green systems, including green walls, active green walls, and urban greenery systems, have emerged as promising solutions to mitigate air pollution [7,8]. These systems utilize plants’ natural ability to absorb, filter, and sequester pollutants, providing an eco-friendly and sustainable approach to improving air quality. Green walls, for example, can be installed on building facades, acting as living filters that trap particulates and absorb gases [9]. Active green walls enhance this effect with integrated ventilation systems that increase airflow through the vegetation, boosting the pollutant capture rate [10]. Urban greenery systems, which include trees, shrubs, and hedges, serve as barriers and sponges for airborne pollutants, improving air quality at the city scale [11].
Over the past decade, five significant reviews have addressed the topic of environmental pollution reduction through green systems [12,13,14,15,16]. The primary differences among these reviews lie in their objectives, the pollutants they address, the types of green systems employed, and the environments in which they are applied. Specifically, Charoenkit and Yiemwattana [12] discuss the benefits of living walls on thermal comfort and CO2 sequestration from the environment. Irga et al. [13] and Bandehali et al. [14] focus on the purification of indoor environments, emphasizing potted plants and the potential of active green walls. Ysebaert et al. [15] and Chaudhuri and Kumar [16] address pollutant mitigation in urban settings.
Despite these contributions, there remains a need for a comprehensive review that not only updates the knowledge provided in earlier studies but also expands the scope to cover various technologies and plant species used in green systems. This proposed review does not examine the reduction of energy consumption, thermal properties, or green roof systems. Instead, it analyzes the performance of various technologies, including green walls, active green walls, and urban greenery systems, with specific insights into the plant species used. It evaluates multiple application environments and considers a wide range of pollutants.
The objective of this study, in addition to updating the knowledge provided in earlier reviews, is to serve as a reference for future experiments investigating botanical biofilter systems applied in both indoor and outdoor environments. To this end, this review aims to offer a foundational understanding of state-of-the-art technologies and materials employed in air purification. It provides information on the types of experiments that can be conducted to evaluate performance, identifying strategies for field experiments (detailing instruments and sensors used), laboratory tests (highlighting which analyses are performed and how), and modeling software for system simulation. By addressing these aspects, this review seeks to enhance the design, implementation, and effectiveness of green systems in mitigating urban air pollution.
2. Methodology
The search for publications to be reviewed in this study was conducted in February 2024, utilizing the Scopus bibliographic database (Figure 1). The search strategy was meticulously designed to identify the scientific literature relevant to the review’s focus on the potential of vegetation-based technologies to mitigate environmental pollution from greenhouse gases, VOCs, and atmospheric particulate matter.
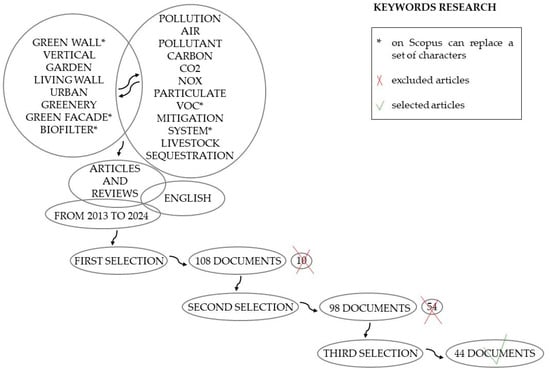
Figure 1.
Diagram visually representing the selection process of articles.
The search was conducted using a combination of specific keywords to capture a wide range of relevant articles. Keywords included terms such as “green wall”, “vertical garden”, “living wall”, “urban greenery”, “green facade”, “pollution”, “air”, “pollutant”, “carbon”, “CO2”, “NOx”, “particulate”, “VOC”, “mitigation”, “system”, “livestock”, “sequestration”, and “biofilter”. These keywords were chosen for the following reasons:
- “Green wall”, “vertical garden”, “living wall”, “urban greenery”, and “green facade”: these terms encompass the various types of vegetation-based systems used in urban environments.
- “Pollution”, “air”, and “pollutant”: these terms relate directly to the primary focus of the study, which is air pollution.
- “Carbon”, “CO2”, “NOx”, “particulate”, “VOC”, and “sequestration”: these terms specify the types of pollutants and processes involved in air quality improvement through green systems.
- “Mitigation”, “system”, and “livestock”: these terms help to capture studies focusing on mitigation strategies and specific application environments like livestock buildings.
- “Biofilter”: this term is crucial for identifying studies that use biological systems to filter and purify air.
In the initial search phase, articles were identified based on their titles if they directly focused on green systems for pollution reduction, resulting in a total of 108 documents. These titles were then screened to ensure they met this criterion. Articles that clearly did not focus on green systems for pollution reduction were excluded. In the second phase, abstracts of these documents were reviewed to exclude studies that treated the topic superficially or marginally, such as studies on greywater reuse with green walls. This step excluded ten articles, leaving 98 documents.
The introduction and conclusion sections of the remaining documents were further analyzed to ensure the studies provided valuable insights into state-of-the-art technologies and materials used in green systems for atmospheric pollution mitigation. Studies were included if they met the following criteria:
- Discussed experimental performance analyses, methodologies, and instruments used to measure pollutant concentrations.
- Quantified the capture of pollutants by botanical biofilters.
- Examined the processes, dynamics, and factors influencing plant capacities.
To ensure that this review covers the most recent advancements and maintains a high standard of scientific rigor, the following exclusion criteria were applied:
- Only studies published in the last ten years were included, excluding articles published before 2013.
- Only peer-reviewed articles in scientific journals were considered.
- Only English-language publications were included to ensure consistency and comprehensibility.
- Studies that were too generic or did not focus primarily on green systems, such as those on the life cycle assessment (LCA) of green walls, their thermal properties, or green roof systems, were excluded as they do not pertain to the primary focus of reducing environmental impact through air purification.
Following this rigorous selection process, a total of 44 journal articles were included in this review. These articles were categorized based on the type of green technology and the type of experimental analysis conducted. The first group includes articles on green walls, active green walls, urban greenery systems, and plant properties and their suitability as biofilters. The second group includes experimental studies testing performance at the installation site (indoor, outdoor, livestock buildings), laboratory or controlled environment analyses, and studies conducting simulations using software and mathematical models. Figure 2 shows the word cloud of the keywords included in the 44 journal articles analyzed.
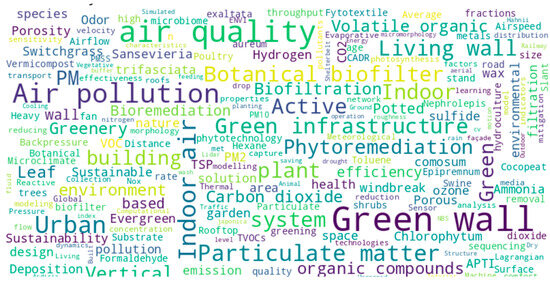
Figure 2.
Word cloud of the keywords from the selected papers.
The selected studies address a range of pollutants, including particulate matter (PM), VOCs, trace elements (TEs, such as zinc and copper), heavy metals (HMs), CO2, NO3, SO2, and O3. This detailed methodology ensures that the review is transparent and reproducible, providing a robust framework for evaluating the performance of green systems in mitigating air pollution.
3. Technology and Materials
This section provides an overview of the technologies and materials used in the selected studies to create experimental biofilters aimed at pollutant capture. The studies are grouped based on the technological systems: green walls, active green walls, urban greenery systems, and plant species. The absorption results of the different technologies will be discussed in Section 5.
3.1. Green Walls
Suarez-Caceres et al. [17] aimed to examine the potential of living walls to remove VOCs. They used a modular felt-based system developed and patented by the University of Seville (Fytotextile®, Terapia Urbana, S.L., Seville, Spain). The module consisted of felt pockets designed for semi-hydroponic cultures, featuring a waterproof back layer, an intermediate drainage layer, and a breathable front layer. Nephrolepis exaltata L. was planted in a mixture of coconut fiber and peat (Figure 3). The modular technology allows for covering large vertical surfaces, enabling the capture of substantial amounts of VOCs near the system. Additionally, using a lightweight material like felt helps contain the load on the support structure.
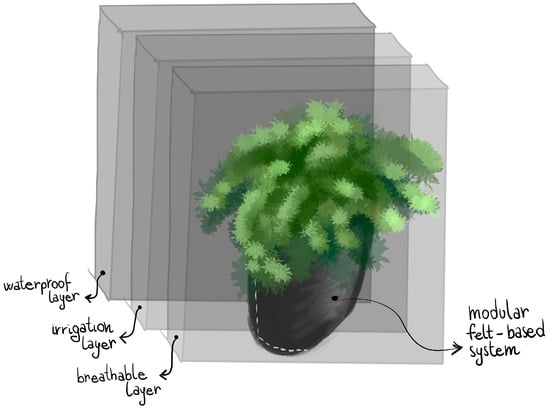
Figure 3.
Modular felt-based system.
Similarly, Shushunova et al. [18] focused on VOC removal and compared the performance and characteristics of five types of commercial green wall systems. Among them, the “Scotscape hydroponic wall system” uses lightweight felt-based modules (Fytotextile®), similar to the previously described study. These are attached to a support layer via a metal frame, with irrigation tubes and a hydroponic drainage system. Another system, the “Versa-wall container system”, consists of a covering structure attached to the wall, framing rows of trays and pots with a drip irrigation system, which can be manual or automatic, with water drainage from the bottom or recirculated. This system is noted for its ease of installation and maintenance.
The “Alivotec container system” features a modular configuration with a metal frame and non-toxic plastic trays containing soil where plants grow. The trays have grooves to facilitate irrigation, which can be manual or automatic, connected to a water supply system. This technology is lightweight and easy to install, with the advantage of easily replacing individual plants since each is planted in a separate tray. The “Biotecture modular hydroponic system” includes a steel support frame holding an impermeable panel, a geotextile drainage layer, an automatic drip irrigation system, and a hydroponic growing medium in Rockwool with a polypropylene grid and vegetation layer. This complex structure makes it the second-heaviest system studied. The “Vertiss modular substrate system” is the heaviest (94 kg/m2) and comprises a steel frame, modular openings containing Pozzolan and cross-linked polymers as substrates, and a less dense vegetation layer (maximum 32 plants per m2), with automatic micro-drip irrigation (Figure 4).

Figure 4.
Vertiss modular substrate system.
Six studies evaluated how structure, materials, and selected plant species influence the ability to absorb atmospheric particulate matter. Hozhabralsadat et al. [19] conducted an experiment to select the best plant species for reducing PM concentrations within a green wall. The analyzed structure featured a waterproof steel grid support with plastic trays, similar to the “Alivotec container system” described above, filled with soil, fertilizer, and chosen plants.
Weerakkody et al. [20,21] used a commercial living wall system by Nemec Cascade Garden Ltd., Praha, Czech Republic, consisting of self-supporting modular panels with interconnected water containers holding potted plants and an automatic irrigation system, to analyze PM removal.
Shao et al. [22] designed an LWS to reduce CO2 levels, connected to a base wall with a metal frame and fixing screws. The structure includes pots linked to an irrigation system that pumps water from a base reservoir, distributes it via drip irrigation, and returns it by gravity (Figure 5). In contrast, Yungstein and Helman [23] used a hydroponic LWS based on Patrick Blanc’s method, with PVC waterproof plates attached to the support wall and fabric layers directly planted with vegetation.
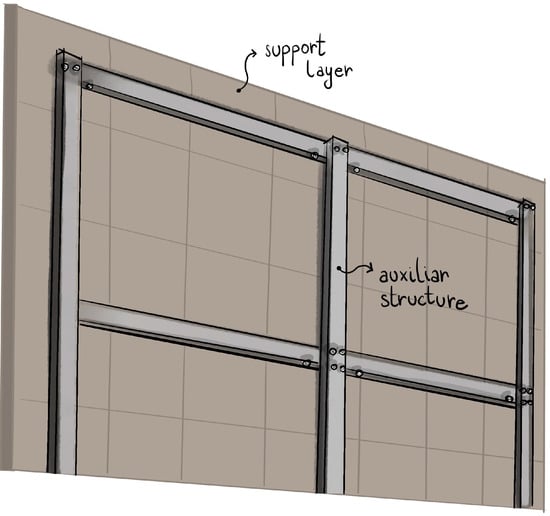
Figure 5.
LWS connected to a base wall with a metal frame and fixing screws.
Additionally, it is crucial to investigate how the environmental placement of green walls affects their performance. Viecco et al. [24] is an example of a study that analyzed how spatial arrangements of green systems influence PM capture, considering variables like installation distance from pollution sources and the presence and height of nearby buildings for outdoor installations.
Table 1 summarizes the key characteristics of various green wall systems examined in the reviewed studies. It includes information on the pollutants targeted (VOC, PM, CO2), the type of construction used for the green walls (semi-hydroponic, hydroponic, modular, container), the vegetation species implemented, and the growing medium utilized. The studies range from examining VOC reduction using semi-hydroponic systems with Nephrolepis exaltata L. [17] to assessing PM reduction with container systems employing various plant species like Rosmarinus officinalis and Lavandula angustifolia [19], and CO2 absorption with hydroponic systems using Peperomia obtusifolia and other species [23]. The diverse methodologies and plant species highlighted in this table underscore the varied approaches and potential of green wall systems for environmental pollution mitigation.

Table 1.
Comparison of green wall systems.
3.2. Active Green Walls
Numerous scientific studies have evaluated the performance of active green walls in filtering and purifying air from harmful substances such as particulate matter (PM), nitrogen dioxide (NO2), carbon dioxide (CO2), and VOCs.
Wu and Yu [25] aimed to assess the formaldehyde removal capacity of an active green wall system equipped with a ventilation system placed behind the green wall module. The positioning of the fan is crucial in the design of an efficient active wall, as it increases the pressure and volume of air exposed to the biofilter, thereby enhancing the quantity and speed of pollutant capture (Figure 6).
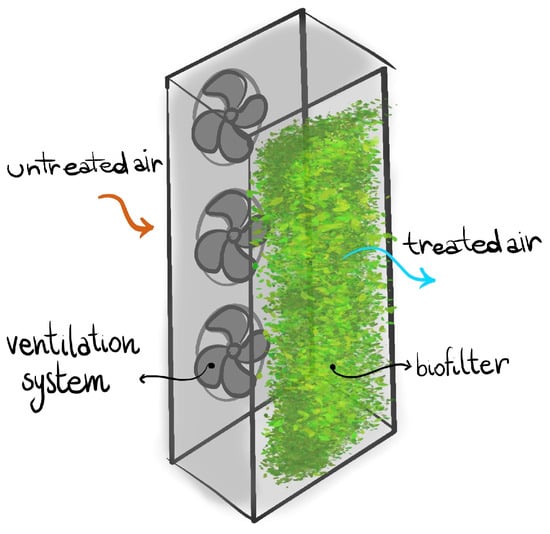
Figure 6.
Green wall equipped with a ventilation system placed behind the module.
Abdo et al. [26] evaluated the airflow characteristics and performance of an active green wall. In their experiment, a mechanical fan was positioned at the center of the back surface of the module, which was rectangular and housed a waterproof polyethylene container designed to hold coconut husk and fiber substrate. The plants extended from the container through openings at the front of the module. Similar systems were studied by Ibrahim et al. [27] and Torpy et al. [28], where the vegetative part consisted of potted plants facing the front of the module, with a series of axial fans placed on the opposite side.
Potted plants were also used in the study by Pongkua et al. [29], cultivated on a wall biofilter with soil and coconut husk. Unlike the previous studies, the ventilation in this setup was designed on the top of the wall rather than the back.
For NO2 capture, Pettit et al. [10] used a coconut husk-based growth substrate, known for its high capacity to filter PM and VOCs. Materials such as coconut husk combined with activated carbon, due to their excellent absorption properties, were considered for modular green wall substrates in studies by Pettit et al. [30] and Pettit et al. [31].
Among the selected works, Irga et al. [32] and Torpy et al. [33] integrated mechanical ventilation into a botanical biofilter system. The first study used a technology designed by the authors themselves: an independent unit on wheels where plants are installed within modular compartments acting as a filter matrix. The second study used a commercial, self-supporting hydroponic system (Naava One system, Naturvention Pty, Jyväskylä, Finland) featuring an irrigation system with a water reserve, where plants are placed in inorganic material enriched with activated carbon. Similar to Torpy et al. [33], Villani et al. [34] opted for a large, self-supporting, modular hydroponic green panel, where airflow can be forced by the internal ventilation system to enhance the capture performance of PM, NO, NO2, and NOx.
Masi et al. [35] conducted a study on the mitigation of air contaminated by VOCs, using the system designed by Pettit et al. [36], consisting of a self-supporting vertical structure with modules attached to a plywood box. Here, too, the structure includes integrated fans: polluted air is pushed through the growth substrate to the green face of each module, filtered, and then returned clean to the environment.
Ajami et al. [37,38,39] experimented with a different active green wall system compared to the previously described ones. Instead of layered technologies using vegetation as a screen punctually inserted on the main wall surface, these three studies used a “porous windbreak wall”, which is a box structure made of treated wood with integrated mechanical fans. The structure is enclosed with a fiberglass screen. To avoid the negative counterpressure effect caused by the fan, the authors created an opening at the bottom of the box, in front of which vegetation is planted to filter and clean the outgoing air.
Table 2 provides a comprehensive overview of the active green wall systems evaluated in the reviewed studies, detailing the pollutants addressed (VOC, PM, CO2, NO, NO2, O3), construction types (modular, freestanding, box, hydroponic), the vegetation species utilized, and the growing mediums employed. The studies range from modular systems, targeting VOC reduction with species such as C. comosum, S. octophylla, and C. elegans [25], to modular freestanding systems addressing multiple pollutants including PM and VOC using Epipremnum aureum [27] and hydroponic systems for CO2 absorption involving plants like Neomarica sp. and Philodendron xanadu [28]. The growing mediums vary, with the common use of coconut husks, soil, and activated carbon, reflecting diverse methodologies and plant choices in enhancing air purification through active green walls.
Table 2.
Comparison of Active Green Walls.
3.3. Urban Greenery Systems
To address urban pollution, various studies have explored the use of nature-based greening solutions such as trees, shrubs, and hedges. Urban greenery systems and vegetative environmental buffers are plant-based solutions that function independently of artificial structures like support frames or metal frameworks, serving as barriers and sponges for airborne pollutants.
Grzędzicka [40] and Srbinovska et al. [41] conducted studies to investigate the air-cleaning capacity of urban green infrastructures for particulate matter (PM) and carbon dioxide (CO2). These studies tested deciduous trees like maples and beeches, as well as evergreen trees like spruces. Both studies found that these natural filters were effective, with their performance closely linked to climatic factors such as temperature, humidity, and wind speed. Aligning with these findings, Kandelan et al. [42] examined the importance of designing urban green systems in relation to environmental conditions. This study evaluated the orientation and placement of trees and shrubs, considering not only their exposure to areas with high pollutant concentrations but also the wind direction to maximize pollutant deposition.
Motie et al. [43] also studied how spatial positioning, characteristics, and types of plant species affect green infrastructure performance, along with the climate in which they are deployed. The goal was to identify the “optimal model” to maximize PM absorption.
Studies by Ma et al. [44] and Kaspar et al. [45] sought to determine the influence of green infrastructure configuration (trees and hedges) on pollutant removal capacity. Ma et al. [44] examined the effect of hedge geometry, testing various heights, densities, and depths. Kaspar et al. [45] aimed to define the performance differences in urban greenery systems based on tree canopy heterogeneity, the contribution of woody parts to pollutant deposition, and the impact of plant life stages on their mitigation abilities.
Willis et al. [46] and Guo et al. [47] focused on vegetative environmental buffers (VEBs). These systems use trees and hedges to physically block and intercept pollutant dispersion. They leverage their orientation and arrangement (e.g., in groups or rows) to influence wind direction and speed, thereby affecting the transport of suspended particles.
Table 3 summarizes the urban greenery systems assessed in the reviewed studies, detailing the pollutants targeted (PM, CO2, O3), construction types (mostly unspecified as these systems often involve direct planting in urban environments), the variety of vegetation used, and the growing mediums (mostly unspecified due to natural soil usage). The studies include a range of tree species such as Betula spp., Fagus spp., and Quercus spp. [40], various shrubs and hedges [41], and specific plant species like Agave victoriae-reginae and Ophiopogon japonicus [42]. These systems are designed to mitigate urban air pollution through the natural filtration capacities of diverse plant species, contributing to the reduction of particulate matter, CO2, and O3. The growing mediums are typically natural soil or unspecified, reflecting the direct integration of these plants into urban landscapes.
Table 3.
Comparison of urban greenery systems.
3.4. Considerations on Plant Species
A crucial element in designing an effective green system for mitigation is the choice of plant species. Plants play a fundamental role in reducing the impact of particulate matter and harmful gases. The rhizosphere microbial community and substrate enable plants to remove pollutants, either by metabolizing them as nutrients or through other metabolic processes. Removal occurs mainly through systemic absorption and deposition, which can be wet (due to precipitation) or dry (due to gravity).
Numerous studies have explored the capture capacities and efficiency of different plant species to identify the key factors for selecting plants for the outer layer of the filter wall. Mikkonen et al. [48] tested the impact of plants and substrate on purification capabilities, analyzing factors such as the presence of microbes in the rhizosphere and irrigation water, substrate types contributing to pollutant degradation, and airflow through the root system (Figure 7).
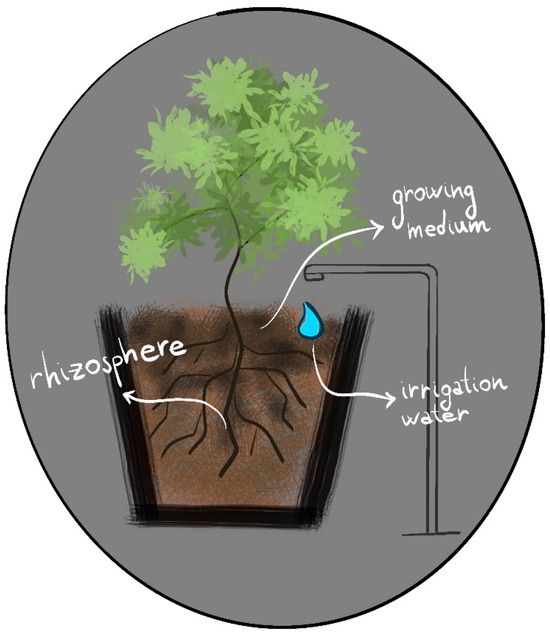
Figure 7.
Impact of plants and substrate on purification capabilities.
Agra et al. [49] discussed using spider plants and devil’s ivy to mitigate CO2 levels. They tested the impact of the pot volume containing the growing medium and plant and the influence of green–white leaf segmentation. Kazemi et al. [50] examined the air purification performance of plants, testing which plant–substrate combinations were most effective, considering growth index, leaf density, and coverage. Similarly, Shen et al. [51] tested the capacity of green wall plants to absorb major urban VOCs. The selection of the best plant species is a widely discussed topic in the literature, as seen in the works of Pettit et al. [52], Weerakkody et al. [53], and Przybysz et al. [54]. Pettit et al. [52] tested plant species on a vertical support system with mechanical ventilation, comparing physical characteristics and PM biofiltration efficiency. Weerakkody et al. [53] evaluated the differences in the quantity and size of PM removed by plant species in a living wall. Przybysz et al. [54] compared multiple species regarding PM and trace element (TE) accumulation, considering influential factors such as leaf wax presence, structure, and plant age.
The health of the vegetation acting as a biofilter is fundamental for long-term removal efficiency. Continuous exposure to contaminants can cause significant changes in the microbial community, reducing the plant’s environmental impact reduction capacity. Pandey et al. [55] calculated the Air Pollution Tolerance Index (APTI) for some climbing plants used in vertical green systems, recognizing that a high APTI value indicates greater plant tolerance to atmospheric pollutants. Paull et al. [56] also focused on this topic, evaluating the resistance and tolerance of common green wall plant species to pollutant exposure, highlighting those most effective in high-pollutant contexts and thus suitable for use in a biofilter system.
Besides pollution tolerance, other factors can influence plant performance. Treesubsuntorn and Thiravetyan [57] investigated the conditions under which plants are grown, such as light conditions. Low light intensities render plants ineffective and can increase ambient CO2 concentration because, under these conditions, plants can become a source. Choi et al. [58] evaluated plant performance under low light intensity and studied plant responses to drought conditions, as water stress can cause the closure of stomata, essential for capturing harmful substances.
Climatic conditions also significantly influence the capture and retention of pollutants by plants. Weerakkody et al. [21] studied the phenomenon of particle resuspension, where pollutants can be re-released into the environment due to strong winds or precipitation.
Table 4 provides a summary of the various plant species examined for their pollutant mitigation capabilities in different construction setups, including potted plants, modular systems, and containers. The pollutants addressed include VOCs, CO2, PM, TEs, O3, SO2, and NO2. The vegetation types range from commonly used indoor plants such as Chlorophytum comosum and Epipremnum aureum to more diverse species like Taxus baccata L. and Pinus nigra Arn. Growing mediums vary from traditional soil to more specialized mixtures like cocopeat, perlite, and vermicompost, reflecting the adaptability of plant species to different substrates for optimal pollutant absorption and retention. The studies highlight the importance of selecting appropriate plant species and growing mediums to enhance the efficiency of green systems in mitigating various environmental pollutants.
Table 4.
Comparison of plant species.
4. Comparative Analysis of Experimental and Simulation Approaches
This section discusses the various methods used to evaluate the mitigation performance of vertical green systems in the selected studies. Three categories of approaches emerged: in situ experimental analysis, laboratory experimental analysis, and model-based simulations.
4.1. Experimental Analysis of “In Situ” Performance
The studies described in this section conducted experimental analyses to investigate the pollutant capture capacities of botanical biofilters in their installed locations. These locations, either indoor or outdoor, correspond to the areas where monitoring and testing were performed using various instruments, technologies, and sensors.
4.1.1. Indoor Performance Trials
Irga et al. [32] conducted their experiment in offices within a railway station depot undergoing maintenance, which caused high localized pollutant levels. Two offices were examined: one with an active green wall (AGW) installed and the other left empty as a control. Concentrations of PM2.5, NO2, and O3 were measured over a 42-day sampling period, along with temperature, relative humidity, and dew point. The single pass removal efficiency (SPRE) was evaluated by calculating the ratio of ambient pollutant concentrations to filtered concentrations. Results showed lower concentrations in the room with the AGW, with a removal efficiency of 80% for O3 and 75% for PM, but only 40% for NO2.
Similarly, Pettit et al. [36] achieved positive results in reducing PM and VOC levels using an AGW tested in a residential room. A sensor installed in the center of the room, maintained at 20–25 °C, detected pollutants over eight trials per pollutant, each lasting 32–37 min. The green system provided better air quality compared to a standard HVAC system.
Shao et al. [22] tested the reduction of PM and CO2 concentrations with a green wall located on the first floor of a six-level office building, specifically on a corridor wall in the stairwell. Measurements of CO2, PM, temperature, and relative humidity were taken using an air quality monitor, photosynthetically active radiation meter, anemometer, and passenger flow counter. The system showed a 17% reduction in CO2 levels and a reduction of PM2.5 by 40%, demonstrating high air purification performance.
4.1.2. Outdoor Performance Trials
Villani et al. [34] conducted outdoor experiments to examine PM and NOx capture by a green wall with integrated assisted mechanical ventilation. The authors worked in an urban context, measuring concentrations over 12 days with a condensation particle counter for PM and an analyzer for NO, NO2, and NOx gas concentrations. The tests showed that the greatest reduction effect occurred in the area near the infrastructure, known as the “region of influence”.
Similarly, Srbinovska et al. [41] found that pollutant concentrations were lowest near the green wall, where deciduous trees, shrubs, and evergreen trees were present, along with buildings, a parking lot, and a road. Measurement points were strategically placed: one near the road, one near the green wall, and one distant from both.
Grzędzicka [40] conducted research in the large urban park “Parco della Slesia” in Poland, measuring air quality at 40 different points once a month for five months. Data were acquired on days with similar weather conditions to verify their influence on pollutant capture. The study found that pollutant concentrations increased with distance from the filtering system.
Kaspar et al. [45] observed a relationship between pollutant concentrations, air temperature, and solar radiation. The highest accumulation of harmful particles occurred during warm hours, while a decrease was observed during cooler hours. The experiment was conducted at a site between a residential area and an urban forest, with pollution data collected using sensors uniformly distributed across the site.
4.1.3. Livestock Farming Area Trials
Four studies conducted experimental analyses within livestock farming areas. The pollutant types and concentrations in these areas differ significantly from those near busy roads or inside urban buildings. The site conditions are unique, necessitating a tailored mitigation strategy using vertical green systems.
Ajami et al. [38,39] installed a Windbreak Wall–Vegetative Strip System in a pig farm and a poultry house, respectively. These studies aimed to apply and validate the experimental filtration system. Near the technology (previously described under “active green walls”), measurements included total suspended particulate (TSP) concentrations, ventilation rate, temperature, fiberglass screen porosity, and differential pressure. The results showed that lower screen porosity increased PM capture but also increased counter-pressure due to screen clogging. The system reduced TSP emissions, ammonia emissions, and odor; vegetation and soil also captured nitrogen and sulfur.
Willis et al. [46] and Guo et al. [47] studied the installation of vegetative environmental buffers in poultry houses. These systems, composed of rows of trees and hedges, control emissions from agricultural areas to the environment, reduce wind speed, and create acoustic and visual barriers. Willis et al. [46] used lidar (light detection and ranging) to estimate particulate capture efficiency, which works by interacting infrared light pulses with air particles. Guo et al. [47] measured concentrations using real-time aerosol monitors and laser photometric meters to detect PM.
Table 5 summarizes the in situ experimental analyses conducted to evaluate the pollutant mitigation performance of various green systems in different settings, including indoor environments, outdoor urban areas, and livestock buildings. The studies investigated pollutants such as particulate matter (PM), VOCs, ozone (O3), nitrogen dioxide (NO2), carbon dioxide (CO2), carbon (C), nitrogen (N), and sulfur (S). The table details the type of green system used, the specific test site, and the pollutant detection methods employed. This comprehensive overview highlights the practical applications and effectiveness of green systems in real-world conditions, providing valuable insights into their potential for environmental pollution mitigation.
Table 5.
Summary of in situ experimental performance analyses.
4.2. Laboratory Tests
Most experimental analyses in the reviewed documents were conducted in laboratory settings, allowing for controlled air quality and climate conditions, such as specific temperature or relative humidity values. This environment also permitted the use of non-portable instruments and the creation of polluted environments through dispersion in sealed test chambers.
4.2.1. Sealed Fumigation Chambers
Sealed fumigation chambers are among the most commonly used tools for analyzing phytoremediation capabilities in pollutant reduction. To test the single pass removal efficiency (SPRE), studies by Pettit et al. [30,31,52] used a sealed Perspex chamber with an internal biofilter. This setup included a contaminant generator connected to the chamber entrance, where an axial fan transported pollutants into the main chamber, and another fan dispersed the pollutants. Particles were evenly distributed within the space, connected to a detection instrument and a vacuum exhaust (Figure 8). These studies highlighted the importance of regulating airflow, selecting plants based on their root systems (which significantly impact particle capture), choosing substrate material and size, and considering water retention capacity and pressure loss.
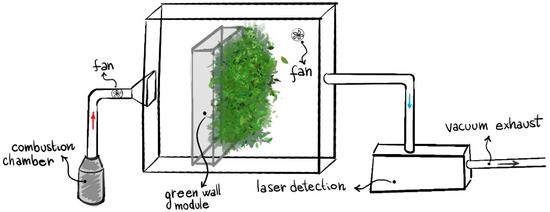
Figure 8.
Sealed fumigation chamber.
Pettit et al. [10] also estimated SPRE using a closed-loop flow reactor with an oval shape, constructed with PVC ducts, polycarbonate, and glass tubes, containing axial fans (before and after the filter) and sensors to monitor pressure, air velocity, and gas concentration. Wu and Yu [25] calculated SPRE in a dynamic test chamber to quantify VOC removal efficiency by active green wall systems, using three types of plants. They found that higher formaldehyde concentrations and airflow rates reduced efficiency. Mikkonen et al. [48] suggested that initial rapid removal could be due to VOC deposition on moist substrate surfaces and leaves rather than active plant absorption.
4.2.2. Plant Characteristics and Purification Capacities
Many laboratory tests aimed to study plant characteristics crucial for their purification capacities. Agra et al. [49] examined the effect of leaf color segmentation and pot volume on CO2 absorption efficiency within a test chamber, finding that green–white leaf variants were more efficient than completely green ones and that larger pots improved performance. Pandey et al. [55] calculated the Air Pollution Tolerance Index (APTI) to identify the most tolerant climbing plant species with the best long-term performance. They monitored air quality, considered climatic conditions, used mathematical models, and studied plant characteristics such as ascorbic acid content, leaf pH, relative water content (RWC), and total chlorophyll content, finding that high APTI values correspond to high pollutant tolerance.
Similar experiments by Hozhabralsadat et al. [19] and Paull et al. [56] focused on plant health variables and calculated APTI, noting that most plants exposed to harmful particles showed no significant health effects during tests. However, prolonged exposure to polluted air could damage plants. Suarez-Caceres et al. [17] conducted long-term removal capacity tests in a sealed glass chamber, exposing plants to pollutants for up to 72 h. Maximum reduction values were observed at the beginning, with performance declining over time. Similarly, Shen et al. [51] found that VOC removal rates were positive during the first 24 h but decreased and became negative in most cases thereafter.
4.2.3. Environmental Factors Influencing Purification
Weerakkody et al. [21] examined the potential for captured particles to re-enter the environment due to natural phenomena like wind or rain. Tests in an environmental chamber with a rain simulator, fan, and air flow meter quantified PM levels on leaf surfaces using ESEM/ImageJ 1.46r analysis, showing significant particle removal by rain on both adaxial and abaxial surfaces.
Factors such as irrigation and lighting conditions also significantly impact purification performance. Choi et al. [58] tested a biofilter in a transparent panel box with potted plants, a fluorescent lamp, fans (for introducing contaminated air and releasing cleaned air), a water circulation system, a control panel, and an air quality analyzer. They found that removal efficiency was higher under continuous light in any drought condition, as lack of water caused stomata closure, and leaf wax increased pollutant removal. Abdo et al. [26] experimented with the importance of airflow and pressure through the module using tools like a thermo-anemometer to measure air velocity and temperature and digital pressure sensors. A water-saturated substrate allowed high air passage, aiding pollutant absorption. Pongkua et al. [29] assessed the contribution of airflow turbulence in a test chamber with pollutant injection points, a central fan for even particle distribution, integrated green system fans, entry and exit sampling instruments, a door, and fluorescent lighting.
Yungstein and Helman [23] studied the effects of lighting conditions on plants in a laboratory room with a green wall, an HVAC system, CO2 inlet tubes, a gas exchange device, temperature and humidity sensors, and LED lighting. CO2 reduction increased with higher light intensities and decreased when lights were off, supporting findings by Kaspar et al. [45]. Treesubsuntorn and Thiravetyan [57] found that CO2 concentrations increased under low light, while VOC removal continued, albeit less efficiently. Torpy et al. [28] identified suitable cultivars for active green walls, highlighting those capable of removing CO2 under low light conditions and noting that substrate ventilation slightly increased removal rates.
Torpy et al. [33] tested VOC removal efficiency in a laboratory room with an integrated ventilation and lighting system, exposing four plant types to methyl ethyl ketone (MEK) from a VOC source connected to the lab. Inlet and outlet air samples were compared to determine green system effectiveness. Ibrahim et al. [27] evaluated a biofiltration system’s efficacy in removing MEK in a test chamber using incense cones containing the compound.
Several studies compared plant species to identify the best for pollutant absorption. Weerakkody et al. [53] analyzed species in a living wall exposed to traffic pollution in a metro station, examining particle distribution on leaves and using ESEM/ImageJ for PM quantification. Weerakkody et al. [20] assessed evergreen and deciduous plants of various sizes and micromorphologies in a living wall to reduce PM from city traffic, sampling leaves randomly, and quantifying PM following the same approach. Weerakkody et al. [60] compared PM distribution on a homogeneous surface (plants of two cultivars of the same height) to a heterogeneous one (plants of varying heights) in a living wall, finding that morphological diversity positively impacted PM removal.
Przybysz et al. [54] collected tree and soil samples from a moderately trafficked site, conducting laboratory tests to analyze PM and TE accumulation on leaves, studying wax content through chemical analysis, and dissolving wax in chloroform before using the Image Analysis System from Skye Instruments Ltd., along with the Skye-Leaf software. Kazemi et al. [59] tested plant species and substrate performance in a laboratory with a green wall, analyzing pH, total chlorophyll content, air quality, temperature, humidity, plant growth index, and leaf area, finding that species with high growth indices and coverage were most suitable. Shushunova et al. [18] compared commercial green wall technologies in a laboratory chamber, using air sampling equipment and chemical analyses to determine pollutant reduction efficacy.
Table 6 presents a comprehensive summary of laboratory tests conducted to evaluate the effectiveness of various green systems in mitigating different pollutants. The studies include a variety of green systems, such as plant species, active green walls, and green walls, tested in both indoor and outdoor environments. Each entry specifies the type of pollutant targeted, the green system used, the test site setting, and the specific pollutant detection methods employed. This detailed overview provides valuable insights into the experimental setups and methodologies used in controlled environments to assess the pollutant reduction capabilities of green systems.
Table 6.
Summary of laboratory tests evaluating pollutant mitigation by green systems.
4.3. Model-Based Simulations
The final group of publications employed mathematical models and simulation software to analyze data and predict expected results. By providing inputs such as climatic conditions or system configurations, these simulations can offer anticipations or hypotheses about the performance of the tested technology. The models were validated against experimental or real-world data to ensure reliability and accuracy.
4.3.1. Sensitivity and Scenario Analysis
The study by Masi et al. [35] aimed to validate a simulation model using the green system developed by Pettit et al. [36] as a reference. A global sensitivity analysis was conducted to measure the influence of input parameters on the pollutant capture response of the biofilter. Numerical models were implemented using a computational platform capable of solving partial differential equations (PDEs) with the finite element method. The initial conditions included ambient pollutant concentrations and flow rates, and boundary conditions were set to reflect real-world environmental parameters.
4.3.2. Computational Fluid Dynamics (CFD) Simulations
Ajami et al. [37] conducted a preliminary analysis for their field studies [38,39] by modeling 72 different scenarios of a porous windbreak wall using computational fluid dynamics (CFD) software FloEFD version 17.2. They experimented with various shapes, sizes, screen porosities, and fan directions to identify the system with the best-predicted performance. Boundary conditions included airflow velocity and direction, while initial conditions were set to represent pollutant concentrations typical of livestock buildings. The assumptions included uniform pollutant distribution and constant environmental conditions.
4.3.3. Urban Green Infrastructure Simulations
Ma et al. [44] used a numerical model and software to generate the structure of hedgerows, examining the effect of geometry and the number of rows for effective mitigation performance. They set boundary conditions such as airflow velocity at the system’s inlet and outlet, characteristics of the top and bottom edges, and the fluid or porous zone for the barrier. Initial conditions involved pollutant concentrations derived from field measurements, and assumptions included steady-state conditions and homogeneous vegetation properties.
Viecco et al. [24], Motie et al. [43], and Kandelan et al. [42] utilized the ENVI-met modeling software, version 5.1, to study the performance of green systems positioned in urban areas subjected to road traffic PM pollution. Viecco et al. [24] developed three ENVI-met models: the Validation Model (VM) with an idealized configuration of the urban area, the Sensitivity Analysis Model (SAM) to identify green wall layouts with the highest particulate capture capacity, and the Greener Corridor Model (GCM) simulating a base scenario (BC) without green infrastructure and a scenario with green systems added to buildings. Initial conditions included pollutant concentrations and meteorological data, while boundary conditions reflected urban environmental parameters. Validation was conducted using real-world air quality data.
Motie et al. [43] tested nine models using meteorological data from spring and summer, comparing two types of urban canyons and conducting 36 different simulations. The model calculated pollutant deposition on urban surfaces and vegetation based on input data. Boundary conditions included meteorological parameters, and initial conditions were set based on observed pollutant levels. The models were validated against experimental air quality measurements.
4.3.4. Wind and Airflow Simulations
Kandelan et al. [42] created a three-dimensional model to simulate the interaction between the biofilter surface and air. The simulation used aerial images for precise model definition, detailing permeable and impermeable areas, building heights, and street dimensions. Four scenarios were simulated: without green infrastructure and wind direction parallel to the streets, with green infrastructure and wind direction parallel to the streets, without green infrastructure and wind direction oblique to the streets, and with green infrastructure and wind direction oblique to the streets. Initial conditions included pollutant concentrations and wind patterns, while boundary conditions reflected the urban layout. Validation was performed using field data on air quality and pollutant deposition.
In the study by Villani et al. [34], following the in situ experimental analyses described in the “Experimental Analysis of ‘In Situ’ Performance—Outdoor Performance Trials” section, a simulation was conducted using the Micro-SWIFT-SPRAY (PMSS) modeling system. Field data served as inputs to quantify pollutant concentration reductions in the simulated model. Boundary conditions included meteorological parameters and pollutant emission rates, while initial conditions were based on measured pollutant levels. The model was validated by comparing simulated results with experimental observations.
Table 7 provides an overview of model-based simulations conducted to evaluate the effectiveness of various green systems in mitigating different pollutants. The studies listed utilize different simulation modeling tools to predict the performance of green systems under various conditions. Each entry details the type of pollutant addressed, the green system evaluated, the setting of the simulation (indoor or outdoor), and the specific simulation modeling tools used. This table highlights the diverse methodologies and computational platforms employed to simulate and predict the impact of green systems on environmental pollution mitigation.
Table 7.
Summary of model-based simulations evaluating pollutant mitigation by green systems.
5. Pollutant Reduction Results
This section highlights the results obtained on the effectiveness of reducing pollutants in both indoor and outdoor environments through the use of green walls, active green walls, and urban greenery systems. Considering the characteristics of the studies described in the previous sections (e.g., different methods used for experiments, various technologies analyzed, and boundary conditions), this section presents and discusses the results in terms of pollutant reduction, as well as the plant species deemed most suitable for use in biofilters.
5.1. CO2 Reduction
Among the studies exploring the potential to reduce CO2, Torpy et al. [28] conducted laboratory tests within a glass chamber on an active green wall biofiltration system, examining the gas absorption capacity of multiple plant species under different light intensities, with and without ventilation. The results showed that species such as C. comosum, E. aureum, and Gibasis sp. could absorb CO2 even at lower light intensities, and substrate ventilation slightly increased the CO2 removal rate. Notably, C. comosum under high light intensity and substrate ventilation reduced the largest CO2 volume, approximately 2999 mL h⁻1 (with light level 250 μmol m⁻2 s⁻1 and fan speed 3.5 m s⁻1). Similarly, Yungstein and Helman [23] found greater CO2 reduction at higher light intensities in laboratory analyses, achieving a 4.8% absorption rate with a green wall system, albeit without assisted ventilation. Shao et al. [22] presented field performance results of a living wall in an occupied urban building, with CO2 levels reduced by 49.9–68.8 μg m⁻3, or about 12–17%, compared to measurements in a similar area without a living wall (Figure 9).
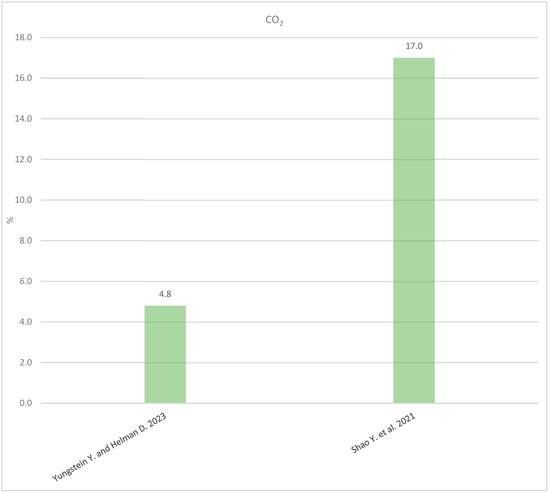
Figure 9.
Maximum percentage of CO2 that studies have succeeded in reducing [22,23].
5.2. VOC Reduction
For SPRE tested in laboratory settings for VOC reduction, Treesubsuntorn and Thiravetyan [57] identified C. comosum and S. trifasciata as the best species for biofilters, evaluating their performance under different light intensities, with an efficiency of 15–20%. Though not very high, this efficiency is functional for purifying the environment. In laboratory analyses, Torpy et al. [33] conducted three tests with increasing pollutant concentrations in the system, measuring output concentrations to determine the efficiency of the active green wall. After a single pass through the biofilter, the removal efficiency was 56.6 ± 0.86%. Laboratory tests by Ibrahim et al. [27] showed an active green wall removal efficiency of 46 ± 4.02%.
Pettit et al. [31] evaluated removal efficiency linked to the chemical properties of VOCs by placing an active green wall module in a test chamber and subjecting it to various harmful substances (e.g., acetone, ethanol, ethyl acetate). The average SPRE for each substance varied from 19.76% to 96.34%. In situ experiments on an active green wall by Pettit et al. [36] compared the efficiency of an active biofilter and a passive one, finding VOC concentrations of 300 ± 3.04 ppbv in a room with a passive green wall, reduced to 217 ± 2.00 ppbv in a room with an active green wall, demonstrating the higher efficiency of the system utilizing airflow through the technology.
Pongkua et al. [29] demonstrated the excellent performance of S. trifasciata, stating that total VOCs could be removed by about 40%. Shen et al. [51] considered VOC removal by various plant species over time. The results showed that the best reduction in 24 h was achieved by Davallia fejeensis, with an average of 1739.755 μg m⁻3, and in 48 h by Platycerium bifurcatum, with an average of 2415.038 μg m⁻3. The species with the poorest mitigation performance after both 24 and 48 h was Calathea lancifolia, with averages of 66.138 μg m⁻3 and 94.766 μg m⁻3, respectively (Figure 10).
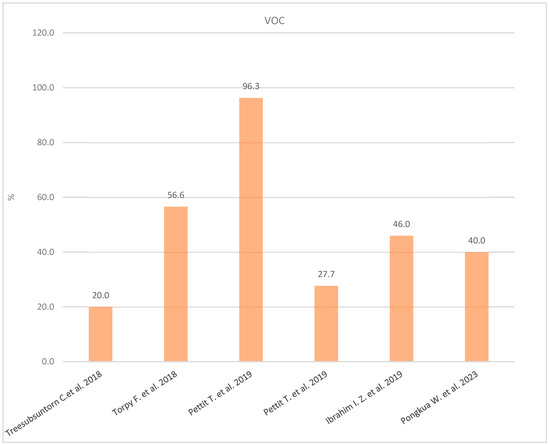
Figure 10.
Maximum percentage of VOCs that studies have succeeded in reducing [27,29,31,33,36,57].
5.3. Particulate Matter (PM) Reduction
Several studies have quantitatively evaluated the performance of green walls in reducing particulate matter (PM). Willis et al. [46] studied a vegetative environmental buffer surrounding an animal feeding operation and found substantial differences in PM absorption between day and night, considering the kinetic energy associated with turbulence to which the systems were exposed. The VEB was less efficient during the day but mitigated PM presence more effectively at night. Overall, the capture efficiency ranged from 21% to 74%, depending on atmospheric conditions. Pettit et al. [36], in comparing active and passive green walls, found that, without mechanical ventilation, PM concentrations inside a room were 101.18 ± 0.29 μg m⁻3. The active botanical filter reduced PM by 42.6%. Ibrahim et al. [27] experimented with a new component called evaporative media (EM), which enhanced the active green wall’s ability to reduce particulates, achieving a removal efficiency of 54.5 ± 6.04% for PM2.5 and 65.42 ± 9.27% for PM10.
Laboratory tests conducted by Przybysz et al. [54] showed that the species P. nigra was the best at capturing PM, with the highest amount of accumulated PM found on its leaf surfaces (PM10: 114.6 μg cm⁻2; PM2.5: 8.99 μg cm⁻2; PM0.2: 4.13 μg cm⁻2). Guo et al. [47] identified Padus Virginiana “Red Select Shrub” as the most effective species for capturing particles of various sizes in a vegetative environmental buffer, accumulating the most PM on its leaves with 18 μg/m3 of PM2.5 and 64 μg/m3 of PM10. Pongkua et al. [29] found that the species S. trifasciata applied to an active green wall module could decrease PM2.5 from 41.67 μg m⁻3 to 13.20 μg m⁻3.
Considerations on the effective range of biofilters were made by Srbinovska et al. [41], who found differences in PM capture at various distances from the urban greenery system. For example, considering a normal concentration of <50 mg/m3, the PM10 concentration was 21.32 μg m⁻3 far from the biofilter, whereas it was 13.86 μg m⁻3 near the biofilter. Kandelan et al. [42] noted that the height-to-width ratio significantly impacts vegetation efficiency and particulate concentration. An increase in the H/W ratio led to higher PM2.5 concentrations, with the system achieving a reduction of up to 24.41%. Shao et al. [22] verified the effective reduction of PM due to the presence of a living wall in an indoor environment, measuring reductions of PM0.3–1 by 1.9–9.4 μg m⁻3 (about 2.4–14.3% compared to the environment without a living wall); 5.1–13.3 μg m⁻3 for PM1–2.5 (about 10.3–11.3% compared to the environment without a living wall); and 5.9–6.2 μg m⁻3 for PM2.5–10 (about 4.7–10.3% compared to the environment without a living wall).
Analyses by Ajami et al. [38,39] on windbreak wall–vegetative strip systems installed near livestock buildings found a range of TSP reduction from 36% to 58%. Field analyses by Kaspar et al. [45] and Irga et al. [32] on urban greenery systems and active green walls examined both PM reduction and harmful gases like O3 and NO2. Kaspar et al. [45] found a removal rate of 0.00–0.28 g m⁻2 per ppb for PM10 and 0.00–0.16 g m⁻2 per ppb for O3. Irga et al. [32] found O3 concentrations of 15.02 ± 0.24 ppb, NO2 concentrations of 5.16 ± 0.19 ppb, and PM2.5 concentrations of 4.08 ± 0.31 μg/m3 in an office with an active green wall. These values were compared to 19.50 ± 0.27 ppb, 6.75 ± 1.33 ppb, and 7.16 ± 3.20 μg/m3, respectively, in a reference office without an AGW (Figure 11).
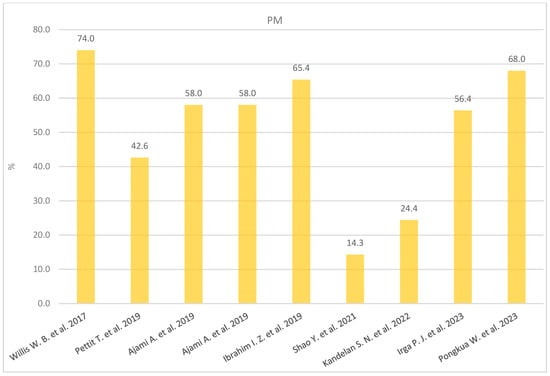
Figure 11.
Maximum percentage of PMs that studies have succeeded in reducing [22,27,29,32,36,38,39,42,46].
6. Discussion
This section discusses the effectiveness of various green systems in reducing pollutants in both indoor and outdoor environments. It critically analyzes the strengths and limitations of the reviewed studies, highlights inconsistencies or gaps in the literature, and explores the practical implications for urban planning, policy-making, and the design of green systems.
6.1. Strengths of Reviewed Studies
The reviewed studies have several strengths:
- They employed a wide range of experimental setups, including controlled laboratory conditions and in situ field experiments. This diversity allowed for a thorough examination of the performance of green systems under different environmental conditions. For instance, Pettit et al. [36] and Shao et al. [22] conducted detailed indoor experiments, providing robust data on pollutant reduction in controlled settings.
- Another significant strength is the coverage of a variety of plant species, which highlighted those best suited for different pollutants. For example, Torpy et al. [28] and Yungstein and Helman [23] identified specific plants like Chlorophytum comosum and Epipremnum aureum for CO2 reduction, while Ibrahim et al. [27] focused on VOC and PM reduction using species like Epipremnum aureum and Sansevieria trifasciata.
- The studies also utilized sophisticated measurement tools and techniques, such as laser nephelometers and gas chromatography-mass spectrometry (GC-MS), ensuring high accuracy and reliability of the data. This precision allowed for detailed quantification of pollutant levels and assessment of green system performance.
6.2. Limitations and Inconsistencies
Despite their strengths, the studies have notable limitations:
- One significant issue is the variability in experimental conditions, such as the size of test chambers, pollutant concentrations, and environmental parameters like temperature and humidity. These differences make it challenging to compare results across studies directly. For example, the CO2 reduction efficiency reported by Shao et al. [22] in a corridor wall setup may not be directly comparable to the controlled laboratory conditions used by Torpy et al. [30].
- Inconsistent metrics and units used to report pollutant reduction further complicate direct comparisons. For instance, some studies reported VOC reduction in terms of percentage efficiency, while others used absolute concentrations. Standardizing these metrics would enhance comparability and synthesis of results.
- Many studies conducted short-term experiments, often lasting only a few days or weeks. This duration may not capture the long-term performance and sustainability of green systems. For instance, the high initial VOC reduction observed by Pettit et al. [31] might not be sustained over extended periods.
6.3. Gaps in the Literature
There are notable gaps in the literature:
- One major gap is the lack of long-term studies assessing the durability and effectiveness of green systems over time. Longitudinal studies are necessary to understand how these systems perform under varying seasonal conditions and prolonged exposure to pollutants.
- Another gap is the limited focus on economic feasibility. Few studies have explored the economic feasibility and cost-benefit analysis of implementing green systems on a large scale. Future research should include economic assessments to provide a more comprehensive understanding of the practicality of these solutions.
- There is also a need for more real-world validation of the simulation models used in many studies. While Ajami et al. [37] and Ma et al. [44] used computational fluid dynamics (CFD) models, their assumptions and boundary conditions need rigorous validation against actual field data to ensure reliability.
6.4. Practical Implications
The findings from these studies have significant implications for urban planning and the design of green infrastructure:
- The high efficiency of certain plant species in reducing CO2 and PM suggests that urban planners should incorporate these species into city landscapes and building designs to improve air quality.
- Policy-makers can use these insights to develop regulations and incentives for the adoption of green systems in urban areas. For instance, mandating the installation of green walls in new buildings could be a policy measure to enhance urban air quality.
- The detailed performance metrics provided by the studies can guide the design and optimization of green systems. Designers can select plant species and system configurations based on the specific pollutants targeted and the environmental conditions of the installation site.
The reviewed studies underscore the potential of green systems in mitigating environmental pollution. However, to fully harness this potential, future research should address the identified gaps and standardize methodologies. Practical implementation of these findings requires collaboration between scientists, urban planners, and policy-makers to create healthier and more sustainable urban environments.
Future research should focus on long-term studies to assess the durability and effectiveness of green systems over time and include economic feasibility analyses to understand the cost–benefit ratio of large-scale implementations. Additionally, more real-world validation of simulation models is needed to ensure their reliability and applicability in practical scenarios.
7. Limitations and Recommendations
After examining the articles and discussing the state-of-the-art topics, several limitations and gaps in the current scientific publications on vertical green systems for pollutant mitigation have been identified.
One significant limitation is the lack of detailed information on the maintenance of green walls. Most of the selected studies do not address this topic, with the exception of Suarez-Caceres et al. [17], which only mentions the maintenance frequency of the active green wall, and Shen et al. [51], which provides reflections on the importance of maintaining green wall plants and practical suggestions for their management, including a predictive vegetation replacement system. Maintenance is known to be one of the most significant costs in green infrastructure design, alongside installation. Designing a robust maintenance system is crucial for the long-term performance of the plants, as prolonged exposure to high pollutant concentrations can reduce their capacity to absorb harmful compounds and may even lead to premature termination of their life cycle. Besides botanical care, it is also essential to regularly check the technologies that comprise the entire system, such as irrigation devices or materials within the layers (e.g., fabric layers or growth substrates), as these elements contribute to achieving optimal performance.
In light of these observations, future research should focus on designing an effective maintenance program alongside the technological framework. Defining maintenance practices that ensure sustained performance over time is essential.
Another gap found in the literature is the potential for captured pollutants to be re-released into the environment after impacting the leaves, a phenomenon known as pollutant resuspension. This re-emission can occur naturally due to wind or be triggered by rainfall washing the pollutants off the leaves. Only two studies address this issue: Weerakkody et al. [21], which specifically aims to determine the influence of rain on the remobilization of PM accumulated on leaves, and Ibrahim et al. [27], where the topic is only briefly mentioned.
It is crucial for future research on green walls for pollutant capture to also evaluate the possibility of re-releasing these sequestered particles back into the environment. Therefore, it will be important to design systems that minimize resuspension by selecting appropriate materials or plants or by developing strategies to reduce this undesirable phenomenon. In light of the results obtained from the selected articles, this review proposes a strategy for the design and performance analysis of a green system for pollutant mitigation, offering insights for future research.
Regarding the type of technology, it has been shown that airflow through vegetation substantially increases efficiency [26,28,29,34,36]. However, no significant differences in pollutant capture were found between modular systems on fixed supports, freestanding modular systems, or container systems. Therefore, the choice of this characteristic can depend solely on the installation site conditions. It is important to maintain a high water content as it helps retain particles better and makes vegetation more tolerant [19,26,55]. The most effective substrate identified is coconut husk [10,26,29].
The system identified by this review as potentially highly performant, and recommended for future experiments, is an active green wall. This system should have a fan positioned on the rear side and an automatic irrigation system that activates when a low substrate humidity value is detected. The substrate could be composed of a mix of coconut husk and organic material. The choice of technology should consider ease of maintenance, such as using lightweight tanks and pots for planting the most efficient plant species like C. comosum and S. trifasciata [28,29,57].
It will be important to define a performance analysis strategy that includes measuring pollutant concentrations when the system is exposed to polluted air and conducting laboratory tests to study the chemical composition of the plants and the amount of particles trapped in the leaves, root system, and growth substrate. Additionally, simulation modeling is highly beneficial. Predicting the future performance of the technology in the context of the microclimatic characteristics of the installation site is crucial. By considering factors such as rain frequency or wind presence, it is possible to assess how resuspension phenomena might impact the actual purification of the environment. Based on these results, the most suitable location, orientation, and shape for hosting the technology can be determined.
In summary, the recommended strategy for designing and analyzing the performance of a green system for pollutant mitigation includes the following steps:
- Opt for active green walls with a fan and automatic irrigation system, using a mix of coconut husk and organic material as the substrate.
- Choose efficient plant species such as C. comosum and S. trifasciata.
- Develop a robust maintenance plan that includes regular checks of the irrigation system, substrate, and plants.
- Measure pollutant concentrations in situ and conduct laboratory tests on the chemical composition and particle capture of the plants.
- Use simulation software to predict the performance of the green system under various microclimatic conditions, minimizing resuspension phenomena and optimizing the system’s placement and design.
Implementing this strategy can provide a comprehensive framework for future research and development of effective green systems for environmental pollutant mitigation.
8. Conclusions
This review aimed to evaluate the effectiveness of various green systems, including green walls, active green walls, and urban greenery systems, in mitigating environmental pollutants such as particulate matter (PM), VOCs, and gases like CO2 and NO2. The key findings from the reviewed studies indicate that green systems can significantly reduce pollutant concentrations in both indoor and outdoor environments. Active green walls, in particular, showed enhanced efficiency due to the incorporation of airflow through vegetation, with species such as Chlorophytum comosum and Sansevieria trifasciata demonstrating high pollutant absorption capacities.
The key findings are as follows:
- Green systems effectively reduce various pollutants. Active green walls achieved higher removal efficiencies compared to passive systems, with VOC reductions of up to 96.34%, PM reductions of 65.42%, and CO2 reduction rates reaching 4.8% under optimal conditions.
- Specific plant species, like Chlorophytum comosum and Sansevieria trifasciata, exhibited high capacities for pollutant absorption, making them ideal for green systems.
- Proper maintenance is crucial for sustaining the performance of green systems. This includes regular checks of irrigation systems, substrates, and plant health to prevent declines in efficiency.
- The potential for pollutant resuspension is a significant gap in current research. Addressing this issue is essential for designing more effective and reliable green systems.
The findings highlight the potential of green systems to improve air quality in urban environments, contributing to public health and environmental sustainability. Urban planners and policy-makers can leverage these insights to develop regulations and incentives for adopting green systems. For instance, mandating green wall installations in new buildings and incorporating specific plant species into urban landscapes could enhance urban air quality.
To advance the field, researchers, policy-makers, and practitioners should focus on the following:
- Conducting long-term studies to assess the durability and effectiveness of green systems under varying seasonal conditions and prolonged pollutant exposure.
- Including economic analyses to evaluate the cost-benefit ratio of large-scale green system implementations.
- Enhancing the reliability and applicability of simulation models through real-world validation against field data.
- Developing maintenance programs that ensure the long-term efficiency of green systems, addressing potential issues like pollutant resuspension.
By addressing these areas, future research can build on the current understanding and develop more effective and sustainable green systems for environmental pollutant mitigation. This will not only enhance air quality but also contribute to healthier urban living environments.
Author Contributions
Conceptualization, S.C. and P.R.D.; methodology, S.C.; formal analysis, S.V.; investigation, S.C. and S.V.; writing—original draft preparation, S.V.; writing—review and editing, S.C.; visualization, S.C.; supervision, P.R.D. All authors have read and agreed to the published version of the manuscript.
Funding
This research received no external funding.
Data Availability Statement
No new data were created or analyzed in this study.
Acknowledgments
The publication was created within the framework of the European Union—FSE-REACT-EU, PON Research and Innovation 2014–2020 DM1062/2021.
Conflicts of Interest
The authors declare no conflicts of interest.
References
- Mannucci, P.; Franchini, M. Health Effects of Ambient Air Pollution in Developing Countries. Int. J. Environ. Res. Public Health 2017, 14, 1048. [Google Scholar] [CrossRef]
- Piracha, A.; Chaudhary, M.T. Urban Air Pollution, Urban Heat Island and Human Health: A Review of the Literature. Sustainability 2022, 14, 9234. [Google Scholar] [CrossRef]
- Lelieveld, J.; Evans, J.S.; Fnais, M.; Giannadaki, D.; Pozzer, A. The Contribution of Outdoor Air Pollution Sources to Premature Mortality on a Global Scale. Nature 2015, 525, 367–371. [Google Scholar] [CrossRef]
- Chen, Z.; Liu, N.; Tang, H.; Gao, X.; Zhang, Y.; Kan, H.; Deng, F.; Zhao, B.; Zeng, X.; Sun, Y.; et al. Health Effects of Exposure to Sulfur Dioxide, Nitrogen Dioxide, Ozone, and Carbon Monoxide between 1980 and 2019: A Systematic Review and Meta-analysis. Indoor Air 2022, 32, e13170. [Google Scholar] [CrossRef]
- Wang, T.; Xue, L.; Brimblecombe, P.; Lam, Y.F.; Li, L.; Zhang, L. Ozone Pollution in China: A Review of Concentrations, Meteorological Influences, Chemical Precursors, and Effects. Sci. Total Environ. 2017, 575, 1582–1596. [Google Scholar] [CrossRef] [PubMed]
- Sofia, D.; Gioiella, F.; Lotrecchiano, N.; Giuliano, A. Mitigation Strategies for Reducing Air Pollution. Environ. Sci. Pollut. Res. 2020, 27, 19226–19235. [Google Scholar] [CrossRef] [PubMed]
- Cascone, S.; Leuzzo, A. Thermal Comfort in the Built Environment: A Digital Workflow for the Comparison of Different Green Infrastructure Strategies. Atmosphere 2023, 14, 685. [Google Scholar] [CrossRef]
- Diener, A.; Mudu, P. How Can Vegetation Protect Us from Air Pollution? A Critical Review on Green Spaces’ Mitigation Abilities for Air-Borne Particles from a Public Health Perspective—With Implications for Urban Planning. Sci. Total Environ. 2021, 796, 148605. [Google Scholar] [CrossRef]
- Radić, M.; Brković Dodig, M.; Auer, T. Green Facades and Living Walls—A Review Establishing the Classification of Construction Types and Mapping the Benefits. Sustainability 2019, 11, 4579. [Google Scholar] [CrossRef]
- Pettit, T.; Irga, P.J.; Surawski, N.C.; Torpy, F.R. An Assessment of the Suitability of Active Green Walls for NO2 Reduction in Green Buildings Using a Closed-Loop Flow Reactor. Atmosphere 2019, 10, 801. [Google Scholar] [CrossRef]
- Yu, M.; Zhou, W.; Zhao, X.; Liang, X.; Wang, Y.; Tang, G. Is Urban Greening an Effective Solution to Enhance Environmental Comfort and Improve Air Quality? Environ. Sci. Technol. 2022, 56, 5390–5397. [Google Scholar] [CrossRef]
- Charoenkit, S.; Yiemwattana, S. Living Walls and Their Contribution to Improved Thermal Comfort and Carbon Emission Reduction: A Review. Build. Environ. 2016, 105, 82–94. [Google Scholar] [CrossRef]
- Irga, P.J.; Pettit, T.J.; Torpy, F.R. The Phytoremediation of Indoor Air Pollution: A Review on the Technology Development from the Potted Plant through to Functional Green Wall Biofilters. Rev. Environ. Sci. Biotechnol. 2018, 17, 395–415. [Google Scholar] [CrossRef]
- Bandehali, S.; Miri, T.; Onyeaka, H.; Kumar, P. Current State of Indoor Air Phytoremediation Using Potted Plants and Green Walls. Atmosphere 2021, 12, 473. [Google Scholar] [CrossRef]
- Ysebaert, T.; Koch, K.; Samson, R.; Denys, S. Green Walls for Mitigating Urban Particulate Matter Pollution—A Review. Urban For. Urban Green. 2021, 59, 127014. [Google Scholar] [CrossRef]
- Chaudhuri, S.; Kumar, A. Urban Greenery for Air Pollution Control: A Meta-Analysis of Current Practice, Progress, and Challenges. Environ. Monit. Assess. 2022, 194, 235. [Google Scholar] [CrossRef] [PubMed]
- Suarez-Caceres, G.P.; Fernández-Cañero, R.; Fernández-Espinosa, A.J.; Rossini-Oliva, S.; Franco-Salas, A.; Pérez-Urrestarazu, L. Volatile Organic Compounds Removal by Means of a Felt-Based Living Wall to Improve Indoor Air Quality. Atmos. Pollut. Res. 2021, 12, 224–229. [Google Scholar] [CrossRef]
- Shushunova, N.; Korol, E.; Luzay, E.; Shafieva, D. Impact of the Innovative Green Wall Modular Systems on the Urban Air. Sustainability 2023, 15, 9732. [Google Scholar] [CrossRef]
- Hozhabralsadat, M.S.; Heidari, A.; Karimian, Z.; Farzam, M. Assessment of Plant Species Suitability in Green Walls Based on API, Heavy Metal Accumulation, and Particulate Matter Capture Capacity. Environ. Sci. Pollut. Res. 2022, 29, 68564–68581. [Google Scholar] [CrossRef]
- Weerakkody, U.; Dover, J.W.; Mitchell, P.; Reiling, K. Quantification of the Traffic-Generated Particulate Matter Capture by Plant Species in a Living Wall and Evaluation of the Important Leaf Characteristics. Sci. Total Environ. 2018, 635, 1012–1024. [Google Scholar] [CrossRef]
- Weerakkody, U.; Dover, J.W.; Mitchell, P.; Reiling, K. The Impact of Rainfall in Remobilising Particulate Matter Accumulated on Leaves of Four Evergreen Species Grown on a Green Screen and a Living Wall. Urban For. Urban Green. 2018, 35, 21–31. [Google Scholar] [CrossRef]
- Shao, Y.; Li, J.; Zhou, Z.; Zhang, F.; Cui, Y. The Impact of Indoor Living Wall System on Air Quality: A Comparative Monitoring Test in Building Corridors. Sustainability 2021, 13, 7884. [Google Scholar] [CrossRef]
- Yungstein, Y.; Helman, D. Cooling, CO2 Reduction, and Energy-Saving Benefits of a Green-Living Wall in an Actual Workplace. Build. Environ. 2023, 236, 110220. [Google Scholar] [CrossRef]
- Viecco, M.; Jorquera, H.; Sharma, A.; Bustamante, W.; Fernando, H.J.S.; Vera, S. Green Roofs and Green Walls Layouts for Improved Urban Air Quality by Mitigating Particulate Matter. Build. Environ. 2021, 204, 108120. [Google Scholar] [CrossRef]
- Wu, D.; Yu, L. Effects of Airflow Rate and Plant Species on Formaldehyde Removal by Active Green Walls. Environ. Sci. Pollut. Res. 2022, 29, 88812–88822. [Google Scholar] [CrossRef] [PubMed]
- Abdo, P.; Huynh, B.P.; Irga, P.J.; Torpy, F.R. Evaluation of Air Flow through an Active Green Wall Biofilter. Urban For. Urban Green. 2019, 41, 75–84. [Google Scholar] [CrossRef]
- Ibrahim, I.Z.; Chong, W.T.; Yusoff, S.; Wang, C.T.; Xiang, X.; Muzammil, W.K. Evaluation of Common Indoor Air Pollutant Reduction by a Botanical Indoor Air Biofilter System. Indoor Built Environ. 2021, 30, 7–21. [Google Scholar] [CrossRef]
- Torpy, F.; Zavattaro, M.; Irga, P. Green Wall Technology for the Phytoremediation of Indoor Air: A System for the Reduction of High CO2 Concentrations. Air Qual. Atmos. Health 2017, 10, 575–585. [Google Scholar] [CrossRef]
- Pongkua, W.; Sriprapat, W.; Thiravetyan, P.; Treesubsuntorn, C. Active Living Wall for Particulate Matter and VOC Remediation: Potential and Application. Environ. Sci. Pollut. Res. 2023, 31, 36180–36191. [Google Scholar] [CrossRef]
- Pettit, T.; Irga, P.J.; Torpy, F.R. Functional Green Wall Development for Increasing Air Pollutant Phytoremediation: Substrate Development with Coconut Coir and Activated Carbon. J. Hazard. Mater. 2018, 360, 594–603. [Google Scholar] [CrossRef]
- Pettit, T.; Bettes, M.; Chapman, A.R.; Hoch, L.M.; James, N.D.; Irga, P.J.; Torpy, F.R. The Botanical Biofiltration of VOCs with Active Airflow: Is Removal Efficiency Related to Chemical Properties? Atmos. Environ. 2019, 214, 116839. [Google Scholar] [CrossRef]
- Irga, P.J.; Morgan, A.; Fleck, R.; Torpy, F.R. Phytoremediation of Indoor Air Pollutants from Construction and Transport by a Moveable Active Green Wall System. Atmos. Pollut. Res. 2023, 14, 101896. [Google Scholar] [CrossRef]
- Torpy, F.; Clements, N.; Pollinger, M.; Dengel, A.; Mulvihill, I.; He, C.; Irga, P. Testing the Single-Pass VOC Removal Efficiency of an Active Green Wall Using Methyl Ethyl Ketone (MEK). Air Qual. Atmos. Health 2018, 11, 163–170. [Google Scholar] [CrossRef]
- Villani, M.G.; Russo, F.; Adani, M.; Piersanti, A.; Vitali, L.; Tinarelli, G.; Ciancarella, L.; Zanini, G.; Donateo, A.; Rinaldi, M.; et al. Evaluating the Impact of a Wall-Type Green Infrastructure on Pm10 and Nox Concentrations in an Urban Street Environment. Atmosphere 2021, 12, 839. [Google Scholar] [CrossRef]
- Masi, M.; Nissim, W.G.; Pandolfi, C.; Azzarello, E.; Mancuso, S. Modelling Botanical Biofiltration of Indoor Air Streams Contaminated by Volatile Organic Compounds. J. Hazard. Mater. 2022, 422, 126875. [Google Scholar] [CrossRef]
- Pettit, T.; Irga, P.J.; Torpy, F.R. The in Situ Pilot-Scale Phytoremediation of Airborne VOCs and Particulate Matter with an Active Green Wall. Air Qual. Atmos. Health 2019, 12, 33–44. [Google Scholar] [CrossRef]
- Ajami, A.; Shah, S.B.; Stikeleather, L.F. Windbreak Wall-Vegetative Strip System to Reduce Air Emissions from Mechanically-Ventilated Livestock Barns—Part 1: CFD Modeling. Water Air Soil Pollut. 2019, 230, 291. [Google Scholar] [CrossRef]
- Ajami, A.; Shah, S.B.; Wang-Li, L.; Kolar, P.; Castillo, M.S. Windbreak Wall-Vegetative Strip System to Reduce Air Emissions from Mechanically Ventilated Livestock Barns—Part 3: Layer House Evaluation. Water Air Soil Pollut. 2019, 230, 290. [Google Scholar] [CrossRef]
- Ajami, A.; Shah, S.B.; Wang-Li, L.; Kolar, P.; Castillo, M.S. Windbreak Wall-Vegetative Strip System to Reduce Air Emissions from Mechanically Ventilated Livestock Barns: Part 2—Swine House Evaluation. Water Air Soil Pollut. 2019, 230, 289. [Google Scholar] [CrossRef]
- Grzędzicka, E. Is the Existing Urban Greenery Enough to Cope with Current Concentrations of PM2.5, PM10 and CO2? Atmos. Pollut. Res. 2019, 10, 219–233. [Google Scholar] [CrossRef]
- Srbinovska, M.; Andova, V.; Mateska, A.K.; Krstevska, M.C. The Effect of Small Green Walls on Reduction of Particulate Matter Concentration in Open Areas. J. Clean. Prod. 2021, 279, 123306. [Google Scholar] [CrossRef]
- Kandelan, S.N.; Yeganeh, M.; Peyman, S.; Panchabikesan, K.; Eicker, U. Environmental Study on Greenery Planning Scenarios to Improve the Air Quality in Urban Canyons. Sustain. Cities Soc. 2022, 83, 103993. [Google Scholar] [CrossRef]
- Motie, B.M.; Yeganeh, M.; Bemanian, M. Assessment of Greenery in Urban Canyons to Enhance Thermal Comfort & Air Quality in an Integrated Seasonal Model. Appl. Geogr. 2023, 151, 102861. [Google Scholar] [CrossRef]
- Ma, S.; Maghirang, R.; Zhao, D.; Liu, X.; Wang, C.; Guo, L. A Numerical Simulation Study of Particulate Collection by Vegetative Barriers. Biosyst. Eng. 2019, 186, 182–194. [Google Scholar] [CrossRef]
- Kaspar, V.; Zapletal, M.; Samec, P.; Komárek, J.; Bílek, J.; Juráň, S. Unmanned Aerial Systems for Modelling Air Pollution Removal by Urban Greenery. Urban For. Urban Green. 2022, 78, 127757. [Google Scholar] [CrossRef]
- Willis, W.B.; Eichinger, W.E.; Prueger, J.H.; Hapeman, C.J.; Li, H.; Buser, M.D.; Hatfield, J.L.; Wanjura, J.D.; Holt, G.A.; Torrents, A.; et al. Particulate Capture Efficiency of a Vegetative Environmental Buffer Surrounding an Animal Feeding Operation. Agric. Ecosyst. Environ. 2017, 240, 101–108. [Google Scholar] [CrossRef]
- Guo, L.; Ma, S.; Zhao, D.; Zhao, B.; Xu, B.; Wu, J.; Tong, J.; Chen, D.; Ma, Y.; Li, M.; et al. Experimental Investigation of Vegetative Environment Buffers in Reducing Particulate Matters Emitted from Ventilated Poultry House. J. Air Waste Manag. Assoc. 2019, 69, 934–943. [Google Scholar] [CrossRef]
- Mikkonen, A.; Li, T.; Vesala, M.; Saarenheimo, J.; Ahonen, V.; Kärenlampi, S.; Blande, J.D.; Tiirola, M.; Tervahauta, A. Biofiltration of Airborne VOCs with Green Wall Systems—Microbial and Chemical Dynamics. Indoor Air 2018, 28, 697–707. [Google Scholar] [CrossRef]
- Agra, H.; Uni, D.; Horwitz, R.; Klein, T.; Blaustein, L. Leaf Color Segmentation and Pot Volume Influence on the CO2 Absorption Efficiency in Two Common Green-Wall Plants. J. Green. Build. 2021, 16, 3–12. [Google Scholar] [CrossRef]
- Kazemi, M.; Courard, L.; Attia, S. Water Permeability, Water Retention Capacity, and Thermal Resistance of Green Roof Layers Made with Recycled and Artificial Aggregates. Build. Environ. 2023, 227, 109776. [Google Scholar] [CrossRef]
- Shen, X.; Sun, Q.; Mosey, G.; Ma, J.; Wang, L.; Ge, M. Benchmark of Plant-Based VOCs Control Effect for Indoor Air Quality: Green Wall Case in Smith Campus at Harvard University. Sci. Total Environ. 2024, 906, 166269. [Google Scholar] [CrossRef] [PubMed]
- Pettit, T.; Irga, P.J.; Abdo, P.; Torpy, F.R. Do the Plants in Functional Green Walls Contribute to Their Ability to Filter Particulate Matter? Build. Environ. 2017, 125, 299–307. [Google Scholar] [CrossRef]
- Weerakkody, U.; Dover, J.W.; Mitchell, P.; Reiling, K. Particulate Matter Pollution Capture by Leaves of Seventeen Living Wall Species with Special Reference to Rail-Traffic at a Metropolitan Station. Urban For. Urban Green. 2017, 27, 173–186. [Google Scholar] [CrossRef]
- Przybysz, A.; Nersisyan, G.; Gawroński, S.W. Removal of Particulate Matter and Trace Elements from Ambient Air by Urban Greenery in the Winter Season. Environ. Sci. Pollut. Res. 2019, 26, 473–482. [Google Scholar] [CrossRef] [PubMed]
- Pandey, A.K.; Pandey, M.; Tripathi, B.D. Assessment of Air Pollution Tolerance Index of Some Plants to Develop Vertical Gardens near Street Canyons of a Polluted Tropical City. Ecotoxicol. Environ. Saf. 2016, 134, 358–364. [Google Scholar] [CrossRef] [PubMed]
- Paull, N.J.; Krix, D.; Irga, P.J.; Torpy, F.R. Green Wall Plant Tolerance to Ambient Urban Air Pollution. Urban For. Urban Green. 2021, 63, 127201. [Google Scholar] [CrossRef]
- Treesubsuntorn, C.; Thiravetyan, P. Botanical Biofilter for Indoor Toluene Removal and Reduction of Carbon Dioxide Emission under Low Light Intensity by Using Mixed C3 and CAM Plants. J. Clean. Prod. 2018, 194, 94–100. [Google Scholar] [CrossRef]
- Choi, Y.K.; Song, H.J.; Jo, J.W.; Bang, S.W.; Park, B.H.; Kim, H.H.; Kim, K.J.; Jeong, N.R.; Kim, J.H.; Kim, H.J. Morphological and Chemical Evaluations of Leaf Surface on Particulate Matter2.5 (PM2.5) Removal in a Botanical Plant-Based Biofilter System. Plants 2021, 10, 2761. [Google Scholar] [CrossRef]
- Kazemi, F.; Rabbani, M.; Jozay, M. Investigating the Plant and Air-Quality Performances of an Internal Green Wall System under Hydroponic Conditions. J. Environ. Manag. 2020, 275, 111230. [Google Scholar] [CrossRef]
- Weerakkody, U.; Dover, J.W.; Mitchell, P.; Reiling, K. Topographical Structures in Planting Design of Living Walls Affect Their Ability to Immobilise Traffic-Based Particulate Matter. Sci. Total Environ. 2019, 660, 644–649. [Google Scholar] [CrossRef]
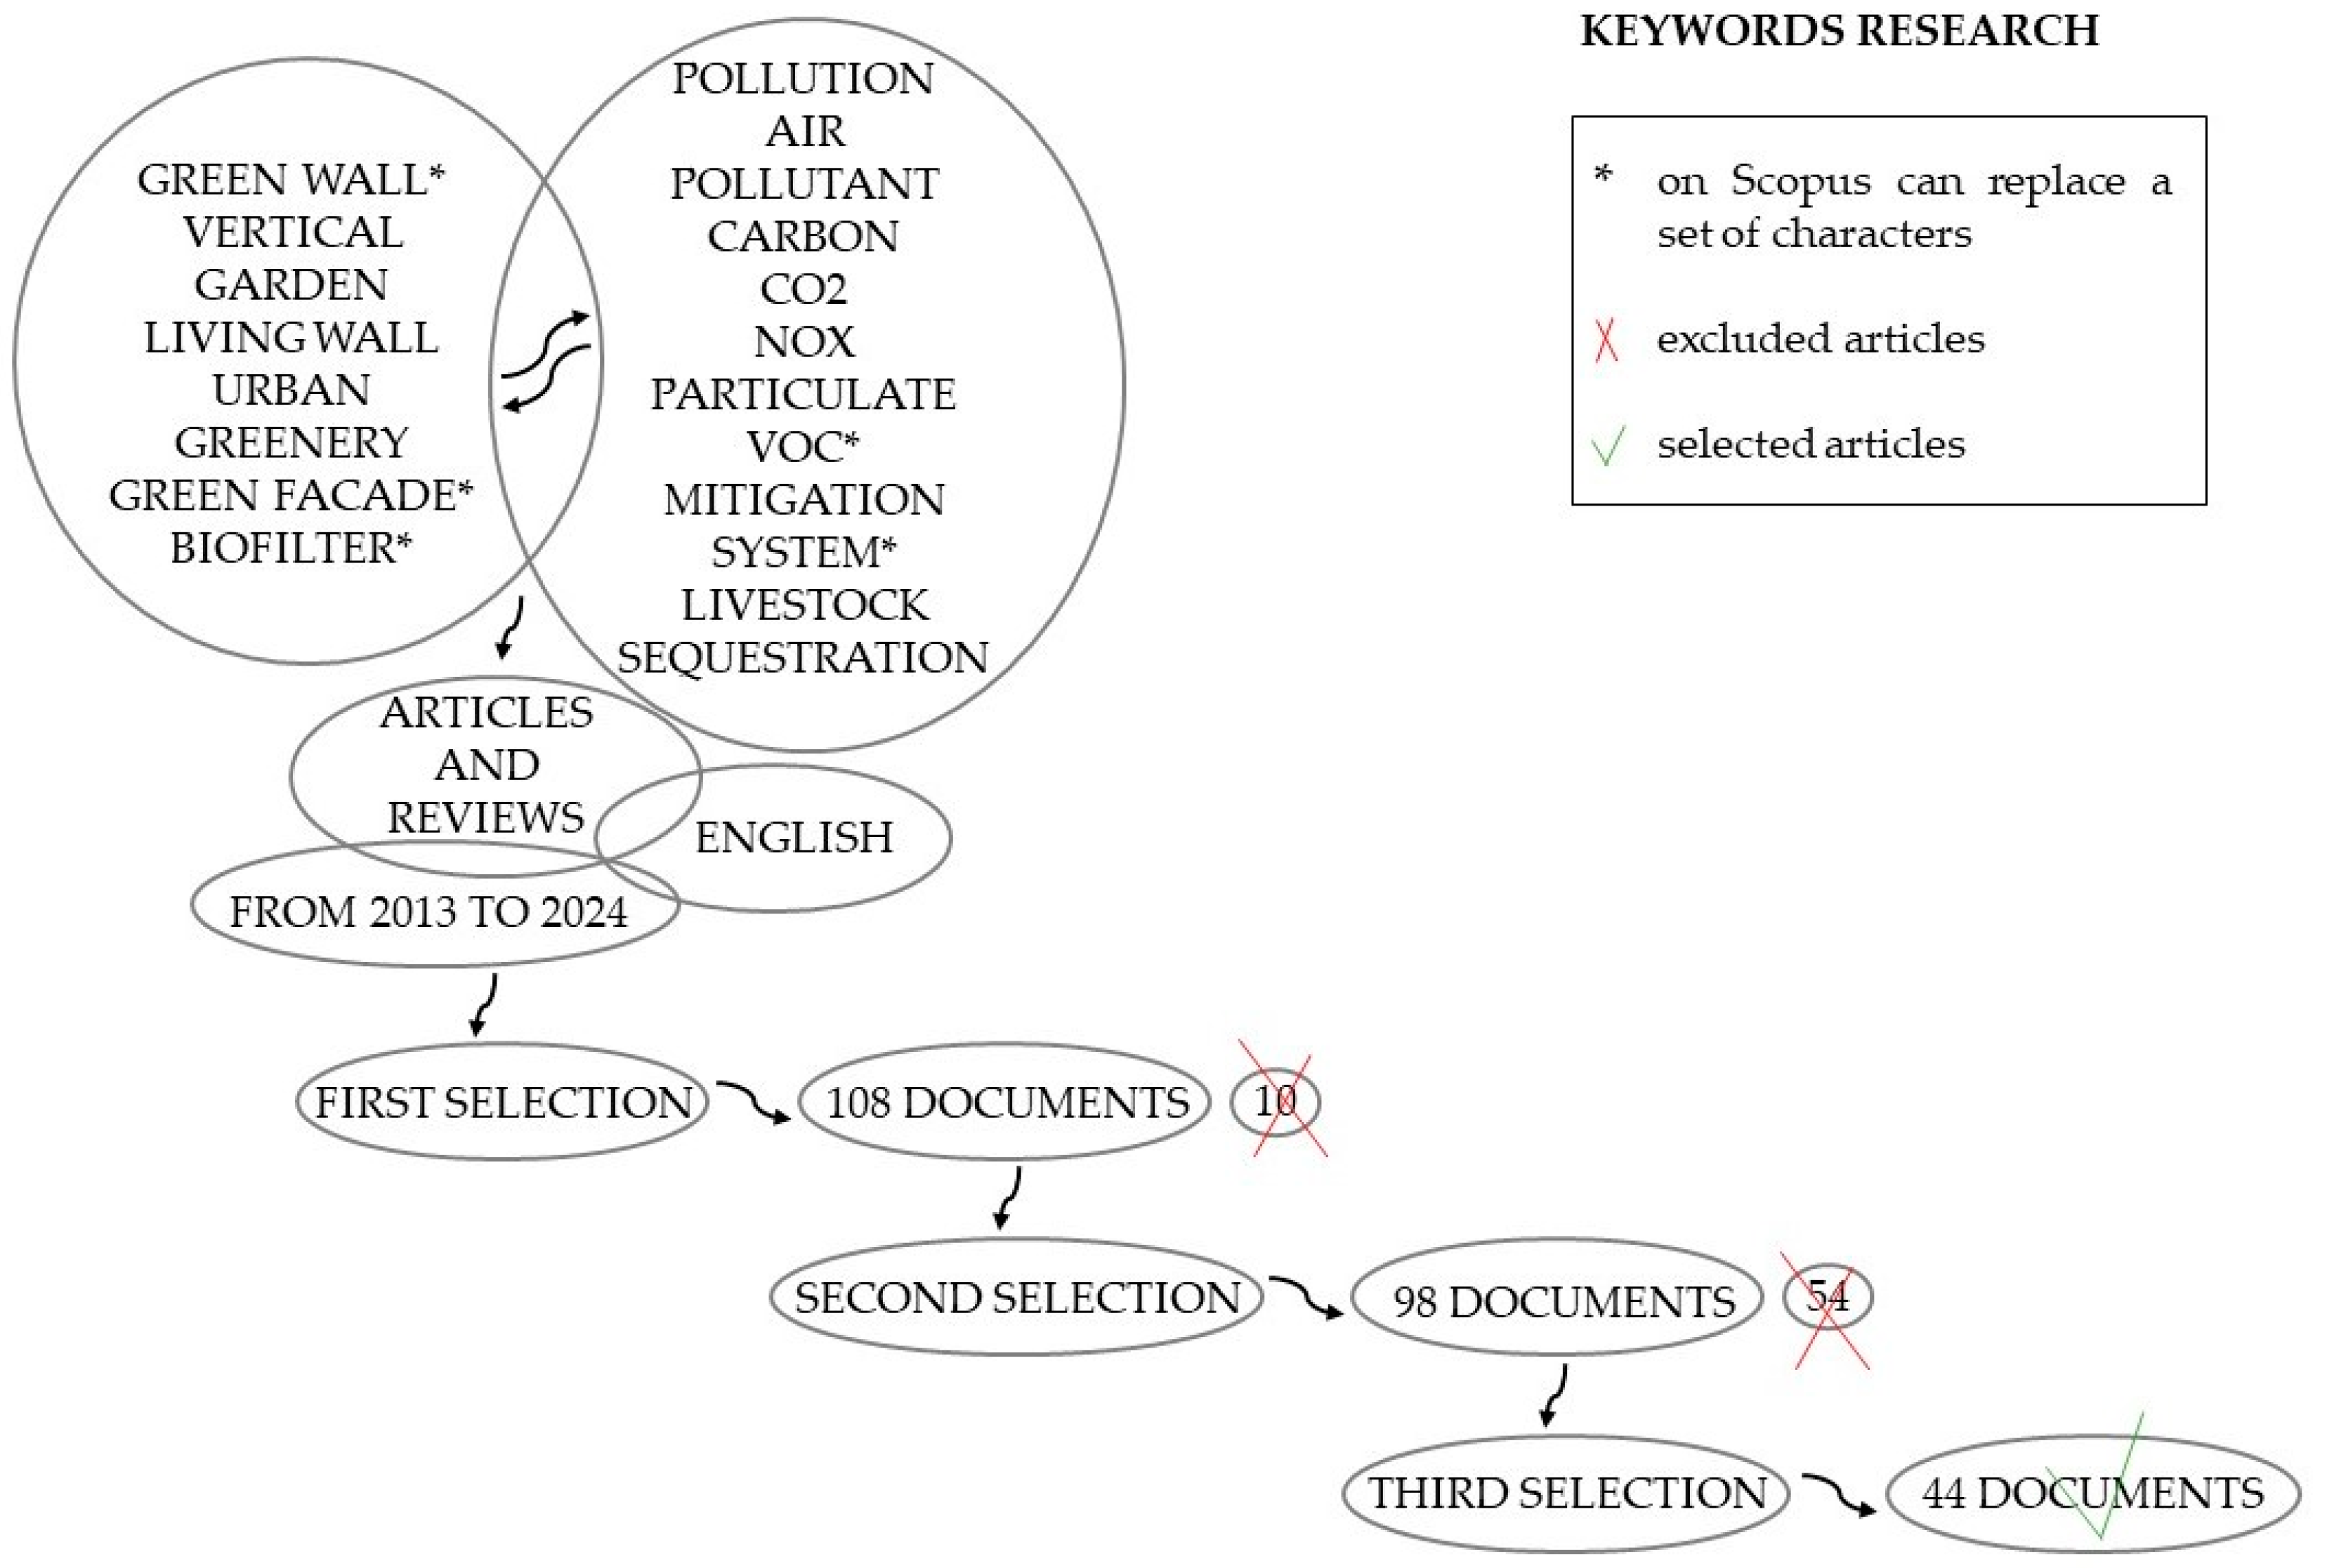
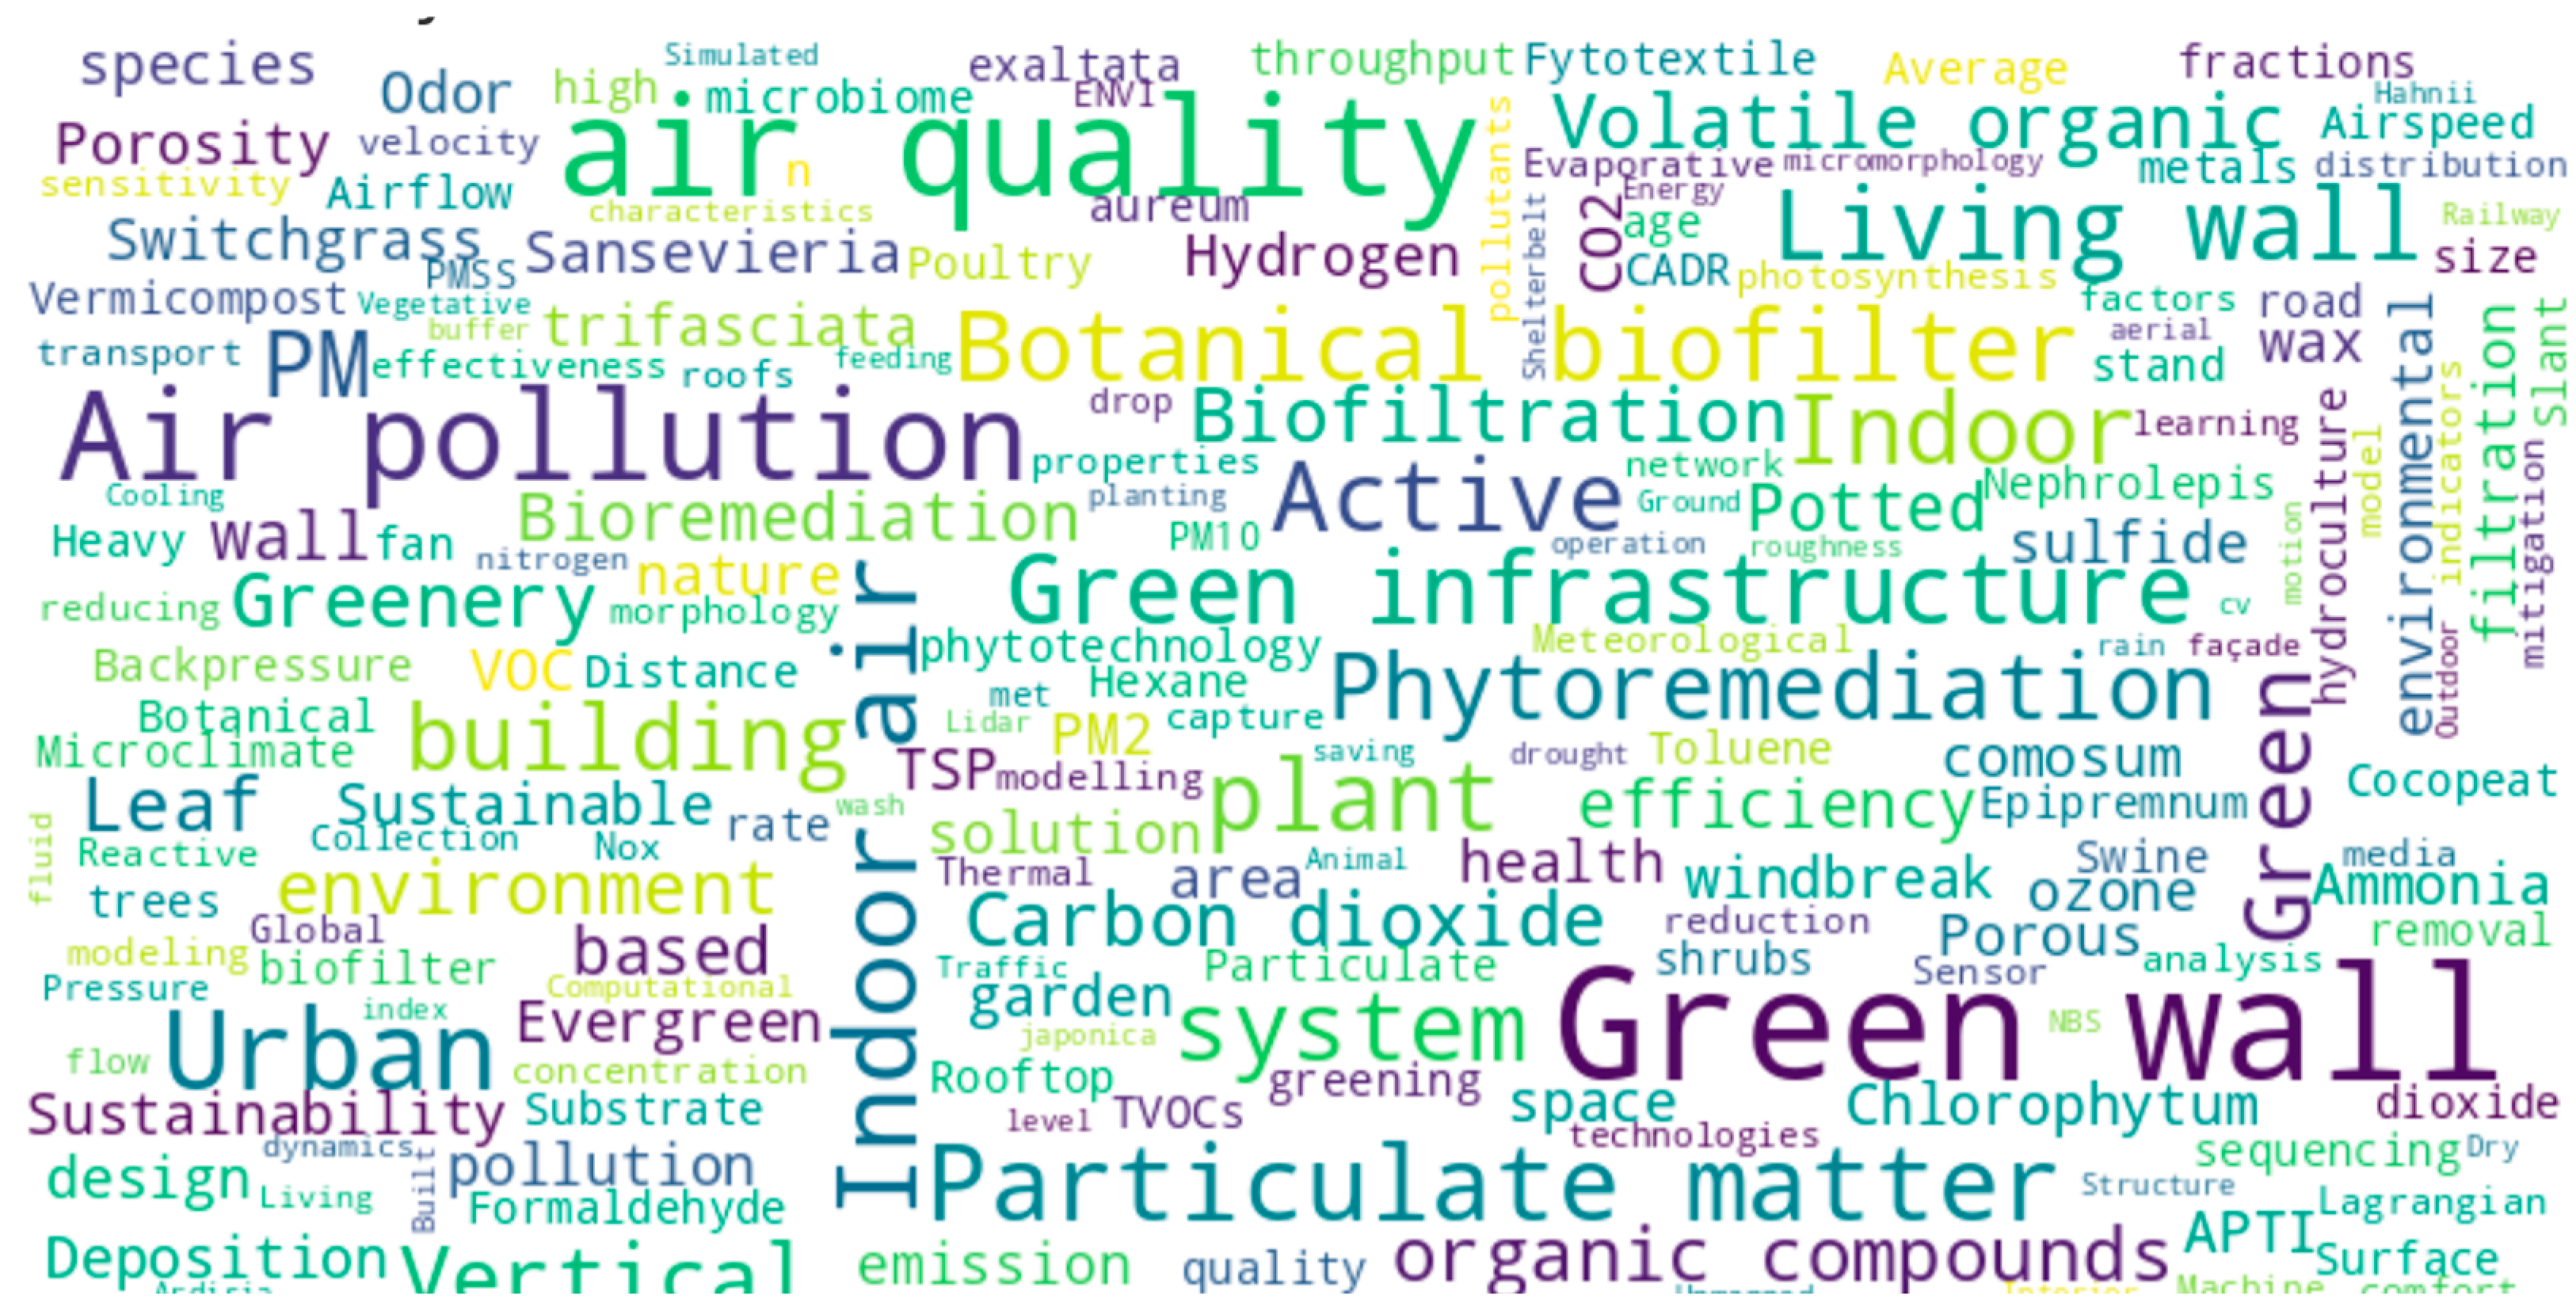

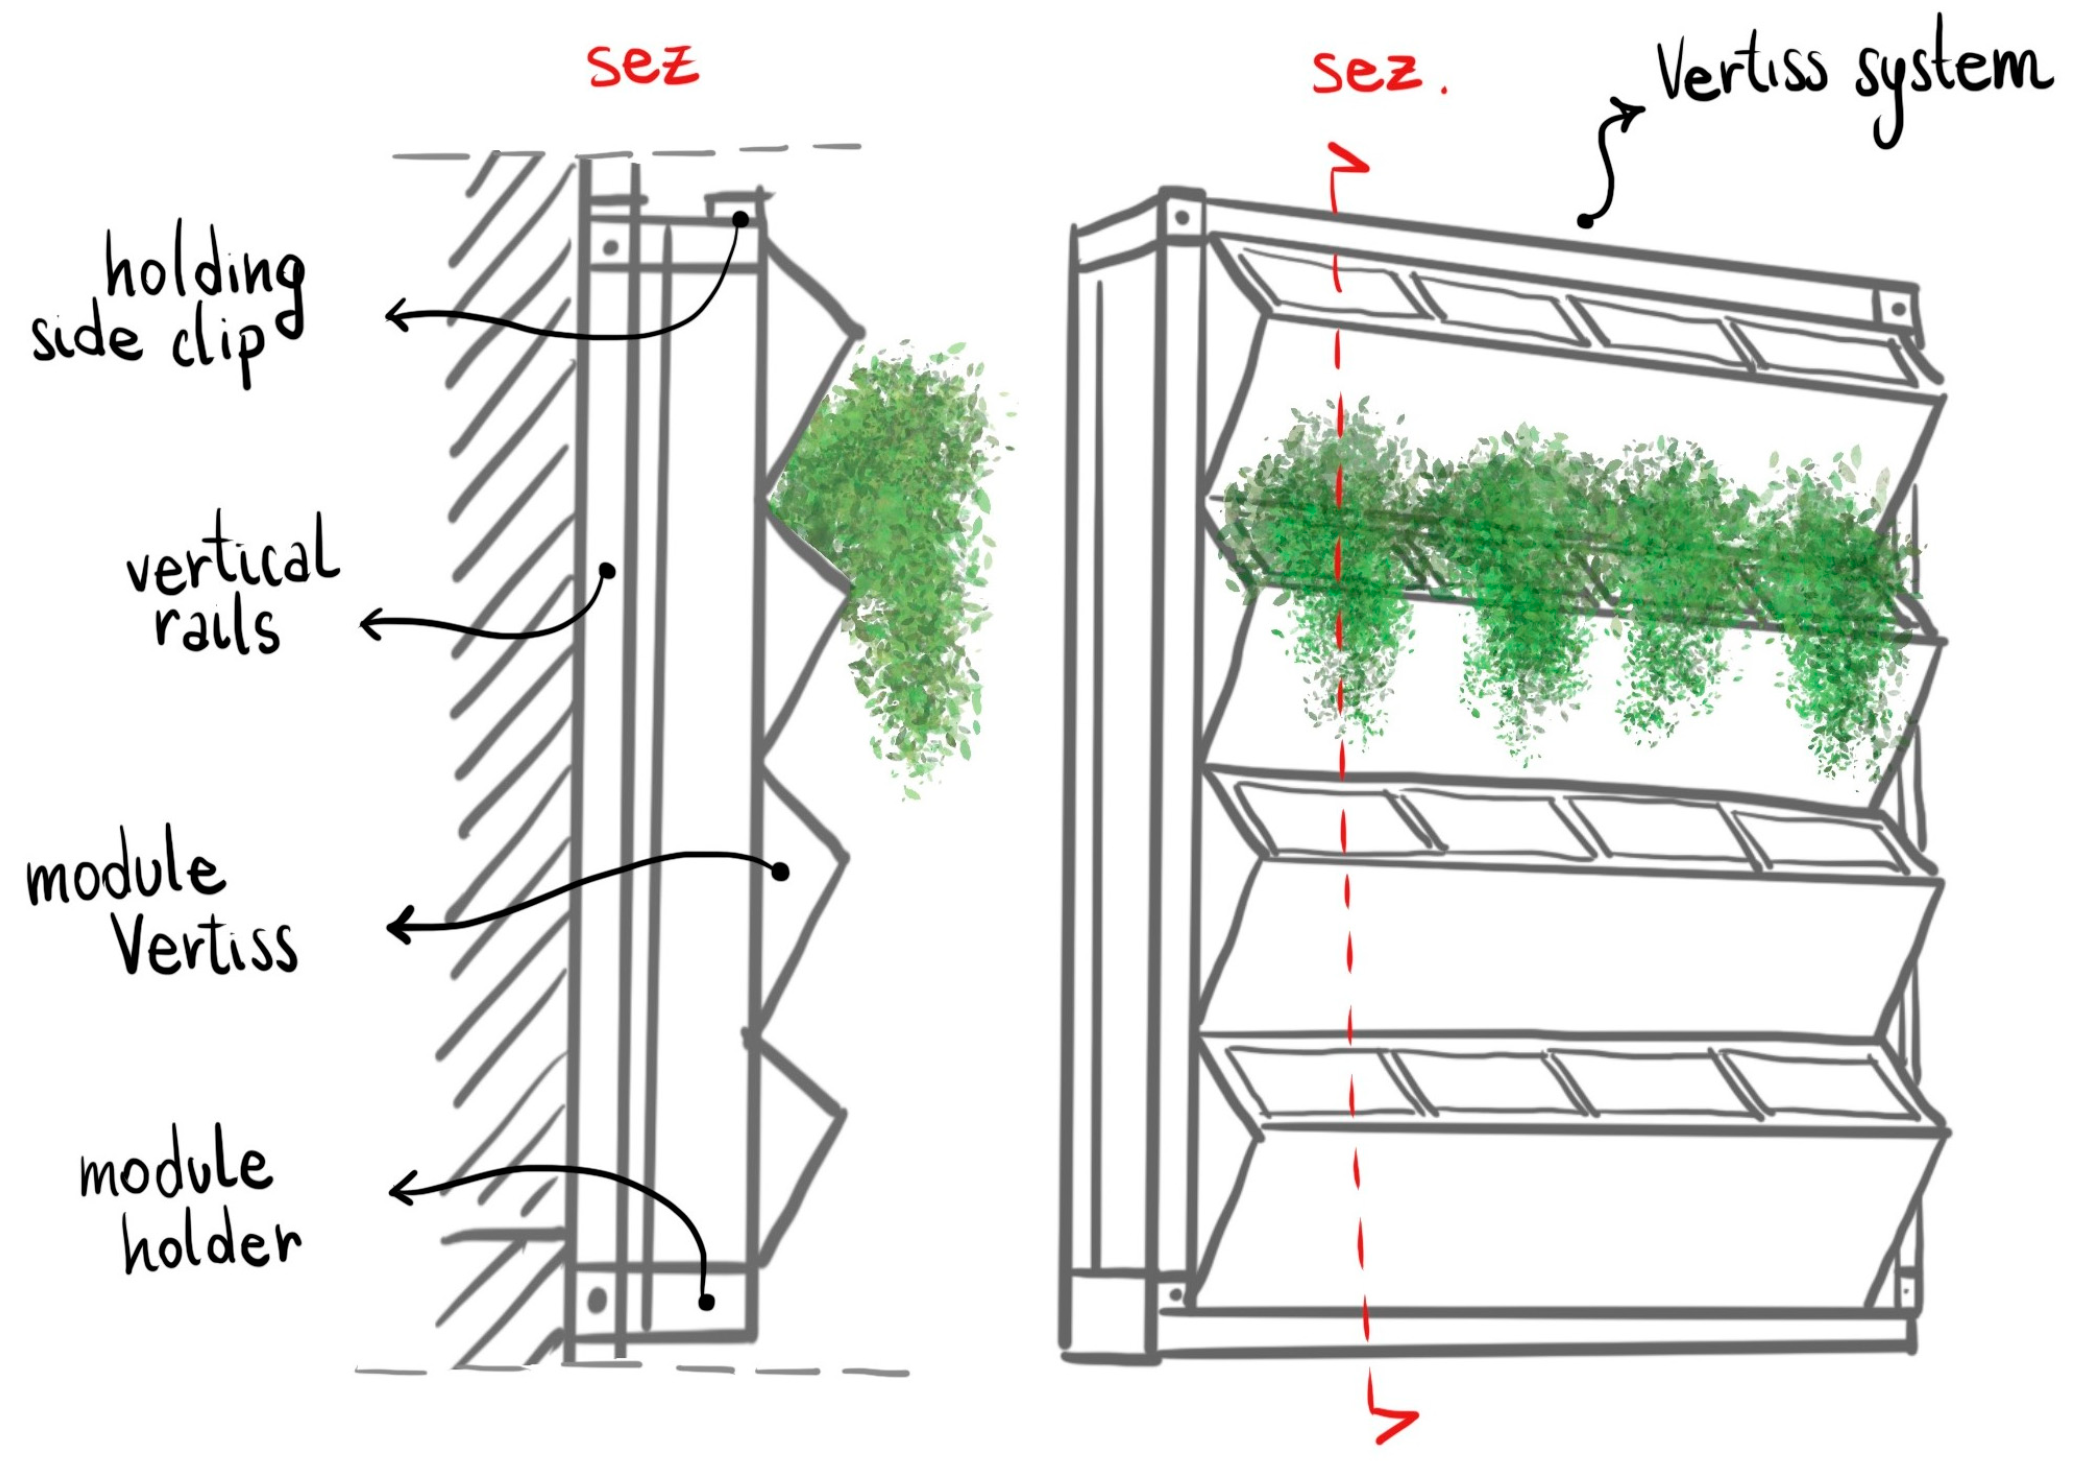


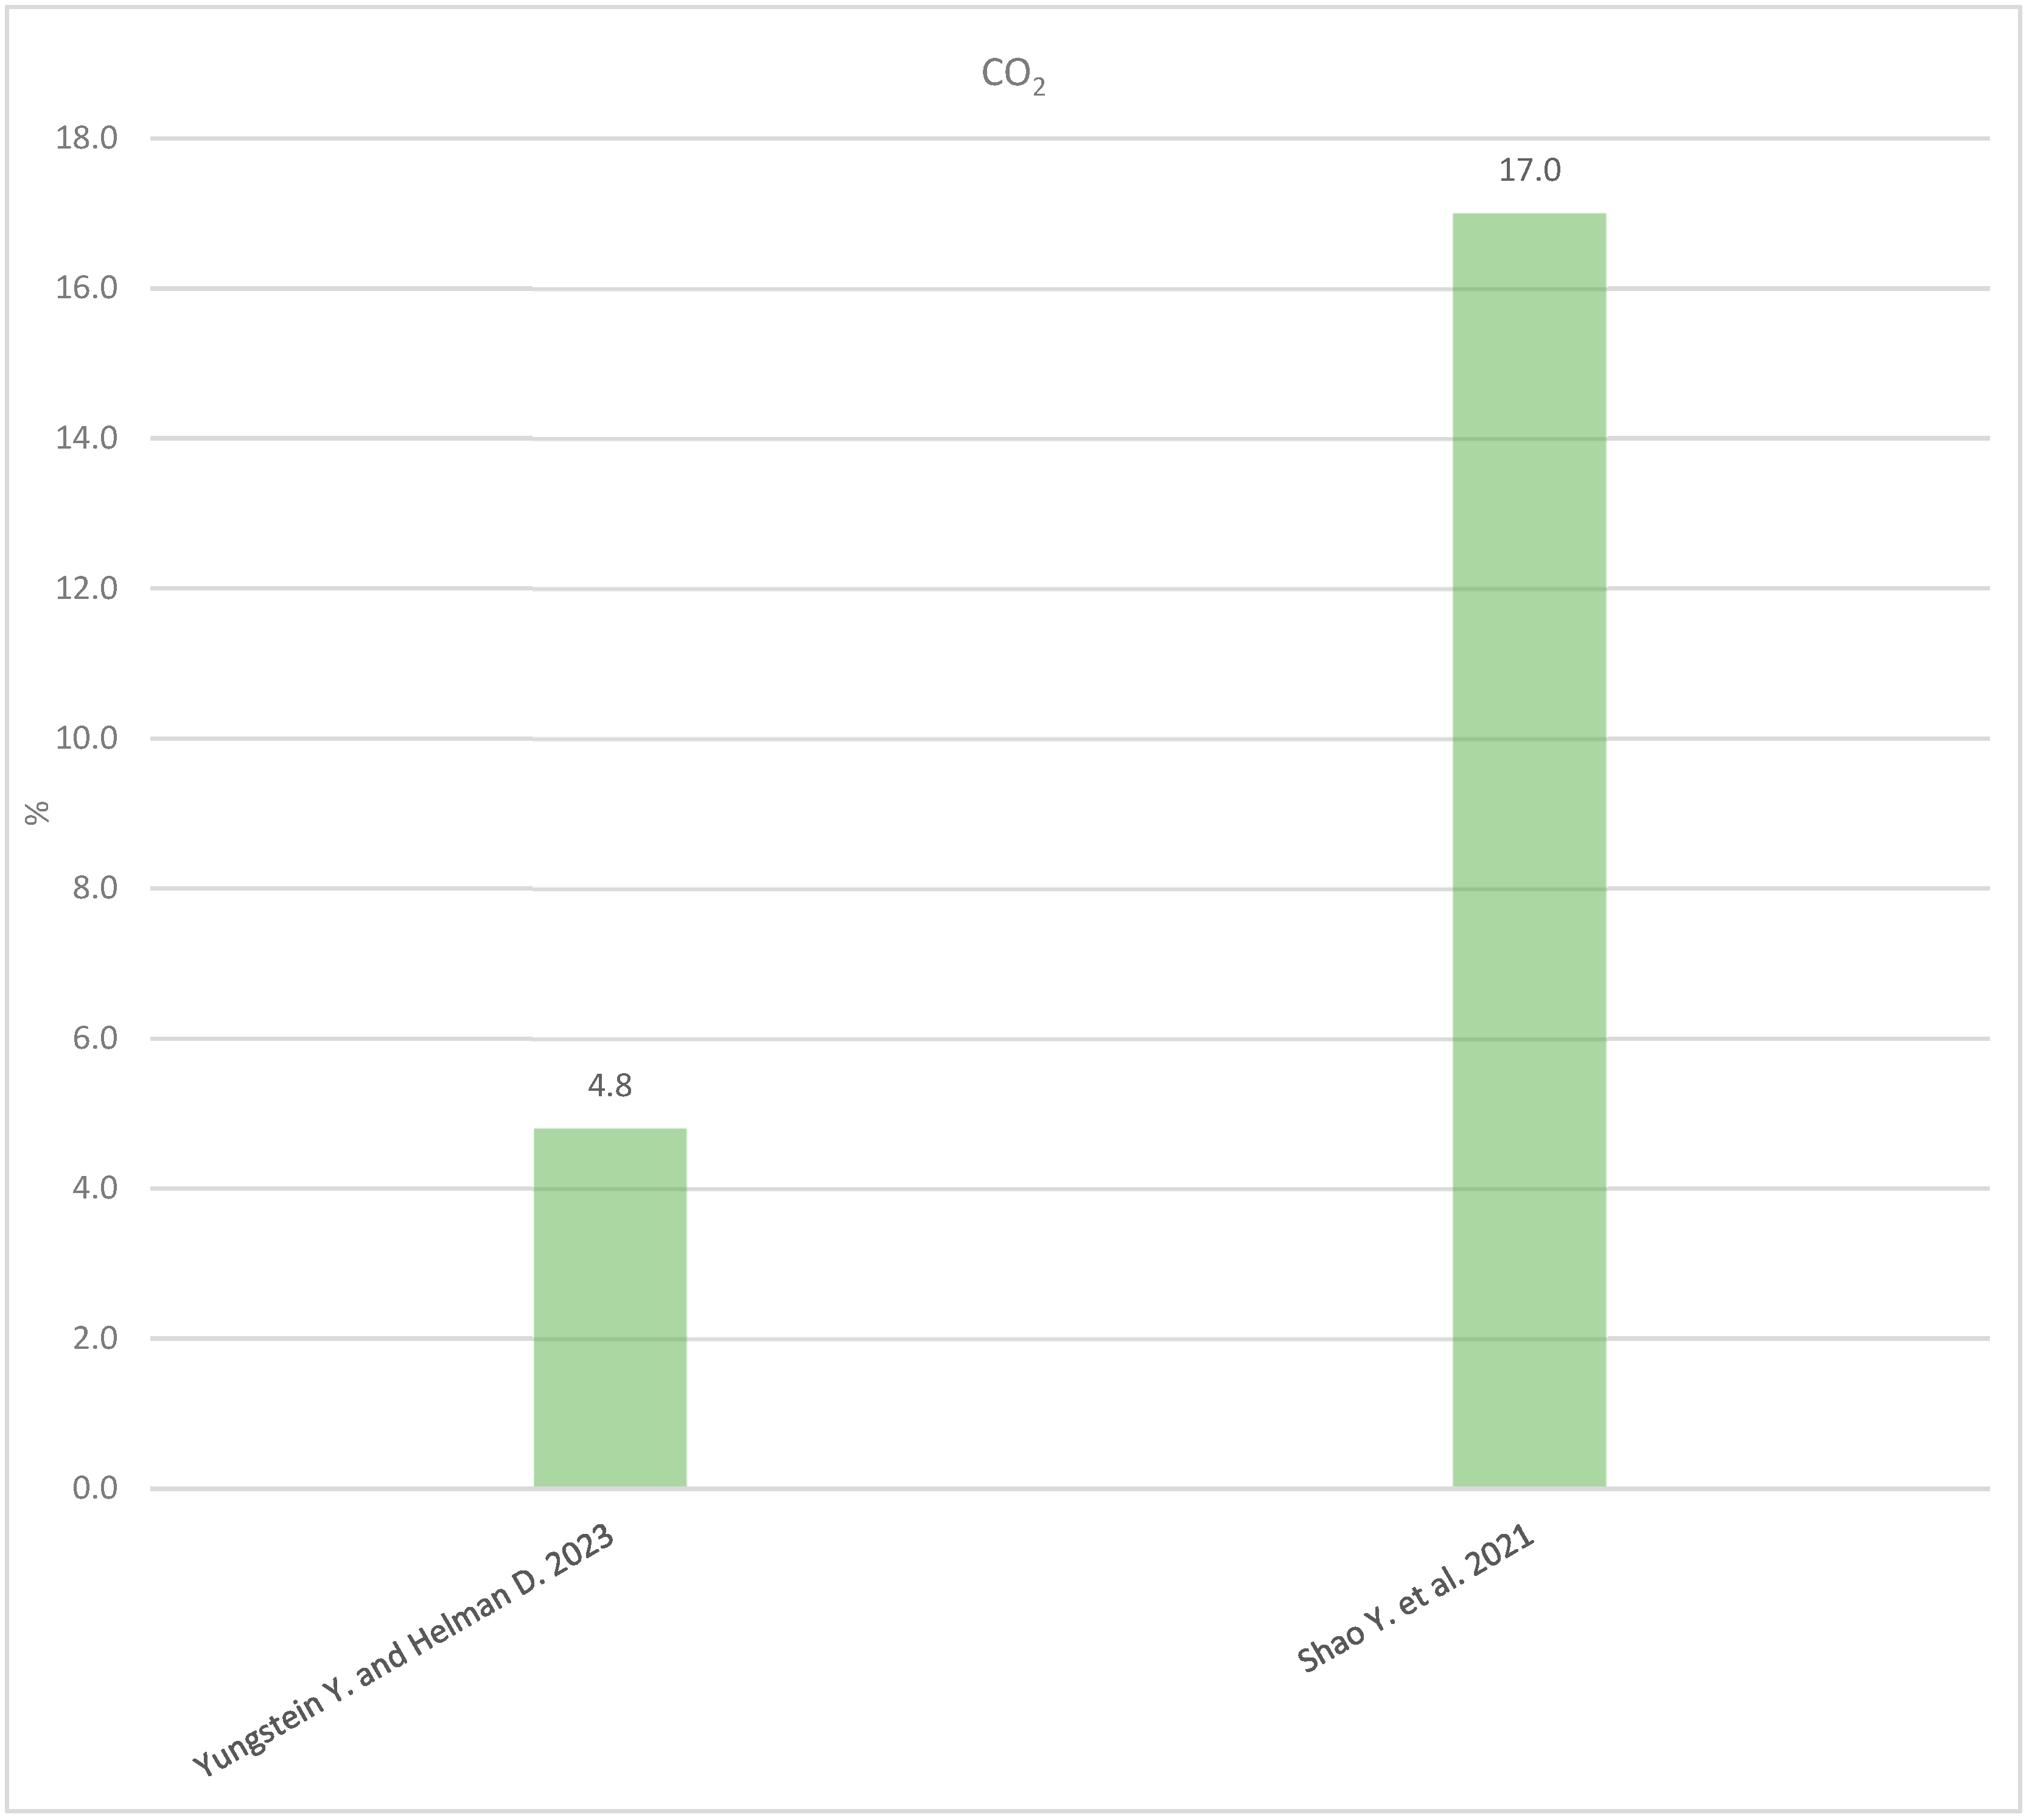
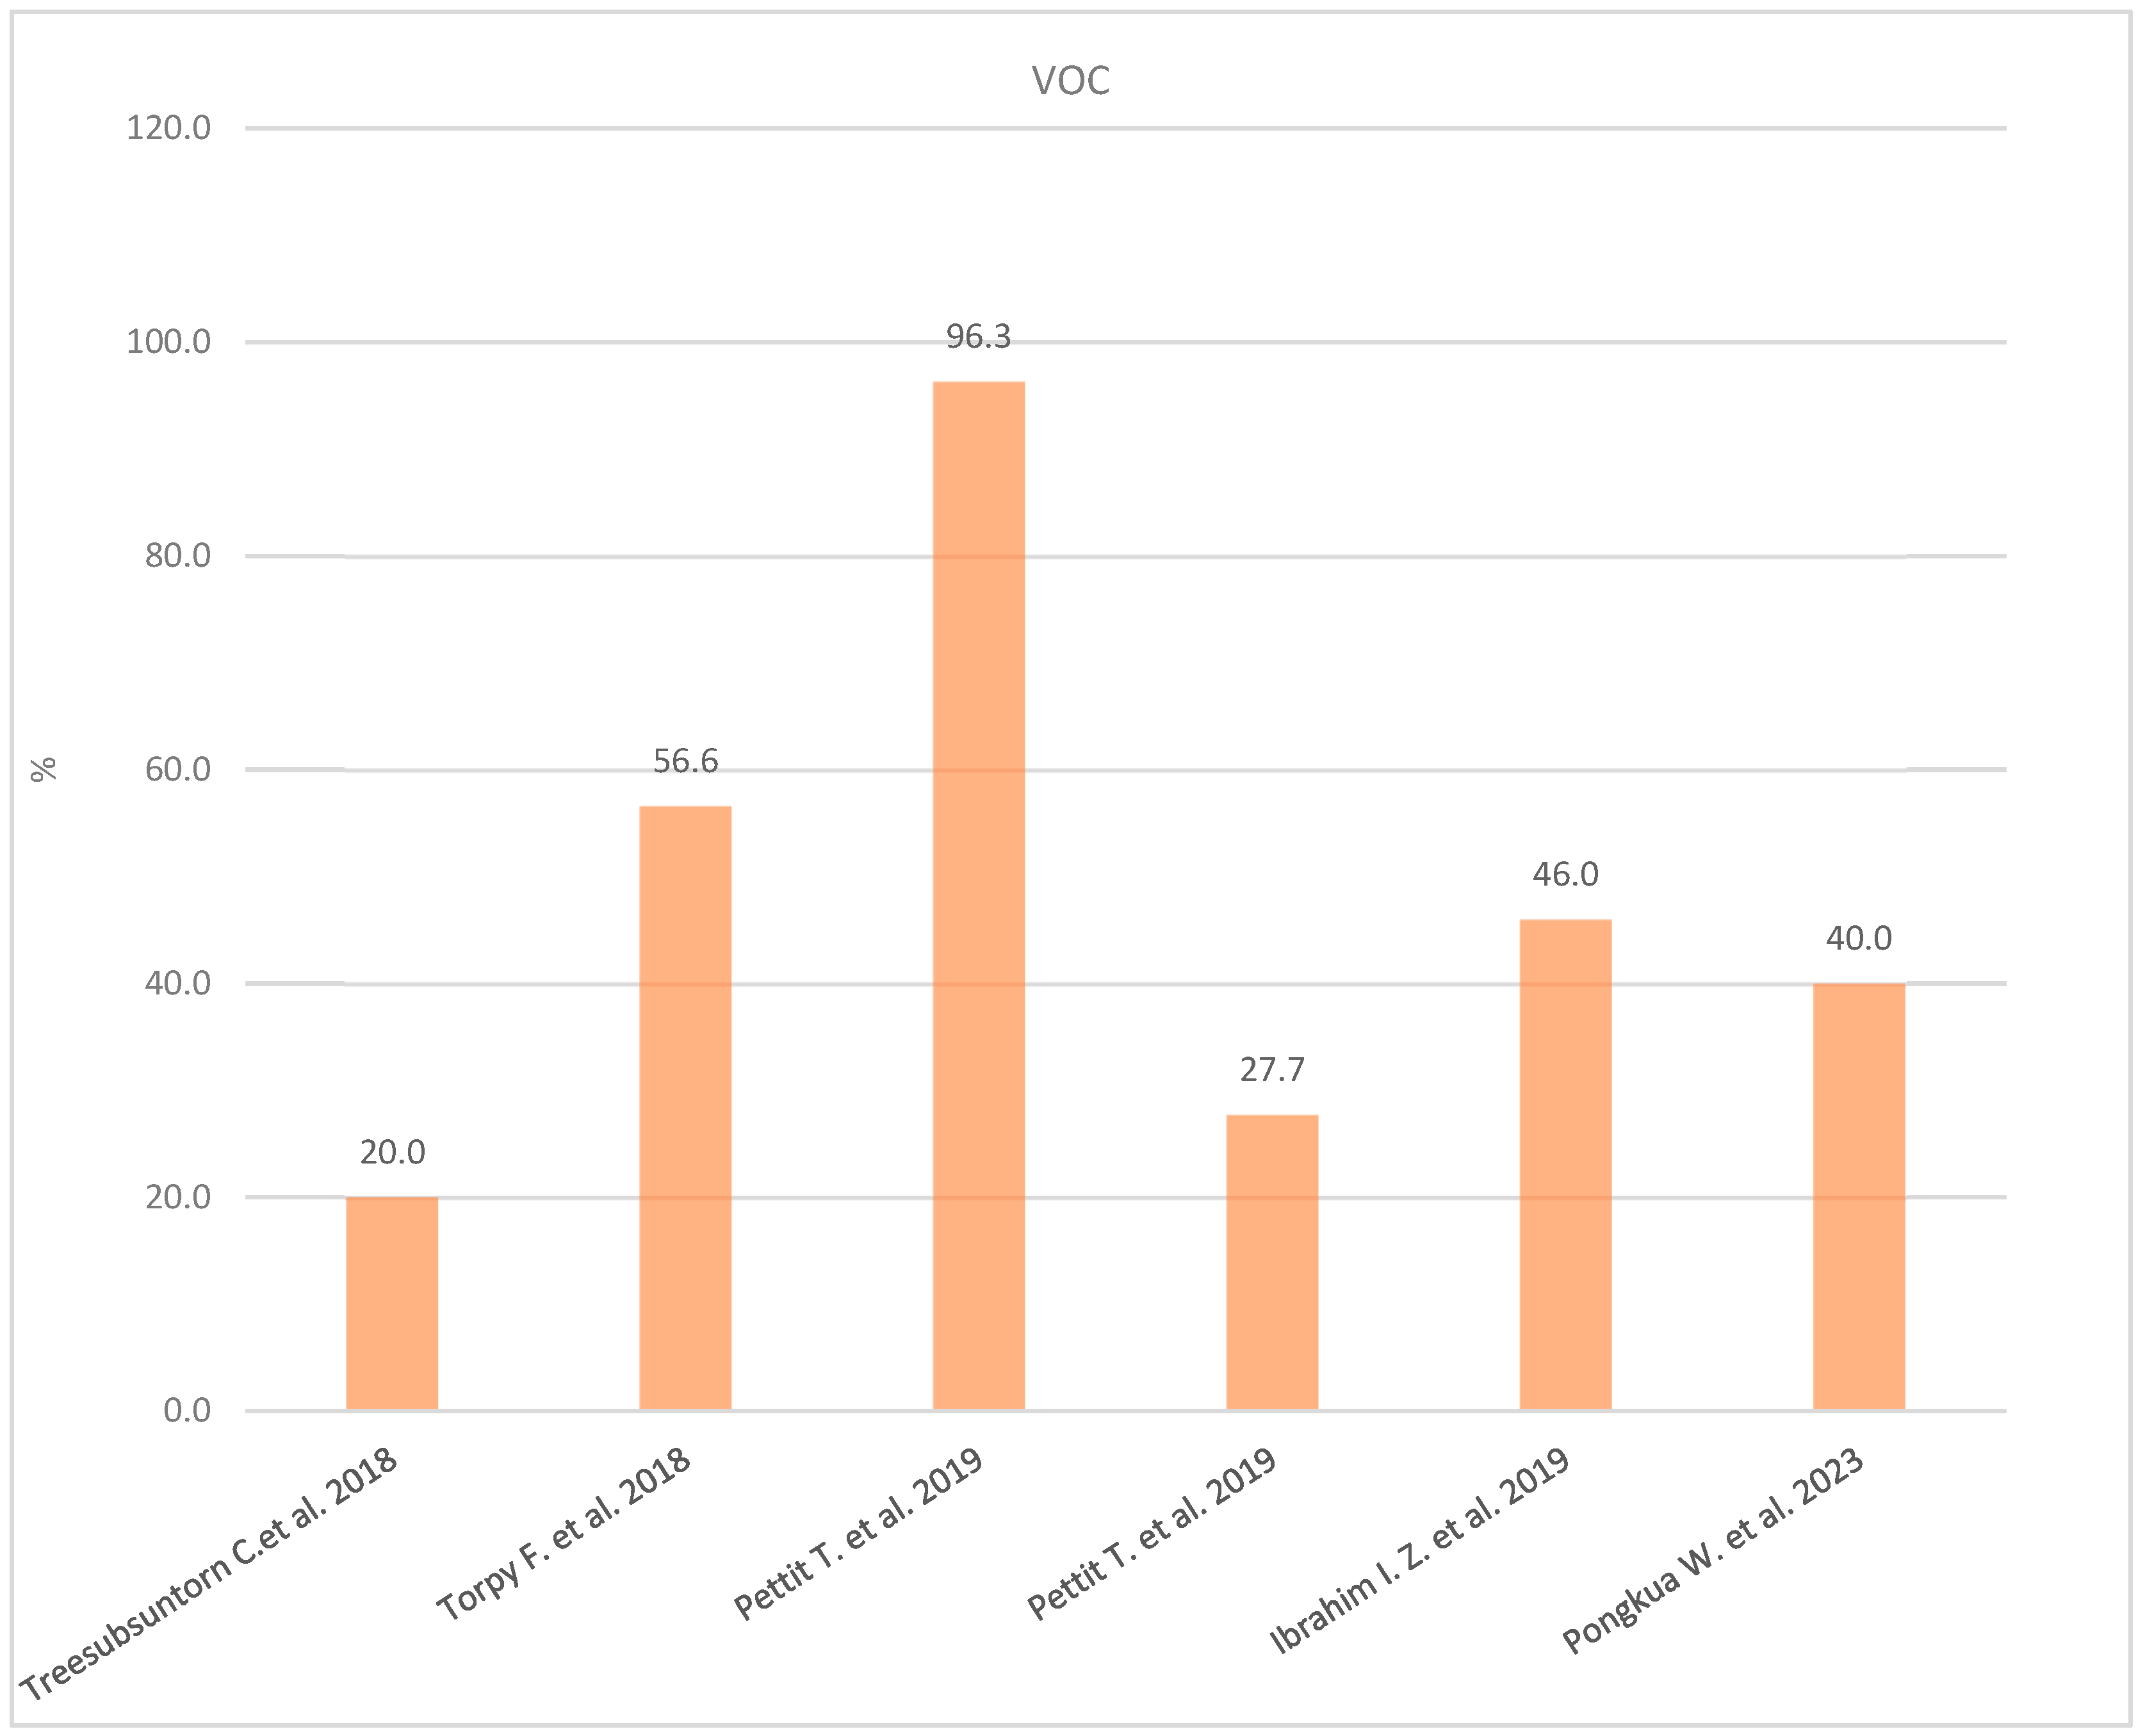
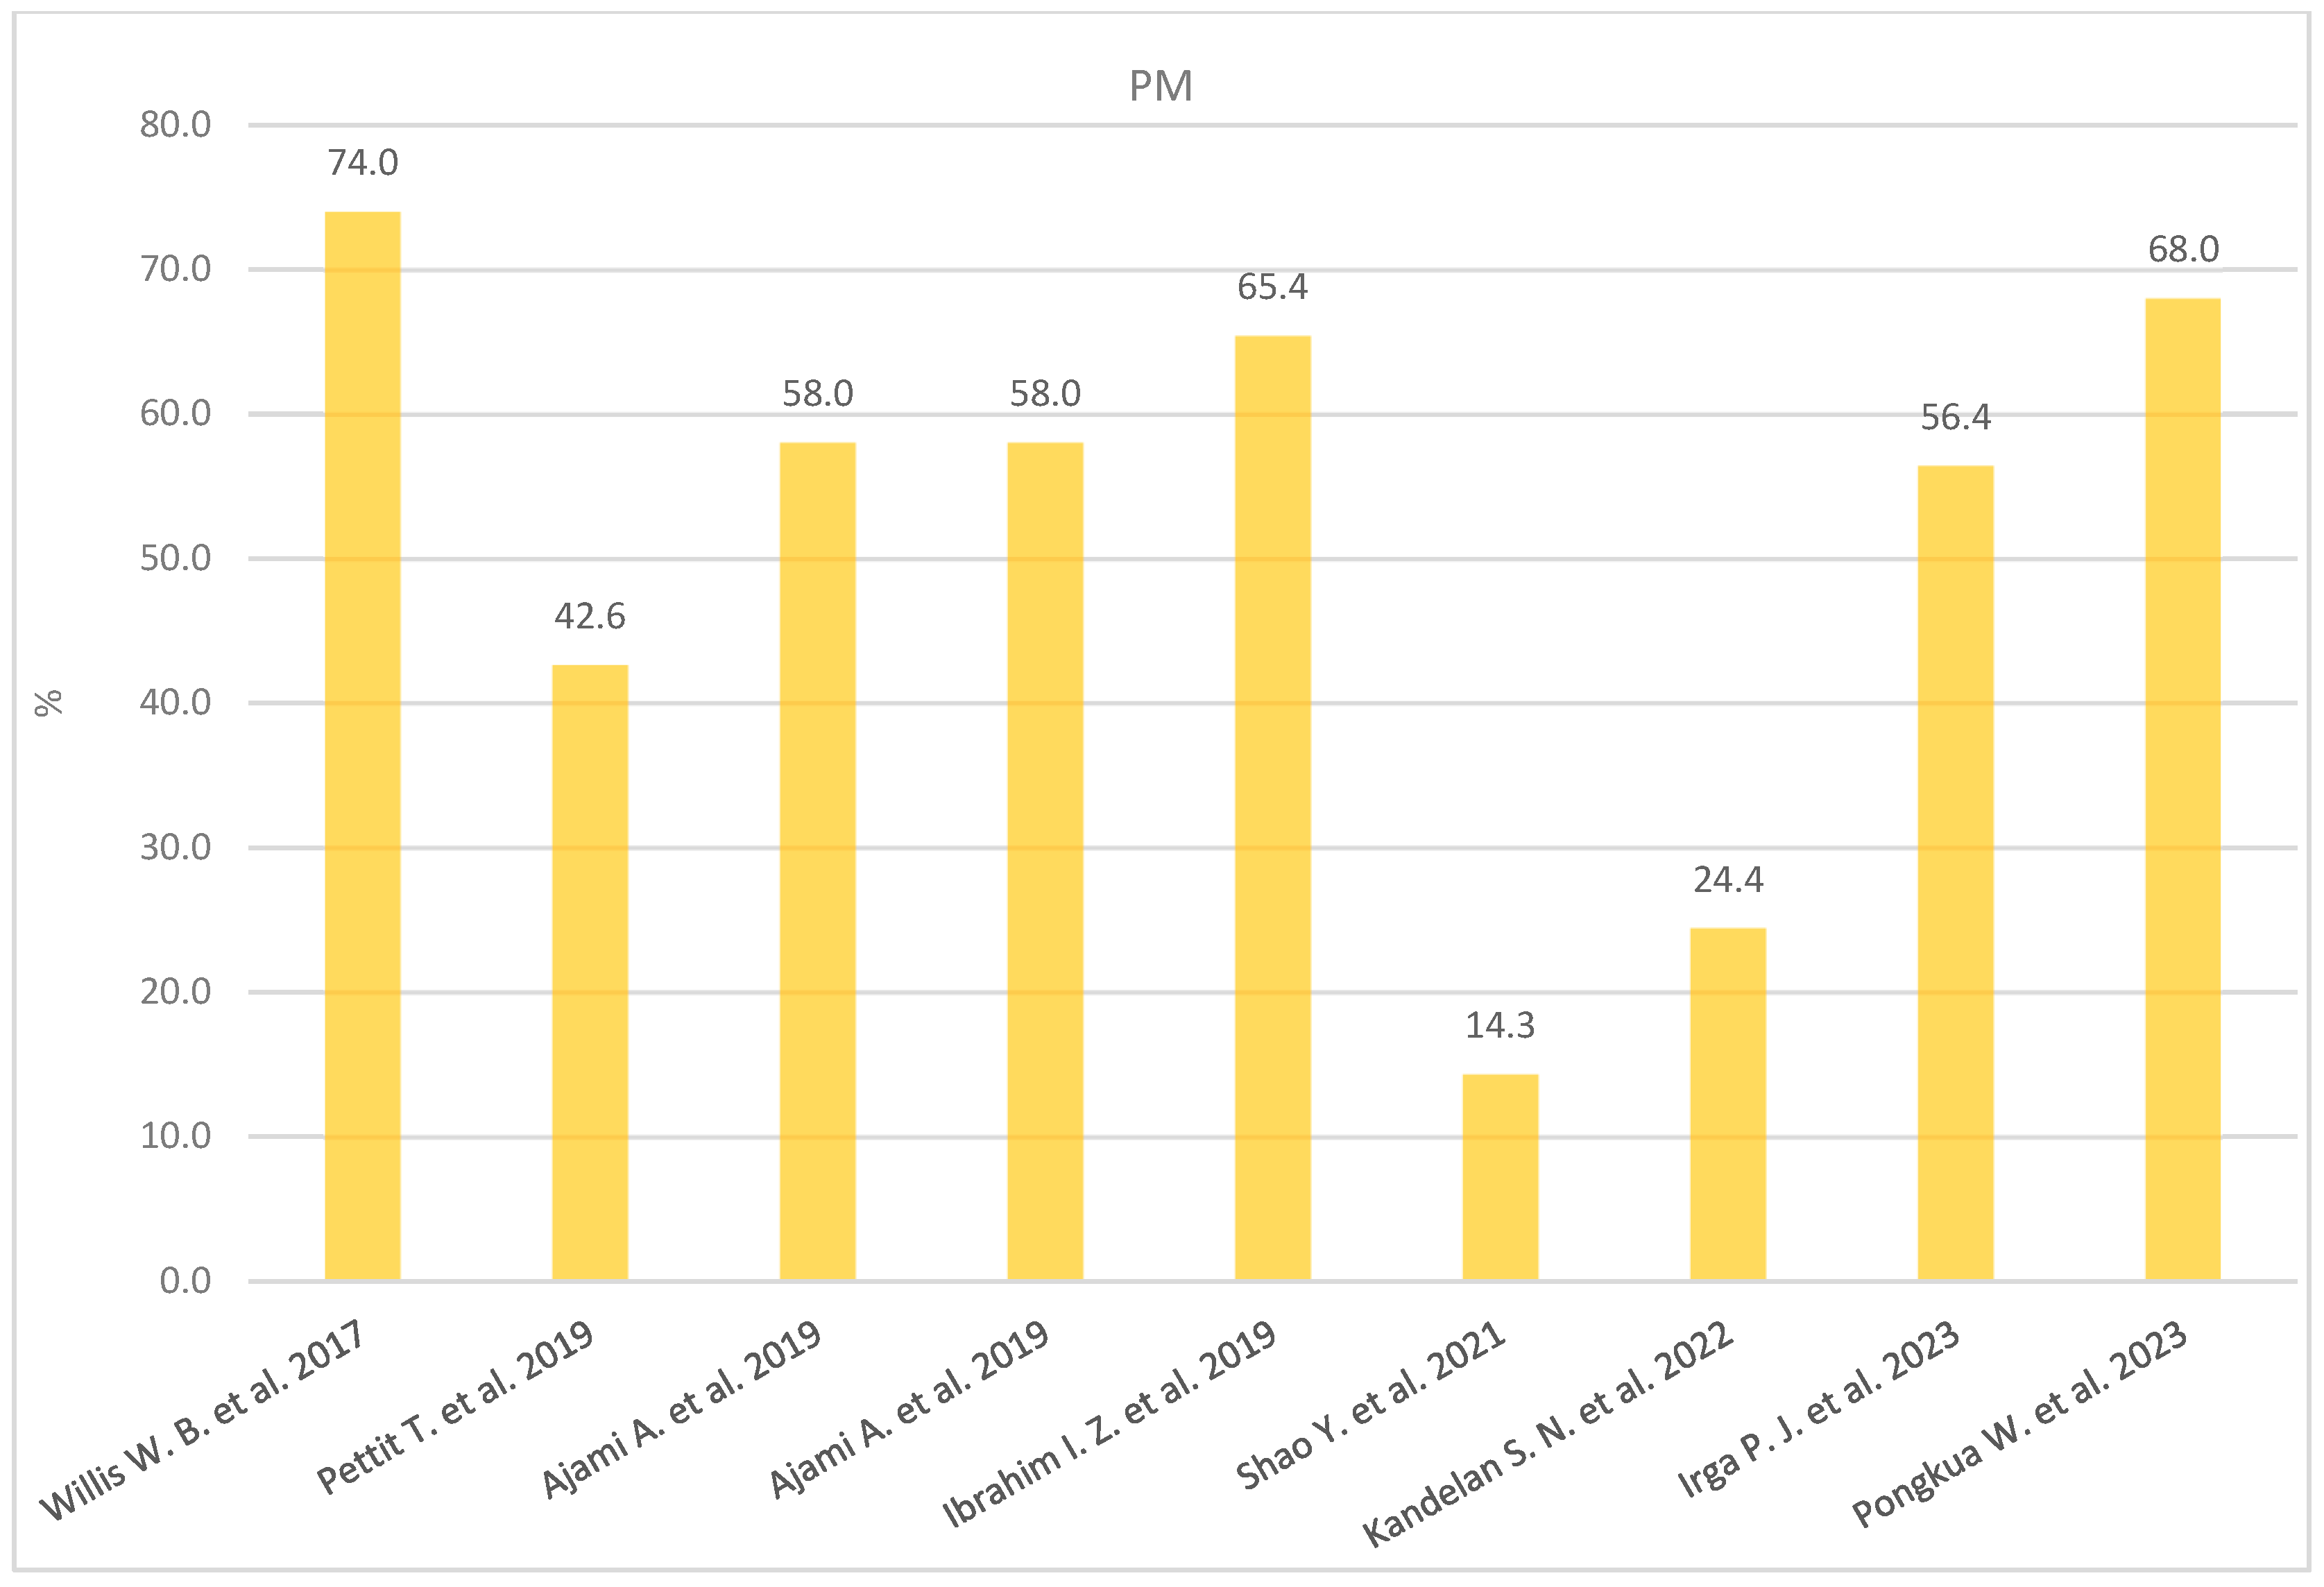
Disclaimer/Publisher’s Note: The statements, opinions and data contained in all publications are solely those of the individual author(s) and contributor(s) and not of MDPI and/or the editor(s). MDPI and/or the editor(s) disclaim responsibility for any injury to people or property resulting from any ideas, methods, instructions or products referred to in the content. |
© 2024 by the authors. Licensee MDPI, Basel, Switzerland. This article is an open access article distributed under the terms and conditions of the Creative Commons Attribution (CC BY) license (https://creativecommons.org/licenses/by/4.0/).