Article

A Consensus-Based Likert–LMBP Model for Evaluating the Earthquake Resistance of Existing Buildings

Department of Civil Engineering, Zonguldak Bulent Ecevit University, 67100 Zonguldak, Turkey
*
Author to whom correspondence should be addressed.
Appl. Sci. 2024, 14(15), 6492; https://doi.org/10.3390/app14156492
Submission received: 5 June 2024 / Revised: 19 July 2024 / Accepted: 23 July 2024 / Published: 25 July 2024
(This article belongs to the Special Issue Structural Seismic Design and Evaluation)

Abstract

:
Almost every year, earthquakes threaten many lives, so not only do developing countries suffer negative effects from earthquakes on their economies but also developed ones that lose significant economic resources, suffer massive fatalities, and have to suspend businesses and occupancy. Existing buildings in earthquake-prone areas need structural safety assessments or seismic vulnerability assessments. It is crucial to assess earthquake damage before an earthquake to prevent further losses, and to assess building damage after an earthquake to aid emergency responders. Many models do not take into account the surveyor’s subjectivity, which causes observational vagueness and uncertainty. Additionally, a lack of experience or knowledge, engineering errors, and inconspicuous parameters could affect the assessment. Thus, a consensus-based Likert–LMBP (the Levenberg–Marquardt backpropagation algorithm) model was developed to rapidly assess the seismic performance of buildings based on post-earthquake visual images in the devastating Kahramanmaraş earthquake, which occurred on 6 February 2023 and had magnitudes of 7.7 and 7.6 and severely affected 11 districts in Türkiye. Vulnerability variables for buildings are assessed using linguistic variables on a five-point Likert scale based on expert consensus values derived from post-earthquake visual images. The building vulnerability parameters required for the proposed model are determined as the top hill–slope effect, weak story effect, soft story effect, short column effect, plan irregularity, pounding effect, heavy overhang effect, number of stories, construction year, structural system state, and apparent building quality. Structural analyses categorized buildings as no damage, slight damage, moderate damage, or severe damage/collapse. Training the model resulted in quite good performance (mse = 7.26306 × 10⁻⁵). Based on the statistical analysis of the entire data set, the mean and the standard deviation of the errors were 0.00068 and 0.00852, respectively.

1. Introduction

Many lives are threatened every year by earthquakes. It is not only developing countries that suffer from the negative effects of earthquakes on the economy [1] but also developed ones that experience significant economic losses, massive fatalities, and the suspension of occupancy as well as businesses every year [2]. A structural safety assessment or conducting a seismic vulnerability evaluation of existing buildings is crucial, since some structures may be susceptible to potential risks [3] in earthquake-prone areas, including some of them which might have been constructed before seismic codes were developed, which may mean they were not designed to resist earthquakes and therefore may not be strong enough to withstand them, and the condition of a building may also have declined as a result of a change in use or land with high liquefaction potential, or as a result of wear and tear over time [1]. Moreover, city planning and construction quality are problematic in developing countries due to insufficient expertise, imprecise legislation, insufficient funds, and unplanned urbanization, which results in low-quality materials and work causing earthquake deaths [4]. Estimating seismic damage before an earthquake is crucial to reducing future losses [5], and assessing building damage after an earthquake is an essential part of emergency response and recovery efforts as well. The level of building damage can range from superficial cracks to complete collapse depending on the building’s properties, soil conditions, and earthquake and ground motion characteristics [6]. Based on the results of a seismic evaluation, a decision will be made as to whether the building needs to be repaired or renovated to increase its resistance to seismic forces, or if it should be demolished [7]. In recent years, alternative methods have been developed to rapidly identify deficient structures from large building stocks [8] and various rapid visual screening (RVS) techniques have been developed by different countries to deal with the devastating effects of earthquakes on buildings and humans [9]. RVS techniques all have their specific characteristics, but basic structural characteristics like irregularities are taken into consideration; however, the final scores of building vulnerability classifications differ significantly due to differences in conventional RVS techniques [10]. Bektaş and Kegyes-Brassai argue that RVS assessments can be used to evaluate the vulnerability of buildings in different regions, with appropriate adaptations [3]. It is therefore possible to calibrate existing RVS methods or to develop new RVS methods to overcome the deficiencies [3]. There are some limitations to traditional RVS methods, including surveyor bias, site-specific characteristics, and the uncertainty and vagueness of the data. Several computer algorithms can be used to overcome these kinds of disadvantages in evaluation, such as fuzzy logic, neural networks, and machine learning. It is generally agreed that further research is needed to implement or modify the method, according to Aldemir et al. [11] and Harith et al. [12], and that the methodology needs to be developed based on pre- or post-earthquake data, detailed seismic risk assessment methodologies, and/or soft RVS methods. With continuous innovation and refinement of the methodologies, the quality of the results is greatly improved [13]. Türkiye is located in an active earthquake zone that can cause very severe earthquakes. Türkiye experiences a severe earthquake every two years, while a very severe earthquake happens every three years, according to a statistical study [14]. Moreover, Mertol et al. came to the conclusion that almost all of Kahramanmaraş, Turkey’s seriously damaged or fallen reinforced concrete structures were built between 1975 and 2000, when site inspections were rare or nonexistent, and the buildings were not designed and constructed according to the seismic codes that were in effect at the time [15]. There were several reasons for building failures and severe damage, including poor material quality, inadequate reinforcement, and framing problems related to their lateral load-carrying systems, deficiencies in construction materials and reinforcement configuration [14], inadequate development length, violations of bending stirrup ends at 135 degrees, violations of confinement zones, violations of the strong beam–stronger column analogy, and issues with building inspections [15]. Many models have no consideration for the surveyor’s subjectivity, which causes observational vagueness and uncertainty [16]. It is also possible that the assessment would be affected by a lack of sufficient experience or knowledge, as well as many other factors, engineering errors, and inconspicuous parameters [17]. Therefore, a novel consensus-based Likert–LMBP model has been developed using post-earthquake visual data of 194 buildings in the Kahramanmaraş earthquake region for rapidly assessing the seismic performance of buildings before an earthquake. Building vulnerability variables are measured utilizing a five-point Likert scale with consensus values derived from linguistic data based on visual images from expert construction engineers. After structural analyses, each building is classified as no damage, slight damage, moderate damage, or severe damage/collapse. Similarly to studies published in the literature, this model was designed for reinforced concrete buildings of 1–7 stories; thus, it cannot be used for RC buildings higher than 7 stories.
Research gaps will be filled in the following ways:
  • Seismic vulnerability can be assessed quickly before an earthquake occurs.
  • Pre-earthquake visual images can be used to assess existing buildings.
  • Experts use linguistic variables in their assessments.
  • Consensus values combine differing opinions from experts.
  • LMBP provides a high-performance solution to the proposed model.

2. Related Studies

Various seismic risk assessment approaches may be used to evaluate the structural integrity of existing structures [18], but they require complex analysis tools, detailed geometric and material data, as well as considerable time and expertise [4,8]. It is not feasible to use these detailed procedures to assess a large number of buildings at once due to a lack of time, resources, and manpower [4]. RVS is used to identify buildings most vulnerable to earthquake-induced damage by classifying them according to the seismic risk level and prioritizing them accordingly [19]. RVS procedures are divided into three main categories: national methods, statistics and machine learning methods, and rule-based methods [20]. These methods have been used in many studies. The following is a summary of a few studies. Various performance modifiers in the national methods including FEMA P-154, the EMS-98 scale, the RISK-UE Project, NRCC, RBTE-2019, etc., are used to quantify the vulnerability of buildings, such as building type, vertical irregularities, plan irregularities, construction quality, and year of construction [20]. The performance modifiers can be collected easily through observations and engineering drawings [21]. A statistical regression method was employed by Chanu and Nanda to analyze the relationship between the outcome variable (the damage grade of existing buildings) and the explanatory variables regarding building attributes that increase the vulnerability of buildings to earthquakes. For calculating the seismic performance scores of buildings, Ansal et al. proposed a general linear equation, and the weights of each vulnerability parameter were determined statistically [22]. In addition, predictor variables and damage grades were modeled as linear relationships [22]. The use of soft computing techniques in seismic assessments of existing buildings reduces human effort dramatically and improves accuracy [20]. In recent years, several soft rapid visual screening (S-RVS) approaches have been created. These methods can be quickly modified based on breakthroughs and prior earthquake data, and they provide more accuracy compared to traditional RVS methods [18]. S-RVS methods utilize artificial intelligence (AI) such as machine learning (ML) [9,17,23], Fuzzy Logic (FL) [23,24,25,26,27], and Artificial Neural Networks (ANNs) [28,29,30,31] in their development process. In recent years, AI has received significant attention in post-earthquake inspections because of its rapid advancement and potential to overcome the disadvantages of manual inspections [31] and has been extensively used in various scientific and technical fields. Studies on the use of these methods in civil engineering have shown promising outcomes and decreased reliance on human involvement, hence minimizing uncertainty and bias [9]. A study published by Mangalathu et al. [6] examined the effectiveness of four ML algorithms in predicting earthquake damage to buildings, including discriminant analysis, K-nearest neighbors, decision trees, and random forests. In the study of Harirchian et al., a comprehensive overview of different AI techniques for analyzing existing buildings and evaluating damage is provided [17]. Ogunjinmi et al. developed a web-based application to classify earthquake damage that can automatically and effectively categorize structural damage [32]. By using gradient-weighted class activation mappings and the convolutional neural network (CNN) model, the degree of damage was assessed [31]. FL evaluates linguistic and information uncertainties and is more realistic when it comes to qualitative assessment than crisp logic [26]. Şen proposed a supervised FL classification approach for assigning hazard categories to buildings similar to the classical fuzzy C-means approach [25]. A fuzzy inference system was proposed by Irwansyah et al. to determine the building damage hazard category following earthquakes based on a fuzzy inference system. A two-stage model architecture was developed: the first involved collecting expert advice for knowledge acquisition and the second involved building fuzzy rules to evaluate buildings. A total of nine input parameters were used, including ring balk, floor block, column, foundation, wall cracks, wall cover and floor cover, Tombak Layar, digital elevation model, peak ground acceleration, and distance from the fault. There were three categories of building damage hazards: slight, moderate, or severe [32]. Harirchian and Lahmer developed an RVS methodology based on an interval type-2 FL system to prioritize vulnerable buildings for detailed assessment while covering uncertainties and minimizing their effects [33]. Building vulnerability could be estimated using the proposed Damage Index, which combines inputs such as the number of stories, the age of a building, irregularities in the plan, irregularities in the vertical plane, quality of the building, and peak ground velocity with a single output variable, and the applicability of the proposed method was examined using a database of reinforced concrete building damage after an earthquake. Building damage states were divided into “None”, “Low”, “Moderate”, “Severe”, and “Collapse” [34]. The study by Ketsap et al. [33] examined how fuzzy earthquake risk assessments could be used to prioritize retrofitting buildings. A building’s risk was assessed by evaluating several risk factors, including (1) building vulnerability determined by the RVS method based on FEMA 154 [35] and FEMA 155 [36], (2) seismic intensity of the site determined by peak ground acceleration, and (3) building occupancy (nine types) representing the significance of the building weighted by the Analytical Hierarchy Process. Utilizing a fuzzy rule-based model, the total risk scores were calculated by integrating the building importance and damageability scores [33]. Many studies have also used multi-criteria decision-making (MCDM) in seismic assessments [5,37,38,39,40,41]. The objective is to assess the severity of damage and analyze the correlation between observed damage levels and damage indices derived from various MCDM techniques. Harirchian, Jadhav, et al. applied several MCDM methods including the Weighed Sum Method (WSM), the Weighed Product Method (WPM), the Analytical Hierarchy Process (AHP), and the Technique for Order of Preference by Similarity to Ideal Solution (TOPSIS) [39]. To perform the MCDM method, several seismic parameters are used, including seismic zone, type of building, vertical irregularity, plan irregularity, pre-code, post-benchmark, and code details, soil type, number of stories, and appearance of building quality. The WSM and WPM methods achieved the highest accuracy among all MCDM methods followed by TOPSIS, while the AHP method performed worst [37]. It has been suggested by Harirchian, Jadhav, et al. that damage classifications may vary with a larger amount of data, so the results can be improved as a result [39]. More precise identification may be possible with the application of sophisticated MCDM techniques like ELECTRE, PROMOTHEE, and several hybrid techniques [37]. An innovative GIS (geographic information system)-based model has been developed by Sadrykia et al. using a modified combination of AHP, TOPSIS, and fuzzy sets theory to handle one of the important uncertainties in an incomplete data set, which is the vagueness of the existing knowledge about the factors affecting seismic vulnerability [5].

3. Methodology

Recently, several classic RVS approaches (FEMA 154 [35], EMS-98 [42], the RISK-UE Project [43], OASP [44], and NRCC [45]) have been established. Buildings constructed before the current standards may be susceptible to strong seismic effects. Thus, these fast evaluation methods are critical for current structures. Data from the 1989 Loma Prieta and 1994 Northridge earthquakes in California were used to calculate basic structural hazard (BSH) ratings in the first iteration of the FEMA 154 RVS method [35], which evaluated seismic hazard using damage probability matrices based on the modified Mercalli intensity (MMI). The Medvedev–Sponheuer–Karnik (MSK) scale-based developed EMS-98 scale is employed to classify buildings both qualitatively (building type and vulnerability) and quantitatively (indicating degrees of damage). Building type, susceptibility, and damage are classified subjectively and quantitatively using the MSK scale-based EMS-98 scale [46,47]. The 2003 damage estimate approach for the RISK-UE [43] had three steps: LM1, LM2, and LM3 methodologies. The LM1 method identifies vulnerability indices and classes. Based on the capacity and fragility model, the microseismic model (LM2) of the RISK-UE has been utilized to analyze the seismic risk in urban areas. The LM3 method calculates the structure seismic response utilizing thorough acceleration time histories and nonlinear dynamic analysis. The Earthquake Planning and Protection Organization (OASP) created the Greek RVS approach called (OASP-0). In the OASP, the structural system, including structural components and material qualities, is considered when using an RVS technique. The current NRCC [14] guideline evaluates structural and nonstructural aspects to assess threats to beams, columns, foundations, slabs, partition walls, ceilings, and building significance.
A consensus-based Likert–ANN approach has been adopted in this study to predict earthquake damage in residential buildings with RC frames. For this purpose, this research focused on selecting structures made of reinforced concrete with a maximum height of 7 stories. Furthermore, this assessment specifically focused on structures that were affected by the catastrophic Kahramanmaraş earthquake that occurred on 6 February 2023. In the analysis, 194 buildings up to seven stories with different structural characteristics were evaluated based on linguistic variables, followed by a feed-forward backpropagation (FFBP) neural network. The proposed model was developed based on structured analyses of the facade photographs of the selected buildings, and its seismic performance was evaluated. A Likert scale was used to assess the structural integrity of the buildings, and four damage levels were differentiated. Following that, ANN inputs from the building properties and output data from the structural analysis results were combined to create the proposed model. Lastly, the data were divided into two subsets to train and test the proposed model.

3.1. Obtaining Data for the Model

The ANN was designed using visual images of buildings damaged in the devastating Kahramanmaraş earthquake of 6 February 2023. It was of magnitudes 7.7 and 7.6 and severely affected 11 districts in Türkiye. The damage levels for 194 buildings were classified based on their visual appearance after the earthquake as no damage, slight damage, moderate damage, or severe damage or collapse. No earthquake damage means a structure was unharmed. There is no risk in using the building. Slight damage implies the earthquake caused paint, plaster, and tiny fractures on the building’s walls. These are buildings with plaster. Moderate damage is defined as structures that may develop fine fractures in the carrying components and walls during an earthquake. Severe damage or collapse means that the earthquake damaged the building’s load-bearing materials. Large and extensive shear fractures/separations occur in structures.
In the model, depending on their appearance following the earthquake, structures were classified as no damage, slight damage, moderate damage, severe damage, or collapse. After that, the consensus value for each parameter was used to generate the risk index (RI). Risk indices range from 0 to 1, whereas damage levels are 0.25, 0.50, 0.75, and 1. Except for building apparent quality, which is rated between 0 (good) and 1 (bad), building vulnerability parameters like soft stories, heavy overhangs, short columns, pounding effect, topography effect, vertical irregularity, and plan irregularity are quantified as 0 or 1. The details of the modeling are given in detail in the following sections.

3.2. The Evaluation Scale

Several research papers in the field of construction management use Likert scales to quantify both visible and non-observable characteristics. For example, the relative importance index was used by Datta et al. [48] to rank the critical project management success factors for the construction industry of Bangladesh, Memon et al. [49] identified the key challenges affecting construction project completion on time, several high-risk factors were identified by Yousri et al. [50] for Egyptian building construction projects, a study conducted by Oke et al. [51] examined the impact of the Internet of Things (IoT) on construction project performance, Ahmed Marey Alhammadi and Memon [52] identified factors that inhibit cost performance in United Arab Emirates (UAE) construction projects, and so on. A 5-point Likert scale is used in this study to evaluate input parameters to the proposed model.

3.3. Building Vulnerability Parameters (Inputs to the Proposed Model)

A total of eleven input vulnerability parameters are defined, each with five membership values. A list of linguistic vulnerability parameters and their values is provided in Appendix A. The following sections provide detailed explanations of these parameters.

3.3.1. Top Hill–Slope Effect

On top of hills, topographic amplification may increase ground motion intensity. Buildings on steep slopes steeper than 30 degrees also often have stopped foundations that are incapable of dispersing ground distortion equally to structural members [53]. It is advisable to avoid hillside slopes that are prone to sliding during an earthquake and instead choose only stable slopes for construction placement. Moreover, it would be more desirable to have many blocks on terraces rather than a single huge block with footings at significantly varying heights [24]. Seismic risk assessments should consider these two factors. A street survey can easily reveal both factors [53].

3.3.2. Vertical Irregularities

Buildings with columns or curtains that do not follow the height of the building create vertical irregularities, reflecting the effect of vertically discontinuous frames and changing floor areas [44]. Vertical irregularities are a major cause of building damage during strong earthquake excitation. There are a variety of factors that contribute to vertical irregularities, including steep slopes, significant wall apertures, structurally vulnerable or flexible floors, discrepancies in floor elevations, setbacks either within the same plane or outside of it [19], a column sitting on a console, vertically discontinuous columns, a curtain sitting on a column, and vertically discontinuous curtains.

Weak Stories

A weak story is usually characterized by vertical discontinuities or by reduced member sizes or reinforcements and tends to concentrate on inelastic activity, which may cause the story to collapse partially or completely [24].

Soft Stories

Buildings with soft stories have collapsed in past earthquakes around the world [53]. Buildings with soft stories have a larger share of severely damaged buildings than those with lower damage, regardless of their number of stories [54]. Soft stories typically occur when the ground floor is less stiff and stronger than the upper floors. Typically, this is the case in buildings located along the side of a main street in which the ground floor is used as a commercial or retail space while the upper floors are occupied by residences. The upper stories are strengthened and stiffened by many partition walls, but at the bottom, the commercial spaces are mostly left open between the frame members for customer circulation. Additionally, the ground stories may have taller clearances and a different axis system, causing irregularities in the construction. Euro code 8 stipulates that the displacement in the direction of seismic forces must not exceed the average story displacement by more than 20% at any given story [24].

Short Columns

In RC buildings, short columns are formed by semi-infilled frames, band windows in semi-buried basements, or mid-story beams around stairway shafts. A captive column usually sustains heavy damage during strong earthquakes due to its short length not being designed to handle high shear forces. A short column is easily identified from the outside because it usually forms along an exterior axis [53].

3.3.3. Plan Irregularities

A non-geometrically symmetrical plan and an irregular placement of vertical structural elements may cause torsion in a building. Due to its detrimental effects on the transmission of seismic loads, a large plan or diaphragm opening should be regarded as a serious kind of plan irregularity [55]. Plan irregularity describes the structural plan with re-entrant corners. E, L, T, and U are defined as complex building forms or shapes. E, H, L, T, U, Y, cross, or a mix of these shapes are common architectural configurations with projections or wings in the plan as re-entrant corners [56]. The irregularity of a structural plan is determined by plan shapes like E, L, T, U, and Z [19,56].

3.3.4. Pounding Effects

Buildings that are not sufficiently separated pound each other during an earthquake because vibration periods differ and vibration amplitudes are not synchronous. Pounding is most detrimental to adjacent buildings at corners, and uneven floor levels aggravate the effect of pounding. High-rise buildings are more likely to be damaged by pounding [53]. A misaligned floor level in an adjacent building is considered the worst-case scenario [27]. To avoid pounding, a building should not be located closer than 4% of its height to an adjacent building to avoid extensive damage [24].

3.3.5. Heavy Overhang Effect

Identifying the difference between ground and above-ground floors is necessary. Multistory reinforced concrete buildings with heavy balconies and overhanging floors shift their mass center upward, causing higher seismic lateral forces and overturning moments during a seismic event. Buildings with large, overhanging cantilever spans enclosed by concrete parapets are more likely to suffer heavy damage [53]. Furthermore, this effect is more noticeable in buildings with four, five, or six stories with heavy overhangs [54].

3.3.6. Number of Stories

A study by Sucuoğlu et al. concluded that building height is one of the most significant or perhaps even the most dominant determinants of seismic vulnerability in Turkish multistory concrete structures, and there is a strong correlation between damage and the number of stories [54], since higher buildings can suffer great deformation and damage during an earthquake [18]. In a report prepared for the Metropolitan Municipality of Istanbul following the Kocaeli and Düzce earthquakes of 1999, it was found that building damage correlated strongly with the number of stories [53]. Şen also found that the most vulnerable buildings in Istanbul were medium-rise (4–7 stories) reinforced concrete frame buildings designed based on outdated regulations [24]. It is clearly seen that there is almost a linear increase in damage with the number of stories. The ratio of moderately and severely damaged buildings increases steadily with the number of stories [53]. However, if buildings are designed to comply with modern seismic codes, damage will be distributed uniformly regardless of the number of stories [54].

3.3.7. Construction Year

The assessment of building vulnerability is based on the construction year, which serves as an indicator of construction quality, design methodologies used, and seismic details included in the project. Old structures cannot be expected to function well because ancient construction procedures ignore the seismic details of modern building requirements [18]. Construction years provide information about building design regulations as well as design standards that are classified as low, moderate, and high. A study by Bektaş and Kegyes-Brassai examined the effects of the construction year on seismic design codes in Albania, and the authors concluded that this existing classification technique could be used by modifying the thresholds based on the seismic standards for the region under consideration [18].

3.3.8. Structural System States

Different types of buildings are more or less vulnerable to earthquakes. Structural load-carrying systems determine a building’s lateral strength and ductility during a seismic event. Several parameters affect this parameter, including structural geometry, member dimensions, and design quality. It was stated in the Ministry of Environment and Urban Planning’s (2019) method for evaluating existing reinforced concrete buildings of 1 to 7 floors that the buildings could have reinforced concrete frames (RCF) or reinforced concrete frame and curtain (RCFC) systems for load bearing. As stated, the load-bearing system should be determined from the inside of a basement floor if there is one, or from inside a store if there is one, or if it cannot be determined, the RCF should be assumed to be ineffective or zero.

3.3.9. Apparent Building Quality

Building apparent quality and earthquake damage are closely related. Construction quality, workmanship, and maintenance reflect the apparent quality of the building [53]. Sucuoğlu et al. [54] found that severely damaged buildings in three- to five-story buildings were of lower quality than those in other damage groups after the Düzce earthquake. Additionally, apparent quality became more significant as building height increased [54]. The apparent quality of a building can generally be classified by a trained observer [53]. Workmanship, material quality, and existing damage and deterioration are used to determine whether a building’s construction is poor, moderate, or good. If a building’s flooring, ceilings, brick walls, uneven surfaces, scratches, or efflorescence have surface or appearance problems, the building’s construction quality is considered average [18].

3.4. Building Seismic Performance Scores (Outputs of the Proposed Model)

A damage score indicates the level of damage likely to be sustained by a structure. Building damageability is computed based on the building vulnerability parameters. Some studies categorize building damage into five damage levels: very low, low, moderate, high, and very high [25,53]. There are, however, three damage levels according to some studies: low risk, medium risk, and high risk [57], or four damage grades: none, light, moderate, and severe/collapse [54]. Damage grades are generally defined as follows. No damage: the structure is not significantly damaged; slight damage: capillary bending or shear cracks in columns, beams, and slabs, as well as capillary shear cracks in walls; moderate damage: local or longitudinal cracks in most columns and beams; severe damage: poured concrete covers, buckled longitudinal reinforcement bars, and wide cracks; and collapse: excessive deformation causing a structure to collapse. Damage grades were classified into four categories in this study: none, slight, moderate, and severe or collapse, as in the study by Sucuoğlu et al. [54]. As explained in detail in the introduction, determining building seismic performance varies depending on the proposed model. The use of linear functions is suggested by some studies, while the use of fuzzy functions, neural networks, and multi-criteria decision-making methods is suggested by others. A consensus-based Likert–ANN model is recommended in this study.

3.5. The Consensus-Based Likert–ANN Model

The classical methods linguistically mark pounding effects as Yes or No [24]. With classical modeling, the building vulnerability parameters such as soft stories, heavy overhangs, short columns, pounding effects, topography effects, vertical irregularities, and plan irregularities are quantified as 1 or 0 depending on crisp two-valued logic, except for the building apparent quality, which is rated as 0 (good), 1 (moderate), and 2 (poor) [53]. As a result, no distinction is made between “slightly”, “moderate”, and “very” quantities in this case. Buildings on steep slopes steeper than 30 degrees, for example, are all quantified as 1; however, a building on top of a hill may be intensified by topographic amplification. FL involves fuzzifying inputs and outputs into multiple fuzzy sets. In some cases, FL with multiple values is more advantageous than crisp logic with two values. The proposed model has been developed to predict seismic risk levels of existing buildings based on linguistic information gathered from expert opinions based on a 5-point Likert scale. Figure 1 illustrates the overall structure of the proposed model.

3.5.1. Consensus Degree

Experts will evaluate each vulnerability parameter individually using the form (Appendix A) based on a five-point Likert scale. Following that, the risk index (RI) based on the consensus value for each parameter will be calculated using the equation shown below.
R I = C n s i = 1 N a i 5 N
where Cns stands for the consensus degree of responses to each parameter, N indicates the total number of experts (suggested five), and ai is the constant that represents the weight assigned to each response (in this case, very low = 1; low = 2; moderate = 3; high = 4; and very high = 5). Individuals in a sample group are said to be in consensus when they agree on a declarative statement [59]. Based on this definition, if an equal number of participants choose their responses in the two extreme categories on a Likert scale, i.e., strongly disagree and strongly agree, there is no consensus; however, this group shows full consensus if all participants choose the same category on the Likert scale. Therefore, for all combinations of response patterns, the consensus degree varies between zero and one.
Tastle and Wierman [59] concluded that the consensus provides a value for comparing different Likert distributions and matches human intuition, and suggested calculating a consensus (Cns) degree as follows:
C n s X = 1 + i = 1 n p i l o g 2 1 x i μ x d x
where X is the response, µx is the mean of X, n represents the number of categories on an ordinal scale, xi is the degree of agreement in category i, pi is the probability of the occurrence of xi, and dx is the width of X, i.e., dx = XmaxXmin (in this case, dx = 5 − 1 = 4).

3.5.2. Neural Network (NN) Modeling

This study can be viewed as pattern classification, and feedforward networks can be used to classify patterns. The non-linearly separable classification problem can only be solved by multilayer networks, and a multilayer perceptron trained using a backpropagation algorithm is the most widely used neural network [58]. There is no general knowledge regarding how many layers or how many neurons are necessary for adequate performance of multilayer networks. Most neural networks have two or three layers, whereas four or more layers are rarely used [58]. When choosing the fastest training algorithm for a given problem, several factors need to be taken into account, including how complex the problem is, the number of data points in the training set, the weights and biases within the network, and the error goal [58]. However, LMBP, despite a large number of computations, is the fastest neural network training algorithm for moderate numbers of parameters [58,60], and well-suited for neural network training [58]. A two-layer feedforward artificial neural network was considered. Therefore, this study uses an 11-11-1 ANN model with LMBP to predict the seismic performances of existing buildings, and the MATLAB NN toolbox (nntool) is used to train and test the model because the fastest way to train a feedforward network of small or medium size is to use “trainlm” in MATLAB [61]. The proposed approach to model training is shown in Figure 2.

4. Results

An evaluation of 194 buildings was conducted with post-earthquake visual images and 11 linguistic variables to categorize damage levels following the Kahramanmaraş earthquake. Thus, it is thought that pre-earthquake visual images can be used to estimate the possible damage levels of existing buildings before a similar earthquake. The results of the designed model are described in detail below.

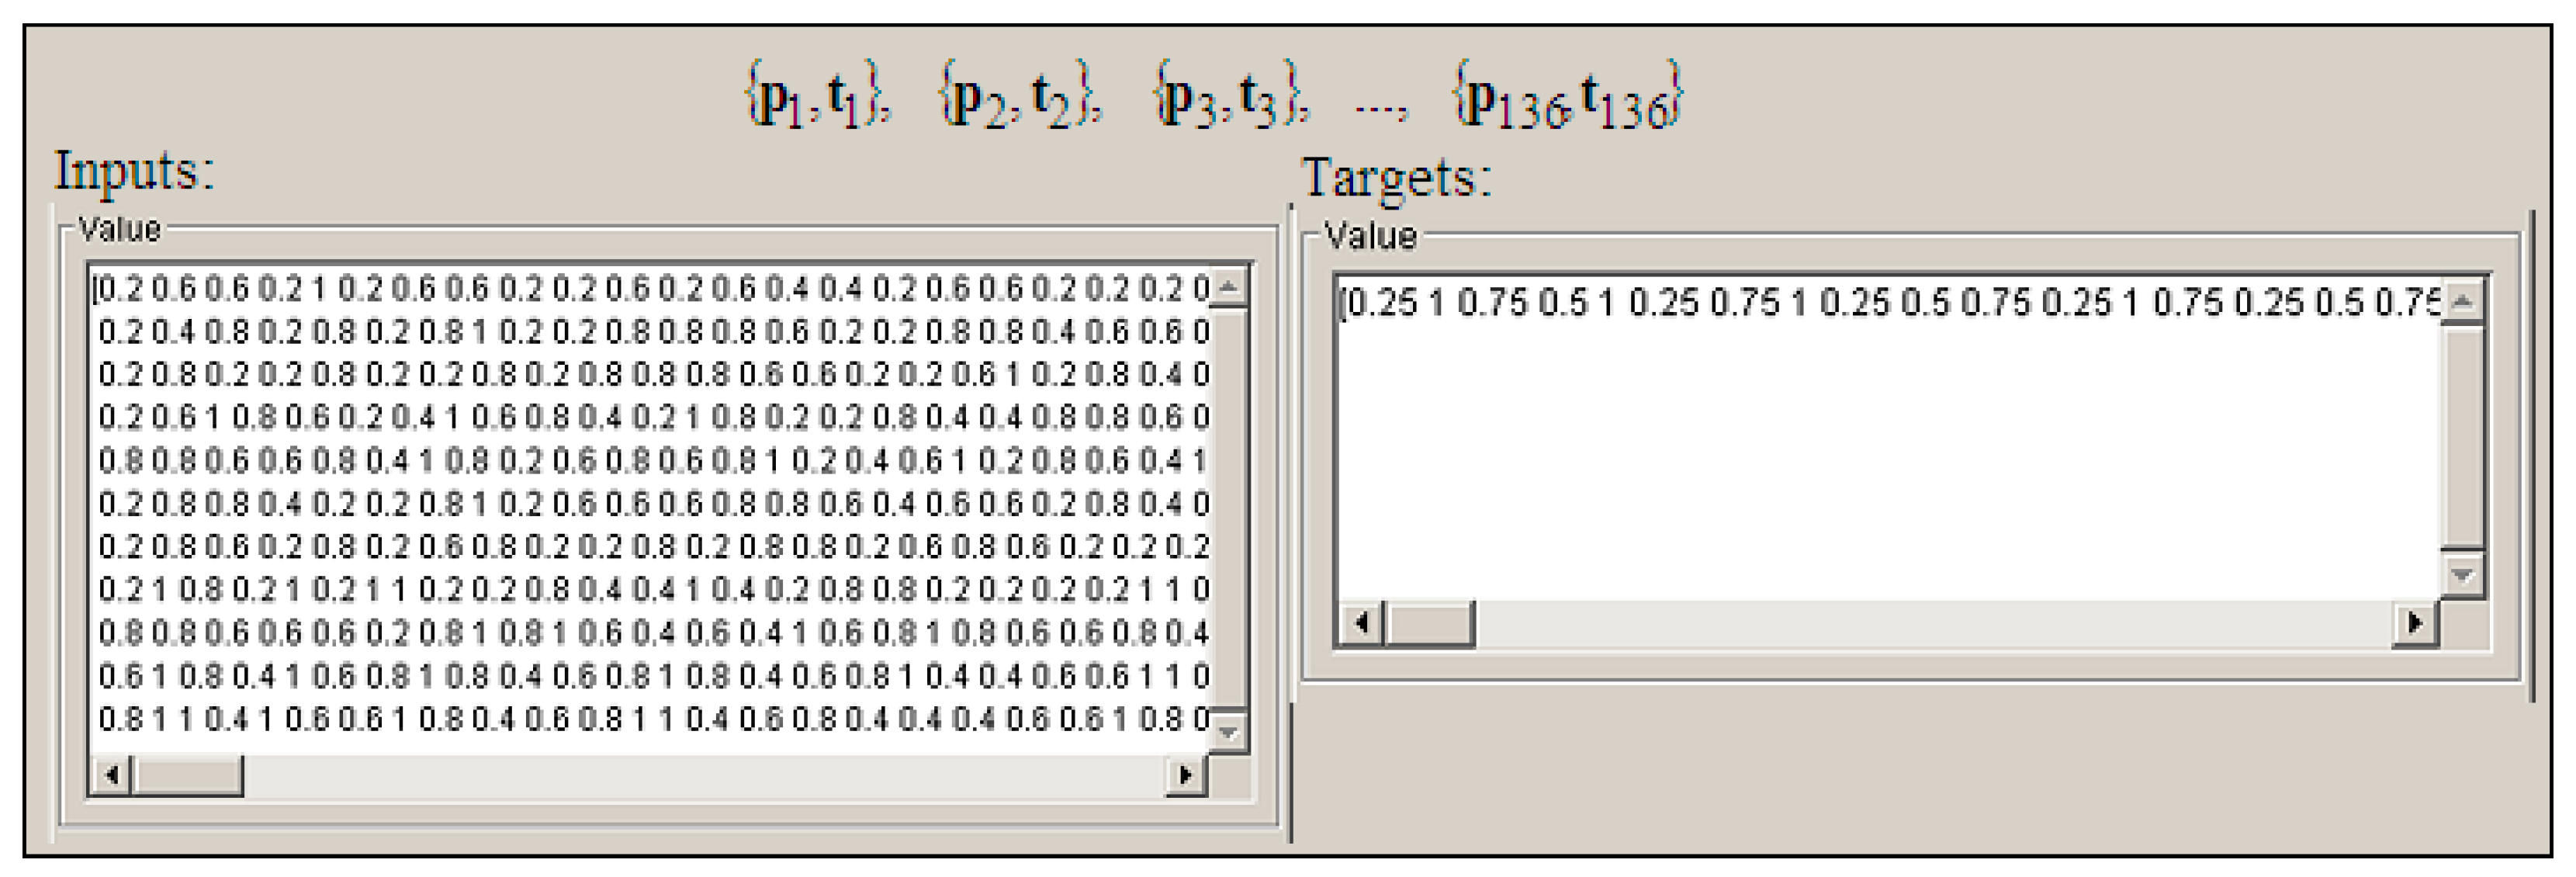
4.1. Inputs and Outputs of the Model

A visual analysis of 194 buildings affected by the Kahramanmaraş earthquake was conducted using linguistic variables based on a five-point Likert scale. Based on their outward appearance after the earthquake, 194 structures were categorized as having no damage, slight damage, moderate damage, severe damage, or collapse. According to their damage levels, 48 of the buildings had no damage, 49 had slight damage, 48 had moderate damage, and 49 had severe damage or collapse. A list of linguistic variables and their values is included in Appendix A. After that, Equations (1) and (2) were used to calculate the risk index (RI) based on the consensus value for each parameter. The model inputs consist of risk indices ranging from 0 to 1, while its outputs consist of damage levels varying between 0.25, 0.50, 0.75, and 1. An overview of the model’s input–output values is shown in Figure 3.

4.2. Architecture of the Model

In most cases, a network with fewer parameters than data points in the training set can sufficiently represent the training data for the network to generalize. Several approaches have been used to create simple networks: growing, pruning, global searches, regularization, and early stopping. A network is grown by starting with no neurons and adding neurons until its performance is adequate. It is also possible to stop training before the network overfits. A simple method for improving generalization is early stopping. This method aims to minimize overfitting by stopping training before the minimum is reached. Additionally, when the backpropagation algorithm converges, it is not certain that it is an optimum solution, so trying several initial conditions ensures an optimal solution. As a step-by-step approach, we compared the performance of various architectures by adding neurons to the hidden layer from 11-4-1 to 11-11-1 at various initial parameters to find the ideal solution, as described above by Hagan et al. [58]. The final architecture and training parameters are shown in Figure 4.

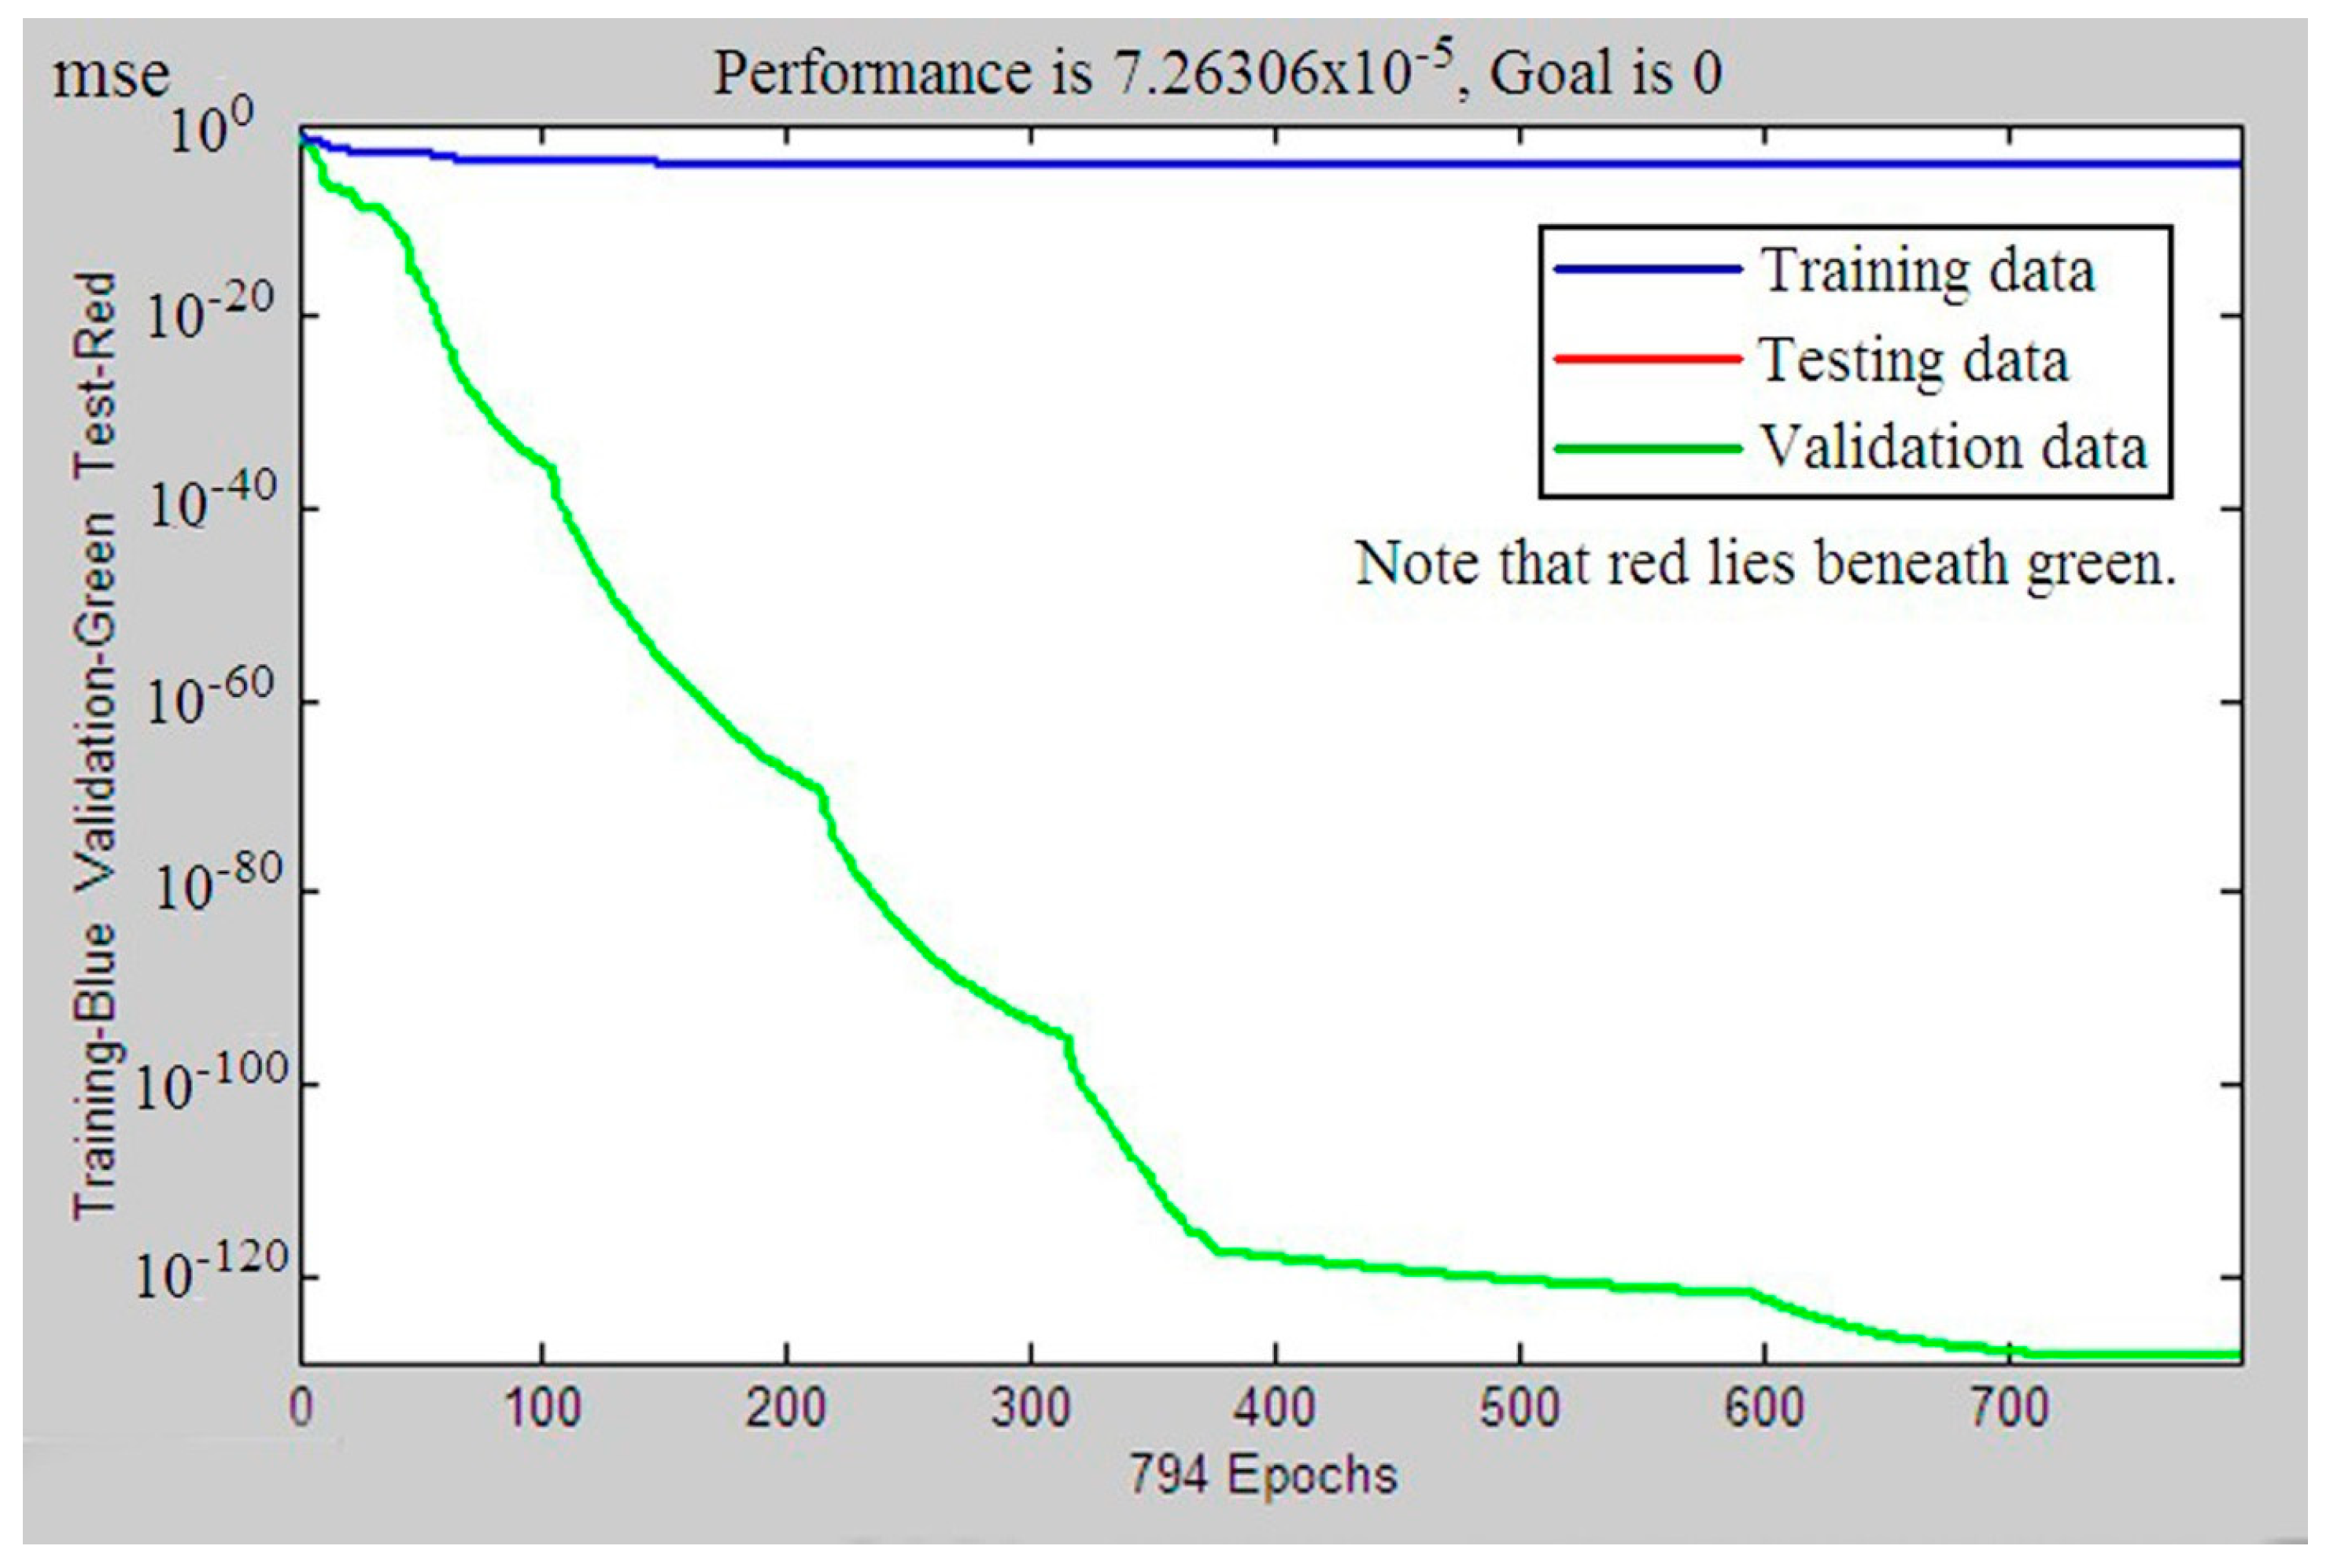
4.3. Training, Testing, and Validation

The model was trained using the MATLAB neural network toolbox. As a first step, the data set was divided into training, testing, and validation subsets. There are various ratios recommended for this. For example, the MATLAB neural network toolbox (nntool) normally divides a network’s data automatically when the network is trained, and the default ratios for training, testing, and validation are 0.7, 0.15, and 0.15, respectively [61]. In this study, the default ratios were not changed. The model was run many times with various initial parameters to find the global minimum point, and finally, the global minimum point sufficient for the model’s performance was reached with the initial values shown in Figure 5. Figure 5 shows the final parameters as well.
The error generally reduces as the number of epochs of training increases; however, the error may start to increase on the validation data as the network starts overfitting to the training data [62]. In the default Levenberg–Marquardt training parameters, five consecutive increases in validation error stop the training [61], and the epoch with the lowest validation error results in the best performance [62]. The proposed model reached max_fail (five in this case) in its 794th iteration and completed training with an adequate performance value (mean squared error), as shown in Figure 6. There are three different colored lines in Figure 6. The blue line represents the mean squared error (mse) of the training set, the green line represents the mse of the validation set, and the red line represents the mse of the test set. As the red and green lines overlap, the red line cannot be seen because it lies beneath the green line. Note that the test curve and validation curve overlap in the figure.
The statistical value for errors in the entire data set (e = t − a) is M = 0.00068 ± STD = 0.00852. Additionally, we obtained 0.02 on one data point, 0.06 on one data point, and 0.07 on two data points. The model shows quite good performance. All of the data points are included in Figure 7’s target–output graph. There were 194 structures evaluated for damage levels: 48 were completely unaffected (represented by a 0.25), 49 were slightly damaged (represented by a 0.50), 48 were moderately damaged (represented by a 0.75), and 49 were severely damaged (represented by a 1.00).

5. Discussion

Ruggieri et al. developed a framework using ML for the analysis of the seismic vulnerability of existing buildings, which identifies buildings in an area and uses their photos to generate a vulnerability index, thereby reducing the time and effort required for surveys and interviews [13]. Similarly, a proposed model was developed based on the structural analysis of post-earthquake facade photographs in the Kahramanmaraş earthquake zone, and its seismic performance was evaluated. A five-point Likert scale with consensus values derived from linguistic data on the visual images was used to measure building vulnerability levels. Several predictor variables were used as input parameters for the ML algorithms, including the closest distance to the surface projection of fault rupture and the spectral acceleration at the site of interest. Variables such as building age (in years), number of stories, plan irregularities, floor area, and replacement cost were also used to predict building performance. Green, Yellow, and Red were the damage tagging categories [6]. In another study, Allali et al. scaled component damage levels and global damage levels according to no damage, slight damage, moderate damage, severe damage, and collapse. Similarly, our study defined eleven input vulnerability parameters with five membership values each. Based on the structural analysis, buildings were classified as having no damage, minor damage, moderate damage, or severe damage/collapse.
Various AI techniques have been used in the literature to design models, and their performances have been analyzed. Kaplan et al. presented a method in which a building’s performance level was categorized as low risk, medium risk, or high risk, claiming that the method showed 83% accuracy, compared to the long and hectic code-based method [47]. An approach based on FL with a genetic algorithm was used by Allali et al. to assess the damage to buildings with different lateral load-resisting components post-earthquake, and approximately 90% accuracy was achieved in their results [63]. Harirchian et al. examined the effectiveness of ML applications in damage prediction using a support vector machine model as the damage classification technique [33]. According to the study, all 22 input parameters resulted in a 52% accuracy rate, which is acceptable given the sample size [64]. According to the results of the study by Mangalathu et al., predictions made using the random forest algorithm had a 66% accuracy in assigning tags and 79% accuracy in actual yellow tags [6]. In the study by Özkan et al., a generalized regression neural network and an FFBP neural network were used for the network architecture [44]. The nonlinear incremental mode combination method was used to evaluate the earthquake performance of these building models. They claimed that an ANN could successfully predict the earthquake behavior of reinforced concrete buildings [65]. Chen and Zhang developed a learning model that enables early disaster risk reduction decisions by automating building vulnerability assessments in seismic areas [54]. The proposed model here, however, uses an ANN with two layers (11-11-1) and LMBP to predict the seismic performances of existing buildings. The structural integrity of the buildings was assessed using a Likert scale, and four levels of damage were differentiated. In the following step, input data from the building properties and output data from the structural analysis results were combined to create the proposed model. Training the model resulted in quite good performance. Based on the statistical analysis of the entire data set, the mean and the standard deviation of the errors were 0.00068 and 0.00852, respectively. Four data points differed from the others but were quite acceptable: 0.02 on one data point, 0.06 on one data point, and 0.07 on two data points.

6. Conclusions

Earthquakes threaten many lives every year. They affect not only developing countries but also developed ones and they cause significant economic losses, massive deaths, as well as the suspension of occupancy and businesses. For future losses to be minimized, it is crucial to estimate seismic damage before an earthquake occurs. Existing buildings in earthquake-prone areas need structural safety or seismic vulnerability assessments. Various RVS techniques have been developed by different countries in recent years to deal with the devastating effects of earthquakes on buildings and humans. However, RVS methods have some limitations, such as surveyor bias and site-specific characteristics, as well as data uncertainty and vagueness. Fuzzy logic, neural networks, and ML are all computer algorithms that can be used to overcome these kinds of disadvantages in evaluation.
Türkiye is located in an active earthquake zone that can cause very severe earthquakes; every two years, it experiences severe earthquakes, and every three years, it experiences very severe earthquakes. Therefore, a new model was developed to rapidly assess building seismic performance. A consensus-based Likert–ANN approach has been used in this study to predict earthquake damage levels in residential buildings with RC frames. The ANN was designed by analyzing the visual images of buildings damaged by the devastating Kahramanmaraş earthquake of 6 February 2023, which measured 7.7 and 7.6 on the Richter scale and severely affected 11 districts in Türkiye. Vulnerability variables for buildings are measured using linguistic data on a five-point Likert scale based on expert consensus values derived from post-earthquake visual images. An extensive literature review was conducted to determine the building vulnerability parameters required for the proposed model, including the top hill–slope effect, weak story effect, soft story effect, short column effect, plan irregularity, pounding effect, heavy overhang effect, number of stories, construction year, structural system state, and apparent building quality. Structural analyses categorized buildings as no damage, slight damage, moderate damage, or severe damage/collapse. In terms of damage levels, 48 of the buildings had no damage, 49 had slight damage, 48 had moderate damage, and 49 had severe damage or collapse. Model inputs consist of risk indices ranging from 0 to 1, while outputs consist of damage levels varying between 0.25, 0.50, 0.75, and 1.
A two-layer neural network (11-11-1) with LMBP was used to train the model after 194 buildings up to seven stories were evaluated. Max_fail (five) was reached in the proposed model’s 794th iteration, and training was completed with an adequate performance value (mse = 7.26306 × 10⁻⁵). Statically, errors in the entire data set (e = t − a) are M = 0.00068 ± STD = 0.00852, with 0.02 on one data point, 0.06 on one data point, and 0.07 on two data points. Using this model, it is possible to assess the seismic vulnerabilities of existing buildings by analyzing pre-earthquake facade images with 11 parameters. Experts can use linguistic variables on a five-point Likert scale, and consensus values combine differing opinions from experts. LMBP provides a high-performance solution to the proposed model. Although the model shows good performance and it can be used for rapid visual analysis, a detailed analysis may still be needed. There is room for improvement. A further evaluation of the model’s reliability should be performed with multiple expert groups and with data from a variety of earthquake zones or should be remodeled with more data. This requires much time, but if an AI application evaluates relevant parameters from photographs, this time will be much shorter, and the proposed model will become more useful.

Author Contributions

Conceptualization, B.O. and M.K.; Methodology, B.O.; Validation, B.O. and M.K.; Formal analysis, B.O.; Investigation, B.O.; Resources, M.K.; Data curation, M.K.; Writing—original draft, B.O.; Writing—review & editing, B.O. and M.K. All authors have read and agreed to the published version of the manuscript.

Funding

This research received no external funding.

Institutional Review Board Statement

Not applicable.

Informed Consent Statement

Not applicable.

Data Availability Statement

The original contributions presented in the study are included in the article, further inquiries can be directed to the corresponding author.

Conflicts of Interest

The authors declare no conflict of interest.

Appendix A. Form for Evaluating Building Vulnerability

nBuilding Vulnerability ParametersVery LowLowMediumHighVery
High
1Top hill–slope effect:
(Topographic amplification can intensify ground motion on hills. Buildings on steep slopes steeper than 30 degrees often have foundations that are unable to disperse ground distortion evenly).
2Weak story effect:
(Weak stories usually have vertical discontinuities or reduced member sizes or reinforcements, which can lead to partial or total collapse).
3Soft story effect:
(Ground floors typically have softer structures than upper floors. Commercial spaces at the bottom are mostly left open (large wall openings) for customer circulation, or the ground stories have taller clearances and different axis systems).
4Short column effect:
(Short columns formed by semi-infilled frames, band windows in semi-buried basements, or mid-story beams around stairway shafts).
5Plan irregularity:
(A non-geometrically symmetrical plan, an irregular placement of vertical structural elements, or a large plan or diaphragm opening; plan shapes like E, L, T, U, +, and Z).
6Pounding effect:
(A building should not be located closer than 4% of its height to an adjacent building. High-rise buildings are more likely to be damaged by pounding. A misaligned floor level in an adjacent building is considered the worst-case scenario).
7Heavy overhang effect:
(Buildings with large, overhanging cantilever spans enclosed by concrete parapets are more likely to suffer heavy damage).
8Number of stories:1–23456–7
9Construction year:
(Construction years provide information about building design regulations as well as design standards).
0–1011–2021–3031–40>40
10Structural system state:
(Parameters such as structural geometry, member dimensions, and design quality affect this parameter. If it cannot be determined, the RCF should be assumed to be medium).
Very
good
GoodMediumPoorVery
poor
11Apparent building quality:
(Very poor if the structure has severe damage; very good if the structure has no visible cracks or damage; medium if there are cracks in some structural members).

References

  1. Haryanto, Y.; Hu, H.-T.; Han, A.L.; Hidayat, B.A.; Widyaningrum, A.; Yulianita, P.E. Seismic vulnerability assessment using rapid visual screening: Case study of educational facility buildings of Jenderal Soedirman University, Indonesia. Civ. Eng. Dimens. 2020, 22, 13–21. [Google Scholar] [CrossRef]
  2. Rashid, M.; Ahmad, N. Economic losses due to earthquake-induced structural damages in RC SMRF structures. Cogent Eng. 2017, 4, 1296529. [Google Scholar] [CrossRef]
  3. Bektaş, N.; Kegyes-Brassai, O. Conventional RVS methods for seismic risk assessment for estimating the current situation of existing buildings: A state-of-the-art review. Sustainability 2022, 14, 2583. [Google Scholar] [CrossRef]
  4. Coskun, O.; Aldemir, A.; Sahmaran, M. Rapid screening method for the determination of seismic vulnerability assessment of RC building stocks. Bull. Earthq. Eng. 2020, 18, 1401–1416. [Google Scholar] [CrossRef]
  5. Sadrykia, M.; Delavar, M.R.; Zare, M. A GIS-based fuzzy decision making model for seismic vulnerability assessment in areas with incomplete data. ISPRS Int. J. Geo-Inf. 2017, 6, 119. [Google Scholar] [CrossRef]
  6. Mangalathu, S.; Sun, H.; Nweke, C.C.; Yi, Z.; Burton, H.V. Classifying earthquake damage to buildings using machine learning. Earthq. Spectra 2020, 36, 183–208. [Google Scholar] [CrossRef]
  7. El-Betar, S.A. Seismic vulnerability evaluation of existing RC buildings. HBRC J. 2018, 14, 189–197. [Google Scholar] [CrossRef]
  8. Bhalkikar, A.; Kumar, R.P. A comparative study of different rapid visual survey methods used for seismic assessment of existing buildings. Structures 2021, 29, 1847–1860. [Google Scholar] [CrossRef]
  9. Kumari, V.; Harirchian, E.; Lahmer, T.; Rasulzade, S. Evaluation of machine learning and web-based process for damage score estimation of existing buildings. Buildings 2022, 12, 578. [Google Scholar] [CrossRef]
  10. Doğan, T.P.; Kızılkula, T.; Mohammadi, M.; Erkan, İ.; Kabaş, H.T.; Arslan, M. A comparative study on the rapid seismic evaluation methods of reinforced concrete buildings. Int. J. Disaster Risk Reduct. 2021, 56, 102143. [Google Scholar] [CrossRef]
  11. Aldemir, A.; Guvenir, E.; Sahmaran, M. Rapid screening method for the determination of regional risk distribution of masonry structures. Struct. Saf. 2020, 85, 101959. [Google Scholar] [CrossRef]
  12. Harith, N.S.H.; Jainih, V.; Ladin, M.A.; Adiyanto, M.I. Assessing the vulnerability of Kota Kinabalu buildings. Civ. Eng. Archit. 2021, 9, 68–77. [Google Scholar] [CrossRef]
  13. Ruggieri, S.; Cardellicchio, A.; Leggieri, V.; Uva, G. Machine-learning based vulnerability analysis of existing buildings. Autom. Constr. 2021, 132, 103936. [Google Scholar] [CrossRef]
  14. Cenan Mertol, H.; Tunc, G.; Akis, T. Damage observation of reinforced concrete buildings after 2020 Sivrice (Elazığ) earthquake, Turkey. J. Perform. Constr. Facil. 2021, 35, 04021053. [Google Scholar] [CrossRef]
  15. Mertol, H.C.; Tunç, G.; Akış, T.; Kantekin, Y.; Aydın, İ.C. Investigation of RC Buildings after 6 February 2023, Kahramanmaraş, Türkiye Earthquakes. Buildings 2023, 13, 1789. [Google Scholar] [CrossRef]
  16. Wu, D.; Mendel, J.M. Recommendations on designing practical interval type-2 fuzzy systems. Eng. Appl. Artif. Intell. 2019, 85, 182–193. [Google Scholar] [CrossRef]
  17. Harirchian, E.; Kumari, V.; Jadhav, K.; Rasulzade, S.; Lahmer, T.; Raj Das, R. A synthesized study based on machine learning approaches for rapid classifying earthquake damage grades to RC buildings. Appl. Sci. 2021, 11, 7540. [Google Scholar] [CrossRef]
  18. Bektaş, N.; Kegyes-Brassai, O. Development in fuzzy logic-based rapid visual screening method for seismic vulnerability assessment of buildings. Geosciences 2022, 13, 6. [Google Scholar] [CrossRef]
  19. Bektaş, N.; Lilik, F.; Kegyes-Brassai, O. Development of a fuzzy inference system based rapid visual screening method for seismic assessment of buildings presented on a case study of URM buildings. Sustainability 2022, 14, 16318. [Google Scholar] [CrossRef]
  20. Harirchian, E.; Hosseini, S.E.A.; Jadhav, K.; Kumari, V.; Rasulzade, S.; Işık, E.; Wasif, M.; Lahmer, T. A review on application of soft computing techniques for the rapid visual safety evaluation and damage classification of existing buildings. J. Build. Eng. 2021, 43, 102536. [Google Scholar] [CrossRef]
  21. Barfield, W. The Cambridge Handbook of the Law of Algorithms; Cambridge University Press: Cambridge, UK, 2020. [Google Scholar]
  22. Ningthoujam, M.; Nanda, R.P. Rapid visual screening procedure of existing building based on statistical analysis. Int. J. Disaster Risk Reduct. 2018, 28, 720–730. [Google Scholar] [CrossRef]
  23. Mora, E.; Ordóñez Bueno, M.; Gómez, C. Structural Vulnerability Assessment Procedure for Large Areas Using Machine Learning and Fuzzy Logic. IRECE 2021, 12, 358. [Google Scholar] [CrossRef]
  24. Şen, Z. Rapid visual earthquake hazard evaluation of existing buildings by fuzzy logic modeling. Expert Syst. Appl. 2010, 37, 5653–5660. [Google Scholar] [CrossRef]
  25. Şen, Z. Supervised fuzzy logic modeling for building earthquake hazard assessment. Expert Syst. Appl. 2011, 38, 14564–14573. [Google Scholar] [CrossRef]
  26. Amiri Shahmirani, M.R.; Akbarpour Nikghalb Rashti, A.; Adib Ramezani, M.R.; Golafshani, E.M. Application of fuzzy modelling to predict the earthquake damage degree of buildings based on field data. J. Intell. Fuzzy Syst. 2021, 41, 2717–2730. [Google Scholar] [CrossRef]
  27. Mangir, A.; Okumus, V. Pre-earthquake fuzzy logic-based rapid hazard assessment of reinforced concrete buildings. Case Stud. Constr. Mater. 2023, 19, e02534. [Google Scholar] [CrossRef]
  28. Gao, Y.; Mosalam, K.M. Deep transfer learning for image-based structural damage recognition. Comput.-Aided Civ. Infrastruct. Eng. 2018, 33, 748–768. [Google Scholar] [CrossRef]
  29. Liang, X. Image-based post-disaster inspection of reinforced concrete bridge systems using deep learning with Bayesian optimization. Comput.-Aided Civ. Infrastruct. Eng. 2019, 34, 415–430. [Google Scholar] [CrossRef]
  30. Pan, X.; Yang, T. Postdisaster image-based damage detection and repair cost estimation of reinforced concrete buildings using dual convolutional neural networks. Comput.-Aided Civ. Infrastruct. Eng. 2020, 35, 495–510. [Google Scholar] [CrossRef]
  31. Ogunjinmi, P.D.; Park, S.-S.; Kim, B.; Lee, D.-E. Rapid post-earthquake structural damage assessment using convolutional neural networks and transfer learning. Sensors 2022, 22, 3471. [Google Scholar] [CrossRef] [PubMed]
  32. Irwansyah, E.; Hartati, S. Three-stage fuzzy rule-based model for earthquake non-engineered building house damage hazard determination. J. Adv. Comput. Intell. Intell. Inform. 2017, 21, 1298–1311. [Google Scholar] [CrossRef]
  33. Ketsap, A.; Hansapinyo, C.; Kronprasert, N.; Limkatanyu, S. Uncertainty and fuzzy decisions in earthquake risk evaluation of buildings. Eng. J. 2019, 23, 89–105. [Google Scholar] [CrossRef]
  34. Harirchian, E.; Lahmer, T. Improved rapid visual earthquake hazard safety evaluation of existing buildings using a type-2 fuzzy logic model. Appl. Sci. 2020, 10, 2375. [Google Scholar] [CrossRef]
  35. Agency, F.E.M. Rapid Visual Screening of Buildings for Potential Seismic Hazards: A Handbook; Government Printing Office: Washington, DC, USA, 2017.
  36. Agency, F.E.M. Rapid Visual Screening of Buildings for Potential Seismic Hazards: Supporting Documentation; Government Printing Office: Washington, DC, USA, 2015. [Google Scholar]
  37. Harirchian, E.; Jadhav, K.; Mohammad, K.; Aghakouchaki Hosseini, S.E.; Lahmer, T. A comparative study of MCDM methods integrated with rapid visual seismic vulnerability assessment of existing RC structures. Appl. Sci. 2020, 10, 6411. [Google Scholar] [CrossRef]
  38. Fortunato, A.; Fabbrocino, F.; Angelillo, M.; Fraternali, F. Limit analysis of masonry structures with free discontinuities. Meccanica 2018, 53, 1793–1802. [Google Scholar] [CrossRef]
  39. Fabbrocino, F.; Farina, I.; Modano, M. Loading noise effects on the system identification of composite structures by dynamic tests with vibrodyne. Compos. Part B Eng. 2017, 115, 376–383. [Google Scholar] [CrossRef]
  40. Modano, M.; Fabbrocino, F.; Gesualdo, A.; Matrone, G.; Farina, I.; Fraternali, F. On the forced vibration test by vibrodyne. In Proceedings of the COMPDYN 2015 Conference Proceedings, Crete Island, Greece, 25–27 May 2015; pp. 25–27. [Google Scholar]
  41. Peng, Y. Regional earthquake vulnerability assessment using a combination of MCDM methods. Ann. Oper. Res. 2015, 234, 95–110. [Google Scholar] [CrossRef]
  42. Grünthal, G. European Macroseismic Scale 1998 (EMS-98); European Seismological Commission, Sub Commission on Engineering Seismology, Working Group Macroseismic Scales. Conseil de l’Europe, Cahiers du Centre Européen de Géodynamique et de Séismologie: Luxembourg, 1998; Volume 15, p. 99. [Google Scholar]
  43. Milutinovic, Z.V.; Trendafiloski, G.S. RISK-UE Project: An Advanced Approach to Earthquake Risk Scenarios with Applications to Different European Towns; Contract: EVK4-CT-2000-00014, WP4: Vulnerability of Current Buildings; European Commission: Brussels, Belgium, 2003; pp. 1–111. Available online: http://www.civil.ist.utl.pt/~mlopes/conteudos/DamageStates/Risk%20UE%20WP04_Vulnerability.pdf (accessed on 23 October 2022).
  44. Earthquake Planning and Protection Organization (OASP). Provisions for Pre-Earthquake Vulnerability Assessment of Public Buildings (Part A); Technical Report; Greek Society of Civil Engineers: Athens, Greece, 2000. [Google Scholar]
  45. NRC. Manual for Screening of Buildings for Seismic Investigation; NRC Publications Archive: Ottawa, ON, Canada, 1993. [Google Scholar]
  46. Pittore, M.; Graziani, L.; Maramai, A.; Haas, M.; Parolai, S.; Tertulliani, A. Bayesian estimation of macroseismic intensity from post-earthquake rapid damage mapping. Earthq. Spectra 2018, 34, 1809–1828. [Google Scholar] [CrossRef]
  47. Musson, R.M.; Grünthal, G.; Stucchi, M. The comparison of macroseismic intensity scales. J. Seismol. 2010, 14, 413–428. [Google Scholar] [CrossRef]
  48. Datta, S.D.; Sobuz, M.H.R.; Nafe Assafi, M.; Sutan, N.M.; Islam, M.N.; Mannan, M.B.; Akid, A.S.M.; Hasan, N.M.S. Critical project management success factors analysis for the construction industry of Bangladesh. Int. J. Build. Pathol. Adapt. 2023; ahead-of-print. [Google Scholar] [CrossRef]
  49. Memon, A.H.; Memon, A.Q.; Khahro, S.H.; Javed, Y. Investigation of Project Delays: Towards a Sustainable Construction Industry. Sustainability 2023, 15, 1457. [Google Scholar] [CrossRef]
  50. Yousri, E.; Sayed, A.E.B.; Farag, M.A.; Abdelalim, A.M. Risk identification of building construction projects in egypt. Buildings 2023, 13, 1084. [Google Scholar] [CrossRef]
  51. Oke, A.E.; Arowoiya, V.A.; Akomolafe, O.T. Influence of the Internet of Things’ application on construction project performance. Int. J. Constr. Manag. 2022, 22, 2517–2527. [Google Scholar] [CrossRef]
  52. Alhammadi, A.S.A.M.; Memon, A.H. Inhibiting factors of cost performance in uae construction projects. Int. J. Sustain. Constr. Eng. Technol. 2020, 11, 126–132. [Google Scholar]
  53. Ansal, A.; Özaydın, K.; Edinçliler, A.; Saglamer, A.; Sucuoglu, H.; Özdemir, P. Earthquake Master Plan for Istanbul, Metropolital Municipality of Istanbul, Planning and Construction Directorate; Geotechnical and Earthquake Investigation Department: Istanbul, Turkey, 2003.
  54. Sucuoğlu, H.; Yazgan, U.; Yakut, A. A screening procedure for seismic risk assessment in urban building stocks. Earthq. Spectra 2007, 23, 441–458. [Google Scholar] [CrossRef]
  55. İlerisoy, Z. Discussion of the structural irregularities in the plan for architectural design within the scope of earthquake codes. Period. Polytech. Archit. 2019, 50, 50–62. [Google Scholar] [CrossRef]
  56. Mendi, H.E. Evaluation of Architectural and Consciousness Exploration Architecture-Based Issues in Seismic Design. Master’s Thesis, Middle East Technical University, Ankara, Turkey, 2005. [Google Scholar]
  57. Kaplan, O.; Guney, Y.; Topcu, A.; Ozcelikors, Y. A rapid seismic safety assessment method for mid-rise reinforced concrete buildings. Bull. Earthq. Eng. 2018, 16, 889–915. [Google Scholar] [CrossRef]
  58. Hagan, M.T.; Demuth, H.B.; Beale, M.H.; De Jesús, O. Neural Network Design, 2nd ed.; Martin Hagan: Stillwater, OK, USA, 2014. [Google Scholar]
  59. Tastle, W.J.; Wierman, M.J. Consensus and dissention: A measure of ordinal dispersion. Int. J. Approx. Reason. 2007, 45, 531–545. [Google Scholar] [CrossRef]
  60. Hagan, M.T.; Menhaj, M.B. Training feedforward networks with the Marquardt algorithm. IEEE Trans. Neural Netw. 1994, 5, 989–993. [Google Scholar] [CrossRef]
  61. Demuth, H.B.; Beale, M.H. Neural Network Toolbox; For Use with Matlab; Computation, Visualization, Programming; User’s Guide, Version 4; Math Works: Natick, MA, USA, 2000. [Google Scholar]
  62. Lopez, C.P. Deep Learning with Matlab. Neural Networks by Examples; Cesar Perez; Lulu.com: Morrisville, NC, USA, 2020. [Google Scholar]
  63. Allali, S.A.; Abed, M.; Mebarki, A. Post-earthquake assessment of buildings damage using fuzzy logic. Eng. Struct. 2018, 166, 117–127. [Google Scholar] [CrossRef]
  64. Harirchian, E.; Lahmer, T.; Kumari, V.; Jadhav, K. Application of support vector machine modeling for the rapid seismic hazard safety evaluation of existing buildings. Energies 2020, 13, 3340. [Google Scholar] [CrossRef]
  65. Özkan, E.; Demir, A.; Turan, M.E. A new ANN based rapid assessment method for RC residential buildings. Struct. Eng. Int. 2023, 33, 32–40. [Google Scholar] [CrossRef]
Figure 1. The structure of the consensus-based Likert–ANN model, only the output processing frame was adapted from Hagan et al., 2014 [58].
Applsci 14 06492 g001
Figure 2. Model’s LMBP training flow adapted from Hagan et al. [58] and Demuth et al. [61].
Applsci 14 06492 g002
Figure 3. A view of the model’s input and output values.
Applsci 14 06492 g003
Figure 4. NND design, training parameters, and stopping criteria.
Applsci 14 06492 g004
Figure 5. The model’s initial and final parameters.
Applsci 14 06492 g005
Figure 6. Model’s neural network performance graph.
Applsci 14 06492 g006
Figure 7. Target–output graph after training.
Applsci 14 06492 g007
Disclaimer/Publisher’s Note: The statements, opinions and data contained in all publications are solely those of the individual author(s) and contributor(s) and not of MDPI and/or the editor(s). MDPI and/or the editor(s) disclaim responsibility for any injury to people or property resulting from any ideas, methods, instructions or products referred to in the content.

