Article

Looking for Microbial Biosignatures in All the Right Places: Clues for Identifying Extraterrestrial Life in Lava Tubes

by
Joseph J. Medley
1,
Jennifer J. M. Hathaway
1,
Michael N. Spilde
2 and
Diana E. Northup
1,*
1
Department of Biology, University of New Mexico, Albuquerque, NM 87131, USA
2
Institute of Meteoritics, University of New Mexico, Albuquerque, NM 87131, USA
*
Author to whom correspondence should be addressed.
Appl. Sci. 2024, 14(15), 6500; https://doi.org/10.3390/app14156500
Submission received: 5 February 2024 / Revised: 12 July 2024 / Accepted: 15 July 2024 / Published: 25 July 2024
(This article belongs to the Special Issue Geomicrobiology: Latest Advances and Prospects)

Abstract

:
Lava caves are home to a stunning display of secondary mineral speleothems, such as moonmilk and coralloids, as well as highly visible microbial mats. These features contain diverse and under-characterized groups of bacteria. The role of these bacteria in the formation of secondary mineral speleothems is just beginning to be investigated. The lava caves of the Big Island of Hawai`i and in El Malpais National Monument, New Mexico (USA), share many morphologically similar speleothems. This study focused on investigating the overlap in bacteria across a wide range of speleothems in these two geographically distant sites. Through scanning electron microscopy (SEM) and 16S rRNA gene analysis, we found that Hawaiian caves have a greater alpha diversity and beta diversity separated by cave and speleothem type. Many Actinobacteriota were in higher abundance in New Mexico caves, while Hawaiian caves contained more bacteria that are unclassified at the genus and species level. Discovering the diversity in bacteria in these secondary speleothems will assist in identifying cave secondary mineral formations that may be good candidates for finding life on extraterrestrial bodies.

1. Introduction

Globally, lava caves host a variety of secondary mineral and microbial deposits, which harbor a diversity of microbial life and provide insights into microbial–mineral interactions. Initial studies of microbial life in lava caves have focused on microbial mats, especially in Hawai`i, USA and the Azores, Portugal [1]; El Malpais National Monument (ELMA) in western New Mexico, USA [2]; and Lava Beds National Monument, California, USA [3]. The earliest studies of microbial mats, called “slimes” in lava caves, were conducted by Staley and Crawford [4] using cultivation to isolate bacteria and fungi, and later by Howarth [5]. Northup and colleagues conducted studies of microbial mats beginning in the late 1990s in the lava caves of ELMA [2]. Studies of lava cave microbial mats expanded globally to Kauai, Hawai`i, USA [6]; the Canary Islands, Spain [7]; Jeju Island, Korea [8]; and Mount Etna, Sicily, Italy [9]. Overlying soil microbial communities also have been compared with microbial mats in underlying lava caves, which revealed minimal overlap between bacterial communities in the surface soil and in the cave [3].
Microbial ecological exploration of lava caves evolved beyond the highly colorful and visible microbial mats to include secondary mineral growths, e.g., mineral crusts and coralloids. These morphology types are common in caves worldwide and are frequently found in lava tubes as well as other cave types [10]. A growing number of cave studies using a variety of techniques, including DNA sequencing and scanning electron microscopy (SEM) imaging, have shown that such secondary cave features harbor a diverse assortment of microorganisms. These studies have investigated silicified microbial morphologies in various secondary minerals such as coralloids [11,12,13], while other investigations of microbial diversity in lava caves included a study of sediment from Mt. Erebus, Antarctica [14]; coralloid, crusts, and moonmilk from the Galapagos Islands, Ecuador [15]; opaline stromatolites in Mexico [16]; ooze, microbial mats, and moonmilk from the Canary Islands, Spain [17]; and a variety of secondary mineral deposits in Craters of the Moon National Monument and Preserve, USA [18]. Together, these studies are starting to paint a picture of the incredible diversity of organisms in lava caves and beginning to elucidate the roles these organisms play in the cave ecosystem, especially in the creation of secondary mineral deposits. Few studies, however, have investigated multiple morphology types from a single cave.
As with lava caves elsewhere in the world, Hawaiian and New Mexican lava caves have been fruitful research sites for investigating a variety of different microbial mats; secondary mineral deposits, including copper silicates and calcitic moonmilk; along with wall features such as gold-colored mineral veins, coralloids, and ooze. The indication of microbial activity in various secondary mineral deposits suggests that microbial presence and geomicrobiological interactions may contribute to the formation of these secondary minerals found in caves [10,19].
We hypothesize that six commonly occurring and highly visible features (i.e., moonmilk, mineral crusts, coralloids, spheroids, microbial mats, and ooze), found in lava caves in New Mexico and Hawai`i, contain microbial life that may influence the physical and mineralogical differences between these features. Based on this hypothesis, we posit that several secondary morphologies (Figure 1) could provide the basis for scientists to effectively design rovers and software to identify viable targets for sampling in lava caves on Mars and other extraterrestrial bodies. Boston et al. [20] proposed that one of the best places to search for evidence of extant or extinct life on Mars was in the subsurface. Such caves could have formed during Mars’ history when volcanism was more active, and the climate was wetter and warmer. Subsurface environments would also provide refuge from the extreme conditions on the surface of Mars. Over the last decades, many lava-cave openings have been detected on the surface of Mars [21,22]. Techniques and equipment to conduct these studies of subsurface environments on Mars to investigate these targets are underway.
To evaluate these hypotheses, we chose three lava caves, from each of our two locations, from which to collect samples: three lava caves from El Malpais National Monument, New Mexico, USA, and another three from the Kanohina System on the Big Island of Hawai`i. The sample types included microbial mats, ooze, and secondary mineral deposits. We have used SEM analysis to confirm and describe microbial morphologies found at the samples’ surfaces to establish a relationship between possible microorganisms and the mineral matrix itself. We also performed 16S rRNA gene sequence analysis to analyze and quantify microbial life within each type of secondary feature.

2. Materials and Methods

2.1. Site Description and Sample Collection

2.1.1. Site Description El Malpais National Monument, New Mexico, USA

New Mexico sampling was performed in the lava caves of El Malpais National Monument (ELMA), located at 34°53′ N 107°55′ W and approximately 55 km south–southwest of Grants, New Mexico, USA, in the Zuni-Bandera volcanic field. This basaltic lava field on the edge of the Rio Grande Rift [23] consists of pahoehoe and A`a lava flows from three eruptive episodes: the oldest dating to ca. 700 ka, a middle one at ca. 150 ka, and the youngest at ca. 80 ka to 3 ka or younger [23,24]. We sampled lava caves in the Bandera flow, which has been dated at between 9.5 and 11.2 ka [23,25], and in the Hoya de Cibola flow, which occurred at approximately 18 ka (Polyak, personal communication). Samples were collected from A`a Cave, Four Windows Cave, and Pantheon Cave, which are smaller, discrete caves with less complexity than those studied in Hawai`i. The caves occur at approximately 2300 m elevation in a region that is semi-arid (precipitation averaging 381 mm/year) with hot summers and cold winters. Cave temperatures at the time of sampling ranged from −0.28 °C to +4.94 °C. Relative humidity at sample sites averaged 94% (Table S1).

2.1.2. Site Description Hawai`i, USA

The Big Island of Hawai`i, USA, in the Pacific Ocean located at 19°43′ N 155°5′ W, was formed by five shield volcanoes, mainly composed of tholeiitic basalt. Sampling was performed in the Kula Kai Caverns and the Maelstrom and Tapa sections of the Kipuka Kanohina Cave Preserve (KKCP), on the south flank of Mauna Loa. The Hawaiian lava caves sampled occur between 330 m and 415 m in elevation, experience surface precipitation of 710–740 mm/year on average, and have a cave temperature that varies from 18 °C to 20 °C (Table S1). The length of the surveyed, connected cave passages is currently 29 miles, consisting of an amalgamation of interconnected lava tubes.

2.1.3. Sampling

Six different morphologies were sampled within the ELMA caves in New Mexico: moonmilk, mineral crusts, coralloids, microbial mats, and ooze. In addition to these morphologies, spheroids were sampled in KKCP in Hawai`i (Figure 1). Moonmilk is hypothesized to be the result of biotic and abiotic interactions. It is described as a generic term for a moist, fine-grained mineral deposit found on the walls and floors of caves and varies in texture from paste-like to crusty [10,26]. Soft moonmilk occurs on walls and ceilings of lava caves and has the appearance of white, fluffy cotton balls. Crusty moonmilk can be found on walls, ceilings, and floors of lava caves. It can be hard and dense, or it can be granular mineral deposits. Moonmilk is generally extremely friable. Mineral crust describes a relatively flat, secondary mineral formation on the walls and ceiling of a lava cave that lacks obvious visual microbial morphologies. Coralloid designates any general coral-like or nodular protrusion from a cave wall or floor [27]. Microbial mats are microbial colonies that range from small, pointillistic colonies to large swaths of hydrophobic, microbial colonies that tend to reflect light [2,28]. Ooze, an understudied feature in lava caves, can be found underneath microbial mats or in depressions in the basalt walls with textures that range from gelatinous to slimy [1,29]. Ooze has been hypothesized to represent material from the surface above the cave seeping through [29]. Spheroids, also known as “gypsum balls”, as described in Hill and Forti [30], are spherical secondary gypsum mineral deposits observed in KKCP, ranging in size from less than a millimeter to over a centimeter in diameter.
Samples of each category described above were collected from unobtrusive locations in each of these caves, using clean nitrile gloves for each sample and an ethanol flame-sterilized chisel, tweezers, or scoopula. In each location, two samples were collected: one for 16S rRNA gene analysis and another for SEM analysis. For SEM samples, chips of mineral deposit or wall rock with microbial deposits were placed in a 2 oz Whirl-Pak, which was carefully folded and placed in a sterile 50 cc BD Falcon™ Tube (Corning Inc., Corning, NY, USA) for transport to the lab. For 16S rRNA gene analysis, approximately 5–10 cc of material was collected for each sample, placed directly into a sterile 50 mL BD Falcon™ tube, and covered in sucrose lysis buffer (SLB) to preserve the DNA [31]. Genetic samples from El Malpais were transported to the lab within 48 h and stored at −80 °C until ready for DNA extractions. Hawaiian samples were frozen until transported to the lab, where they were stored at −80 °C.

2.2. Scanning Electron Microscopy and Energy Dispersive X-ray Spectroscopy

Depending on moisture content, SEM samples were either air-dried or vacuum-dried using a Precision Scientific Company (Winchester, VA, USA) Model 19 Thelco Vacuum Oven at a temperature of 60° C and in a vacuum of 25 inches Hg for 12 h. The samples were mounted on aluminum SEM stubs using a hot glue gun and stored in a desiccator until analyzed.
Samples were imaged using a TESCAN VEGA3 (TESCAN USA, Warrendale, PA, USA) scanning electron microscope (SEM) equipped with an IXRF (IXRF Systems, Austin, TX, USA) energy-dispersive X-ray spectrometer (EDS). EDS was used to confirm and describe microscopic morphologies found in the samples and establish their relationship to the mineral matrix itself. The mounted samples were coated with a gold–palladium alloy, using a low-vacuum evaporation coating technique employing an EMITECH K950X Turbo Evaporator (Quorum Technologies, Lewes, UK). Samples were analyzed at an accelerating voltage of 15 KeV using either back-scatter electron and/or secondary-electron detectors. A beam current of at least 2 nA was employed in EDS analyses, but imaging was performed at less than 1 nA.

2.3. Geochemistry

Samples of basalt lava were collected from the walls or floors of the sampled caves to be as representative as possible of the lava flows that formed the caves. Samples taken from the walls were collected with as little damage as possible to the cave. The samples were powdered in a Spex Shatterbox (Antylia Scientific company, Vernon Hills, IL, USA), mixed with a boron binder, and pressed into pellets. The pelletized samples were then analyzed on a Rigaku ZSX Primus II (Rigaku, Tokyo, Japan) wavelength dispersive X-ray fluorescence spectrometer.

2.4. DNA Extraction and Amplification

Samples were extracted using a QIAGEN™ dNeasy PowerSoil DNA Kit (Germantown, MD, USA). We followed the manufacturer’s procedure with two exceptions: a BioSpec Products Mini-Beadbeater-8™ was used for 1.5 min at medium intensity instead of the Vortex Adapter to enhance DNA extraction. Additionally, 50 µL of DIFCO powdered skim milk was incorporated into the extraction protocol, using the manufacturer’s preparation, before the bead-beating step to increase DNA yield [32]. To verify DNA quality, extracted DNA was amplified using polymerase chain reactions (PCR) of the 16S rRNA gene. Reactions were carried out in a 25 µL reaction mixture using 2 µL of dNTPs at 2.5 mM each (GeneAmp Applied Biosystems, Poway, CA, USA), 0.25 µL of 100x BSA (Invitrogen, Carlsbad, CA, USA), 0.1 µL of AmpliTaq™ DNA Polymerase (Applied Biosystems, Foster City, CA, USA), 2.5 µL of 10× PCR Buffer I (Applied Biosystems), and 0.3 µL of 50 mM primers—both universal bacterial primers 8F (5′-GTGYCAGCMGCCGCGGTAA-3′) and 1492R (5′-GTGYCAGCMGCCGCGGTAA-3′). PCR reactions were run using an Eppendorf® (Hamburg, Germany) Mastercycler thermocycler with the following conditions: five-minute denaturation at 94 °C, followed by 30 cycles of 30 s at 94 °C for denaturation, another 30 s at 55.5 °C for annealing, and one minute 30 s at 72 °C for extension with a final seven minutes at 72 °C for extension after cycling was complete [3].

2.5. Sequencing and Phylogenetic Analyses

Sequencing of extracted DNA was performed at MR DNA (www.mrdnalab.com, Shallowater, TX, USA on 18 February 2019 and 8 July 2019) using MiSeq sequencing following the manufacturer’s guidelines. Sequence data were processed using MR DNA’s analysis pipeline (MR DNA, Shallowater, TX, USA). The primers 515F (5′-GTGYCAGCMGCCGCGGTAA-3′) and 806R (5′-GGACTACNVGGGTWTCTAAT-3′) were used to target the V4 region of the 16S rRNA gene of bacteria. These primers were used in a single-step, 30-cycle PCR using the HotStarTaq™ Plus Master Mix Kit (Qiagen, Germantown, MD, USA) as follows: 94 °C for three minutes, followed by 30–35 cycles of 94 °C for 30 s, 53 °C for 40 s, 72° C for one minute, and a final elongation step at 72 °C for five minutes. After amplification, PCR products were checked in a 2% agarose gel to determine the success of amplification and the relative intensity of bands. Pooled samples were purified using calibrated Ampure XP beads (BECKMAN COULTER Life Sciences, Indianapolis, IN, USA). The pooled and purified PCR product was used to prepare the Illumina DNA library.
A Quantitative Insights into Microbial Ecology 2, version 2022.11 (QIIME2) [33], pipeline was implemented using the SILVA release 138 database (https://www.arb-silva.de/documentation/release-138/) [34], as well as DADA2, version 1.10.0 [35], to prepare the data for analysis. QIIME2 was used to demultiplex samples and assign barcodes based on sample identification. DADA2 was used to separate demultiplexed samples into amplicon sequence variants (ASVs), and the primers were removed. ASVs were selected over OTUs for reasons outlined in Callahan, et al. [36]. Visualizations and artifacts were then produced by QIIME2 in order to describe the data. Sampling depths were set to 40,000 features per sample for all bacterial analyses. Subsequent analyses were performed in rStudio, version 2023.09.1+494, using vegan (version 2.6-6.1), fossil (version 0.4.0), ggplot2 (version 3.5.1), reshape2 (version 1.4.4), phyloSeq (version 1.48.0), metagenomeSeq (version 1.46.0), and DESeq2 (version 1.44.0) packages [37,38,39,40,41,42,43,44,45], as well as Microsoft Excel (version 16.86).
Statistical significance in alpha diversity was determined using a non-parametric, pairwise, Wilcoxon test by means of the function wilcox.test under the core R stats package. The alpha was set to 0.05, and we rejected the null hypothesis (i.e., no statistical difference between the two datasets existed) in favor of the alternate hypothesis (i.e., there existed a statistical significance between the two datasets), if the comparison yielded a p-value greater-than or equal-to our predetermined alpha.
Statistical testing in our beta diversity was performed using a PERMANOVA, as outlined by Anderson [46,47]. Multivariate homogeneity of group distances was calculated using the R package, “vegan”, and the function “betadisper” as well as the functions “anova” and “TukeyHSD,” to test for homogeneity of dispersions, as the design was unbalanced (unequal number of samples in each group). Results exhibiting homogeneity of group distances were then tested with a PERMANOVA test, using the adonis2 function in vegan. Results were considered significant when p-values were at or below our alpha (0.05).

3. Results

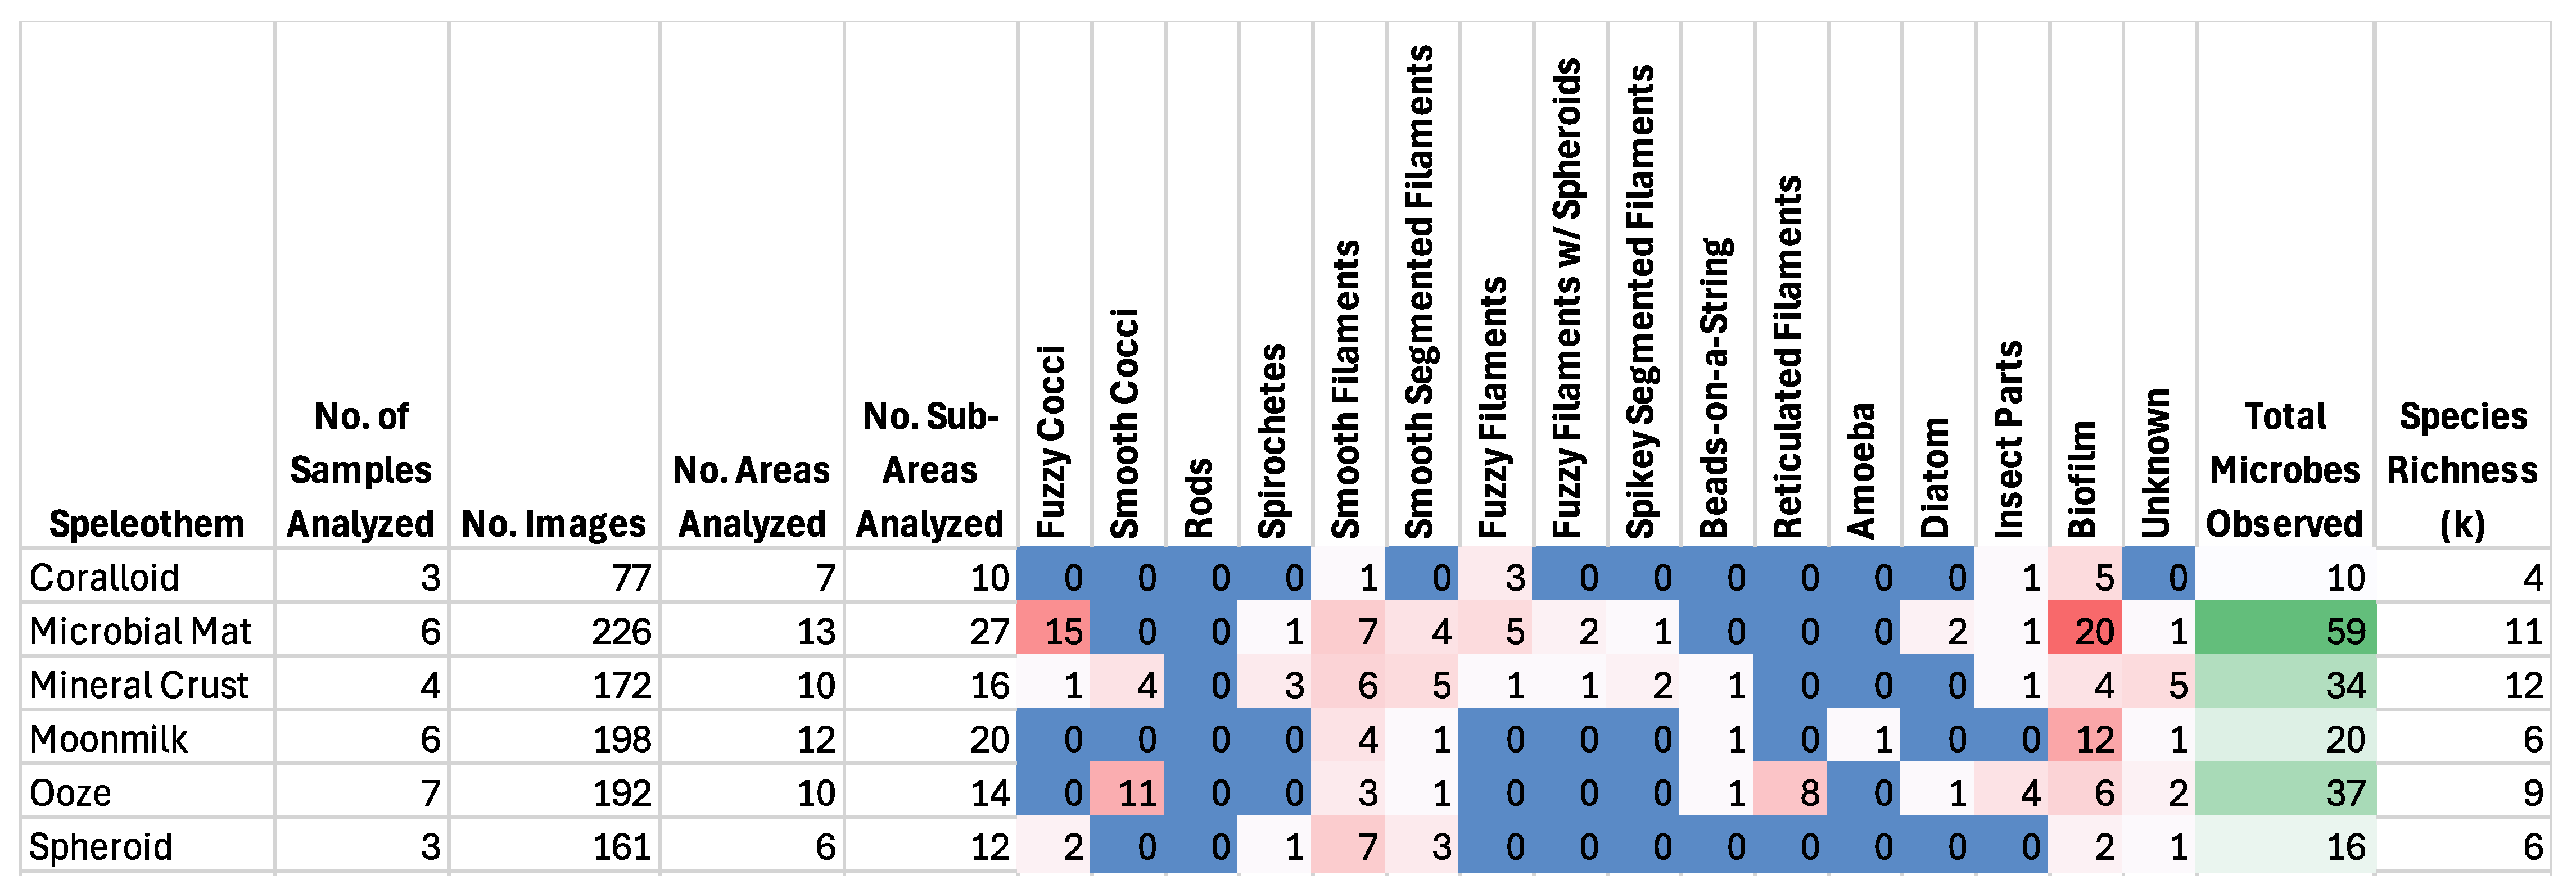
3.1. General Results

New Mexican samples averaged about 74,982 counts per sample (median 76,071 counts), ranging from 46,998 to 94,064 counts and a sum total of 1,499,635 counts across all samples. Hawaiian samples had an average count total of 107,012 counts (median 114,381 counts), with a range of 55,516 to 138,493 counts and a total of 2,140,258 counts across all samples (Table S2).
Climate conditions between both locations, Hawai`i and New Mexico, are worth noting as well. Caves in New Mexico were more than 10 °C cooler, in both wet- and dry-bulb readings, than those found in Hawai`i. Not only that, but caves in New Mexico were almost 2000 m higher than those found on the island of Hawai`i. Furthermore, Hawai`i averaged almost four times the amount of rainfall (in mm) as that experienced in New Mexico.
The diversity was overall higher in Hawaiian samples when compared to New Mexican samples. Alpha diversity was especially low in Kula Kai when compared to the other Hawaiian samples, while the beta diversity ordination demonstrated similar results—four samples from Kula Kai stand half-way between the centroids of the data for New Mexican and Hawaiian samples.

3.2. Alpha Diversity

Various alpha diversity indices show that the diversity between Hawaiian and New Mexican lava caves, at the local scale of the sample type, differs significantly.
Inverse Simpson, library size, and species richness (Figure 2) help to demonstrate that the diversity of microbes found within both Maelstrom and Tapa caves in Hawai`i are different from those found in A`a, Pantheon, and Four Windows caves in New Mexico. When a Wilcoxon Test was used, both library sizes and species richness measures were significantly different (p < 0.05) between New Mexican and Hawaiian caves, with the exception of Kula Kai. A Wilcoxon test demonstrates that Kula Kai is not only different from the other Hawaiian samples, but it groups with the New Mexican caves.
Looking at sample types between Hawai`i and New Mexico, while not statistically significant in all cases (by means of a Wilcoxon test), we do notice lower diversity, species richness, and overall library sizes in all New Mexican speleothems relative to their Hawaiian speleothem counterparts (with the exception of Kula Kai).
The different sample types do vary in terms of alpha diversity, but those differences are not significantly different, statistically.

3.3. Beta Diversity

Non-Metric Multidimensional Scaling (NMDS) analyses revealed a clear separation between the lava caves of Hawai`i and New Mexico (Figure 3). According to McCune and Grace [48], NMDS should be the go-to beta diversity ordination for ecologists. When these data were analyzed by cave, Hawai’i and New Mexico caves had separate centroids. Similar to observations made in our alpha diversity analysis, Kula Kai stands out from the rest of the Hawaiian caves. Kula Kai overlaps slightly with New Mexico samples but does so, more extensively, with the Hawaiian samples. The four samples from Kula Kai do not group with Hawaiian or New Mexican samples. Instead, they are found to reside between the two locations (Figure 3). The sample types of those outliers are moonmilk, a mineral crust, a microbial mat, and a coralloid. The samples from Kula Kai that are well within the Hawai`i groupings are two spheroids and an ooze.
We confirmed that both locations (Hawai`i and New Mexico) were significantly different by establishing a Bray–Curtis dissimilarity matrix, thus allowing for statistical hypothesis testing. Applying a permutational analysis of variance (PERMANOVA) [37] showed that the two locations were significantly different from one another (p < 0.05) (Figure 3). Additionally, if we apply the same PERMANOVA to analyze the difference between speleothems, we obtain a variety of results (Figure 4). However, the more curious results are that mineral crusts are not significantly different from any of the speleothems, with the exception of spheroids, which are significantly different from all other speleothems.
When divided out by cave feature (Figure 4), the NMDS demonstrated a visual delineation between ooze, moonmilk, spheroids, and microbial mats, across both New Mexican and Hawaiian samples. Coralloids have a bit of overlap with spheroids, microbial mats, and moonmilk. Mineral crusts overlap with almost everything, excluding spheroids. Using a PERMANOVA hypothesis test with an alpha of 0.05, we can establish that spheroids are statistically different (rejecting the null hypothesis) from everything within the dataset (p < 0.05). In the case of mineral crusts, we failed to reject the null hypothesis in all speleothem comparisons, with the exception of spheroids (p > 0.05). In the case of coralloids, we reject the null hypothesis in favor of the alternate hypothesis in only the cases of ooze and spheroids (p < 0.05). Moonmilk is statistically different from ooze, spheroids, and microbial mats.

3.4. Relative Abundance

Although there is considerable overlap in the most abundant genera present across these six caves and between Hawaiian and New Mexican caves, there are several genera that showed differences in abundance across sites. Of particular note is the genus Blastocatella, which was much higher in the New Mexican caves, and only present in a much lower amount in the three Hawaiian caves (Figure 5). Other genera present in higher amounts in the New Mexican caves were Bryobacter, Rubrobacter, Micrococcaceae, Crossiella, unclassified 67-14, and Candidatus Udaeobacter. Hawaiian samples have considerably more Candidatus Omnitrophus, Gemmataceae, Vicinamibacteraceae, CCM11a, and PLTA13.
Additionally, there are some differences among speleothems depending on where they come from (Figure 6). Coralloid microbial composition differs between Hawai`i and New Mexico, in that Hawaiian samples contained Candidatus Omnitrophus, CCM11a, and NB1-j. Additionally, the bacterial analysis of Hawaiian coralloids had more abundant Nitrospira, unclassified Alphaproteobacteria, Gemmataceae, and Longimicrobiaceae than New Mexican coralloids. Meanwhile, New Mexican coralloids were more abundant in Rubrobacter, 67-14, and JG30-KF-CM45 than Hawaiian coralloids.
Microbial mats also differ between New Mexico and Hawai`i in that Hawaiian samples contained Candidatus Omnitrophus, AKYG1722, NB1-j, and Zixibacteria—all of which are not found in New Mexican microbial mats. Additionally, Hawaiian samples were more abundant than New Mexican samples in MND1, Nitrospira, and unclassified Alphaproteobacteria. New Mexican samples had more Bryobacter, Crossiella, Rubrobacter, Solirubrobacter, and 67-14.
Mineral crusts differ between our two locations in a few ways. Hawaiian samples contained Longimicrobiaceae, Nitriliruptoraceae, and PLTA13, all of which were not found in New Mexican samples. More abundant in Hawai`i than in New Mexico were Candidatus Omnitrophus, unclassified Alphaproteobacteria, and NB1-j; whereas New Mexican samples were more abundant in Bryobacter, Rubrobacter, Solirubrobacter, and 67-14.
Moonmilk, on the other hand, was very different in terms of microbial composition, as the Hawaiian moonmilk had lower numbers of bacteria that had been found more within New Mexican samples. We found Candidatus Omnitrophus, Gemmataceae, CCM11a, and NB1-j to be present exclusively within Hawaiian moonmilk. In comparison with the New Mexico samples, we found MND1, Solirubrobacter, unclassified Acidimicrobiia, unclassified Alphaproteobacteria, Gemmatimonadaceae, Longimicrobiaceae, IMCC26256, PLTA13, and wb1-P19 to be more abundant in Hawai`i. In addition, Rubrobacter, AKYG1722, unclassified Euzebyaceae [49], Micrococcaceae, and Nitriliruptoraceae were more abundant in New Mexico.
Ooze was also slightly different in that Solirubrobacter and Longimicrobiaceae were only found in Hawai`i, whereas Candidatus Omnitrophus, Acidimicrobiia, unclassified Alphaproteobacteria, and Gemmataceae were more abundant in Hawai`i than New Mexico. More abundant in New Mexico were MND1, AKYG1722, BSV26, Micrococcaceae, and Zixibacteria.

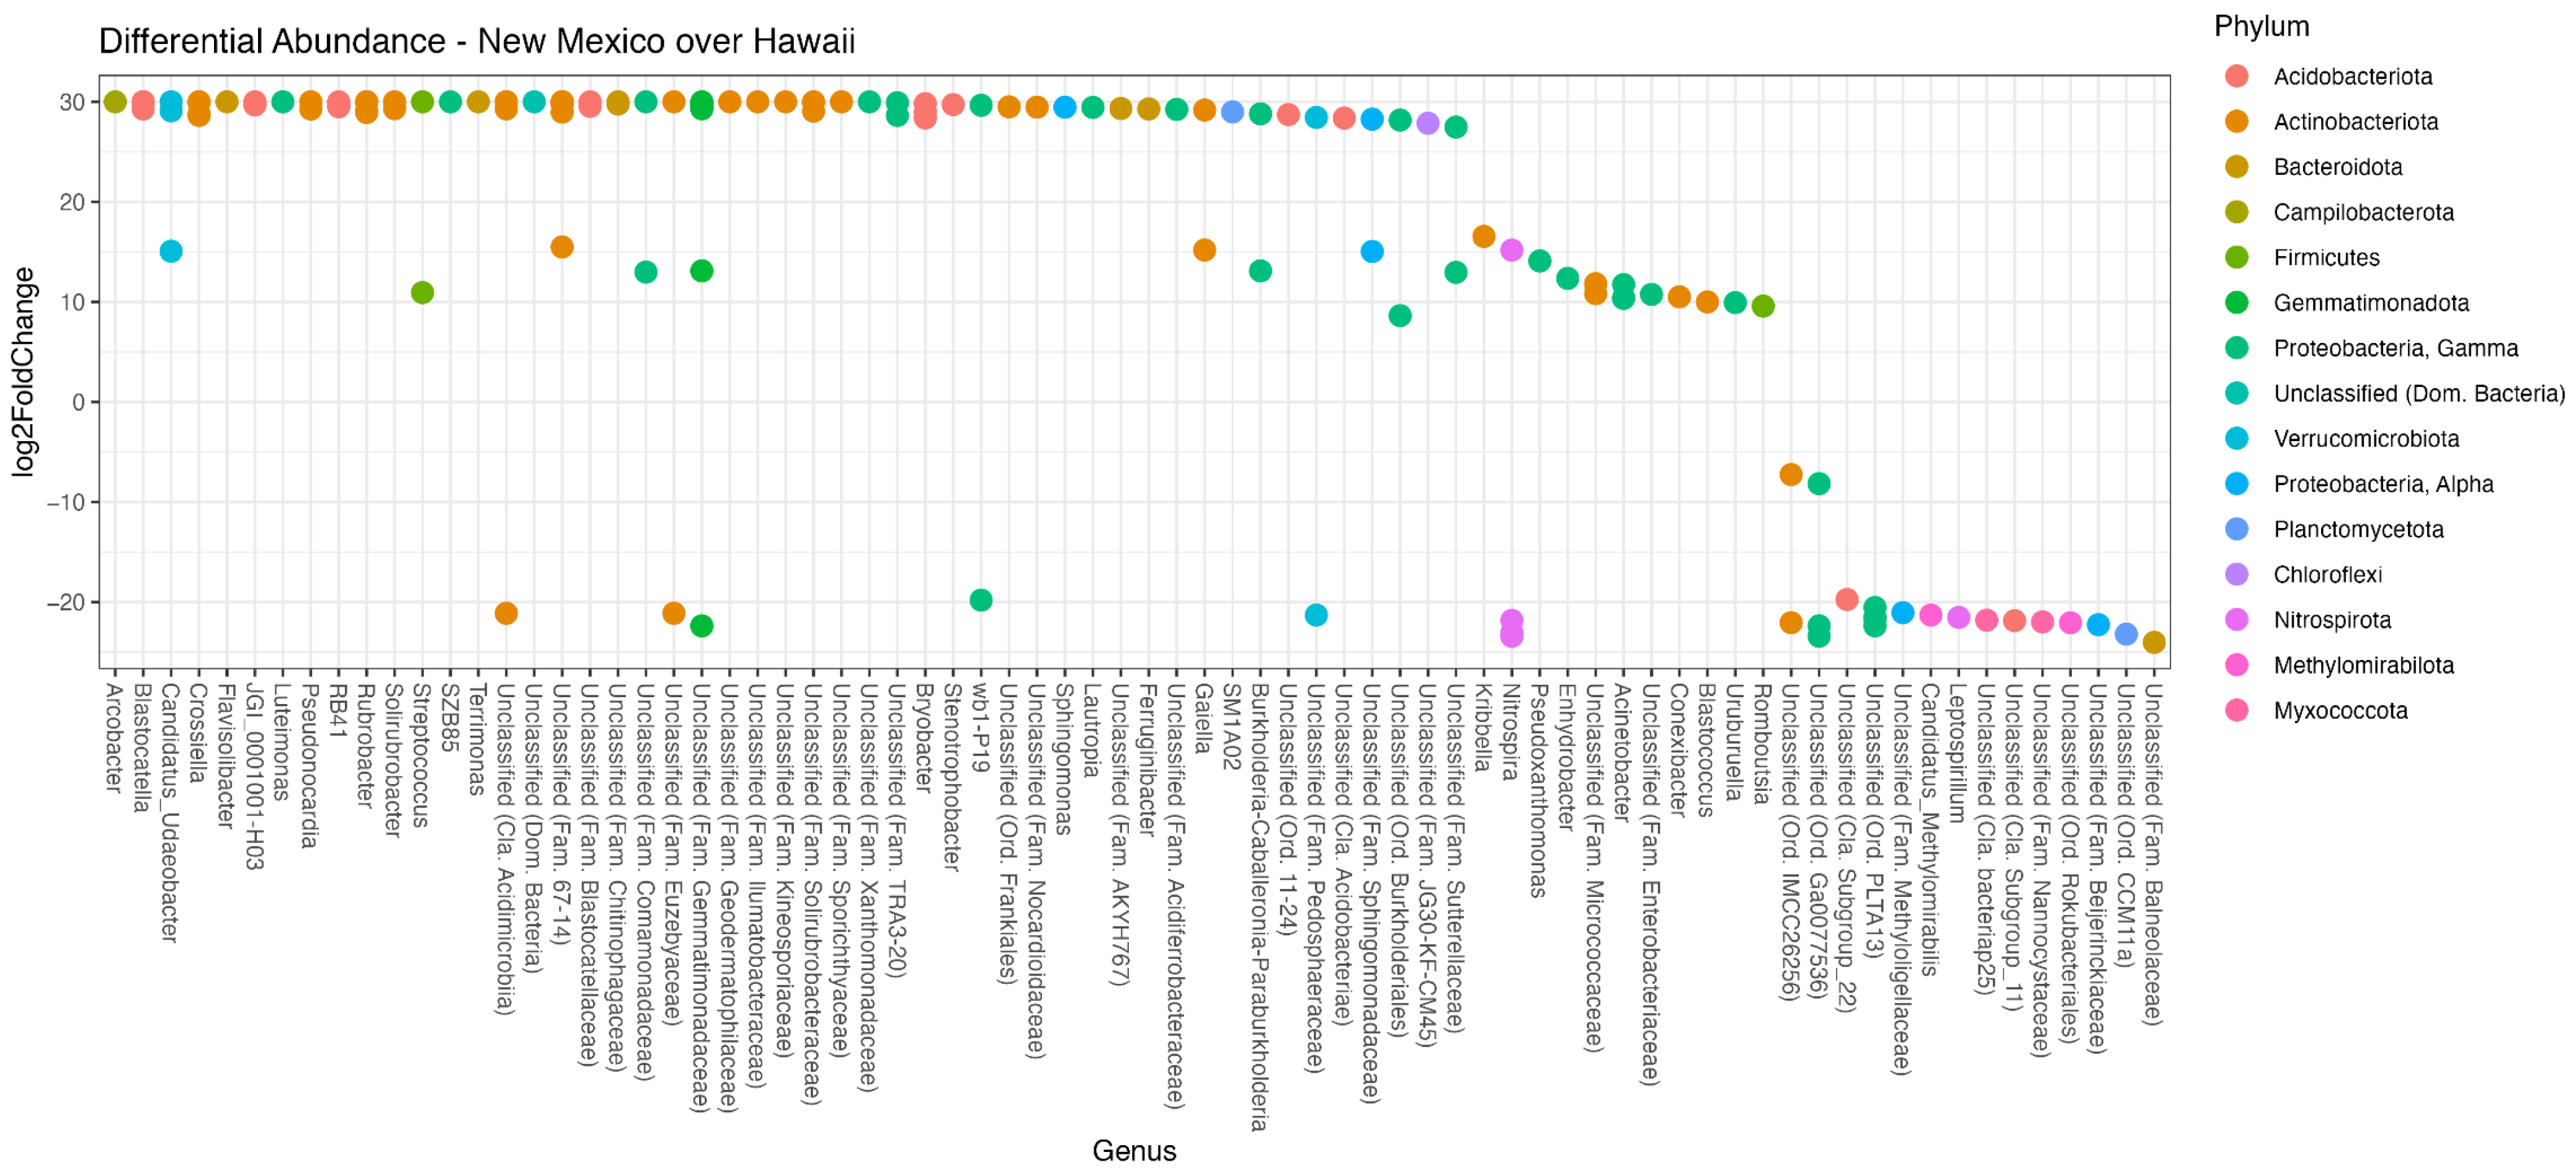
3.5. Differential Abundance Analysis
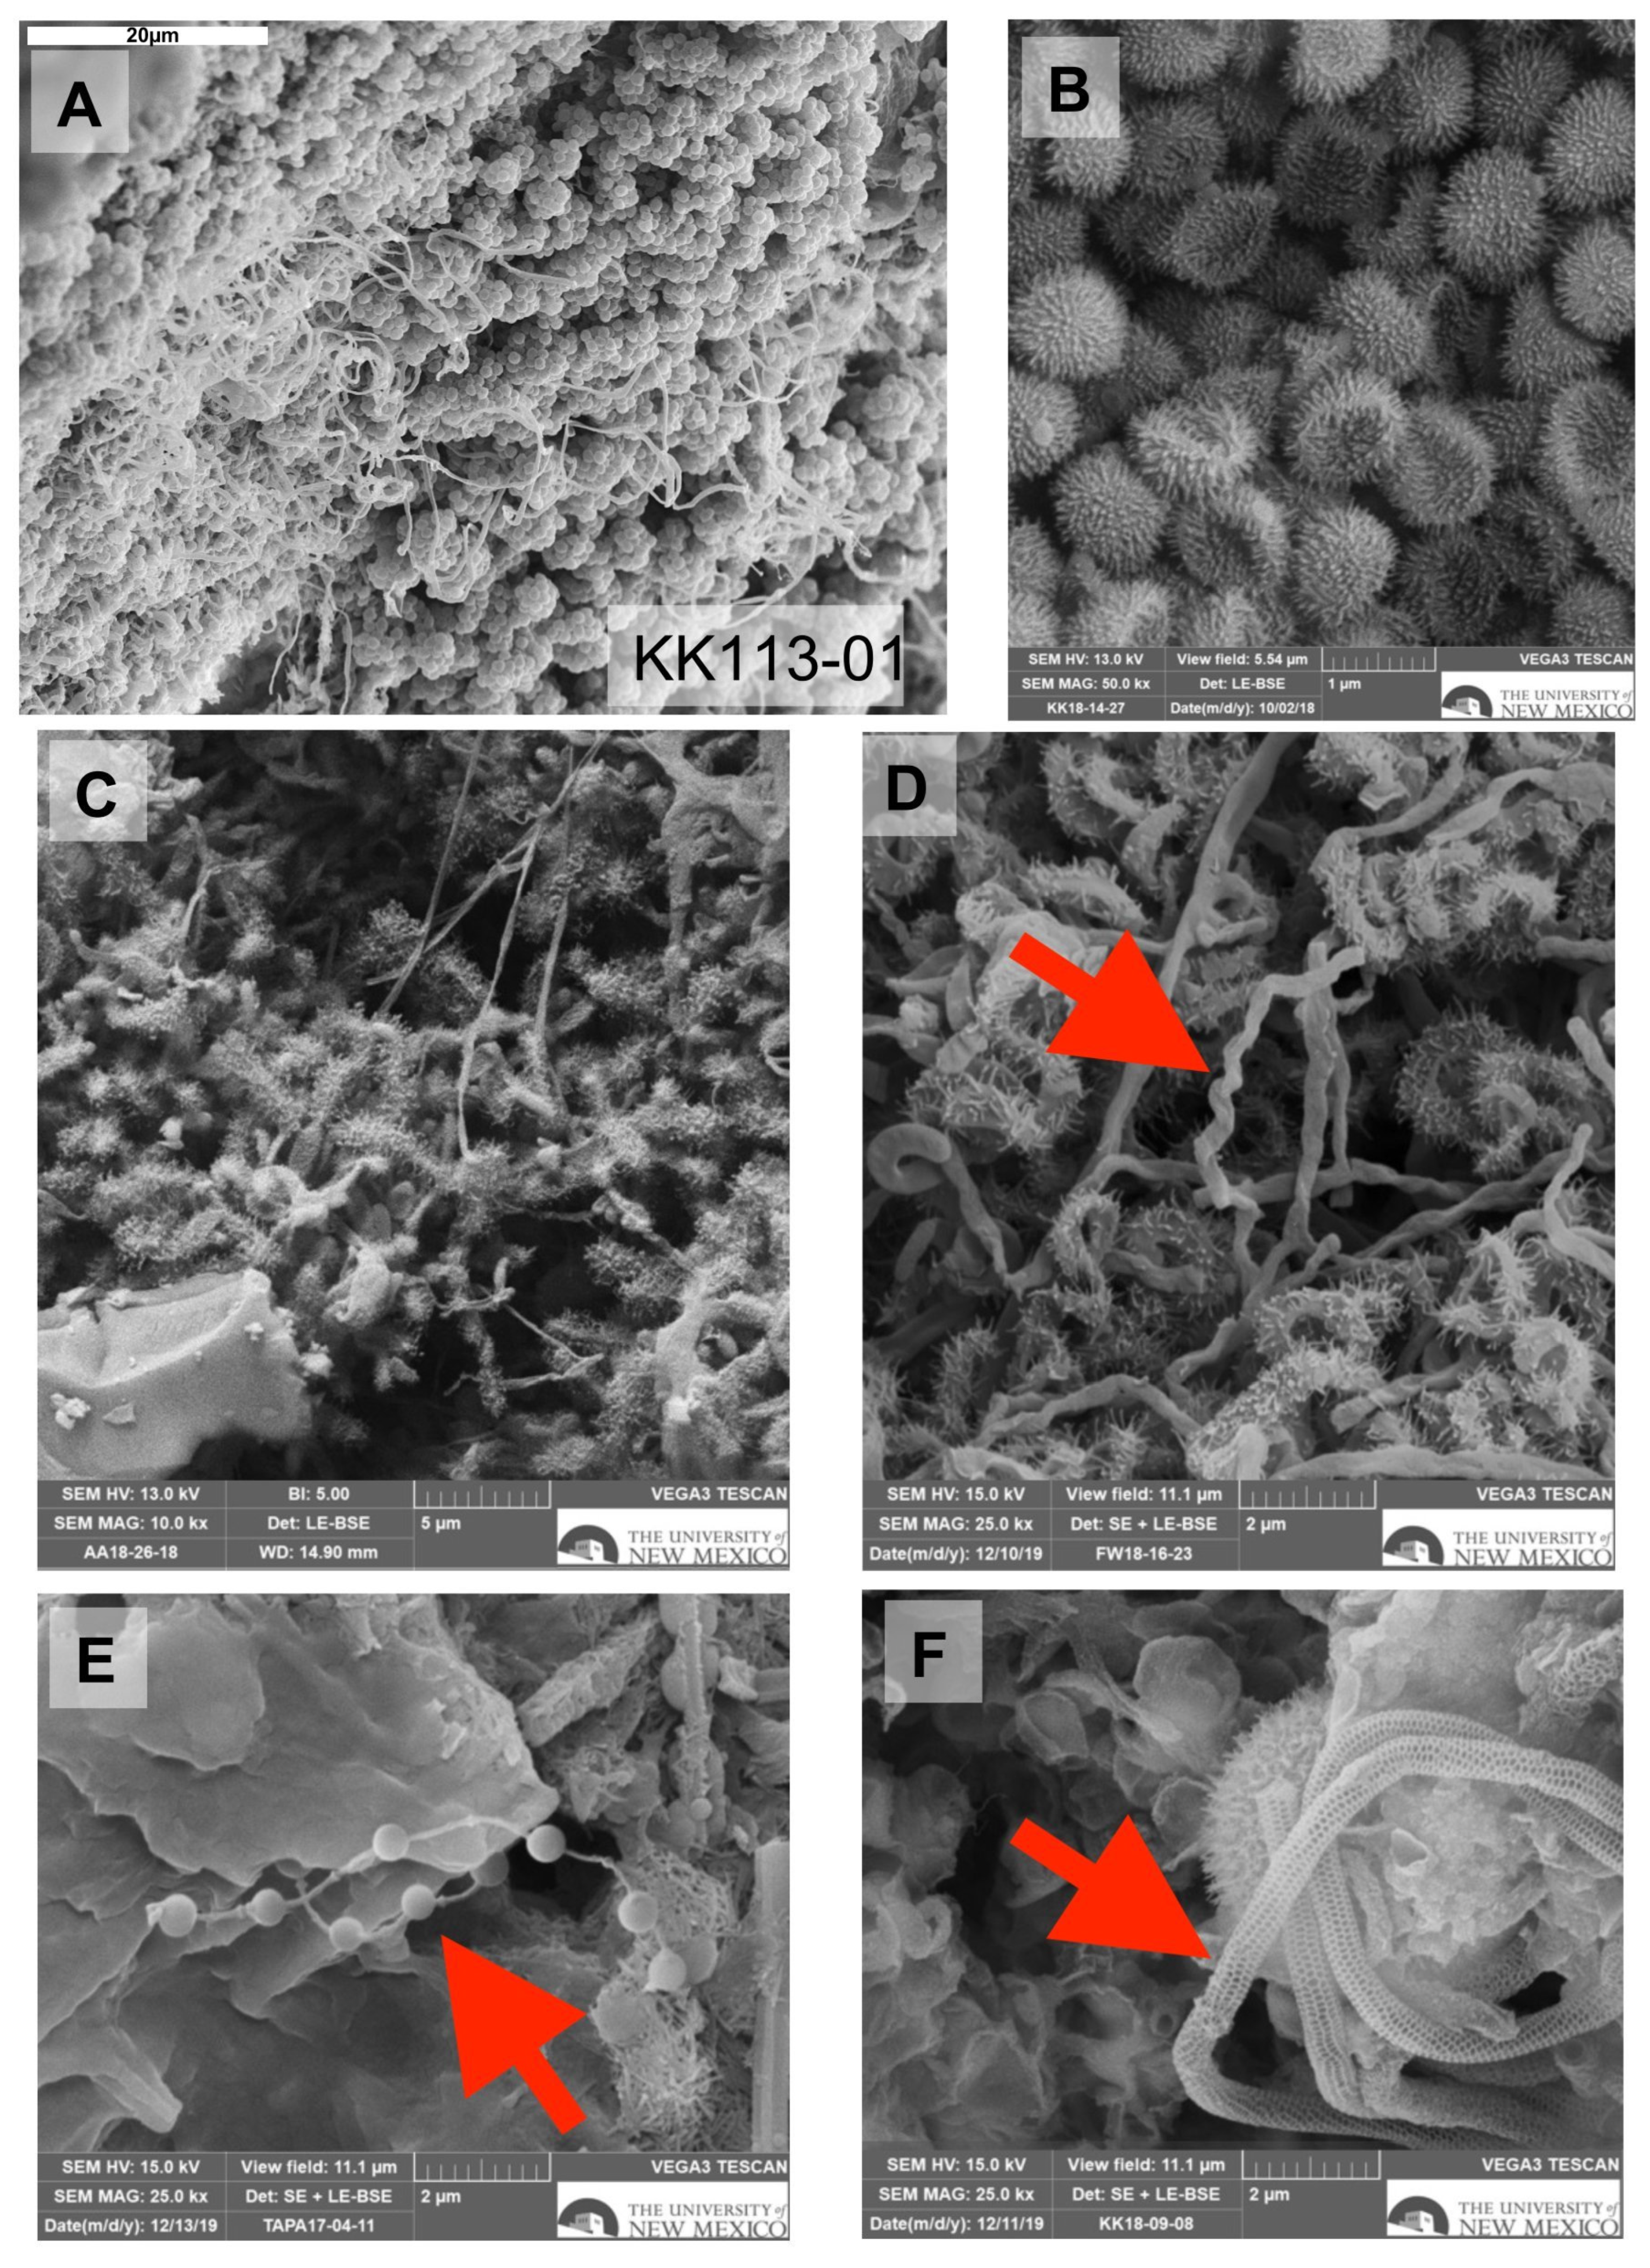
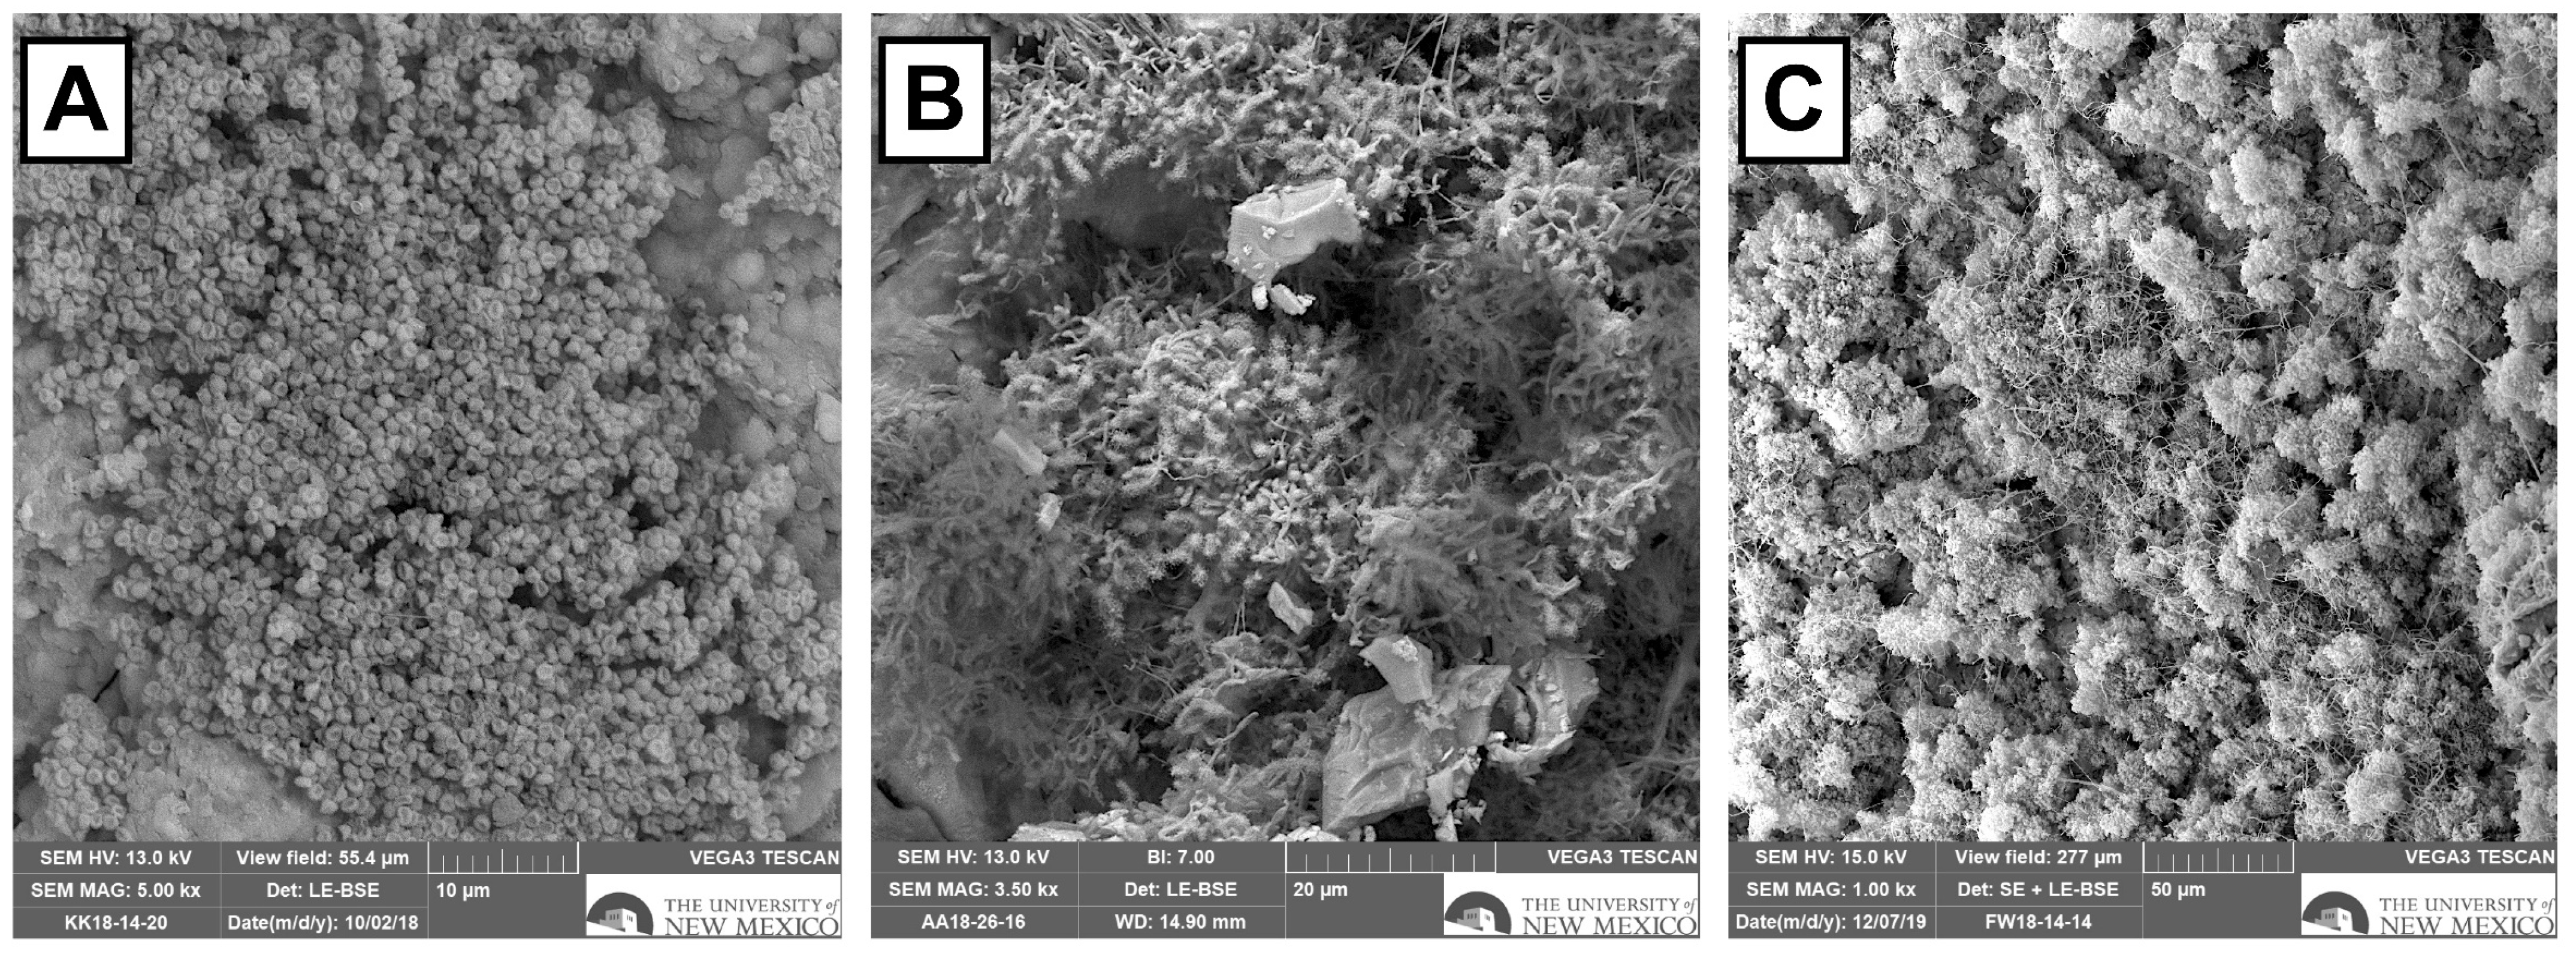
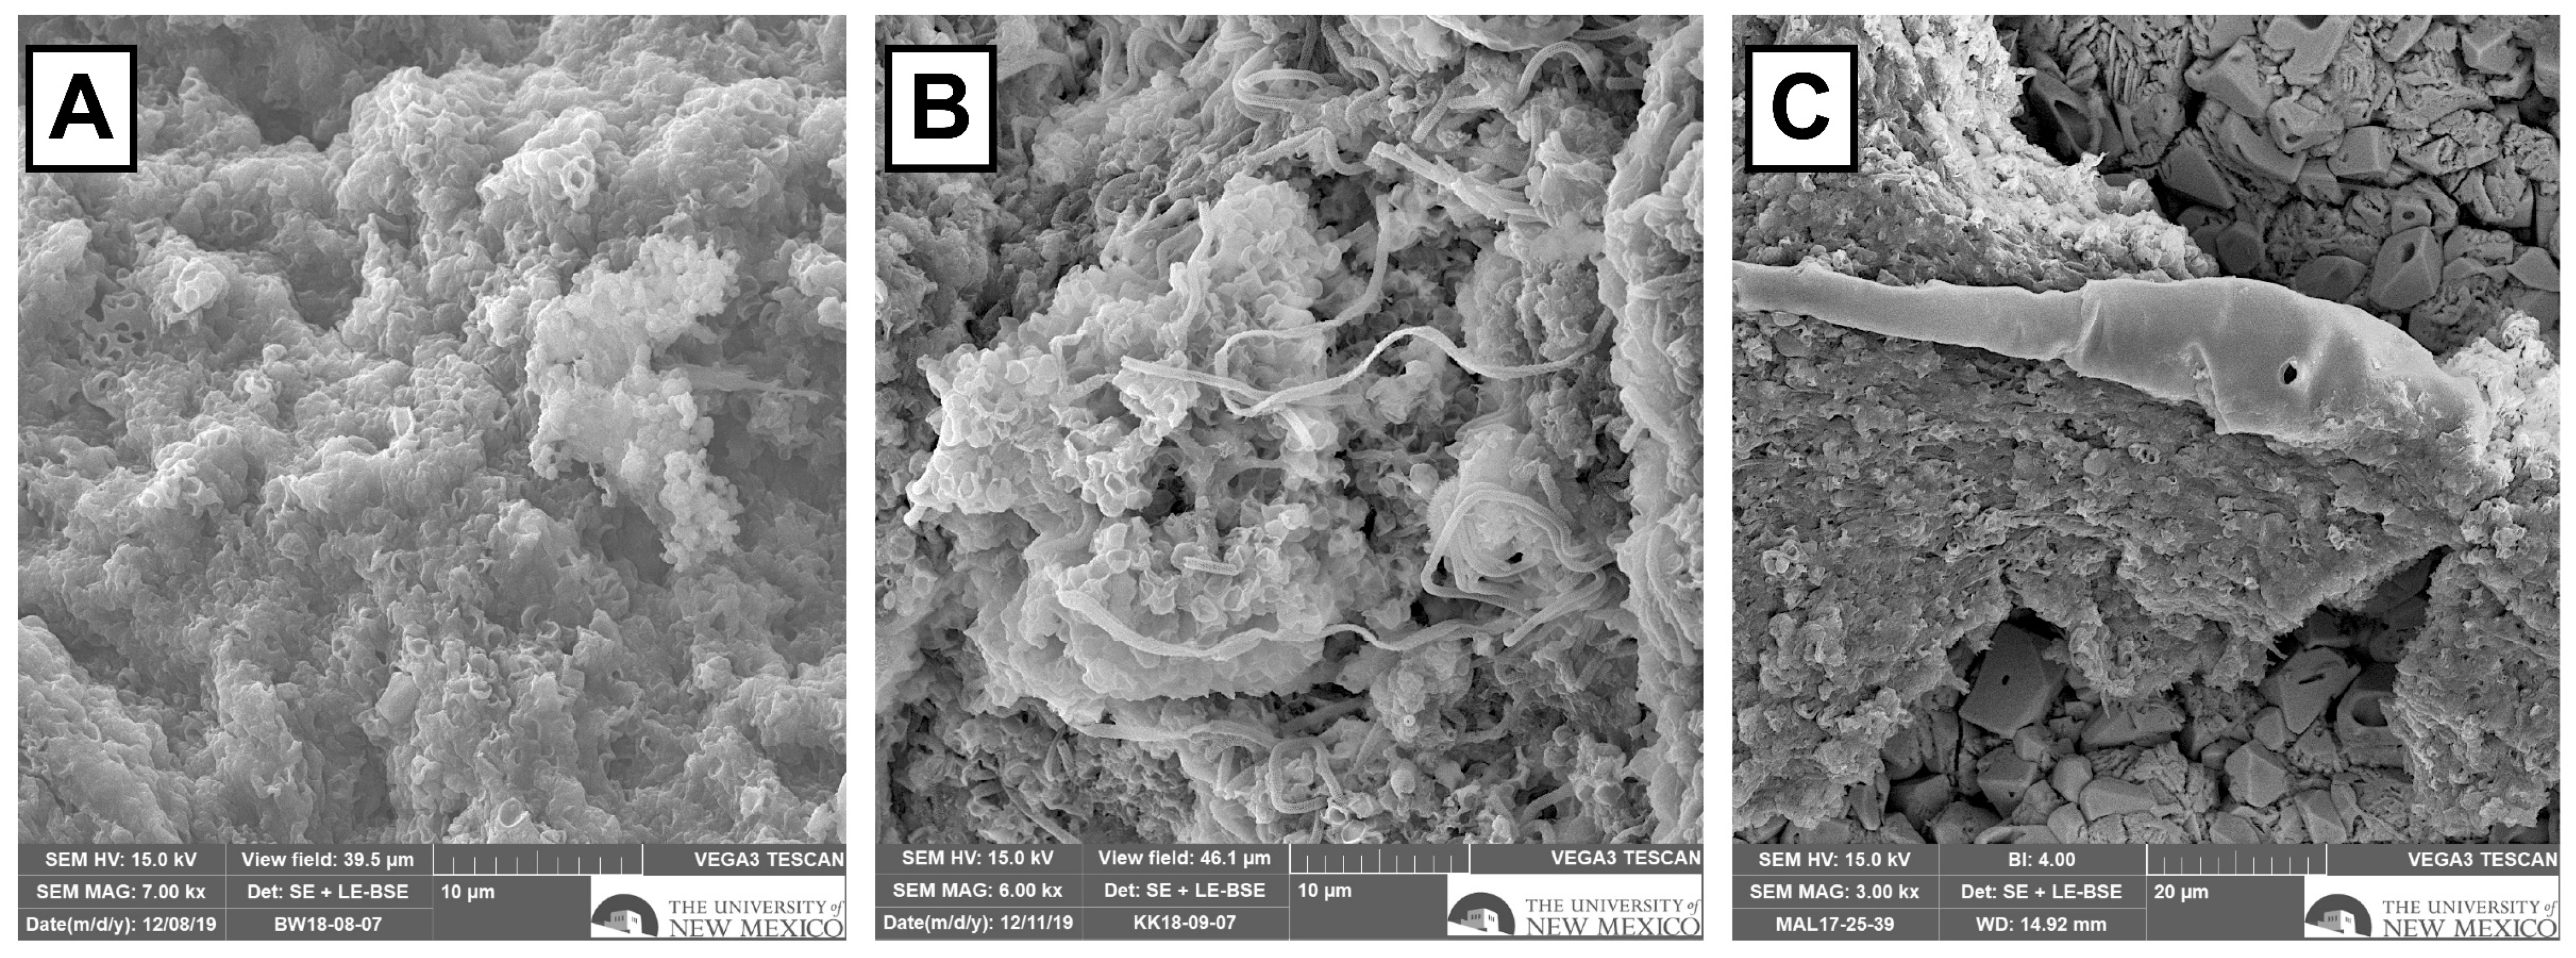
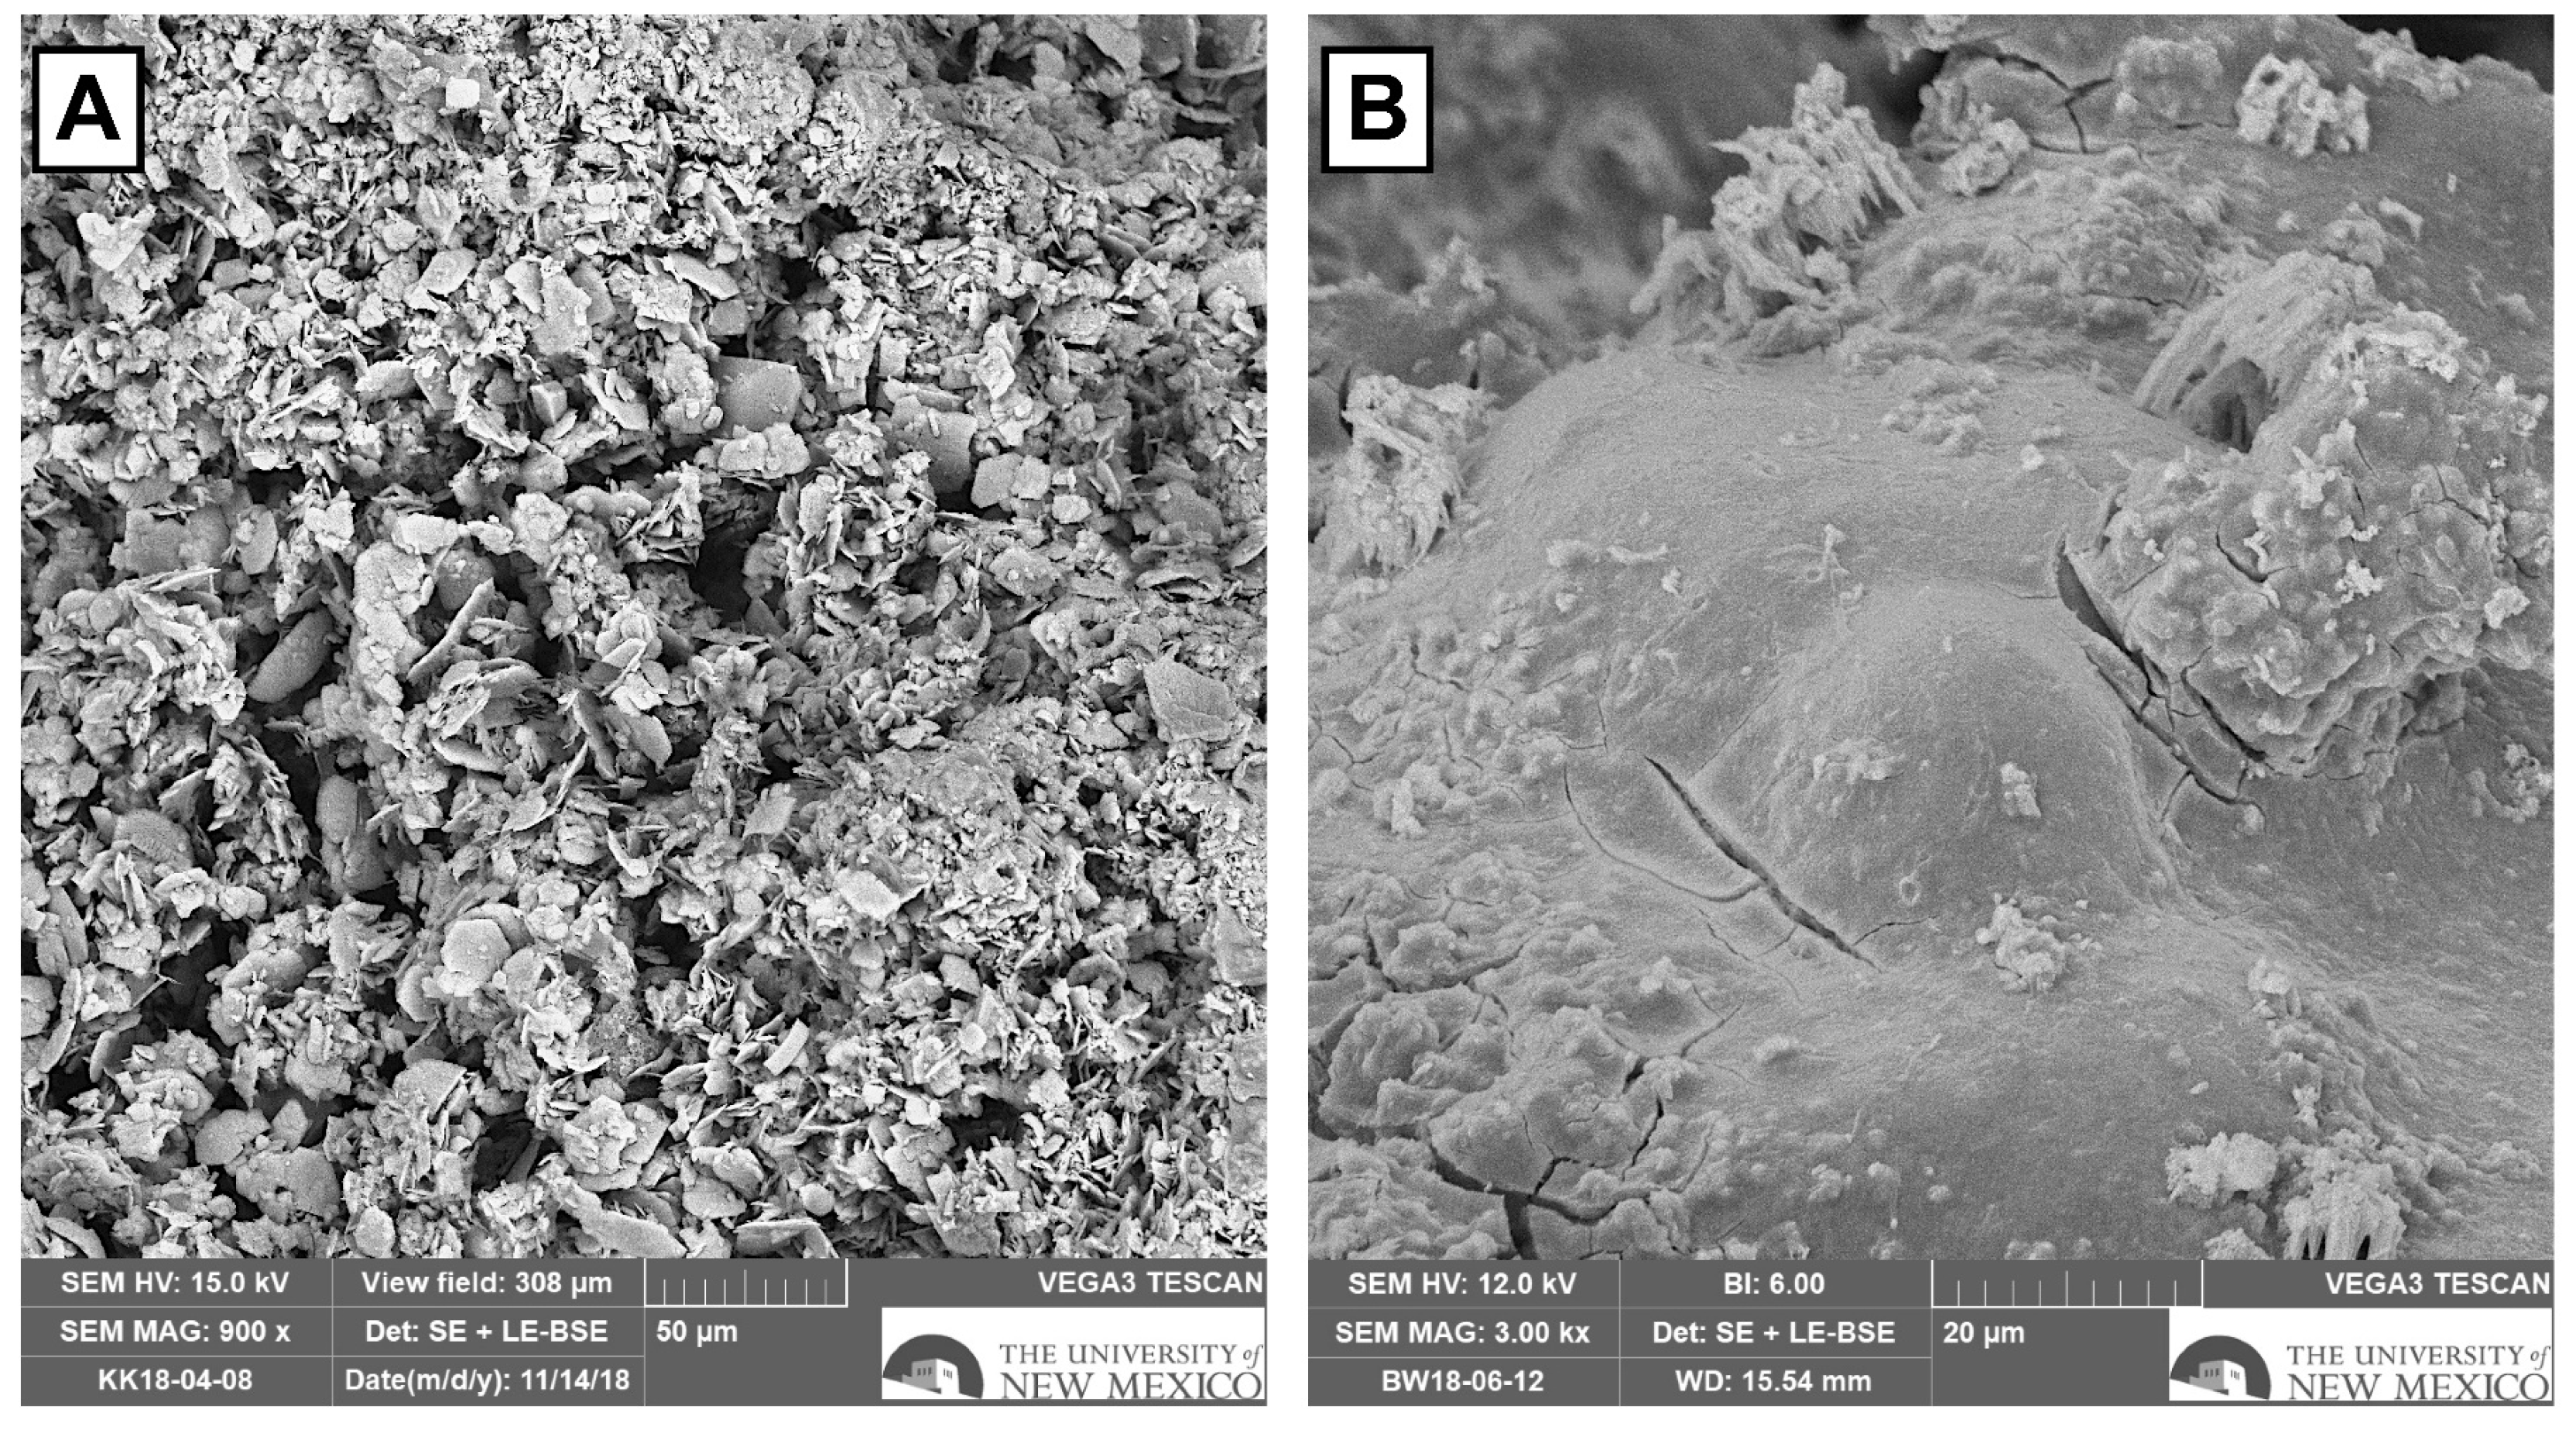
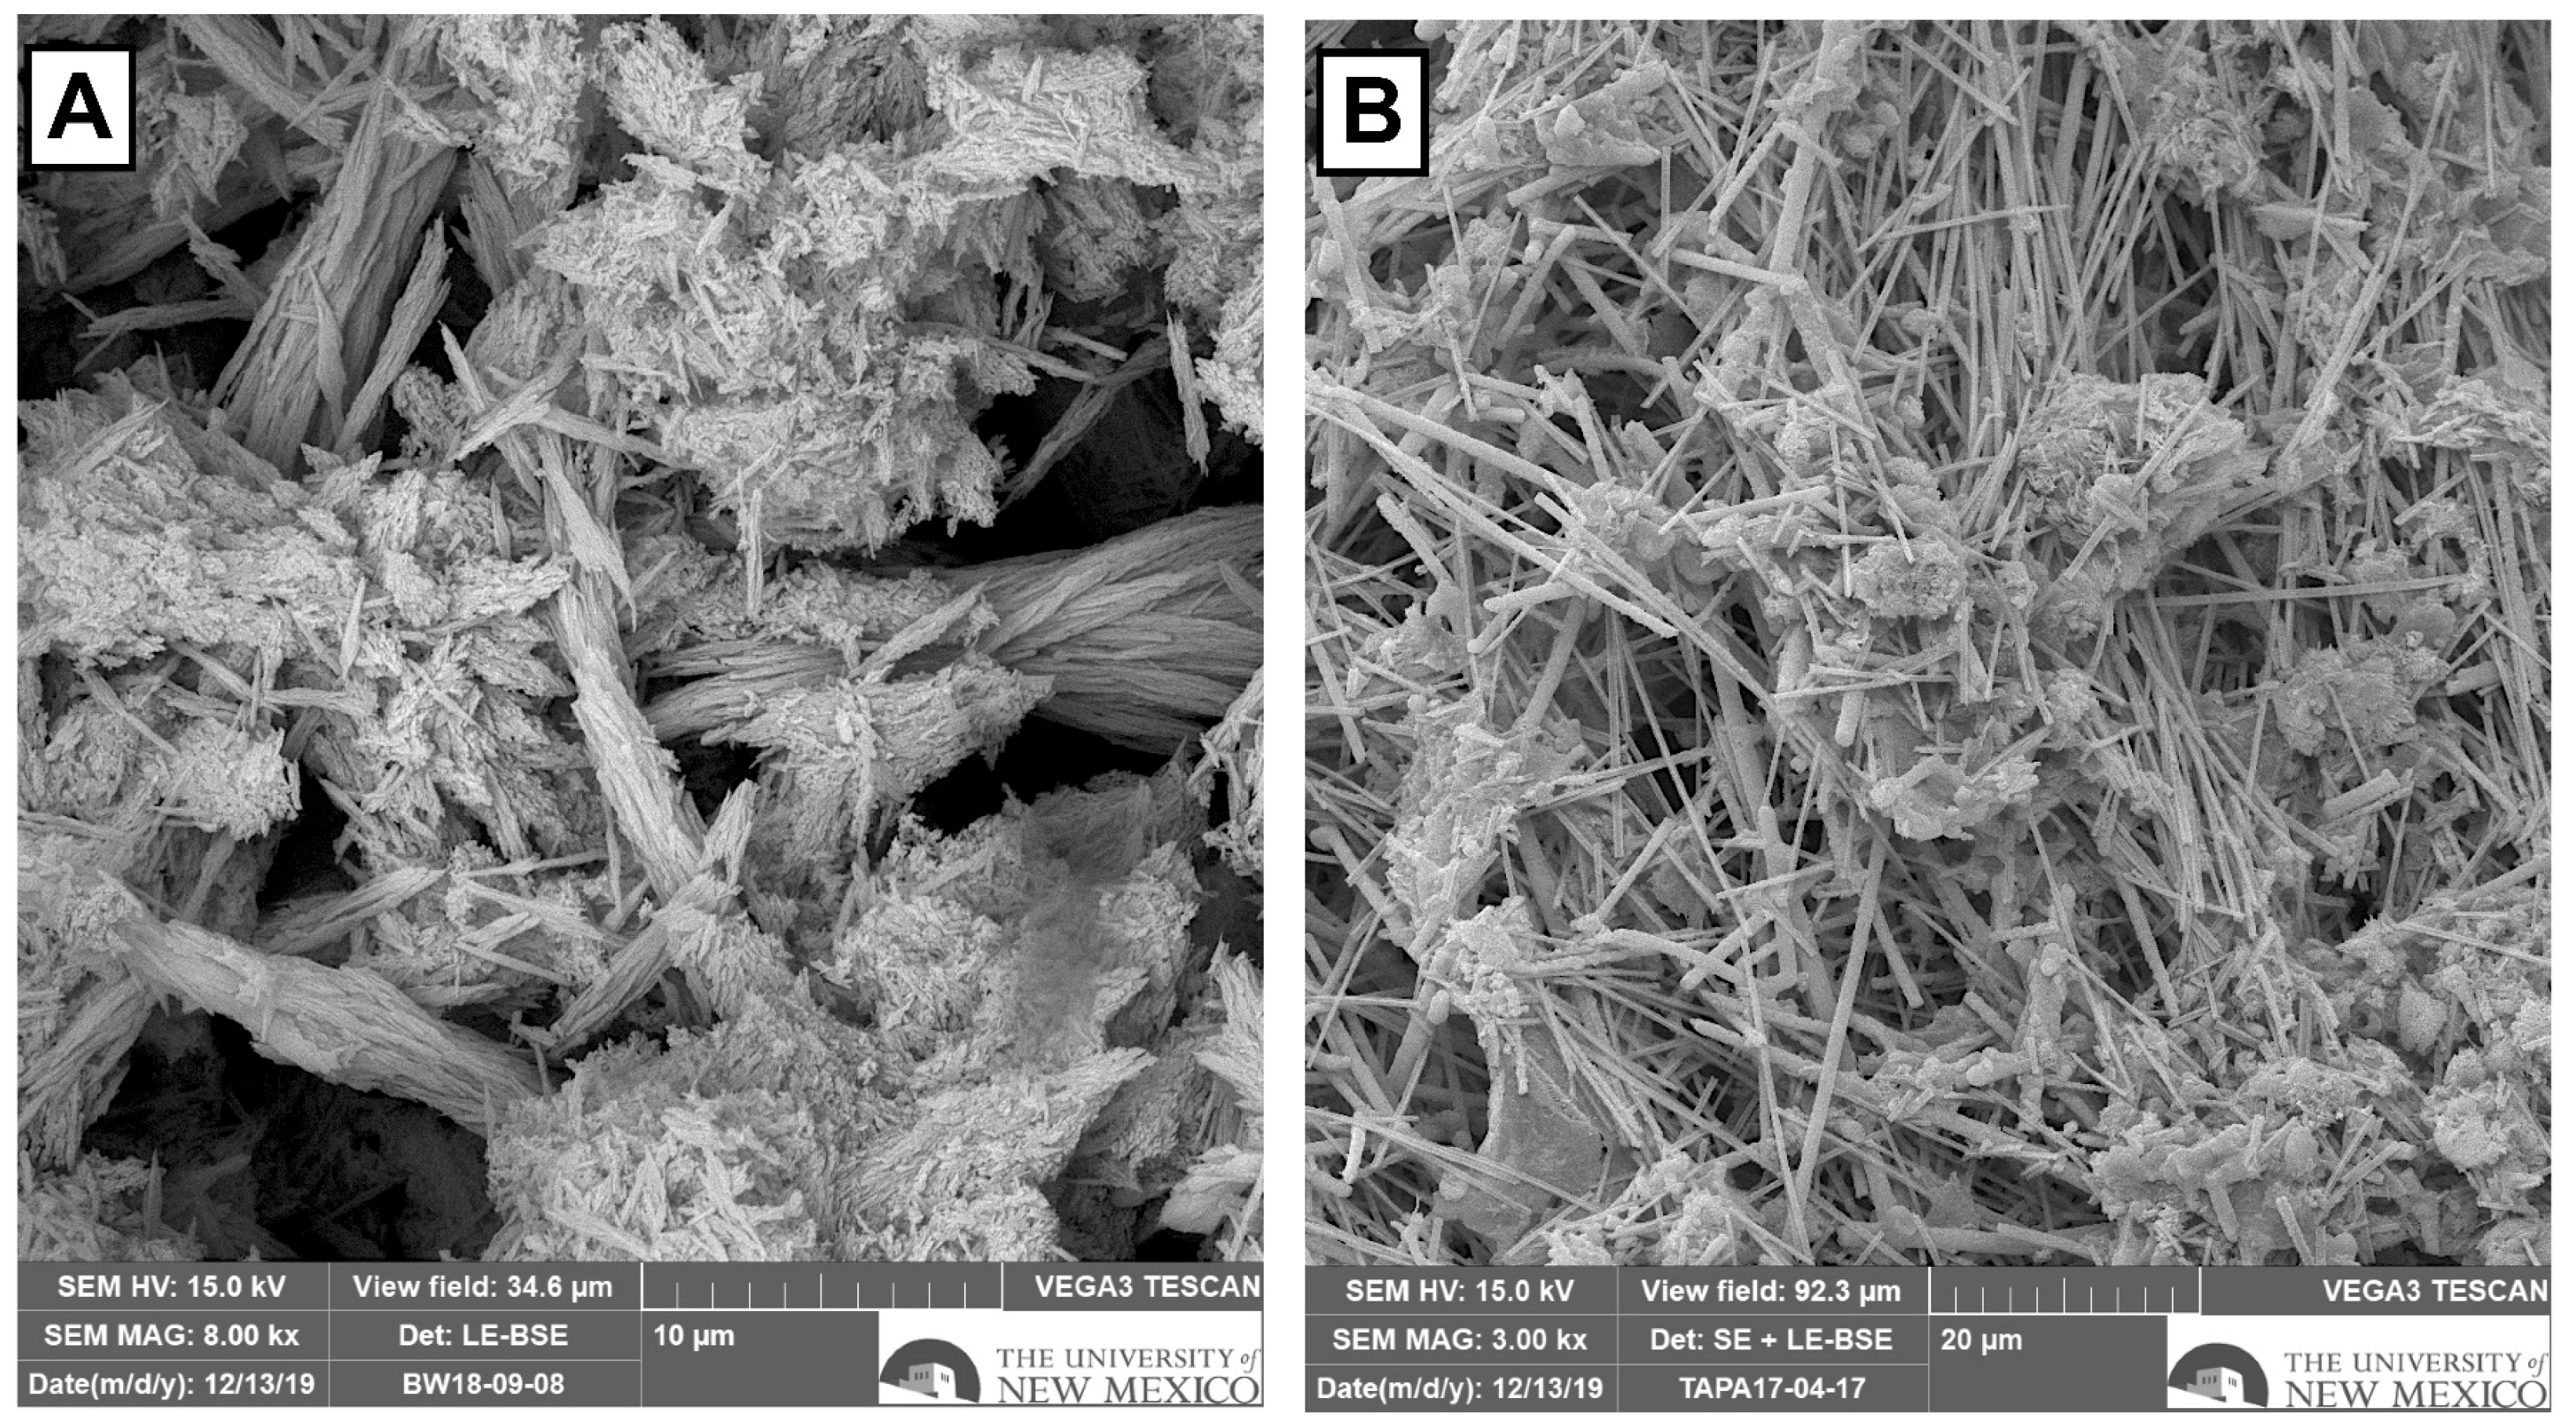
Differential abundance analysis was performed using DESeq2 from the Bioconductor suite in R [50]. Differential abundance identifies which ASVs are differently present/abundant between our two locations (Hawai`i and New Mexico). We used significance as a threshold to focus our discussion, rather than being inundated by too many taxa. We find that New Mexico lava caves seem to have more ASVs that are highly differentially abundant in comparison to Hawai`i lava caves (Figure 7).
Additionally, there are instances of unique ASVs from the same genus—for example, the genus wb1-P19—where one ASV is highly differentially abundant in New Mexico, and a different wb1-P19 ASV exhibits low differential abundance in New Mexico. We also find that many genera are unidentified at the level of the genus. Of those taxa, the majority are only identified to the level of the family.

3.6. SEM Results

Several microbial morphologies were observed under SEM, and associated EDS confirmed the chemical composition of the samples. Numerous microbial morphologies were observed in differing amounts across several morphological sample types (Figure 8). Most of the terms we use are self-explanatory, and demonstrated through the use of SEM images, but we felt we should define the term “Biofilm” in this context. We use the term biofilm to describe the amorphous matrix substance found between, below, and covering other morphologies. It has a high carbon peak when probed with EDS.
Microbial mats and mineral crusts were the sample types that had the greatest diversity of microbial morphologies, followed closely by the ooze sample type. The least diversity of microbial morphologies was observed in coralloids. Spheroids and moonmilk sample types were the next least diverse in terms of microbial morphologies. There were several interesting and unique occurrences across the samples we imaged. First, microbial mats had the highest number of fuzzy cocci (Figure 9B). Moonmilk had the second-highest biofilm observations but had one of the lowest numbers of different morphologies present.
There were two rare morphologies across the samples: beads-on-a-string (Figure 9E) were observed once in each of three sample types: one mineral crust, one moonmilk, and one ooze sample. Reticulated filaments (Figure 9F) were found exclusively in Hawaiian samples, especially in Maelstrom cave and especially in ooze samples. These two interesting, ornate morphologies were previously found in caves in other parts of the world [29,51].
As for other morphologies found, cocci (Figure 9B) were observed both with putative pili or fimbriae and in large, aggregate groups. Microbial rods were observed but were not as common as other morphologies present in these samples. Filamentous microbes were found in most of our samples, generally falling into one of two categories: smooth filaments (Figure 9A) and what we have dubbed “fuzzy” filaments (Figure 9C). A common morphology observed is a mix between cocci and fuzzy filaments—we have dubbed such morphologies as “fuzzy filaments with cocci” (Figure 10C). Less often observed but somewhat related to filaments are what we call “segmented filaments”, which are often flat and come in a smooth, segmented filament variety as well as a “spikey”, segmented variety, where the spikes are likely pili. Some spiral bacteria (Figure 9D) were observed as well, but much like the rods, spiral bacteria were relatively rare. Testate amoebas were commonplace, as well as diatoms. Biofilm (Figure 10B) is found on every sample we looked at, including bare rock, which was not included in this analysis. Finally, insect parts (Figure 11C) were also commonly found in both New Mexican and Hawaiian samples.
We also looked at the surface morphologies of each microbe and mineral type of cave features. Coralloids varied in their appearance under SEM from mineral flakes at the surface, to smooth, almost crust-like surfaces on the samples (Figure 12A,B). All associated sample EDS spectra showed signals of silica, some gypsum and calcite in coralloid samples, which is to be expected [27].
Spheroids had macroscopically visible ridges across the sample, which were the main features noticed underneath the microscope (Figure 13A,B). Spheroids are primarily composed of gypsum, not calcite.
Most mineral crust samples had random assortments of microbial morphologies scattered throughout (Figure 14A,B). There were relatively large patches of microbes across such samples, but examples were sparse. For the most part, samples gave the initial impression that they were entirely mineral.
Moonmilk appears in crusty and fluffy genres (Figure 15A,B), which were distinct under SEM. Fluffy moonmilk exhibited long, calcitic rod-like minerals, whereas crusty moonmilk was composed of sharp, knife-like crystals among filamentous detritus. Microbes and biofilms were plentiful within fluffy moonmilk samples. Both New Mexican and Hawaiian moonmilk samples consist of calcium carbonate.
Microbial mats were similar under SEM to mineral crusts. Oftentimes, the surface simply looks like the substrate. However, areas of the sample consisting of the microbial mat, visible macroscopically, were covered in enormous swaths of microbial life (Figure 10A–C). Numerous diverse microbial morphologies, often mixed, were observed. Ooze appears as an amalgam of different materials (Figure 11A–C). EDS spectra demonstrate various compounds, such as clays, silica, and calcium carbonate, associated with large amounts of carbon.

3.7. Geochemistry

Both New Mexican and Hawaiian caves have similar compositions of tholeiitic lavas, which could provide ample energy sources in the form of reduced manganese and iron for chemolithotrophic respiration. Other chemically reduced elements could also act as potential energy sources. Of particular note are the copper and vanadium content in Hawai`i versus New Mexico. Copper is generally lower in New Mexico, in both the analyzed samples and published values, which range from 55 to 81 ppm (Table 1). One exception is Pantheon Cave, which has a higher concentration than other New Mexico caves and Hawai`i. Only one of our New Mexico samples was analyzed for Vanadium but published values from the Bandera area of ELMA range from 172 to 231 ppm [54,55]. Vanadium content is generally higher in Hawai`i.

4. Discussion

In 1969, Oberbeck et al. [56] first suggested that rilles, found in images taken by the Lunar Orbiter V, might be lava caves. A few years later, the existence of such rilles was confirmed in the Marius Hills region on the moon [57], and soon thereafter on Mars [58]. Nearly two decades elapsed before researchers would hypothesize that such lava caves may be potentially habitable places for extant life on Mars [20]. In the search for evidence of extraterrestrial life, Mars remains the strongest candidate because of its appealing evidence of Earth-like conditions, such as the presence of liquid water [59,60], the existence of numerous potential Martian lava caves [21,22,58], and evidence of crustal fluids at the Martian surface [61]. Although Mars is just outside of the traditional circumstellar habitability zone, a set of climate constraints prerequisite to viable life and affected by a planet’s proximity to the sun [62], its subsurface is considered potentially habitable by microbial life [63]. Martian lava caves could provide protection from the inhospitable environment at the Martian surface [64] and are likely similar to lava caves found on Earth [20,56,58], thus making lava caves on Earth well-suited analogs for those on Mars. Our findings identify critical biosignatures in secondary mineral deposits present in subsurface habitats for programs designing rovers to identify viable sampling targets in the search for life on Mars and elsewhere.
There is a large difference in the microbial ecologies between New Mexican and Hawaiian lava caves. Not only do the two locations group separately on NMDS plots (Figure 3), but we also see differences via statistical hypothesis testing applied to the Bray–Curtis dissimilarity measures (see Figure 3 and Figure 4). We detect a difference between Hawai`i and New Mexico, using a PERMANOVA hypothesis test. This is likely due to several different factors. First, the two locations are very different climatologically from each other. While both locations experience relatively low precipitation levels, Hawai`i does see almost four times the average rainfall compared to El Malpais in New Mexico. Hawaiian caves are also much warmer, with an average temp of 19 °C compared to 5 °C in New Mexico. Furthermore, the lava caves in New Mexico are at a considerably higher altitude—almost five times higher than those found on the island of Hawai`i (Table S1).
Despite Hawaii being an active volcanic hot spot, whereas ELMA volcanic activity is related to a deep crustal structure known as the Jemez Lineament that extends northeasterly across the state, the two sites have chemically similar tholeiitic lava containing reduced metals [65]. Chemolithotrophic bacteria have been found to utilize reduced metals in the bedrock of caves. Certainly, both systems contain high levels of reduced iron and manganese, and significant levels of copper, all of which may provide energy from oxidation for microbial respiration. Furthermore, Hawaiian caves contain more copper than New Mexican caves, and copper minerals have been observed in previous studies of microbial minerals in Hawaiian lava caves [29]. The cave geometry and total length varied between the two locations, with the Hawaiian tubes all being part of a very large complex of caves while the New Mexican caves were all discrete caves. Together, these factors lead to distinct communities in the locations as shown by the alpha and beta diversities.
However, one of the larger anomalies encountered was that of Kula Kai Caverns. Kula Kai tended to group with New Mexico caves in alpha diversity analyses. Beta diversity also evidences Kula Kai overlapping with New Mexico cave distribution (Figure 3). One of the largest differences between Kula Kai and every other cave in our dataset is the fact that Kula Kai is a show cave, meaning that it is regularly visited by the public on cave tours. Not only is there a higher rate of human impact on the cave via tours, but there is also much more infrastructure above Kula Kai, increasing the potential for human impact. This includes a regularly traveled road, pit toilets, and housing. Additionally, Kula Kai is also at the highest elevation of all three Hawaiian caves, although they are less than a fifth of the elevation of El Malpais (Table S1). Hathaway et al. [1] investigated the bacterial composition of Kula Kai using clone data and found the same distinction in community structure when compared to other Hawaiian caves. The four outliers from Kula Kai were a mineral crust, a microbial mat, moonmilk, and a coralloid sample. This, again, is probably best explained through an increased human impact on the cave. The samples that fell well within the range of Hawai`i were two spheroids and an ooze sample. This makes sense as ooze is more prominently found in Hawai`i and spheroids have not yet been discovered in lava caves in El Malpais.
A large part of the existing literature on cave microbes has focused on microbial mats and other cave features, not discussed here [29,64,66]. This study is one of the few to look at multiple and various speleothems across lava caves in Hawai`i and New Mexico. There appears to be differentiation in the microbial composition of speleothems (Figure 4). While most of the speleothems divide out separately from one another, mineral crusts seem to cover the entire gamut of microbial communities found in speleothems. We believe that this might be evidence of the fact that mineral crusts, in caves, will eventually overrun most other speleothems.
One of the only speleothems that does not appear to have overlap, both visually in situ and in our NMDS plots, are spheroids. However, it is worth noting that the only spheroids that were found were found in Hawai`i. Additionally, it has the lowest number of samples collected (n = 3), preventing the estimation of an ellipse in beta diversity. However, when placed into an NMDS, spheroids group clearly with the Hawaiian samples (Figure 3 and Figure 4). This makes sense, as spheroids are composed of gypsum, which is rare in the other speleothems, and spheroids have not yet been found in New Mexican lava caves. Our suite of secondary morphologies could provide the foundation for viable biosignatures on other planets.
Boston [64] suggests that viable biosignatures must be uniquely discernable at both the macroscopic and microscopic levels, identifiable via non-visual inspection, and must be “...relatively independent of the specific life chemistries of the responsible microorganisms”. While we were limited in our investigation, our proposed biosignatures meet many of the established criteria. All of our biosignatures are distinctly identifiable at the macroscopic level. However, it is less clear at the microscopic level, but our results suggest that some of these speleothems are, in fact, identifiable via their microscopic appearance. It is worth noting, however, that these SEM micrographs only represent a few samples across both locations, and therefore these conclusions are not definitive. Instead, they point in a direction that suggests uniqueness, although further studies should be conducted to confirm the veracity of such claims at the microscopic level.
Spheroids are unique and easily noticeable by the unaided eye but are also distinctive at the microscopic level. Microscopically and macroscopically, spheroids have distinctive ridges in them that are both microscopically identifiable and unique under the SEM. Additionally, spheroids are composed of gypsum, another unique marker. Spheroids are also strong candidates as biosignatures, as they are seemingly unique in their microbial community composition too, although that must also come with the caveat that we only analyzed three spheroids at the molecular level, which might account for such drastic differences.
Moonmilk is identifiable to the unaided eye, and its appearance can be confirmed by its unique morphologies under the microscope. Calcitic moonmilk, both crusty and fluffy, contains filamentous and crystalline calcite [52]. Both the physical appearance of moonmilk under the microscope and the EDS spectra unique to calcite help to make this a good biosignature in lava caves on Mars.
Ooze is also a viable option, as it is identifiable at the macroscopic level as well as the microscopic. At the level of the SEM, ooze looks like an amalgam of different organic and inorganic materials. EDS spectra confirm this through aluminum, silicon, oxygen, carbon, and calcium peaks. The organic signatures, as well as a visual inspection with the microscope, reveal that ooze is, or was, teeming with life.
The final three were more difficult to distinguish at the level of the electron microscope. Coralloid surfaces tended to alternate between smooth areas and areas of “flaky” minerals, or what looks like detritus. Additionally, they tend to be composed of both silica and minor calcite composition [27].
Distinguishing between a mineral crust and a microbial mat at the macroscopic level is easy, while microscopically, it is dependent on the amount of life found at the sample’s surface. Microbial mats have considerably larger areas of colonies, observable at the surface, compared to mineral crusts. Occasionally, mineral crusts will be associated with a unique sample surface chemistry, detectable through EDS, but this is not always the case. Such an example is that of blue-green mineral crusts that have been observed in both Hawai`i and New Mexico, which generally also have either a copper peak in the spectra, bismuth, or vanadium.
While this analysis of the SEM is by no means exhaustive, it does suggest that further research on all six of our potential biosignatures is warranted.
We discovered that both species richness and overall library sizes were significantly greater in caves in Hawai`i than in New Mexico. Abiotic factors that appear to contribute to this difference include elevation, as New Mexico’s elevation is more than five times higher than that of our Hawaiian caves. Additionally, precipitation in Hawai`i is considerably higher, on average, and surface and cave temperatures also are considerably higher in Hawai`i.
There are a greater number of microbial bacterial groups that are predominantly found in New Mexico rather than Hawai`i. These include Blastocatella, Bryobacter, Candidatus Udaeobacter, Pseudonocardia, Rubrobacter, Solirubrobacter, unclassified (family Solirubrobacteraceae), unclassified (family 67-14), and unclassified (family Micrococcaceae). Blastocatella is a genus within subdivision 4 of the Acidobacteria. It is an aerobic, chemoorganotrophic genus that is Gram-negative, non-spore-forming, and motile. Ouyang et al. [67] have documented its contribution to ammonium removal in pharmaceutical wastewater. Bryobacter, another genus within the Acidobacteria, was repeatedly found in geothermal sites by Prescott et al. [68], rather than in the lava caves in the study. This genus also has been suggested as a vanadium reducer [69], an element that is found in Hawaiian basalt that makes up the cave walls (Table 1). Candidatus Udaeobacter, an aerobic heterotroph in the phylum Verrucomicrobia, was found to be a dominant taxon in the karst soil ecosystem overlying the Karst Graben Basin in China [70]. Pseudonocardia, a more common cave inhabitant, also has been documented as a major player in the deterioration of Paleolithic paintings in caves [71], as has Rubrobacter [72]. In addition to Rubrobacter, Solirubrobacter, Pseudonocardia, unclassified (family Solirubrobacteraceae), unclassified (family 67-14), and unclassified (family Micrococcaceae), were all found to be prominent players in five different soil ecosystems in China [73].
Bacterial genera that were observed to be more numerous in Hawaiian samples included Candidatus Omnitrophus, Nitrospira, unclassified (class Alphaproteobacteria), unclassified (family Gemmatimonadaceae), unclassified (family Vicinamibacteraceae), and unclassified (order PLTA13). Candidatus Omnitrophus has been identified in a few other caves, such as the study of the yellow biofilms in Pindal Cave in Spain [49,74], but much remains to be discovered about its role(s) in caves. Nitrospira spp., on the other hand, are well-known nitrite oxidizers that have been found in many caves [3].
Several groups/genera have been found in both New Mexico and Hawai`i caves. These include unclassified (class Acidomicrobia), unclassified (family Euzebaceae), unclassified (family Gemmatimonadaceae), wb1-P19, Nitrospira, and unclassified (family Pedosphaeraceae). The genus Euzebya is found in many terrestrial environments, including caves [3,15,28,49], and appears to prefer alkaline, humid environments. Interestingly, the unclassified order PLTA13 in the Gammaproteobacteria has been documented in yellow biofilms in Pindal Cave in Spain, along with Crossiella and wb1-P19 [74]. Wb1-P19 occurred in both New Mexico and Hawai`i study caves, with New Mexico study caves having just under half the number of counts (24,427 counts) compared to Hawai`i (55,793 counts). Wb1-P19 often co-occurs with Nitrospira, a genus that plays a prominent role in nitrification [74]. The two outliers are the Maelstrom and Tapa caves in Hawai`i. Crossiella occurred in higher numbers in NM, but moderate numbers of Crossiella were also found in HI. Several of the organisms discussed above have been found in both caves and overlying soils [75].

5. Future Research

Our future studies include sequencing archaea from our samples to expand our knowledge of lava cave microbial communities using domain-specific primers [76] in order to fully understand these processes in caves. Archaea are being shown as important contributors to carbon, nitrogen, and sulfur cycling [77] and should be included in future analyses.
More research into the various speleothems we have identified in this paper is needed, but more specifically, research into ooze and spheroids is warranted. Ooze is of interest because it often has large quantities of reticulated filaments. Furthermore, it has a high silica content, and we are not entirely sure as to its origins. Ooze can be found in lava caves around the world and comes in a variety of consistencies as well as colors. Spheroids, in contrast, have not been found all around the world. We have yet to see spheroids in El Malpais National Monument. Their occurrence in limited lava tubes, coupled with their odd placement within the data sets, suggests the need for more examples of this unique speleothem.
Additionally, more research into show caves as compared to caves with limited visitation is needed due to the marked difference between Kula Kai and other Hawaiian caves. A variety of show caves and wild caves might help to establish two different microbial baselines for future cave microbial analyses or raise more questions about the substantial difference in Kula Kai microbial communities. As of now, it stands to reason that the show cave nature of Kula Kai explains it as a slight outlier.
Finally, future studies should compare and contrast the vegetation of the two study areas to determine what impact the surface vegetation has on the microbial communities in the caves.

Supplementary Materials

The following supporting information can be downloaded at: https://www.mdpi.com/article/10.3390/app14156500/s1, Table S1: Temperature, elevation, and precipitation data; Table S2: summary statistics of ASVs from each cave.

Author Contributions

Conceptualization, D.E.N.; data curation, J.J.M.; formal analysis, J.J.M.; funding acquisition, J.J.M. and D.E.N.; investigation, J.J.M., J.J.M.H., M.N.S. and D.E.N.; methodology, J.J.M., J.J.M.H., M.N.S. and D.E.N.; software, J.J.M.; supervision, J.J.M., J.J.M.H., M.N.S. and D.E.N.; visualization, J.J.M., J.J.M.H., M.N.S. and D.E.N.; writing—original draft, J.J.M. and D.E.N.; writing—review and editing, J.J.M., J.J.M.H., M.N.S. and D.E.N. All authors have read and agreed to the published version of the manuscript.

Funding

Funding came from multiple sources. We would like to thank the New Mexico Space Grant Consortium’s Undergraduate Scholarship, as well as the New Mexico Geological Society’s Cearly Undergraduate Grant-in-Aid Award for their generous contributions to this project. We would also like to thank the Department of Biology at the University of New Mexico for their financial assistance via the Rosemary Miller née Gonzalez Scholarship and the Maurice L. Hughes Scholarship.

Institutional Review Board Statement

Not applicable.

Informed Consent Statement

Not applicable.

Data Availability Statement

The original data presented in the study are openly available in NCBI (Bioproject ascension: PRJNA1049795; ascension numbers SRR27129805 through SRR27129852) and will be made public by the publishing of this article.

Acknowledgments

We would like to thank Tomislav Gracanin and Veda Hackell for their immense help in field work, sample collection, and subject matter expertise on lava caves of Hawai`i. Without their help, this paper would still be in the sampling phase. We would also like to thank Dr. Kenneth Ingham (http://www.i-pi.com, 14 July 2024) for his expertise in cave photography, services which he so generously volunteered to our team. We would also like to thank the Cave Conservancy of Hawai`i and landowners (Ric Elhard and Rose Herrera (Kula Kai); Don and Barb Coons (Tapa); Jim and Linn Burlington (Maelstrom)) in Hawai`i for their cooperation and permission to enter the caves and sample. We would like to thank the staff, in particular Eric Weaver, Steve Baumann, and Laura Baumann at El Malpais National Monument for their assistance as well as granting us permits to sample in the monument. We would also like to thank Dr. Melissa Pardi, of the Illinois State Museum, for her assistance with many technical aspects of this paper, as well as help in the fieldwork.

Conflicts of Interest

The authors declare no conflicts of interest.

References

  1. Hathaway, J.J.M.; Garcia, M.G.; Balasch, M.M.; Spilde, M.N.; Stone, F.D.; Dapkevicius, M.D.L.N.E.; Amorim, I.R.; Gabriel, R.; Borges, P.A.V.; Northup, D.E. Comparison of Bacterial Diversity in Azorean and Hawai’ian Lava Cave Microbial Mats. Geomicrobiol. J. 2014, 31, 205–220. [Google Scholar] [CrossRef] [PubMed]
  2. Northup, D.E.; Connolly, C.A.; Trent, A.; Peck, V.M.; Spilde, M.N.; Welbourn, W.C.; Natvig, D.O. The Nature of Bacterial Communities in Four Windows Cave, El Malpais National Monument, New Mexico, USA. In Proceedings of the X, XI, and XII International Symposia on Vulcanospeleology; Espinasa-Pereña, R., Pint, J., Eds.; Association for Mexican Cave Studies: Austin, TX, USA, 2004; pp. 119–125. [Google Scholar]
  3. Lavoie, K.H.; Winter, A.S.; Read, K.J.H.; Hughes, E.M.; Spilde, M.N.; Northup, D.E. Comparison of Bacterial Communities from Lava Cave Microbial Mats to Overlying Surface Soils from Lava Beds National Monument, USA. PLoS ONE 2017, 12, e0169339. [Google Scholar] [CrossRef]
  4. Staley, J.T.; Crawford, R. The Biologist’s Chamber: Lava Tube Slime. Cascade Caver 1975, 14, 20–21. [Google Scholar]
  5. Howarth, F.G. Community Structure and Niche Differentiation in Hawaiian Lava Tubes. In Island Ecosystems: Biological Organization in Selected Hawaiian Communities; Hutchinson Ross Pub. Co.: Stroudsburg, PA, USA, 1981; pp. 318–336. ISBN 0-87933-381-2. [Google Scholar]
  6. Léveillé, R.J.; Fyfe, W.S.; Longstaffe, F.J. Geomicrobiology of Carbonate–Silicate Microbialites from Hawaiian Basaltic Sea Caves. Chem. Geol. 2000, 169, 339–355. [Google Scholar] [CrossRef]
  7. Gonzalez-Pimentel, J.L.; Miller, A.Z.; Jurado, V.; Laiz, L.; Pereira, M.F.C.; Saiz-Jimenez, C. Yellow Coloured Mats from Lava Tubes of La Palma (Canary Islands, Spain) Are Dominated by Metabolically Active Actinobacteria. Sci. Rep. 2018, 8, 1944. [Google Scholar] [CrossRef]
  8. Kim, J.-S.; Kim, D.-S.; Lee, K.C.; Kim, Y.-H.; Ahn, U.-S.; Lee, M.-K.; Lee, J.-S. Yellow-Colored Mats in Jeju Island Lava Tubes. J. Korean Appl. Sci. Technol. 2019, 36, 1338–1348. [Google Scholar] [CrossRef]
  9. Nicolosi, G.; Gonzalez-Pimentel, J.L.; Piano, E.; Isaia, M.; Miller, A.Z. First Insights into the Bacterial Diversity of Mount Etna Volcanic Caves. Microb. Ecol. 2023, 86, 1632–1645. [Google Scholar] [CrossRef]
  10. Lavoie, K.H.; Northup, D.E.; Barton, H.A. Microbe–Mineral Interactions: Cave Geomicrobiology. In Geomicrobiology; Jain, S.K., Khan, A.A., Rai, M.K., Eds.; CRC Press: Boca Raton, FL, USA, 2010; ISBN 978-1-4398-4510-3. [Google Scholar]
  11. Willems, L.; Compère, P.; Hatert, F.; Pouclet, A.; Vicat, J.P.; Ek, C.; Boulvain, F. Karst in Granitic Rocks, South Cameroon: Cave Genesis and Silica and Taranakite Speleothems. Terra Nova 2002, 14, 355–362. [Google Scholar] [CrossRef]
  12. Romaní, J.R.V.; Rodriguez, M.V. Types of Granite Cavities and Associated Speleothems: Genesis and Evolution. Nat. Conserv. 2007, 63, 41–46. [Google Scholar]
  13. Miller, A.Z.; Pereira, M.F.C.; Calaforra, J.M.; Forti, P.; Dionísio, A.; Saiz-Jimenez, C. Siliceous Speleothems and Associated Microbe-Mineral Interactions from Ana Heva Lava Tube in Easter Island (Chile). Geomicrobiol. J. 2014, 31, 236–245. [Google Scholar] [CrossRef]
  14. Tebo, B.M.; Davis, R.E.; Anitori, R.P.; Connell, L.B.; Schiffman, P.; Staudigel, H. Microbial Communities in Dark Oligotrophic Volcanic Ice Cave Ecosystems of Mt. Erebus, Antarctica. Front. Microbiol. 2015, 6, 179. [Google Scholar] [CrossRef] [PubMed]
  15. Miller, A.Z.; García-Sánchez, A.M.; Coutinho, M.L.; Costa Pereira, M.F.; Gázquez, F.; Calaforra, J.M.; Forti, P.; Martínez-Frías, J.; Toulkeridis, T.; Caldeira, A.T.; et al. Colored Microbial Coatings in Show Caves from the Galapagos Islands (Ecuador): First Microbiological Approach. Coatings 2020, 10, 1134. [Google Scholar] [CrossRef]
  16. Luis-Vargas, M.N.; López-Martínez, R.A.; Vilchis-Nestor, A.R.; Daza, R.; Alcántara-Hernández, R.J. Bacterial Insights into the Formation of Opaline Stromatolites from the Chimalacatepec Lava Tube System, Mexico. Geomicrobiol. J. 2019, 36, 694–704. [Google Scholar] [CrossRef]
  17. Gonzalez-Pimentel, J.L.; Martin-Pozas, T.; Jurado, V.; Miller, A.Z.; Caldeira, A.T.; Fernandez-Lorenzo, O.; Sanchez-Moral, S.; Saiz-Jimenez, C. Prokaryotic Communities from a Lava Tube Cave in La Palma Island (Spain) Are Involved in the Biogeochemical Cycle of Major Elements. PeerJ 2021, 9, e11386. [Google Scholar] [CrossRef] [PubMed]
  18. Weng, M.M.; Zaikova, E.; Millan, M.; Williams, A.J.; McAdam, A.C.; Knudson, C.A.; Fuqua, S.R.; Wagner, N.Y.; Craft, K.; Kobs Nawotniak, S.; et al. Life Underground: Investigating Microbial Communities and Their Biomarkers in Mars-Analog Lava Tubes at Craters of the Moon National Monument and Preserve. J. Geophys. Res. Planets 2022, 127, e2022JE007268. [Google Scholar] [CrossRef]
  19. Barton, H.A.; Northup, D.E. Geomicrobiology in Cave Environments: Past, Current and Future Perspectives. J. Cave Karst Stud. 2007, 69, 163–178. [Google Scholar]
  20. Boston, P.J.; Ivanov, M.V.; McKay, C.P. On the Possibility of Chemosynthetic Ecosystems in Subsurface Habitats on Mars. Icarus 1992, 95, 300–308. [Google Scholar] [CrossRef] [PubMed]
  21. Cushing, G.E.; Titus, T.N.; Wynne, J.J.; Christensen, P.R. THEMIS Observes Possible Cave Skylights on Mars. Geophys. Res. Lett. 2007, 34. [Google Scholar] [CrossRef]
  22. Cushing, G.E. Mars Global Cave Candidate Catalog Archive Bundle; US Geological Survey: Troy, NY, USA, 2015.
  23. Sims, K.W.W.; Ackert, R.P.; Ramos, F.C.; Sohn, R.A.; Murrell, M.T.; DePaolo, D.J. Determining Eruption Ages and Erosion Rates of Quaternary Basaltic Volcanism from Combined U-Series Disequilibria and Cosmogenic Exposure Ages. Geology 2007, 35, 471. [Google Scholar] [CrossRef]
  24. Laughlin, A.W.; Poths, J.; Healey, H.A.; Reneau, S.; WoldeGabriel, G. Dating of Quaternary Basalts Using the Cosmogenic 3He and 14C Methods with Implications for Excess 40Ar. Geology 1994, 22, 135–138. [Google Scholar] [CrossRef]
  25. Laughlin, A.W.; WoldeGabriel, G. Dating the Zuni-Bandera Volcanic Field. In Natural History of El Malpais National Monument; Mabery, K., Ed.; New Mexico Bureau of Geology and Mineral Resources: Socorro, NM, USA, 1997; pp. 25–29. ISBN 1-883905-01-X. [Google Scholar]
  26. Cañaveras, J.C.; Cuezva, S.; Sanchez-Moral, S.; Lario, J.; Laiz, L.; Gonzalez, J.M.; Saiz-Jimenez, C. On the Origin of Fiber Calcite Crystals in Moonmilk Deposits. Naturwissenschaften 2006, 93, 27–32. [Google Scholar] [CrossRef]
  27. Larson, C.V. Nomenclature of Lava Tube Features. In Proceedings of the Sixth International Symposium on Vulcanospeleology, Hilo, HI, USA, 5–9 August 1991; Rea, G.T., Ed.; National Speleological Society: Huntsville, AL, USA, 1992; pp. 231–248, ISBN 1-879961-02-4. [Google Scholar]
  28. Spilde, M.N.; Northup, D.E.; Caimi, N.A.; Boston, P.J.; Stone, F.D.; Smith, S. Microbial Mat Communities in Hawaiian Lava Caves; GSA: Denver, CO, USA, 2016; Volume 48. [Google Scholar]
  29. Northup, D.E.; Melim, L.A.; Spilde, M.N.; Hathaway, J.J.M.; Garcia, M.G.; Moya, M.; Stone, F.D.; Boston, P.J.; Dapkevicius, M.L.N.E.; Riquelme, C. Lava Cave Microbial Communities Within Mats and Secondary Mineral Deposits: Implications for Life Detection on Other Planets. Astrobiology 2011, 11, 601–618. [Google Scholar] [CrossRef] [PubMed]
  30. Hill, C.A.; Forti, P. Speleothems. In Cave Minerals of the World; National Speleological Society: Huntsville, AL, USA, 1997; pp. 45–116. ISBN 978-1-879961-07-4. [Google Scholar]
  31. Giovannoni, S.J.; DeLong, E.F.; Schmidt, T.M.; Pace, N.R. Tangential Flow Filtration and Preliminary Phylogenetic Analysis of Marine Picoplankton. Appl. Environ. Microbiol. 1990, 56, 2572–2575. [Google Scholar] [CrossRef] [PubMed]
  32. Takada-Hoshino, Y.; Matsumoto, N. An Improved DNA Extraction Method Using Skim Milk from Soils That Strongly Adsorb DNA. Microbes Environ. 2004, 19, 13–19. [Google Scholar] [CrossRef]
  33. Bolyen, E.; Rideout, J.R.; Dillon, M.R.; Bokulich, N.A.; Abnet, C.C.; Al-Ghalith, G.A.; Alexander, H.; Alm, E.J.; Arumugam, M.; Asnicar, F.; et al. Reproducible, Interactive, Scalable and Extensible Microbiome Data Science Using QIIME 2. Nat. Biotechnol. 2019, 37, 852–857. [Google Scholar] [CrossRef]
  34. Quast, C.; Pruesse, E.; Yilmaz, P.; Gerken, J.; Schweer, T.; Yarza, P.; Peplies, J.; Glöckner, F.O. The SILVA Ribosomal RNA Gene Database Project: Improved Data Processing and Web-Based Tools. Nucleic Acids Res. 2012, 41, D590–D596. [Google Scholar] [CrossRef] [PubMed]
  35. Callahan, B.J.; McMurdie, P.J.; Rosen, M.J.; Han, A.W.; Johnson, A.J.A.; Holmes, S.P. DADA2: High-Resolution Sample Inference from Illumina Amplicon Data. Nat. Methods 2016, 13, 581–583. [Google Scholar] [CrossRef] [PubMed]
  36. Callahan, B.J.; McMurdie, P.J.; Holmes, S.P. Exact Sequence Variants Should Replace Operational Taxonomic Units in Marker-Gene Data Analysis. ISME J. 2017, 11, 2639–2643. [Google Scholar] [CrossRef]
  37. Oksanen, J.; Simpson, G.L.; Blanchet, F.G.; Kindt, R.; Legendre, P.; Minchin, P.R.; O’Hara, R.B.; Solymos, P.; Stevens, M.H.H.; Szoecs, E.; et al. Vegan: Community Ecology Package 2024.
  38. Wickham, H. Ggplot2: Elegant Graphics for Data Analysis; Springer: New York, NY, USA, 2016; ISBN 978-3-319-24277-4. [Google Scholar]
  39. Wickham, H. Reshaping Data with the Reshape Package. J. Stat. Softw. 2007, 21, 1–20. [Google Scholar] [CrossRef]
  40. Posit Team. RStudio: Integrated Development Environment for R; RStudio, Inc.: Boston, MA, USA, 2023. [Google Scholar]
  41. R Core Team. R: A Language and Environment for Statistical Computing; The R Project for Statistical Computing: Vienna, Austria, 2023. [Google Scholar]
  42. Vavrek, M.J. Fossil: Palaeoecological and Palaeogeographical Analysis Tools. Palaeontol. Electron. 2011, 14, 16. [Google Scholar]
  43. McMurdie, P.J.; Holmes, S. Phyloseq 2017.
  44. Joseph Nathaniel Paulson, H.T. metagenomeSeq 2017.
  45. Love, M.; Anders, S.; Ahlmann-Eltze, C.; Forbes, K.; Huber, W. DESeq2 2017.
  46. Anderson, M.J. A New Method for Non-parametric Multivariate Analysis of Variance. Austral Ecol. 2001, 26, 32–46. [Google Scholar] [CrossRef]
  47. Anderson, M.J. Permutational Multivariate Analysis of Variance (PERMANOVA). In Wiley StatsRef: Statistics Reference Online; Kenett, R.S., Longford, N.T., Piegorsch, W.W., Ruggeri, F., Eds.; Wiley: Hoboken, NJ, USA, 2017; pp. 1–15. ISBN 978-1-118-44511-2. [Google Scholar]
  48. McCune, B.; Grace, J.B.; Urban, D.L. Analysis of Ecological Communities, 2nd ed.; MjM Software Design: Gleneden Beach, OR, USA, 2002; ISBN 978-0-9721290-0-8. [Google Scholar]
  49. Gonzalez-Pimentel, J.L.; Martin-Pozas, T.; Jurado, V.; Laiz, L.; Fernandez-Cortes, A.; Sanchez-Moral, S.; Saiz-Jimenez, C. The Marine Bacterial Genus Euzebya Is Distributed Worldwide in Terrestrial Environments: A Review. Appl. Sci. 2023, 13, 9644. [Google Scholar] [CrossRef]
  50. Love, M.I.; Huber, W.; Anders, S. Moderated Estimation of Fold Change and Dispersion for RNA-Seq Data with DESeq2. Genome Biol. 2014, 15, 550. [Google Scholar] [CrossRef]
  51. Melim, L.A.; Northup, D.E.; Spilde, M.N.; Boston, P.J. Update: Living Reticulated Filaments from Herbstlabyrinth-Adventhöhle Cave System, Germany. J. Cave Karst Stud. 2015, 77, 87–90. [Google Scholar] [CrossRef]
  52. Cailleau, G.; Verrecchia, E.P.; Braissant, O.; Emmanuel, L. The Biogenic Origin of Needle Fibre Calcite. Sedimentology 2009, 56, 1858–1875. [Google Scholar] [CrossRef]
  53. Bindschedler, S.; Cailleau, G.; Braissant, O.; Millière, L.; Job, D.; Verrecchia, E.P. Unravelling the Enigmatic Origin of Calcitic Nanofibres in Soils and Caves: Purely Physicochemical or Biogenic Processes? Biogeosciences 2014, 11, 2809–2825. [Google Scholar] [CrossRef]
  54. Rowe, M.C.; Lassiter, J.C. Chlorine Enrichment in Central Rio Grande Rift Basaltic Melt Inclusions: Evidence for Subduction Modification of the Lithospheric Mantle. Geology 2009, 37, 439–442. [Google Scholar] [CrossRef]
  55. Peters, T.J.; Menzies, M.; Thirlwall, M.; Kyle, P.R. Zuni–Bandera Volcanism, Rio Grande, USA—Melt Formation in Garnet- and Spinel-Facies Mantle Straddling the Asthenosphere–Lithosphere Boundary. Lithos 2008, 102, 295–315. [Google Scholar] [CrossRef]
  56. Oberbeck, V.R.; Quaide, W.L.; Greeley, R. On the Origin of Lunar Sinuous Rilles. Mod. Geol. 1969, 1, 75–80. [Google Scholar]
  57. Greeley, R. Lava Tubes and Channels in the Lunar Marius Hills. Moon 1971, 3, 289–314. [Google Scholar] [CrossRef]
  58. Carr, M.H. Volcanism on Mars. J. Geophys. Res. 1973, 78, 4049–4062. [Google Scholar] [CrossRef]
  59. Baker, V.R.; Strom, R.G.; Gulick, V.C.; Kargel, J.S.; Komatsu, G.; Kale, V.S. Ancient Oceans, Ice Sheets and the Hydrological Cycle on Mars. Nature 1991, 352, 589–594. [Google Scholar] [CrossRef]
  60. Westall, F.; Brack, A.; Hofmann, B.; Horneck, G.; Kurat, G.; Maxwell, J.; Ori, G.G.; Pillinger, C.; Raulin, F.; Thomas, N.; et al. An ESA Study for the Search for Life on Mars. Planet. Space Sci. 2000, 48, 181–202. [Google Scholar] [CrossRef]
  61. Michalski, J.R.; Cuadros, J.; Niles, P.B.; Parnell, J.; Deanne Rogers, A.; Wright, S.P. Groundwater Activity on Mars and Implications for a Deep Biosphere. Nat. Geosci. 2013, 6, 133–138. [Google Scholar] [CrossRef]
  62. Kasting, J.F.; Whitmire, D.P.; Reynolds, R.T. Habitable Zones around Main Sequence Stars. Icarus 1993, 101, 108–128. [Google Scholar] [CrossRef] [PubMed]
  63. McMahon, S.; O’Malley-James, J.; Parnell, J. Circumstellar Habitable Zones for Deep Terrestrial Biospheres. Planet. Space Sci. 2013, 85, 312–318. [Google Scholar] [CrossRef]
  64. Boston, P.J.; Spilde, M.N.; Northup, D.E.; Melim, L.A.; Soroka, D.S.; Kleina, L.G.; Lavoie, K.H.; Hose, L.D.; Mallory, L.M.; Dahm, C.N.; et al. Cave Biosignature Suites: Microbes, Minerals, and Mars. Astrobiology 2001, 1, 25–55. [Google Scholar] [CrossRef] [PubMed]
  65. Baldridge, W.S. Petrology and Petrogenesis of Plio-Pleistocene Basaltic Rocks from the Central Rio Grande Rift, New Mexico, and Their Relation to Rift Structure. In Rio Grande Rift: Tectonics and Magmatism; American Geophysical Union (AGU): Washington, DC, USA, 1979; pp. 323–354. ISBN 978-1-118-66498-8. [Google Scholar]
  66. Palma, V.; González-Pimentel, J.L.; Jimenez-Morillo, N.T.; Sauro, F.; Gutiérrez-Patricio, S.; De La Rosa, J.M.; Tomasi, I.; Massironi, M.; Onac, B.P.; Tiago, I.; et al. Connecting Molecular Biomarkers, Mineralogical Composition, and Microbial Diversity from Mars Analog Lava Tubes. Sci. Total Environ. 2024, 913, 169583. [Google Scholar] [CrossRef]
  67. Ouyang, E.; Liu, Y.; Ouyang, J.; Wang, X. Effects of Different Wastewater Characteristics and Treatment Techniques on the Bacterial Community Structure in Three Pharmaceutical Wastewater Treatment Systems. Environ. Technol. 2019, 40, 329–341. [Google Scholar] [CrossRef]
  68. Prescott, R.D.; Zamkovaya, T.; Donachie, S.P.; Northup, D.E.; Medley, J.J.; Monsalve, N.; Saw, J.H.; Decho, A.W.; Chain, P.S.G.; Boston, P.J. Islands Within Islands: Bacterial Phylogenetic Structure and Consortia in Hawaiian Lava Caves and Fumaroles. Front. Microbiol. 2022, 13, 934708. [Google Scholar] [CrossRef]
  69. Hao, L.; Zhang, B.; Feng, C.; Zhang, Z.; Lei, Z.; Shimizu, K.; Cao, X.; Liu, H.; Liu, H. Microbial Vanadium (V) Reduction in Groundwater with Different Soils from Vanadium Ore Mining Areas. Chemosphere 2018, 202, 272–279. [Google Scholar] [CrossRef] [PubMed]
  70. Li, Q.; Song, A.; Yang, H.; Müller, W.E.G. Impact of Rocky Desertification Control on Soil Bacterial Community in Karst Graben Basin, Southwestern China. Front. Microbiol. 2021, 12, 636405. [Google Scholar] [CrossRef] [PubMed]
  71. Stomeo, F.; Portillo, M.C.; Gonzalez, J.M.; Laiz, L.; Saiz-Jimenez, C. Pseudonocardia in White Colonizations in Two Caves with Paleolithic Paintings. Int. Biodeterior. Biodegrad. 2008, 62, 483–486. [Google Scholar] [CrossRef]
  72. Duan, Y.; Wu, F.; Wang, W.; He, D.; Gu, J.-D.; Feng, H.; Chen, T.; Liu, G.; An, L. The Microbial Community Characteristics of Ancient Painted Sculptures in Maijishan Grottoes, China. PLoS ONE 2017, 12, e0179718. [Google Scholar] [CrossRef]
  73. Zhang, B.; Wu, X.; Tai, X.; Sun, L.; Wu, M.; Zhang, W.; Chen, X.; Zhang, G.; Chen, T.; Liu, G.; et al. Variation in Actinobacterial Community Composition and Potential Function in Different Soil Ecosystems Belonging to the Arid Heihe River Basin of Northwest China. Front. Microbiol. 2019, 10, 2209. [Google Scholar] [CrossRef]
  74. Martin-Pozas, T.; Fernandez-Cortes, A.; Cuezva, S.; Cañaveras, J.C.; Benavente, D.; Duarte, E.; Saiz-Jimenez, C.; Sanchez-Moral, S. New Insights into the Structure, Microbial Diversity and Ecology of Yellow Biofilms in a Paleolithic Rock Art Cave (Pindal Cave, Asturias, Spain). Sci. Total Environ. 2023, 897, 165218. [Google Scholar] [CrossRef] [PubMed]
  75. Cheng, X.; Xiang, X.; Yun, Y.; Wang, W.; Wang, H.; Bodelier, P.L.E. Archaea and Their Interactions with Bacteria in a Karst Ecosystem. Front. Microbiol. 2023, 14, 1068595. [Google Scholar] [CrossRef] [PubMed]
  76. Hathaway, J.J.M.; Moser, D.P.; Blank, J.G.; Northup, D.E. A Comparison of Primers in 16S rRNA Gene Surveys of Bacteria and Archaea from Volcanic Caves. Geomicrobiol. J. 2021, 38, 741–754. [Google Scholar] [CrossRef]
  77. Baker, B.J.; De Anda, V.; Seitz, K.W.; Dombrowski, N.; Santoro, A.E.; Lloyd, K.G. Diversity, Ecology and Evolution of Archaea. Nat. Microbiol. 2020, 5, 887–900. [Google Scholar] [CrossRef]
Figure 1. Mineral and microbial sample types from Hawaiian caves (photo credits: Dr. Kenneth Ingham).
Applsci 14 06500 g001
Figure 2. Alpha diversity, by cave. Representations of library size, species richness, and inverse-Simpson diversity. Box plots represent medians, as well as all four quartiles.
Applsci 14 06500 g002
Figure 3. NMDS, by cave. Beta diversity ordination of our data, with normal confidence ellipses (where 95% of the data are expected to be found), generated by ggplot2. A`a, Pantheon, and Four Windows are New Mexican caves, and Kula Kai, Maelstrom, and Tapa are Hawaiian caves.
Applsci 14 06500 g003
Figure 4. NMDS, by speleothem. Graphed here are the normal confidence ellipses (where 95% of the data are expected to fall), generated by ggplot2.
Applsci 14 06500 g004
Figure 5. Bacterial relative abundance by cave and location. The top nine bacterial genera by cave, with the three Hawaiian caves on the left and the three New Mexican caves on the right.
Applsci 14 06500 g005
Figure 6. Bacterial relative abundance by cave and location. Top 6 genera from each location, organized by speleothem and location.
Applsci 14 06500 g006
Figure 7. Differential abundance analysis. The output is New Mexico over Hawai`i, a positive log2 fold change output indicates high differential abundance in New Mexico, and a negative log2 fold change output indicates low differential abundance in New Mexico. Each point represents a unique ASV. Colors are associated with phyla and the x-axis is genera.
Applsci 14 06500 g007
Figure 8. Number of observations of different microbial morphologies across different sample types. “Number of Samples Analyzed” is a reference to the number of cave features placed under the SEM. “Number of Images” references the sum total of different scanning electron micrographs taken for all samples analyzed. The data are represented in two different heat maps. The microbial morphologies are color coded with dark blue representing extremely low numbers observed, and dark red representing high abundance; white is the intermediate. Sample size goes from white, representing a low number of samples analyzed, to dark green, representing a high number of samples analyzed.
Applsci 14 06500 g008
Figure 9. (AF) SEM micrographs of various microbial morphologies found in Hawaiian and New Mexican lava caves: (A) smooth filaments and smooth cocci microbes, (B) “fuzzy” cocci, (C) fuzzy filaments, (D) spiral bacteria (arrow), (E) beads-on-a-string and (F) reticulated filaments.
Applsci 14 06500 g009
Figure 10. (AC) Microbial mats from lava caves in Hawai`i and New Mexico. (A) A large swath of “fuzzy” cocci at the surface of a Hawaiian microbial mat sample. (B) A large group of “fuzzy” and “smooth” filaments. Cloudy areas indicate the presence of a biofilm. (C) A mixture of “fuzzy” cocci, “fuzzy” and “smooth” filaments, and biofilm from a New Mexican lava cave.
Applsci 14 06500 g010
Figure 11. (AC) Ooze under SEM. (A) Ooze from New Mexico. (B) Ooze from Hawai`i. Reticulated filaments can be seen within the image. (C) Ooze from Hawai`i, featuring an insect part. Differentiation between the ooze, and the mineral matrix below it can be observed.
Applsci 14 06500 g011
Figure 12. (A,B) SEM micrographs of the surface of coralloids. (A) Coralloid from Hawai`i with a “flakey” superficial mineral crust. (B) Coralloid from a New Mexican lava cave with both smooth and flakey areas.
Applsci 14 06500 g012
Figure 13. (A,B) Gypsum spheroids from two different Hawaiian caves. (A) Spheroid with porous but otherwise solid ridges at the surface. (B) Spheroid with ridge-like protrusions and gypsum debris in between.
Applsci 14 06500 g013
Figure 14. (A,B) Mineral crusts from Hawai`i. (A) Example of microbes on the surface of a mineral crust. Underlying sample substrate can still be seen. (B) At the lower magnification on the right, we see nothing but inorganic material.
Applsci 14 06500 g014
Figure 15. (A,B) Various forms of moonmilk under SEM. (A) Crusty moonmilk from New Mexico. (B) Fluffy moonmilk from Hawai`i. Both consist of thin and rod-like CaCO3 crystals, but the crusty moonmilk tends to have morphologically robust crystals whereas the fluffy moonmilk largely consists of needle fiber calcite crystals [52,53].
Applsci 14 06500 g015
Table 1. Concentration of selected elements and oxides in the basalt substrate, divided by cave.
New MexicoHawaii
CaveFour-WindowsPantheon A`a CaveMaelstromKula KaiTapa
Sample No.sFW190831-01BW180325-14AA18113-05MAL171220-11, -20KK171218-6TAP171219-3
Wt%
P2O50.300.310.170.24–0.260.250.23–0.25
MnO0.180.180.170.17–0.180.174–0.180.17–0.18
SO30.020.030.010.01–0.020.007–0.0100.01–0.02
FeO10.982011.3410.35010.627010.44–10.8910.35–10.80
ppm
Cu7015972121–145117–133122–135
V282na na 329299–322276–302
Analyses by XRF at UNM; na = not analyzed.
Disclaimer/Publisher’s Note: The statements, opinions and data contained in all publications are solely those of the individual author(s) and contributor(s) and not of MDPI and/or the editor(s). MDPI and/or the editor(s) disclaim responsibility for any injury to people or property resulting from any ideas, methods, instructions or products referred to in the content.

