Article

Stress State Analysis of the Soil Plug of Open-Ended Piles during Impact Driving Using Particle Flow Code (PFC)

School of Civil, Environmental and Architectural Engineering, Korea University, Seoul 02841, Republic of Korea
*
Author to whom correspondence should be addressed.
Appl. Sci. 2024, 14(15), 6512; https://doi.org/10.3390/app14156512
Submission received: 11 July 2024 / Revised: 23 July 2024 / Accepted: 24 July 2024 / Published: 25 July 2024
(This article belongs to the Special Issue Soil-Structure Interaction in Structural and Geotechnical Engineering)

Abstract

:
The increasing demand for energy and industrial development necessitates the construction of large-scale structures, often in previously undeveloped areas. Pile foundations, particularly open-ended piles (OEPs), are extensively used in such projects due to their drivability and structural integrity. This research focuses on the unique plugging effect in OEPs, where soil enters the pile during installation, forming a soil plug that significantly contributes to the pile’s static resistance. A significant challenge in OEP applications is the uncertainty in internal stress states and bearing capacity due to the dynamic nature of impact driving in sands. Current standards assume that the inner skin friction equals the outer skin friction along the entire soil plug length, a conservative approach lacking in consideration of the actual stress states. Utilizing the Particle Flow Code (PFC) software, this research aims to analyze the internal stress conditions within the soil plug during impact driving, providing a more accurate prediction of OEP behavior under various conditions. The study’s findings, validated against experimental results, enhance the understanding of soil–pile interactions, contributing to the development of improved design methodologies for open-ended piles.

1. Introduction

Due to industrial development and increasing energy demand, structures are being constructed on a large scale, often in previously undeveloped areas. As the size of structures increases with advancements in construction and its technologies, pile foundations have become the most essential and widely used type of foundation [1]. Loads from the upper structure are transferred to the subsoils through piles and resisted through tip resistance and skin friction. Pile foundations govern the overall stability of the structure, resisting significant challenges from geological or meteorological hazards that have recently gained attention. In particular, open-ended piles (OEPs) are employed to facilitate drivability and to prevent pile destruction by allowing the intrusion of soil into the pile during pile installation [2]. They are frequently used not only in buildings but also in infrastructure projects such as wind turbines, oil platforms, and bridges, both in onshore and offshore environments, due to their efficient construction [3].
When an open-ended pile begins to penetrate, soil enters the central cavity of the OEP, and the soil–pile friction gradually compacts the internal soil as penetration continues. This phenomenon is referred to as the ‘plugging effect’, and the compacted soil inside the pile is called a ‘soil plug’, which is a distinctive feature of OEPs. In this state, the friction between the soil plug and the interior of the OEP significantly contributes to the static resistance of the pile compared with conventional pile foundations. As driving continues, the degree of the soil plug transitions into a ‘fully plugged’ state, at which point no further soil inflow is allowed, causing the OEP to perform as a closed-ended pile [4,5]. This phenomenon is governed by the interplay between two forces acting on the soil plug within the pile: (a) the drag-down friction from the internal skin of the pile and (b) the uplifting thrust at the bottom of the soil plug.
Due to the significant influence of the ‘plugging state’ on pile behavior, several researchers have studied factors affecting plug formation [5,6,7,8,9,10,11]. It has been consistently reported that three major factors influence the formation of soil plugs: (1) pile geometry, (2) soil conditions, and (3) installation method. In summary, the optimal conditions for the longer soil plug development are (1) a large pile diameter [4,6,10], (2) dense ground conditions [7,11], and (3) dynamic driving rather than static driving methods [8,9,12,13]. According to the literature, the relation between the soil plug length and the pile penetration depth has been used to represent the plugging state [14,15,16,17,18,19,20] because the stress state measurement of the soil plug is highly limited. Two typical plug length indices are the Plug Length Ratio (PLR) and the Incremental Filling Ratio (IFR). The PLR is defined as the total plug length over the total penetration length at a specific driving stage, while the IFR is defined as the increment in plug length divided by the incremental penetration length for each driving impact. These indices can also be expressed using the following equations:
P L R = L p D p
I F R = Δ L p Δ D p
Here, Lp and Dp present the soil plug length and the depth of pile penetration, respectively, with Δ referring to the increment of the variable. An IFR is known to better represent the degree of plugging state than a PLR during open-ended pile installation [4,7]. An IFR close to ‘1’ indicates that the pile is installed in a fully cored state, and ‘0’ means that a soil plug inside the pile exhibits a fully plugged mode, preventing the soil from below the pile tips from entering the open-ended pile.
When the plugging effect occurs within open-ended piles, especially when it is impact-driven in sands, two major challenges occur. First, during the penetration, the huge inertial force exerted by the impact applied to the pile and its dynamic nature strengthens the uncertainty of the plugging state and the internal stress state of the soil plug. Additionally, the huge uncertainty in the bearing capacity of the pile is also problematic after installation, which stems from the uncertainty of the stress state throughout the installation process. In this context, present standards or manuals suggest a design method that estimates the inner skin friction to be equal to the outer skin friction and assumes it to act along the entire length of the soil plug [21,22]. These conclusions, made without consideration of the internal stress state of the soil plug, are known to be highly conservative. There are only limited studies that directly investigate the internal state experimentally [23], and numerical studies lack comprehensive validation of the pile penetration model that covers both the soil–soil and soil–pile interaction while simulating impact driving. The difficulty in experimentally measuring the internal stress condition further complicates solving the problem in this regard. Alternatively, among previous numerical study methodologies, the Finite Element Method (FEM) and the Finite Difference Method (FDM) have an inherent disadvantage as they are unsuitable for analyzing soil behavior during pile installation simulations without any additional supportive techniques [24,25,26,27,28]. Although the Discrete Element Method (DEM) can be utilized to investigate large-displacement analysis of soil behavior, previous studies have primarily focused on verifying the behavior of the pile itself, and they lack sufficient validation of the soil–pile interaction during the pile installation process [10,29,30,31].
Therefore, this research aims to investigate and analyze the stress state within the soil plug of open-ended piles during impact driving using the Particle Flow Code (PFC) software (v.6.0). Specifically, it seeks to address the uncertainties and challenges associated with the plugging effect in OEPs, which significantly affect their structural integrity and load-bearing capacity. The study aims to provide insights into the internal stress conditions of the soil plug, which are crucial for accurately predicting the behavior of OEPs under various installation conditions. Moreover, the study verified the DEM model through comprehensive comparisons with the author’s experimental results [32]. While the previous DEM analysis only validated the soil–soil interaction, this study enhanced the accuracy and reliability of its research results by verifying both soil–soil and soil–pile interactions. By employing PFC simulations, the research intends to advance our understanding beyond the current conservative design methods and traditional numerical models, thereby contributing to improved methodologies for the design and construction of open-ended piles.

2. Methodology

In this study, commercial software, namely the PFC2D (v.6.0, Itasca Software, Minneapolis, MN, USA), was used for DEM modeling of the pile penetration process. Numerous researchers have extensively utilized the PFC program to perform research on the penetration issue [10,29,30,31,33,34]. Each particle is represented as a rigid circle with density in two-dimensional space, and the contacts between them carry forces and moment, with their calculations determined by a contact model that includes contact determination criteria and which obeys Newton’s law of motion [35]. In this study, an open-ended pile and a sand sample were generated in PFC2D based on the specifications of the laboratory model pile test [32], and the penetration process of the pile was simulated to analyze the inner state of the soil plug.

2.1. Laboratory Model Pile Test

Here, we describe the laboratory model pile test conducted by the author to validate the numerical analysis results using DEM analysis. Ottawa F-55 sand was used as the test soil, which was prepared by dry pluviation to achieve 80% relative density in a cube-shaped soil chamber. The Unified Soil Classification System (USCS) classifies Ottawa F-55 silica sand as SP: poorly graded sand. More details on the test material are summarized in Table 1. In addition, Figure 1 also illustrates the particle size distribution curve of the test material and the granular material in PFC.
The open-ended model pile used in the experiment had an external diameter of 88.9 mm and an internal diameter of 49.3 mm. It was installed using manual hammering with an 8 kg hammer dropped from a height of 800 mm, penetrating to a depth of 670 mm. Measurements were taken of both the penetration depth and the soil plug length during the impact-driving of 96 blows in total. Through this laboratory model pile test, we evaluated the drivability and load-carrying capacity of the OEP. The double-wall system was utilized to isolate and assess the internal shaft friction on the inner circumferential surface induced by the soil plug. This enabled a study of how the soil plug affects the pile’s drivability and bearing capacity. However, experiments are time-consuming and labor-intensive, which limit the ability to explore various conditions. Therefore, it is advantageous to use numerical methods for additional parametric studies.

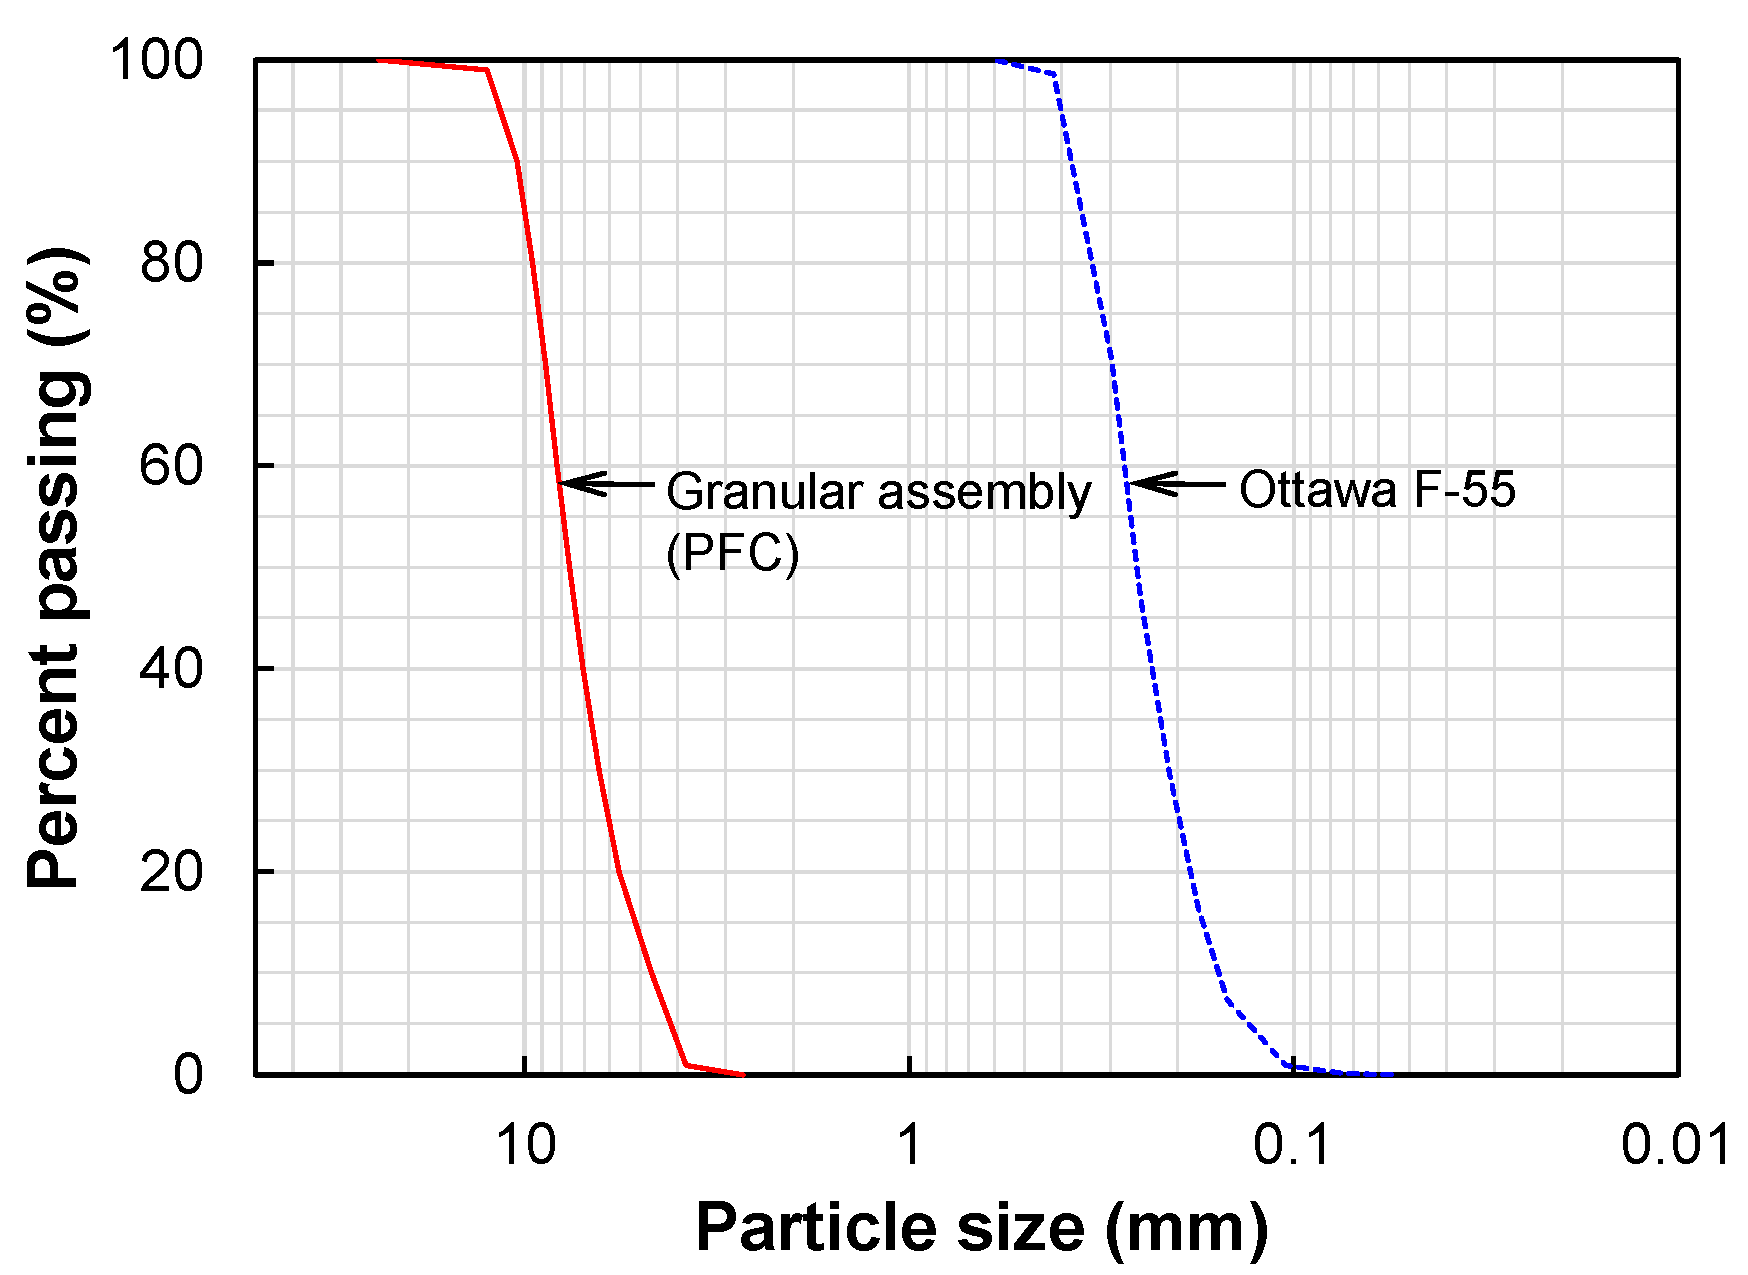
2.2. Granular Assembly in PFC Modeling

A granular assembly was generated in PFC2D by following the particle distribution curve of Ottawa F-55 sand as shown in Figure 1. However, due to a significant increase in computational time with real-scale particle sizes, a magnification procedure on the granular assembly was undertaken to reduce the number of particles. The D50 of the sample is 3.84 mm as a result, which is within an acceptable range, as demonstrated in previous studies by several researchers [10,29,38].

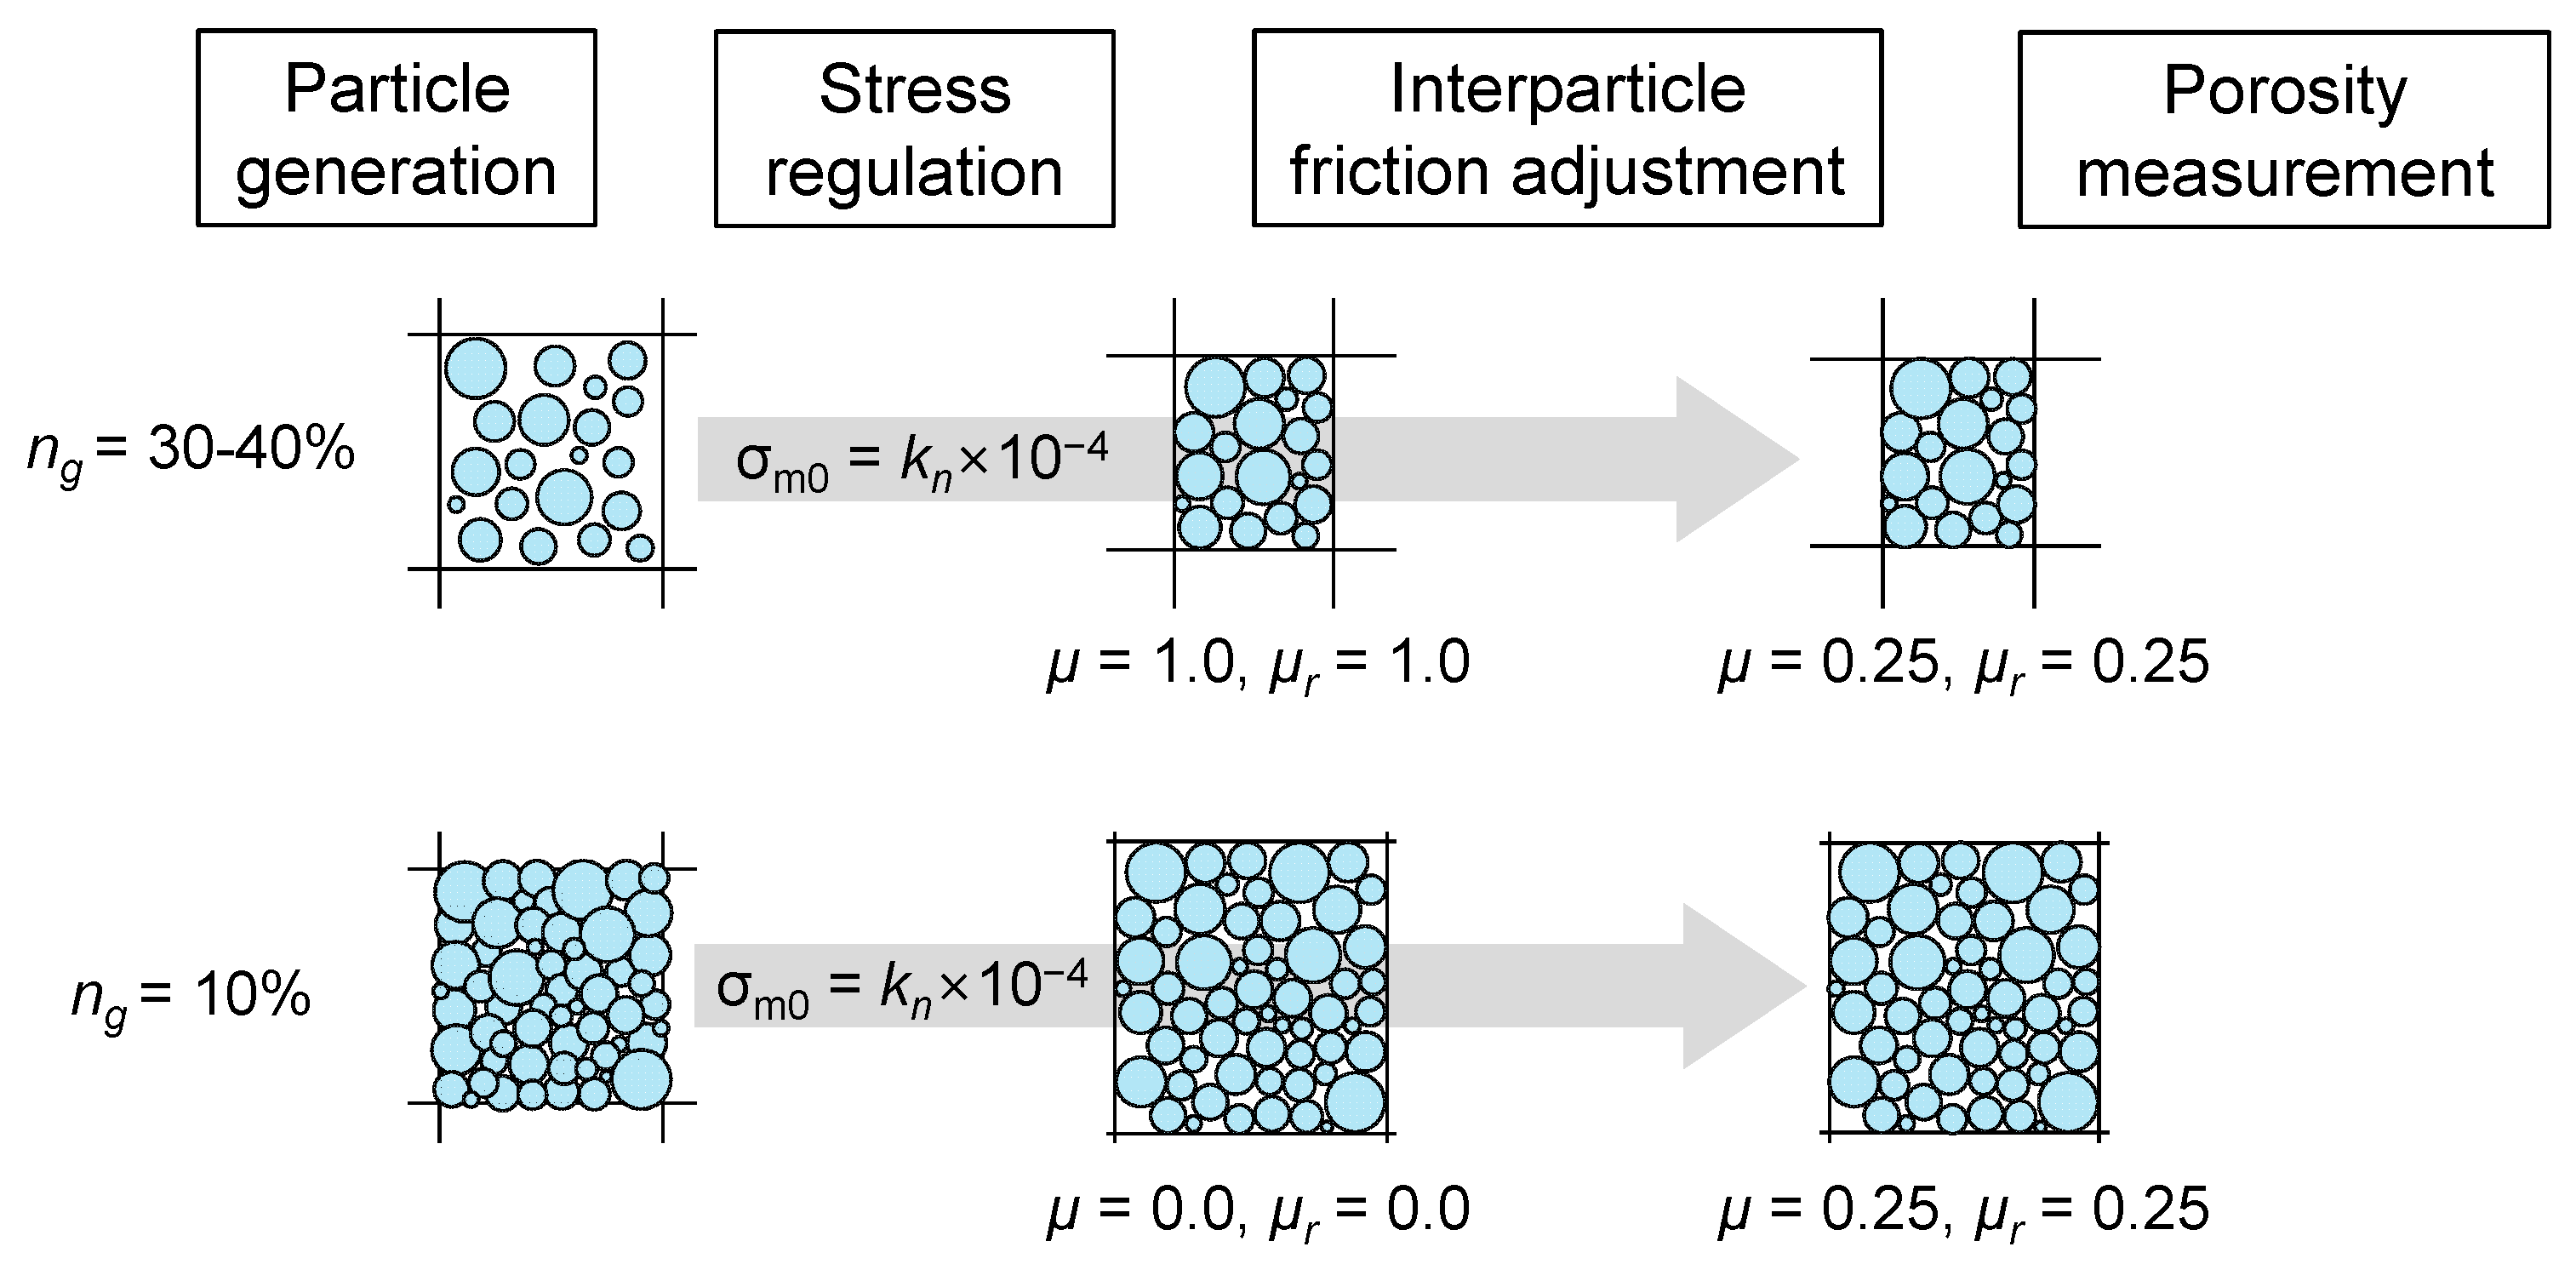
2.3. Sample Preparation in PFC Modeling

With the prepared set of particles, a soil sample was formed using specific steps to simulate the author’s conducted model pile test. The sample preparation in PFC consisted of two large steps: (1) assigning a contact model with validation of the soil–soil interaction to make the particles behave like Ottawa F-55 sand; and (2) vertically confining the particles to control the lateral earth pressure coefficient (K0) and the relative density within the soil sample in the DEM. First, the Rolling Resistance Linear Model (RRLM) was adopted as a contact model to achieve a realistic internal friction angle, which is herculean in the conventional Linear Model [30].
Input parameters such as the normal and shear stiffness of the contact and the rolling friction coefficient were calibrated through a series of numerical biaxial tests in the DEM, and the following results are listed in Table 2. The soil sample was prepared at a relative density of 80%, and each was confined at a stress of 50, 100, and 200 kPa during the axial compression stage until the axial strain reached 20%. The deviatoric stress at failure was measured for each confining stress, and the subsequent results are shown in Figure 2. The peak internal friction angle was determined to be 37.8°, which exhibits a mean absolute error of 0.5% compared with the experimental value of 38° obtained by El-Sekelly et al. [37].
Next, a rectangular soil container consisting of four rigid walls was prepared in a two-dimensional DEM simulation. The container has a width of 1.9 m and a depth of 1.4 m to prevent boundary effects, as demonstrated by Esposito et al. [39], where the boundary distance exceeds by 10-fold the outer diameter of the pile. Figure 3 presents the configuration of an overview of the PFC modeling.
Particles following the prepared PSD were then generated and suspended inside the container without any initial contact under zero gravity. The resulting porosity (n) was 0.158, corresponding to a relative density of 80%, which resulted in the generation of 68,799 particles. Note that the relative density was used as the criterion for sample preparation following the recommendation of Salot et al. [40] to simulate the packing of sand, and a relative density of 80% was calculated based on the extreme porosities determined by the criteria suggested by Muir Wood and Maeda [41], which are widely used in DEM analysis [42,43]. Figure 4 shows the concept of the evaluation of extreme porosities of granular material. The generated particles with assigned mechanical properties are finally compressed vertically by moving the upper and bottom walls toward each other to form contacts between particles.
Figure 5 shows a lateral earth pressure (K0) of 0.384 throughout the granular media after activating gravity at 9.81 m/s2, along with the distribution of horizontal and vertical stress and the porosity according to depth.

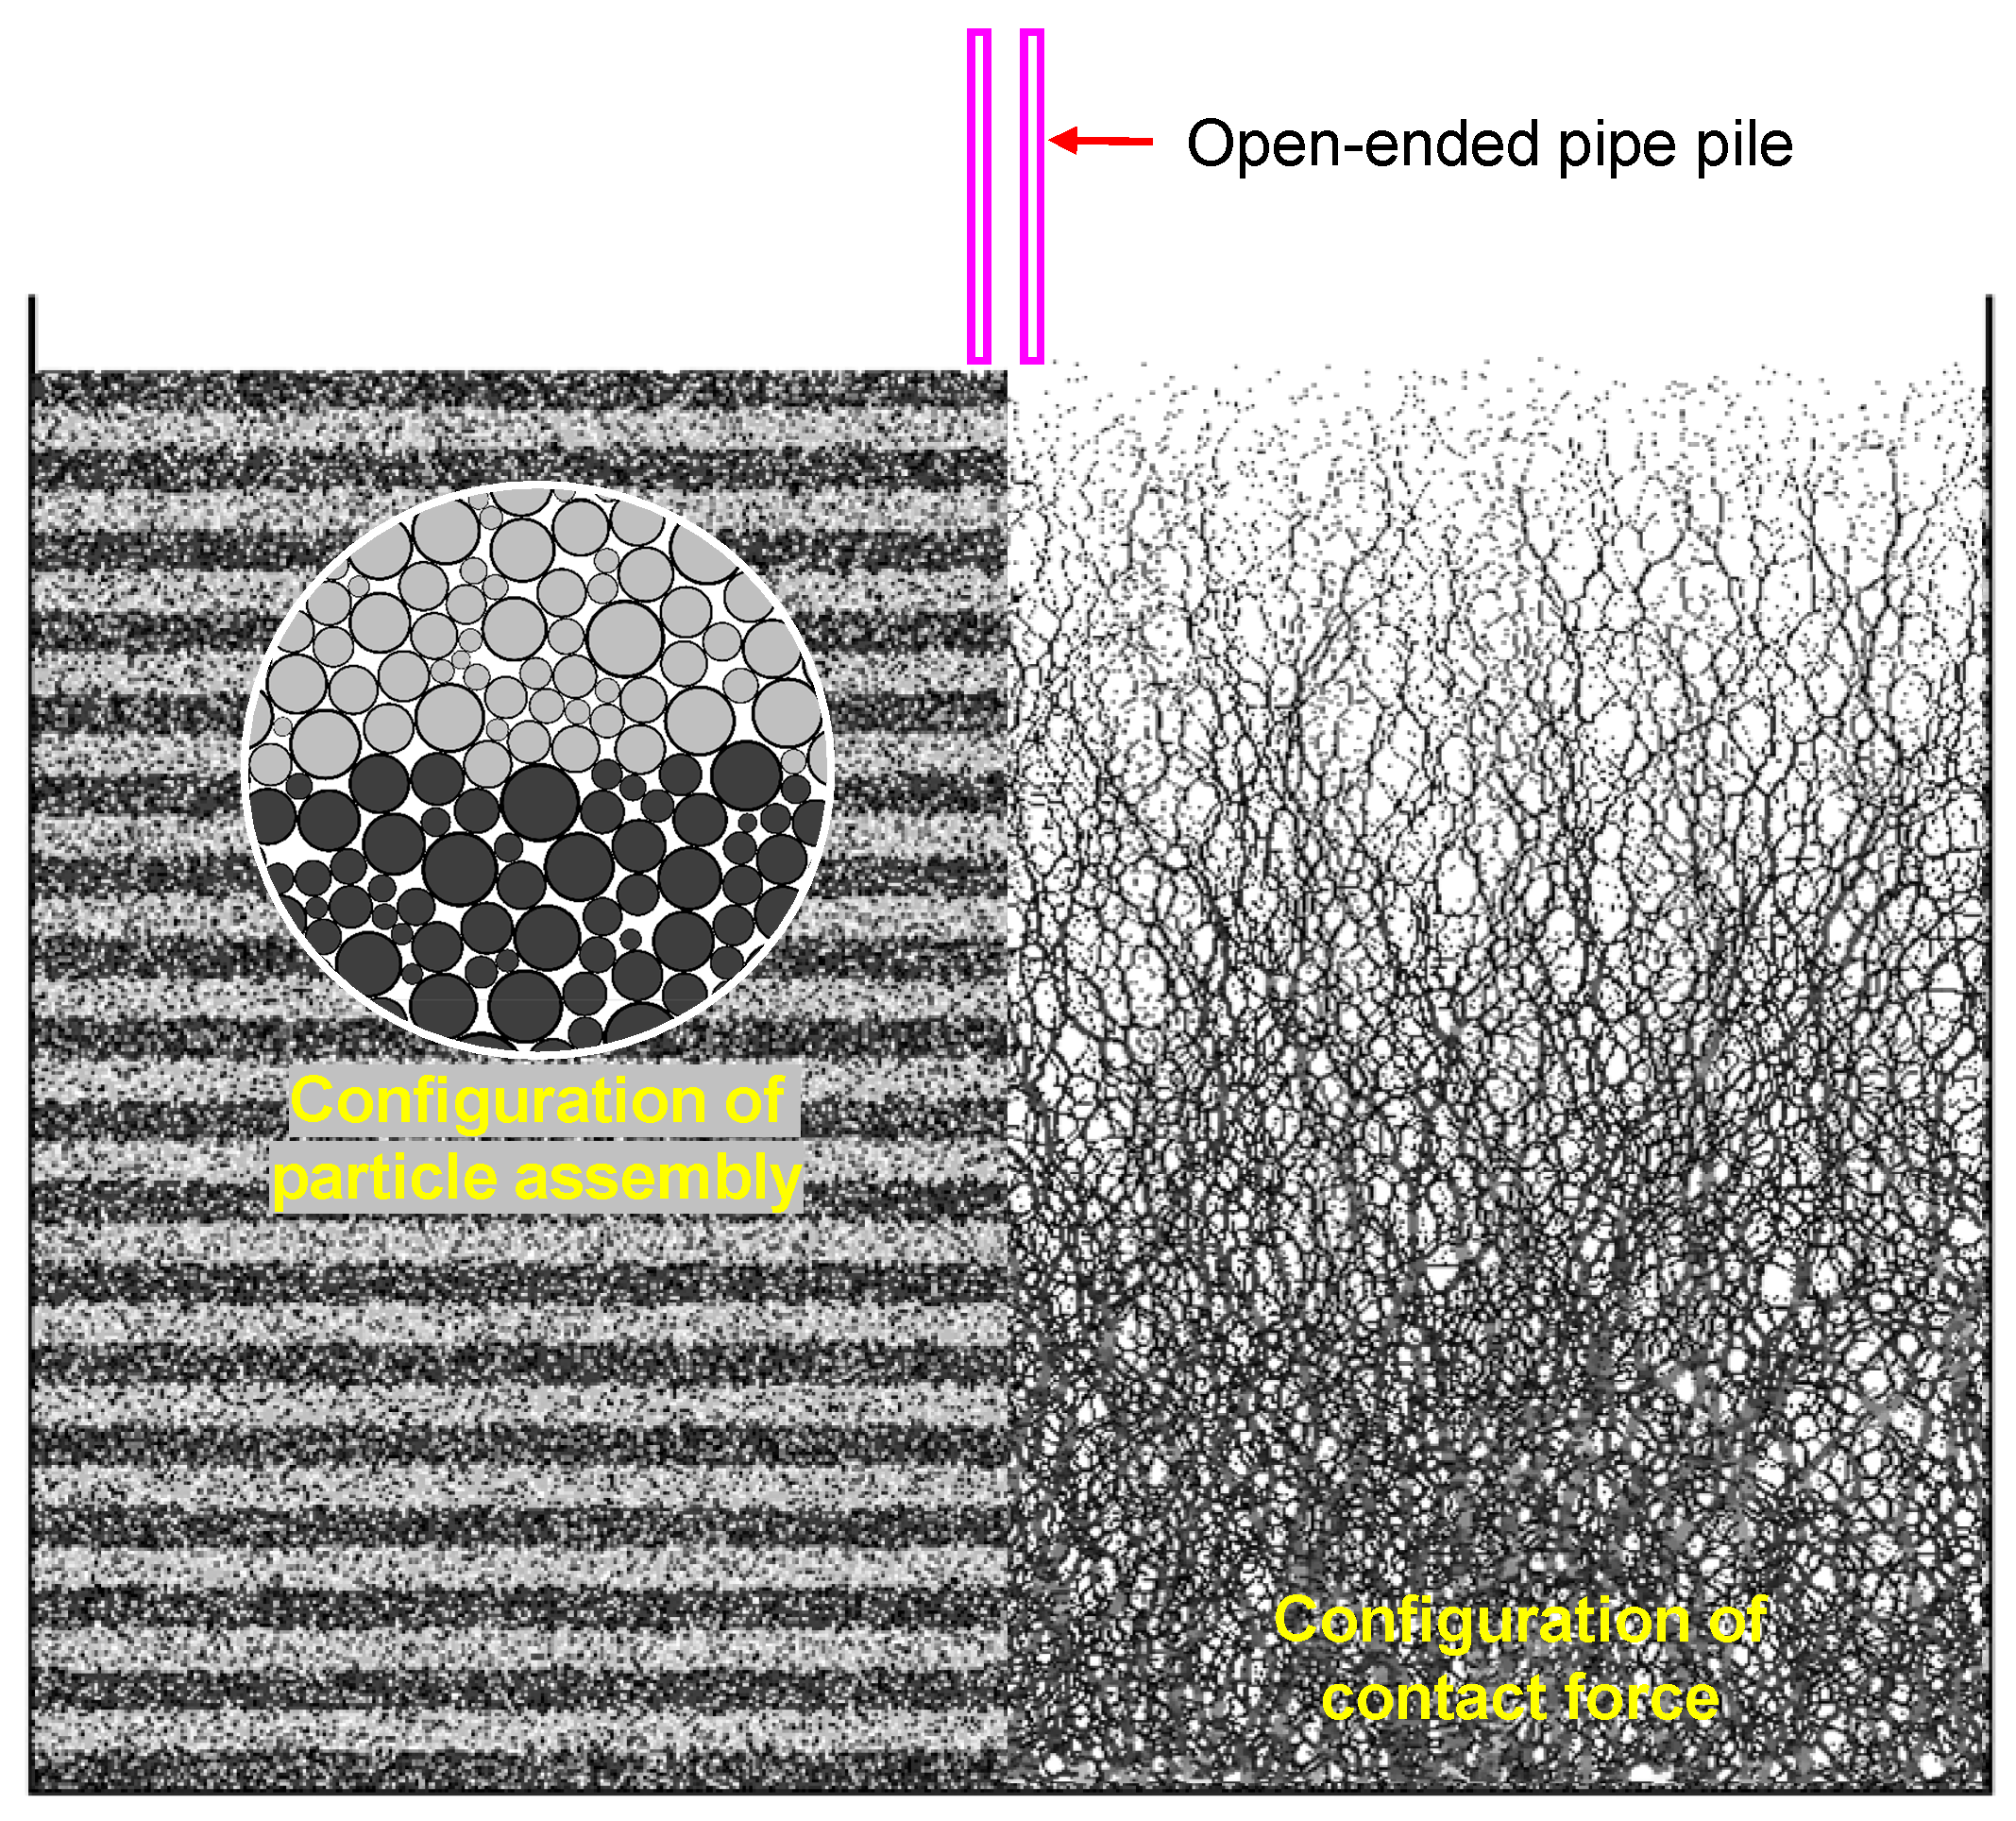
2.4. Simulation of Pile Installation

An open-ended pile with inner and outer diameters of 49.3 mm (Din) and 88.9 mm (Dout) was generated by adhering to the pile geometry used by Kim et al. [32]. Under 2D plane–strain conditions, a pair of slender rectangles was created to represent a vertical cross-section of the tubular pile (see Figure 3). Rigid walls were employed as elements for the pile in PFC to represent the relative rigidity of the carbon steel pile used in the experiment.
To simulate the pile penetration from hammer impact, the vertical displacement of the pile over simulation time was controlled by following the experimental records. For the efficiency of simulation, the experimental displacement from each hammer impact was merged every eight blows, resulting in a total of twelve stages for the numerical analysis.
Figure 6 shows the merged pile displacement plotted against the simulation time. With fixed displacement, the pile response from each impact was simulated in two steps: (1) moving downward at a constant velocity (initially 1.8 m/s) until reaching a target displacement, and (2) performing equilibrium analysis. This method successfully captures the influence of pile penetration on the soil sample, as proven by previous studies [10,39].

2.5. Research Program

The internal stress state within the soil plug was numerically analyzed based on the validation of both interparticle and soil–pile behavior of the DEM model. The interparticle behavior was validated by preparing a sample of particles at a target relative density of the physical sample (Dr = 80%) and by matching the internal friction angle of the numerical sample at a peak state to that of the physical sand bed ( ϕ p = 38 ° ). The peak state in the DEM model was induced by the biaxial compression test conducted on a numerical cell prepared at a relative density of 80%. Next, the particle–pile behavior was validated by matching the length of the soil plug resulting from the simulation of pile penetration to that of the physical model pile test. In this process, the pile in the simulation was generated to match the geometry of the model pile used in the experiment, and the simulation of its installation followed the pile displacement record from the same experiment, as described in Section 2.4.
After the comprehensive validation of the model, it was declared as the reference model and named D90 since the outer diameter of the open-ended pile used in this model was 89.9 mm. Then, three different models with varying pile diameters were simulated to further investigate the influence of pile diameter on the behavior of the soil plug. While maintaining the thickness of the pile, the outer diameters varied from 98.9 mm, 108.9 mm, and 128.9 mm, and the three models were named D100, D110, and D130, respectively.

3. Simulation Results and Discussion

3.1. Validation of Soil–Soil Interaction

As described in Section 2.3 and Section 2.5, the soil–soil interaction throughout the sand bed in the DEM model was validated by controlling its relative density and peak-state internal friction angle. It was determined to be 37.8° (measured from a biaxial cell prepared at a relative density of 80%), which exhibits a mean absolute error of 0.5% compared with the experimental value of 38° from a sample prepared at a relative density within a range of 80–90%.

3.2. Validation of Soil–Pile Interaction

The interaction between the soil particles and the pile was verified by comparing the development of the soil plug length in numerical simulations with the results from the model pile test reported by Kim et al. [32]. This comparison covered the entire process (Stages 1 to 12) of pile installation as shown in Figure 7, representing the trend of soil plug length against penetration depth.
In the early stage of driving, reaching a penetration depth of 162 mm, the pile is driven in a mode of fully coring penetration. This implies that the plugging effect has not yet been achieved at this stage in the DEM model. However, with further penetration, the plug length plot starts to gradually deviate from the fully coring line and follows the trend observed in the experimental results. The gradual change in soil plug length is visualized in Figure 8 with respect to the successive simulation steps of impact driving.
The plugging effect in the DEM model was confirmed to match that observed in the experimental case, validating the soil–pile interaction in the DEM model. At the completion of installation, the soil plug inside the open-ended pile measured 320.0 mm, compared with the experimental measurement of 350.7 mm.

3.3. Measurements of Soil Plug

Figure 9a,b show the PLR and IFR, respectively, obtained from the DEM simulation along with the experimental results.
The significant trends observed in the numerical analysis results are as follows: the IFR started at 1 at the beginning of penetration and decreased to 0 when the penetration depth reaches 516 mm, accounting for 60~70% of total penetration depth. As the impact driving progressed further, the IFR increased again, approaching approximately 0.4 in its final state. This pattern indicates that initially, the pile was fully coring. As penetration continued, gradual clogging began to occur, reaching a fully plugged state at a depth of 516 mm. Then, the plugging effect dissipated, and soil from the base of the pile began to intrude, resulting in a partially plugged state. This trend is consistent with the previously analyzed trends of soil plug length [32,44]. Particularly, the determination of the fully plugged state could be clearly made through the IFR. By comparing the length indices from the simulation results with values from the actual model pile test, validation of the soil–pile interaction was successfully completed. This process also effectively verifies the DEM model with the raw value of the plug length.

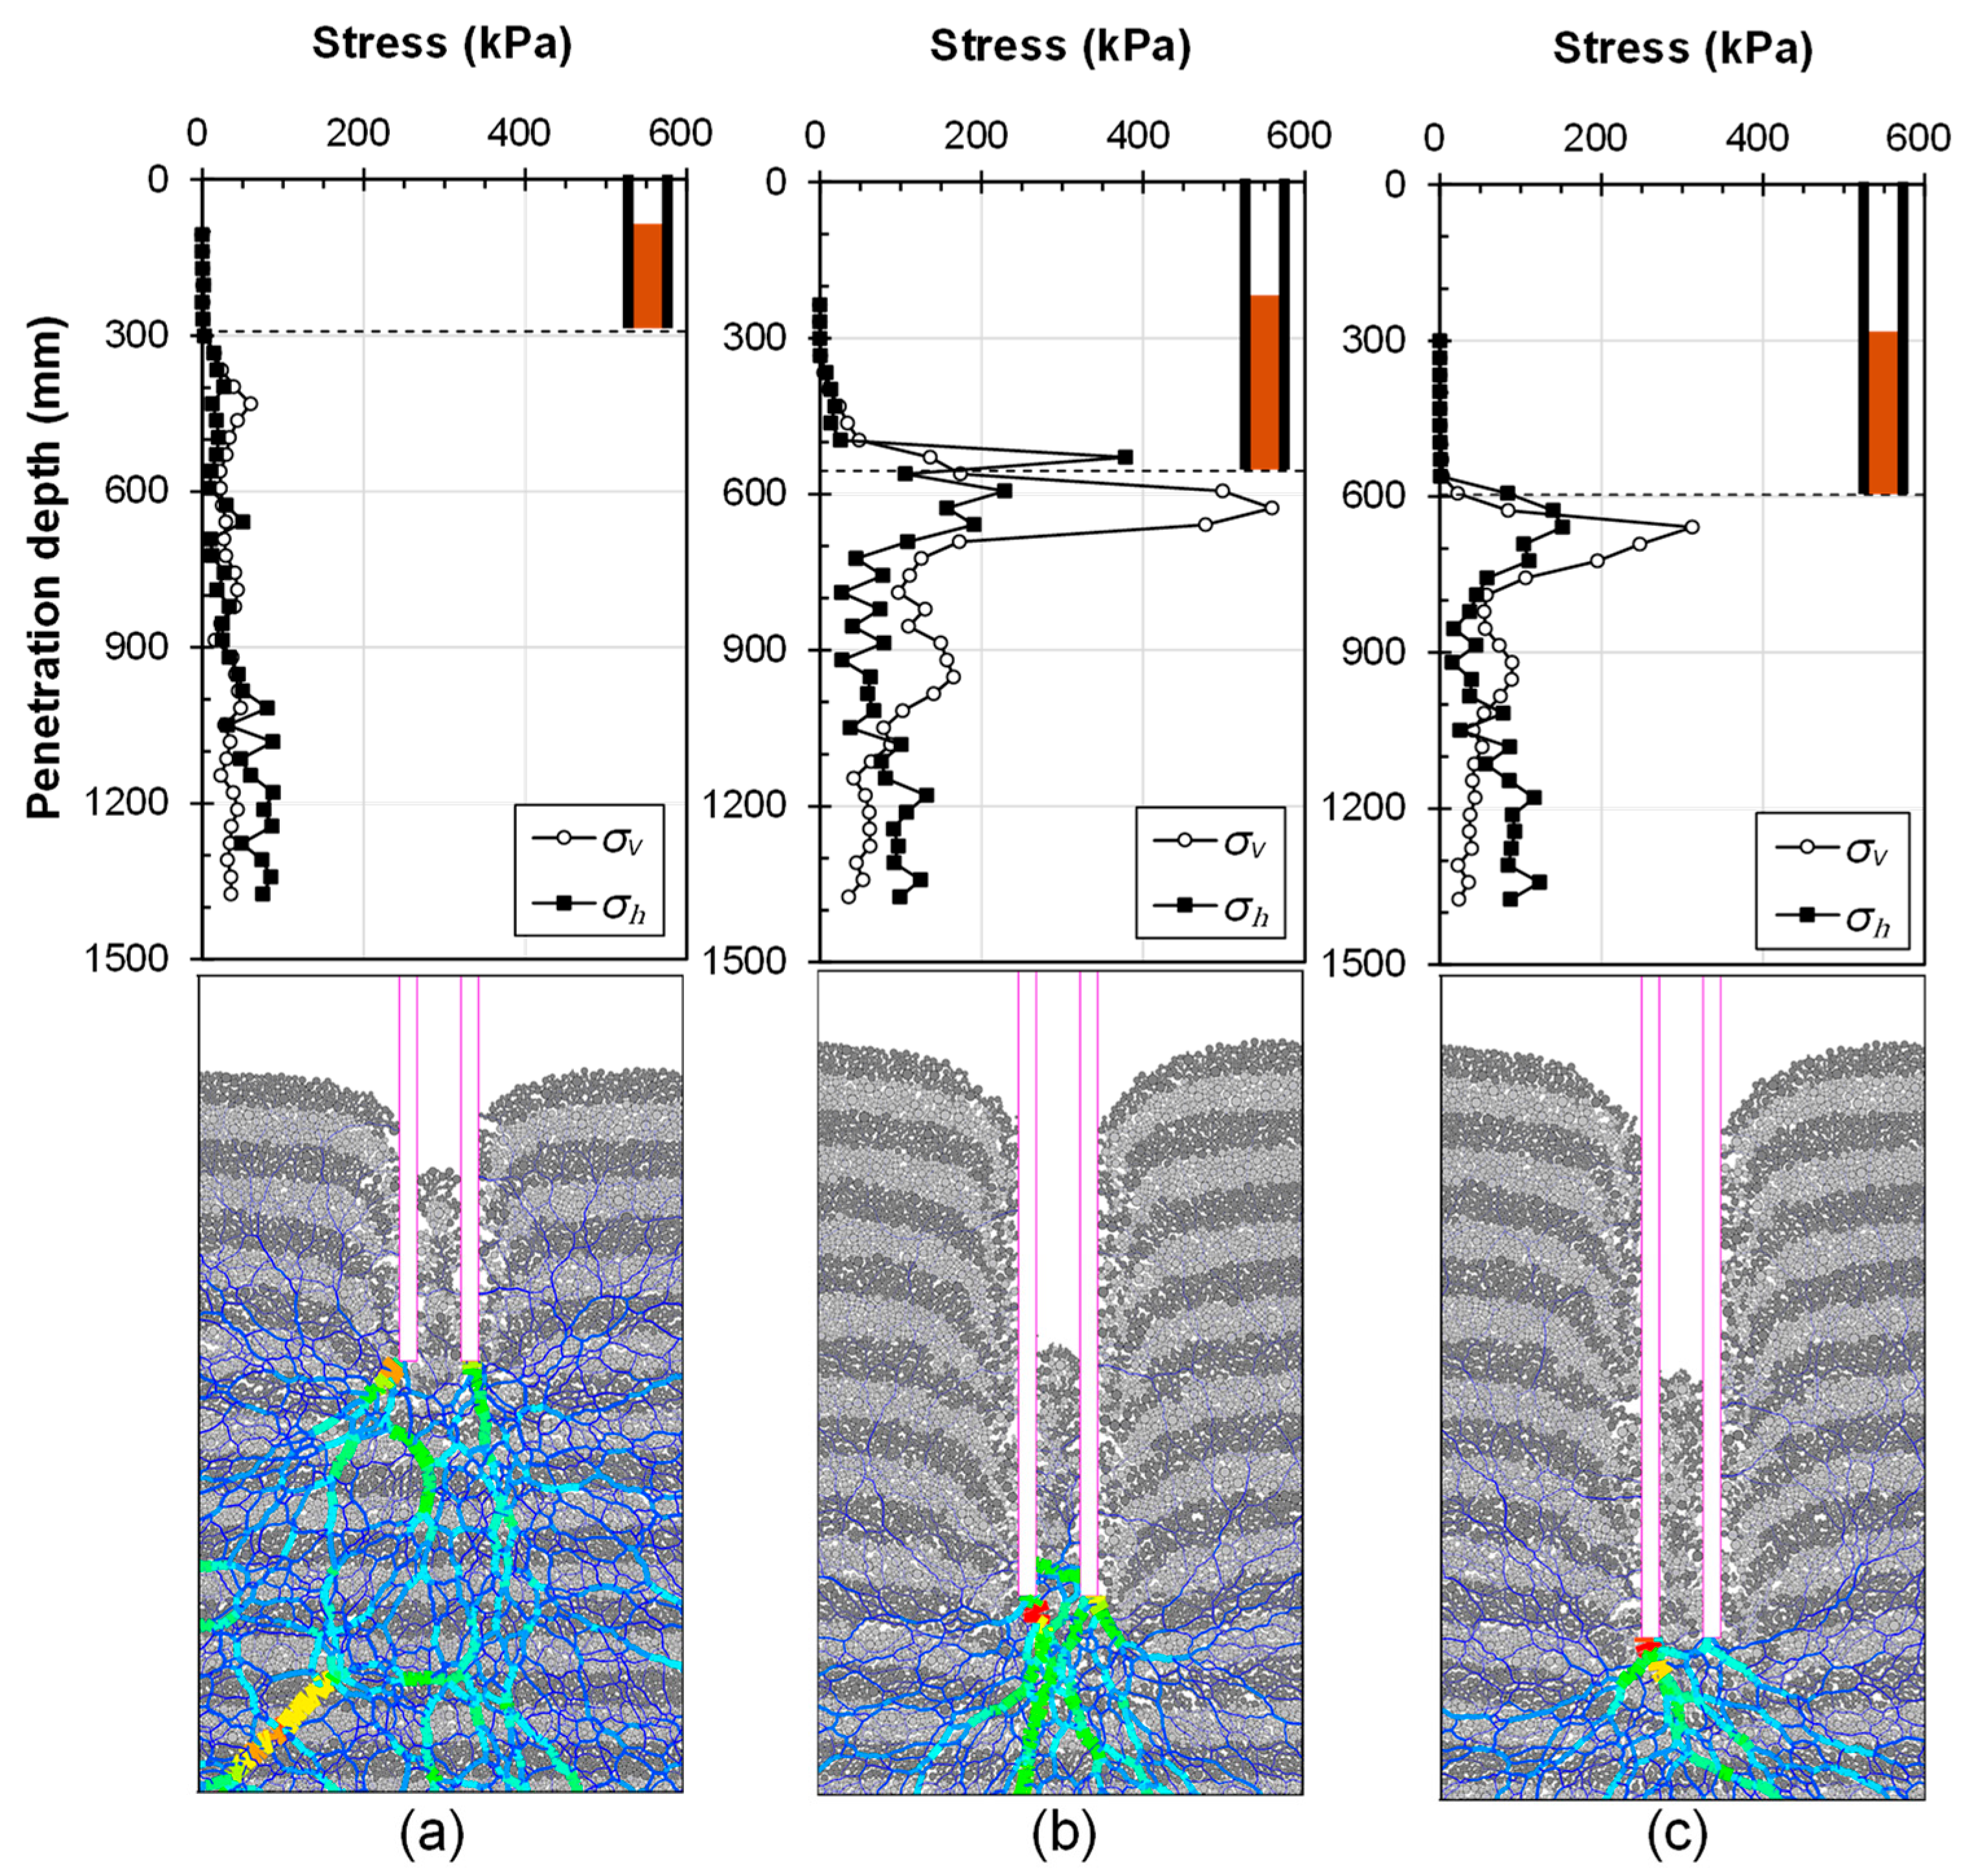
3.4. Progressive Internal Stress State of the Soil Plug

As the open-ended pile penetrates deeper, the internal state of the soil plug experiences significant changes throughout its depth at each impact-driving stage. The fluctuations of the internal state were captured in terms of horizontal and vertical stress. Within the twelve steps of progressive penetration, three specific depths—292 mm, 555 mm, and 596 mm—were highlighted, representing the unplugged state, fully plugged state, and partially plugged state, respectively, as presented in Figure 10.
As the penetration proceeded to 292 mm, as shown in Figure 10a, a soil arch that was formed temporarily in the preceding step broke down with the following penetration. The formerly obstructed area by the arch was filled with particles, resulting in a reduction in the overall length of the soil plug compared with the current depth of penetration. Additionally, the main contact force chain was formed vertically beneath the pile, so the plugging effect was not observed at this stage. The corresponding stress state throughout the soil plug remained at the overburden stress level, with the maximum horizontal stress within the soil plug observed at 2.2 kPa, and the IFR at this stage is 0.62. All these observations lead to the conclusion that the pile is in an unplugged state. The soil plug and its internal stress state at the penetration depth of 555 mm are shown in Figure 10b. The impact driving in this step induces a strong contact force chain inside the open-ended pile, showing a particularly robust soil arch at 1 Din from the pile tip. The resulting stress state consists of horizontal stress of 378.4 kPa, which corresponds to seventy times the overburden stress. This can be concluded as a fully plugged state, which is also supported by an extremely low IFR of 0.006 at this stage. Figure 10c shows the contact force chain and distribution of the internal stress at a 596 mm penetration depth. Unlike the unplugged state (e.g., at 292 mm), the contact force chain was formed horizontally beneath the tip even though the internal soil arch had diminished. This can be interpreted as the soil plug behaving as a closed-ended pile. This behavior offers considerable resistance from internal skin friction between the pile and the plug. The IFR at this stage increases to 0.44, and the internal horizontal stress is reduced significantly from 378 kPa to 84.3 kPa; however, it is still over five times the overburden stress. Considering various factors, this stage is determined to be a partially plugged state.

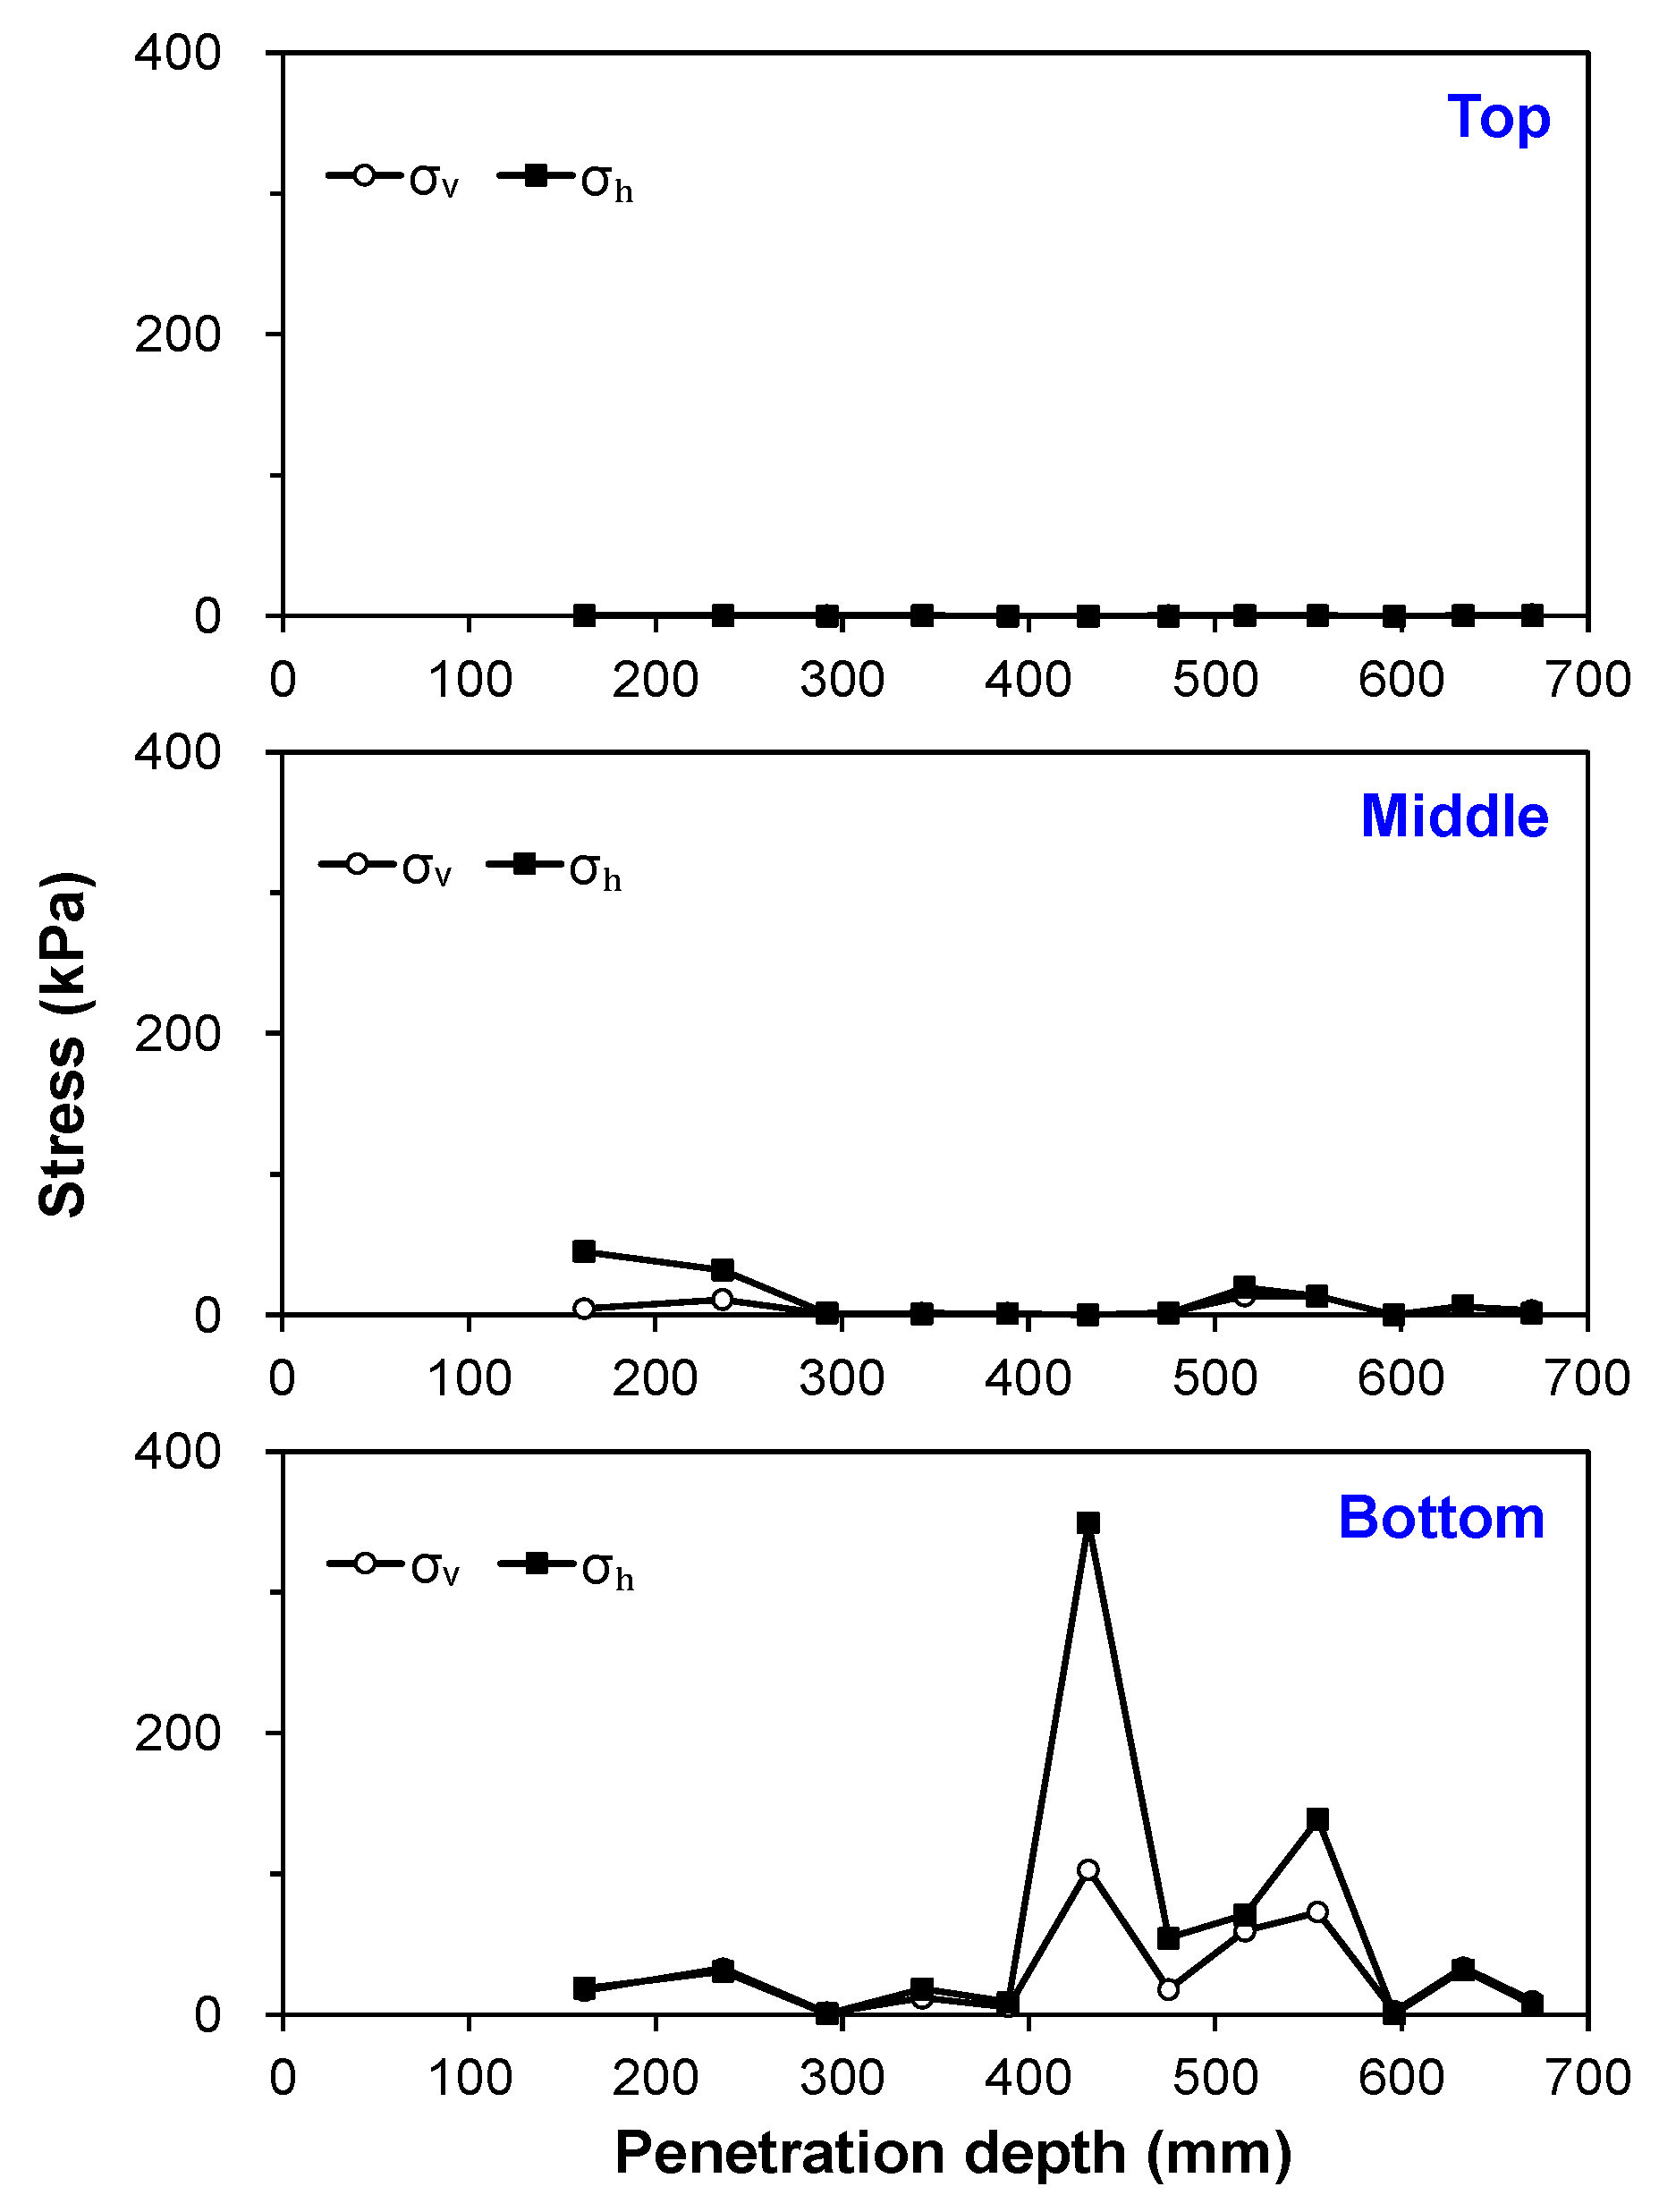
3.5. Local Stress State of the Soil Plug

The analysis subsequently focused on how the stress state within the soil plug changed with the progression of installation. It was observed that the stress distribution within the plug varied depending on its location. Therefore, the soil plug was divided into three equal parts (top, middle, and bottom) based on its length. The variation in the stress state due to penetration is illustrated in Figure 11.
In the top portion, neither vertical nor horizontal stresses were found to exceed their self-weight; in fact, lower stress states than those of self-weight were confirmed. In the middle part, at the initial stages of penetration, a considerable horizontal stress of 45 kPa was recorded, exceeding the average 18.8 kPa observed in the bottom part during the same phase. This led to clogging from the middle down to the bottom section, with a greater degree of plugging noted in the middle section. As penetration deepened to a depth of 300 mm, all additional stresses were alleviated. Furthermore, at the bottom section, at a penetration depth of 432 mm, corresponding to 60% of the final penetration depth, a maximum average horizontal stress of 349 kPa was observed.
A significant observation is that, even during subsequent penetrations, this stress was not entirely relieved until reaching a 555 mm penetration depth, along with the persisting plugged state. For a detailed analysis of the soil state variations in this section, the overall stress state of the soil inside the open-ended pile at the penetration stages of 432 mm and 555 mm in terms of lateral earth pressure coefficient (K) is shown in Figure 12. It was plotted against the distance from the pile tip in order to track the relative movement of the soil plug and soil arching. Maximum earth pressure coefficients at each stage were recorded as 3.4 and 2.8, significantly higher than the external coefficients of 1 and 1.8, respectively. These results indicate that the horizontal stresses developed earlier were partially maintained and transferred upward along with the incoming soil. In the post-432 mm penetration stage, it was observed that horizontal stresses in the middle section were formed even without blocking from the top section. Moreover, an earth pressure coefficient of 1.6 in the middle section at the final stage suggests a partial alleviation from the initial maximum values. The distance between these two points was found to correspond with the depth penetrated during the sustained plugging state, from 432 mm to 555 mm. The maximum K of 3.4, approximately nine times higher than K0, was noted to be located at a distance of 1 Din from the pile tip, as confirmed by the contact force chain analysis.
Additionally, the beta index at the position that shows the maximum K0 inside the soil plug was calculated from both the PLR and the stress state, and they were finally compared to each other. A relationship between the PLR and the beta index studied by Paik and Salgado [7] was used to derive the beta index from the soil plug length ( β P L R ). The equation is expressed as follows:
q s , i n K 0 σ v tan δ c α = 7.2 4.8 P L R
in which qs,in = the internal skin friction (also equals β P L R · σ v ), α = a function of the relative density of the sand bed (1.0 for dense sand), and δ c = the critical-state interface friction angle between the pile and the soil. Consequently, as the beta index relates to the skin friction and the stress state within soil after the pile penetration, β s t r e s s was obtained from the observed internal stress state within the soil plug. β P L R was determined to be 0.6, while β s t r e s s was obtained as 1.7. It was found that for the given plugging state, the beta value reflecting the length of the soil plug was highly underestimated compared with the beta value reflecting the actual stress state within the soil plug.

3.6. Effect of Pile Diameter

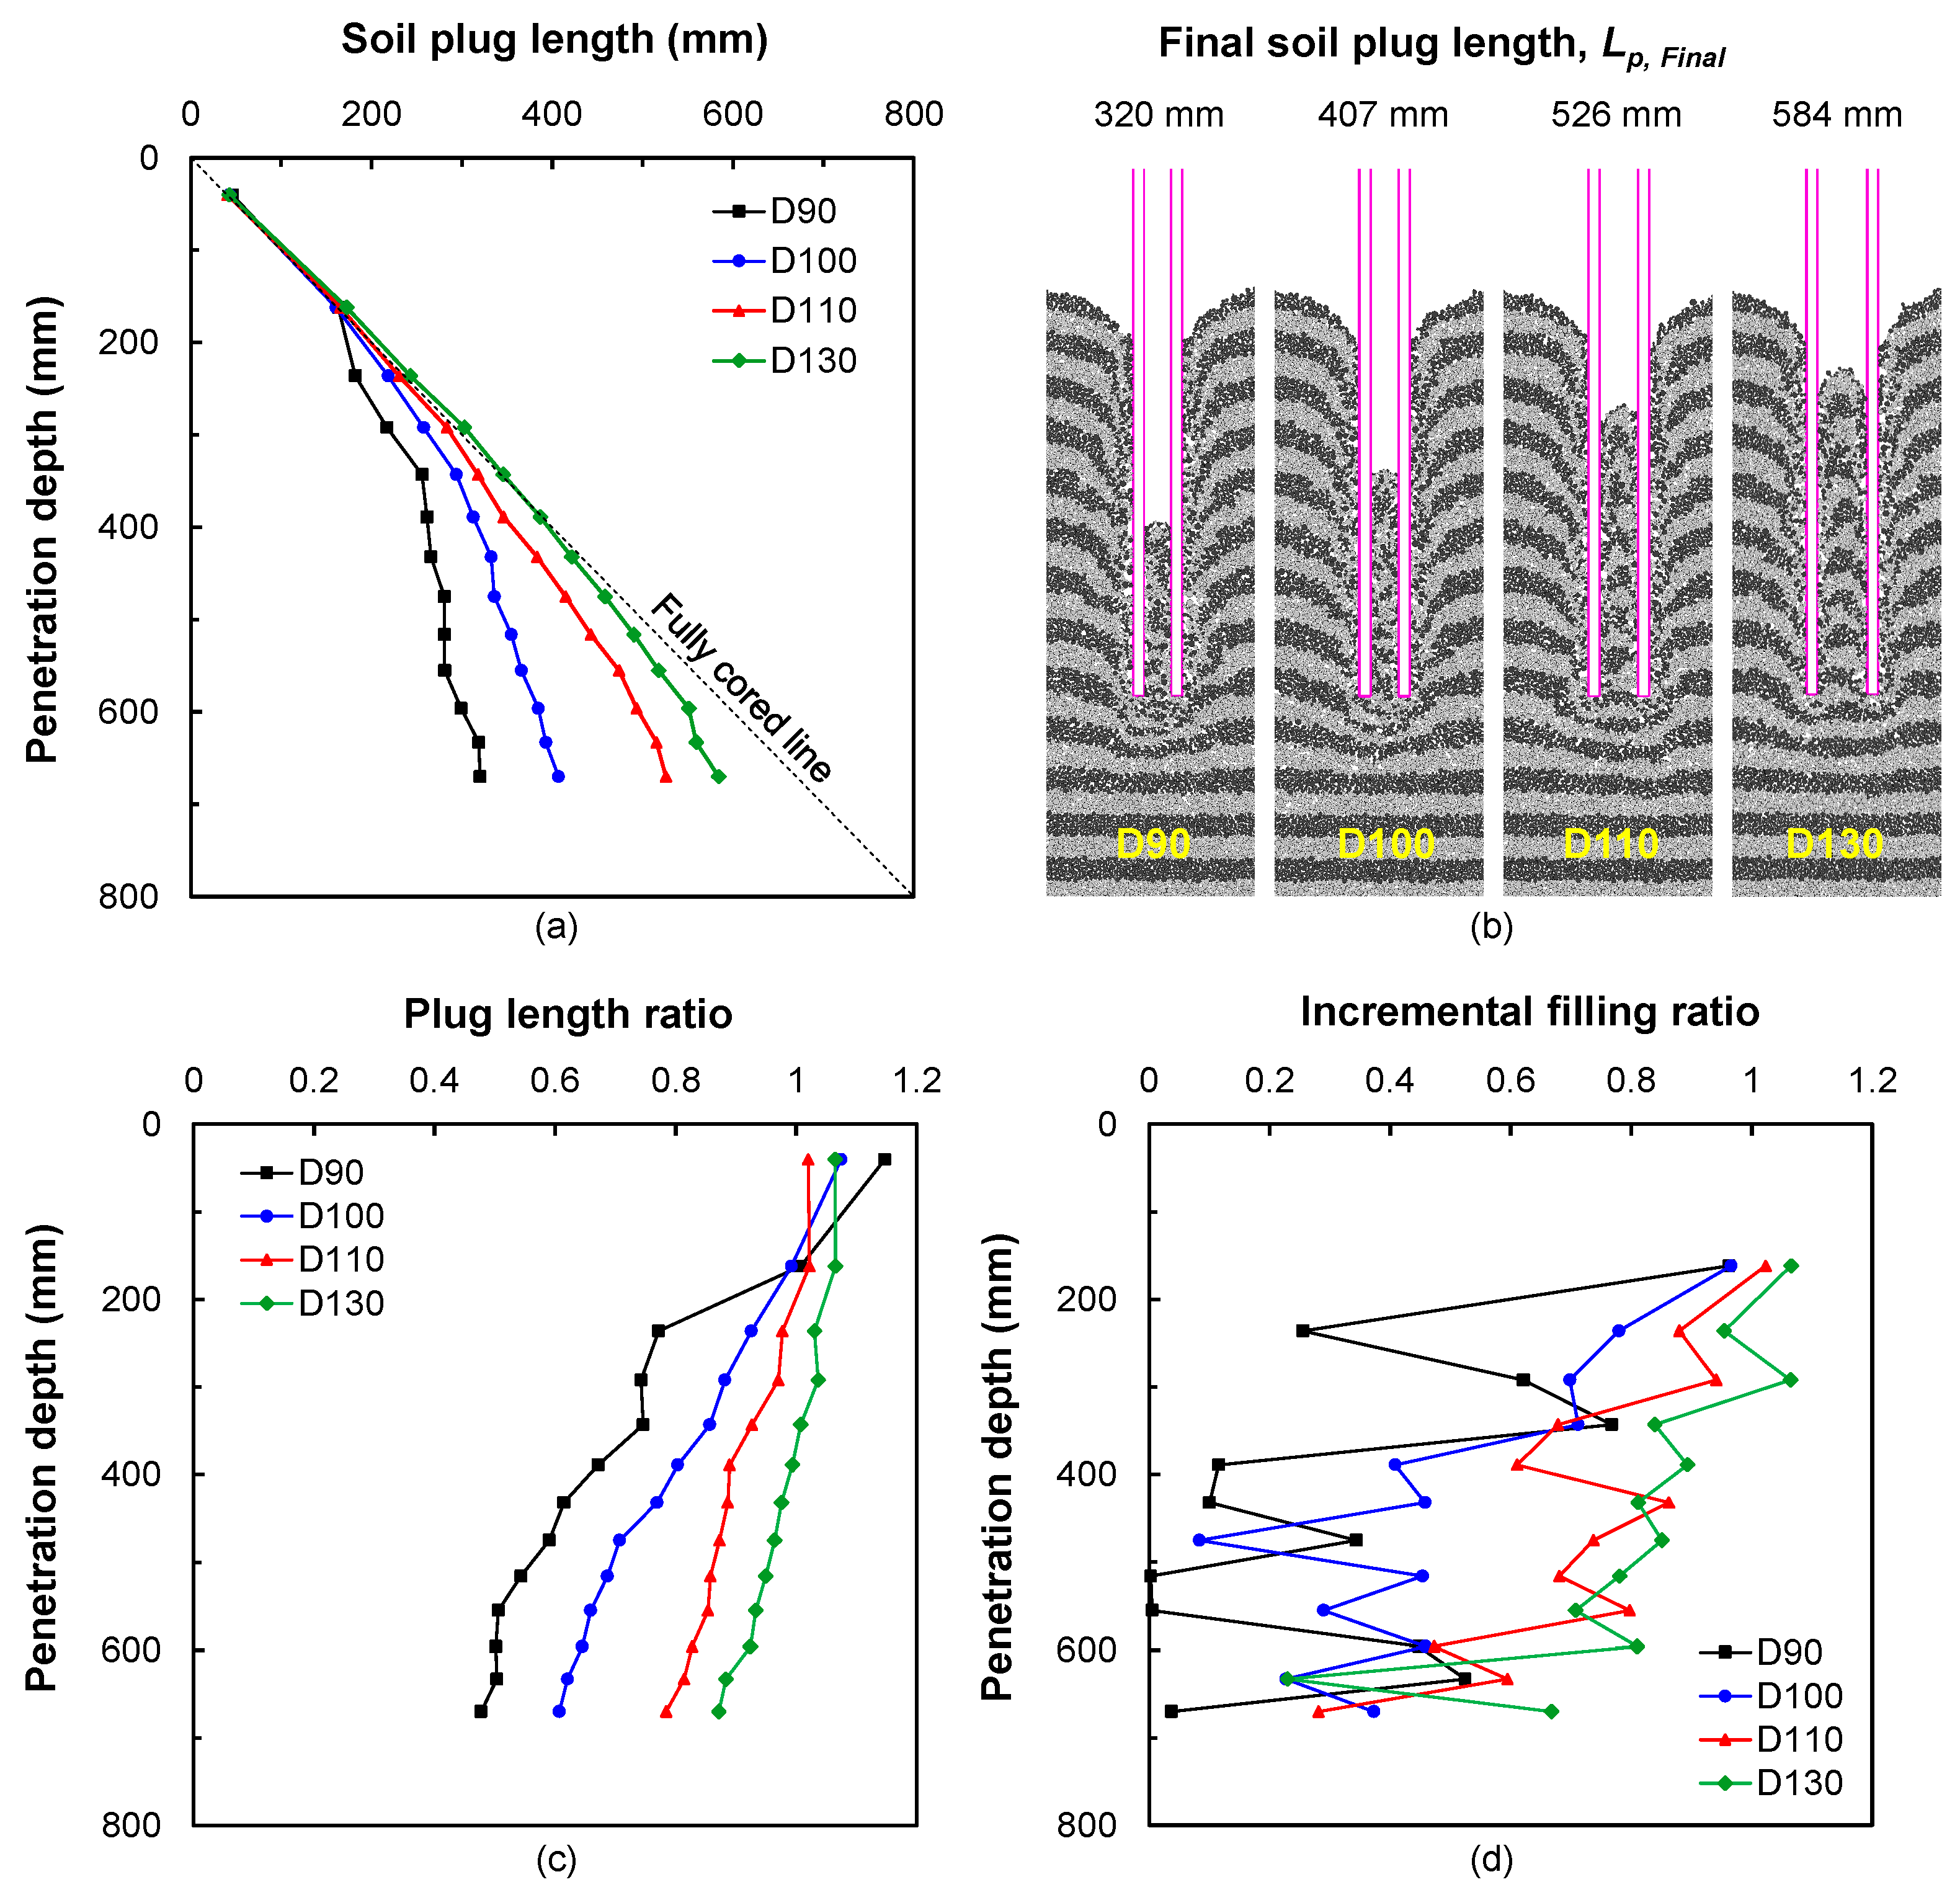
3.6.1. Influence on Plug Length

Figure 13 represents the model overview at the final penetration depth of 670 mm for four different diameters of piles, where the length of the soil within the pile was measured throughout the entire penetration process. Initially, the length of the soil follows the fully coring line, but as penetration progresses, the trend shows that the smaller the diameter, the further it deviates from this line. The soil plug lengths vary with pile diameter: D90 resulted in a 320 mm long soil plug, D100 in 407 mm, D110 in 526 mm, and D130 in 584 mm. In addition, the plug length indices were subsequently obtained and are shown in Figure 13c,d. They indicate that with an increase in pile diameter, the values of the PLR at the final penetration depth increased from 0.48 to 0.87, a trend consistent with existing research. Contrary to the PLR, the IFR shows more significant variations with penetration depth; however, the magnitude of reduction from 1 diminishes with the increase in pile diameter. This also aligns with existing studies, suggesting that smaller pile diameters tend to lead to a higher tendency for the plugging effect. Furthermore, due to the high variability in the IFR and the difficulty of measuring it during pile installation (Paik and Salgado [7]), a correlation was derived to predict the IFR directly from the PLR values:
I F R % = 144 · P L R 61
As shown in Figure 14, this relationship demonstrates relatively high accuracy for PLR values above 0.85, but the accuracy is relatively low for PLR values below 0.8.

3.6.2. Impact on the Internal Stress State of the Soil Plug

Since the bottom portion of the plug reacts most sensitively to the plugging state, the horizontal stress of this portion is depicted for each pile diameter throughout the penetration process, as shown in Figure 15.
The greatest incidence of plugging occurs at a penetration depth corresponding to 60~65% of the final depth. It is noted that apart from the 90 mm diameter pile, plugging occurs intermittently and is relieved periodically. At this depth, the soil plug has probably experienced substantial compaction and shear, which increases the likelihood of particle interlocking and frictional resistance. This intermediate depth is a crucial transition zone, where the soil particles are not fully stabilized but are compacted enough to create conditions favorable for a fully plugged state. Additionally, the stress distribution and load transfer within the soil column may peak at this penetration range, facilitating the formation of the soil plug. The maximum horizontal stress within the soil plug is not significantly affected by the pile diameter. However, in the case of 110 D, an unusually low-stress pattern was observed compared with other cases due to the uncertainty of the plugging phenomenon.
Furthermore, based on the maximum stress states observed within the soil plug, the determination of the β coefficient from the beta method, which calculates the frictional force on the internal surface of open-ended piles, yielded a range from 1 to 3.6. This suggests that the methodology presented by the Canadian Geotechnical Society (CGS) [21] better reflects the internal stress state of the soil plug in the bearing capacity than the method proposed by the American Petroleum Institute (API) [22].

4. Conclusions

This research investigated the patterns of soil plug formation during pile driving and the effects of pile diameter on the plugging effect by employing DEM simulation of physical model pile tests conducted in previous research. It enabled the direct capture and visualization of the stress state within the soil plug along with the particle displacement field, which is highly challenging in physical experiments. The simulation was carried out by controlling the displacement of the pile from the physical test against the simulation time and was verified in terms of soil–soil and soil–wall interactions. Subsequent simulations of piles with outer diameters of 90, 100, 110, and 130 mm were performed to further investigate the influence of pile diameter on the soil plug formation and its internal state. Based on the aforementioned results, the following conclusions can be drawn:
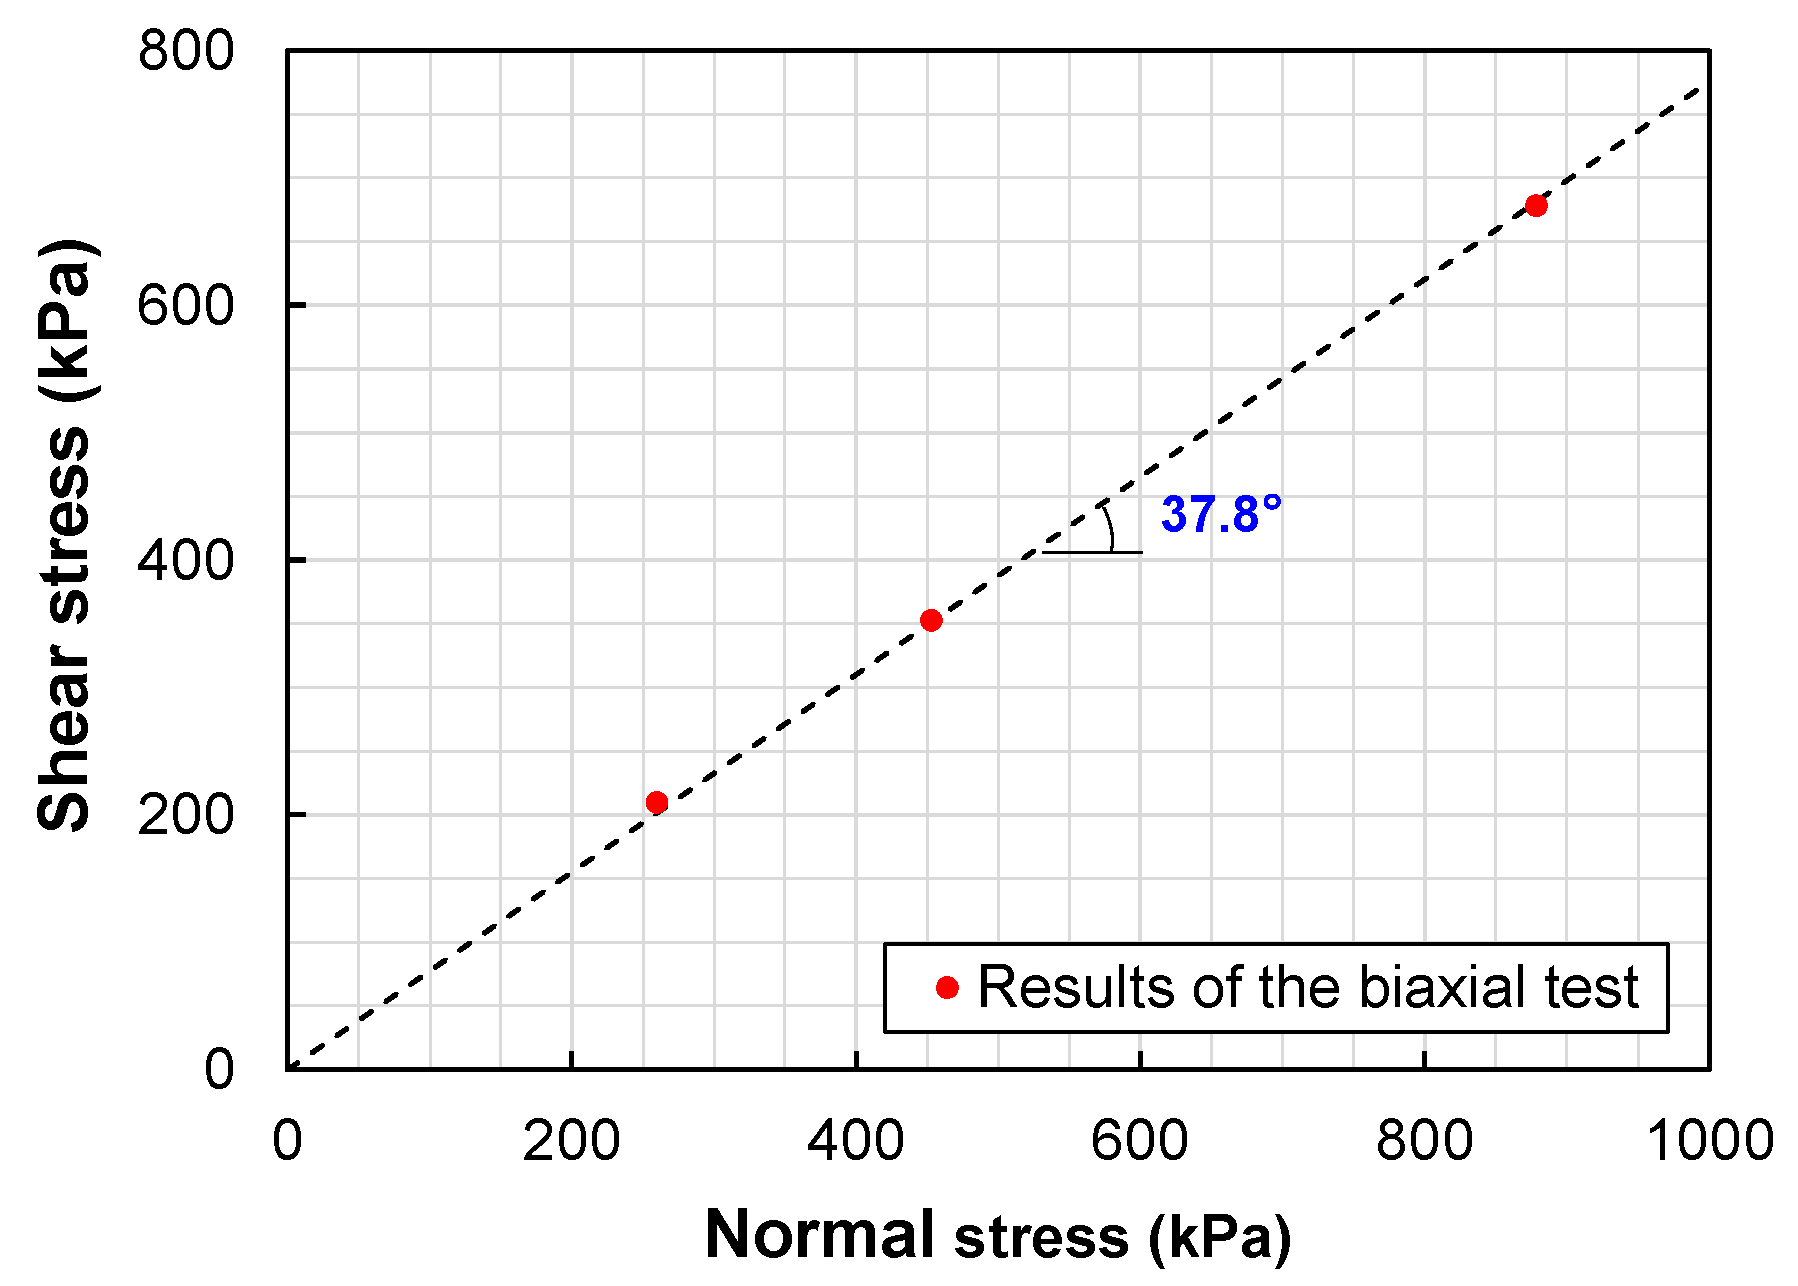
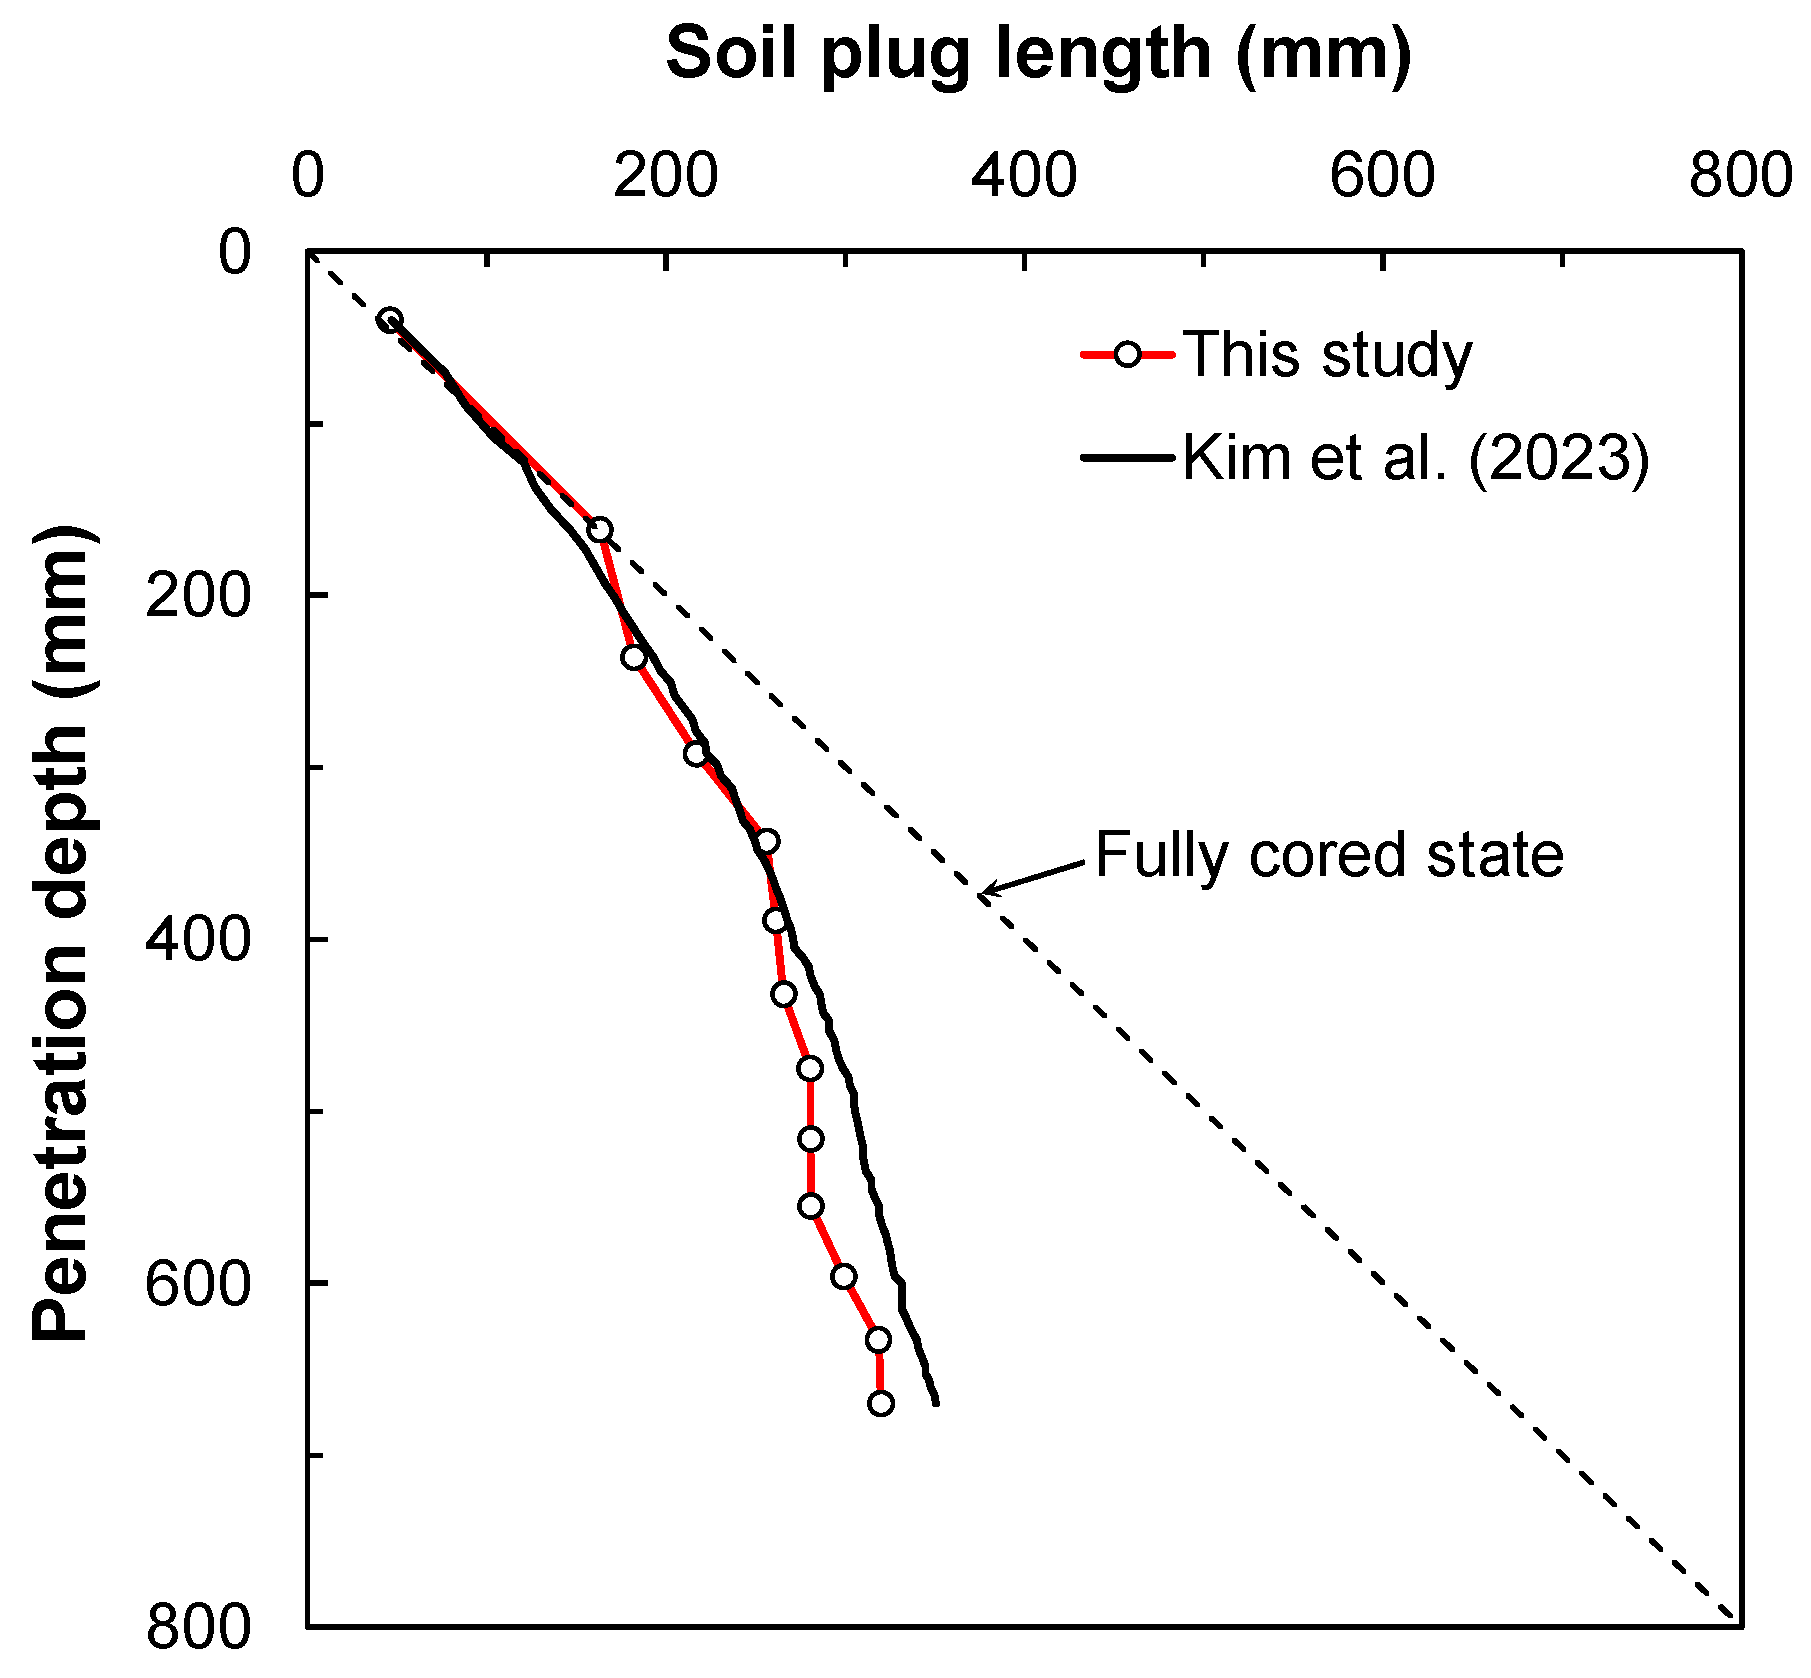
  • Successful simulation of soil plug formation through the DEM was conducted and verified by calibrating both biaxial compression test results and plug length indices from the simulation to the physical test results.
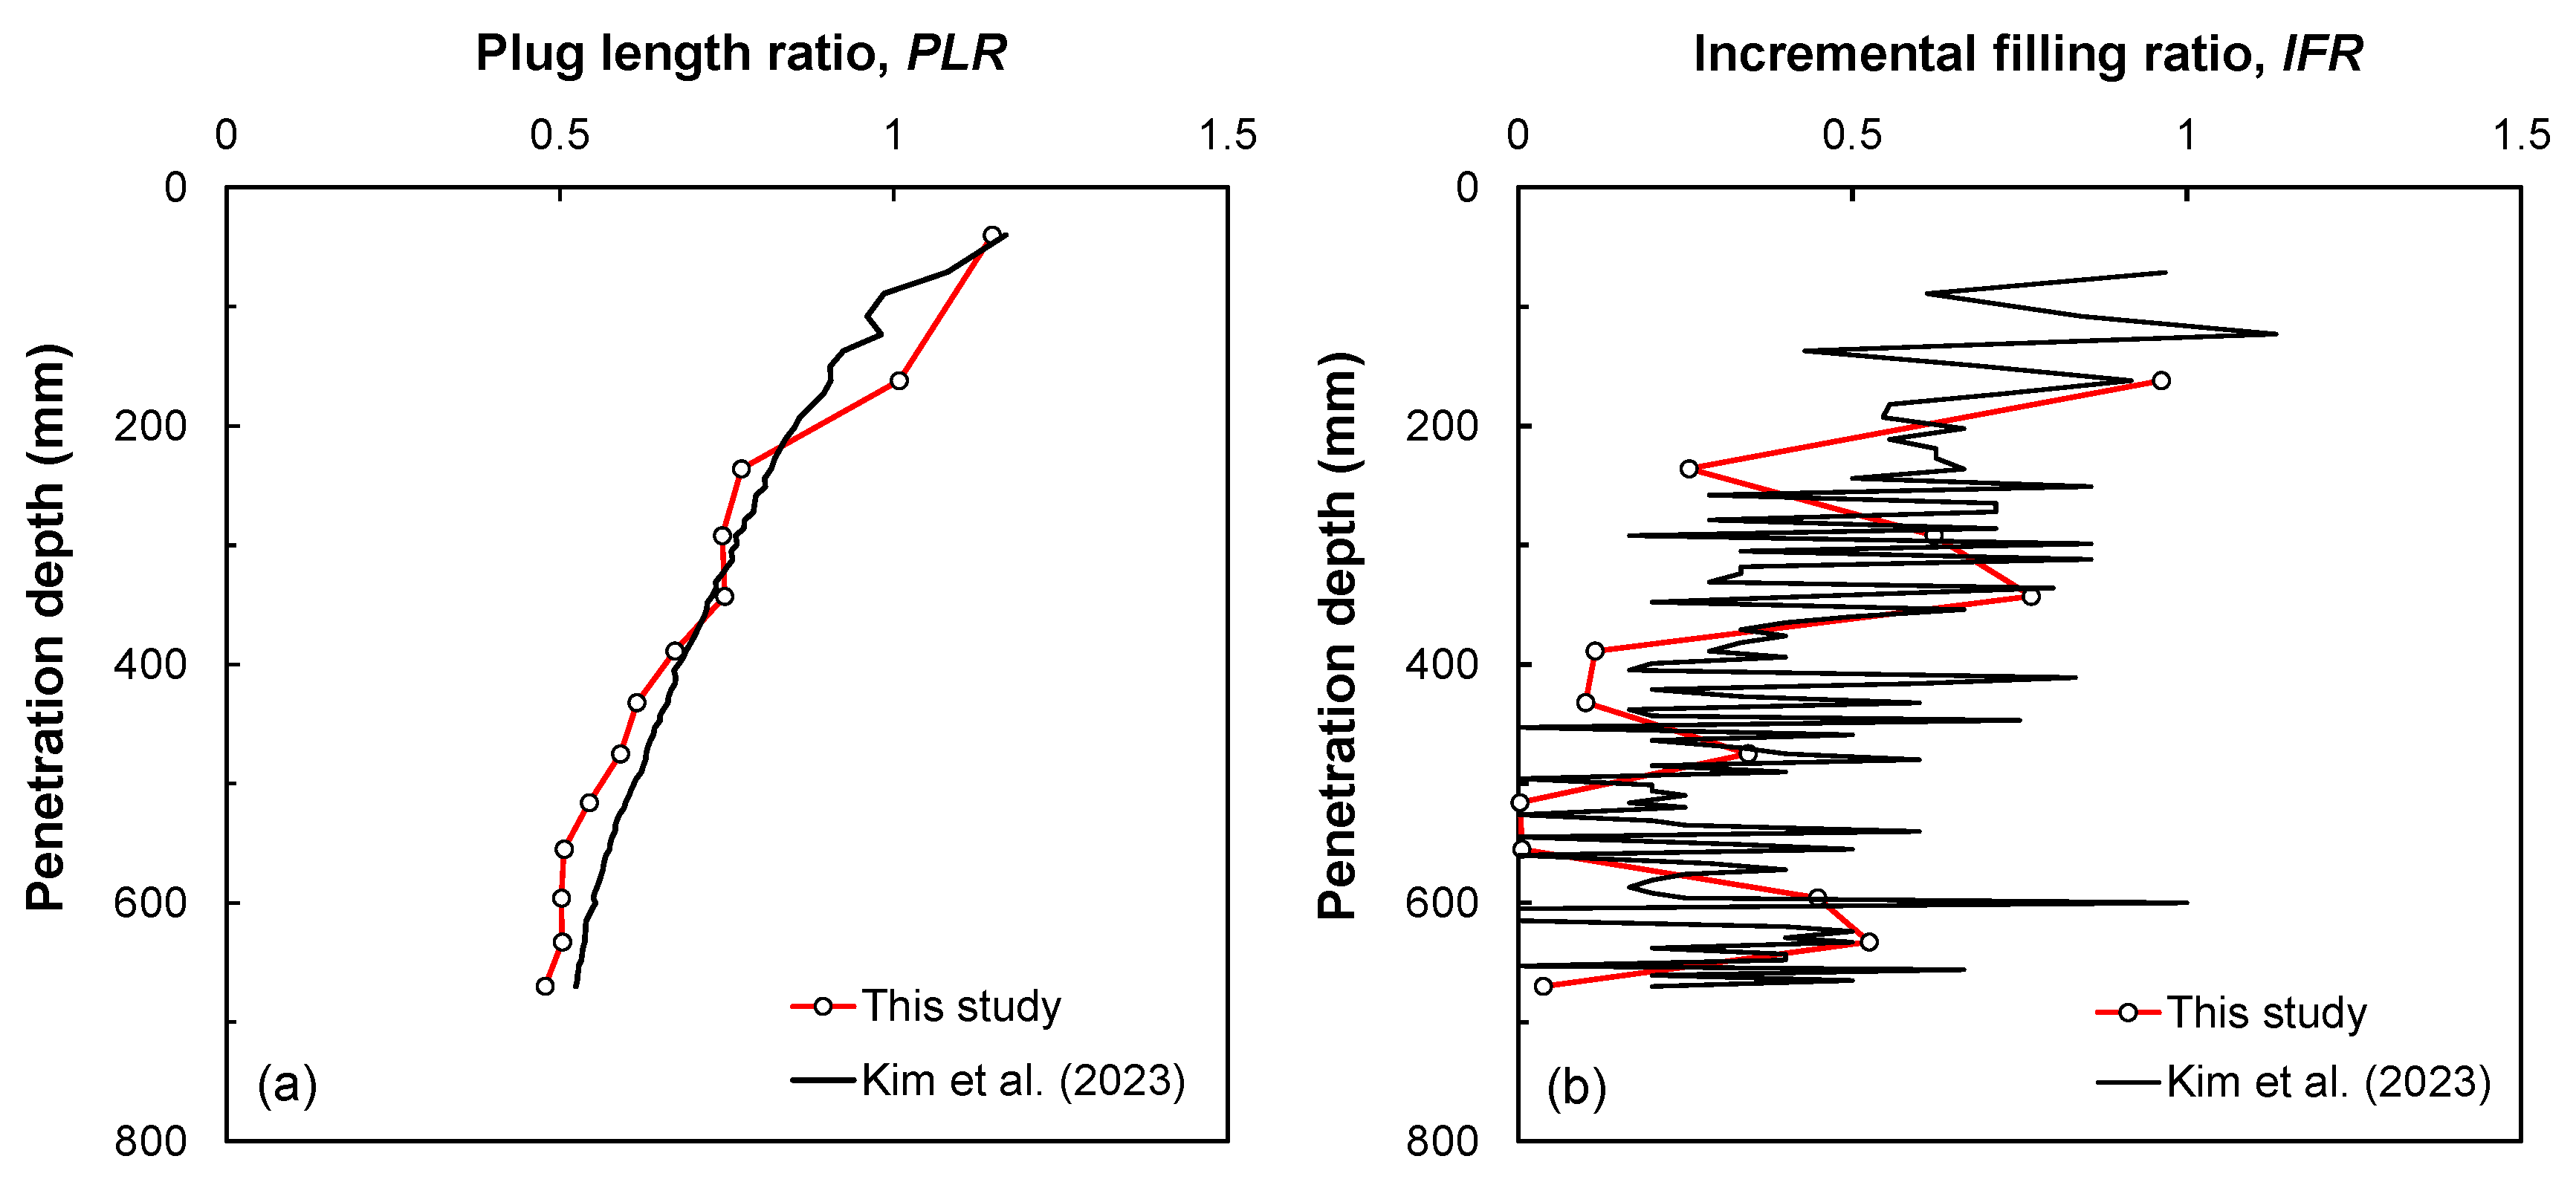
  • Plug length indices (e.g., PLR and IFR) started at approximately 1 at the beginning of the penetration and generally decreased with the progression of pile installation. The PLR exhibited a gradual decrease without any fluctuation, ending at 0.5, whereas the IFR showed significant fluctuation, including a sudden increase from 0.006 to 0.5 and a drastic drop from 0.8 to 0.1. Hardening and release in the horizontal stress within the soil plug were accompanied by a sudden drop and increase in the IFR, respectively. It is considered that the IFR better indicates the internal state of the soil plug than the PLR.
  • Due to the high degree of spatial variance in the internal horizontal stress during penetration, dividing the soil plug into three equal parts based on length results in each section showing distinctive variations in mechanical behavior. While the top section did not exhibit any stress variation due to penetration, the middle and bottom sections experienced substantial changes in the horizontal stress, surging from the overburden stress to a maximum stress of 349 kPa, corresponding to a coefficient of lateral earth pressure (K) of 3.4. The IFR of 0.1 at this stage also indicated a high degree of plugging state. A phenomenon was also observed where the excessive horizontal stress developed at the bottom section in the former penetration stage was pushed upward to the middle section with a slight alleviation in magnitude during subsequent impact driving.
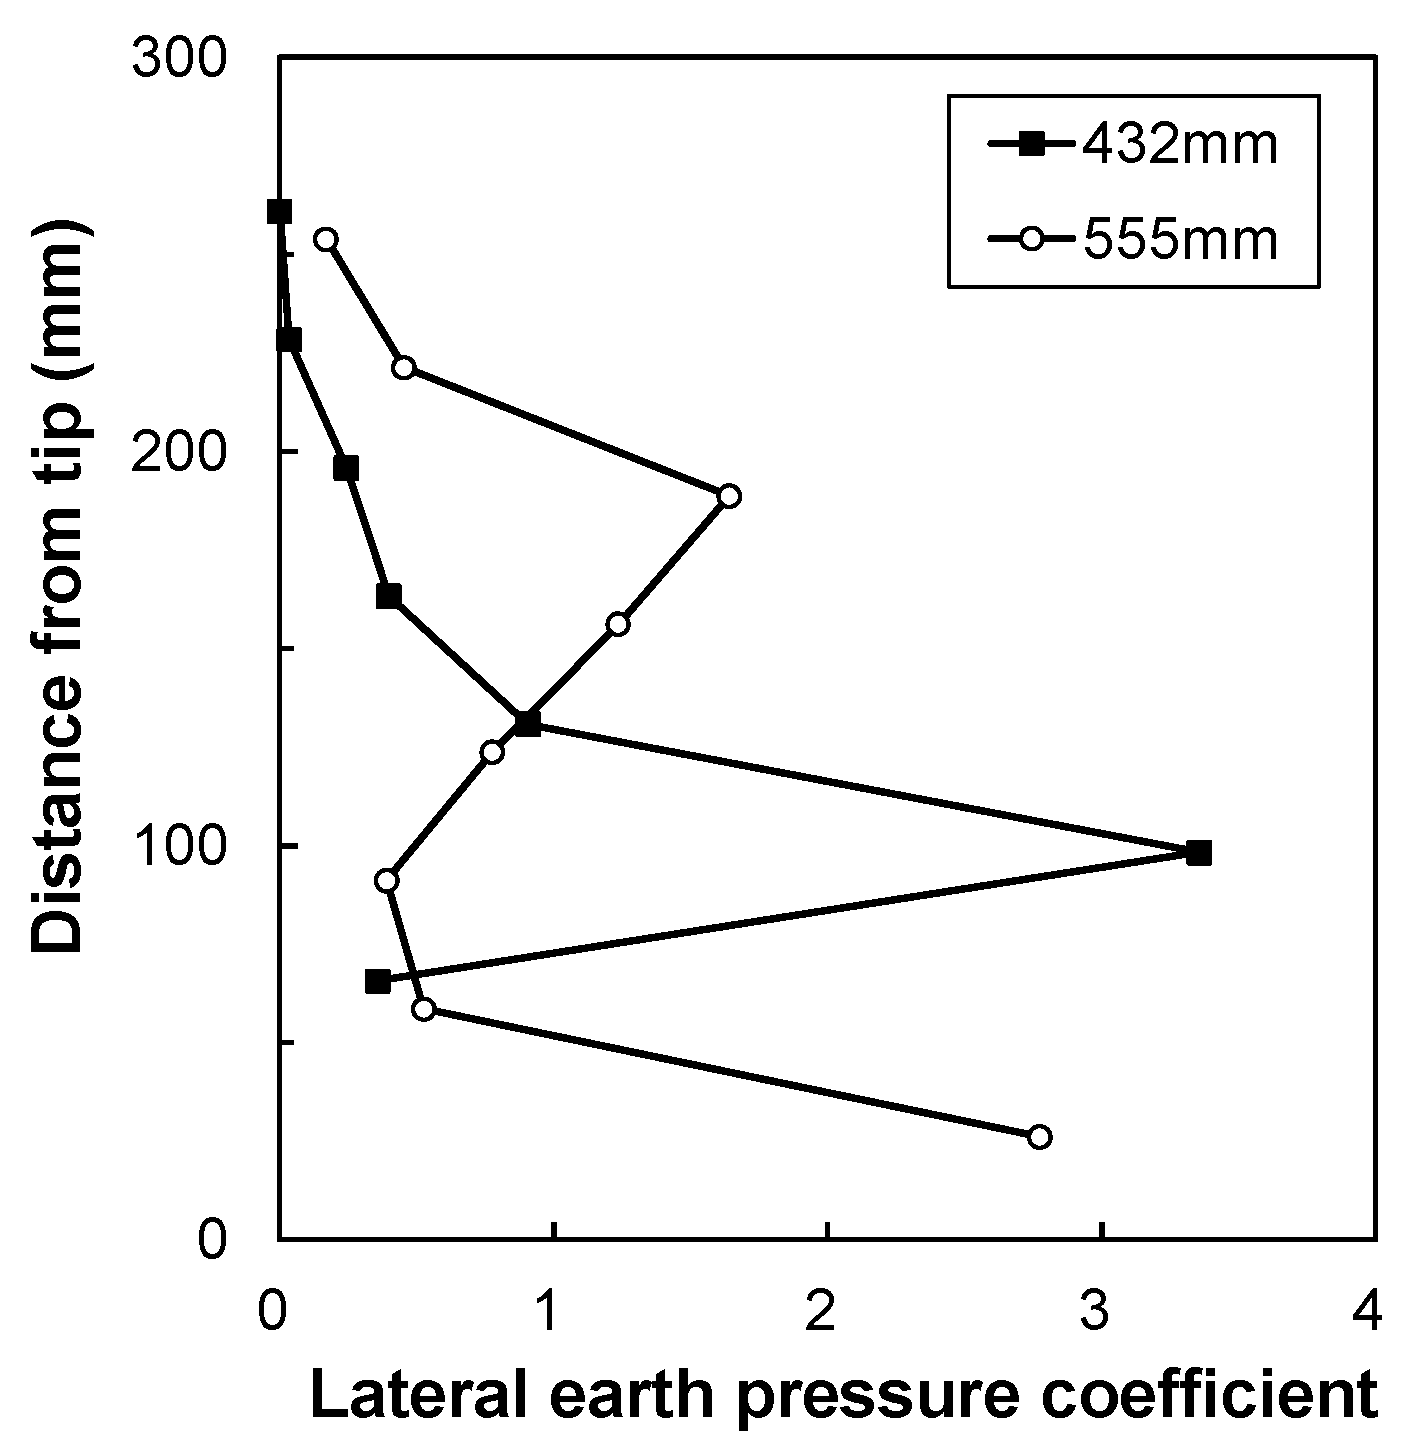
  • The active length, where excessive horizontal stress developed within the soil plug, was measured as 2 Din from the pile tip at specific penetration phases in which the degree of plugging was highly developed. The location of the maximum horizontal stress within the active length was 1 Din from the pile tip.
  • The plug length increased with pile diameter, as indicated by larger PLR and IFR values. However, the longer formation of the soil plug did not indicate a trend of the internal stress state since the maximum horizontal stress per each impact driving was not significantly affected by the pile diameter.
  • In the results from all parametric models, the earliest plugging effect was observed at a penetration progress of 60~65% of the total penetration, where the maximum horizontal stress developed regardless of the pile diameter.
  • The beta index obtained from the known PLR and β relationship ( β P L R ) was determined to be 0.6, while the one obtained from the direct stress state within the soil plug ( β s t r e s s ) was 1.7. It showed that for a given plugging state, there was a possibility of underestimating the inner skin friction of an open-ended pile if it was designed in terms of plug length indices.
  • Soil plugs at penetration stages where excessive horizontal stress had developed exhibited a highly passive state, indicated by a high Kin (lateral earth pressure coefficient within the soil plug). The maximum Kin throughout the entire penetration process was observed to be 3.4, whereas Kout (K measured near the outer shaft of the pile) was 1. Beta values determined from K were found to range from 1 to 3.6, surpassing the values of current design codes.

Author Contributions

Conceptualization, M.K.; methodology, M.K. and Y.K.; software, Y.K.; validation, M.K. and Y.K.; formal analysis, Y.K.; investigation, M.K. and Y.K.; resources, M.K.; data curation, M.K. and Y.K.; writing—original draft preparation, M.K. and Y.K.; writing—review and editing, M.K. and Y.K.; visualization, M.K. and Y.K.; supervision, M.K.; project administration, M.K.; funding acquisition, M.K. All authors have read and agreed to the published version of the manuscript.

Funding

This research received no external funding.

Institutional Review Board Statement

Not applicable.

Informed Consent Statement

Not applicable.

Data Availability Statement

The raw data supporting the conclusions of this article will be made available by the authors on request.

Conflicts of Interest

The authors declare no conflicts of interest.

References

  1. Viggiani, C.; Mandolini, A.; Russo, G. Piles and Pile Foundations; CRC Press: Boca Raton, FL, USA, 2014. [Google Scholar]
  2. Meyerhof, G.G. Compaction of sands and bearing capacity of piles. J. Soil Mech. Found. Div. 1959, 85, 1292–1322. [Google Scholar] [CrossRef]
  3. Randolph, M.; Gourvenec, S. Offshore Geotechnical Engineering; CRC Press: Boca Raton, FL, USA, 2017. [Google Scholar]
  4. Paikowsky, S.G. A Static Evaluation of Soil Plug Behavior with Application to the Pile Plugging Problem. Doctoral Dissertation, Massachusetts Institute of Technology, Cambridge, MA, USA, February 1989. [Google Scholar]
  5. Paikowsky, S.G. The mechanism of pile plugging in sand. In Proceedings of the Offshore Technology Conference, Houston, TX, USA, 7–10 May 1990. [Google Scholar]
  6. Szechy, C.H. Tests with tubular piles. Acta Tech. 1959, 24, 181. [Google Scholar]
  7. Paik, K.; Salgado, R. Determination of bearing capacity of open-ended piles in sand. J. Geotech. Geoenviron. Eng. 2003, 129, 46–57. [Google Scholar] [CrossRef]
  8. Paik, K.; Salgado, R. Effect of pile installation method on pipe pile behavior in sands. Geotech. Test. J. 2004, 27, 11391. [Google Scholar] [CrossRef]
  9. Henke, S.; Grabe, J. Numerical investigation of soil plugging inside open-ended piles with respect to the installation method. Acta Geotech. 2008, 3, 215–223. [Google Scholar] [CrossRef]
  10. Li, L.; Wu, W.; Liu, H.; Lehane, B. DEM analysis of the plugging effect of open-ended pile during the installation process. Ocean Eng. 2021, 220, 108375. [Google Scholar] [CrossRef]
  11. Ko, J.; Jeong, S.; Seo, H. Effect of soil condition on the coefficient of lateral earth pressure inside an open-ended pipe pile. Geomech. Eng. 2022, 31, 209–222. [Google Scholar] [CrossRef]
  12. Brucy, F.; Meunier, J.; Nauroy, J.F. Behavior of pile plug in sandy soils during and after driving. In Proceedings of the Offshore Technology Conference, Houston, TX, USA, 6–9 May 1991. [Google Scholar]
  13. Lu, J.; Guang, H.; Cui, L.; Liu, J.; Wang, C.; Kumar, S.A. Experimental study on penetration characteristics of an open-ended pile under static and dynamic driving methods. Soil Dyn. Earthq. Eng. 2023, 166, 107770. [Google Scholar] [CrossRef]
  14. Paikowsky, S.G.; Whitman, R.V. The effects of plugging on pile performance and design. Can. Geotech. J. 1990, 27, 429–440. [Google Scholar] [CrossRef]
  15. Paik, K.H.; Lee, S.R. Behavior of soil plugs in open-ended model piles driven into sands. Mar. Georesources Geotechnol. 1993, 11, 353–373. [Google Scholar] [CrossRef]
  16. Jardine, R.; Chow, F.; Overy, R.; Standing, J. ICP Design Methods for Driven Piles in Sands and Clays; Thomas Telford: London, UK, 2005. [Google Scholar]
  17. Rausche, F.; Webster, S. Behavior of cylinder piles during pile installation. In Proceedings of the Contemporary Issues in Deep Foundations, Denver, CO, USA, 18 February 2007. [Google Scholar]
  18. Gudavalli, S.R.; Safaqah, O.; Seo, H. Effect of soil plugging on axial capacity of open-ended pipe piles in sands. In Proceedings of the 18th International Conference on Soil Mechanics and Geotechnical Engineering, Paris, France, 2–6 September 2013. [Google Scholar]
  19. Ko, J.; Jeong, S. Plugging effect of open-ended piles in sandy soil. Can. Geotech. J. 2015, 52, 535–547. [Google Scholar] [CrossRef]
  20. Randolph, M.F. Potential damage to steel pipe piles during installation. IPA Newsl. 2018, 3, 3–10. [Google Scholar]
  21. CGS (Canadian Geotechnical Society). Canadian Foundation Engineering Manual; Canadian Geotechnical Society: Toronto, ON, Canada, 2006. [Google Scholar]
  22. 2GEO/ISO 19901-4; Geotechnical and Foundation Design Considerations: ANSI/API Recommended Practice, 1st ed. API (American Petroleum Institute): Washington, DC, USA, 2011.
  23. Henke, S.; Bienen, B. Centrifuge tests investigating the influence of pile cross-section on pile driving resistance of open-ended piles. Int. J. Phys. Model. Geotech. 2013, 13, 50–62. [Google Scholar] [CrossRef]
  24. Kim, Y.; Jeong, S.S. Analysis of dynamically penetrating anchor based on coupled Eulerian-Lagrangian (CEL) method. KSCE J. Civ. Environ. Eng. Res. 2014, 34, 895–906. [Google Scholar] [CrossRef]
  25. Ko, J.; Jeong, S.; Lee, J.K. Large deformation FE analysis of driven steel pipe piles with soil plugging. Comput. Geotech. 2016, 71, 82–97. [Google Scholar] [CrossRef]
  26. Daryaei, R.; Bakroon, M.; Aubram, D.; Rackwitz, F. Numerical evaluation of the soil behavior during pipe-pile installation using impact and vibratory driving in sand. Soil Dyn. Earthq. Eng. 2020, 134, 106177. [Google Scholar] [CrossRef]
  27. Augarde, C.E.; Lee, S.J.; Loukidis, D. Numerical modelling of large deformation problems in geotechnical engineering: A state-of-the-art review. Soils Found. 2021, 61, 1718–1735. [Google Scholar] [CrossRef]
  28. Qin, W.; Cai, S.; Dai, G.; Wang, D.; Chang, K. Soil resistance during driving of offshore large-diameter open-ended thin-wall pipe piles driven into clay by impact hammers. Comput. Geotech. 2023, 153, 105085. [Google Scholar] [CrossRef]
  29. Duan, N.; Cheng, Y.P.; Liu, J.W. DEM analysis of pile installation effect: Comparing a bored and a driven pile. Granul. Matter 2018, 20, 36. [Google Scholar] [CrossRef]
  30. Li, L.; Wu, W.; El Naggar, M.H.; Mei, G.; Liang, R. DEM analysis of the sand plug behavior during the installation process of open-ended pile. Comput. Geotech. 2019, 109, 23–33. [Google Scholar] [CrossRef]
  31. Liu, J.; Duan, N.; Cui, L.; Zhu, N. DEM investigation of installation responses of jacked open-ended piles. Acta Geotech. 2019, 14, 1805–1819. [Google Scholar] [CrossRef]
  32. Kim, M.; Li, L.; Seo, H. Effect of a constrictor plate on behavior of a model steel pipe pile driven in dense sand. Ocean Eng. 2023, 267, 113210. [Google Scholar] [CrossRef]
  33. Huang, A.B.; Ma, M.Y. An analytical study of cone penetration tests in granular material. Can. Geotech. J. 1994, 31, 91–103. [Google Scholar] [CrossRef]
  34. Lobo-Guerrero, S.; Vallejo, L.E. DEM analysis of crushing around driven piles in granular materials. Geotechnique 2005, 55, 617–623. [Google Scholar] [CrossRef]
  35. Itasca Consulting Group, Inc. Itasca’s Particle Flow Code Documentation, version 6.0; Itasca Consulting Group: Minneapolis, MN, USA, 2021.
  36. Lee, J.; Prezzi, M.; Salgado, R. Experimental investigation of the combined load response of model piles driven in sand. Geotech. Test. J. 2011, 34, 653–667. [Google Scholar] [CrossRef]
  37. El-Sekelly, W.; Tessari, A.; Abdoun, T. Shear wave velocity measurement in the centrifuge using bender elements. Geotech. Test. J. 2014, 37, 689–704. [Google Scholar] [CrossRef]
  38. Zhang, M.X.; Qiu, C.C.; Javadi, A.A.; Lu, Y.; Zhang, S.L. Discrete-element method simulation of a model test of an embankment reinforced with horizontal–vertical inclusions. Geosynth. Int. 2013, 20, 238–251. [Google Scholar] [CrossRef]
  39. Esposito, R.G.; Velloso, R.Q.; do Amaral Vargas, E., Jr.; Danziger, B.R. Multi-scale sensitivity analysis of pile installation using DEM. Comput. Part. Mech. 2018, 5, 375–386. [Google Scholar] [CrossRef]
  40. Salot, C.; Gotteland, P.; Villard, P. Influence of relative density on granular materials behavior: DEM simulations of triaxial tests. Granul. Matter 2009, 11, 221–236. [Google Scholar] [CrossRef]
  41. Muir Wood, D.; Maeda, K. Changing grading of soil: Effect on critical states. Acta Geotech. 2008, 3, 3–14. [Google Scholar] [CrossRef]
  42. Yin, Z.; Wang, P. Micro-mechanical analysis of caisson foundation in sand using DEM: Particle shape effect. Appl. Ocean Res. 2021, 111, 102630. [Google Scholar] [CrossRef]
  43. Wang, P.; Yin, Z.Y.; Zhou, W.H.; Chen, W.B. Micro-mechanical analysis of soil–structure interface behavior under constant normal stiffness condition with DEM. Acta Geotech. 2022, 17, 2711–2733. [Google Scholar] [CrossRef]
  44. Seo, H.; Kim, M. Soil plug behaviour of open-ended pipe piles during installation. DFI J. 2017, 11, 128–136. [Google Scholar] [CrossRef]
  45. Jeong, S.; Ko, J.; Won, J.; Lee, K. Bearing capacity analysis of open-ended piles considering the degree of soil plugging. Soils Found. 2015, 55, 1001–1014. [Google Scholar] [CrossRef]
Figure 1. Particle size distribution curves of Ottawa F-55 sand and the granular assembly in the DEM model.
Applsci 14 06512 g001
Figure 2. Peak state friction angle of the granular assembly.
Applsci 14 06512 g002
Figure 3. Configuration of the overview of the PFC modeling.
Applsci 14 06512 g003
Figure 4. Procedures for evaluating the extreme void ratios (modified from Muir Wood and Maeda [41]).
Applsci 14 06512 g004
Figure 5. Initial state of the sample as a function of depth.
Applsci 14 06512 g005
Figure 6. Pile displacement versus time for simulating the pile installation.
Applsci 14 06512 g006
Figure 7. Progressive state of the model by pile penetration.
Applsci 14 06512 g007
Figure 8. Soil plug length comparison between the numerical simulation and experimental result [32].
Applsci 14 06512 g008
Figure 9. Plug length indices from the DEM simulation and model pile test (Kim et al. [32]): (a) PLR; (b) IFR.
Applsci 14 06512 g009
Figure 10. Horizontal and vertical stress distribution within the soil plug and the contact force chain at the penetration depth of (a) 292 mm, (b) 555 mm, and (c) 596 mm.
Applsci 14 06512 g010
Figure 11. Local stress state of the soil plug at the top, middle, and bottom sections.
Applsci 14 06512 g011
Figure 12. Distribution of the lateral earth pressure coefficient inside the soil plug at the 432 mm and 555 mm penetration stages.
Applsci 14 06512 g012
Figure 13. Results of the numerical analysis of (a) soil plug length, (b) configuration, (c) plug length ratio, and (d) incremental filling ratio of each model at the final penetration depth.
Applsci 14 06512 g013
Figure 14. Correlation between the IFR and the PLR [7,45].
Applsci 14 06512 g014
Figure 15. Variation in the horizontal stress inside the soil plug at the bottom section for each model.
Applsci 14 06512 g015
Table 1. Soil properties of the test material (modified from Kim et al. [32]).
Soil PropertiesValues/Classification
D10 (mm)0.157
D30 (mm)0.211
D50 (mm)0.256
D60 (mm)0.276
Coefficient of uniformity, Cu1.76
Coefficient of curvature, Cc1.03
emin and emax [36]0.47 and 0.78
Peak friction angle [37] (Dr of 80–90%), ϕ p (degree)38
Critical-state friction angle, ϕ c (degree)32.8
Gs2.65
Particle shapeSubangular to subrounded
Unified Soil Classification SystemPoorly graded sand (SP)
Table 2. Input parameters of the numerical model.
Input ParametersValue
  Soil properties
Normal stiffness, kn (kN/m)1 × 105
Shear stiffness, ks (kN/m)2 × 104
Friction coefficient, μ0.50
Rolling friction coefficient, μr0.45
Specific gravity, Gs2.65
  Wall properties
Normal stiffness, kn (kN/m)1 × 107
Shear stiffness, ks (kN/m)1 × 107
Friction coefficient, μ0.50
Disclaimer/Publisher’s Note: The statements, opinions and data contained in all publications are solely those of the individual author(s) and contributor(s) and not of MDPI and/or the editor(s). MDPI and/or the editor(s) disclaim responsibility for any injury to people or property resulting from any ideas, methods, instructions or products referred to in the content.

