Featured Application
The proposed modeling solution enables realistic multi-body simulations of subgrade layers in the railway infrastructure context, for the purpose of modal analysis.
Abstract
A novel modeling solution (MS) was created that can provide realistically accurate results on the natural frequencies of a railway subgrade layer in the context of a railway infrastructure numerical simulation. This MS was specifically developed for implementation in a multibody simulation (MBS) model, which constitutes a step forward in relation to the state-of-art of this specific topic. The main obstacle was to find a criterion to define the geometry and dimensions of the subgrade elements inside the numerical model, so that the resulting resonance frequencies would be realistically accurate and representative. The proposed MS combines four theoretical models to create a set of equations that enables a deterministic relationship between the height and the diameter of a cylindrically shaped subgrade layer element to be implemented in the MBS model. This MS is dedicated to simulating scenarios involving railway infrastructure and a railway vehicle. However, its background theoretical models are adaptable to simulating other model configurations. This article details the MS and a sensitivity analysis that was performed to assess it. These tests were performed using the MBS software Simpack® (version 2021x). The results obtained from these tests support the selected theoretical equations and the overall validity of the proposed MS.
1. Introduction
The railway sector is of major importance in today’s society, which explains the continuous investment and research into the development of several relevant topics in this field. One such topic is the development and improvement of modeling solutions for railway vehicles and/or railway infrastructures, which can range from simple predictive maintenance-related models to digital twins of entire railway lines and vehicle fleets [1,2]. Among their several benefits, these models are important tools for use by railway managers to support efficient and timely maintenance actions.
Many of the available solutions dedicated to modeling the railway infrastructure are focused on either the plain railway superstructure or specific assets, such as bridges/viaducts or tunnels [3,4,5]. Common applications for these models include the Structural Health Monitoring of specific assets, the detection of track defects, or the prediction of track degradation [1,2,3,6]. Despite the major focus on railway superstructure, the railway substructure is also the main goal of several modeling solutions. Most of them involve either lumped-elements theoretical models, where the substructure is represented by layers of spring-damper elements, or complex numerical simulations using the Finite Element Method (FEM) or other similar methods, where every component is modeled in detail [7,8,9,10]. These modeling solutions can be used for several applications, such as to analyze noise and vibration propagation from the track [11,12] or assess soil stability conditions under traffic loads [13].
However, there is a significant lack of modeling solutions for the railway substructure based on multibody simulation (MBS) models. This group of numerical simulation solutions is amply used to model railway vehicles and the railway superstructure [6,14,15], but to the authors’ knowledge, there is no dedicated modeling solution focused on modeling the substructure with this type of software as a fully formed set of elements with their own independent and complete modal properties (mass, stiffness and damping). The common alternative modeling solutions either oversimplify the substructure representation by modeling it with only spring-damper elements, thus inherently coupling its modal properties and dynamic responses to the surrounding elements (e.g., coupled natural frequencies that depend on the mass of the elements above the substructure), or use FEM models to fully represent the substructure, which naturally involves higher development and computation costs [8,9,10].
The main objective of such a tool would be to enable proper modal analysis on a railway substructure model, where the uncoupled natural frequencies of this railway component could be extracted with significantly less computational effort than a FEM simulation. The need for such a modeling solution came during the development of a new track condition monitoring methodology (TCMM) that is based on the modal analysis of the natural frequencies of the multi-element system that encompasses an instrumented railway vehicle and the railway infrastructure under analysis [16,17]. This methodology proposes the assessment of the railway infrastructure by monitoring the first vertical resonance frequency of the upper soil layer beneath the track (i.e., the first subgrade layer), thus taking into account the subgrade’s major contribution to overall track support conditions, as opposed to the more common solutions that focus on superstructure conditions [4,18,19].
The development of this TCMM required a modeling solution that could provide adequate and realistic modal results from this multi-element mechanical system, but also simulate long stretches of railway track in a time-efficient manner (i.e., simulate track lengths of over 1 km). These requirements pushed for the use of an MBS software, but there was still a significant issue to be solved that involved defining the dimensions of the subgrade layer element that would enable realistically accurate results in terms of its natural frequencies by clearly defining an appropriate and compatible mass value. More specifically, there were two aspects that needed to be settled to solve this issue:
- What should be the geometrical shape of the subgrade element?
- What should be its dimensions?
A specific modeling solution (MS) that solves the previous issue is proposed here that defines concrete answers to the two previous questions, thus providing the means to perform numerical simulations on railway tracks using an MBS software and obtain realistic modal results from the track substructure, in terms of its resonance frequencies. This implementation allows for the simulation of long track sections in each run at a fraction of the computational effort that other modeling solutions would require. For example, Simpack® (an MBS software) requires 10 to 20 min to simulate the passage of a single railway vehicle over a plain track model with a length of 2000 m using the proposed MS. By contrast, the same model conditions could easily require multiple hours or even days to run in an FEM model [14].
While this MS does not allow for the analysis of some situations, like noise and vibration propagation from a railway track, it fills a niche that could be useful for other track monitoring solutions or related applications where computational time is crucial. An example of such an application is data generation for training Machine Learning algorithms to be used on drive-by track condition assessment strategies [5], which could be focused on assessing the entire railway infrastructure, and not just focuses on the superstructure.
This article presents a detailed description of the proposed MS in Section 2, followed by the Simpack® (version 2021x) model that was used to perform a systematic sensitivity analysis of several parameters that could influence the quality of the results provided by this MS. Section 3 shows the obtained results and relevant conclusions.
2. Materials and Methods
This section describes the proposed MS, including all the theoretical models used. As previously explained, the MS proposed here was developed to allow the simulation of the layered elements of a railway infrastructure (e.g., ballast layer and subgrade layer), and a moving railway vehicle, in the context of an MBS model. More specifically, the main goal was to be able to obtain realistic results from the vehicle–track dynamic interaction, with a focus on the vertical resonance frequency of the underlying soil layer of the substructure (i.e., the first subgrade layer).
2.1. Underlying Premise and Main Concept
Before describing the main concept behind the proposed MS, this subsection presents an important premise permitting the underlying logic that was used in its design, in terms of physical and mechanical principles. The premise in question is: “The values of the natural frequencies of the soil layers beneath a railway track do not directly depend on the presence of a railway vehicle on said track”. This means that the observable values of the natural frequencies of the soil layers do not directly change due to the presence of a vehicle above those layers, and do not change based on the modal parameters of the vehicle. This statement does not disregard the expected smaller changes in the values of the resonance frequencies from the soil layers due to the dynamic interaction between the two mechanical systems in question (i.e., the railway infrastructure and vehicle). Instead, it just states that there is no direct change in these natural frequencies caused by the presence of a railway vehicle, since the characteristic frequencies of a linear mechanical system are independent from the properties of the excitation source used to assess them [18]. This concept is applicable here as an approximation of this complex multi-element system, for the purpose of modal analysis, in the same way that it is acceptable in the context of analyzing other common engineering structures [20]. This premise has been clearly presented here first, due to its relevance to the topic under study, since this is something that is not commonly stated in the bibliography that deals with the natural frequencies of soil layers in the railway context [4,19,21].
In an MBS model, using only rigid-type body elements, there is an inherent detachment between the mechanical properties of a body element and its geometric dimensions. While overall mass can be established using a body’s geometry and its density, parameters related with other mechanical properties cannot be directly linked to body elements (e.g., Young’s modulus). These other mechanical properties are usually simulated through other element types, such as springs and dampers. In the present context, this means that there is a disconnection between the geometry/mass of a subgrade layer body element and its equivalent stiffness characteristics. Furthermore, this means that the natural frequency values of the simulated subgrade layer are dependent on the combination of the imposed mass of the subgrade body element and the stiffness of the associated spring element, which have no intrinsic relationship. This is in opposition to other modeling software (e.g., FEM model), where the mechanical properties of a subgrade layer can be intrinsically established during model setup. Thus, in an MBS model, the subgrade’s mechanical properties are not fully linked to enable an adequate simulation of the subgrade’s natural frequencies. Another aspect related to this issue is the difficulty in obtaining realistic values for the modal properties of a soil layer, as opposed to a common steel beam, which hinders the option of simply imposing these values on an MBS model.
The proposed MS overcomes these issues by providing a set of theoretical models that result in a fully determined system for the subgrade layer element’s geometry to be used in an MBS model. More specifically, by selecting a cylindrical shape for the body elements of the railway’s layered elements (e.g., a subgrade layer and a ballast layer) and some input parameters related with their mechanical properties, this MS provides an equation that gives the diameter of these cylindrical elements as a function of subgrade layer height. As previously explained, the proposed MS represents a potential innovation in the specific field of soil layer modeling in the railway context, which is denoted by both the combined model and the geometry shape choice, since the authors did not find any similar solution in the consulted bibliography. As will be presented in Section 2.2, soil layer height is a major parameter in the process of estimating soil layer natural frequencies using the established theoretical model [12,19], hence its importance in this combined model.
2.2. Proposed Modeling Solution
The MS proposed here is a combination of four distinct theoretical models, which together create a deterministic solution for the layered elements’ geometry in an MBS model. Table 1 presents a list of the main geometrical and mechanical parameters that relate to these theoretical models. The control parameter of this combined model, to verify the realistic scenario conditions, is the natural frequency of the first vertical vibration mode of the subgrade layer. The four theoretical submodels (SM) are described below.

Table 1.
Main parameters used in the proposed modeling solution.
The first submodel (SM-Freq) is the theoretical equation of the natural frequencies of a surface-level soil layer from a natural soil deposit [12,19]. For each vibration wave type (e.g., longitudinal waves or shear waves), the general form of this equation can estimate the frequency values for the n vibration modes of a soil layer. The kinematics of each vibration mode depend on the type of vibration wave created by the excitation source and its position relative to the soil layer. The specific form of this equation used here (Equation (1)) gives the frequency value of the first vibration mode (f1), due to a vertical excitation source, based on the soil’s characteristic longitudinal wave velocity (cp) and the soil layer’s height (h). This corresponds to the first vertical vibration mode that is dynamically excited by the presence of an excitation source above the soil layer, such as a railway vehicle, which is the most relevant situation in the present context [12].
The second submodel (SM-Wave) is the equation for the characteristic longitudinal wave velocity of a soil layer (cp) [12,19]. This equation (Equation (2)) provides a relationship between relevant mechanical properties of the soil to be simulated, namely, its shear modulus (G), its density (ρ), its Young’s modulus (E) and its Poisson’s ratio (ν). Equations (3) and (4) present the formula for the Lamé parameters (λ, μ), which are relevant for Equation (2). SM-Freq and SM-Wave represent a deterministic pair of equations for the natural frequency of a soil layer, for a given set of the relevant input parameters. This theoretical formulation is well known in the geotechnical field [21]. However, it is not enough to define the geometric shape of the railway’s layered elements in an MBS model, since it only establishes layer height. Therefore, there was a need for additional models to be added to the overall formulation.
The third sub-model (SM-Lumped) is a lumped-elements type model that can provide an adequate estimate of the subgrade’s resonance frequency of interest obtainable from an MBS simulation [17]. This theoretical model was developed in the context of the new TCMM that was previously mentioned. It is a two Degree-of-Freedom (2-DoF) model, containing an assembly of two spring-mass subsystems in series, which represents the vehicle, per axle, and the railway infrastructure beneath it. The lower mass element represents the unsprung mass of one vehicle axle and the modal mass of the infrastructure section that is being dynamically excited by the passing vehicle (m1), and the second represents the vehicle’s sprung mass that is supported by one axle (m2). These body elements are linked by a spring that represents the vehicle’s suspension system (k2). The remaining element is a spring that characterizes the modal stiffness of the railway infrastructure (k1). This last element aggregates all stiffness contributions from the entire railway infrastructure, including from the subgrade layer. The outputs of this model are two natural frequencies (ω1 and ω2) [20]. Frequency ω2 is mainly influenced by the vehicle’s modal characteristics and corresponds to the vertical oscillatory motion of the vehicle’s sprung mass, which has a frequency range between 1 and 5 Hz for common passenger carriages [10]. On the other hand, frequency ω1 is influenced by the modal parameters of the railway infrastructure elements. This is the frequency that represents an adequate estimate of the subgrade’s first vertical resonance frequency obtainable from an MBS model (fsim) in the presented conditions [17]. Morais et al. (2021) provides a more in-depth description of this TCMM and this concept [16].
The formula for frequency ω1 is the equation associated with SM-Lumped (Equation (5)). In this equation, k2 represents the vertical stiffness of the primary suspension of the vehicle, even for a vehicle with two suspension levels, since it is the spring element that separates the sprung and unsprung mass elements of the vehicle. Equation (5) also shows how ω1 is calculated with the relevant parameters from Table 1.
Having integrated the layered elements’ mass (included in m1) in the overall formulation, the conditions to establish their geometry were still not met. The system of equations was still undetermined due to the vertical stiffness term of the subgrade layer (ki.su).
The fourth sub-model (SM-Stiffness) is an equation that gives an estimate of the vertical stiffness that a platform or foundation would perceive when placed on a single soil layer (kf). This sub-model (Equation (6)) defines the soil layer as a homogeneous half-space and is solely based on the in-plane dimensions of the platform and the mechanical properties of the soil layer [22]. This equation will be used to provide an estimate for the subgrade layer vertical stiffness (ki.su), a concept that has already been used in another railway-related context to study vibration propagation from a railway track [12]. In the railway context, the platform’s dimensions used are the length (2a) and width (2b) of a sleeper. The soil’s mechanical properties relevant for this equation are its shear modulus (G) and its Poisson’s ratio (ν).
With this additional equation, the combined model now represents a deterministic solution for the geometry of the railway’s layered elements to be used in an MBS model. However, before describing in detail how this combined model is implemented, the following list presents some relevant aspects that are related to the required modeling conditions:
- This formulation works with a vehicle control volume of one axle and the respective portion of vehicle sprung mass (e.g., for a vehicle with four axles, the sprung mass to be considered here would be ¼ of the total mass);
- Only a single sleeper is being considered as part of each set of infrastructure elements;
- A cylindrical shape is being used for all the railway layered elements to be modeled in the MBS software, and their respective heights are imposed by the user;
- The equivalent vertical stiffness and density of the railway layered elements are also selected by the user. From a practical point of view, estimates of these vertical stiffness values can be obtained based on experimental data, or obtained from theoretical track deformation values and the respective imposed testing load.
Finally, this combined model is implemented by pairing SM-Freq with SM-Lumped, via imposing equality between the frequency values obtainable from these two submodels (f1 and ω1). This results in an equation that can be solved in respect to the diameter of the layered elements of the railway infrastructure (θ). Its final form is shown in Equation (7), which makes use of the relevant parameters from Table 1. This equation represents the main output of this combined model.
Of note, while the modeling scenario considered here involves a railway vehicle placed above a railway infrastructure, this formulation should still work in other scenarios with just some adjustments. For example, to represent only a soil layer and no vehicle would only require an adjustment to the lumped elements model used in SM-Lumped by considering only a 1-DoF model (m1 and k1). Naturally, this MS had to be tested to verify the validity of the concept. Some results regarding this topic are shown in Section 3.
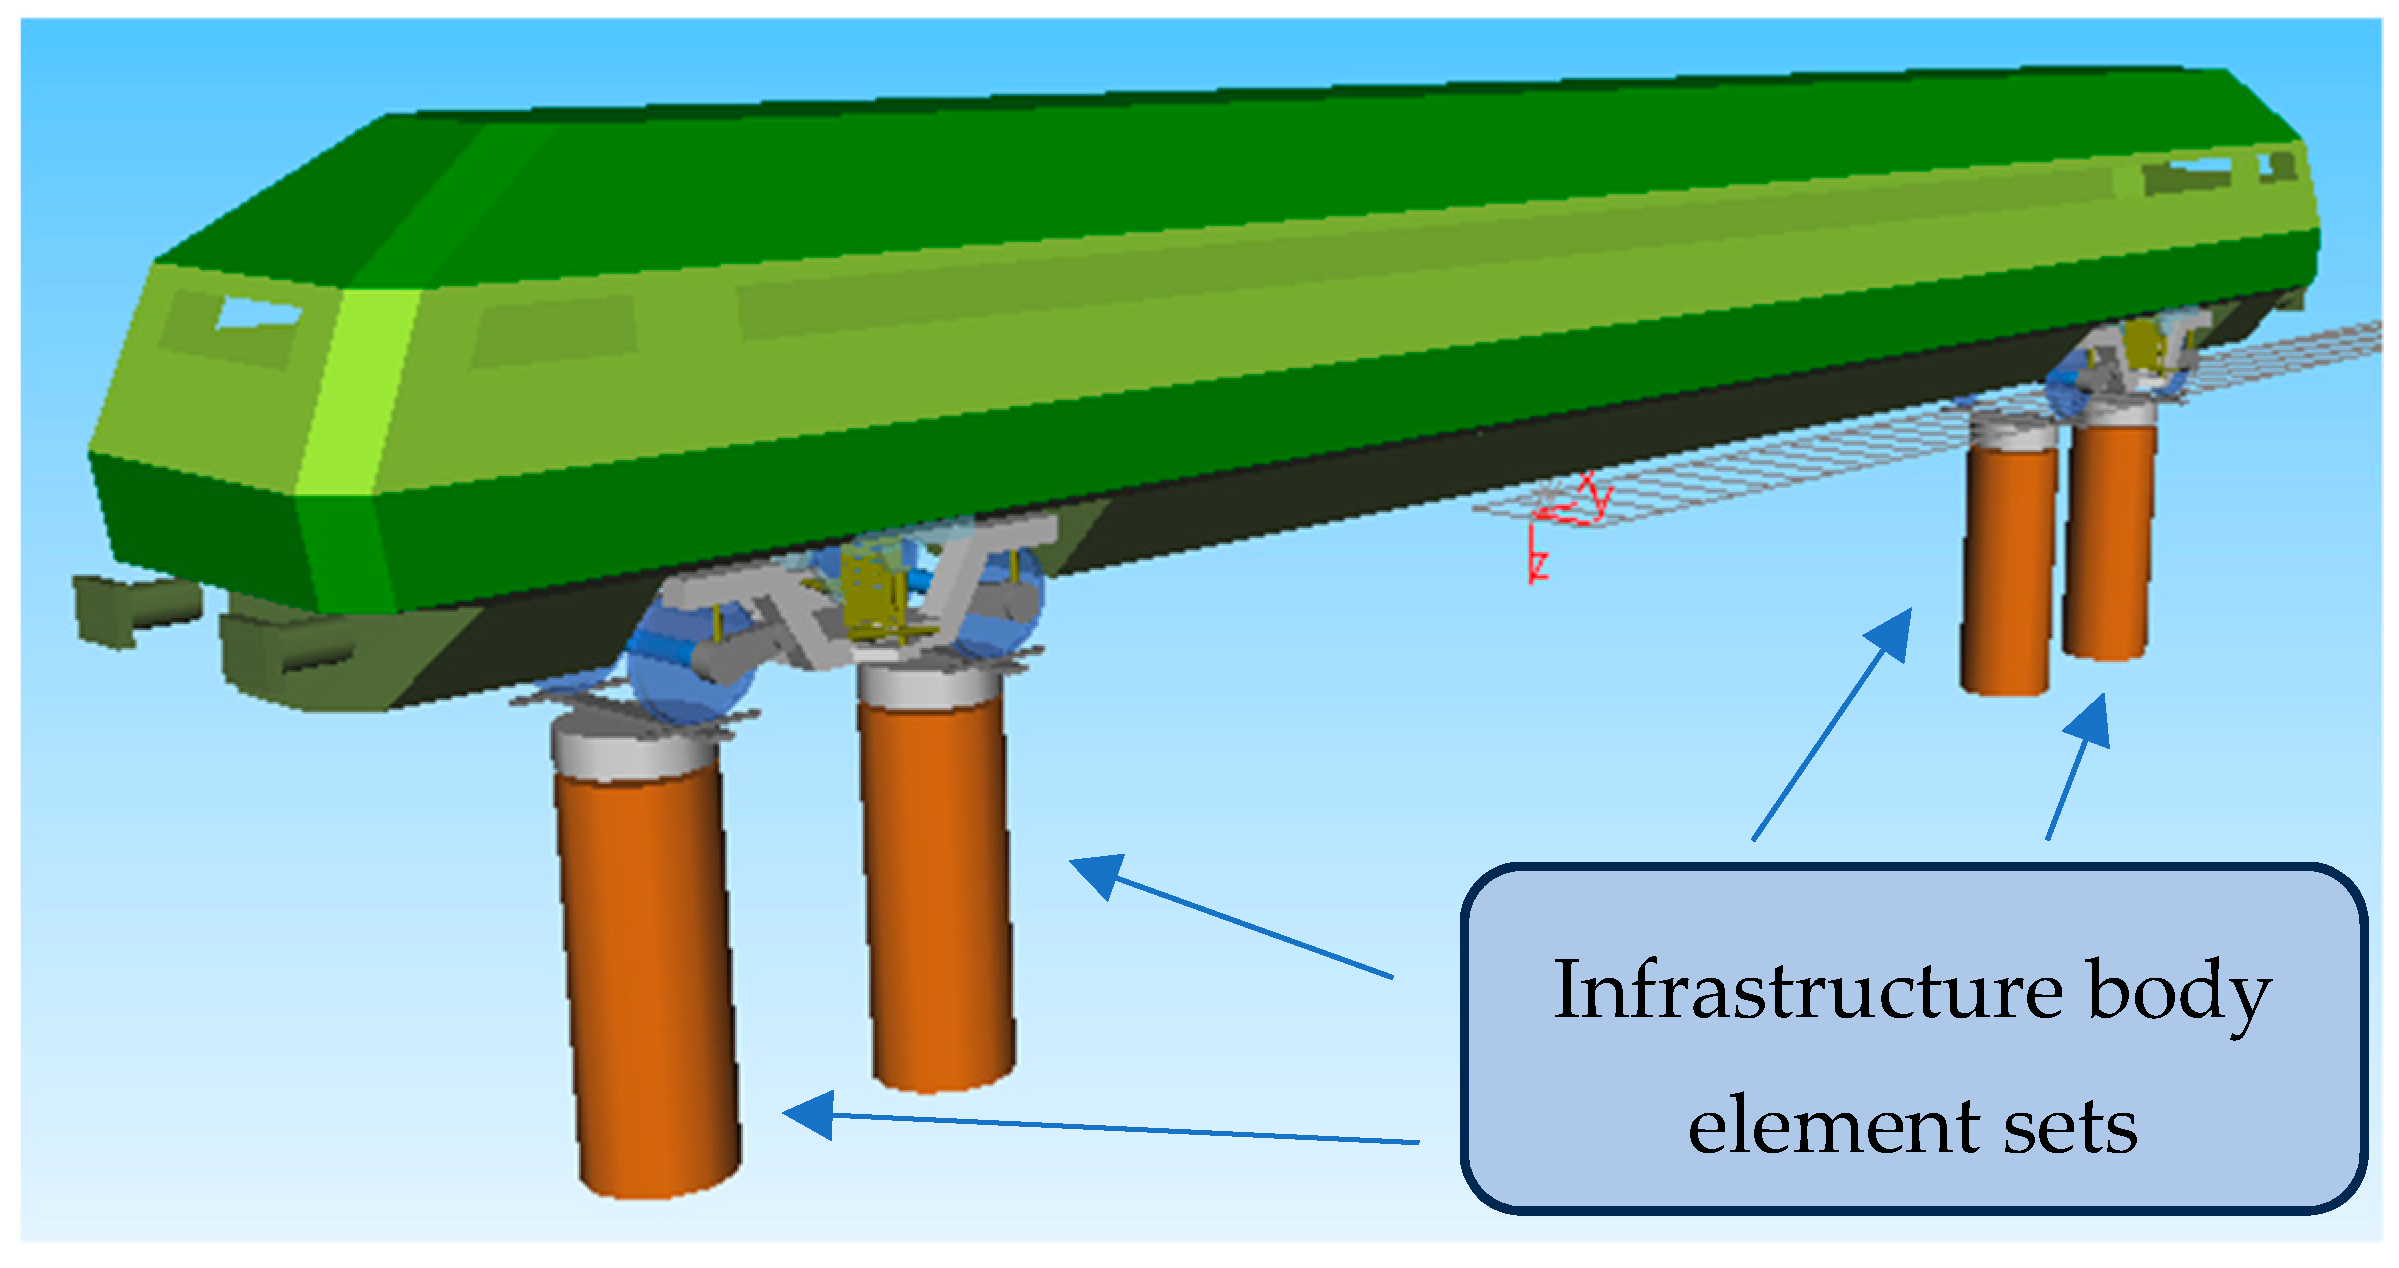
2.3. Simpack® Numerical Model
This subsection presents the Simpack® (version 2021x) model (Figure 1) that was developed based on the proposed MS to assess its validity and perform a sensitivity analysis on the parameters that influence Equation (7). This will be checked by comparing the subgrade’s theoretical resonance frequency value given by the combined model with the equivalent resonance frequency obtained from the Simpack® model (fsim). The sensitivity analysis results for some of these parameters will also be presented here, along with a discussion on the overall validity of this concept. The core elements of this MBS model were a basic railway passenger carriage, with two bogies, and four sets of elements to represent the railway infrastructure presence below each vehicle axle. The geometry and dimensions of the layered components of these railway infrastructure element sets were defined based on the proposed MS by selecting subgrade layer heights from a predefined testing range.
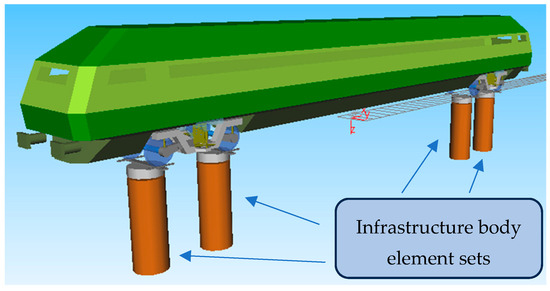
Figure 1.
Simpack® model made by a railway passenger carriage and the railway infrastructure.
The generic vehicle model included all the elements relevant for these tests, namely, springs and dampers elements for the two levels of suspension systems, and mass elements to represent both the sprung and unsprung mass components of the vehicle. A passenger carriage was chosen as the model for these tests since it represents one of the more common railway vehicle types and is the intended subject for application of the proposed TCMM. Table 2 presents the nominal values of the main modal parameters of the vehicle model. These parameter values are in accordance with standard values used on similar numerical models [10,23].
Table 2.
Nominal parameter values used in the Simpack® vehicle model.
The railway infrastructure was described by four equal sets of body elements, each including two rail elements, one sleeper, and two cylinders placed on top of each other. These cylinders, which were set according to the proposed MS, represented a ballast layer (grey cylinder) and a subgrade layer (brown cylinder). This part of the model also contained spring-damper elements to simulate the equivalent vertical stiffness behavior from each component. During a standard simulation, these body element sets follow their corresponding vehicle axle as the vehicle moves along the cartographic profile of the track, thus enabling the application of varying track stiffness profiles on the track at each infrastructure level (i.e., sleeper, ballast and subgrade levels). The sleeper spacing effect is simulated by a relatively small harmonic oscillation of the vertical stiffness at that level. However, these operational details were not relevant for the sensitivity analysis since those results were obtained in a standstill model simulation. But they are essential for the validation efforts of the proposed TCMM using numerical data, as shown in Morais et al. (2023). Table 3 presents the nominal values used for the modal parameters of the infrastructure elements sets. The implemented modal stiffness and modal damping values are within the respective ranges used in the consulted bibliography, as are the density values used to calculate the mass for each layered element of the infrastructure [23].
Table 3.
Nominal parameter values used in the Simpack® infrastructure model.
The main objective of this model was to obtain the resonance frequency value of the first vertical vibration mode of the simulated subgrade layer (fsim), which should be related with the natural frequency value of a real subgrade layer with similar characteristics as the ones being simulated. This value was obtained by performing modal analyses on the presented numerical model, via a tool in Simpack® called “Eigenvalues Analysis”. This tool calculates each resonance frequency present on the model, based on its initial conditions, and provides a representation of the kinematics of each vibration mode.
As presented in Morais et al. (2023), the subgrade vibration mode of interest from a MBS model with this overall configuration corresponds to the full-body oscillation of all infrastructure elements, coupled with the unsprung mass of the vehicle, over the adjoining spring elements. This vibration mode has the highest sensitivity to the subgrade’s modal properties. Thus, it is the best candidate to represent the equivalent vibration mode of the first resonance frequency of the subgrade layer. Further details on this connection are available in Morais et al. (2023), including a more thorough explanation of why this choice was made and its adequacy [17].
Based on the nominal values selected for the model’s modal parameters (Table 2 and Table 3), an initial successful assessment of the validity of the proposed MS was performed by comparing the subgrade’s theoretical natural frequency value given by the combined model with the equivalent resonance frequency obtained by Simpack®. The obtained frequency was sufficiently close to the theoretical model’s estimate, with the error being under 5%. Then, to further verify this topic, a sensitivity analysis was performed to check the direct or indirect influence that several parameters could have on the quality of this comparison; that is, to check if the obtainable error margin was still adequate in a broader range of the relevant model parameters, thus assessing the MS’s robustness. The parameters that could directly influence this comparison are those that enter into the combined model (Equations (1)–(7)). The indirect influencing parameters correspond to those that are not specifically mentioned in the combined model but could potentially influence the results. Table 4 presents the values of the parameters that were used to obtain the sensitivity analysis results that will be shown in Section 3. The only indirectly influencing parameter shown in this table is the car body mass (mv.c). These specific ranges were selected with the intent of testing the limits of the MS from a mathematical standpoint, with less focus on trying to replicate a realistic situation. But each parameter range was still centered on the respective nominal values presented in Table 2 and Table 3. Each of these parameters was changed separately in each step of the sensitivity analysis, with the remaining parameters kept in the nominal values presented in Table 2 and Table 3.
Table 4.
Parameter values used in the sensitivity analysis on the proposed modeling solution.
For each of the parameter values presented in Table 4, theoretical and numerically calculated frequency values were determined for multiple subgrade layer heights, namely, for [2,3,4,5,6,10] meters. This range, which includes the nominal subgrade layer height mentioned in Table 3, was chosen to further test the capabilities of the proposed MS by simulating an even wider range of scenarios.
3. Results
This section presents the results from the sensitivity analysis performed for the validation of the proposed MS. The results will be presented per tested parameter, in two graphs. The first graph type compares the imposed subgrade layer heights with the respective layered element’s diameter obtained from Equation (7). This graph will provide information on whether and how the tested parameter affects this relationship. The second graph presents the ratio between the subgrade layer natural frequency value obtained from Equation (1) and the respective frequency value obtained from Simpack® (f1/fsim), for each subgrade layer height. From this second graph type, data regarding the validity of the proposed MS will be extracted, since it presents the obtained error in the estimation of the simulated resonance frequency of interest for each tested configuration. Figure 2, Figure 3, Figure 4, Figure 5 and Figure 6 present the results, in graphical form, for each of the tested parameters. These figures are displayed following the parameter order used in Table 4.
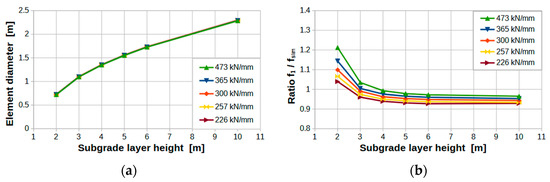
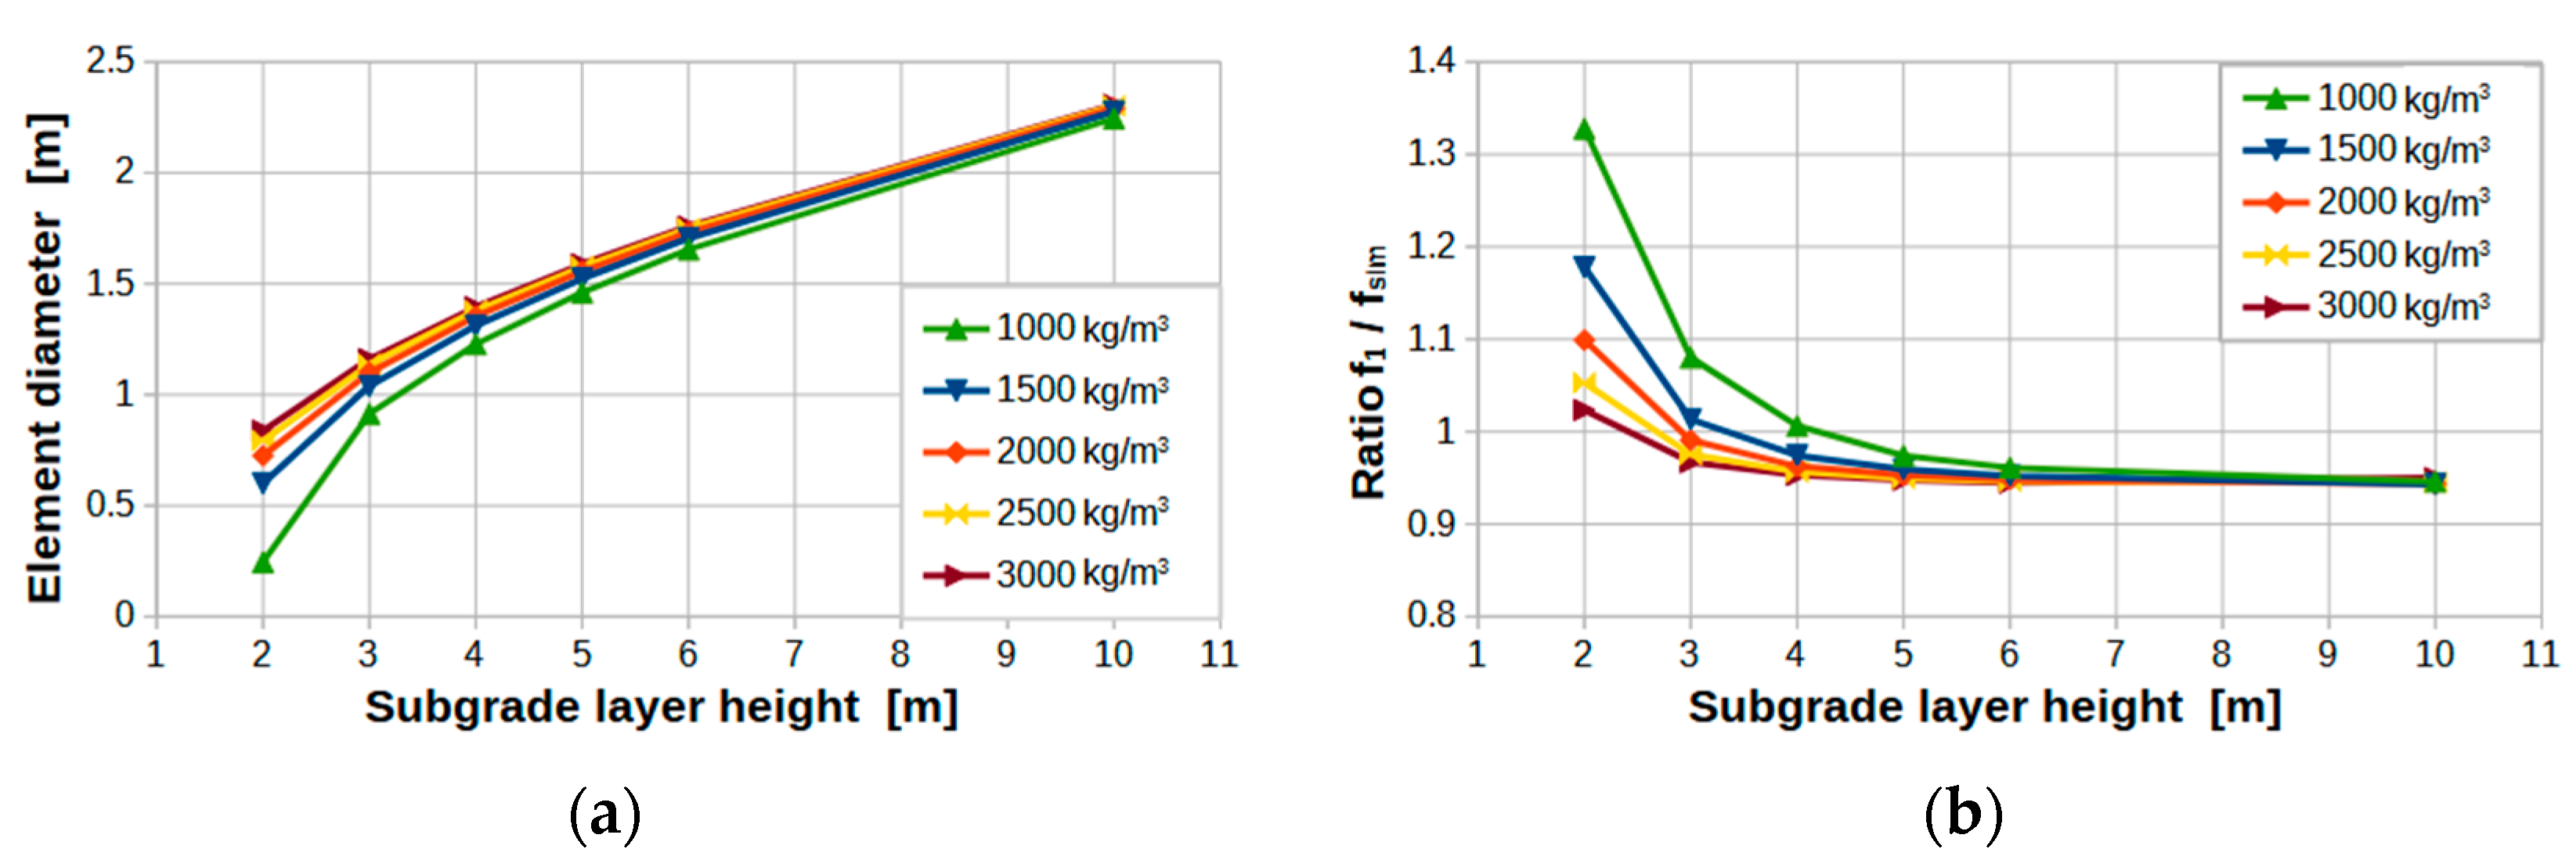
Figure 2.
Sensitivity analysis results in relation to subgrade stiffness (ki.su): (a) subgrade layer height to cylindrical element diameter curves; (b) subgrade layer height to obtained frequency ratio curves.
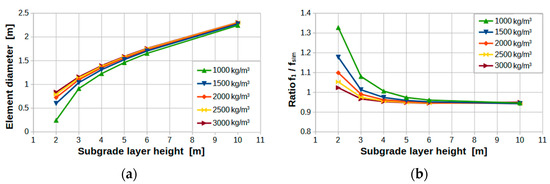
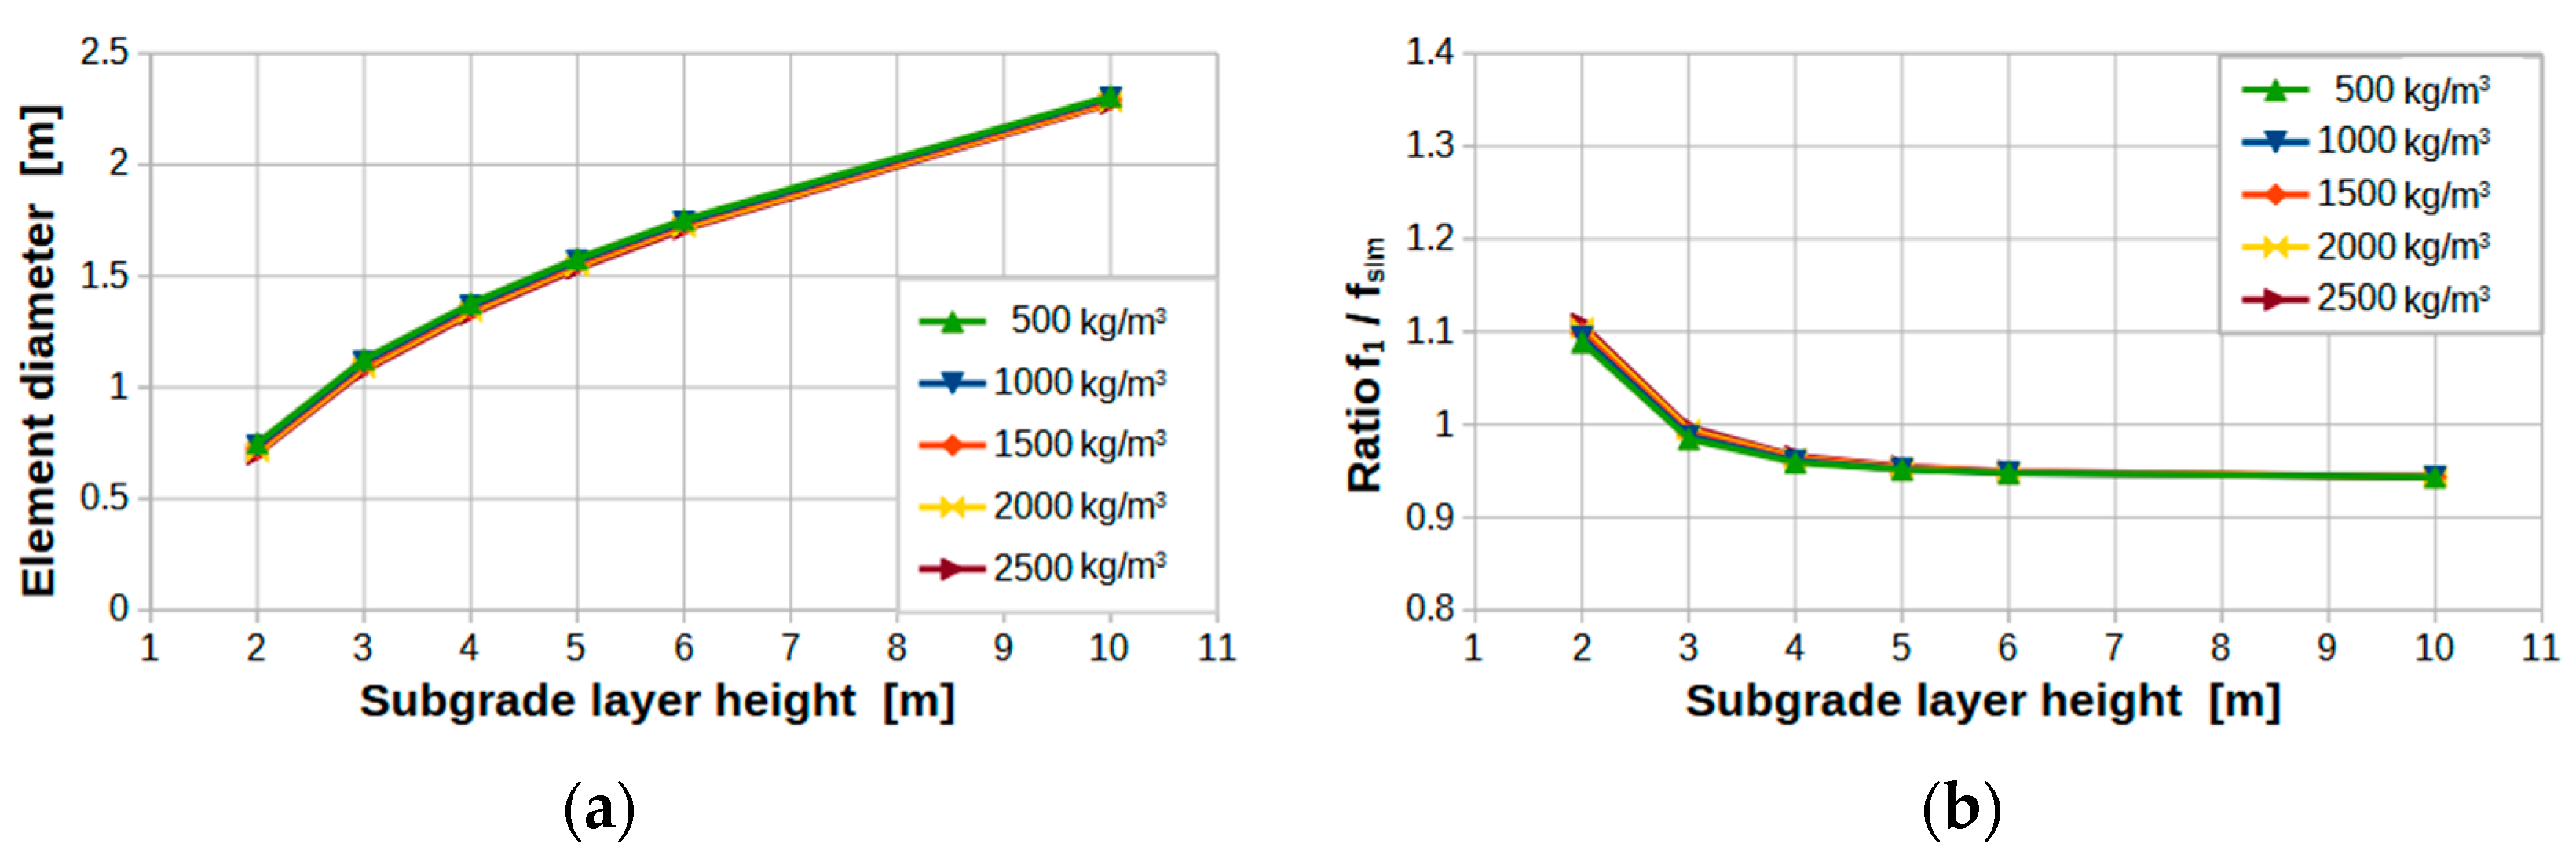
Figure 3.
Sensitivity analysis results in relation to subgrade density (ρsu): (a) subgrade layer height to cylindrical element diameter curves; (b) subgrade layer height to obtained frequency ratio curves.
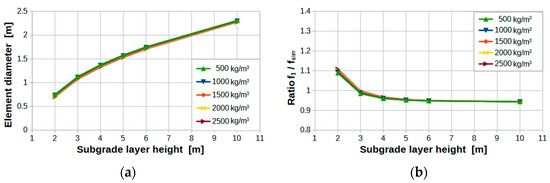
Figure 4.
Sensitivity analysis results in relation to ballast density (ρba): (a) subgrade layer height to cylindrical element diameter curves; (b) subgrade layer height to obtained frequency ratio curves.
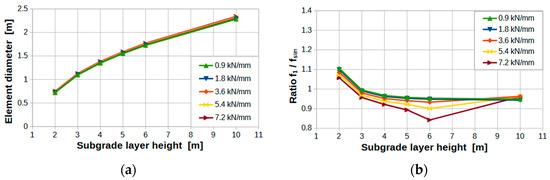
Figure 5.
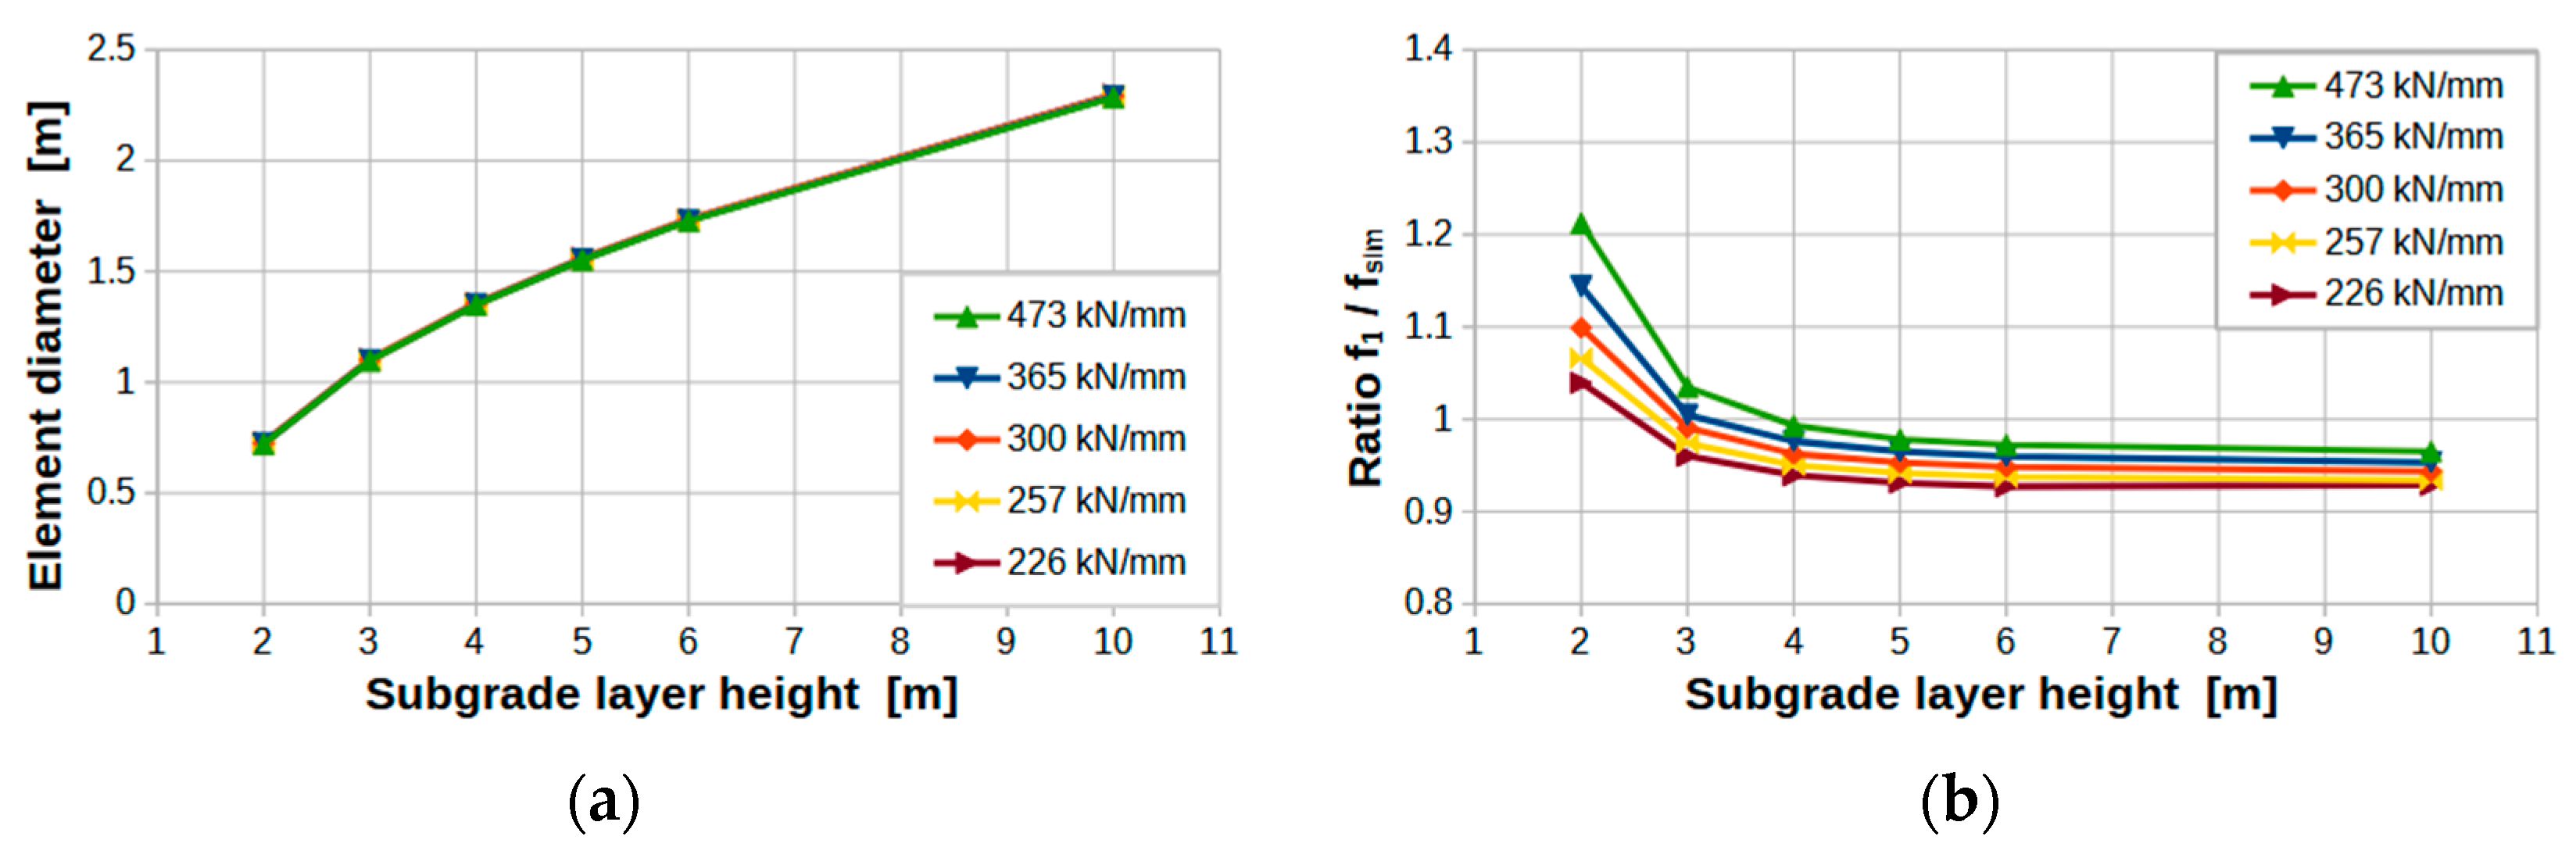
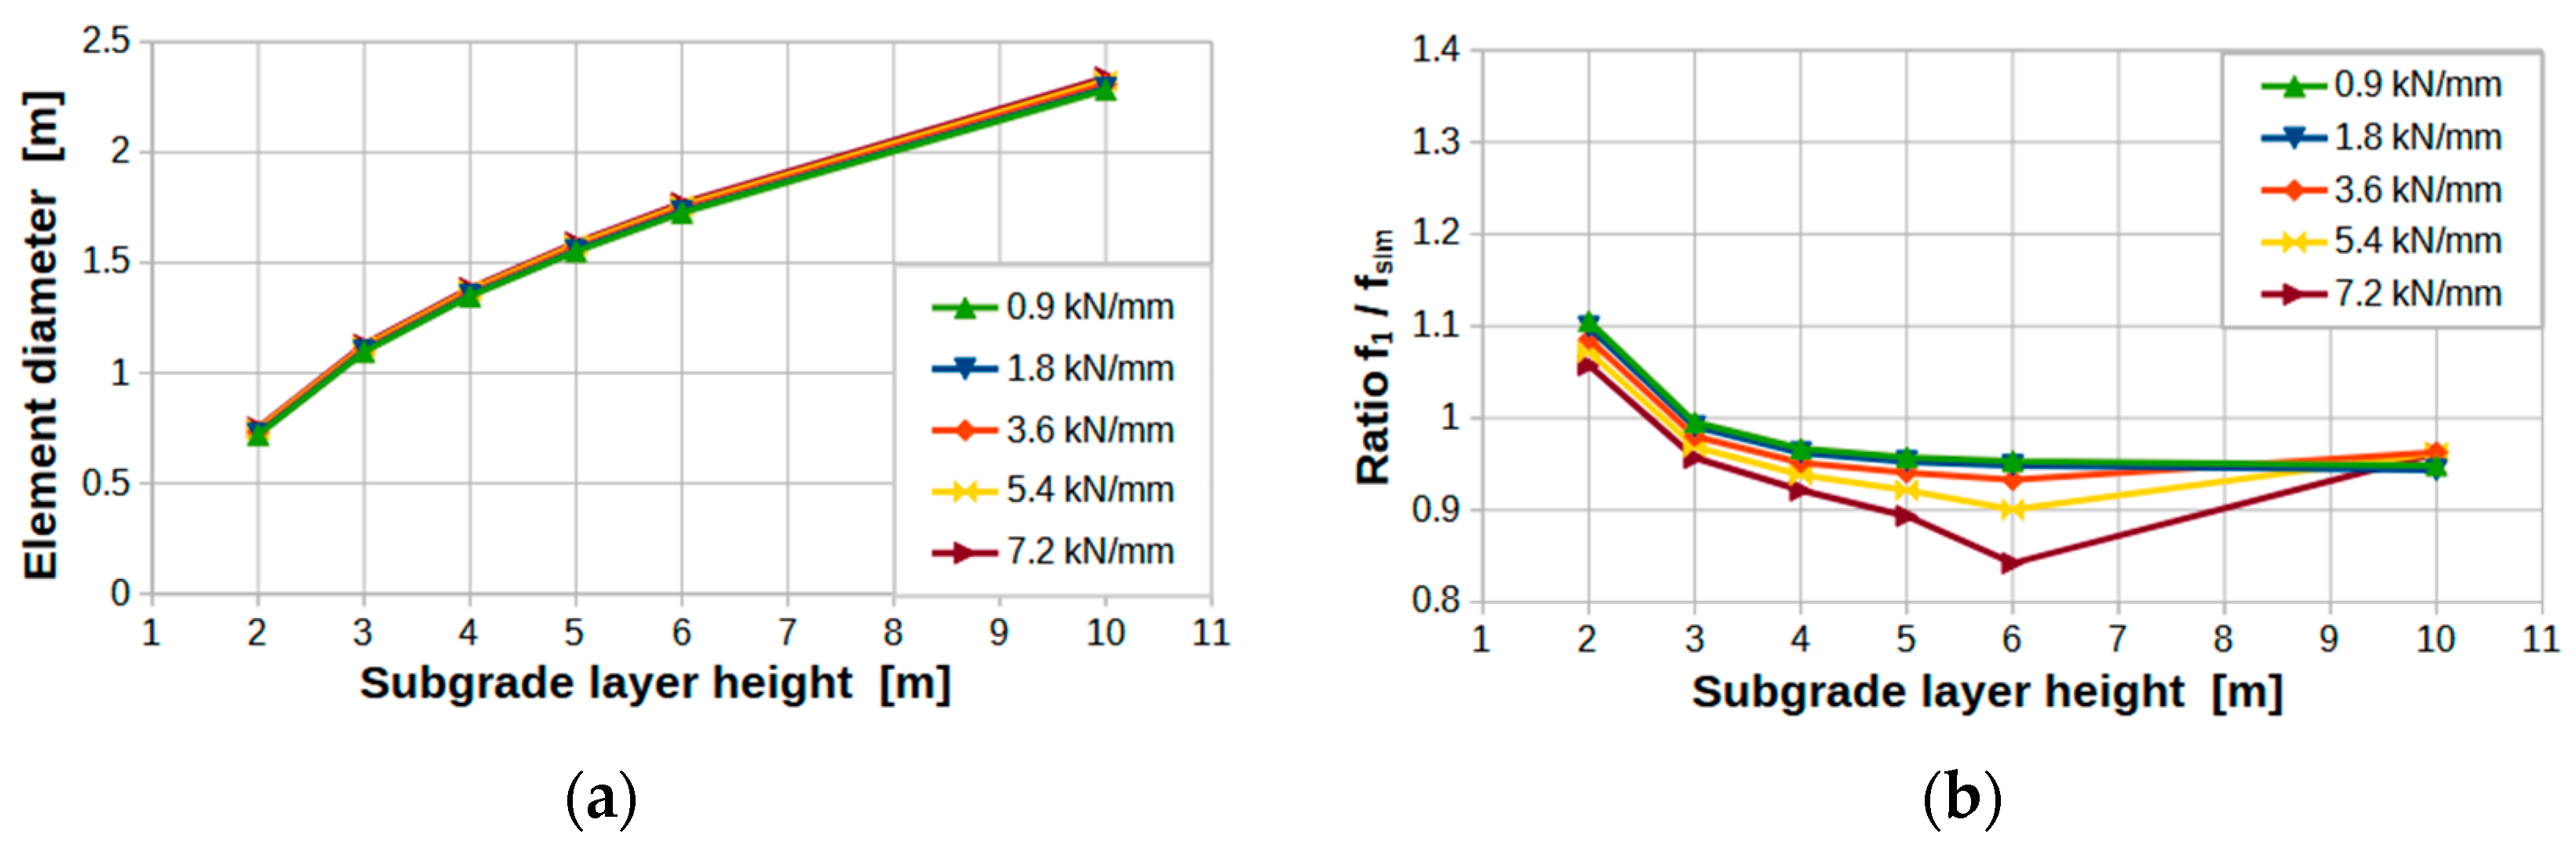
Sensitivity analysis results in relation to vehicle primary suspension stiffness (kv.s1): (a) subgrade layer height to cylindrical element diameter curves; (b) subgrade layer height to obtained frequency ratio curves.
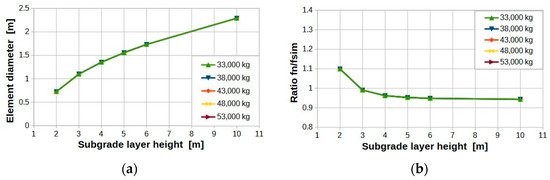
Figure 6.
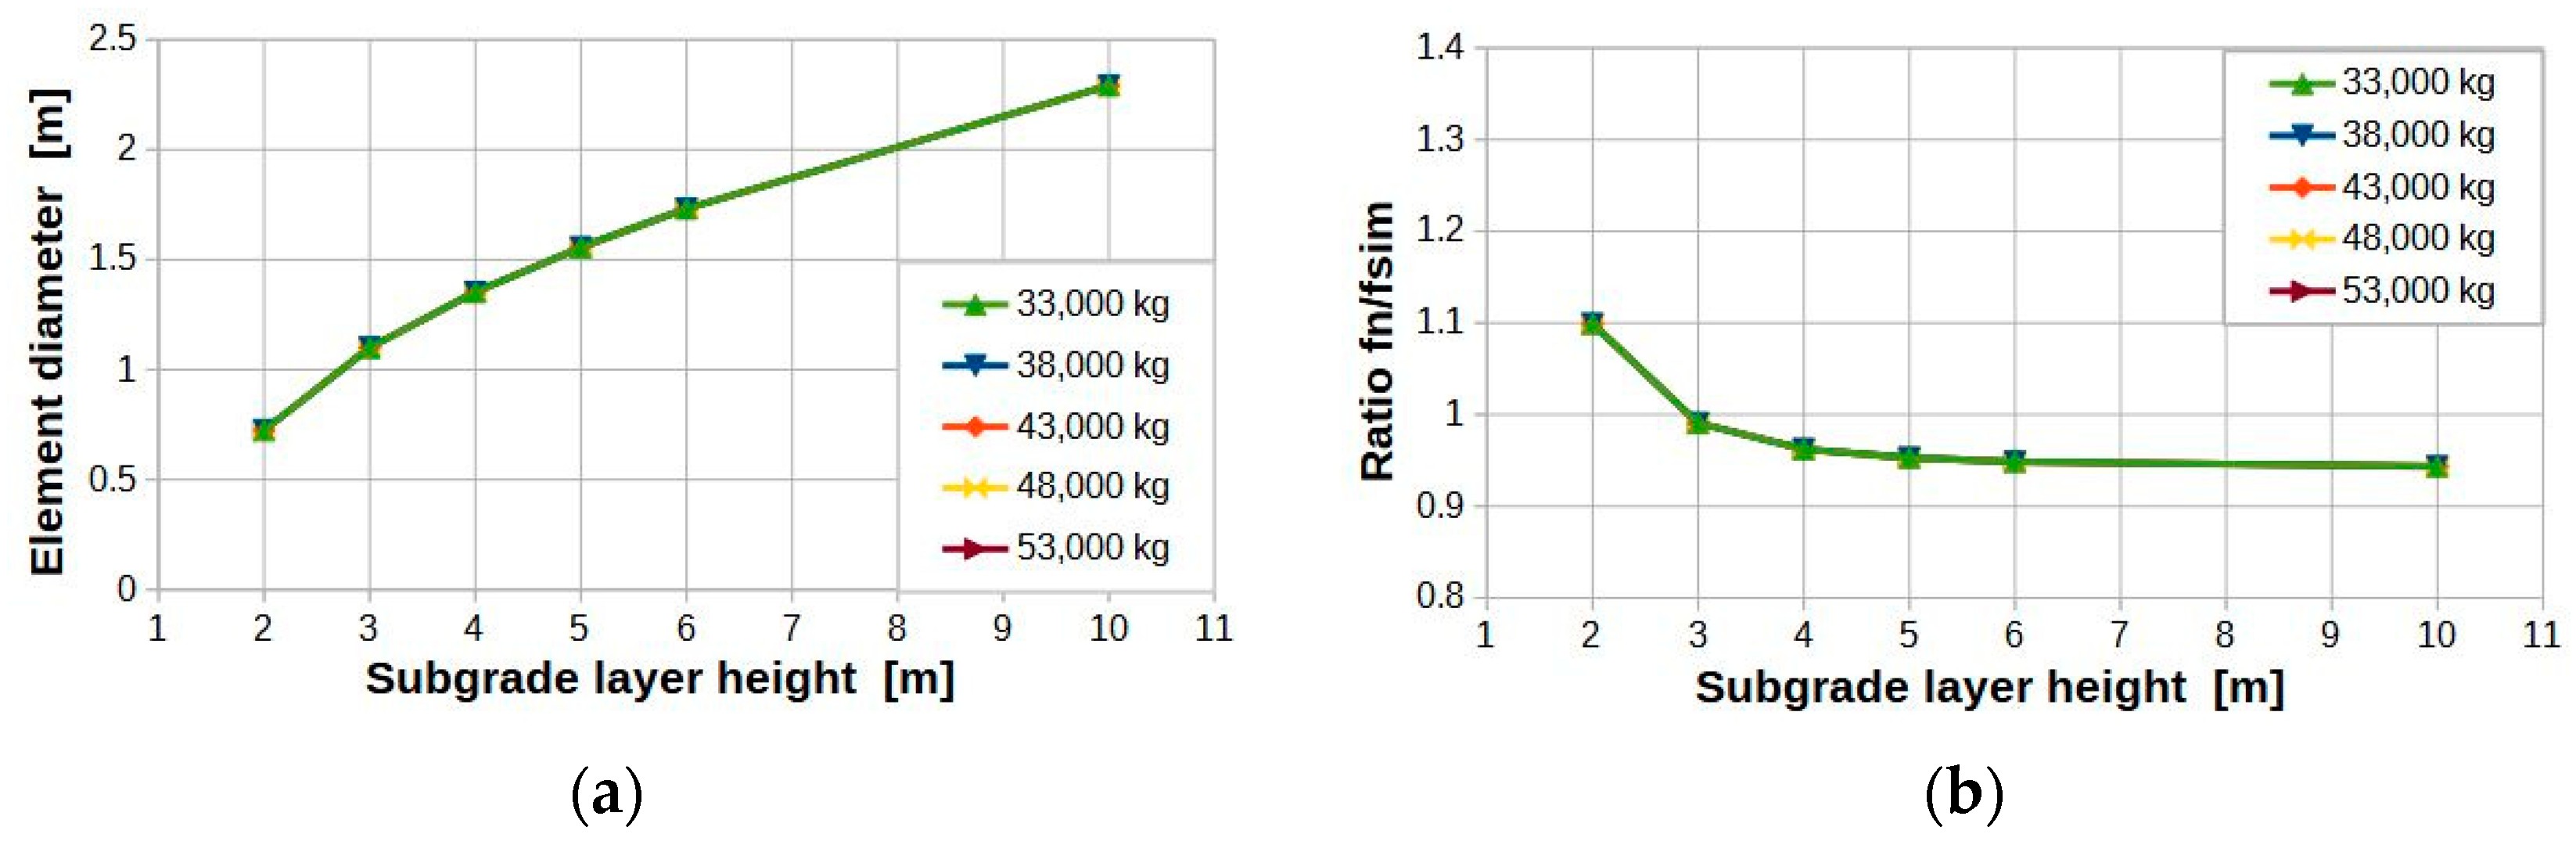
Sensitivity analysis results in relation to car body mass (mv.c): (a) subgrade layer height to cylindrical element diameter curves; (b) subgrade layer height to obtained frequency ratio curves.
Apart from a small discrepancy due to two points in Figure 5b (i.e., the two points at subgrade height of 6 m, from the brown and yellow curves), the obtained patterns from each graph type are very similar. These deviated points are the result of an unexpected dynamic interaction between the specific suspension stiffness values used, acting through a related vibration mode from the vehicle, and one vibration mode from the subgrade element (i.e., a local resonance effect due to two overlapping natural frequencies). Although some attention should be paid to these types of situations when running a modal analysis on multi-DoF systems such as this, this phenomenon does not significantly influence the validity assessment of the proposed MS, since the error margin is still manageable, and it was an isolated occurrence. This specific result is actually more relevant as a cautionary case for the validation process of the proposed TCMM, showing that local resonance phenomena could potentially interfere with the track assessment results.
The first graph type clearly shows that the relationship between the layered elements’ diameter and subgrade layer height is not significantly influenced by the tested parameters, with an almost linear behavior between these two factors. This overall result was also evident for the remaining parameters that can directly influence the combined theoretical model (Equations (1)–(7)) that are not mentioned in Table 4. The only exception is for the subgrade density (Figure 3a), where for the smaller subgrade layer heights and lower density values, there is a minor shift in the overall pattern. This happens because, for smaller subgrade element mass values, the relative importance of this element in the overall dynamic response of the multi-element mechanical system begins to change. This results in a shift in the related vibration modes [20], and in the corresponding resonance frequencies. This is a direct consequence of testing the proposed MS in more severe parameter configurations, where the resulting mass of the subgrade element becomes extremely small when compared with the vehicle’s mass. For the subgrade layer height of 2 m, in the green curve from Figure 3a, the subgrade layer mass was only 90.7 kg. In these severe cases, it is expected that the proposed MS will provide less adequate results, simply because the previous premise that frequency ω1 is an adequate estimate of the subgrade’s natural frequency of interest given by an MBS model is no longer as valid (i.e., the multi-element mechanical system is no longer as adequately approximated by the proposed 2-DoF model).
As for the (b) graphs, the correlation between the frequency ratio and subgrade layer height also follows a pattern that is similar for each of the presented parameters. This behavior is also shared by the remaining parameters that can directly influence the combined theoretical model. The frequency ratio tends to be higher than 1.0 for smaller subgrade layer heights, crossing the unity threshold around a subgrade layer height of 3 to 4 m, and then it is lower than 1.0 for the rest of the tested range. The steep changes in ratio value on the lower subgrade heights can also be attributed to the change in the dynamic behavior of the multi-element mechanical model that was explained before. This means that the proposed MS provides less adequate results in these conditions. However, the frequency estimation error for a subgrade layer height of 2 m is just around 10% for most of the tested parameters, which can still represent a decent estimate for many applications. The dispersion of the presented curves, which are also mainly concentrated in the lower subgrade layer height range, is also a consequence of the changes in the dynamic behavior of the multi-element mechanical system. These behavioral changes are naturally more influenced by the modal parameters that are directly related with the subgrade element (i.e., subgrade mass and stiffness) or the vibration mode of interest from the infrastructure (i.e., primary suspension stiffness).
Despite the behavior seen previously under severe conditions, for higher layer heights, there is an apparent trend for the frequency ratio to converge for a value at around 0.95. Thus, excluding the lower subgrade height cases, this MS can create an MBS model that is able to provide a very stable and adequate estimate of the first natural frequency of the upmost subgrade layer in a wide range of model parameterizations. The minor differences between the calculated and simulated frequency values were expected, since the proposed MS stands on an inherent approximation of a complex mechanical system (i.e., the railway infrastructure and a railway vehicle) given by a relatively simple 2-DoF lumped-elements model (SM-Lumped). It is possible that improvements in the quality of these results could be made by using a more refined theoretical model that further discretizes the vehicle–track system (e.g., separates the infrastructure into separate element layers). However, the proposed MS fulfils the intended goal of representing a robust solution that can provide realistically adequate values for the vertical resonance frequency of the underlying soil layer of railway infrastructure from an MBS model in a wide range of situations, while still being a relatively simple tool to implement.
Finally, the car body mass (mv.c) case was presented here just to showcase that this parameter has no influence on either the layered elements’ diameter, or on the frequency ratio. This does not prove the previous premise from Section 2.1, that the presence of the vehicle does not influence the natural frequencies of the soil layers beneath a railway track. It just demonstrates that this MS observes this important aspect.
From the obtained results, we see that the proposed MS performed adequately for the intended goal. It can provide the desired solution for the geometry of the layered components of a railway infrastructure to be modeled in an MBS software. This was adequately achieved by selecting a cylindrical shape for these layered elements and devising a theoretical model that could establish the relationship between these elements’ heights and diameters, so that the resulting scenarios could be used to perform realistic accurate modal analyses on these elements. While the validation of the MS presented here was solely based on simulated data, and not validated against any experimental data due to the difficulty of obtaining them, its theoretical validity is supported by the fact that every single one of its individual sub-models have already been thoroughly validated in their respective contexts as presented in Section 2. Further development efforts in this study will regard the prospect of validating this concept with experimental data, obtained through a dedicated field campaign.
The concept described here represents a potentially relevant advancement in the relatively specific and unexplored topic of modeling soil layers as independent lumped elements using an MBS software. While in the present application, this was used to enable modal analysis on these specific elements, it could also represent the means to enable other types of research. An example of a possible application could be data generation for training Machine Learning algorithms to be employed on track condition-monitoring tools.
4. Conclusions
A new MS was developed to fulfil the specific need of an MBS model that could provide realistic results when performing modal analysis on a railway infrastructure that includes a subgrade layer. This MS represents a valuable tool required for the validation of a new TCMM, which is based on monitoring resonance frequencies from the railway subgrade layer, and from these infer information on overall track support conditions.
This paper presents a thorough description of the proposed MS, including the steps that lead to the final combined theoretical model that supports it. This is followed by a description of a Simpack® model that was used to assess and validate this concept. The validation process was performed by performing a sensitivity analysis on the relevant parameters that can influence the combined theoretical model. The obtained results demonstrate the robustness of the MS in providing adequate results in a wide range of situations.
Author Contributions
Conceptualization, J.M. (João Morais); methodology, J.M. (João Morais); writing—original draft, J.M. (João Morais); writing—review and editing, E.F., D.R. and J.M. (Joaquim Mendes). All authors have read and agreed to the published version of the manuscript.
Funding
This work received financial support through a doctoral fellowship, funded by Fundação para a Ciência e a Tecnologia [2021.08011.BD]. This work was conducted in the framework of the TC202 Transportation Geotechnics national committee of the Portuguese Geotechnical Society (SPG), in association with the International Society for Soil Mechanics and Geotechnical Engineering (ISSMGE). The third author acknowledges the financial support from the Base Funding UIDB/04708/2020 and Programmatic Funding UIDP/04708/2020 of the CONSTRUCT—Instituto de I&D em Estruturas e Construções, funded by national funds through the FCT/MCTES (PIDDAC). The fourth author appreciates the financial support from UIDB/50022/2020 and UIDP/50022/2020, funded by national funds through the FCT/MCTES (PIDDAC). This work is a result of Agenda “PRODUCING RAILWAY ROLLING STOCK IN PORTUGAL”, nr. C645644454-00000065, investment project nr. 55, financed by the Recovery and Resilience Plan (PRR) and by European Union—NextGeneration EU.
Data Availability Statement
Data is contained within the article.
Conflicts of Interest
The authors declare no conflicts of interest. The funders had no role in the design of the study; in the collection, analyses, or interpretation of data; in the writing of the manuscript; or in the decision to publish the results.
References
- Azimi, M.; Eslamlou, A.; Pekcan, G. Data-Driven Structural Health Monitoring and Damage Detection through Deep Learning: State-of-the-Art Review. Sensors 2020, 20, 2778. [Google Scholar] [CrossRef] [PubMed]
- Avci, O.; Abdeljaber, O.; Kiranyaz, S.; Hussein, M.; Gabbouj, M.; Inman, D.J. A review of vibration-based damage detection in civil structures: From traditional methods to Machine Learning and Deep Learning applications. Mech. Syst. Signal Process. 2021, 147, 107077. [Google Scholar] [CrossRef]
- INNOTRACK. Methods of Track Stiffness Measurements. Thematic Priority 6: Sustainable Development, Global Change and Ecosystems Project No. TIP5-CT-2006-031415O, Co-Funded by the European Commission within the Sixth Framework Programme (2002–2006). 2008. Available online: https://insitutek.com/documents/methods-of-track-stiffness-measurements-innotrack-guideline-project-no-tip5-ct-2006-031415-pdf/ (accessed on 3 March 2019).
- Wang, P.; Wang, L.; Chen, R.; Xu, J.; Xu, J.; Gao, M. Overview and outlook on railway track stiffness measurement. J. Mod. Transp. 2016, 24, 89–102. [Google Scholar] [CrossRef]
- Sousa, E.; Bragança, C.; Meixedo, A.; Ribeiro, D.; Bittencourt, T.N.; Carvalho, H. Drive-by Methodologies Applied to Railway Infrastructure Subsystems: A Literature Review—Part I: Bridges and Viaducts. Appl. Sci. 2023, 13, 6940. [Google Scholar] [CrossRef]
- Kong, X.; Cai, C.S. The State-of-the-Art on Framework of Vibration-Based Structural Damage Identification for Decision Making. Appl. Sci. 2017, 7, 497. [Google Scholar] [CrossRef]
- Berggren, E. Railway Track Stiffness—Dynamic Measurements and Evaluation for Efficient Maintenance. Ph.D. Dissertation, KTH Royal Institute of Technology, Stockholm, Sweden, 2009. [Google Scholar]
- Fernández-Bobadilla, H.; Martin, U. Modern Tendencies in Vehicle-based Condition Monitoring of the Railway Track. IEEE Trans. Instrum. Meas. 2023, 72, 3507344. [Google Scholar] [CrossRef]
- Lamprea-Pineda, A.; Connolly, D.; Castanheira-Pinto, A.; Alves-Costa, P.; Hussein, M.F.; Woodward, P.K. On railway track receptance. Soil Dyn. Earthq. Eng. 2024, 177, 108331. [Google Scholar] [CrossRef]
- Zhai, W. Vehicle–Track Coupled Dynamics. Theory and Applications; Springer: Singapore, 2020. [Google Scholar] [CrossRef]
- Auersch, L. The excitation of ground vibration by rail traffic: Theory of vehicle–track–soil interaction and measurements on high-speed lines. J. Sound Vib. 2005, 284, 103–132. [Google Scholar] [CrossRef]
- Kouroussis, G.; Conti, C.; Verlinden, O. Investigating the influence of soil properties on railway traffic vibration using a numerical model. Veh. Syst. Dyn. 2012, 51, 421–442. [Google Scholar] [CrossRef]
- Shi, C.; Zhou, Y.; Xu, L.; Zhang, X.; Guo, Y. A critical review on the vertical stiffness irregularity of railway ballasted track. Constr. Build. Mater. 2023, 400, 132715. [Google Scholar] [CrossRef]
- Lesgidis, N.; Sextos, A.; Moschen, L.; Gomez, J.S.G.; Pistone, E. Rigorous vehicle-soil-track simulation of high-speed rail through optimization-based model order reduction. Transp. Geotech. 2020, 23, 100350. [Google Scholar] [CrossRef]
- Shang, Y.; Nogal, M.; Wang, H.; Wolfert, A.R.M. Systems thinking approach for improving maintenance management of discrete rail assets: A review and future perspectives. Struct. Infrastruct. E 2021, 19, 197–215. [Google Scholar] [CrossRef]
- Morais, J.; Morais, P.; Santos, C.; Paixão, A.; Fortunato, E. Railway track support condition assessment—Initial developments on a vehicle-based monitoring solution through modal analysis. Proc. Inst. Mech. Eng. Part F J. Rail Rapid Transit. 2021, 236, 9. [Google Scholar] [CrossRef]
- Morais, J.; Fortunato, E.; Ribeiro, D.; Calçada, R.; Mendes, J. Railway track support condition assessment—Methodology validation using numerical simulations. Eng. Fail. Anal. 2023, 152, 107483. [Google Scholar] [CrossRef]
- Doebling, S.; Farrar, C.; Prime, M. A Summary Review of Vibration-Based Damage Identification Methods. Shock Vib. Dig. 1998, 30, 91–105. [Google Scholar] [CrossRef]
- Esveld, C. Modern Railway Track; MRT-Productions: Zaltbommel, The Netherlands, 2001; ISBN 90-800324-3-3. [Google Scholar]
- Maia, N.; Silva, J. Theoretical and Experimental Modal Analysis; Research Studies Press: Letchworth, UK, 1997; ISBN 0863802087. [Google Scholar]
- Selig, E.; Waters, J. Track Technology and Substructure Management; Thomas Telford Productions: Telford, UK, 1994; ISBN 0-7277-2013-9. [Google Scholar]
- Wolf, J.; Somaini, D. Approximate Dynamic Model of Embedded Foundation in Time Domain. Earthq. Eng. Struct. Dyn. 1986, 14, 683–703. [Google Scholar] [CrossRef]
- Milne, D.; Harkness, J.; Le Pen, L.; Powrie, W. The influence of variation in track level and support system stiffness over longer lengths of track for track performance and vehicle track interaction. Veh. Syst. Dyn. 2019, 59, 245–268. [Google Scholar] [CrossRef]
Disclaimer/Publisher’s Note: The statements, opinions and data contained in all publications are solely those of the individual author(s) and contributor(s) and not of MDPI and/or the editor(s). MDPI and/or the editor(s) disclaim responsibility for any injury to people or property resulting from any ideas, methods, instructions or products referred to in the content. |
© 2024 by the authors. Licensee MDPI, Basel, Switzerland. This article is an open access article distributed under the terms and conditions of the Creative Commons Attribution (CC BY) license (https://creativecommons.org/licenses/by/4.0/).