Article

Excavation Method Comparison and Optimization for a Super Large Cross-Section Tunnel

1
School of Civil Engineering and Architecture, East China Jiaotong University, Nanchang 310013, China
2
School of Civil Engineering, Central South University of Forestry and Technology, Changsha 410004, China
*
Author to whom correspondence should be addressed.
Appl. Sci. 2024, 14(15), 6544; https://doi.org/10.3390/app14156544
Submission received: 23 June 2024 / Revised: 22 July 2024 / Accepted: 24 July 2024 / Published: 26 July 2024
(This article belongs to the Section Civil Engineering)

Abstract

:
Characterized by long spans, low aspect ratios, and intricate construction sequences, super-large cross-section tunnels present substantial construction risks. Therefore, the selection of the optimal excavation method and construction sequence is crucial for ensuring the safety of tunnel construction and minimizing project costs. This paper takes a super large transverse-section highway tunnel as a case study, employing field monitoring data combined with ABAQUS software to analyze the stress and deformation of surrounding rock and support structures under different excavation methods. The findings reveal that the deformation of surrounding rock and support structures excavated by the Double-Side Drift Method is smaller than those caused by the three-benching seven-step method and the CRD excavation method. Nevertheless, the significant stresses of surrounding rock and support structures are released by the Double-Side Drift Method, leading to potential stress concentrations. Thus, it is necessary to ensure the rapid completion of early support and quick sealing of the tunnel. Furthermore, the sixth process achieves smaller deformation (including arch displacement and surface settlement) of the tunnel, a shorter construction period, and lower economic costs when compared to other construction processes. Consequently, it can obviously be concluded that both the Double-Side Drift Method and the sixth construction process stand out as the most appropriate choices for excavating super large cross-section tunnels. The insights obtained from this study provide theoretical guidance for the design and construction of similar tunnel projects.

1. Introduction

The expansion of China’s urban rail transit has accelerated dramatically since the 21st century, driven by the constraints of limited surface space and the urgent need to develop underground transportation networks. Amidst China’s rapid economic growth, the transportation sector is concurrently transitioning into a phase of high-quality development. To mitigate urban traffic congestion and enhance highway traffic flow and safety, more and more highway tunnels with large cross-sections are increasingly being constructed [1,2,3,4]. However, the distinctive cross-sectional shapes of these tunnels present numerous challenges, including low flatness of the tunnel structure, complex geological conditions, and significant deformation of the surrounding rock near tunnel portals, all of which considerably complicate the construction process [5,6,7,8]. Furthermore, constructing highway tunnels with super-large cross-sections in difficult geological conditions highlights the marked lack of pertinent theories and technologies. Common issues include vast excavation areas, stress concentrations in the surrounding rock, and complex construction sequences. These challenges often lead to problems such as a decrease in the load-bearing capacity of the perimeter rock and increased demands for support structures [9,10,11,12,13,14,15].
Identifying the most reasonable construction method and sequence is essential for addressing challenges and enhancing the efficiency of tunnel construction. For instance, Wu et al. [16] analyzed various excavation schemes for highway tunnels, aiming to maximize construction efficiency and tunnel stability. They refined the excavation methods and pinpointed the most effective sequences. Gong [17] developed a three-dimensional finite element model based on the Crane Tunnel Project, systematically examining the deformation patterns of the surrounding rock under various construction scenarios and assessing the mechanical impacts of these processes. Jiang et al. [18,19] explored the transient dynamics of tunnel excavation using similar modeling experiments and 3D elastic-plastic modeling, finding significant impacts of the excavation method and sequence on the release of elastic displacement during transient phases. Jia [20] utilized the CD method and step method in a numerical model for the Yankou Mountain Tunnel, monitoring the stress and plasticity in the vault to assess the effects on the stability of the surrounding rock, particularly through weak zones. Liu [21] implemented a two-dimensional elastic-plastic analysis tool, 2D-σ, and conducted comparative analyses with physical models to evaluate the influence of various excavation techniques on the construction sequence, revealing distinct stress distribution patterns at different stages of construction. Performing tunnel monitoring can facilitate real-time observation of the deformation in surrounding rock and support structures in tunnels and provide early prediction and warning when necessary, which is conducive to ensuring the safe and stable operation of tunnels. A new technology combining deep learning techniques with the finite element method was proposed by Yang et al. [22], which can automatically identify the deformation position and predict the deformation evolution of the tunnel structure. Strauss et al. [23] presented a comprehensive review of various testing methodologies, along with a meticulous classification of strategies and tools, organized according to the technologies and techniques employed for monitoring tunnels. Based on a series of shaking-table model tests of tunnel excavation, a new surrounding-rock fault-zone-lining model was established by Tang et al. [24] to analyze the dynamic responses of the tunnel, which offered practical guidance for tunnel engineering earthquake damage. An extensive review of the state of the art of the current understanding of the seismic behavior of tunnels was summarized by Tsinidis et al. [25], which presented a new physical model based on an experiment to study the kinematic and seismic performance of tunnel structures. The issue of the large deformation mechanism in tunnels has puzzled tunnel scholars for decades. Chen et al. [26] conducted detailed on-site measurements, a full investigation, and statistical analysis of the instability and failure of the Muzhailing Tunnel and found that human factors (such as jerry-build, inappropriate construction methods, unreasonable operation, construction not in accordance with the design, etc.) are the direct factors of a tunnel’s large deformation.
While numerous domestic and international scholars have conducted extensive research on various excavation methods used in road tunnels, including theoretical derivations, numerical simulations, indoor and outdoor tests, and analyses of engineering cases, there remains a significant gap in the literature concerning the selection and optimization of construction methods for super large cross-section highway tunnels. Consequently, this paper aims to address this gap by discussing the selection and optimization of construction methods for super-large cross-section highway tunnel projects, providing insights that may guide future developments in this specialized area of civil engineering.

2. Project Overview

2.1. Engineering Background

This project is conducted on the Jiangxi Xiaoyuan Tunnel, which spans a total length of 390 m. It is the first super-large transverse cross-section highway tunnel in the province and marks the initiation of four-lane tunnels in Jiangxi Province. Located in Xiaoyuan Village, Daping Township, Nankang District, Ganzhou City, the Xiaoyuan Tunnel is an essential part of the Ji’an to Nankang expansion project within the Jiangxi section of the Daguang Expressway. The tunnel starts at Jianxia Village in Zhongshi Township, Suichuan County, Ji’an City, and extends southward along the existing Daguang Expressway. The project scope includes the reconstruction of the Tang Village Interchange, crossing the G105 national highway, passing through Nihu and Qiaotou, and eventually redeveloping the original site of Daping Village to modify the Hengshi Service Area ramps. The route passes through Tianxi, Qiaozhuang, and Fenwenlou, finally connecting with the C4 section at Gaobei Village, Hengshi Town. The surrounding rocks in the area where the tunnel is located are mainly fine-grained biotite granite, and the rock mass is broken with densely developed joints and fractures. The surrounding rock grades of the tunnel body are mainly Class III and Class IV, while some parts of the structural development zone are Class V surrounding rocks. The rock mass of the tunnel body is primarily composed of fine-grained biotite granite from the first stage of the Caledonian period, with generally to moderately developed fractures. The rock mass is relatively intact, and its tunnel-forming properties are generally good, making the surrounding rock of the tunnel wall relatively stable. However, during construction, due to the impact of artificial excavation sections, new fractures and other unfavorable factors may occur in the tunnel. Additionally, this area belongs to a hilly landform type, with ridges mostly trending northeast. The engineering geological longitudinal section of the tunnel is illustrated in Figure 1.

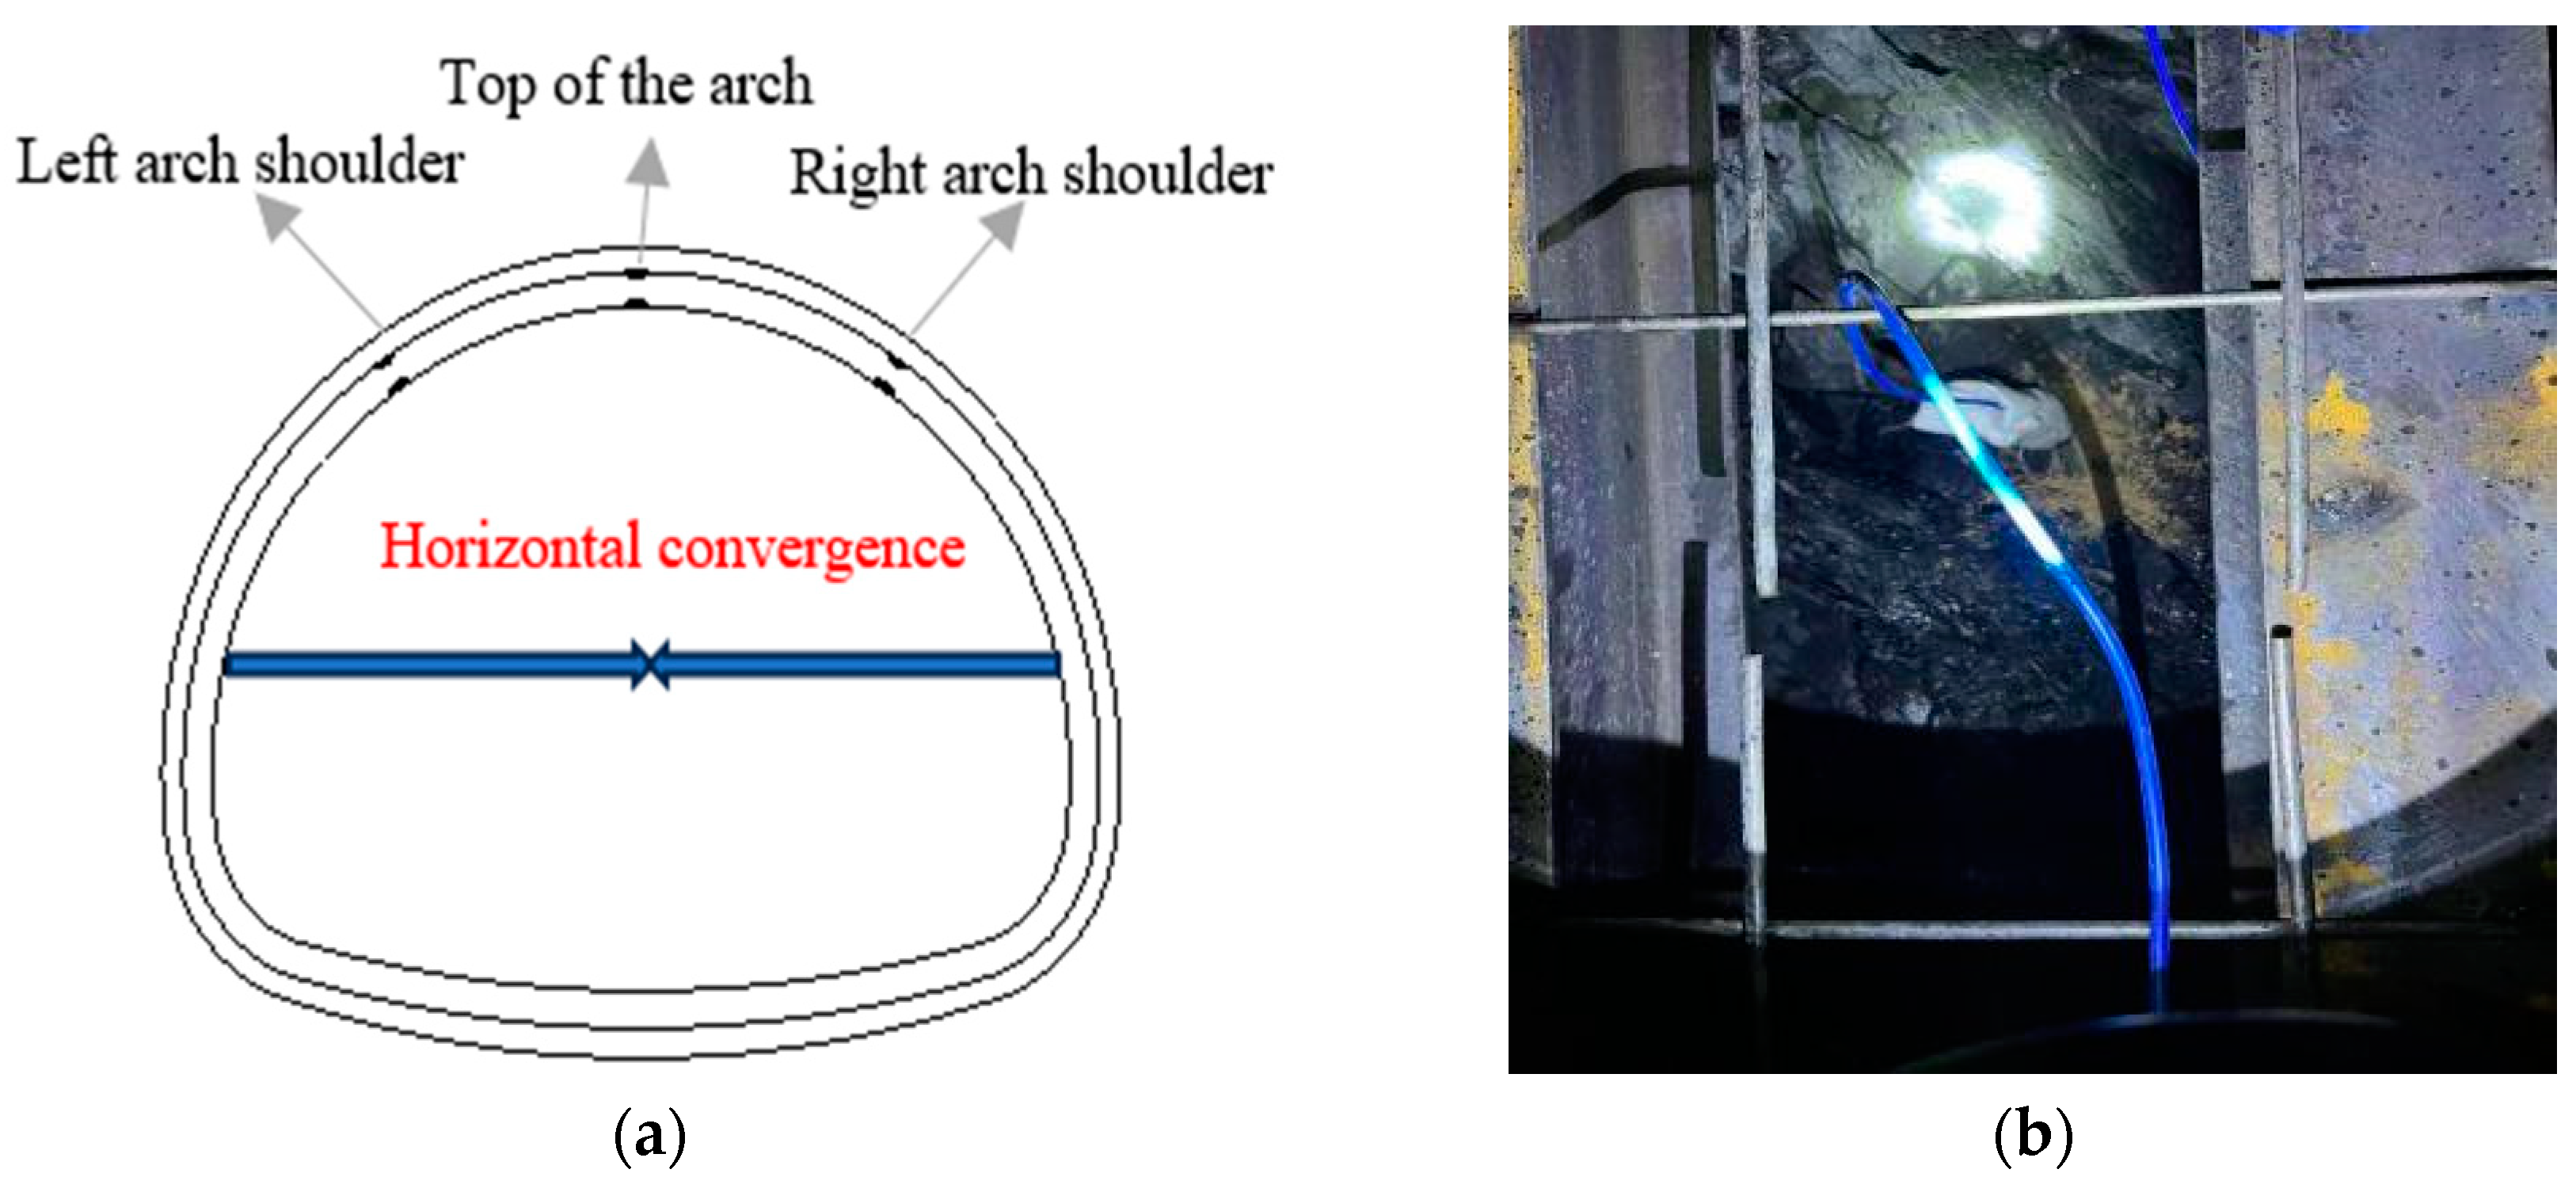
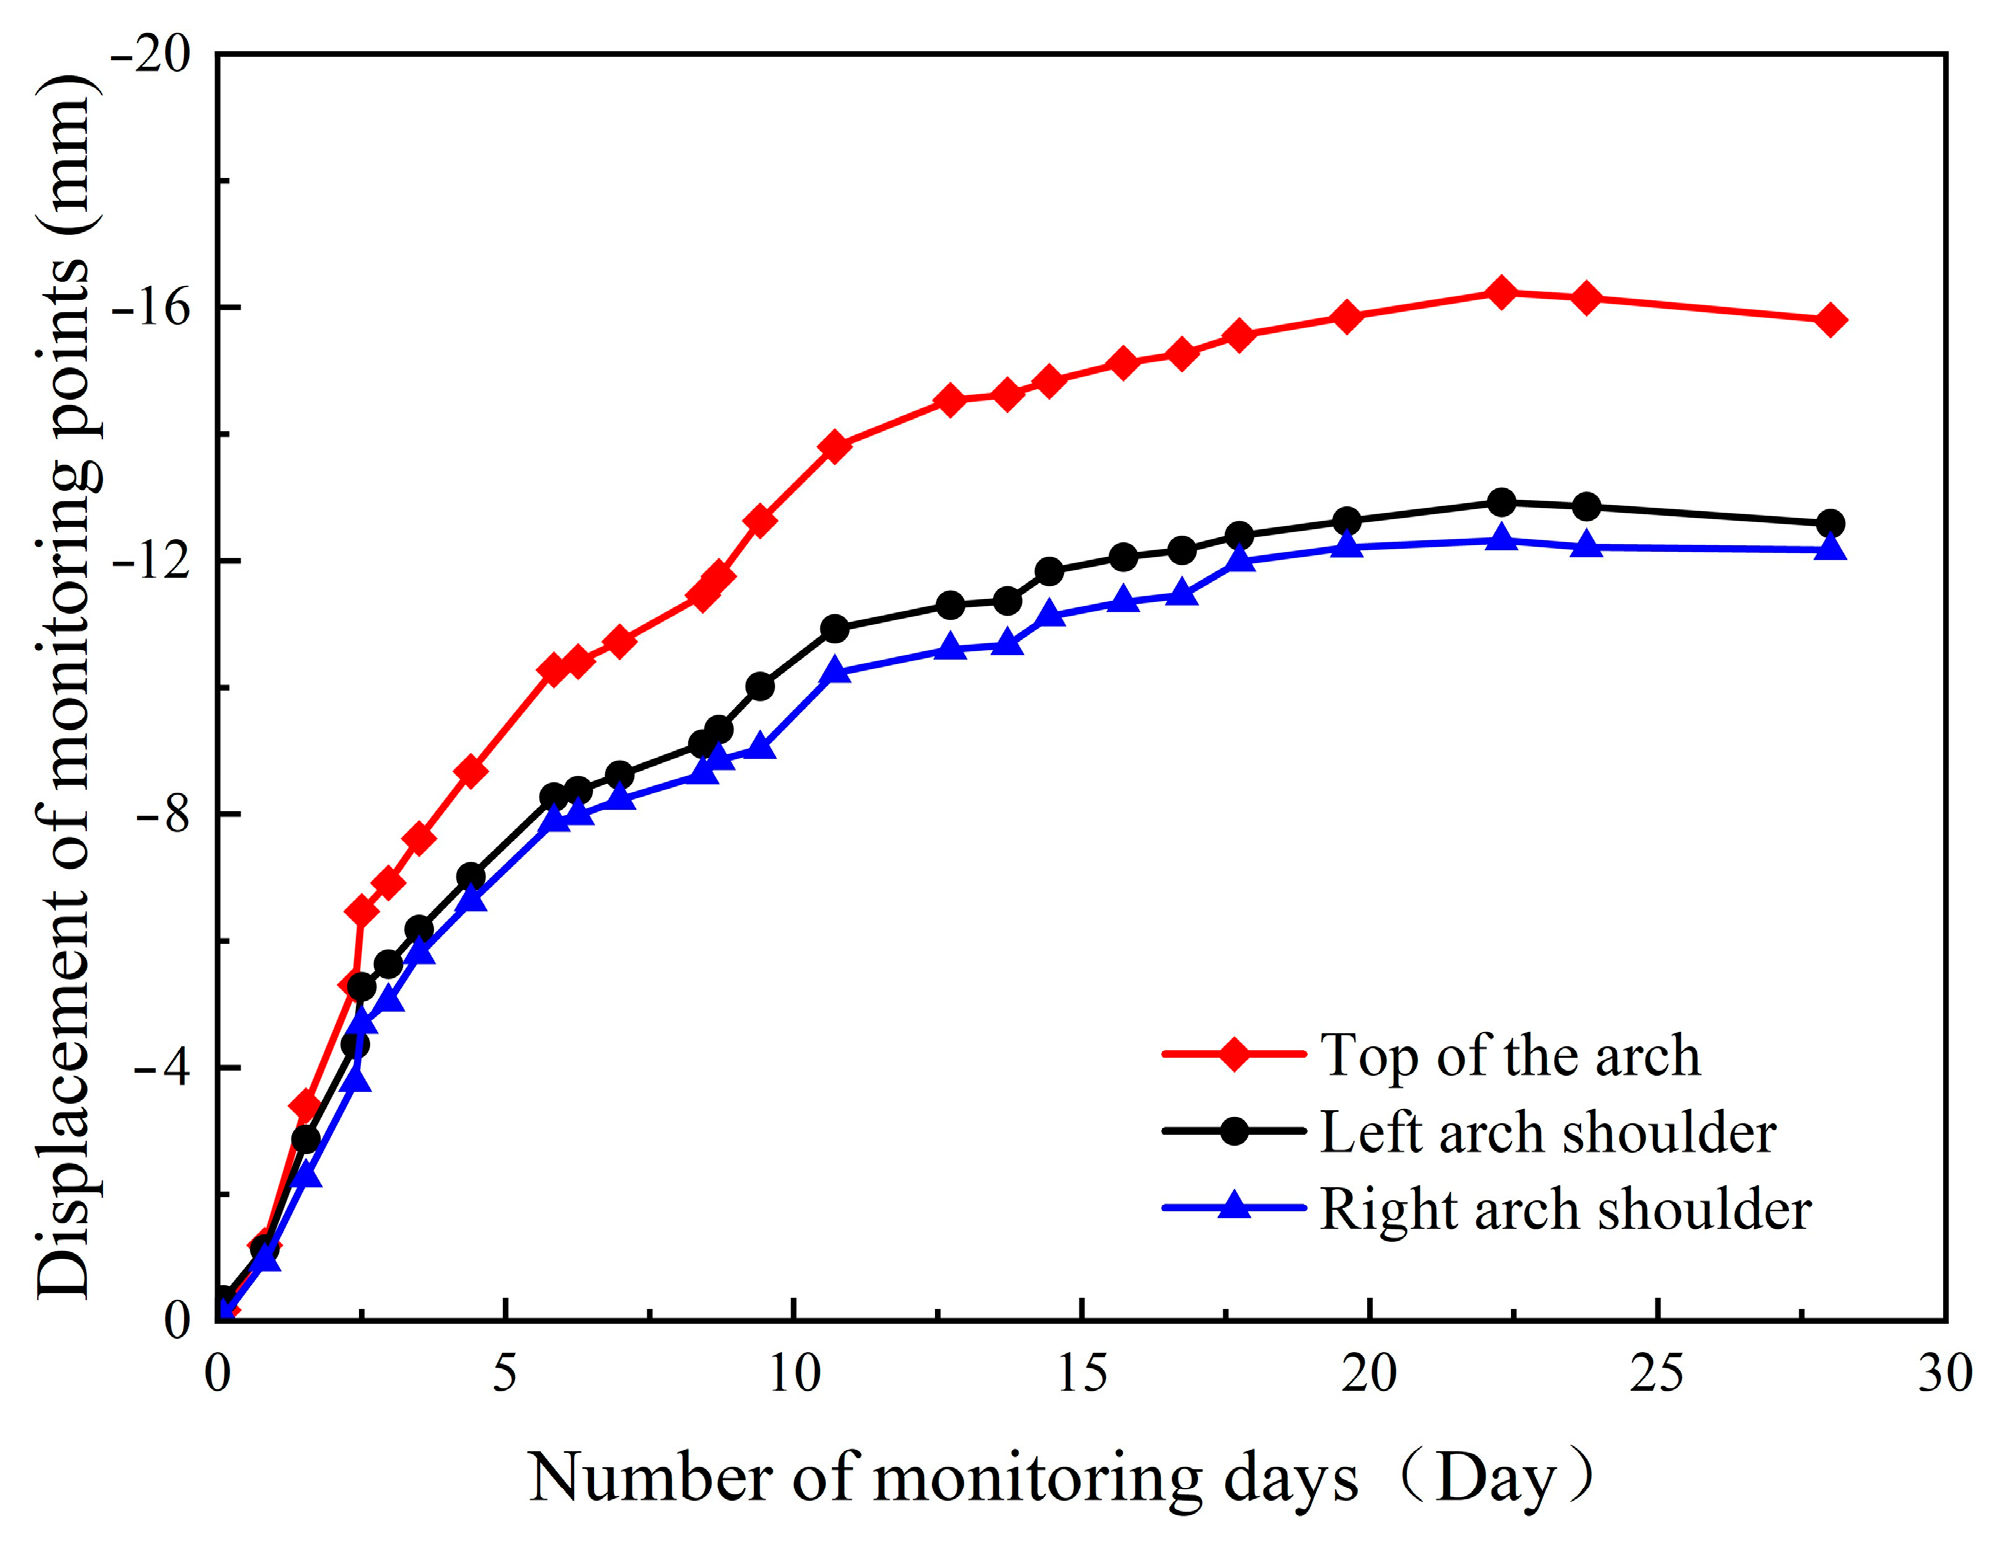
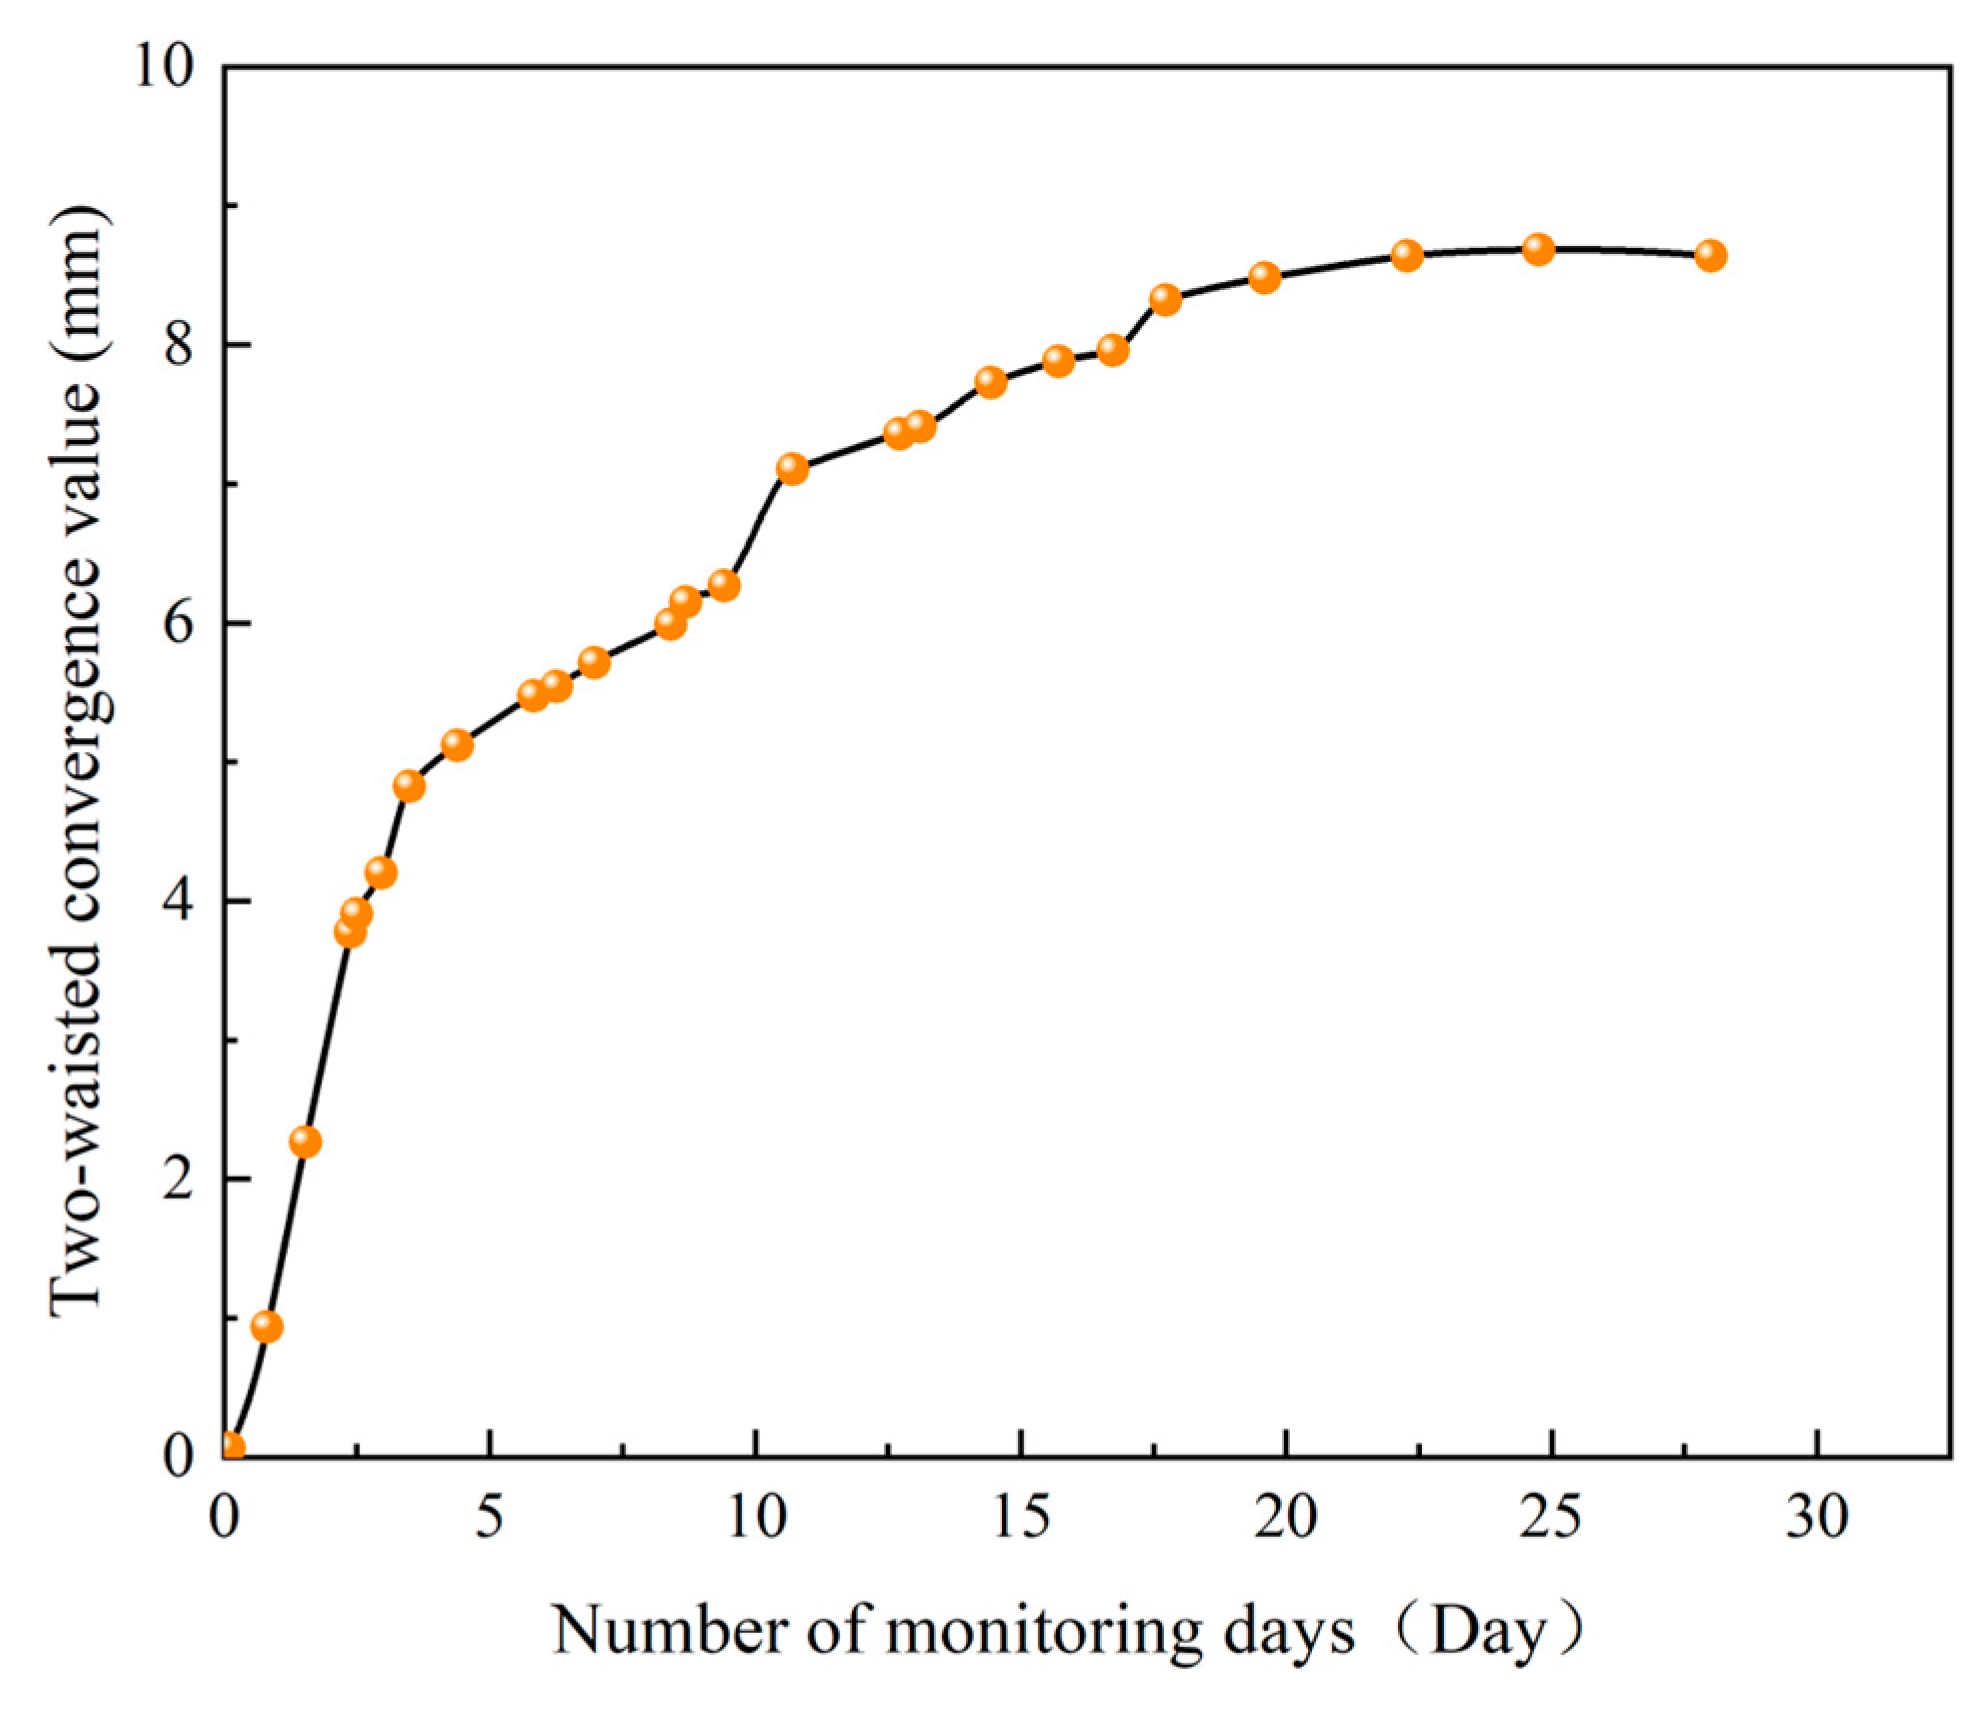
2.2. On-Site Monitoring

The Xiaoyuan Tunnel represents the first instance of a single-tunnel, four-lane, large cross-section highway tunnel in Jiangxi Province. An illustration of the tunnel construction limits and internal outlines is provided in Figure 2. The tunnel, characterized by its linear design, is situated in an area with complex geological conditions that present numerous potential and unpredictable geological hazards. Given these circumstances, it is crucial to meticulously monitor the relaxation zones and displacements of the surrounding rock, as well as to accurately assess the development of surrounding rock deformation. To this end, the deformation of the tunnel is measured by a multipoint displacement meter, which has an uncertainty of 0.5, an accuracy of ±1%FS (i.e., full scale), and a measurement range of 0~100 mm. The horizontal convergence of the surrounding rock is gauged by a laser range finder, which was positioned 4.5 m above the ground and close to the side wall of the tunnel. Moreover, each tunnel section is equipped with a laser rangefinder, and the distance between two adjacent laser rangefinders (arranged along the tunnel traffic direction or the tunnel’s longitudinal direction) is 25 m. For the material of actual tunnel construction, C25 shotcrete and C35 reinforced concrete are selected to construct the primary lining and secondary lining, respectively. The specifics of the above measurements are depicted in Figure 3.
The monitoring results for the top of the arch, along with the left and right arch shoulders, are presented in Figure 4. The data clearly demonstrate consistent settlement trends across these points. Initially, the settlement values increase rapidly but gradually slow down and eventually stabilize. Notably, the monitoring data exhibit significant variability during the initial 15 days, with settlement values beginning to stabilize from the 16th day onward. This stabilization corresponds with the excavation of the tunnel’s left guide hole on the 16th day, which exposed the tunnel’s critical surface and induced the most substantial deformation of the surrounding rock. Following the implementation of initial support measures, vault settlement reached total deformation. By the 15th day, the excavation of the right guide hole was essentially complete, and the vault displacement largely stabilized. Subsequently, the tunnel then underwent a second lining construction, which resulted in a marked decrease in displacements at all monitoring points. The maximum settlement at the top of the arch vault was recorded at 15.8 mm and eventually stabilized. The settlement at the left arch shoulder consistently exceeded that at the right, with the maximum settlement reaching 12.4 mm. Additionally, displacement monitoring was conducted at two waist monitoring points in tunnel section ZK2985+420, with the results depicted in Figure 5.
As depicted in Figure 5, the convergence change curve of the two waists exhibits a pronounced steep trend in the initial 15 days, attributed to the appearance of the critical section during the early stages of tunnel construction. As excavation progressed to the 20th day, with the near completion of the right guide hole, the convergence values at the two waist points began to stabilize. At this stage, the maximum convergence value recorded for both waist points was 8.6 mm. Hence, the convergence curve of the two waists can be comprehensively divided into three distinct stages: an initial rapid growth phase, subsequently transitioning to a deceleration phase, and finally stabilizing at a slower rate.

3. Comparison of Construction Methods

3.1. Model Building

Compared to field data, numerical simulation offers a more comprehensive and efficient basis for decision-making in selecting construction methods [15]. In this research, the finite difference software ABAQUS 6.14 is utilized for numerical simulations. The perimeter rock section ZK2985+420 of the Xiaoyuan Tunnel is selected as the simulation object, treated as a continuous, isotropic, ideal elastic-plastic medium, disregarding the fractured and layered conditions of the rock body. Adhering to Saint-Venant’s principle to minimize the influence of model boundaries on the results, the left and right boundaries of the model are set at a distance more than three times that of the tunnel’s excavation span. To better represent ground stress distribution, the vertical and horizontal orientations of the model are aligned with the z-axis and x-axis, respectively. In this paper, the three-dimensional numerical model adopts hexahedral element shapes for meshing. The existence of groundwater has been omitted from the modeling process. The constitutive model selected is the Mohr–Coulomb constitutive model. The surrounding rock and support structure are simulated by selecting the C3D8R solid element and the C3D8 solid element, respectively. The model boundary employs displacement boundary conditions (with x-direction (along the tunnel traffic direction) constraints applied on the left and right sides and y-direction constraints applied on the front and back sides). The top surface of the model is an unconstrained free surface while the bottom surface of the model is fully constrained. The soil was in a normal consolidation state before excavation. The 3D mesh distribution of the model is depicted in Figure 6. The dimensions of the tunnel model area are set at 120 m horizontally, 120 m vertically, and 20 m along the y-axis in the direction of the tunnel, with 70 m on the shallow buried side and 50 m on the left and right sides.

3.2. Model Validation

In this paper, the Mohr–Coulomb model is selected as the constitutive model during the numerical simulation. To prove the validity of the model, the numerical model of the present work was first compared with two case studies [27,28] on surface settlement, as shown in Figure 7a. The numerical results are basically consistent with the case studies. Then, the numerical result was compared with the field monitoring results as illustrated in Figure 7b. The construction of a support structure during numerical simulation is instantaneous while the construction of a support structure in practical engineering is relatively delayed. Therefore, the measured displacement is greater than the simulated displacement. To further prove the validity and efficiency of the model, we make another comparison with two case studies [3,29] on the vertical displacement of tunnel arch, as shown in Figure 7c. Although there is little difference among the curves, the trend of curves in Figure 7 is basically the same, which also proves the correctness of the numerical model.

3.3. Material Properties

The value of surrounding rock and soil parameters is usually determined based on the engineering conditions and geological environment and should be measured through field tests or laboratory tests when necessary. Since the ZK2985+420 tunnel section chosen as the simulation object of this study is located in a Grade III surrounding rock zone according to the actual engineering report, the material parameters in the numerical model in this paper are mainly selected based on the soil parameters corresponding to the Grade III surrounding rock. In the computational model, the parameters for Grade III perimeter soil from the actual project are employed, and the Mohr–Coulomb failure criterion is utilized as the principal model. The parameters within the model are carefully chosen to reflect the stresses experienced during actual tunnel construction. These soil parameters are dictated by the prevailing geological conditions. The specific parameters used in the model are detailed in Table 1.
Given the complexity of modeling the reinforcing cage in both the primary and secondary linings of the tunnel, simplifications are essential in the modeling process. Specifically, the concrete and reinforcing bars in the primary lining are consolidated into a single entity, and the 16 I-beams used in the initial support are integrated into the primary support concrete using the “equivalent stiffness method”. This method adjusts the modulus of elasticity of the initial support, which is converted as shown in Equation (1):
E = E g A g + E c A c A g + A c
where E is the modulus of elasticity of the concrete profile layer; Eg is the modulus of elasticity of the steel arch; Ec is the modulus of elasticity of the initial concrete; Ag is the cross-sectional area of the steel arch; and Ac is the cross-sectional area of the concrete.

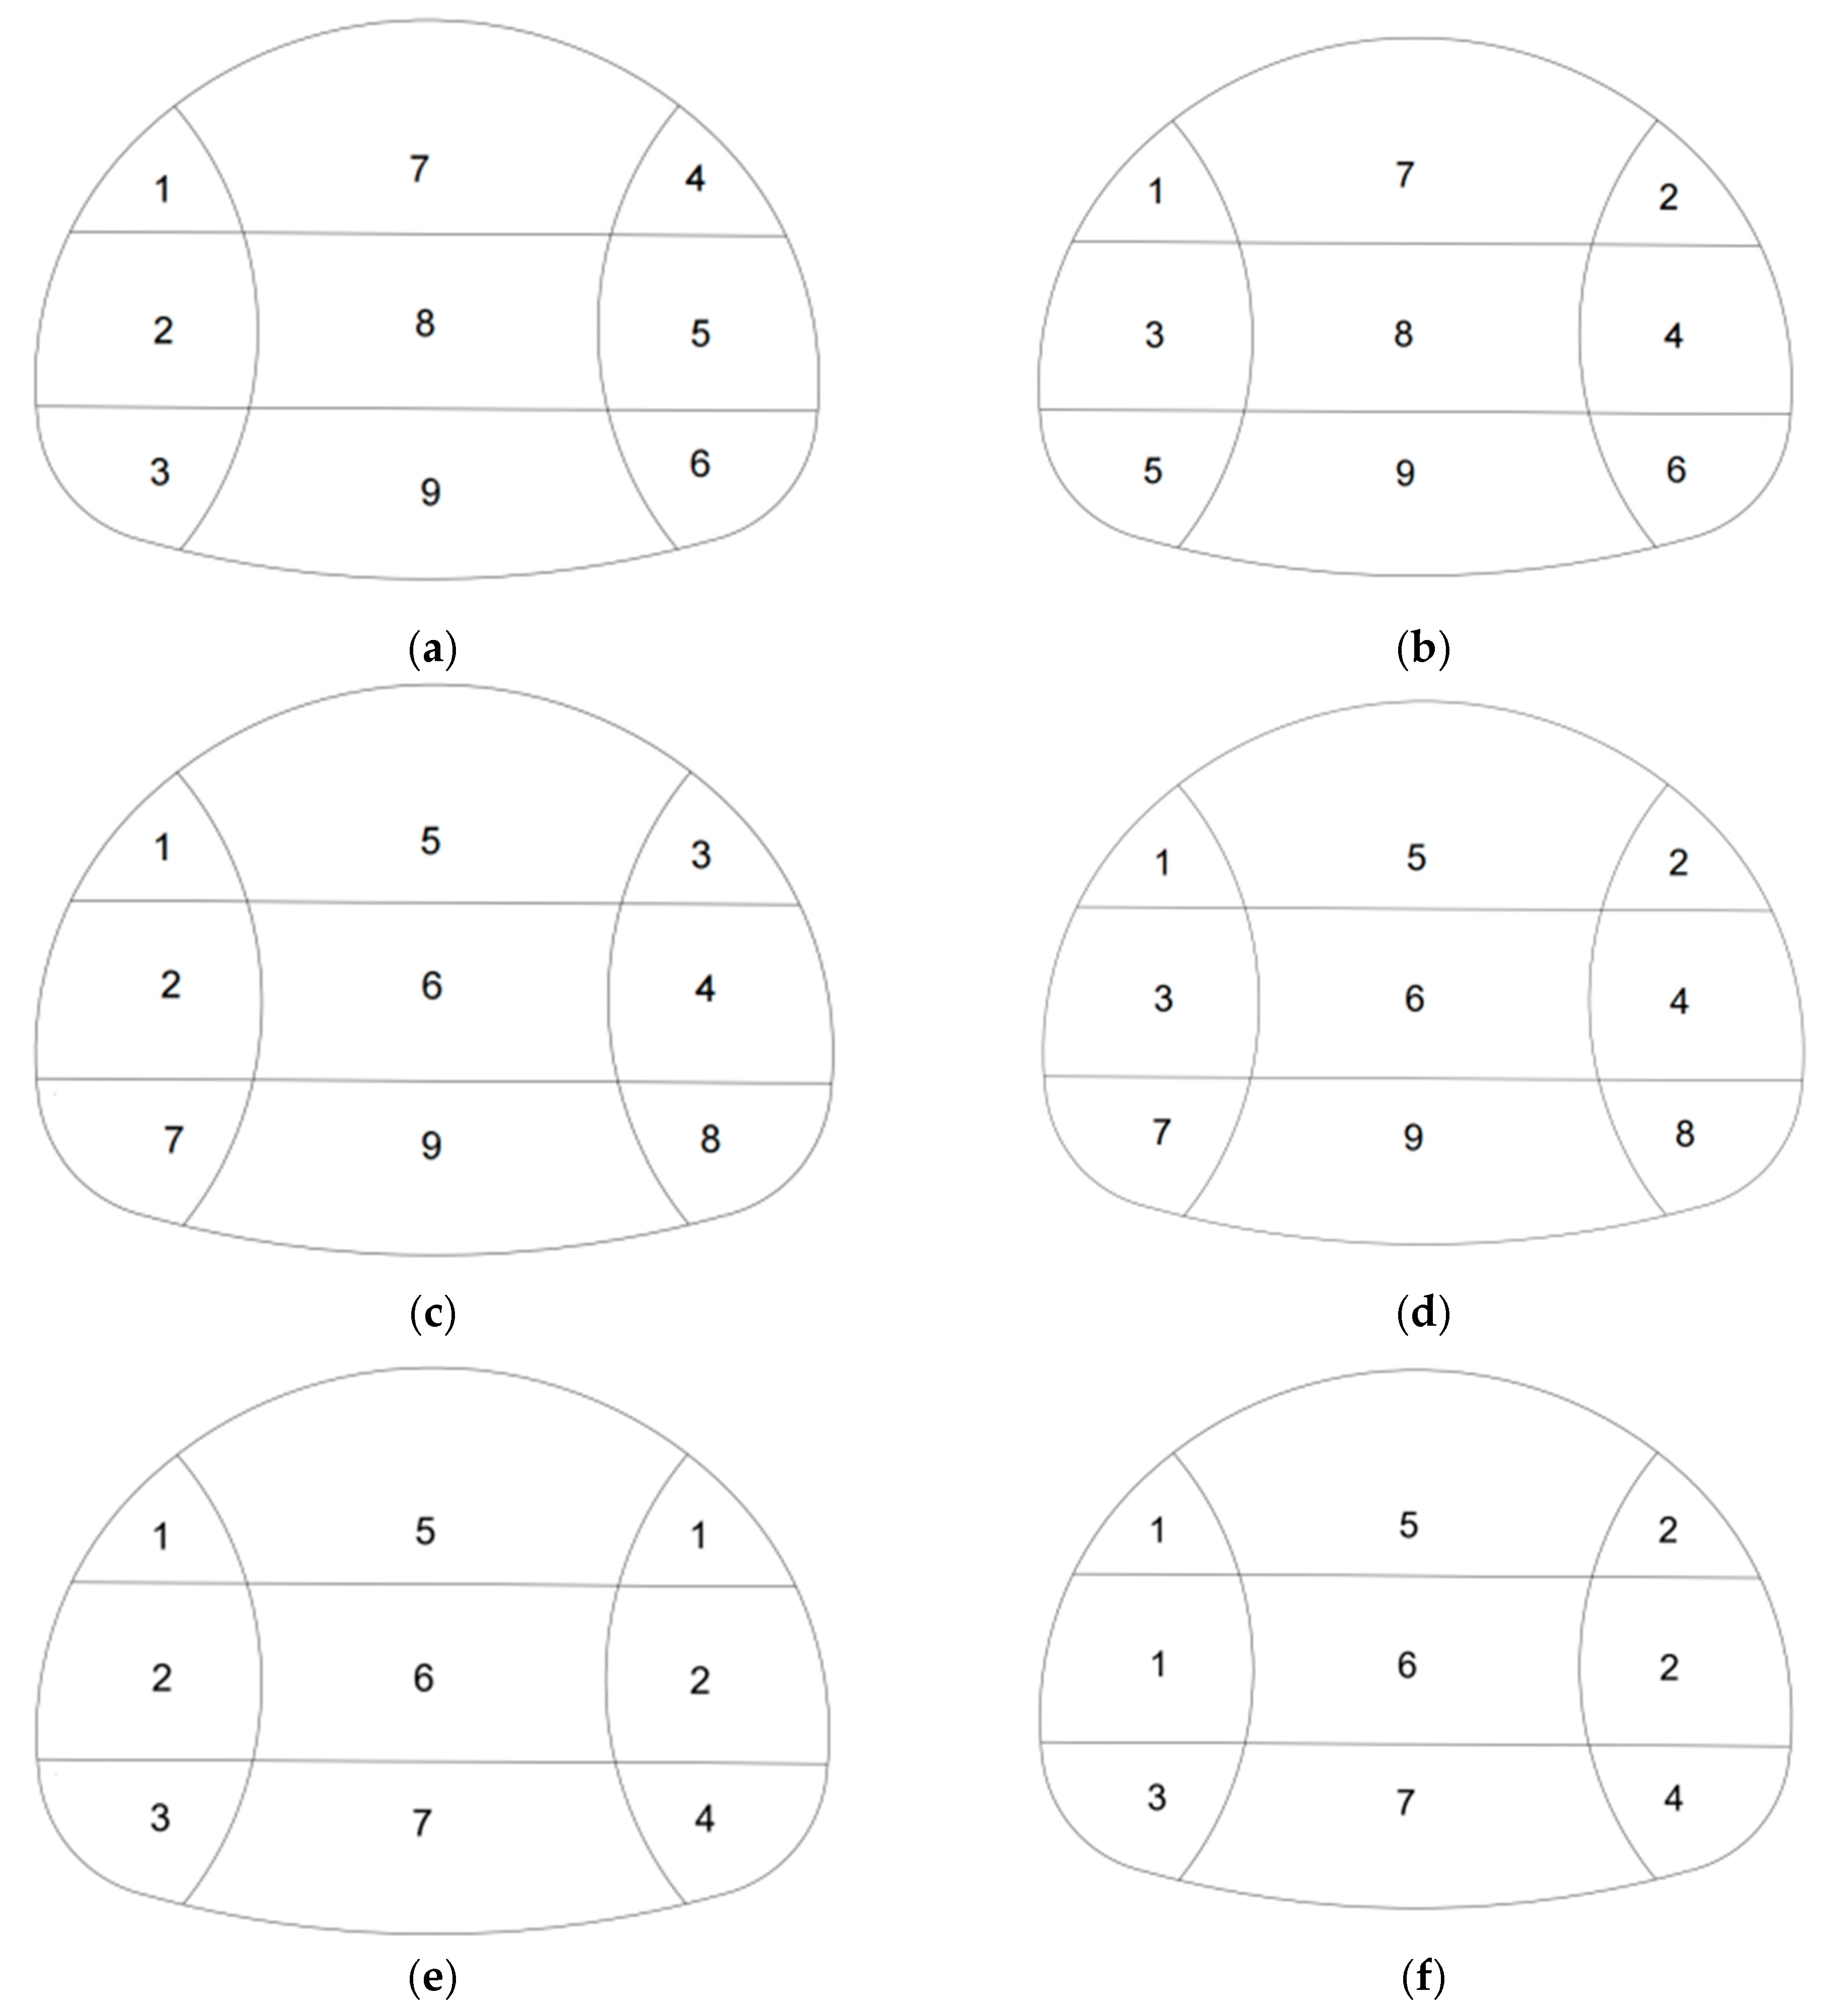
3.4. Different Working Methods to Simulate Working Conditions

Drawing on the literature and construction experience, various concealed excavation methods for tunnels are available. We have selected three methods—the double-sided drift method, the CRD method, and the three-benching seven-step method—for comparative analysis. The construction sequence for these methods is detailed as follows: initially, the excavation and initial support of the left upper guide pit are undertaken, immediately followed by the excavation and initial support of the left lower guide pit. This sequence is succeeded by the sequential excavation and support of the right upper guide pit, the right lower guide pit, the center upper guide pit, and the center lower guide pit. The final stage involves the excavation of the superelevation arch, initial support, and casting and filling of the arch. The grid distribution of the 3D model for the double-sided drift method is illustrated in Figure 8a. The implementation process for the CRD method begins with the excavation and initial support of the upper guide pit on the left side, followed by the excavation and initial support of the lower guide pit on the though right side. Subsequent stages include the excavation and initial support of the left lower guide pit and the right upper guide pit. The process concludes with the excavation of the superelevation arch, its initial support, and the casting and filling of the arch. The grid distribution of the 3D model for the CRD method is displayed in Figure 8b. For the three-benching seven-step method, the procedure begins with the excavation and initial support of the upper ring of the upper guide pit. This is followed by the excavation and initial support of the left and right-side center guide pits, respectively. The method concludes with the excavation of the superelevation arch, its initial support, and the casting and filling of the arch. The grid distribution of the 3D model for this method is shown in Figure 8c.

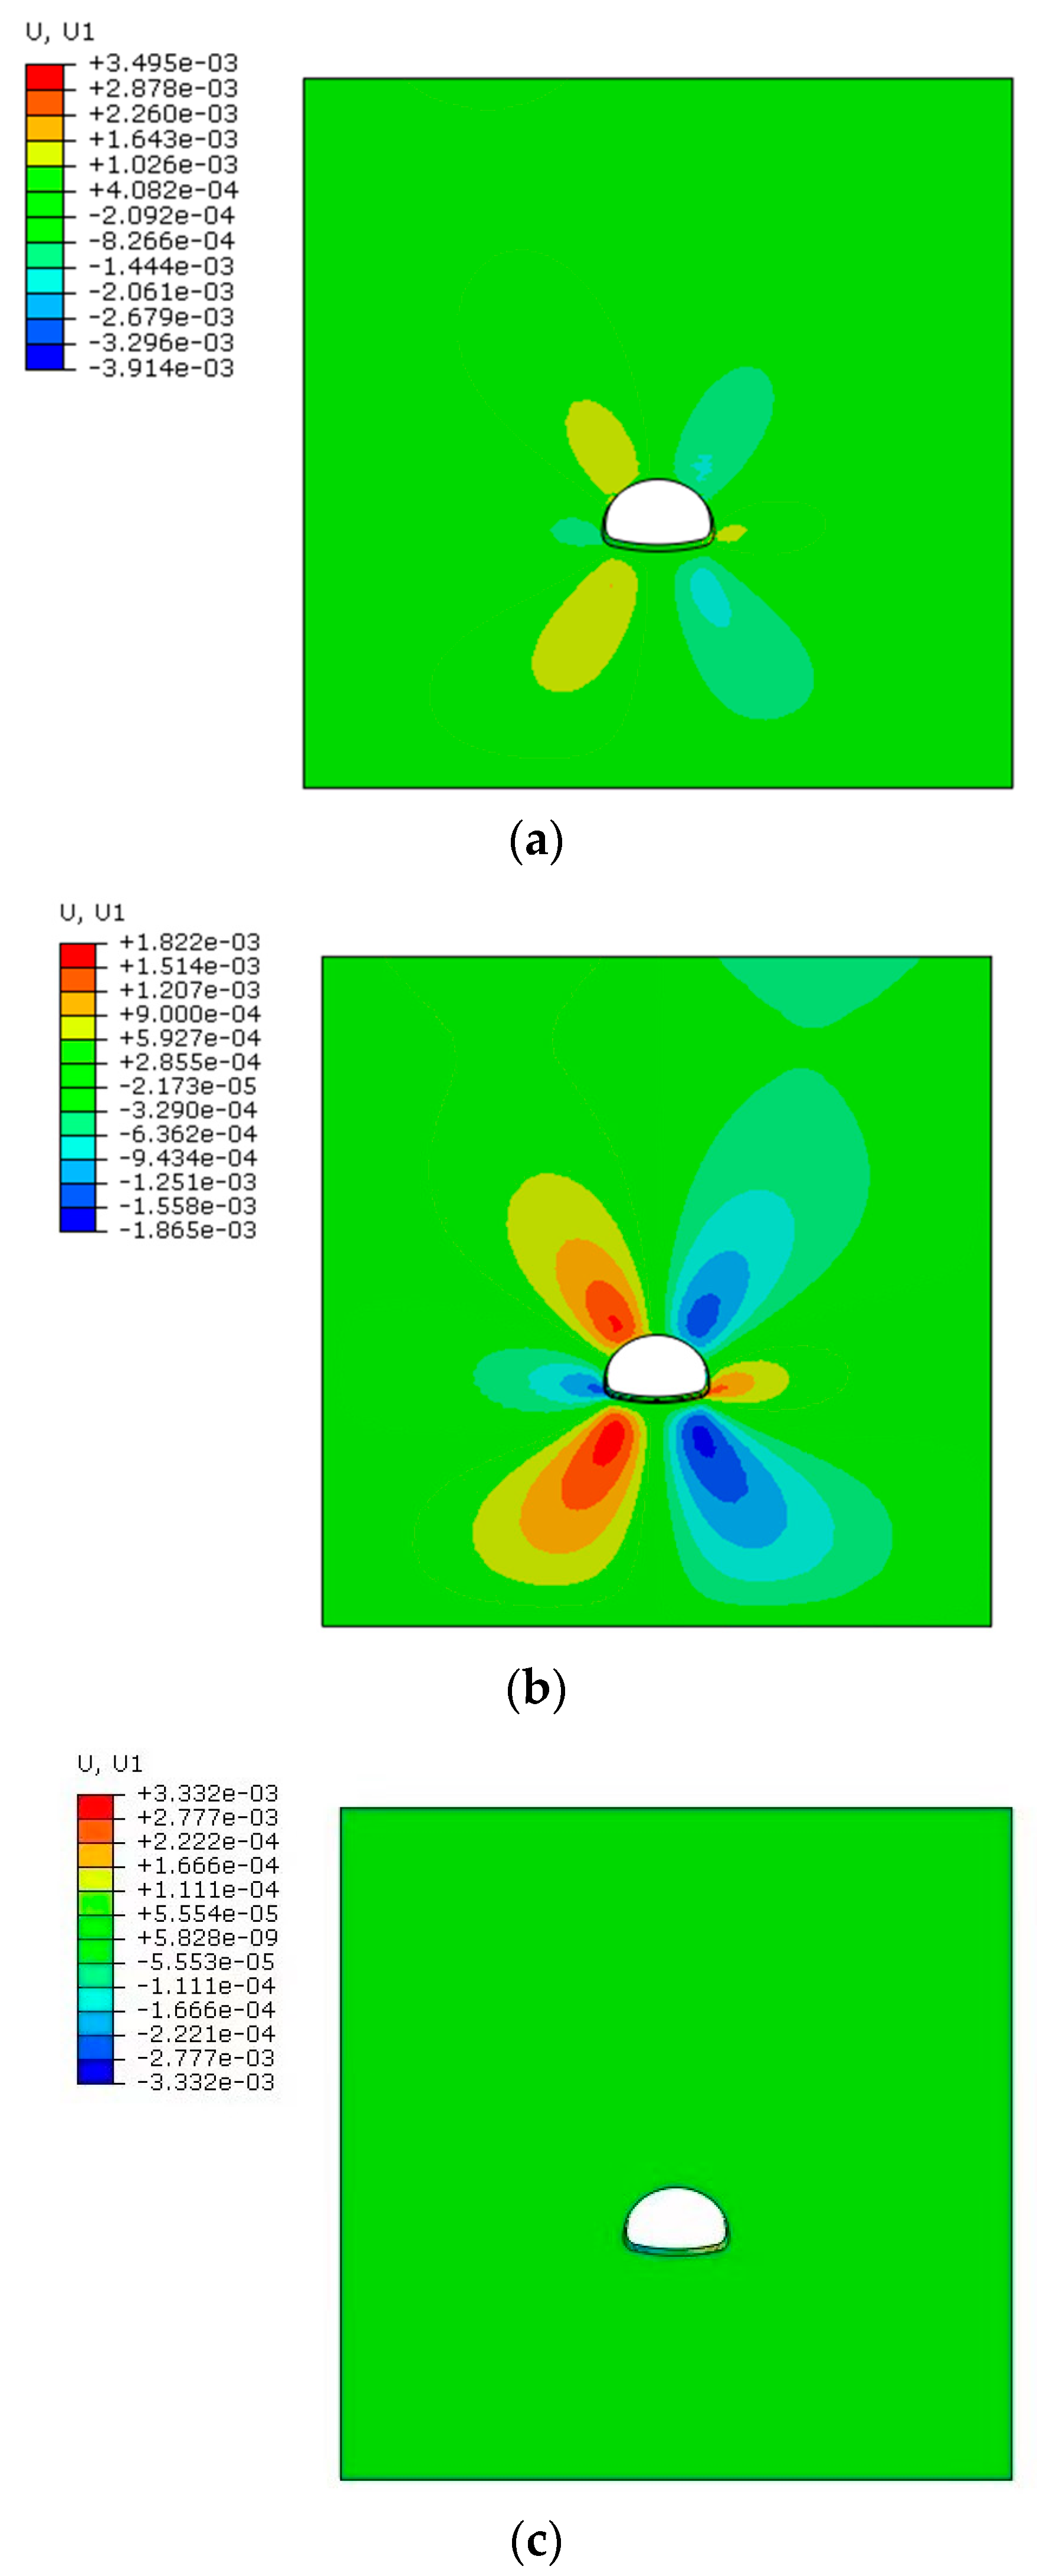
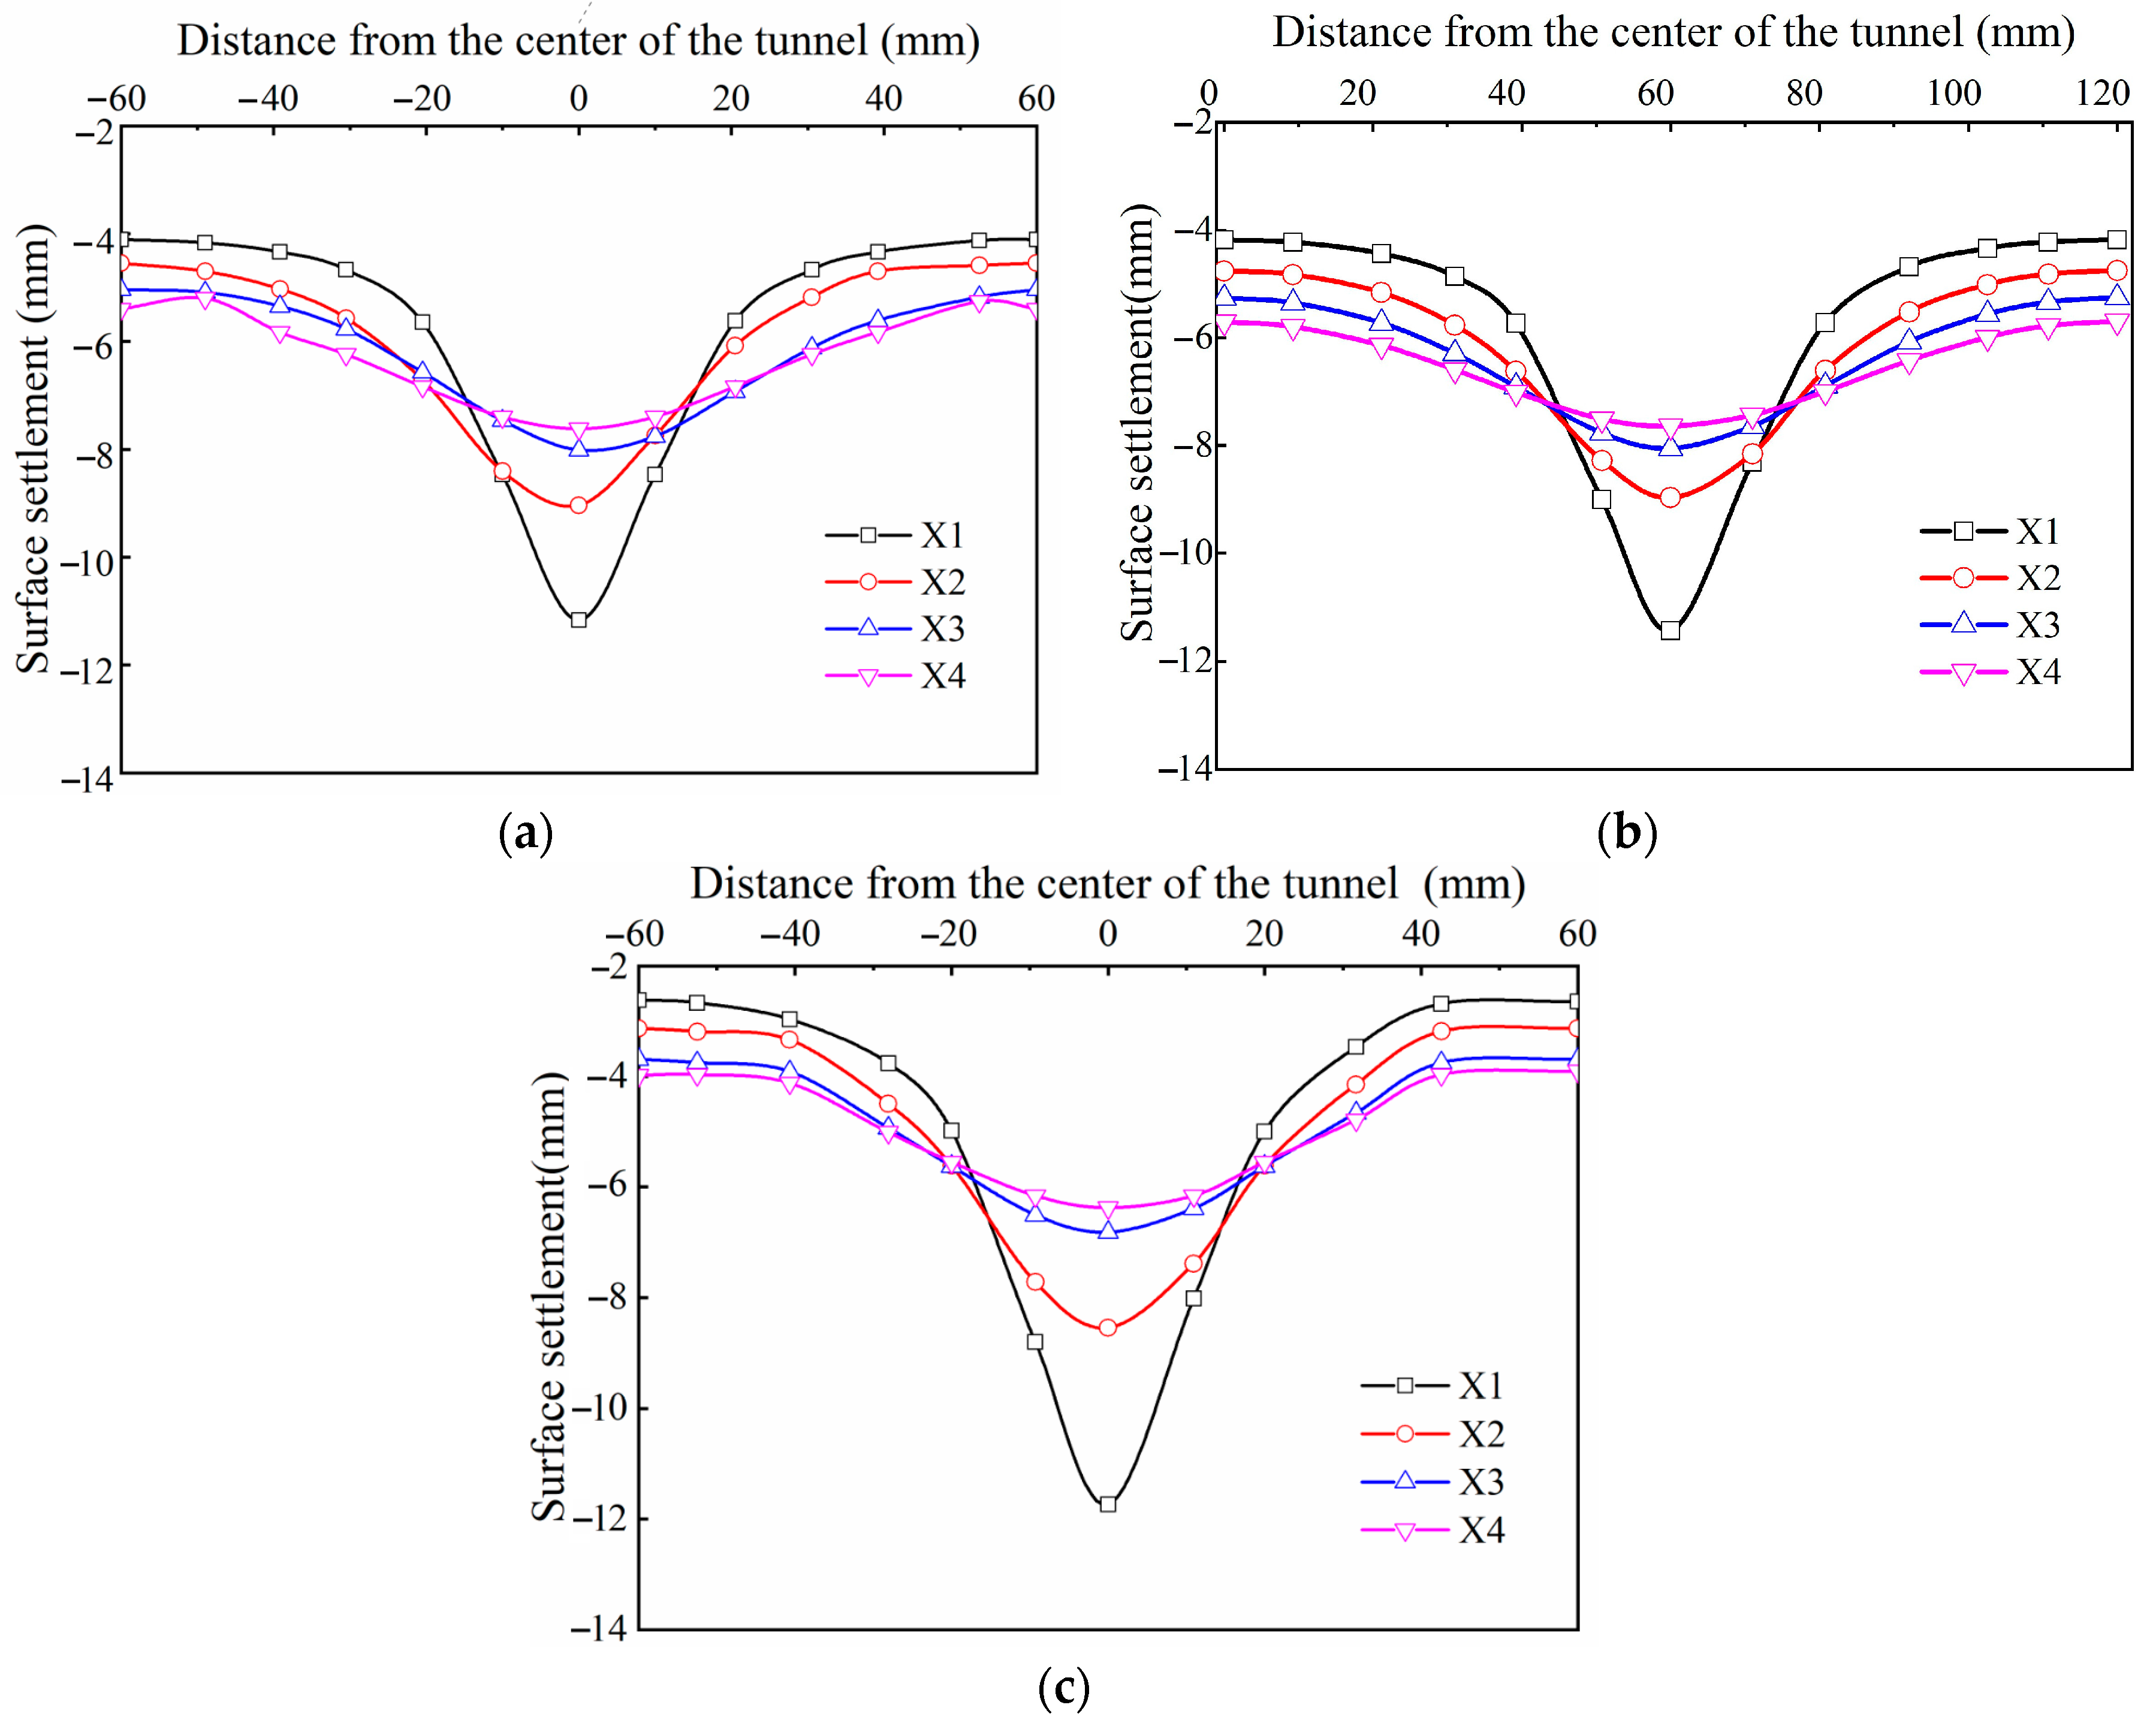
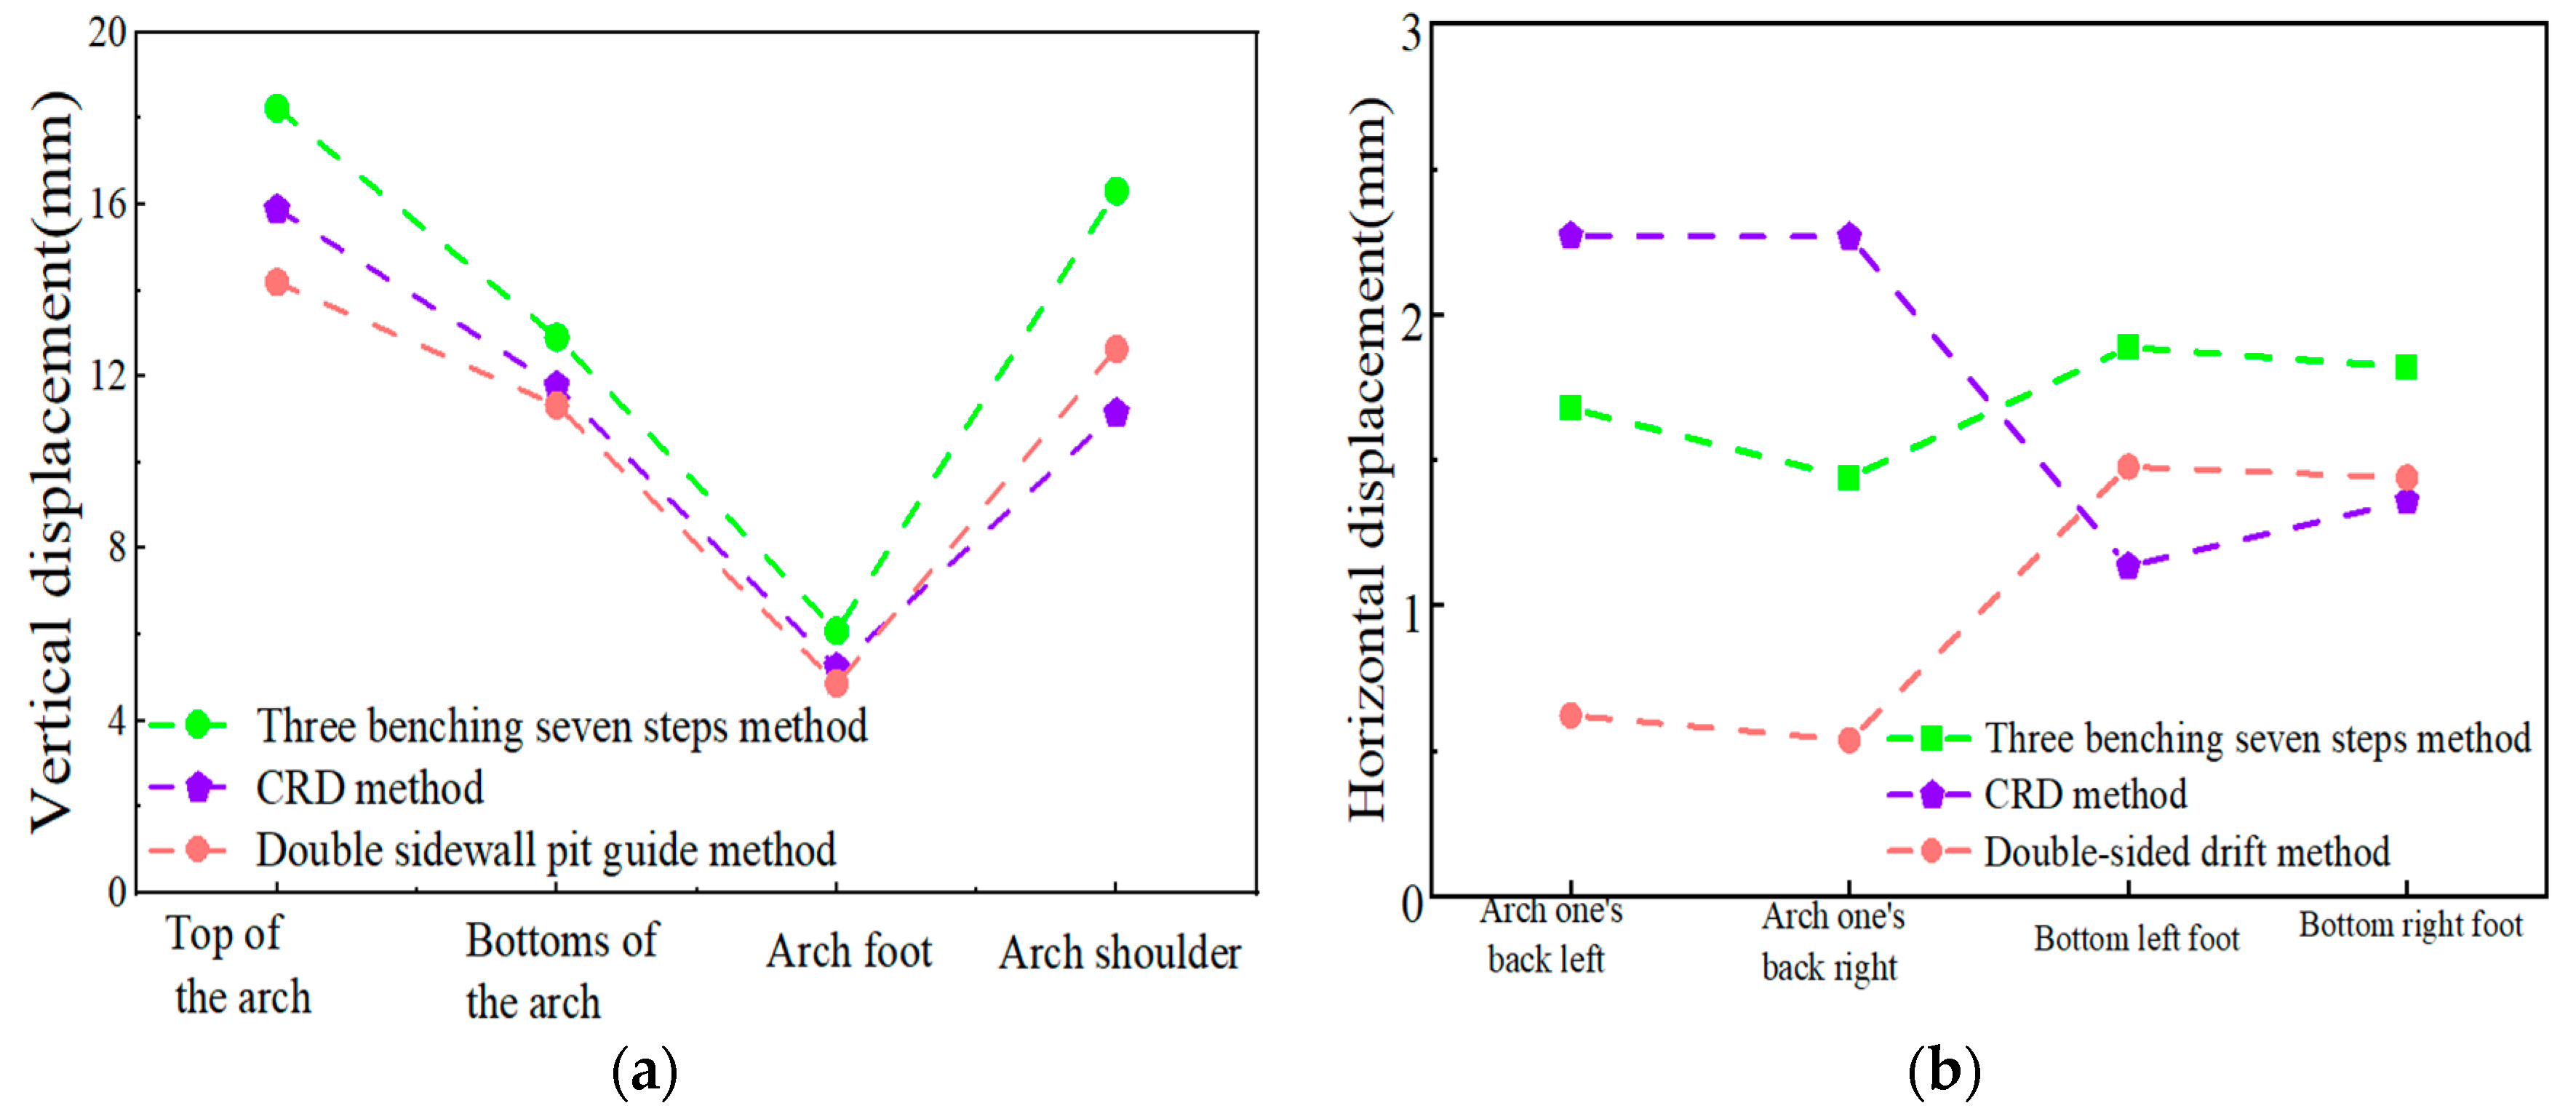
3.5. Surrounding Rock Displacement Analysis

The key monitoring points and lines within the tunnel are organized as depicted in Figure 9. Four crucial lines, designated as X1, X2, X3, and X4, have been established at each of the tunnel vaults for intensive monitoring. These lines are positioned 10 m apart from each other.
The displacement patterns under the three excavation methods are illustrated in Figure 10. Following tunnel excavation, the displacement outcomes are as follows: For the three-benching seven-step method, the settlement at the arch top is 17.7 mm and the bulge at the arch bottom is 12.8 mm. The CRD method records a settlement of 15.3 mm at the arch top and a bulge of 12.1 mm at the arch bottom. Meanwhile, the double-sided drift method shows a settlement of 14.6 mm at the arch top and a bulge of 11.5 mm at the arch bottom. Comparatively, the double-sided drift method achieves a 26% reduction in displacement at the base compared to the CRD method, which itself shows a 23% reduction in base displacement relative to the three-benching seven-step method. Among the evaluated methods, the double-sided drift method results in the least displacement, indicating its effectiveness in minimizing structural deformation.
During the excavation and support of the tunnel, the relationship between the vertical displacement at each monitoring point and the corresponding construction step is depicted in Figure 11. Given that the maximum vertical displacements typically occur at the top and bottom of the arch during tunnel section support, these locations are chosen as the primary monitoring targets for the study. Comparative analysis of the displacement data reveals that the three-benching seven-step method results in the largest vertical displacements. This is attributed to the method’s initial full excavation of the upper step, which disturbs the surrounding rock significantly and leads to more pronounced deformation. In contrast, the double-sided drift method starts by excavating the left soil, facilitating a more rapid release compared to the right soil, which in turn minimizes the vertical deformation of the surrounding rock and results in a lesser overall vertical displacement. Additionally, as the number of construction steps increases, there is a consistent decrease in the displacement at the top of the arch at the end of the support phase across all three methods.
Figure 12 presents the surface settlement values at the monitoring points X1, X2, X3, and X4, illustrating the impact of the three excavation methods on the ground surface near the tunnel vault. An increasing trend in settlement values is observed as proximity to the tunnel vault increases, while settlements decrease with greater burial depths at the tunnel’s edge. Furthermore, the burial depth locations are symmetrically arranged along the tunnel’s central distance line, with the maximum settlement point at each depth located on the tunnel’s centerline, consistently reaching peak values at X1. For the three-benching seven-step method, the maximum surface settlement recorded at X1 is 11.73 mm, with the subsequent values at X2, X3, and X4 decreasing with depth to 8.55 mm, 6.81 mm, and 6.31 mm, respectively. The CRD method exhibits a maximum settlement of 11.45 mm at X1, with the surface settlements at X2, X3, and X4 showing a similar decreasing trend with increasing burial depth, registering at 8.97 mm, 8.06 mm, and 7.64 mm, respectively. Similarly, the double-sided drift method displays a settlement of 11.43 mm at X1, with reductions at X2, X3, and X4 to 8.85 mm, 8.08 mm, and 7.62 mm as the burial depth increases.
Additionally, the arrangement of key monitoring points and lines is outlined in Figure 9, with four key lines—X1, X2, X3, and X4—strategically placed 10 m apart at each tunnel vault for essential monitoring.
As shown in Figure 13, it is evident that the three-benching seven-step method results in the highest vertical displacement at the arch top position and the greatest horizontal displacement at the arch waist position. In comparison, the double-sided drift method exhibits superior performance in controlling the displacement of the perimeter rock. This enhanced control is attributed to the construction sequences of the double-sided drift method, where temporary support is strategically added to effectively inhibit the deformation of the surrounding rock. For both the double-sided drift method and the CRD method, horizontal displacements predominantly occur at the bottom footing location. Conversely, the three-benching seven-step method exhibits significant relative displacements at both sides of the arch waist position. Consequently, when implementing the three-benching seven-step method, it is crucial to employ reinforced support measures at the arch waist location to minimize deformation and ensure structural stability during excavation.

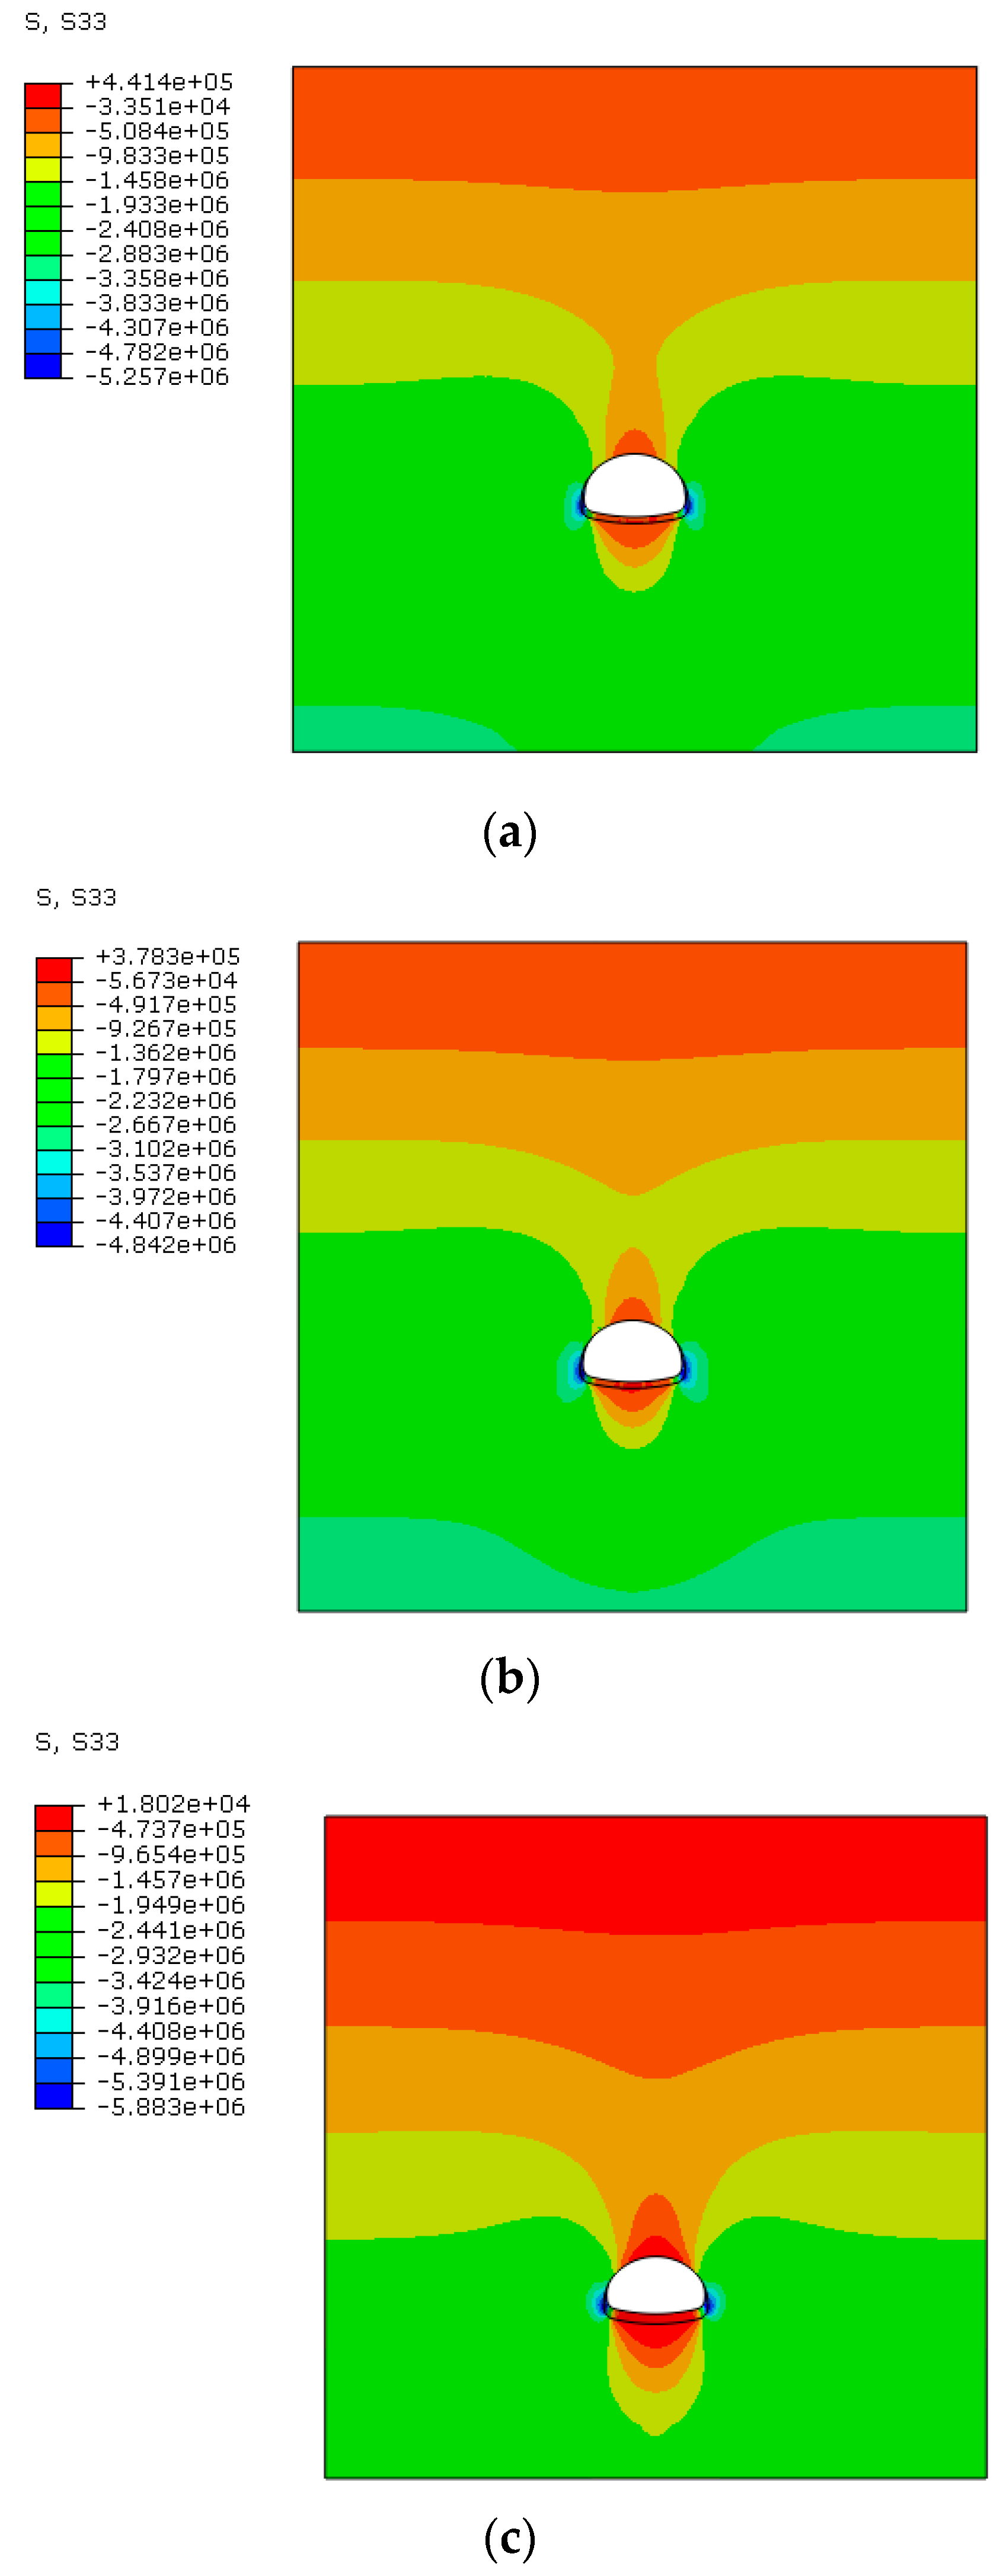
3.6. Surrounding Rock Stress

The stress distribution in the surrounding rock under the three excavation methods is depicted in Figure 14. Compared to the three-benching seven-step method and the double-sided drift method, the CRD method exerts a lesser impact on the vertical stresses in the surrounding rock. During the excavation sequences, regardless of the chosen method, the surrounding rock primarily experiences pressure in the vertical direction. The maximum compressive stress is observed at the foot of the arch, while the maximum tensile stress is noted at the bottom of the arch. It is particularly noteworthy that the three-benching seven-step method induces the highest overall compressive stress, registering an increase of approximately 17.6% over that experienced with the double-sided drift method.

4. Optimization for the Construction Sequence

Considering the impact of construction sequences on the stability of the tunnel surrounding rock, the processes depicted in Figure 15 are rigorously simulated and analyzed. Given the oversized cross-section of the highway tunnel studied in this paper, and to ensure the safety of construction operations, the first four sequences are subdivided into three segments centered around the guide hole and excavated following the sequence indicated in the diagram. In the numerical simulation, the initial four construction sequences include a total of 18 stages, ranging from establishing ground stress equilibrium to the final incorporation of the second lining. To expedite the construction timeline, sequences V and VI are streamlined by combining both sides of the guide pits into a single construction step, reducing the total number of sequences to 16.
The vertical displacements at the top and bottom of the tunnel arch under different construction sequences are detailed in Table 2. During tunnel support excavation, the bottom of the tunnel arch is influenced by self-gravity stress and the rate of loss of the bottom layer, which generates a certain degree of vertical upward tensile stress. This tension results in smaller bulge deformations at the bottom of the arch compared to those at the top. However, the various construction sequences significantly affect the timing of the peak values of arch bulge deformation; For example, Sequence III exhibits the largest cumulative base bulge value by the end of construction. Sequence IV records the maximum bulge value at the bottom of the arch during construction, whereas Sequence VI demonstrates the least cumulative bulging at this location. The cumulative vertical displacement of the vault in Sequence VI, along with the associated settlement during construction, is minimized, making this sequence shorter and more cost-effective. Sequence I features the most consistent changes throughout the construction processes, resulting in smaller final vault settlements but requiring a longer duration and presenting more construction challenges than Sequence VI. Both Sequence III and Sequence IV experience the greatest cumulative bulging at the arch bottom and the most significant bulge values. Overall, Sequence VI not only reduces the cumulative bulging at the arch bottom and the settlement at the arch top but also minimizes displacement during construction, offering the benefits of a shorter construction period, reduced construction difficulty, and improved economic efficiency.
The surface settlement results illustrate the surface disturbance caused by the construction of different sequences in super-large cross-section tunnels. There is a documented correlation between the amount of surface settlement and the distance from the center of the tunnel, as detailed in Figure 16. At monitoring point X1, the trends of cumulative settlement changes under the six sequences are fundamentally similar. Owing to the symmetrical distribution of the tunnel along the central axis, the surface settlement exhibits a symmetrical concave pattern. Further analysis indicates that Sequence IV experiences the most pronounced overall cumulative settlement and the widest sinkhole. This is closely followed by Sequences III and II, with the trends for Sequences III and IV largely coinciding. Sequences V and VI show comparable levels of cumulative surface settlement, and their sinkhole warpage magnitudes are virtually identical. Notably, Sequence VI results in the least cumulative settlement of the surrounding rock. The values of settlement at the arch bottom and arch rise are crucial for assessing the stability of mega-section highway tunnels as they provide accurate reflections of the vertical displacements at the top and bottom of the arch.

5. Conclusions

Three excavation methods—namely, the double-sided drift method, the CRD method, and the three-benching seven-step method—were selected for numerical simulation studies, with the results subsequently compared against actual monitoring data. The following conclusions can be drawn:
(1) Comparison of Numerical Simulation Results: The CRD method, the three-benching seven-step method, and the double-sided drift method were analyzed for displacement at various key points. The three-benching seven-step method yielded the highest vertical displacement at the vault, followed by the CRD method, while the double-sided drift method exhibited the lowest vault settlement displacement. At the arch base, the double-sided drift method showed the smallest increase in displacement, whereas the three-benching seven-step method recorded the largest.
(2) Implications of the Double-Sided Drift Method: The use of the double-sided drift method in the excavation sequence facilitates a greater release of support stress in the surrounding rock compared to the other methods, which can lead to stress concentrations. Therefore, it is advisable to complete the initial support promptly and quickly form the large section of the hole into a ring to minimize the risk of collapse.
(3) Optimization and Construction Sequence Comparison: After further optimization of the double-sided drift method, six different construction sequences were compared. The findings indicate that the construction sequence of the center guideway significantly impacts the displacement of the surrounding rock, whereas altering the sequence of the left and right guideways has a minimal effect on the overall displacement of the surrounding rock. Analysis of the stress and displacement fields in the perimeter rock reveals that Sequence VI demonstrates the most stable performance overall. Additionally, this sequence involves fewer steps, thereby enhancing construction efficiency. Based on these observations, it is recommended that Sequence VI be implemented for the excavation construction using the double-sided drift method in similar large cross-section road tunnel projects.

Author Contributions

Conceptualization, Y.H.; software, Y.H.; validation, T.F.; investigation, T.F.; data curation, N.W.; writing—original draft preparation, Y.H.; writing—review and editing, T.F.; visualization, T.F.; supervision, N.W.; project administration, N.W.; funding acquisition, Y.H. and N.W. All authors have read and agreed to the published version of the manuscript.

Funding

This research was supported by the National Natural Science Foundation of China, grant numbers 52168047, 52368071, 52068027, 52062016, and 41972291.

Institutional Review Board Statement

Not applicable.

Informed Consent Statement

Not applicable.

Data Availability Statement

The authors confirm that the data supporting the findings of this study are available within the article.

Conflicts of Interest

The authors declare that they have no conflicts of interest.

References

  1. Huang, M.S.; Li, H.; Yu, J.; Zhang, C.R.; Ni, Y.P. On the simplified method for evaluating tunnel response due to overlying foundation pit excavation. Transp. Geotech. 2023, 42, 101048. [Google Scholar] [CrossRef]
  2. Wei, G.; Feng, F.F.; Cui, Y.L.; Wang, X.Q.; Diao, H.G.; Wu, Y. Research on the influence of foundation pit excavation on the lateral force and deformation of side shield tunnels based on full-scale experiments. Tunn. Undergr. Space Technol. 2023, 140, 105236. [Google Scholar] [CrossRef]
  3. Zhao, J.P.; Tan, Z.S.; Yu, R.S.; Li, Z.L.; Wang, X.Y. Mechanical responses of a shallow-buried super-large-section tunnel in weak surrounding rock: A case study in Guizhou. Tunn. Undergr. Space Technol. 2023, 131, 104850. [Google Scholar] [CrossRef]
  4. Zhou, D.H.; Cao, L.Q.; Ma, Y.F.; Shi, Z. Influence analysis of core rock construction in super large section and span tunnel. Model. Comput. Eng. 2010, 1–5. [Google Scholar]
  5. Tian, Z.X.; Yu, C.; Zhang, B.L.; Zhao, Q.H.; Wang, Z.W. Analysis of Surface and Building Deformation by Shield Tunneling through Geology. Appl. Sci. 2023, 13, 11155. [Google Scholar] [CrossRef]
  6. Hong, Q.Y.; Lai, H.P.; Liu, Y.Y.; Ma, X.M.; Xie, J.T. Deformation control method of a large cross-section tunnel overlaid by a soft-plastic loess layer: A case study. Bull. Eng. Geol. Environ. 2021, 80, 4717–4730. [Google Scholar] [CrossRef]
  7. Liu, C.; Li, S.C.; Zhou, Z.Q.; Li, L.P.; Shi, S.S.; Chen, Y.X. Numerical Analysis of Surrounding Rock Stability in Super-Large Section Tunnel Based on Hydro-Mechanical Coupling Model. Geotech. Geol. Eng. 2019, 37, 1297–1310. [Google Scholar] [CrossRef]
  8. Huang, Y.B.; Zhang, T.T.; Lu, W.; Wei, H.Y.; Liu, Y.; Xiao, Y.C.; Zeng, Z.N. Research on Creep Deformation and Control Mechanism of Weak Surrounding Rock in Super Large Section Tunnel. Geotech. Geol. Eng. 2021, 39, 5213–5227. [Google Scholar] [CrossRef]
  9. Guo, X.H.; Chen, F.F.; Chu, Y.D.; Qiao, C.J. Research on support technology of highway tunnel in water-rich and weak zone. Geotechnics 2011, 32, 449–454. [Google Scholar]
  10. Li, L.P.; Li, J.C.; Zhao, Y.; Wang, H.P.; Liu, Q.; Yuan, X.S.; Zhao, Y.; Zhang, Q. Spatial deformation mechanism and load release evolution law of weak and fragmented surrounding rock in mega section tunnel. J. Rock Mech. Eng. 2012, 31, 2109–2118. [Google Scholar]
  11. Verma, H.K.; Samadhiya, N.K.; Singh, M.; Goel, R.K.; Singh, P.K. Blast induced rock mass damage around tunnels. Tunn. Undergr. Space Technol. 2018, 71, 149–158. [Google Scholar] [CrossRef]
  12. Li, X.J.; Tang, L.; Ling, J.X.; Chen, C.; Shen, Y.; Zhu, H.H. Digital-twin-enabled JIT design of rock tunnel: Methodology and application. Tunn. Undergr. Space Technol. 2023, 140, 105307. [Google Scholar] [CrossRef]
  13. Song, S.G.; Li, S.C.; Li, L.P. Model test study on vibration blasting of large cross-section tunnel with small clearance in horizontal stratified surrounding rock. Tunn. Undergr. Space Technol. 2019, 92, 103013. [Google Scholar] [CrossRef]
  14. Zhang, D.L.; Wang, M.S.; Gao, J.; Liu, Z.W. Research on the construction technology of large-span tunnels under complex surrounding rock conditions. J. Rock Mech. Eng. 2003, 22, 290–296. [Google Scholar]
  15. Zheng, G.; Wang, R.; Lei, H.; Zhang, T.; Li, H. A novel sequential excavation method for constructing large-cross-section tunnels in soft ground: Practice and theory. Tunn. Undergr. Space Technol. 2022, 128, 104626. [Google Scholar] [CrossRef]
  16. Wu, B.; Huang, W. Optimization of sequential excavation method for large-section urban subway tunnel: A case study. Adv. Mech. Eng. 2020, 12, 2072264806. [Google Scholar] [CrossRef]
  17. Gong, J.W. Mechanical Study on the Construction of Highway Tunnels with Flat Large cross Section and Small Clear Distance. Ph.D. Thesis, Tongji University, Shanghai, China, 2008. [Google Scholar]
  18. Jiang, S.P.; Liu, H.Z.; Xian, X.F. Similar simulation and numerical analysis of dynamic construction of large-span flat tunnels. J. Rock Mech. Eng. 2000, 19, 567–572. [Google Scholar]
  19. Jiang, S.P.; Li, J.J.; Xie, F. Comparative stability analysis of different excavation methods for tunnel openings. Tunnel Constr. 2007, 16–20. [Google Scholar]
  20. Jia, X.X. Research on Key Technology of Controlled Blasting for Subway Excavation in Urban Complex Environment. Master’s Thesis, Shijiazhuang Tiedao University, Shijiazhuang, China, 2017. [Google Scholar]
  21. Liu, C. Study on Mechanical Characteristics of Deeply Buried Large-Section Tunnel Construction. Ph.D. Thesis, Chongqing University, Chongqing, China, 2007. [Google Scholar]
  22. Yang, H.; Shi, Q.; Xu, X. Intelligent monitoring of tunnel structures based on vision measurement technologies. Mech. Adv. Mater. Struct. 2022, 29, 5906–5910. [Google Scholar] [CrossRef]
  23. Strauss, A.; Bien, J.; Neuner, H.; Harmening, C.; Seywald, C.; Österreicher, M.; Voit, K.; Pistone, E.; Spyridis, P.; Bergmeister, K. Sensing and monitoring in tunnels testing and monitoring methods for the assessment of tunnels. Struct. Concr. 2020, 21, 1356–1376. [Google Scholar] [CrossRef]
  24. Tang, Y.; Zheng, Y.; Li, L.; Xian, L.; Guo, D. Experimental Study of Dynamic Responses of Special Tunnel Sections under Near-Fault Ground Motion. Sustainability 2023, 15, 4506. [Google Scholar] [CrossRef]
  25. Tsinidis, G.; de Silva, F.; Anastasopoulos, I.; Bilotta, E.; Bobet, A.; Hashash, Y.M.A.; He, C.; Kampas, G.; Knappett, J.; Madabhushi, G.; et al. Seismic behaviour of tunnels: From experiments to analysis. Tunn. Undergr. Space Technol. 2020, 99, 103334. [Google Scholar] [CrossRef]
  26. Chen, J.; Liu, W.; Chen, L.; Luo, Y.; Li, Y.; Gao, H.; Zhong, D. Failure mechanisms and modes of tunnels in monoclinic and soft-hard interbedded rocks: A case study. KSCE J. Civ. Eng. 2020, 24, 1357–1373. [Google Scholar] [CrossRef]
  27. Galli, G.; Grimaldi, A.; Leonardi, A. Three-dimensional modeling of tunnel excavation and lining. Comput. Geotech. 2004, 31, 171–183. [Google Scholar] [CrossRef]
  28. Li, P.; Zhao, Y. Performance of a multi-face tunnel excavated in loess ground based on field monitoring and numerical modeling. Arab. J. Geosci. 2016, 9, 1–10. [Google Scholar] [CrossRef]
  29. Aydin, A.; Ozbek, A.; Cobanoglu, I. Tunnelling in difficult ground: A case study from Dranaz tunnel, Sinop, Turkey. Eng. Geol. 2004, 74, 293–301. [Google Scholar] [CrossRef]
Figure 1. Longitudinal section of engineering geology.
Applsci 14 06544 g001
Figure 2. Schematic diagram of tunnel construction limits and internal outlines (unit: centimeter).
Applsci 14 06544 g002
Figure 3. Monitoring instrument and measuring point layout. (a) The measurement points distribution; (b) displacement meter layout.
Applsci 14 06544 g003
Figure 4. Monitoring curves for the top of arch, left arch shoulder, and right arch shoulder.
Applsci 14 06544 g004
Figure 5. Monitoring curves of two waist convergence values.
Applsci 14 06544 g005
Figure 6. Three-dimensional numerical model. (a) Finite element numerical mesh diagram; (b) grid diagram of tunnel initial support.
Applsci 14 06544 g006
Figure 7. Diagram of model validation. (a) Comparison with two case studies on surface settlement; (b) comparison with field monitoring results; (c) comparison with two case studies on the vertical displacement of tunnel arch [3,27,28,29].
Applsci 14 06544 g007
Figure 8. Grid diagram of the three working methods. (a) Double-sided drift method; (b) CRD method; (c) three-benching seven-step method.
Applsci 14 06544 g008
Figure 9. Layout of monitoring points and monitoring lines. (a) Distribution of monitoring points; (b) horizontal monitoring line position.
Applsci 14 06544 g009
Figure 10. Surrounding rock displacement cloud map under different working methods. (a) Double-sided drift method; (b) CRD method; (c) three-benching seven-step method.
Applsci 14 06544 g010
Figure 11. Variation in the tunnel arch/bottom displacements with the number of construction steps under the different working methods. (a) Vertical displacement of tunnel arch; (b) vertical displacement of tunnel bottom.
Applsci 14 06544 g011
Figure 12. Surface settlement curves for the three working methods. (a) Double-sided drift method; (b) CRD method; (c) three-benching seven-step method.
Applsci 14 06544 g012
Figure 13. Displacement map of the tunnel monitoring points. (a) Vertical displacement; (b) horizontal displacement.
Applsci 14 06544 g013
Figure 14. Surrounding rock stress maps under three working methods. (a) Double-sided drift method; (b) CRD method; (c) three-benching seven-step method.
Applsci 14 06544 g014
Figure 15. Working sequence arrangement. (a) Sequence I; (b) Sequence II; (c) Sequence III; (d) Sequence IV; (e) Sequence V; (f) Sequence VI.
Applsci 14 06544 g015
Figure 16. Surface settlement map under different sequences.
Applsci 14 06544 g016
Table 1. Parameters of the model.
NameGrave/KN/m3Modulus of Elasticity/GPaPoisson’s
Ratio
Cohesive Force/KPaFriction Angle/°
perimeter rock2410.70.261100 Kpa44
primordial branch2431.50.2//
second lining25300.3//
steel arch782100.3//
Table 2. Vertical displacement under different sequences.
Working
Condition
Sequence ISequence IISequence IIISequence IVSequence VSequence VI
Top of arch settlement (mm)14.7414.7514.8914.9114.9214.72
Disclaimer/Publisher’s Note: The statements, opinions and data contained in all publications are solely those of the individual author(s) and contributor(s) and not of MDPI and/or the editor(s). MDPI and/or the editor(s) disclaim responsibility for any injury to people or property resulting from any ideas, methods, instructions or products referred to in the content.

