Article

Comparison of Embankment Properties with Clay Core and Asphaltic Concrete Core

by
Chawakorn Rewtragulapaibul
1,
Saravut Jaritngam
1,*,
Tanawan Wannawong
2 and
Opas Somchainuek
3
1
Faculty of Engineering, Prince of Songkla University, Songkhla 90110, Thailand
2
Royal Irrigation Department, Ministry of Agriculture and Cooperatives, Bangkok 10300, Thailand
3
Department of Highways, Ministry of Transport, Songkhla 90000, Thailand
*
Author to whom correspondence should be addressed.
Appl. Sci. 2024, 14(15), 6555; https://doi.org/10.3390/app14156555
Submission received: 20 May 2024 / Revised: 19 June 2024 / Accepted: 26 June 2024 / Published: 26 July 2024
(This article belongs to the Special Issue Structural Mechanics in Materials and Construction)

Abstract

:
The development of a country is affected by various multifaceted factors, which are likely to generate the highest benefits. For example, developing water resources by constructing embankments to store water and for transportation must consider high resilience, particularly with the current challenges arising from climate change. Another factor that must be considered is the shortage of essential materials for embankment cores, such as clay, which is the primary material for constructing such cores. This study aims to analyze the stability of soil embankments between the change of materials, namely clay and asphaltic concrete, by varying the water level and increasing the embankment load. The result shows that the asphaltic concrete core exhibits a significantly higher stability than the clay core, such as its reduced water seepage and lower deformation. In the worst-case scenario, the asphalt concrete core has a thickness of 0.3 m and a seepage rate of 15.1 × 10⁻⁴ m3/day. Comparatively, the seepage rate of the clay core is approximately 10-times lower.

1. Introduction

Identifying an explicit approach through planning is necessary to reduce the probability of double investment and consider the effectiveness of a budget. The transportation network system is one of the significant components of a country’s development; it drives economic activities through passenger and cargo transport. For example, to transport agricultural products, construction materials, and domestic goods, most highway systems in Thailand are constructed on soil embankments, which is the same major component in irrigation systems because this material is readily available and has a low construction cost. That is, it is a worthy investment that can last for a century. Therefore, highway engineering has developed the stability of soil embankments, including improved pavement materials for comfort in travel [1,2,3]. However, the lack of construction materials has become a recent problem, while existing soil embankments have undergone certain issues due to climate change. The effects of climate change have produced uncertain natural conditions that severely affect the stability of soil embankments [4,5]. Flooding results from inadequate design that does not consider the effects of climate change. Drainage systems are unable to drain massive amounts of water during high-intensity rainfall and cannot handle rapidly dropping water levels [6]. Moreover, the increase in people’s daily activities, recreation, and agricultural transportation on soil embankments along irrigation systems is inevitable. Soil embankments in irrigation systems have not been designed to support massive transportation. This condition is a significant factor that affects the stability of soil embankments. In cases wherein soil embankments are unable to support activities, fatal accidents and property loss may result [7].
The replacement of soil embankment material is one of the reasonable solutions to this problem, and clay is typically the primary material used. Thus, in material replacement, the engineering properties of replacement materials should be similar to those of the original material. According to collected data, asphaltic concrete can be used as a substitute material for soil [8,9,10]. Asphaltic concrete has engineering properties that correspond to those of clay. It is simple, has accessible sources, and controllable cost.
The objective of this study is to test and compare the properties of soil embankments constructed with clay and asphaltic concrete. Engineering properties, such as the permeability, shear strength, and elastic modulus, are considered for assessing and analyzing the stability of soil embankments. Numerical analysis via GeoStudio is applied to analyze the significant factors, such as seepage through the embankment, displacement, and slope stability, of clay and asphaltic concrete core embankments [11,12,13]. To set the test conditions, the water level is divided into two models: the normal water level state and a rapid drawdown state, including the reaction load from transportation on an embankment. The results will be helpful in designing soil embankments to improve stability and strength, reduce the risk of soil embankment loss, and acknowledge the worth of investment costs for soil embankment construction.

2. Materials and Methods

2.1. Significant Factors Affect the Stability of an Embankment

2.1.1. Seepage Analysis through an Embankment

This study determines seepage by analyzing two models, namely the normal water level and rapid drawdown states, via the following 2D steady-state flow equation [6].
k x 2 h x 2 +   k y 2 h y 2   =   0
where
  • h = Hydraulic head.
  • kx = Permeability coefficient in the x direction.
  • ky = Permeability coefficient in the y direction.

2.1.2. Displacement Analysis of Embankments

The soil settlement condition is assumed to move through vertical displacement through soil weight, causing a decrease in the soil embankment height and a crack in the soil body. These conditions results in overtopping flow and erosion through cracks. The soil settlement condition is mostly the result of the consolidation of materials, the effective force on surcharge, and the elastic settlement of the embankment [14].

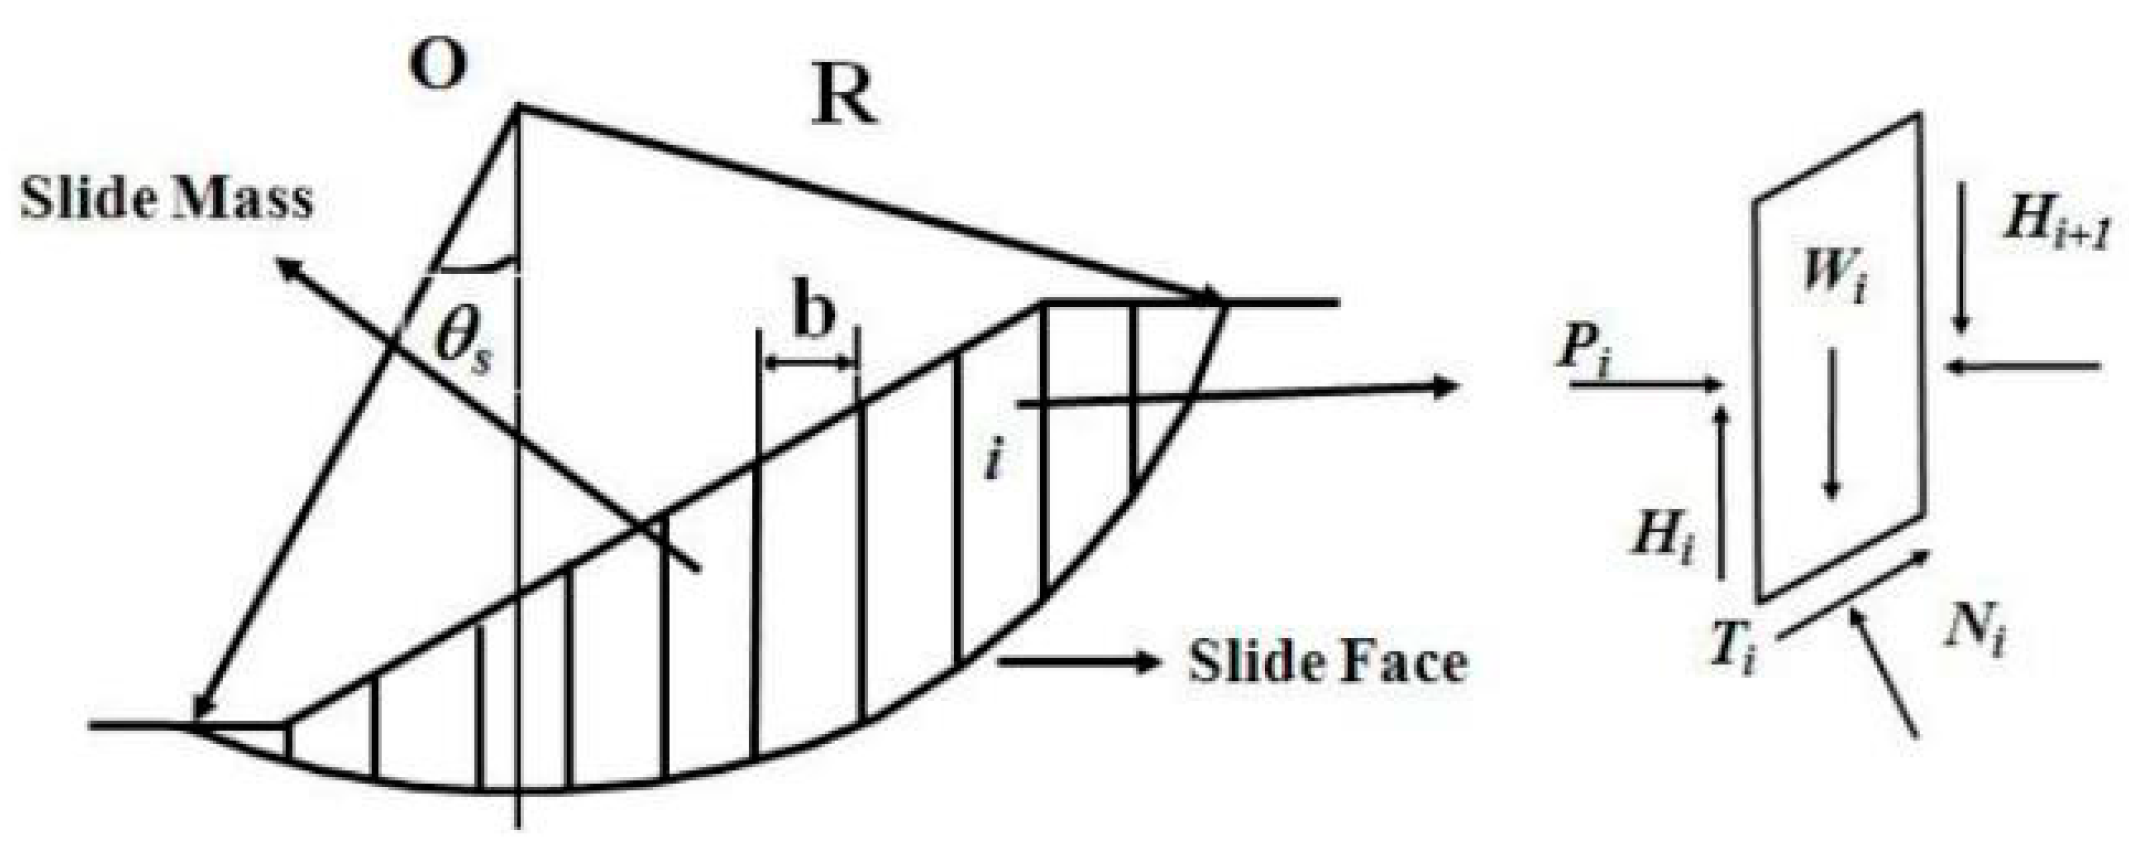
2.1.3. Slope Stability Analysis of an Embankment

To analyze slope stability, the limit equilibrium method (LEM) is applied in accordance with the Mohr–Coulomb criterion [15]. In the first step, a moving pattern or critical failure surface is assumed. The design for solving the failure of an embankment can comprehend the exact critical failure surface through soil investigation. To consider the shear stress acting on soil and compare it with the available shear strength of soil, as shown in Figure 1, the calculation derives the factor of safety (FOS). The FOS is a key parameter used in limit equilibrium analysis. It is defined as the ratio of the available shear strength of the soil to the shear stress acting on the soil.
F . S = a v a i l a b l e   s h e a r   s t r e n g t h   o f   t h e   s o i l s h e a r   s t r e s s   a c t i n g   o n   t h e   s o i l
Widely used methods for analyzing the slope stability of embankments include the ordinary method [16,17], Bishop’s simplified method (BSM) [16], Janbu’s simplified method (JSM) [18,19,20], the Morgenstern–Price method (M–PM) [21], and Spencer’s method (SM) [22]. The analysis has to test the total and effective stress approaches [23]. For criteria in other countries, the FOS for embankments is presented in Table 1.

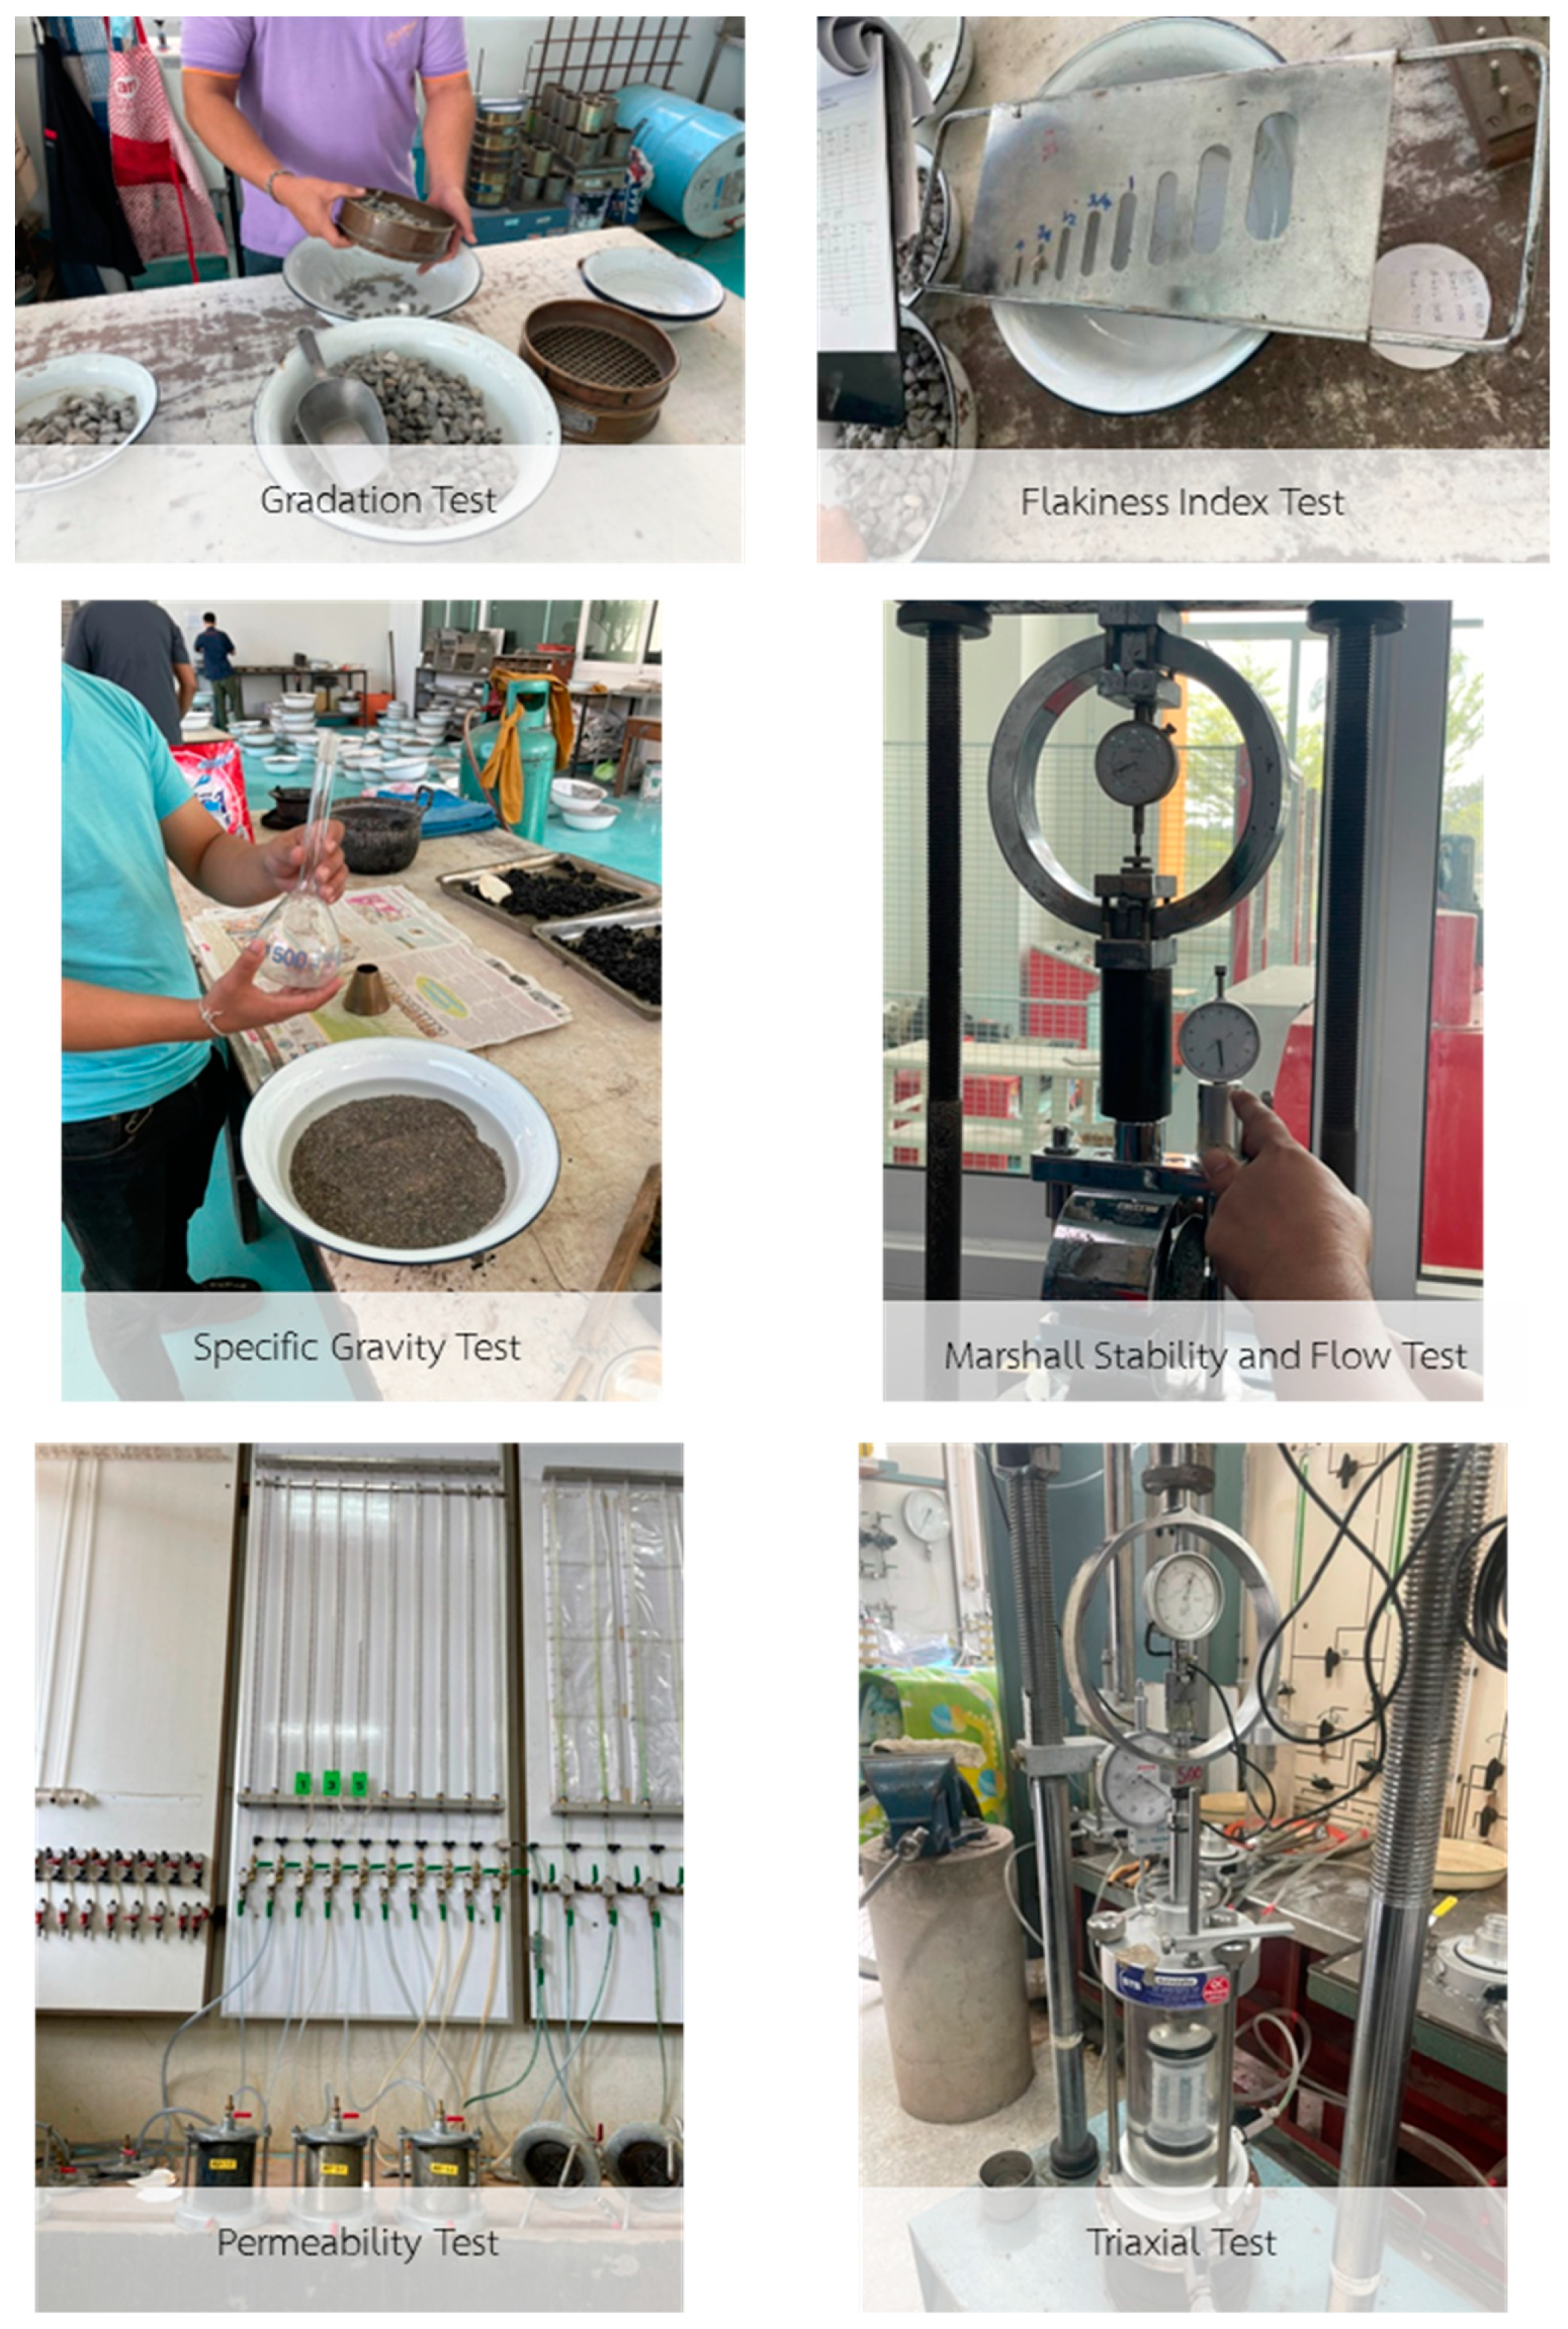
2.2. Testing of Asphaltic Concrete in the Laboratory

In the laboratory testing of asphaltic concrete, the procedure involves examining the properties of the aggregate material, which is used as a substitute for a component of asphaltic concrete. However, testing does not extend to asphalt cement, another constituent, because it is typically certified by regulatory bodies. Focus remains on assessing the crucial properties of asphaltic concrete for its potential use as an embankment core material. Therefore, this testing is divided into two parts: the testing of aggregate properties, which comprises eight testing methods, and the testing of asphaltic concrete properties, which comprises four testing methods. The testing procedures are outlined in Table 2.
In the testing of aggregate properties and asphaltic concrete, the selected aggregate is limestone, which ranges from fine to 3/4 inch. The chosen asphalt (bitumen) is type AC 60/70. The specific gravity of the asphalt cement used in the testing is 1.02. For asphaltic concrete testing using the Marshall method, mix designs are formulated with varying proportions of aggregate sizes to achieve different air void contents in asphaltic concrete, i.e., approximately 1%, 2%, and 3% (by volume of asphaltic concrete), with an asphalt cement content of 6% (by mass of asphaltic concrete). Subsequently, these mix designs are subjected to three testing methods: (1) determination of the strength index, (2) a water permeability test, and (3) a compression strength test of three cylindrical specimens.
In the current study, the mix proportions are described as ratios of Hot Bin 1:2:3:4 (% by mass of total aggregate materials). Aggregate materials are obtained from the hot bin to separate them from materials in the cold bin. Grates are then utilized in the incineration plant to categorize them into Hot Bins 1, 2, 3, and 4. The details of the hot bins for aggregate materials are provided in Table 3.
After completing the laboratory testing of asphaltic concrete, the next step involves analyzing the test results to assess the properties of asphaltic concrete. This analysis aims to determine the suitability of the asphaltic concrete mixture, which consists of locally sourced materials, for use as an embankment core material.
In the laboratory testing of asphaltic concrete, two major procedures were conducted: aggregate and asphaltic concrete testing. An overview of the testing is illustrated in Figure 2. The results of the 12 testing methods are summarized in Table 4. This table presents the general aggregate properties and asphaltic concrete test results, intended for application as an embankment core material.

2.2.1. Analysis of Asphaltic Concrete Mixture Design Results

Testing asphaltic concrete by using the Marshall method serves as a technique for designing an asphaltic concrete mixture. This method provides information about aggregate material proportions and sizes. Each test reveals crucial properties that are essential for mixture design, including density, stability, flow, air void content (AV), and asphalt cement content (AC). In the current study, the objective is to determine the aggregate material proportions for different AV values, particularly 1%, 2%, and 3%. This investigation aims to understand how varying AV values affect the aggregate proportions and overall properties of the asphaltic concrete mixture.
Therefore, on the basis of the results of the Marshall method testing for asphaltic concrete, three different aggregate material proportions that correspond to AV values of 1%, 2%, and 3% are obtained. This study aims to compare the differences in aggregate material proportions among the three designs. The comparison is presented in three parts: (1) aggregate material proportions; (2) aggregate material sizes; and (3) density, stability, and flow characteristics. This comparison provides insights into the effects of varying AV values on an asphaltic concrete mixture.
1.
Aggregate Material Proportions.
The aggregate material proportions obtained from the asphaltic concrete mixture design through Marshall method testing, with AV values of 1%, 2%, and 3%, and an AC of 6%, are presented in Table 5.
Table 5 clearly shows that the aggregate material proportions, with an AC of 6% and an AV of 1%, have the highest percentage of aggregate material in Hot Bin 1 (size: <4.75 mm). This aggregate size is the smallest in the mixture, and it decreases gradually with an AV of 2% and 3%. However, for an AV of 3%, the highest percentage of aggregate material is found in Hot Bin 4 (size: 19.05 mm), which is the largest aggregate size in the mixture, and it decreases with an AV of 2% and 1%. This finding demonstrates that when aiming for a lower AV in asphaltic concrete with 6% AC, the proportion of aggregate material in Hot Bin 1 (size: <4.75 mm) increases, efficiently filling the voids between aggregates. Furthermore, when comparing equal proportions of aggregate material with varying AC values, AV decreases as AC increases. However, selecting an appropriate AC is crucial, because excessive amounts may reduce strength.
2.
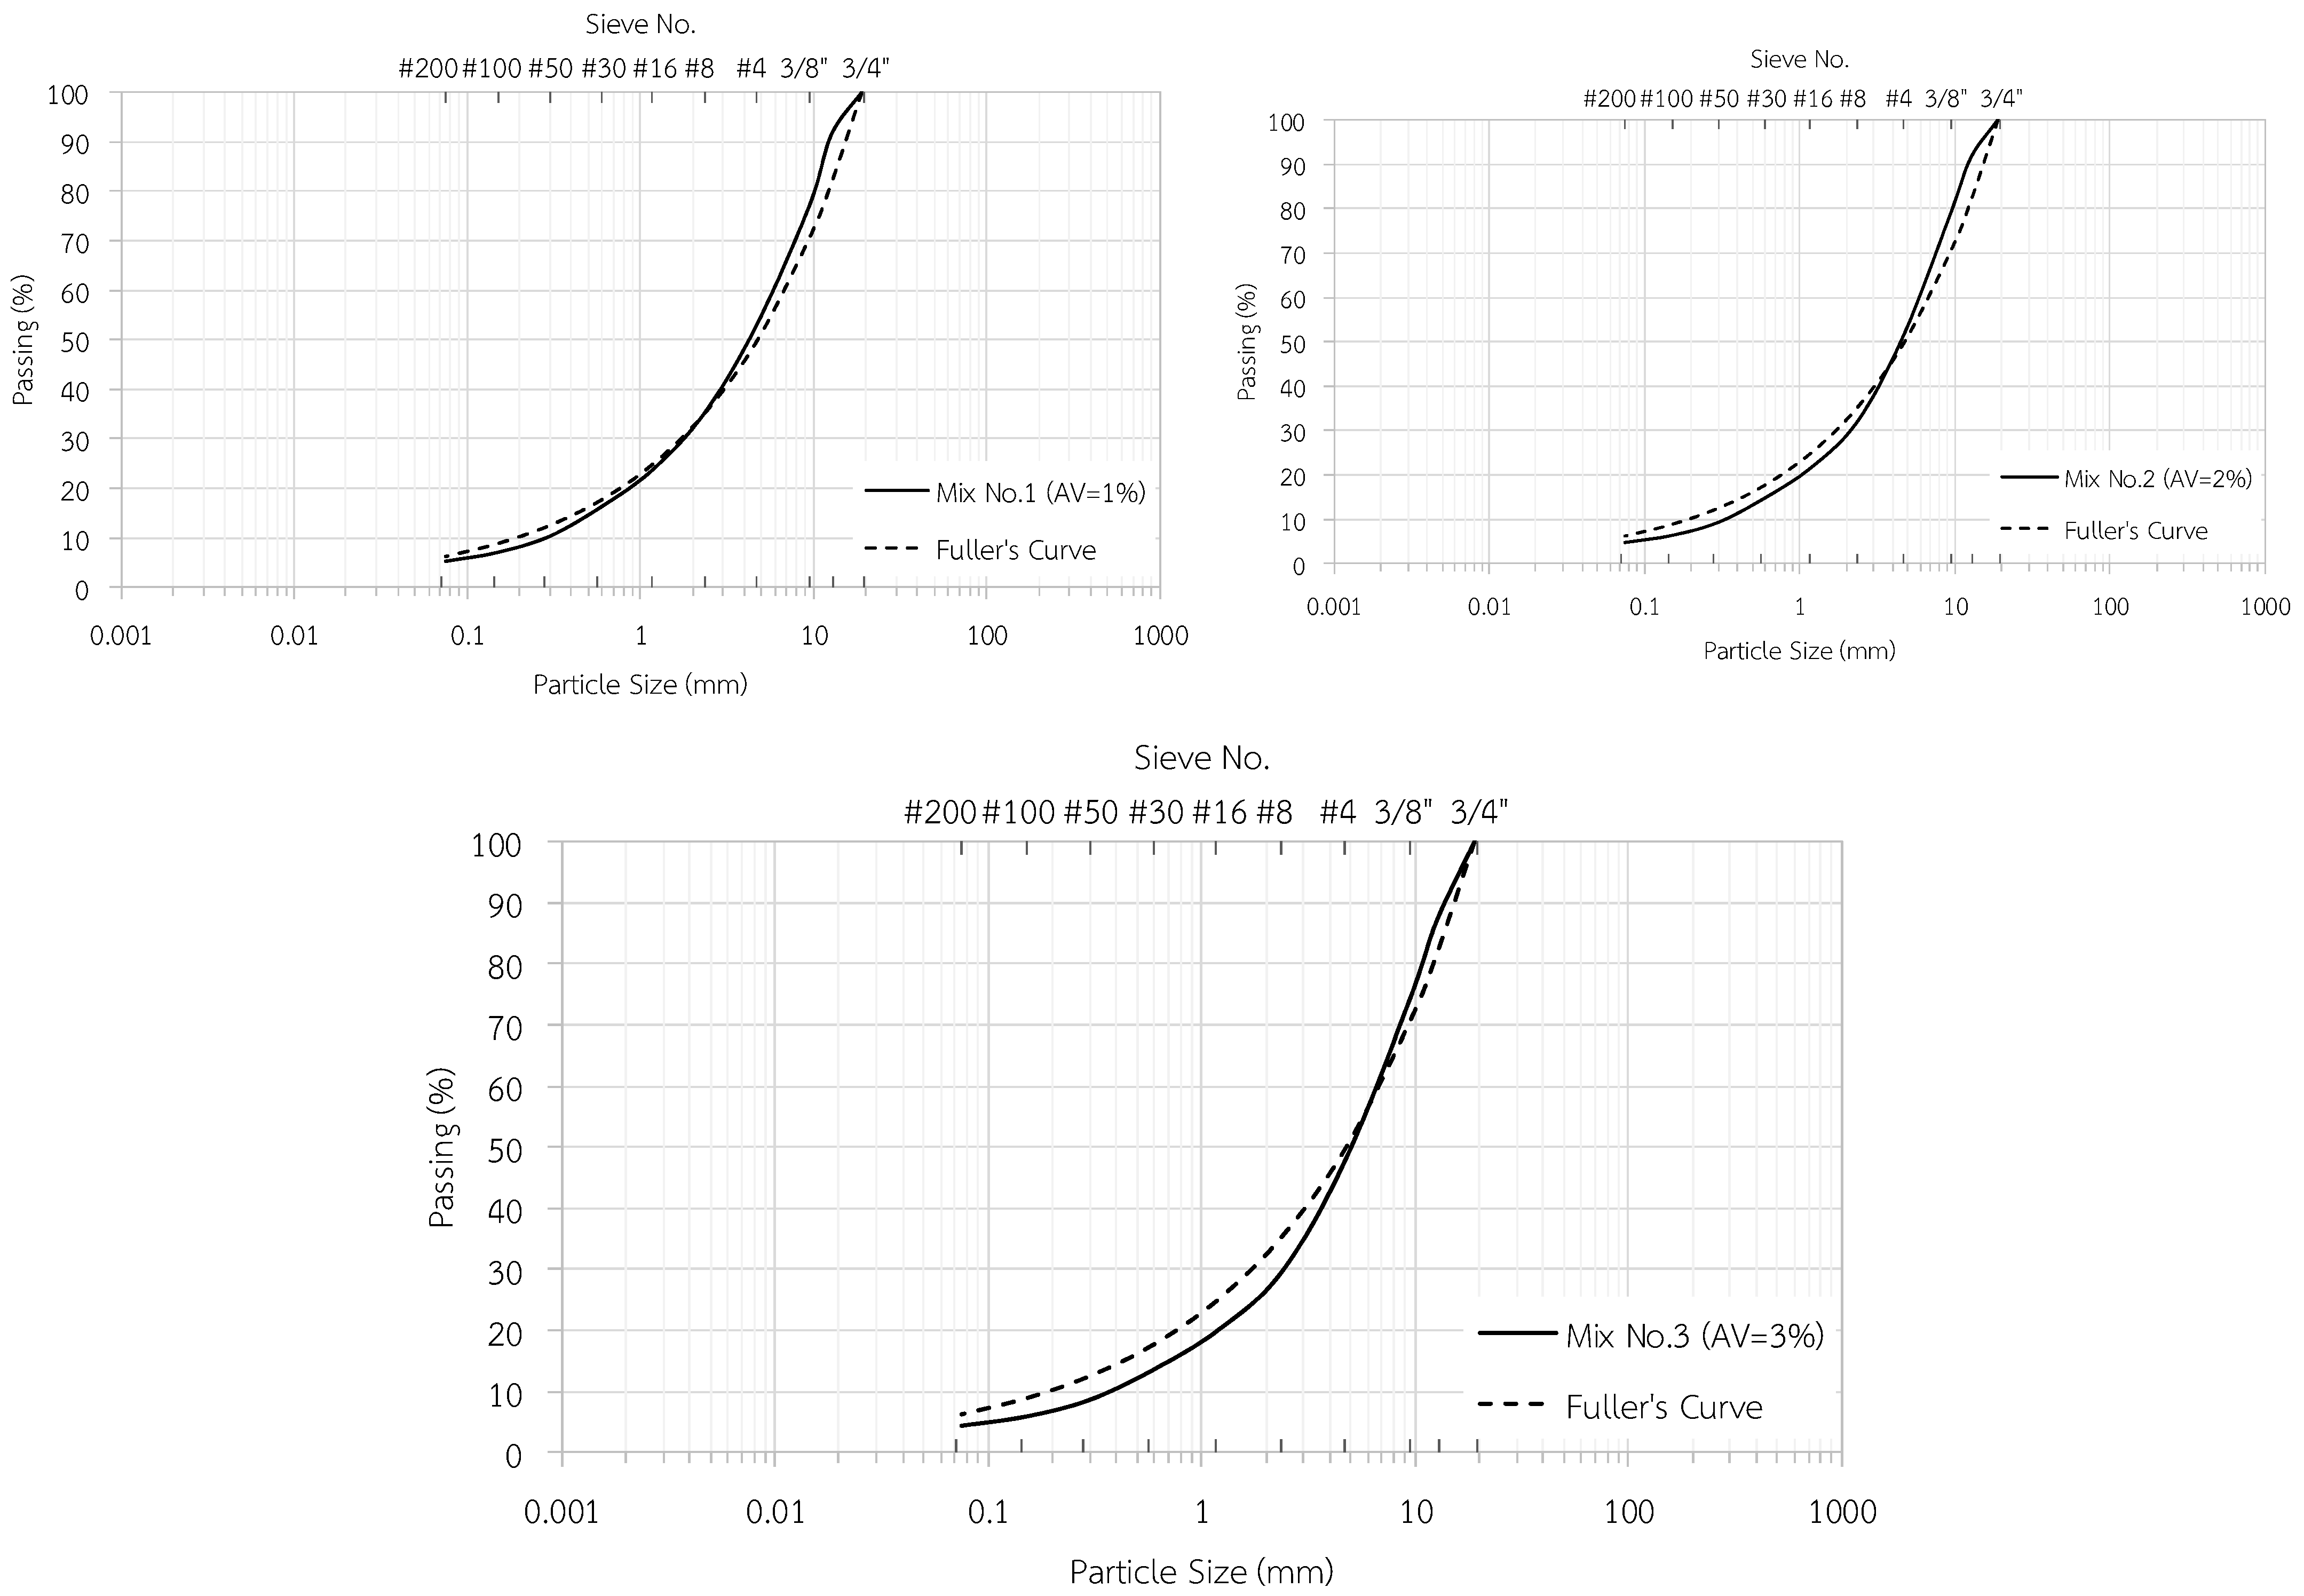
Aggregate material size gradation.
The aggregate material size gradation obtained from the design of asphaltic concrete mixtures in accordance with AV values of 1%, 2%, and 3%, with 6% AC, is plotted on a scatterplot to compare it with Fuller’s curve. Fuller’s curve is a scatterplot of aggregate size distribution that provides the appropriate density and strength characteristics of asphaltic concrete mixtures. It is illustrated in Figure 3.
As shown in Figure 3, the scatterplot of aggregate sizes obtained from the designed asphaltic concrete mixtures at AV values of 1%, 2%, and 3%, with 6% AC, closely resembles Fuller’s curve in all three cases. However, the scatterplot is closest to Fuller’s curve at an AV of 1%. This finding indicates that asphaltic concrete exhibits the most appropriate density and strength characteristics when comparing AV values of 1%, 2%, and 3%.
3.
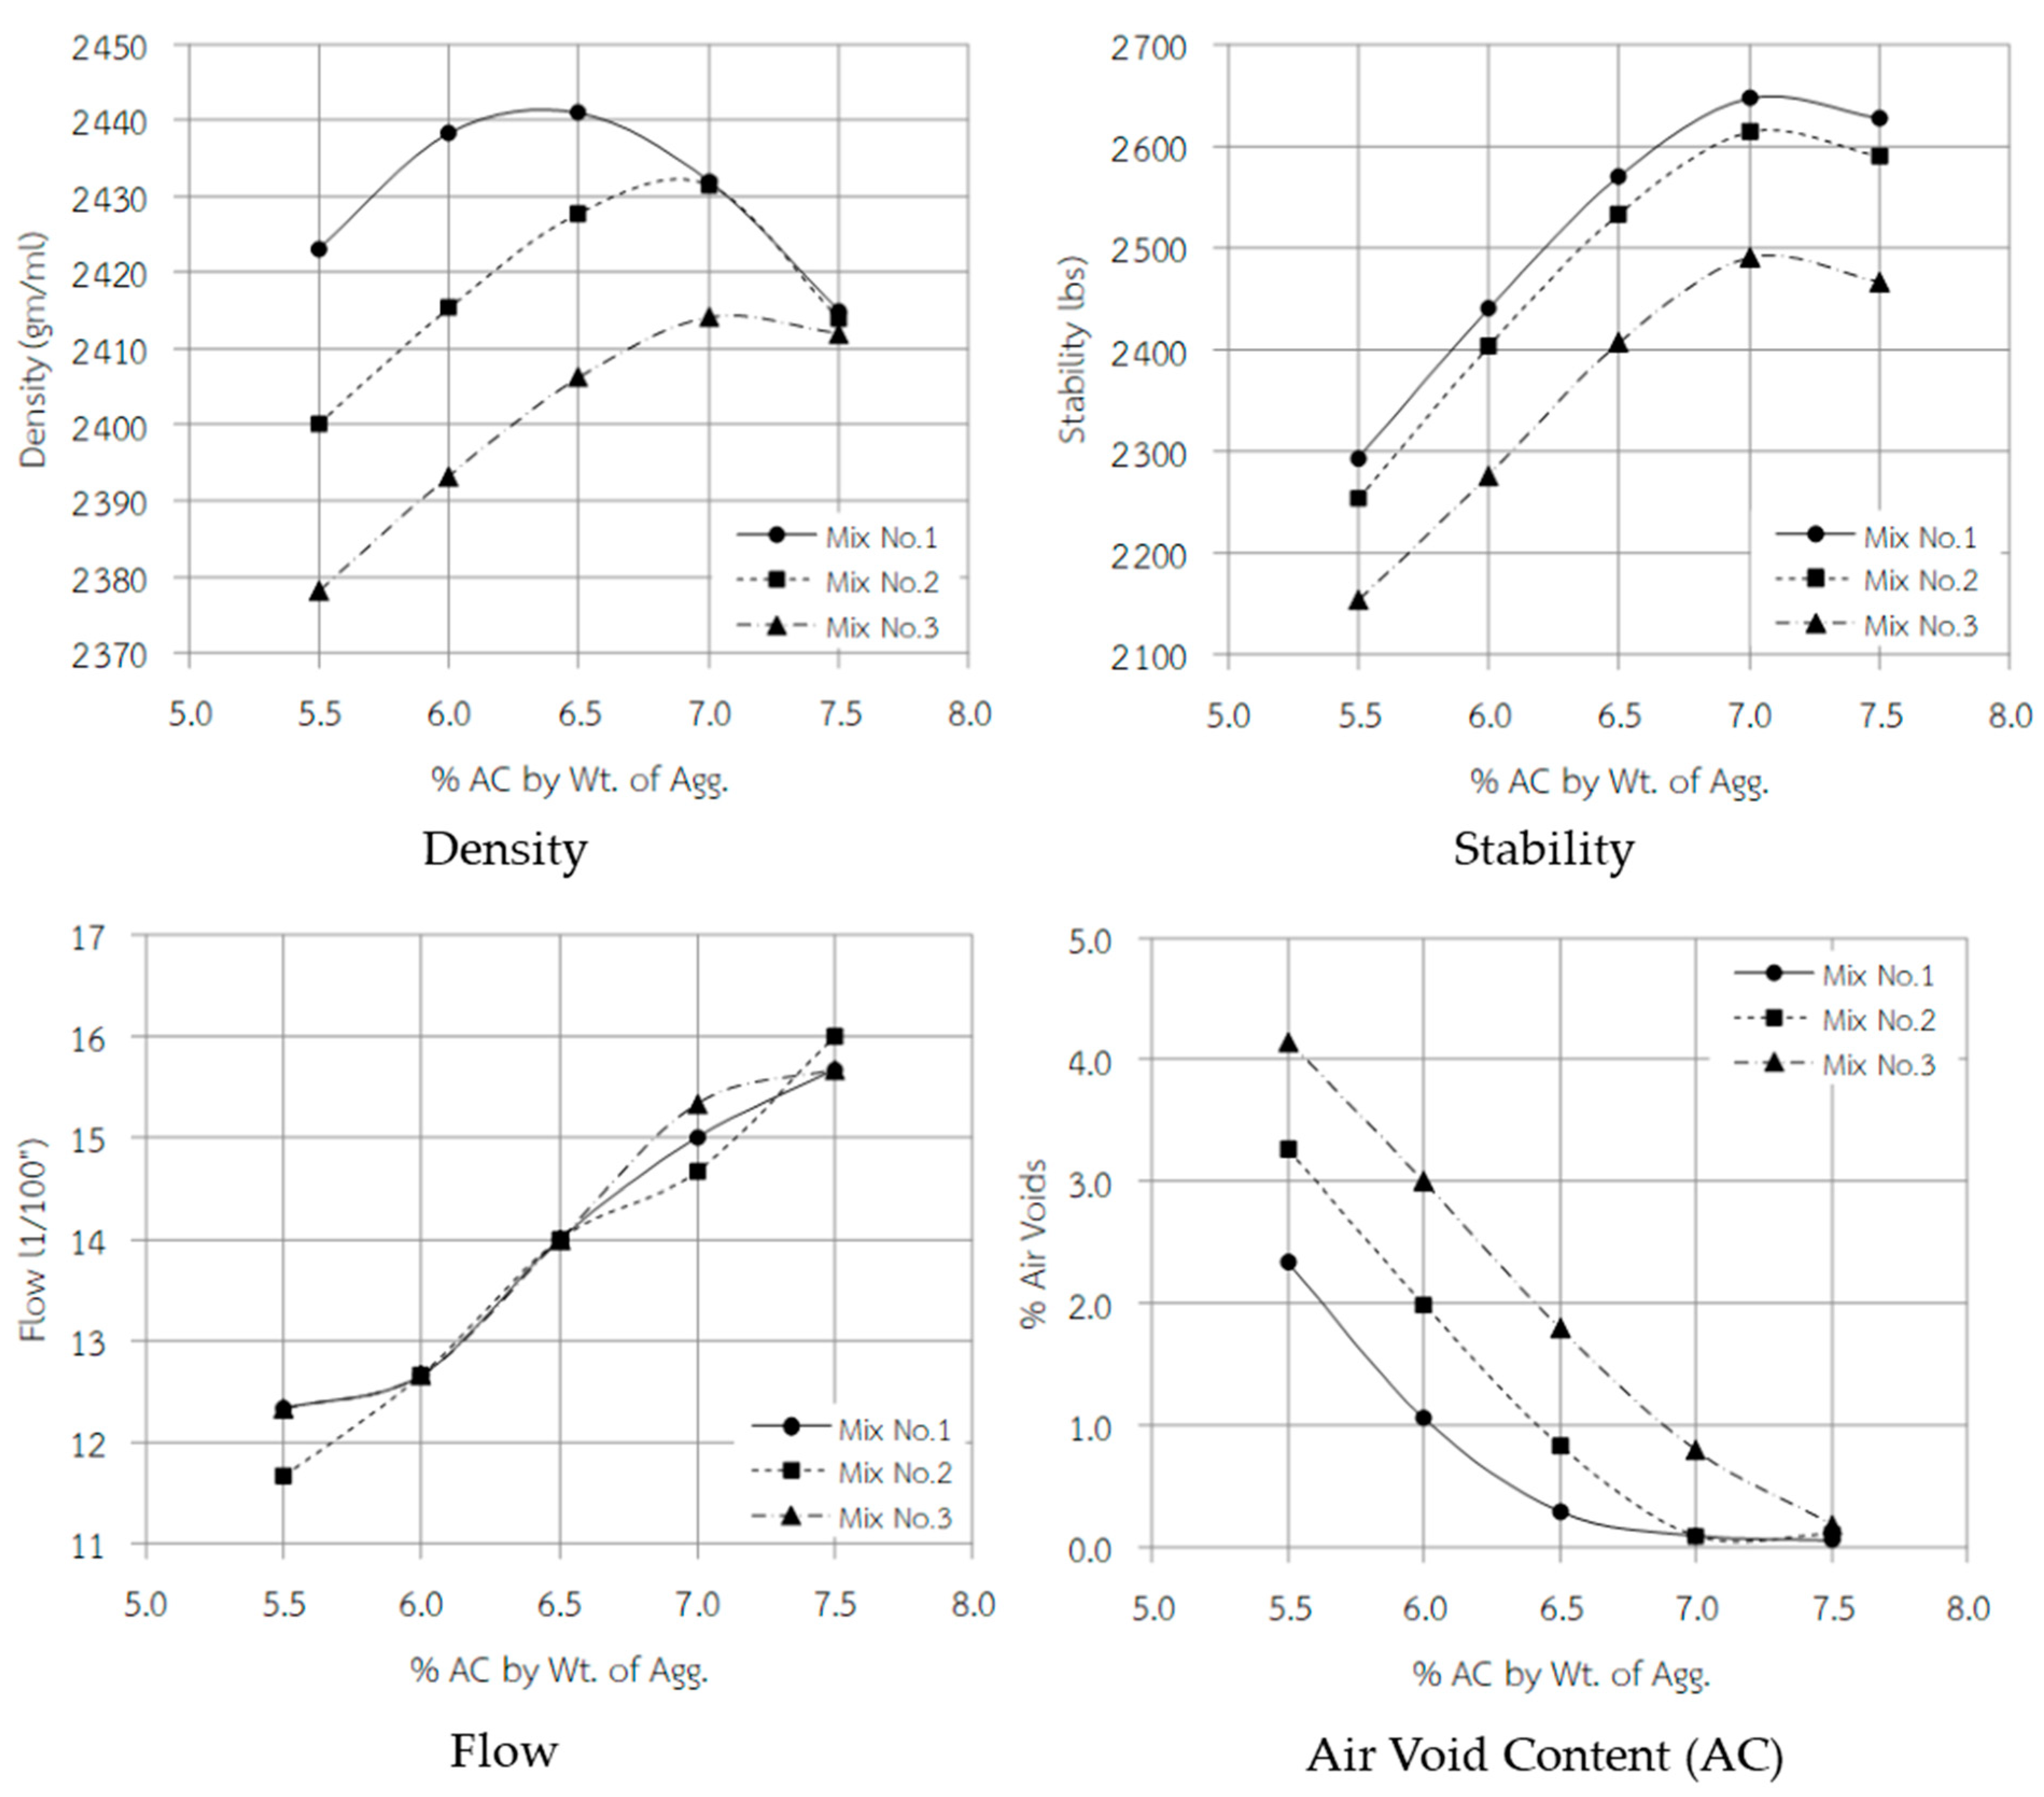
The density, stability, and flow characteristics.
The properties of the asphalt concrete designed mixtures based on AV values of 1%, 2%, and 3%, an AC of 6%, and a compaction of 98% include density, stability, and flow (Table 6 and Figure 4). A comparison of AC with density, stability, flow, and AV for the three mix designs is presented. Stability refers to the maximum resistance to deformation, while flow denotes the mobility or unit volume reduction.
Table 6 clearly shows that setting AV to 1%, 2%, and 3%, with 6% AC, results in var-ying proportions of aggregate materials. Consequently, the properties of asphaltic concrete also change in accordance with the aggregate mix proportions. Density and stability are the highest for the mix proportion with 1% AV. However, the flow values remain consistent across the three mix proportions. Further examination of the relationship between various AC values and the density, stability, flow, and AV of the three mix proportions, as depicted in Figure 4, reveals that when AC is altered between 5.5% and 7.5%, the properties of asphaltic concrete exhibit the following characteristics.
  • The density of Mix No. 1 increases until it reaches its peak at 6.5% AC, and then de-creases as AC increases. However, Mix Nos. 2 and 3 exhibit an increase in density until reaching their maximum at 7% AC, and then a decrease as AC increases. When comparing the three mix proportions, Mix No. 1 provides the highest density at each AC level, followed by Mix No. 2 and then No. 3. Notably, at 7.5% AC, the density values of all three mix proportions are nearly identical. Overall, this study suggests that the appropriate AC leads to the highest density value, depending on the aggregate mix proportions.
  • Stability values obtained from the experiments reveal that as AC increases, stability also increases until reaching its peak at 7.0% AC. Then, it decreases as AC further in-creases. This trend is observed across all three mix proportions. When comparing the three mix proportions, Mix No. 1 provides the highest stability at each AC level, followed by Mix No. 2 and then No. 3.
  • Flow values indicate the mobility or compactness of a mixture. The flow values obtained from the experiments for all three mix proportions are relatively similar at each AC level. High flow values indicate a low resistance to deformation, making asphalt concrete more susceptible to shape distortion.
  • The void content values of the three mix proportions decrease as AC increases. How-ever, when AC increases to 7.5%, the AV values of the three mix proportions are equal.
On the basis of this study, the suitable AC for use in asphalt concrete mixtures for embankment projects is between 6.0% and 6.5%. This range ensures the highest density values, ranking first and second, respectively. It yields stability values ranging from 2277 lbs to 2570 lbs, and flow values ranging from 12.67 to 14.00 (in units of 0.01 inch), with an AV below 3%. This optimal AC aligns with international research, which generally recommends an asphalt content between 5.5% and 6.5%. However, the current study specifically choses an AC of 6.0%

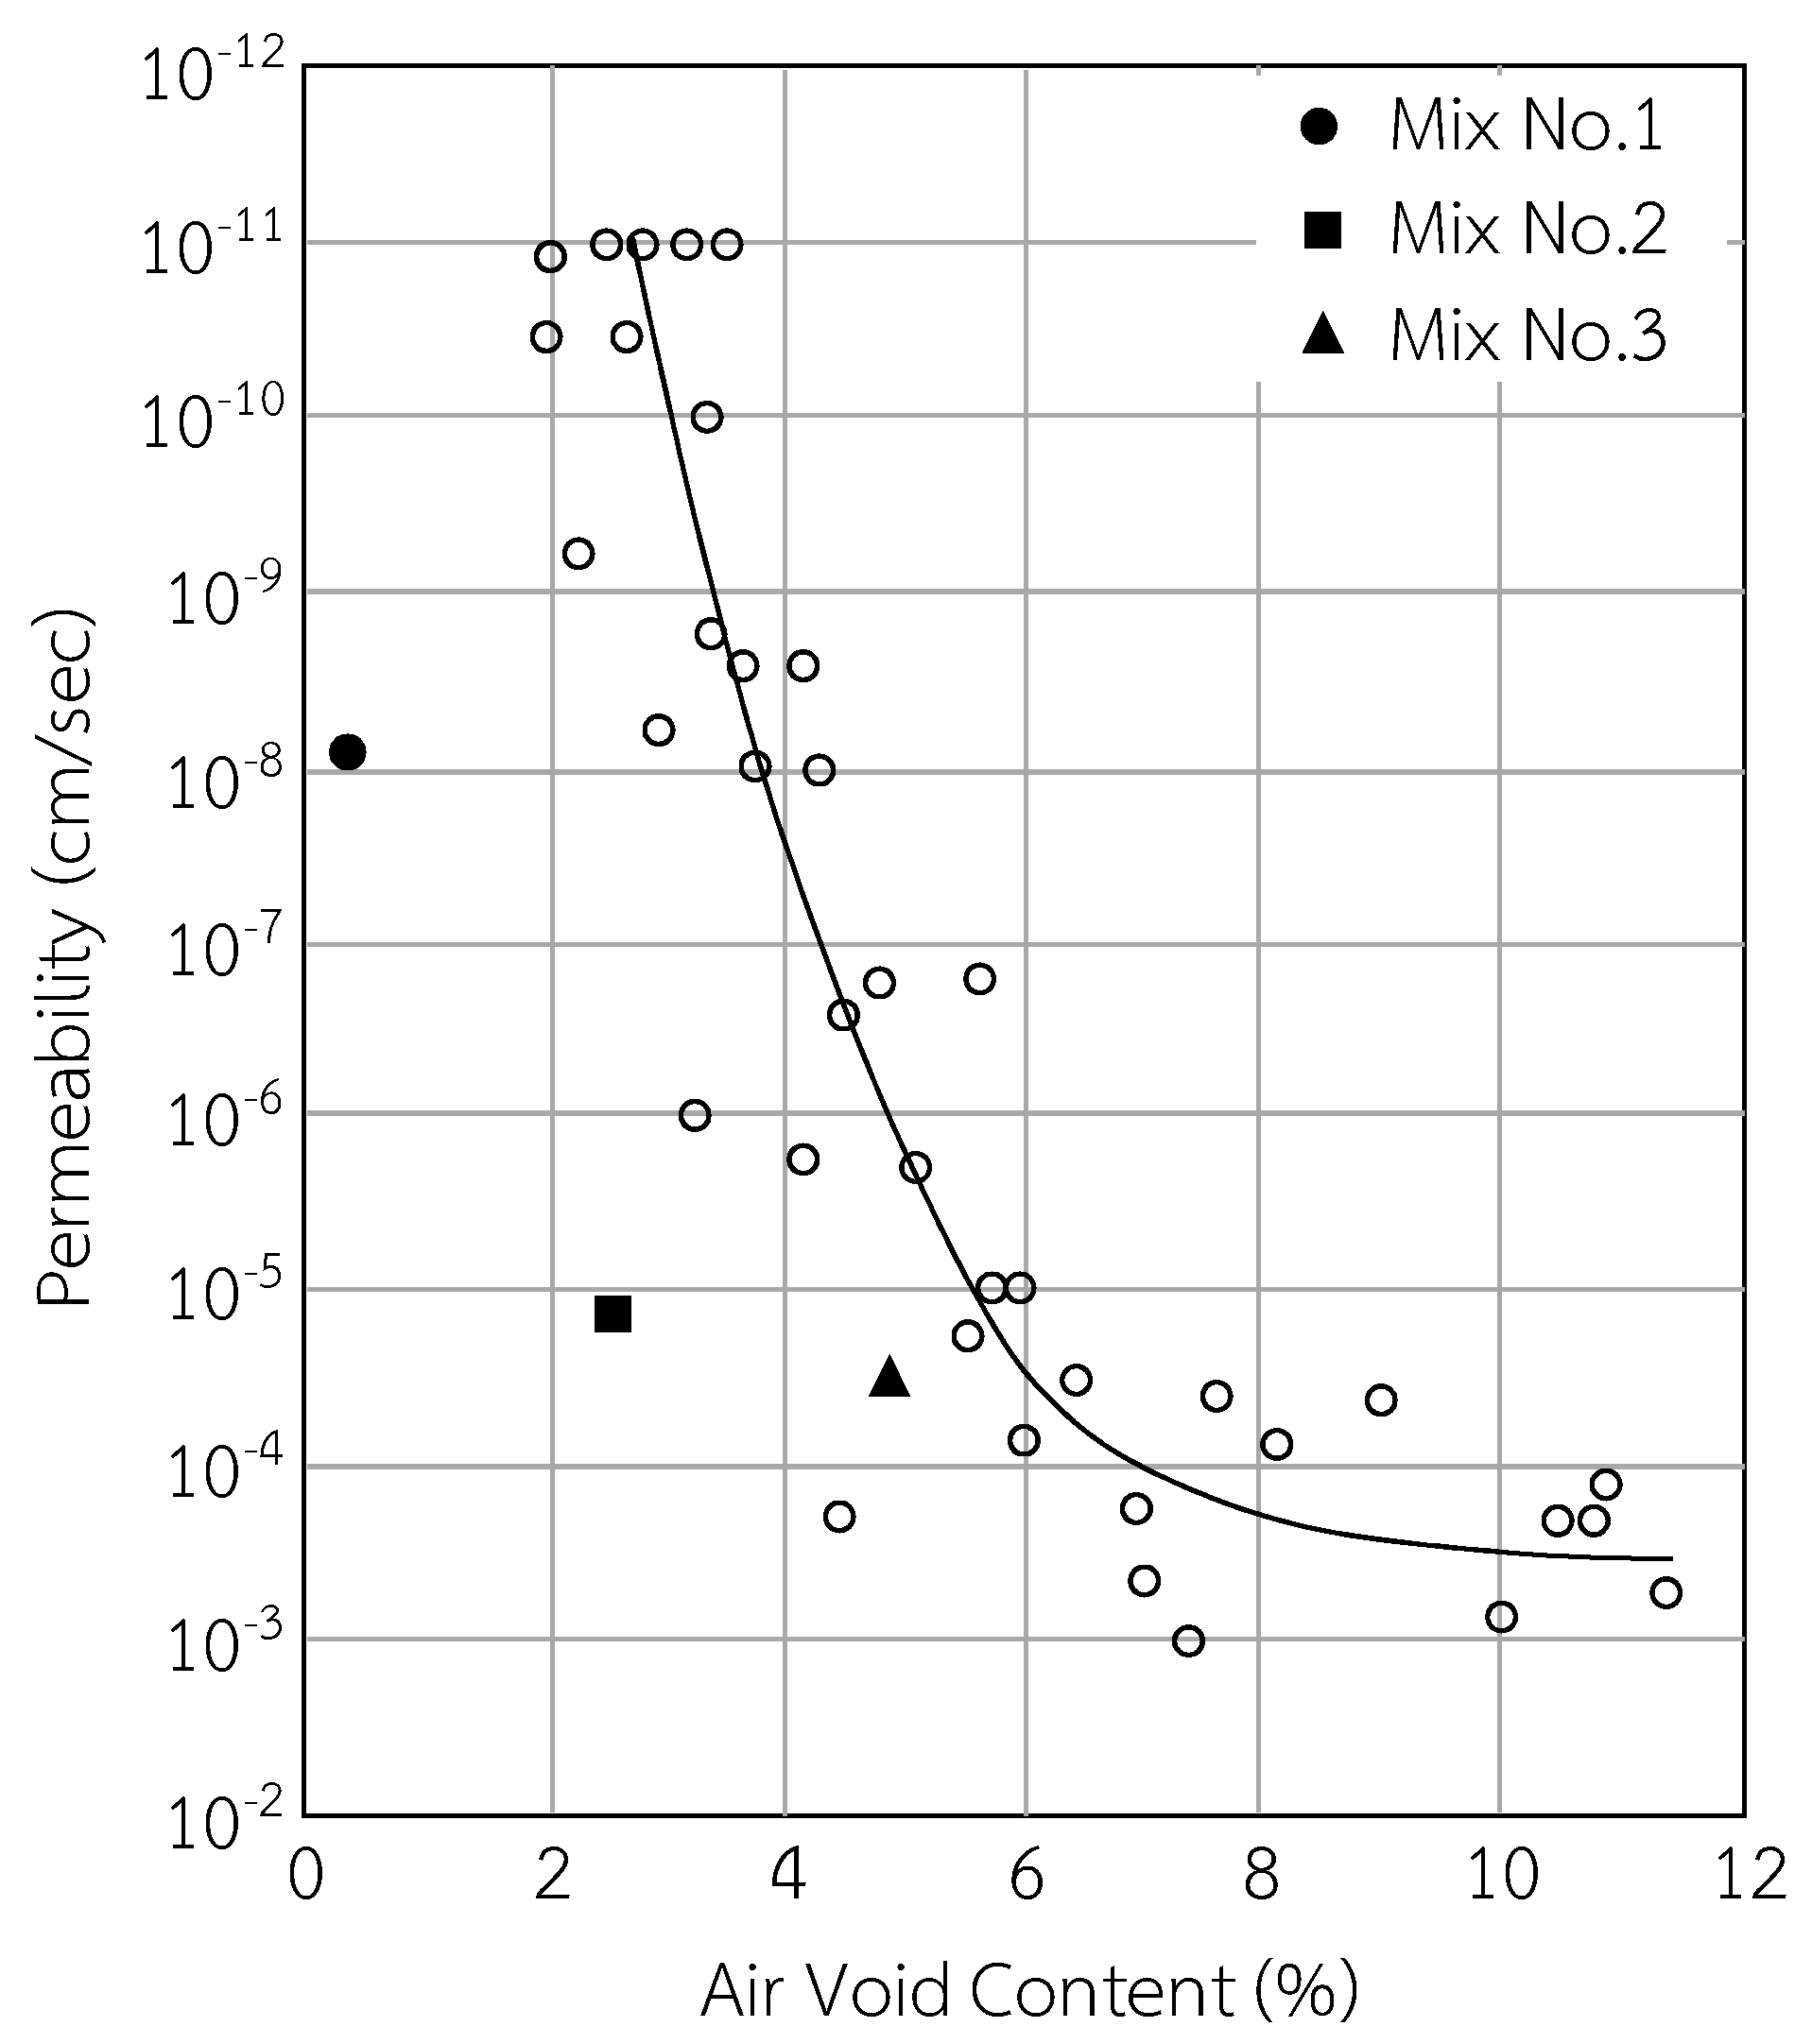
2.2.2. Analysis of Permeability Test Results

Test samples were prepared in accordance with the three mix proportions, utilizing 6% AC. The samples were tested for permeability by using specimens with AV values of 0.30%, 2.65%, and 4.71% for Mix Nos. 1, 2, and 3, respectively. The test results are presented in Table 7.
From the test results in Table 7, when test samples were prepared with different densities in accordance with the different mix proportions, a reduction in AV occurred. This reduction in AV led to a decrease in permeability, corresponding to the decreased AV. For Mix No. 1, the water permeability value was 8.50 × 10⁻⁹ cm/s, which was the lowest, indicating the highest water resistance of the material. Mix Nos. 2 and 3, with AV values of 2.65% and 4.71%, respectively, yielded permeability values close to each other but higher than 1 × 10⁻⁶ cm/s. These void contents may be unsuitable for use as an embankment core material. A plot of the permeability values was obtained from this study against AV and compared with the data from Kjaernsli et al. [27]. The relationship is depicted in Figure 5.
From Figure 5, the data show the relationship between AV and permeability values compiled from various international studies, along with the data obtained from the permeability tests conducted in the current study. The comparison of the test results with data from international research indicates that the water permeability values obtained for AV values of 0.30%, 2.65%, and 4.71% in the current study are relatively higher than those reported in international research. This finding suggests that the properties of the asphaltic concrete mix used in the current study may differ from those studied internationally.
In accordance with the relationship between AV and permeability from international research, permeability rapidly increases as AV increases. For example, at an AV of 3%, permeability is approximately 1 × 10⁻¹¹ cm/s, and it increases rapidly to 1 × 10⁻⁴ cm/s at an AV of 6%.
Based on the preliminary findings of the current study, asphaltic concrete mixtures used as core materials in embankments within a country should ideally have an AV of less than 1% to achieve permeability lower than 1 × 10⁻⁶ cm/s, in accordance with the specified criteria.

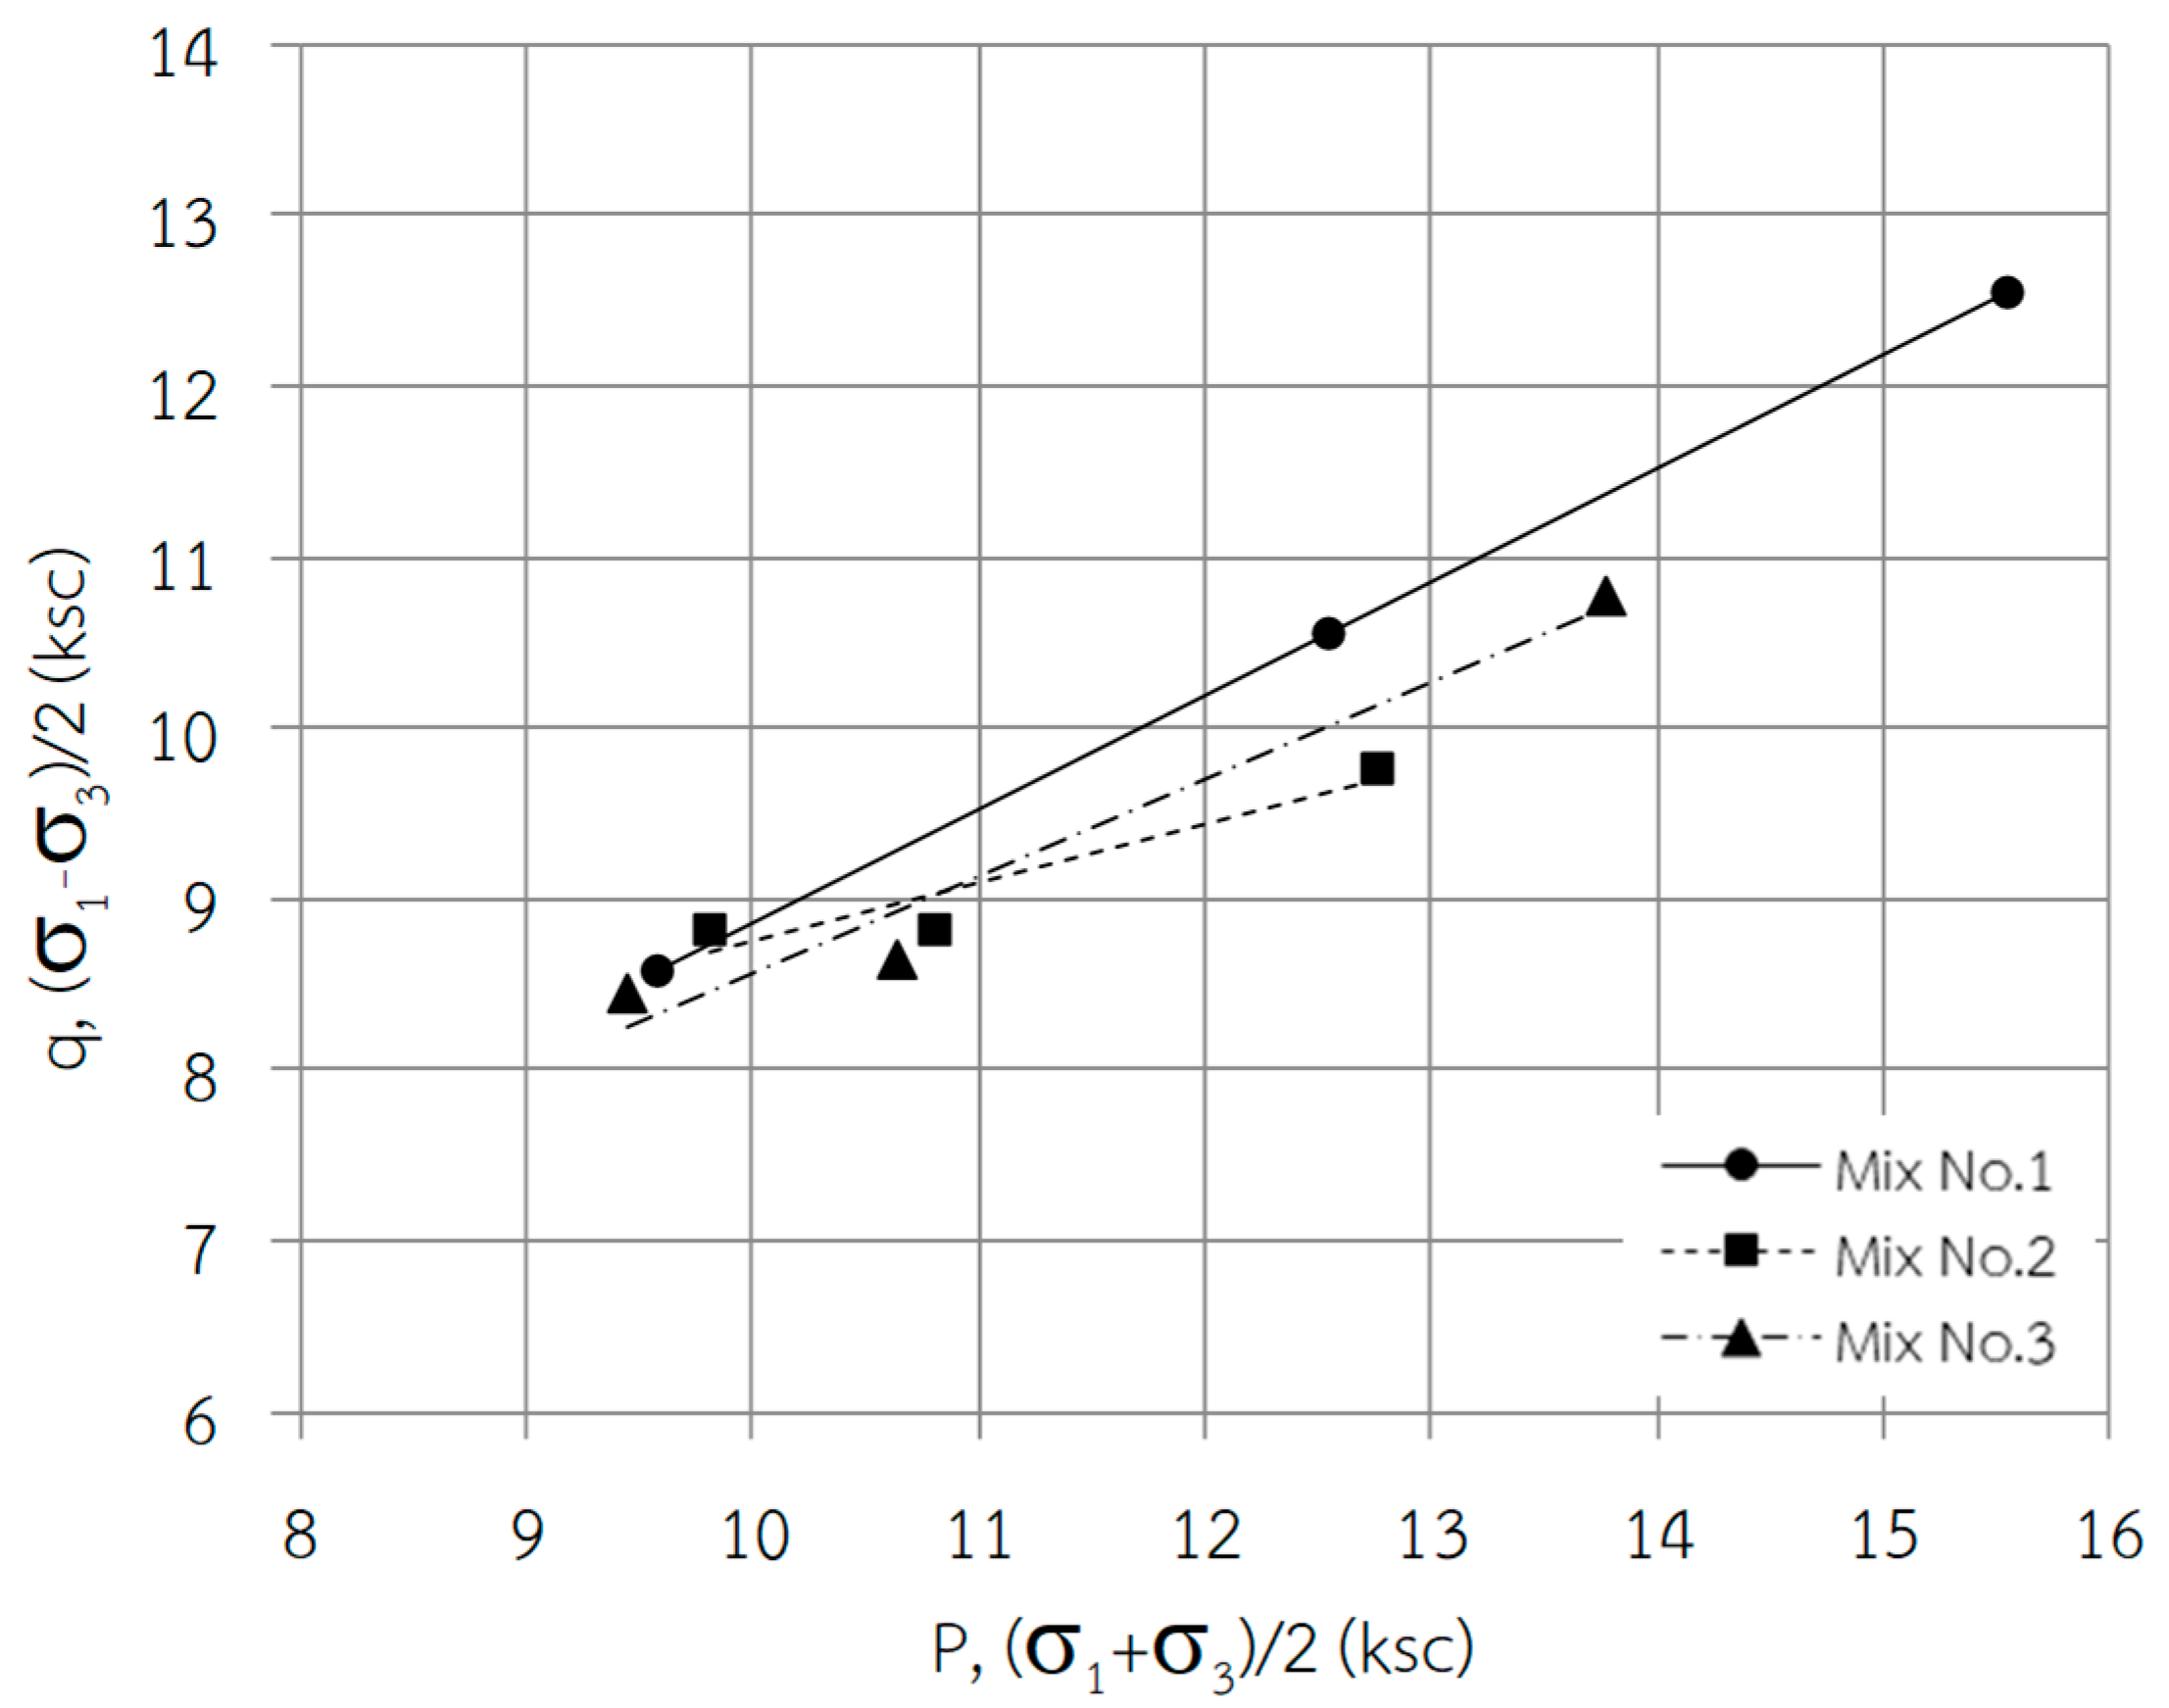
2.2.3. Analysis of Triaxial Compressive Strength Test Results

The objective of the triaxial compressive strength tests is to study the behavior of asphaltic concrete under conditions that simulate the effects of radial stress, similar to those experienced by a section of an embankment subjected to circumferential pressure. For these tests, asphaltic concrete test specimens were prepared in accordance with the three different mix proportions of the designed mixtures. An AC of 6% was utilized. The details of the test results are presented in Table 8.
The information in Table 8 is summarized from the stress–strain graphs and Mohr’s Coulomb envelope of the triaxial compressive strength tests for the asphaltic concrete specimens of each mix proportion. Three samples were tested, and each was subjected to different effective confining pressure values (σ3). The comparison at σ3 = 3 kg/cm2 (the highest) shows that for Mix No. 1, the axial stress (σ1) at failure was 28.10 kg/cm2, which was the highest among all three mix proportions. However, the Young’s modulus (Es) was 319 kg/cm2, which was not the highest among the mix proportions. For Mix Nos. 1, 2, and 3, the cohesion (c) and friction angle (ϕ) values ranged from 2.70 kg/cm2 to 4.66 kg/cm2 and from 30.23° to 45.80°, respectively.
To assess the load-bearing capacity of the asphaltic concrete specimens for all three mix proportions from the triaxial compressive strength tests, stress path graphs (which illustrate changes in stress units) were plotted, as shown in Figure 6, Mix No. 1 exhibited a higher load-bearing capacity than Mix Nos. 2 and 3.
The post-test condition of the specimens for Mix. No. 1 after the triaxial compressive strength tests is illustrated in Figure 7. The specimens tested under σ3 = 1 kg/cm2 exhibited more significant deformation and cracking compared with those tested under σ3 = 2–3 kg/cm2. Although the post-test condition of the specimens for Mix Nos. 2 and 3 resembled that of Mix No. 1, their ability to withstand stress differed.
In Figure 7, the post-test condition of the specimens for Mix Proportion 1 after the triaxial compressive strength tests is illustrated. It was observed that specimens tested under σ3 equal to 1 kg/cm2 exhibited more significant deformation and cracking compared to those tested under σ3 equal to 2 and 3 kg/cm2. Although the post-test condition of the specimens for Mix Proportions 2 and 3 resembled that of Mix Proportion 1, their ability to withstand stress differed.

2.3. Advantages of an Asphalt Concrete Core Embankment

Selecting asphalt concrete materials for constructing embankment cores can significantly improve construction efficiency and address specific challenges and conditions encountered during construction such as the following:
  • Selecting asphalt concrete materials for constructing embankment cores can significantly improve construction efficiency and address specific challenges and conditions encountered during construction.
  • Asphalt concrete’s ductile and viscous behavior makes it a suitable material for embankments in earthquake zones. This enables it to effectively support the strength of the embankment and accommodate differential foundation settlements without cracking, even at low temperatures.
  • It has been proven that asphalt concrete exhibits self-recovery (self-sealing) properties, allowing it to quickly repair any cracks that may occur due to accidental loading.
  • The core can be constructed in rainy and cold weather without delaying the construction of other sections of the embankment.
  • An asphalt concrete core embankment can be successfully constructed with lower-grade compacted rockfill than what is typically required in earlier dams of this type.
  • The asphalt concrete mix design can be adjusted to meet specific design requirements [28,29].

2.4. Determining the Geometry and Material Engineering Properties

To determine the geometry of the soil embankment model, it is combined with the core zone (impervious material), filter, and shell of the embankment. The height and width are determined by designing the embankment slope ratios of 1:2, 1:1.5, and 1:1, while the cores of the embankment are 0.3, 0.5, 0.8, and 1 m. The parameters of asphaltic concrete material were obtained partially from experiments conducted in a laboratory. The core material has two types: asphaltic concrete and clay (Figure 8). The parameters of the material are determined in the laboratory and assumed to have typical values as indicated in Table 9.

2.5. Case Study Determination

This study is to determine the analysis approach as follows:
  • Cases of different slope ratios: 1:2, 1:1.5, 1:1.5, and 1:1.
  • Cases of clay core embankment and asphaltic concrete core embankment with thicknesses of 0.30, 0.50, 0.80, and 1.00 m.
  • Cases of upstream assumption in the normal water level state and rapid drawdown state.
  • Cases of soil embankments with a surcharge load from transportation on the soil embankment.
This study applies the GeoStudio program to analyze comparison engineering properties such as seepage through the embankment, displacement, and slope stability of a clay core embankment and an asphaltic concrete core embankment [30,31,32,33,34].

3. Results

We analyze 48 cases of clay and asphaltic concrete core embankments and discuss some cases that evidently influence the behavior of the embankment. Figure 9, Figure 10 and Figure 11 present the results of the soil embankment behavior analysis. The results of seepage through the embankment, displacement, and slope stability are explained as follows.

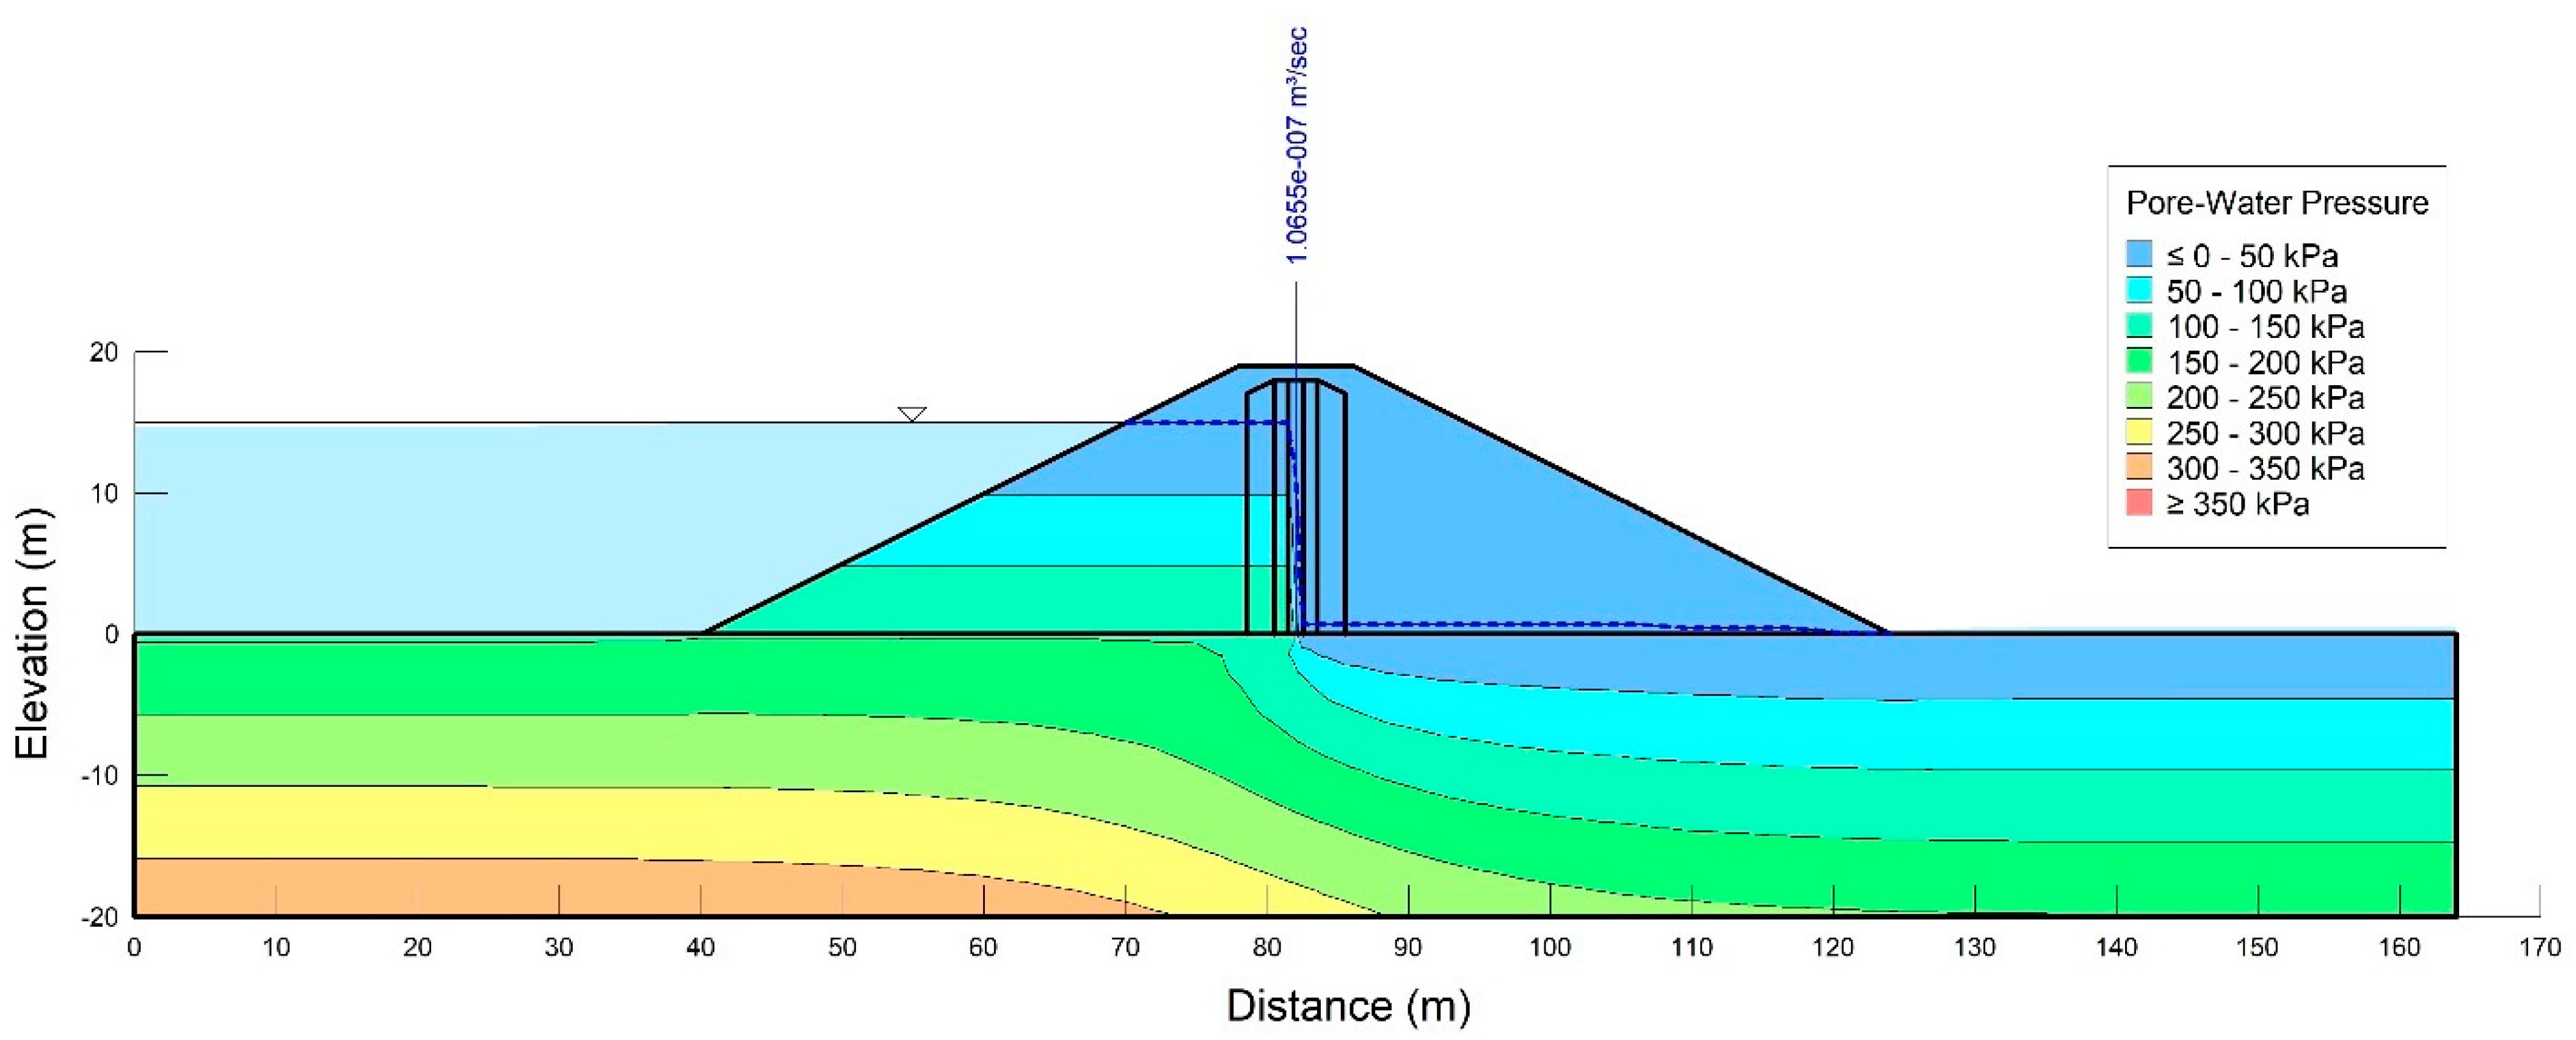
3.1. Results of Seepage Analysis through an Embankment

This study compares seepage analysis through clay and asphaltic concrete core embankments with different thickness values of 0.30, 0.50, 0.80, and 1.00 m. The result shows that the asphaltic concrete core embankment exhibits the minimum discharge passing through the core of 4.66 × 10⁻⁴ m3/day with 1 m thickness. Meanwhile, the clay core embankment demonstrates the minimum discharge passing through the core of 9.24 × 10⁻³ m3/day with 1 m thickness. To consider the correlation between core thickness and dis-charge passing through the core, increasing the thickness of the core embankment will result in less discharge. This analysis result shows that the minimum core thickness is 0.30 m, which provides maximum discharge. However, the discharge passing through the core is still extremely low compared with the standard (0.01% of the upstream volume). The results are presented in Table 10.

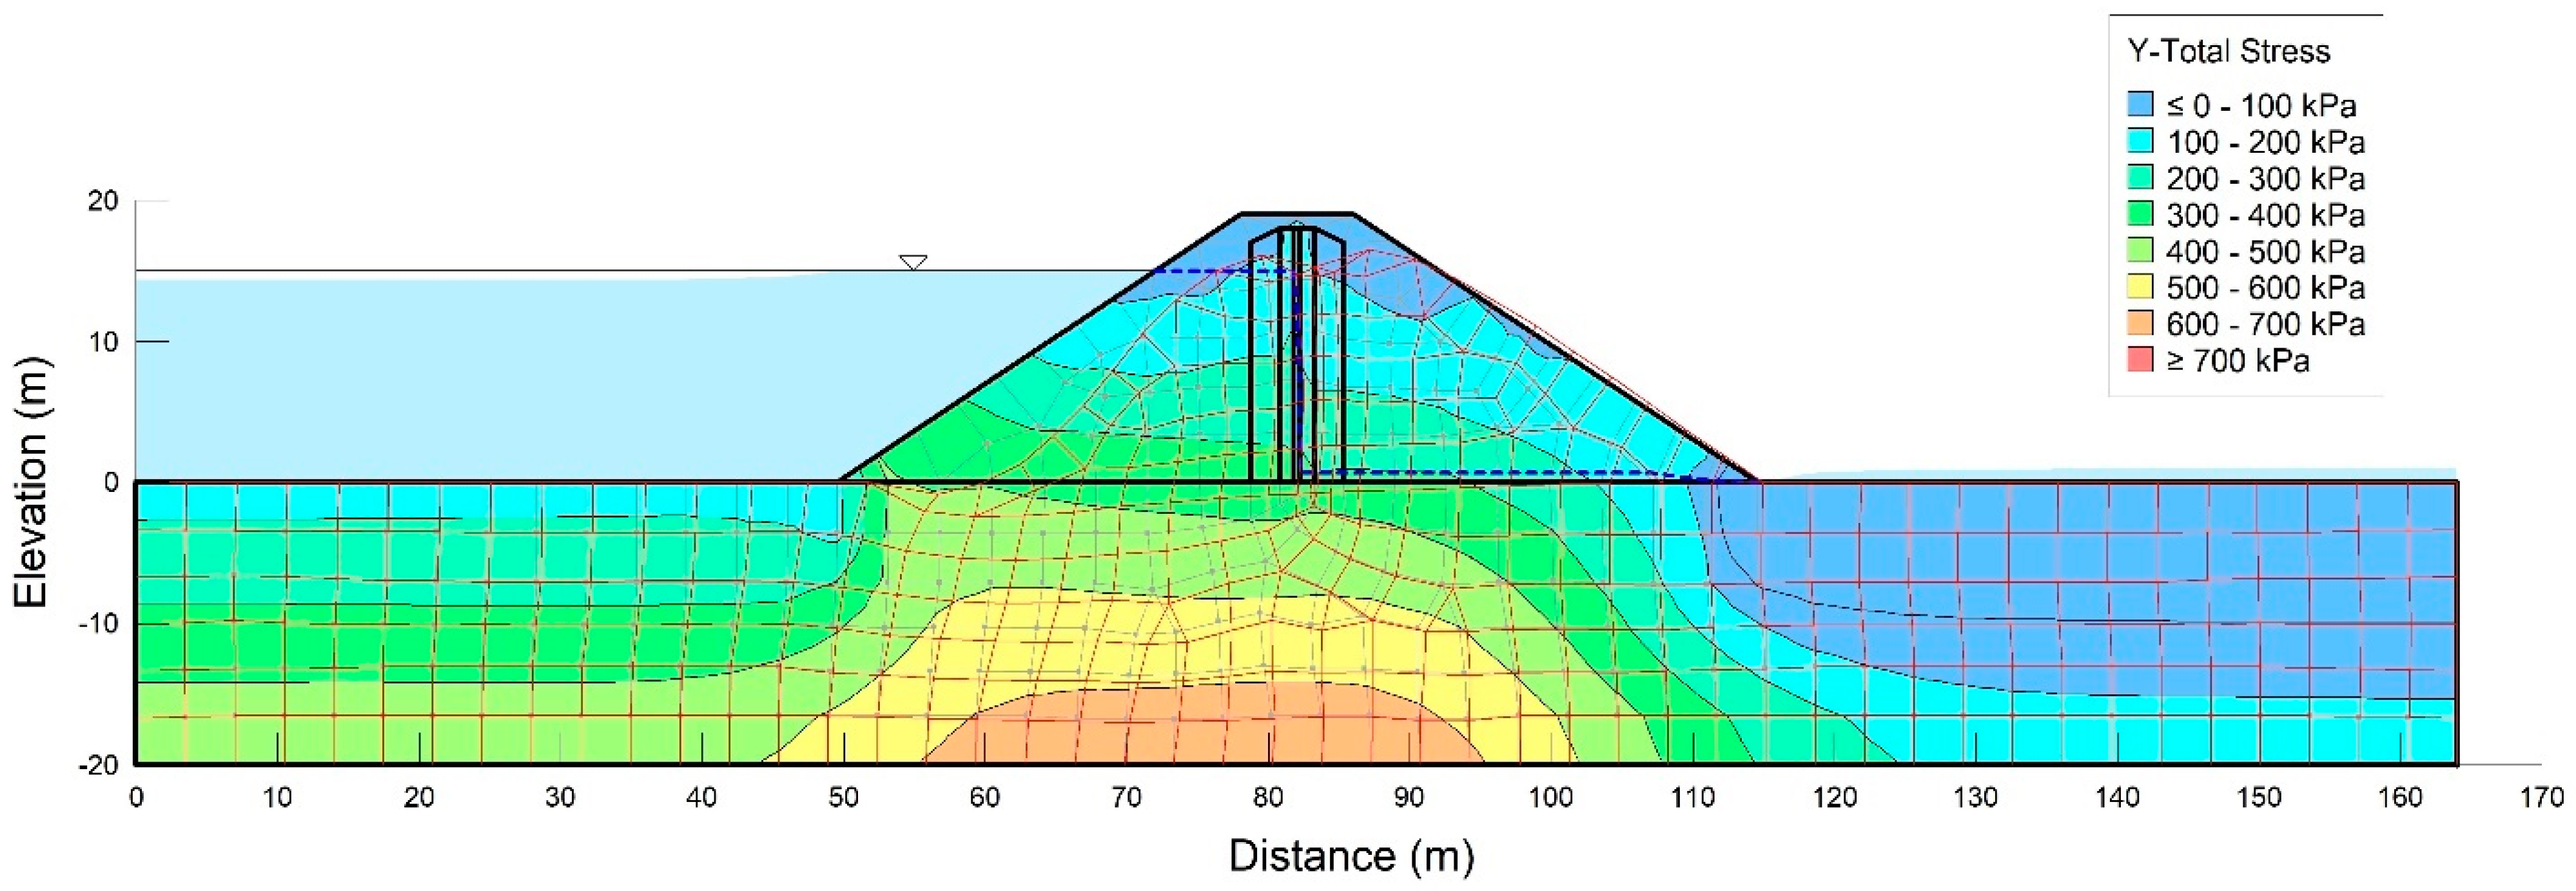
3.2. Displacement Analysis of Embankments

The displacement analysis in the case of the normal water level state compares the different slopes as 1:2, 1:1.5, and 1:1 with or without a surcharge load. The result shows that the condition slope is 1:1, and without a surcharge load, the upstream slope derives a maximum horizontal displacement of 5.5 cm. With a surcharge load of 50 kPa, the result shows that the maximum vertical displacement at the core zone is 1.6 cm.
To consider the difference in core thickness between clay and asphaltic concrete core embankments, the results in Table 11 indicate less difference in displacement. Figure 12 and Figure 13 show the displacement analysis at the slope ratio of 1:1. The figures illustrate the correlation between the vertical displacement of the core zone and the horizontal dis-placement of the upstream slope compared with the embankment height in the normal water level state with a surcharge load.

3.3. Result of the Slope Stability Analysis of the Embankment

The slope stability analysis results of the embankments by calculating FOS (refer to Table 1) can be explained as follows.
Clay and asphaltic concrete core embankments in a rapid drawdown state with and without a surcharge load have derived FOS values for upstream slopes of 1.2 to 0.7. The case of the slope ratio 1:1 provides the minimum FOS for all cases, as indicated in Table 12 and Table 13.
The study conclusion is to explain how seepage through the embankment has been influenced by two factors, the core thickness and core material, whereas the displacement of the soil embankment relates to three factors, the slope, water level state, and surcharge load. The slope stability of the embankment is the most sensitive factor due to influences from four factors. We summarize the factors that influence to the behavior of the soil embankment for designing in Table 14.

4. Discussion

4.1. Seepage through an Embankment

The thickness of the core embankment, 1 m and 0.3 m, exhibits a 10-times-different discharge passing through the core. Decreasing the core thickness reduces the seepage through an embankment.

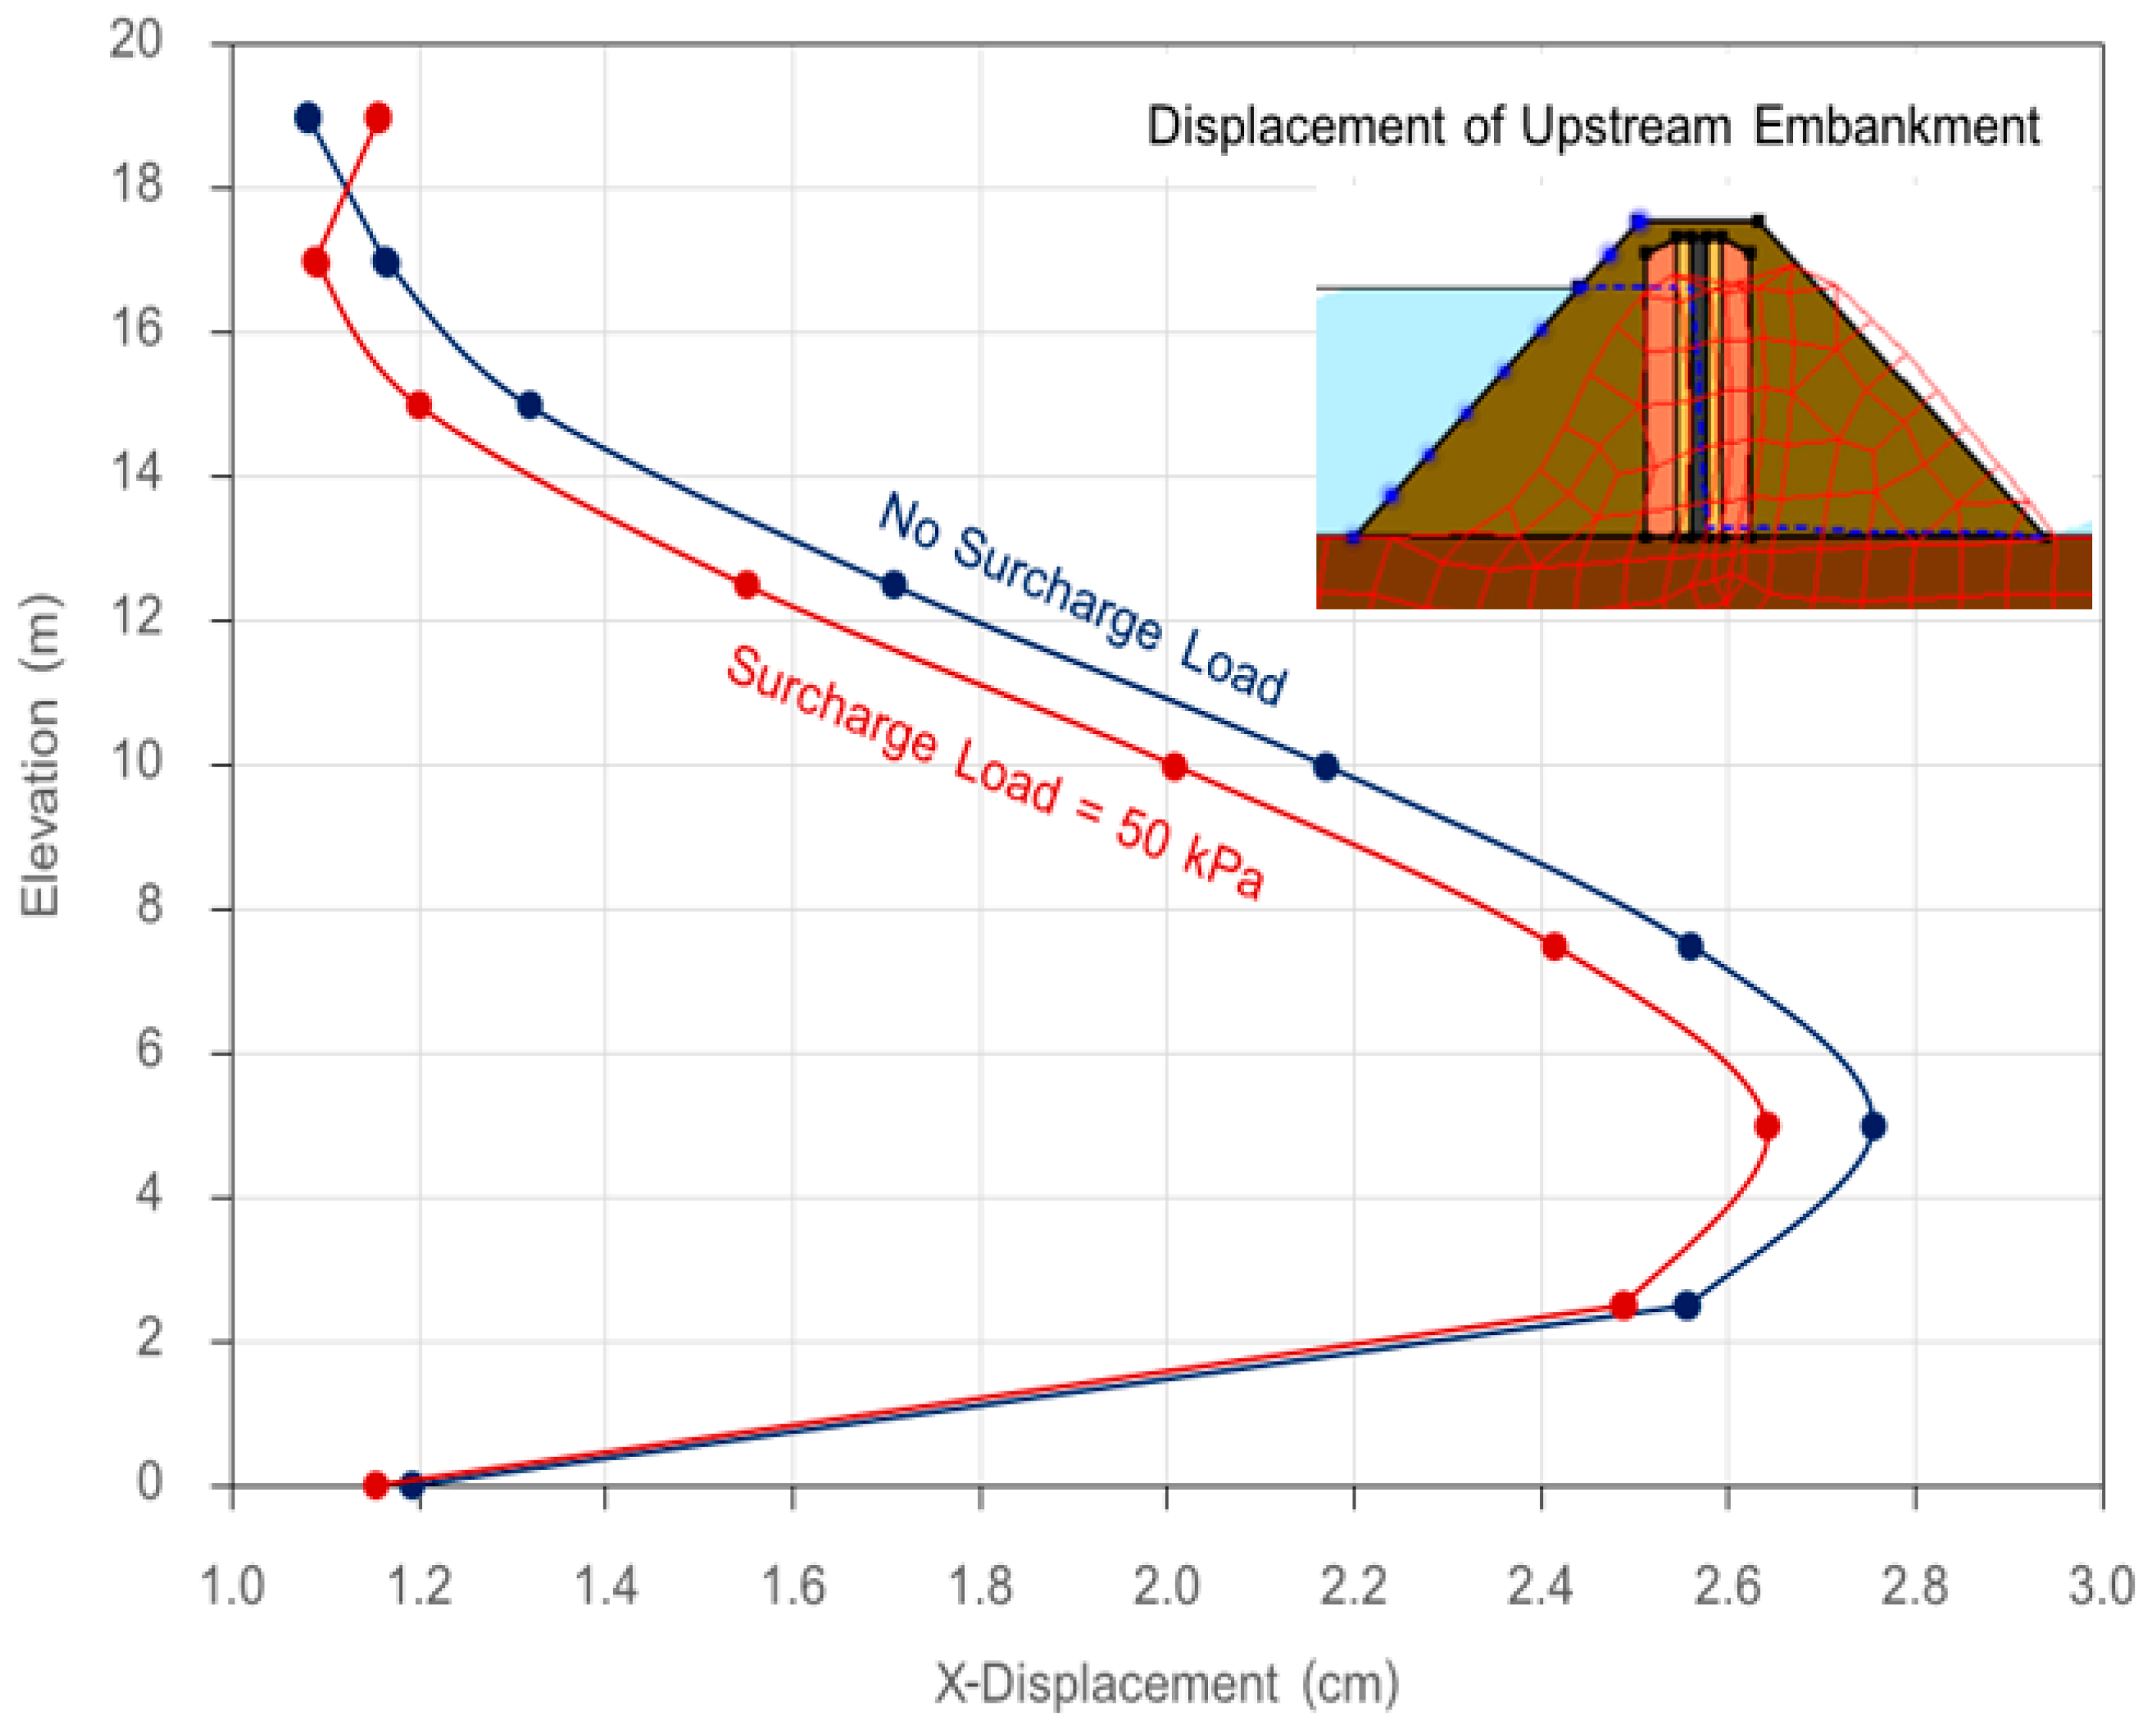
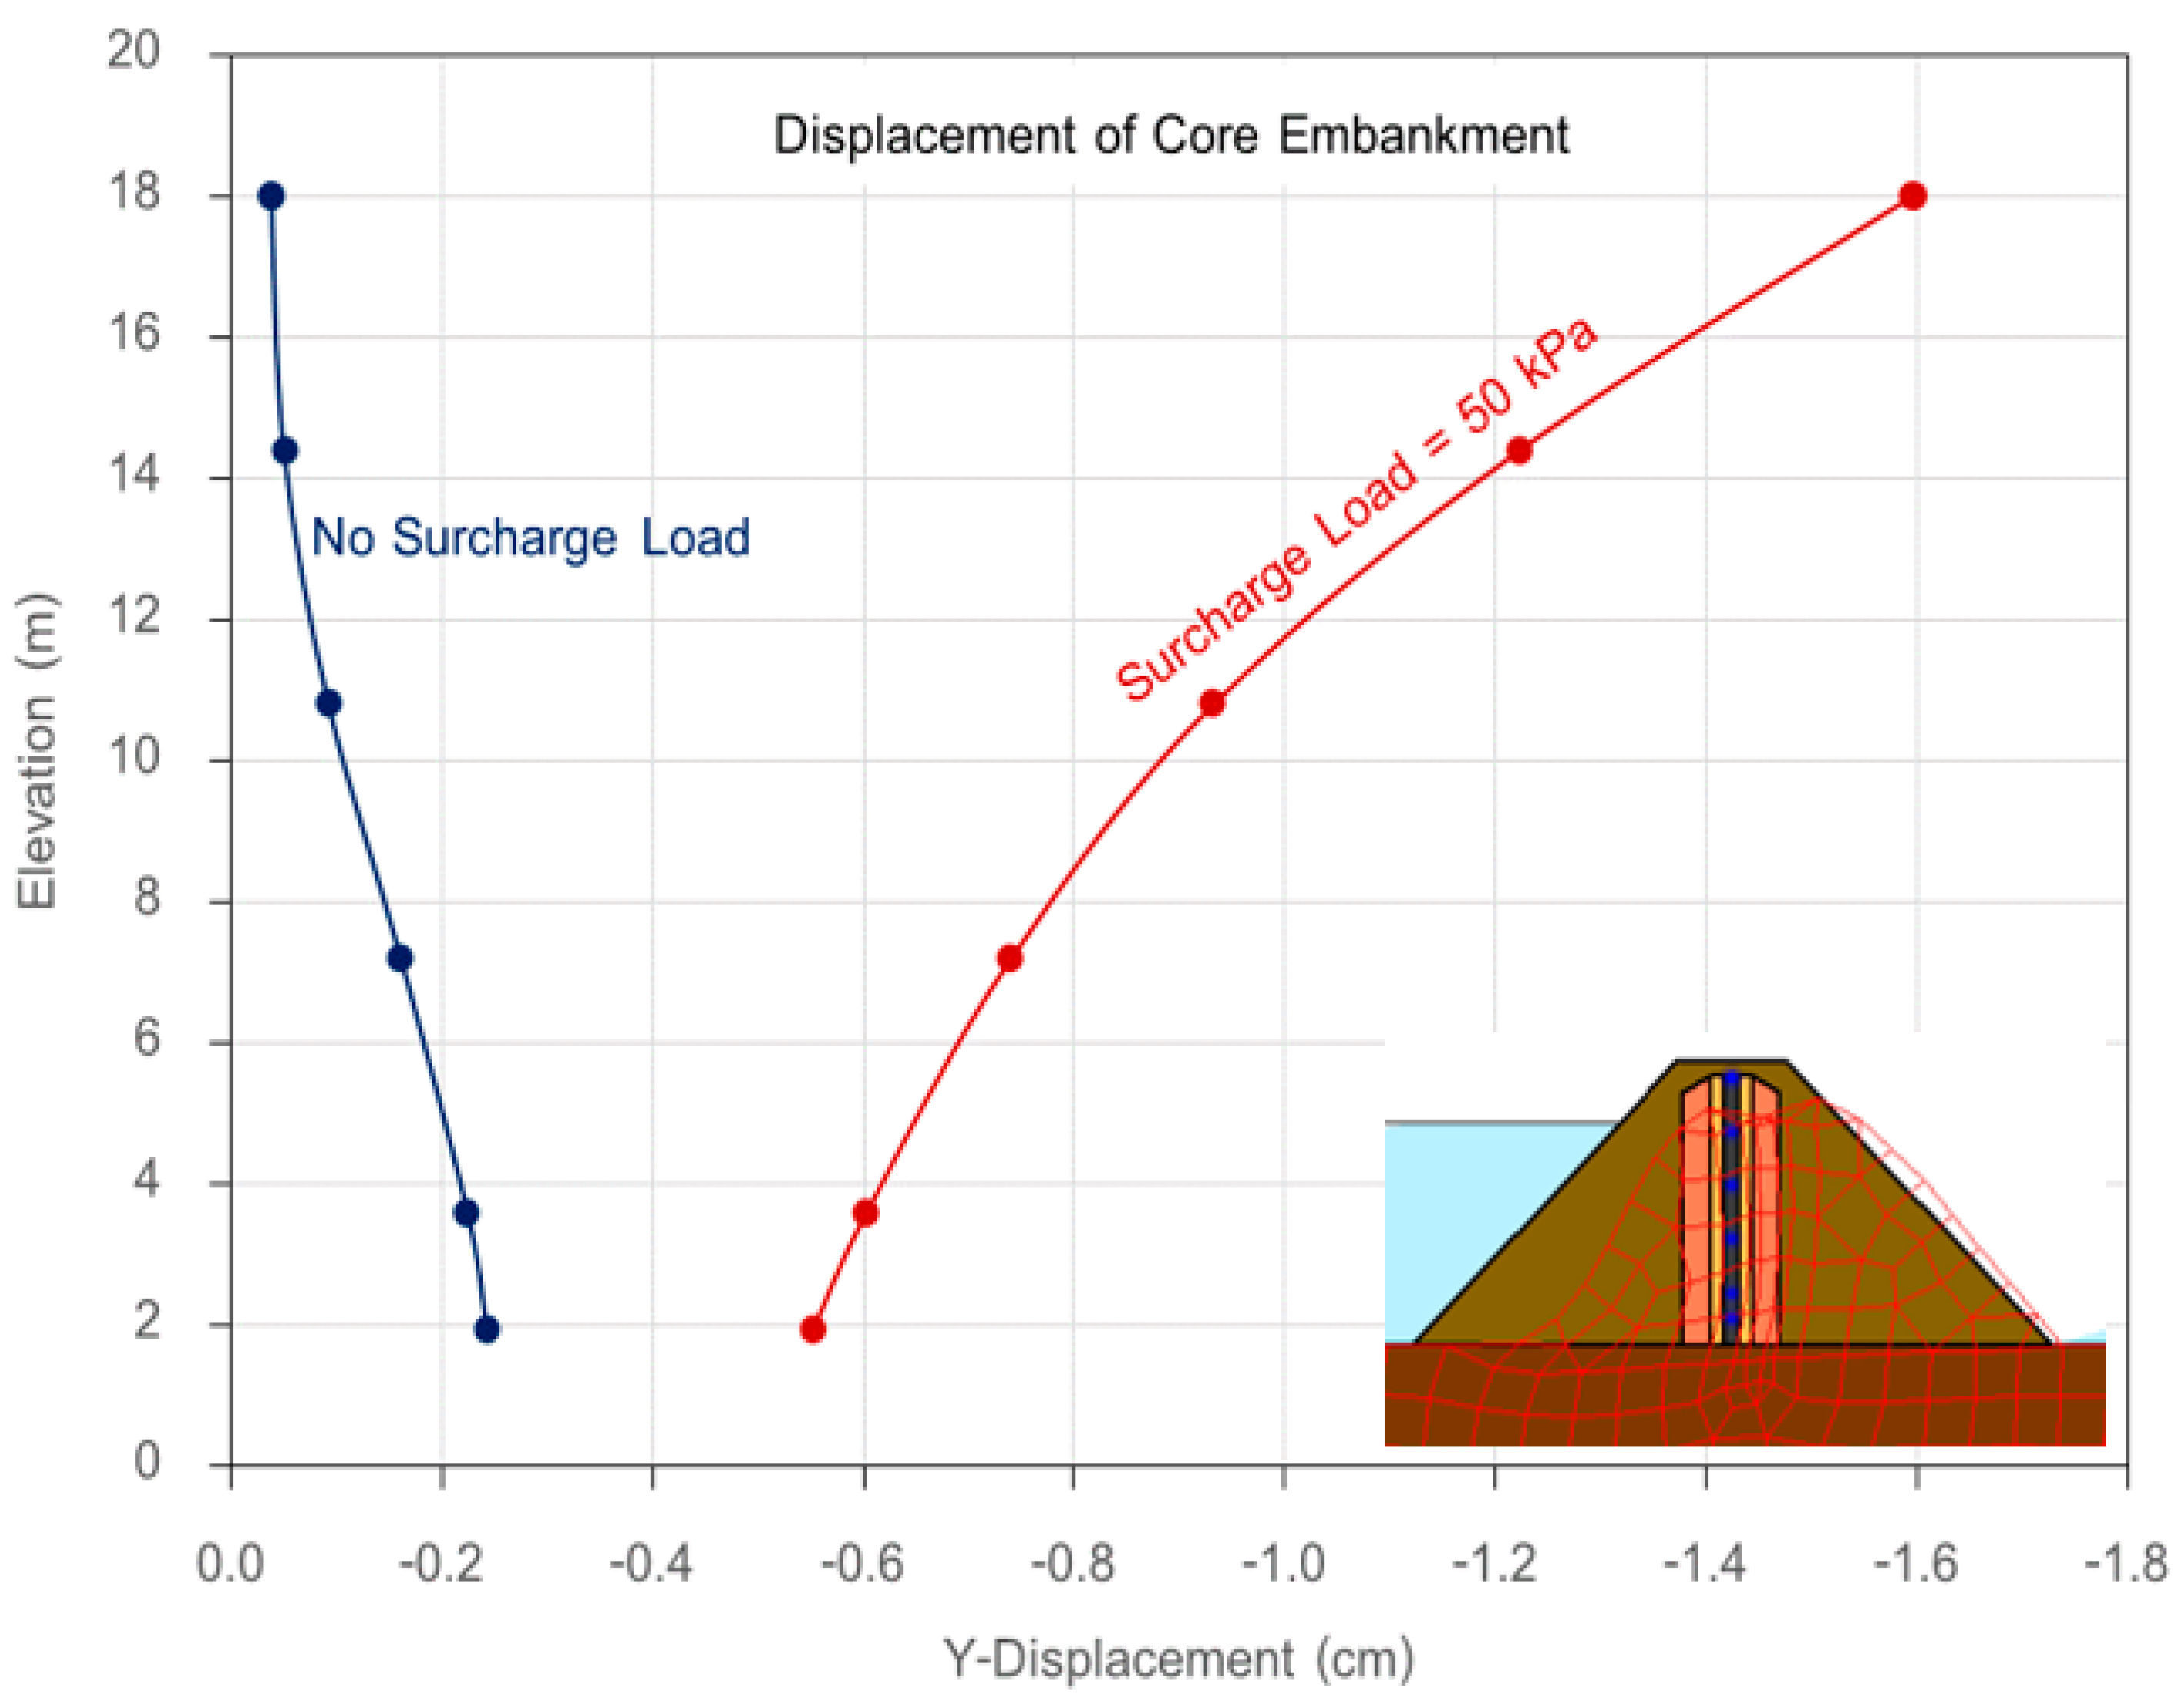
4.2. Displacement of Embankment

The difference in core thickness between clay and asphaltic concrete core embankments presents less difference in displacement.
The displacement has evidently changed when the embankment slope reacts with a surcharge load. Hence, displacement is influenced by a surcharge load.
As the slope ratio increases, the vertical displacement of the upstream slope with the normal water level decreases. Conversely, the horizontal displacement is increased.
To discuss the displacement of the core embankment when the slope is increased with a surcharge load, displacement in the vertical and horizontal directions is increased.

4.3. Stability of the Embankment

The factors that noticeably influence FOS on the upstream embankment slope are the slope ratio, core material, water level state, and surcharge load. The core thickness exerts less influence on FOS. To compare the core materials of asphaltic concrete and clay, asphaltic concrete core embankment derives a higher FOS on the upstream embankment slope than the clay core embankment, particularly in the case of the rapid drawdown state on the slope ratios 1:1.5 and 1:1 (only the FOS of the upstream embankment slope is less than the standard in Table 1).

5. Conclusions

Through an analysis of various embankment models to study the behavior of the seepage through an embankment, displacement, and the stability of the slope, the results can explain the factors that influence the stability of the embankment, such as the core material, embankment slope, core thickness, water level state, and surcharge load. Therefore, embankment design must consider and analyze these significant factors that are possibly related to the design concept.
In accordance with model analysis and the study of embankment behavior, asphaltic concrete has suitable characteristics for use with substituted clay. The seepage of asphaltic concrete is less than that of clay, resulting in less displacement of the core embankment. It also achieves a higher FOS of the upstream embankment slope than clay.
On the basis of the analysis, the worst-case scenarios for each aspect of the study are as follows.
  • Water seepage through the concrete core axis: When the asphalt concrete core axis is 0.3 m-thick, the highest seepage rate observed is 15.1 × 10⁻⁴ m3/day. Compared with a clay core, the seepage rate through the asphalt concrete core is approximately 10-times lower.
  • Movement of the core axis: For a slope of 1:1, asphalt concrete and clay cores exhibit the highest movement. In this scenario, the vertical movement is 1.6 cm with a load of 50 kPa, while the horizontal movement is 2.7 cm.
  • Stability of dam slope: Under rapid drawdown conditions with a loading of 50 kPa and a slope of 1:1, asphalt concrete and clay cores have similar safety factors above water, with values of 0.8 and 0.7, respectively.
The results of this study inform responsible agencies for water management, particularly in the case of embankment construction, by proposing the utilization of asphaltic concrete as an alternative construction material for the core of embankments. The country lacks clay materials for embankment construction, and thus, these materials are very ex-pensive to transport over long distances. Eventually, asphaltic concrete will be able to re-place clay soil. Applying the related parameters to a proper design concept can achieve investment cost control and effective management of the investment budget. In addition, the results of this study point out changes in the application of alternative materials that reduce the destruction of the environment because they can considerably reduce the amount of construction resources needed.

Author Contributions

Conceptualization, C.R. and S.J.; methodology, C.R., S.J. and T.W.; software, C.R. and T.W.; validation, C.R., S.J. and O.S.; formal analysis, C.R., S.J. and T.W.; writing—original draft preparation, C.R.; writing—review and editing, S.J. and O.S. All authors have read and agreed to the published version of the manuscript.

Funding

This research received no external funding.

Institutional Review Board Statement

Not applicable.

Informed Consent Statement

Not applicable.

Data Availability Statement

The data used in this research have been properly cited and reported in the main text.

Acknowledgments

The authors wish to acknowledge the Royal Irrigation Department of Thailand for data support and license of Geo Studio software (Serial Number: 6890-115064-101500-4682).

Conflicts of Interest

The authors declare no conflicts of interest.

References

  1. Ps, M.A.; Balan, T.A. Numerical Analysis of Seepage in Embankment Dams. IOSR J. Mech. Civ. Eng. 2014, 4, 13–23. [Google Scholar]
  2. Zamanizadeh, A.; Heidarnejad, M.; Bordbar, A. Investigating the Effect of Seepage on Earth Dam Using Geostudio (Case Study “Jereh” Dam Reservoir. J. Water Sci. Environ. Technol. 2017, 2, 125–129. [Google Scholar]
  3. Gopal, P.; Kiran, K.T. Slope Stability and Seepage Analysis of Earthen Dam of a Summer Storage Tank: A Case Study by Using Different Approaches. Int. J. Innov. Res. Adv. Eng. 2014, 1, 130–134. [Google Scholar]
  4. Singh, D.; Jha, J.N.; Gill, K.S. Effect of canal water level on stability of its embankment and side slopes. Int. J. Eng. Sci. Technol. 2017, 9, 645–651. [Google Scholar]
  5. Pinyol, N.M.; Alonso, E.E.; Olivella, S. Rapid drawdown in slopes and embankments. Water Resour. Res. 2008, 44, W00D03. [Google Scholar] [CrossRef]
  6. Vaughan, P.R.; Kovacevic, N.; Ridley, A.M. The influence of climate and climate change on the stability of embankment dam slopes. Reservoirs in a Changing World. In Proceedings of the 12th Conference of the BDS, Trinity College, Dublin, Ireland, 4–8 September 2002. [Google Scholar]
  7. Johnston, I.; Murphy, W.; Holden, J. A review of floodwater impacts on the stability of transportation embankments. Earth-Sci. Rev. 2021, 215, 103553. [Google Scholar] [CrossRef]
  8. Baziar, M.H.; Salemi, S.H.; Heydari, T. Analysis of Earthquake Response of an Asphalt Concrete Core Embankment Dam. Int. J. Civ. Eng. 2006, 4, 192–211. [Google Scholar]
  9. Shafiei, H.; Eskandari, M.S. A Review of the Embankment Dam with Asphalt Concrete Core. Sci. Eng. Investig. 2016, 5, 111–114. [Google Scholar]
  10. Akhtarpour, A.; Khodaii, A. Experimental study of asphaltic concrete dynamic properties as an impervious core in embankment dams. Constr. Build. Mater. 2013, 41, 319–334. [Google Scholar] [CrossRef]
  11. Alim, M.A.; Ahmed, F.; Islam, M.S. Seepage Analysis of Mahananda Earthen Embankment at Chapai Nawabganj in Bangladesh. Am. J. Eng. Technol. Manag. 2017, 2, 1–6. [Google Scholar] [CrossRef]
  12. Devi DD, L.; Anbalagan, R. Study on Slope Stability of Earthen Dams by using GEOSTUDIO Software. Int. J. Adv. Res. Ideas Innov. Technol. 2017, 3, 408–414. [Google Scholar]
  13. Bayisa, N.M. Relative performance evaluation of asphaltic concrete core embankment dam and clay core embankment dam: By Plaxis software application. J. Sci. Eng. Technol. 2019, 4, 18–29. [Google Scholar]
  14. Mairaing, W. Earth Dam Engineering; Library Nine: Bangkok, Thailand, 2003. [Google Scholar]
  15. Fredlund, D.G. Slope Stability Analysis Incorporating the Effect of Soil Suction. In Slope Stability, Chapter 4; Andersen, M.G., Richards, K.S., Eds.; Wiley: New York, NY, USA, 1987; pp. 113–144. [Google Scholar]
  16. Abramson, L.W.; Lee, T.S.; Sharma, S.; Boyce, G.M. Slope Stability Concepts. In Slope Stabilisation and Stabilisation Methods, 2nd ed.; John Willey & Sons, Inc.: Hoboken, NJ, USA, 2002; pp. 329–461. [Google Scholar]
  17. Nash, D. Comprehensive Review of Limit Equilibrium Methods of Stability Analysis. In Slope Stability, Chapter 2; Andersen, M.G., Richards, K.S., Eds.; Wiley: New York, NY, USA, 1987; pp. 11–75. [Google Scholar]
  18. Janbu, N. Stability analysis of Slopes with Dimensionless Parameters. Ph.D. Thesis, Harvard University, Cambridge, MA, USA, 1954. [Google Scholar]
  19. Janbu, N. Application of Composite Slip Surface for Stability Analysis. In Proceedings of the European Conference on Stability of Earth Slopes, Stockholm, Sweden, 20–25 September 1954. [Google Scholar]
  20. Janbu, N. Slope Stability Computations. (Geoteknikk, NTH). Soil Mechanics and Foundation Engineering; Technical University of Norway: Trondheim, Norway, 1968. [Google Scholar]
  21. Morgenstern, N.R.; Price, V.E. The Analysis of the Stability of General Slip Surfaces. Geotechnique 1965, 15, 77–93. [Google Scholar] [CrossRef]
  22. Spencer, E. A method of Analysis of the Stability of Embankments, Assuming Parallel Interslice Forces. Geotechnique 1967, 17, 11–26. [Google Scholar] [CrossRef]
  23. ASCE. Stability and Performance of Slopes and Embankments; Conference Proceeding; ASCE: Berkeley, CA, USA, 1966. [Google Scholar]
  24. EM 1110-2-1902; Engineering and Design Stability of Earth and Rock Fill Dams. Corps of Engineers: Washington, DC, USA, 1970.
  25. Tanaka, T.; Tatsuoka, F.; Mohri, Y. Earthquake Induced Failure of Fujinuma Dam. In Proceedings of the International Symposium on Dams for a Changing World, Kyoto, Japan, 5 June 2012. [Google Scholar]
  26. Pare, J.J.; Verma, N.S. Geotechnical Practice in Hydro Electric Projects in Canada. In Proceedings of the Canadian Engineering Centennial Convention, Montreal, QC, Canada, 18–22 May 1987. [Google Scholar]
  27. Kjaernsli, B.; Moum, J.; Torblaa, I. Laboratory Tests on Asphaltic Concrete for an Impervious Membrane on the Venemo Rockfill Dam; Norwegian Geotechnical Institute Publication: Oslo, Norway, 1966; pp. 17–26. [Google Scholar]
  28. Weibiao, W.; Kaare, H. The asphalt core embankment dam: A very competitive alternative. In Proceedings of the 1st International Symposium on Rockfill Dams, Chengdu, China, 18–20 October 2009. [Google Scholar]
  29. Mathias, S.; Selami, G. Asphalt core embankment dams in Turkey—Dam design, core material and construction. In Proceedings of the 11th ICOLD European Club Symposium, Crete, Greece, 2–4 October 2019. [Google Scholar]
  30. Geo-Slope International Ltd. Seepage Modeling with SEEP/W; Geo-Slope International Ltd.: Calgary, AB, Canada, 2012. [Google Scholar]
  31. Gemeda, D. The Alternative Design of Gidabo Embankment Dam by Introducing Asphalt Concrete Core: Southern Ethiopia. Int. J. Sci. Eng. Res. 2020, 11, 1158–1175. [Google Scholar]
  32. Babak, A.; Ramez, H.; Imad, L. Asphalt concrete dynamic modulus prediction: Bayesian neural network approach. Int. J. Pavement Eng. 2023, 24, 2270569. [Google Scholar]
  33. Xu, W.; Huang, X.; Yang, Z.; Zhou, M.; Huang, J. Developing Hybrid Machine Learning Models to Determine the Dynamic Modulus (E*) of Asphalt Mixtures Using Parameters in Witczak 1-40D Model: A Comparative Study. Materials 2022, 15, 1791. [Google Scholar] [CrossRef] [PubMed]
  34. Huang, J.; Zhang, J.; Li, X.; Qiao, Y.; Zhang, R.; Kumar, G.S. Investigating the effects of ensemble and weight optimization approaches on neural networks’ performance to estimate the dynamic modulus of asphalt concrete. Road Mater. Pavement Des. 2022, 24, 1939–1959. [Google Scholar] [CrossRef]
Figure 1. General formulation for the limit equilibrium method.
Applsci 14 06555 g001
Figure 2. Testing of aggregate and asphaltic concrete.
Applsci 14 06555 g002
Figure 3. The graph of the particle size distribution according to the air void content (AV) at 1%, 2%, and 3%, and the asphalt cement content (AC) at 6%.
Applsci 14 06555 g003
Figure 4. Comparison of the relationship between various AC contents and the density, stability, and flow of the three mix proportions.
Applsci 14 06555 g004
Figure 5. Permeability values from the study’s tests vs. the relationship between the air void content and permeability values, compiled by Kjaernsli et al., 1966 [27].
Applsci 14 06555 g005
Figure 6. Yield strength of asphaltic concrete with three different mix ratios from triaxial compression tests.
Applsci 14 06555 g006
Figure 7. Test sample condition of Mix Proportion 1 after triaxial compression test.
Applsci 14 06555 g007
Figure 8. Geometry and materials of a hypothetical embankment.
Applsci 14 06555 g008
Figure 9. Seepage analysis through an embankment in a normal water level state (Slope 1:2, clay core thickness: 1.0 m).
Applsci 14 06555 g009
Figure 10. Displacement analysis in the case of a normal water level state with a surcharge load (Slope 1:1.5, clay core thickness: 0.5 m).
Applsci 14 06555 g010
Figure 11. Slope stability analysis in the case of a rapid drawdown state with a surcharge load (Slope 1:1, asphaltic concrete core thickness: 0.3 m).
Applsci 14 06555 g011
Figure 12. Horizontal displacement of the upstream slope in a normal water level state with a surcharge load for Slope Ratio 1.
Applsci 14 06555 g012
Figure 13. Vertical displacement of the core zone in a normal water level state with a surcharge load for slope ratio 1:1.
Applsci 14 06555 g013
Table 1. Factors of safety for embankment [24,25,26].
CaseDesignConditionJapanICOLDCrop. of Eng.SCDWRUS. Federal RegisterCanada
1Normal Water LevelStatic--1.51.51.51.5
Earthquake1.2--1.111.1
2Rapid
Drawdown
Static-1.21.21.2-1.3
Earthquake1.2----1.3
Table 2. Laboratory testing procedures for aggregate and asphaltic concrete properties.
OrderTesting SequenceProportionNumber of Samples
1Testing for the particle size of materials by using a wash sieve method.-2
2Testing for the particle size of materials by using a non-wash sieve method-2
3Testing aggregate toughness and abrasion resistance by using the Los Angeles abrasion machine-1
4Testing for aggregate soundness by using sodium sulfate or magnesium sulfate-2
5Testing for the flatness index-2
6Testing for the specific gravity of coarse aggregate-3
7Testing for the specific gravity and water permeability of fine aggregate-3
8Testing for the asphalt permeability of aggregate-6
9Testing asphaltic concrete by using the Marshall method13
23
33
10Testing to determine the strength index of asphaltic concrete mixtures14
24
34
11Testing the permeability of asphaltic concrete11
21
31
12Triaxial compression testing of asphaltic concrete13
23
33
Table 3. Hot bin aggregate details.
Hot BinStandard Sieve AnalysisAperture Size (mm)
1No.44.75
23/89.53
3½″12.70
4¾″19.05
Table 4. Summary of all 12 testing methods.
OrderAggregate Property Testing Results
1Testing for particle size distribution by using the wet sieve methodThe particle size distribution is well-graded, following Fuller’s curve. Further details are provided in the next section
2Testing for particle size distribution by using the dry sieve methodThe particle size distribution is well-graded, conforming to Fuller’s curve. Further details will be elaborated in the subsequent section.
3Testing aggregate abrasion resistance by using the Los Angeles Abrasion machineThe abrasion value using the Los Angeles machine for 3/4 inch stone is 22.30%.
4Testing soundness of the aggregate by using sodium sulfate or magnesium sulfateThe soundness value for 3/4 inch stone is 0.70%, and for stone dust is 2.20%.
5Testing for the flatness indexFlatness index:
Hot Bin 2 (9.53 mm): 22%
Hot Bin 3 (12.70 mm): 24%
Hot Bin 4 (19.05 mm): 12%
Length index:
Hot Bin 2 (9.53 mm): 18%
Hot Bin 3 (12.70 mm): 17%
Hot Bin 4 (19.05 mm): 18%
6Testing for the specific gravity of coarse aggregate materialSpecific gravity of coarse aggregate:
Hot Bin 2 (9.53 mm): 2.682
Hot Bin 3 (12.70 mm): 2.691
Hot Bin 4 (19.05 mm): 2.697
Water absorption:
Hot Bin 2 (9.53 mm): 0.50%
Hot Bin 3 (12.70 mm): 0.41%
Hot Bin 4 (19.05 mm): 0.30%
7Testing for specific gravitySpecific gravity of fine aggregate:
Hot Bin 1 (size < 4.75 mm): 2.660
Water absorption:
Hot Bin 1 (size < 4.75 mm): 0.81%
8Testing for the asphalt permeability of the aggregateAsphalt permeability value = 0.20%.
9Testing asphaltic concrete by using the Marshall methodDesign to achieve an air void content (AV) of 1% and asphalt cement content (AC 60/70) of 6%:
Mix No. 1: Hot Bin 1:2:3:4 = 42:30:18:10
Design to achieve AV of 2% and AC 60/70 of 6%:
Mix No. 2: Hot Bin 1:2:3:4 = 38:37:15:10
Design to achieve AV of 3% and AC 60/70 of 6%:
Mix No. 3: Hot Bin 1:2:3:4 = 35:35:15:15
Further details will be provided in the next section.
10Testing to determine the Strength Index of the asphaltic concrete mixtureStrength index:
Mix No. 1 = 76.1%
Mix No. 2 = 75.1%
Mix No. 3 = 75.6%
11Testing for water permeabilityWater permeability (k):
Mix No. 1 (*AV = 0.30%) = 8.56 × 10⁻⁹ cm/s
Mix No. 2 (*AV = 2.65%) = 2.71 × 10⁻⁵ cm/s
Mix No. 3 (*AV = 4.71%) = 4.56 × 10⁻⁵ cm/s
Note: * In the sample preparation for testing, the AV values deviate from the designed AV of 1%, 2%, and 3% for Mix Nos. 1, 2, and 3, respectively.
12Triaxial compression testingCohesion (c):
Mix No. 1 = 2.70 kg/cm2
Mix No. 2 = 4.66 kg/cm2
Mix No. 3 = 3.15 kg/cm2
Internal friction angle (f):
Mix No. 1 = 45.80°
Mix No. 2 = 30.23°
Mix No. 3 = 39.83°
Further details are provided in the next section.
Table 5. Aggregate material proportions of asphaltic concrete according to AV values of 1%, 2%, and 3%, and an AC of 6%.
Air Void
Content (%)
Aggregate Material Proportions (% by Weight)Remark
Hot Bin 1
(Size < 4.75 mm)
Hot Bin 2
(Size 9.53 mm)
Hot Bin 3
(Size 12.70 mm)
Hot Bin 4
(Size 19.05 mm)
142301810Asphalt Cement Content 6%
238371510
335351515
Table 6. Density, stability, and flow from a mix design based on AV at 1, 2, and 3% and AC at 6%.
AV (%)Properties of Asphalt ConcreteRemark
Density (g/mL)Stability (lbs)Flow (1/100 inch)
1243824401267Asphalt Cement (AC) 6%
2241524001267
3239322801267
Table 7. Permeability test results of asphaltic concrete.
Mix No. AV (%)Density (g/cm3)Permeability (cm/s)
10.302.3958.50 × 10−9
22.652.3342.71 × 10−5
34.712.3094.56 × 10−5
Table 8. Comparison of triaxial compressive strength test results for three mix proportions using 6% asphalt cement content.
Mix No.Test No.Effective Confining Pressure, σ3 (ksc)Axial Stress at Failure, σ1 (ksc)σ13
at Failure
Young/s Modulus, ES (ksc)Cohesion, c (ksc)Friction Angle, ϕ (degree)
11118.1618.163052.745.8
2223.1111.55269
3328.109.37319
24118.6318.633424.6630.23
5219.629.81257
6322.537.51349
37117.9017.92973.1539.83
8219.279.63295
9324.548.18317
Table 9. List of material parameters used in the analysis.
MaterialParameterReferences
Permeability, k (m/s)Unit Weight, γ (kN/m3)Cohesion, c (kPa)Friction Angle, ϕ (deg.)Young’s Modulus, Es (kPa)Poisson’s Ratio
Asphaltic Concrete Core8.50 × 10−11232644526,4000.49Testing
Clay Core1.00 × 10−91650-21,0000.49WWDSE, 2008 [30]
Filter7.50 × 10−618-3529,0000.30WWDSE, 2008
Transition5.00 × 10−418-3532,0000.30[30]
Rock Fill5.00 × 10−322-4034,0000.28WWDSE, 2008
Foundation1.00 × 10−1218-4590,0000.25[30]
Table 10. Summary of discharge passing through an embankment.
Thickness of Core (m)Discharge Passing through the Core (m3/Day)
Asphaltic ConcreteClay
0.3015.1 × 10−43.52 × 10⁻²
0.509.16 × 10−42.00 × 10⁻²
0.805.78 × 10−41.17 × 10⁻²
1.004.66 × 10−40.92 × 10⁻²
Table 11. Summary of the displacement analysis of the embankment.
Slope RatioMaximum Displacement (cm)
No Surcharge LoadSurcharge Load = 50 kPa
Upstream SlopeCoreUpstream SlopeCore
VerticalHorizontalVerticalHorizontalVerticalHorizontalVerticalHorizontal
1:24.63.90.01.24.63.91.51.2
1:1.54.04.60.01.74.14.51.61.7
1:13.05.50.02.73.25.41.62.7
Table 12. FOS of upstream slope without a surcharge load.
Slope RatioAsphaltic Concrete CoreClay Core
Normal Water LevelRapid DrawdownNormal Water LevelRapid Drawdown
U/SD/SU/SD/SU/SD/SU/SD/S
1:22.12.11.22.12.02.01.12.0
1:1.51.81.71.01.71.51.60.91.6
1:11.41.30.91.31.41.20.71.2
Table 13. FOS of upstream slope with a surcharge load (50 kPa).
Slope RatioAsphaltic Concrete CoreClay Core
Normal Water LevelRapid DrawdownNormal Water LevelRapid Drawdown
U/SD/SU/SD/SU/SD/SU/SD/S
1:21.92.01.22.01.81.91.11.9
1:1.51.61.61.01.61.41.50.91.5
1:11.31.20.81.21.11.10.71.1
Table 14. Factors influencing the behavior of embankments for designing.
Analysis of Soil Embankment BehaviorType of Core Embankment MaterialEmbankment SlopeThickness of Core EmbankmentWater LevelSurcharge Load
Seepage through an embankment
Displacement
Slope Stability
Disclaimer/Publisher’s Note: The statements, opinions and data contained in all publications are solely those of the individual author(s) and contributor(s) and not of MDPI and/or the editor(s). MDPI and/or the editor(s) disclaim responsibility for any injury to people or property resulting from any ideas, methods, instructions or products referred to in the content.

