Article

An Adaptive Multi-Objective Genetic Algorithm for Solving Heterogeneous Green City Vehicle Routing Problem

School of Mechanical Engineering, Xi’an Jiaotong University, Xi’an 710049, China
*
Author to whom correspondence should be addressed.
Appl. Sci. 2024, 14(15), 6594; https://doi.org/10.3390/app14156594 (registering DOI)
Submission received: 19 June 2024 / Revised: 16 July 2024 / Accepted: 23 July 2024 / Published: 28 July 2024
(This article belongs to the Special Issue Multi-objective Optimization: Techniques and Applications)

Abstract

:
Intelligent scheduling plays a crucial role in minimizing transportation expenses and enhancing overall efficiency. However, most of the existing scheduling models fail to comprehensively account for the requirements of urban development, as exemplified by the vehicle routing problem with time windows (VRPTW), which merely specifies the minimization of path length. This paper introduces a new model of the heterogeneous green city vehicle routing problem with time windows (HGCVRPTW), addressing challenges in urban logistics. The HGCVRPTW model considers carriers with diverse attributes, recipients with varying tolerance for delays, and fluctuating road congestion levels impacting carbon emissions. To better deal with the HGCVRPTW, an adaptive multi-objective genetic algorithm based on the greedy initialization strategy (AMoGA-GIS) is proposed, which includes the following three advantages. Firstly, considering the impact of initial information on the search process, a greedy initialization strategy (GIS) is proposed to guide the overall evolution during the initialization phase. Secondly, the adaptive multiple mutation operators (AMMO) are introduced to improve the diversity of the population at different evolutionary stages according to their success rate of mutation. Moreover, we built a more tailored testing dataset that better aligns with the challenges faced by the HGCVRPTW. Our extensive experiments affirm the competitive performance of the AMoGA-GIS by comparing it with other state-of-the-art algorithms and prove that the GIS and AMMO play a pivotal role in advancing algorithmic capabilities tailored to the HGCVRPTW.

1. Introduction

Logistics management encompasses the entire process from the procurement of raw materials to the final delivery of products, integrating logistical planning, transportation, warehousing, inventory management, and the coordination and optimization of diverse supply chain activities [1]. The movement of goods from supply points to various destinations holds significant importance in logistics management, exerting a considerable impact on overall expenditures and the level of service provided to customers. The classical problem in logistics scheduling is referred to as the vehicle routing problem (VRP), initially formulated by Dantzig and Ramser [2]. In recent years, numerous variants of the VRP have been extensively researched [3,4,5], especially those incorporating the concept of time windows, known as VRP with Time Window (VRPTW) variants [6]. Applying intelligent scheduling algorithms to design efficient allocation plans and organize vehicles systematically has proven effective in enhancing efficiency and reducing transportation costs [7,8,9].
Despite the progress in solving VRP, existing scheduling models still exhibit limitations, such as the lack of attention to achieving a balance among the interests of various stakeholders under urban conditions. In practical logistics systems, stakeholders possess diverse interests that may potentially conflict [10,11,12]. The traditional VRPTW suffers from inherent limitations, such as oversimplification of vehicle attributes and customer satisfaction, along with the absence of environmental considerations. These limitations result in the oversight of the influence of diverse vehicle characteristics on route planning, disregard for variations in customer tolerance for overdue waiting times, and the oversight of the environmental implications of distinct routes.
To address these gaps, this paper introduces the heterogeneous green city VRPTW (HGCVRPTW), which aims to offer a more comprehensive and realistic solution that better aligns with diverse stakeholder requirements. Furthermore, an adaptive multi-objective genetic algorithm based on greedy initialization strategy (AMoGA-GIS) is proposed to solve this novel HGCVRPTW problem. Firstly, a greedy initialization strategy (GIS) is devised to generate multiple subpopulations, and each subpopulation corresponds to a specific objective. This allows the overall population to evolve from optimal single objectives, expediting population convergence. To ensure population diversity, an additional subpopulation is generated through a random approach. Secondly, the adaptive multiple mutation operators (AMMO) are designed to ensure that the algorithm has opportunities to employ suitable mutation strategies at different evolutionary stages. The AMMO adjusts the selection probability of mutation operators based on the success rate of mutation, favoring different mutation operators that are more likely to drive population evolution at the current stage, thereby accelerating population convergence. The diagram of the AMoGA-GIS is shown in Figure 1.
The novelty of our work lies in its comprehensive approach to the VRP, incorporating heterogeneous vehicle attributes, customer satisfaction levels, and environmental impacts, which are often overlooked in traditional models. By addressing these aspects, our research fills the gaps in current VRP studies, which typically oversimplify vehicle attributes and disregard customer and environmental considerations. The primary contributions of our work are as follows:
(1)
Introducing the novel concept of the heterogeneous green city VRPTW (HGCVRPTW), which incorporates multiple stakeholder interests and environmental considerations into the VRP framework;
(2)
Proposing an adaptive multi-objective genetic algorithm based on a greedy initialization strategy to solve the HGCVRPTW problem. This algorithm ensures efficient route planning while maintaining population diversity and accelerating convergence through adaptive multiple mutation operators;
(3)
Conducting experiments to demonstrate that our proposed algorithm can effectively solve the HGCVRPTW problem.
The rest of this article is structured as follows: Section 2 introduces the related works of VRP and provides a detailed definition of the VRPTW; Section 3 introduces the proposed AMoGA-GIS in detail; In Section 4, a comprehensive experimental analysis is conducted, focusing on evaluating the performance of the proposed AMoGA-GIS; Section 5 comprehensively summarizes the main contributions of this paper and future work.

2. Related Works

In this section, we first present a brief overview of some related works of the VRP. Subsequently, we introduce the specific problem formulations that need to be addressed in the context of the VRPTW.

2.1. Related Works of VRP

Research on variants of the VRP is extensive, with one of the simplest being the capacitated VRP, which focuses on vehicle capacity. Altabeeb et al. [13] proposed a novel enhanced firefly algorithm to address the capacitated vehicle routing problem. Firstly, local search techniques are incorporated to expedite convergence toward optimal solutions. Secondly, the crossover and two mutation techniques are introduced to strike a balance between diversity and convergence. To further explore the VRP by considering scenarios, it is known as the VRP with Simultaneous Pick-up and Delivery (VRPSPD), where delivering and picking up goods occur simultaneously. On the contrary, it is referred to as the VRP with Backhauls (VRPB) when picking up occurs after the delivery is completed. Goksal et al. [14] proposed an approach that combines particle swarm optimization and variable neighborhood descent to address the VRPSPD. Additionally, they integrated simulated annealing to ensure algorithmic diversity. Wang et al. [15] proposed a parallel simulated annealing algorithm to address the VRPSPD. Taking the environmental concerns into account, such as power consumption or pollution, it is considered a Green VRP. Schneider et al. [16] introduced a hybrid heuristic approach, combining the variable neighborhood search algorithm with a tabu search heuristic method to address the freight distribution problem with charging stations. Dedović et al. [17] conducted an in-depth study on the VRP formulation for a company specializing in the distribution of electrical appliances and consumer goods, obtaining exact solutions through the application of the GNU Linear Programming Kit (GLPK).
In recent years, algorithms that integrate new technologies have gradually emerged. Wang et al. [18] proposed a two-stage multi-objective evolutionary algorithm to enhance the capability of solving the multi-depot VRPTW by seeking Pareto extreme solutions and extending Pareto extreme solutions. Srivastava et al. [19] proposed a method based on non-dominated sorting genetic algorithm II (NSGA-II) to solve multi-objective VRPTW by designing operators that leverage problem characteristics and the attributes of each objective. Kuo et al. [20] combined the multi-objective particle swarm optimization algorithm with tabu search to address the trade-off between total cost and carbon emissions in VRPTW. Mukherjee et al. [21] leveraged the graphical characteristics of the VRP to design and enhance evolutionary computation methods. Azadi et al. [22] extended the electric vehicle routing problem by introducing multiple charging stations and options for both full and partial recharging of electric vehicles, formulating it as a multi-objective integer linear programming model that included economic, environmental, and social objectives. Their model employed the preemptive fuzzy goal programming method for small-sized problems and hybrid meta-heuristic algorithms for larger problems, achieving promising results in experiments. Gülmez et al. [23] addressed the green vehicle routing problem with flexible time windows by developing a multi-objective optimization model to minimize costs, reduce fossil fuel usage, and enhance customer satisfaction. Huang et al. [24] proposed a dynamic grey wolf optimizer algorithm with floating 2-opt, which combined real number encoding with equal-division random key and ROV rules for decoding and introduced a dynamic non-dominated solution set update strategy to address vehicle scheduling in humanitarian aid through a multi-objective cumulative capacitated vehicle routing problem considering operation time. Khoo et al. [25] introduced a parallelized two-phase distributed hybrid ruin-and-recreate genetic algorithm (HRRGA) designed to solve the multi-objective vehicle routing problem with time windows (MOVRPTW). HRRGA operated in either the HRRGA phase, combining hybrid genetic algorithms (HGA) with various ruin-and-recreate (HRR) strategies to find near-optimal solutions, or in the HRR phase, using only HRR strategies. By executing these phases in parallel, HRRGA harnessed both exploitation and exploration capabilities to enrich the diversity of the Pareto optimal front. They integrate machine learning to boost the flexibility and efficiency of VRPTW optimization, thereby generating solutions with higher quality.
Despite the significant progress made in the aforementioned studies, several shortcomings remain. For instance, most existing methods primarily focus on single-objective or limited multi-objective scenarios, failing to comprehensively address the complexities present in real-world applications. Additionally, there is a paucity of research that considers carbon emissions and customer satisfaction, and the investigation into heterogeneous vehicles (vehicles of different types and capacities) remains insufficient.

2.2. VRPTW

Assume G = (V, E), where V = {0, 1, …, n} denotes all the points, with 0 as the depot and the rest as customer points; E = {(i, j)} represents all the edges. Each edge eij has a corresponding weight cij, representing the transportation cost from node i to node j. xij represents whether location i is directly connected to location j. If xij = 1, it is true; otherwise it is not. qi represents the quantity of goods at the location. i. Q represents the vehicle capacity limit. The basic VRP model can be represented in the following form:
m i n i m i z e i = 0 n j = 0 n c i j x i j
i = 0 n x i j = 1 ,   j s . t .   V \ { 0 }
j = 0 n x i j = 1 ,   i V \ { 0 }
i = 0 n q i x i j Q ,   j N
x i j { 0 ,   1 } ,   i , j V
Equation (1) aims to minimize the total cost incurred by vehicles while fulfilling all customer demands. Equation (2) restricts each customer node from being visited exactly once, which signifies that each node must be assigned to a vehicle. Equation (3) represents the vehicle capacity restriction.

3. AMoGA-GIS

Given that the effectiveness of algorithms heavily relies on the quality of initial solutions [26], this paper proposes a GIS to ensure high-quality and diverse solutions within the population. Then, the novel AMMO is designed to improve the convergence of the population. Therefore, this section first introduces the proposed problem model. Second, we introduce the representation of the solution. Third, the proposed GIS and AMMO are introduced, and finally, the complete AMoGA-GIS algorithm is given clearly.

3.1. The Proposed HGCVRPTW Model

Traditional VRPTW models suffer from oversimplification regarding vehicle attributes, inadequate considerations for varying recipient delay tolerances, and a lack of comprehensive environmental sustainability considerations. Firstly, they oversimplify when considering vehicle attributes, neglecting the crucial heterogeneity in carrier vehicle attributes necessary for practical urban logistics. Secondly, these models inadequately account for the varying tolerance levels of recipients for delays, potentially resulting in a decrease in service quality. Lastly, disparate congestion levels in the urban environment raise concerns about carbon emissions, which are associated with different routes and emphasize the need for a more comprehensive approach to environmental sustainability.
Therefore, we designed the HGCVRPTW problem to comprehensively address these issues. Compared to VRPTW, HGCVRPTW introduces two additional considerations in its evaluation criteria:
(1) As the gap widens between the arrival times of vehicles and the expected times of customers, customer satisfaction gradually declines. The traditional time window concept fails to adequately address this issue, limiting itself to serving customers within specific time intervals and overlooking customer expectations regarding service timeliness and flexibility. Customer satisfaction is higher when services are provided on time or as per their expected times. However, any delay or advancement in service timing reduces customer satisfaction. This degradation in satisfaction with increasing disparities between arrival and expected times is not entirely captured by the classical time window concept. Hence, this paper introduces the concept of customer satisfaction, evaluated as follows:
m i n i m i z e i = 0 n z ( t i t i 0 )
where ti is denoted as the actual arrival time at location i, and ti0 represents the ideal arrival time at location i. The function z(·) is used to convert the time difference into satisfaction in this context;
(2) Minimizing carbon emission costs has become an increasingly crucial objective in vehicle routing. Optimizing routes and schedules can reduce vehicle travel distances and time, thereby decreasing fuel consumption and carbon emissions. By minimizing carbon emission costs, enterprises not only reduce their environmental impact but also enhance their social responsibility image. This objective aligns closely with the growing global emphasis on sustainability and environmentally friendly transportation.
m i n i m i z e i = 0 m p i L m
where pi denotes the carbon emission for route I; Li represents the length of the route i, and m is the total number of routes after allocation. Notice that carbon emission here is a generalized measure that can refer to CO2, CO, or PM emissions. Our algorithm is adaptable to different emission standards, making it flexible for various scenarios.

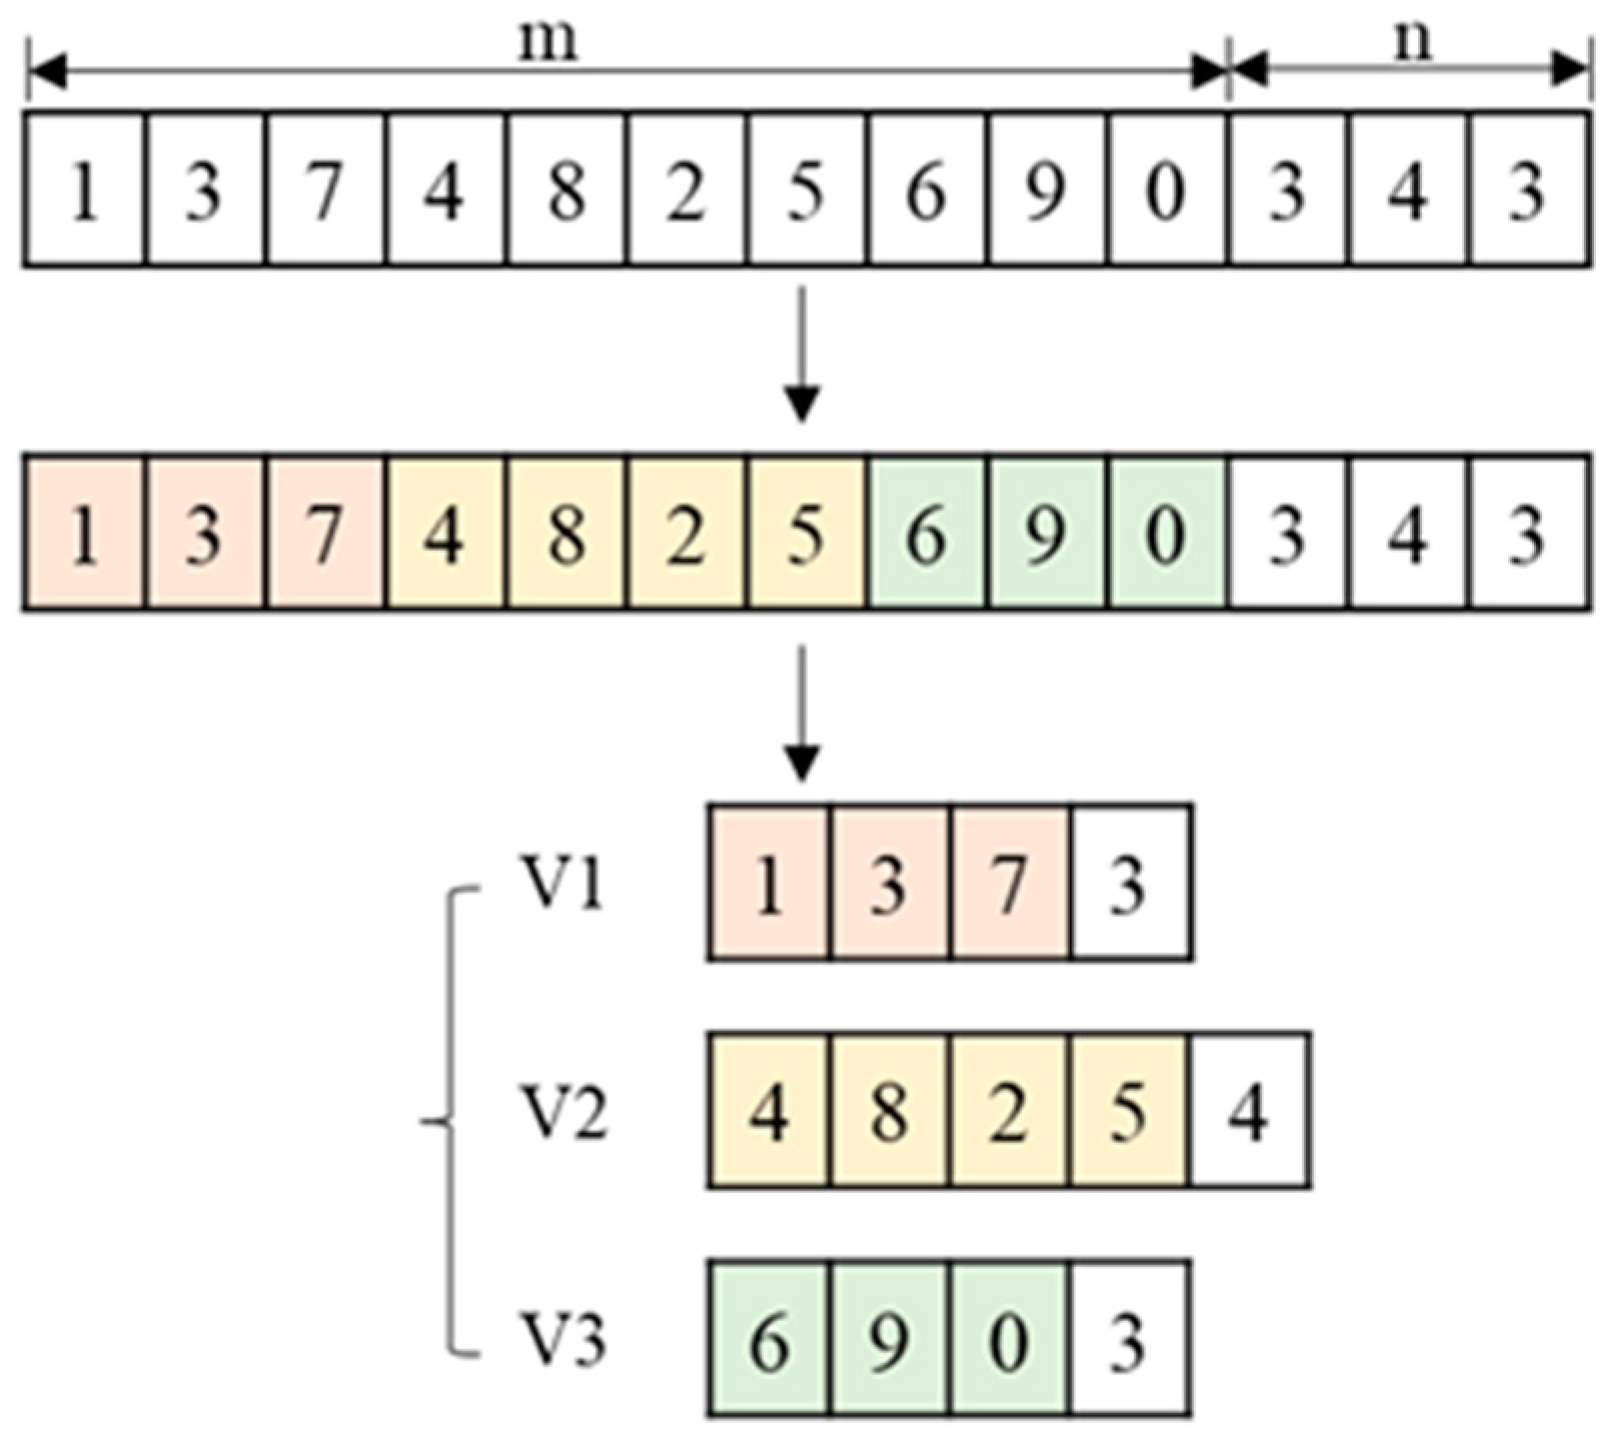
3.2. Solution Encoding

The choice of encoding method is important during an evolutionary process, where each chromosome needs to encompass all allocation information within a solution. This choice significantly influences the performance of the algorithm. To further align with evolutionary strategies, a permutation-based representation is employed. All pending tasks are arranged into a sequence awaiting allocation, with each gene in the chromosome representing a task ID. Assuming the existence of m pending tasks in the problem, the initial m elements in the chromosome constitute a sequence of 1 to m. Additionally, it is essential to denote the correspondence between pending tasks and vehicles. Assuming the availability of n usable vehicles in the problem, the last n elements in the chromosome indicate the number of tasks allocated to each vehicle. The complete chromosome length should be m + n, and V1, V2, and V3 represent three vehicles.
For instance, as illustrated in Figure 2, assume a chromosome {1, 3, 7, 4, 8, 2, 5, 6, 9, 0, 3, 4, 3} represents a solution for a problem with 10 tasks and three vehicles. Following the order of task sequences, we allocate the required tasks for each vehicle sequentially. Notably, at this point, the demand for the three vehicles is {3, 4, 3}. The first vehicle, V1, is allocated the first three tasks {1, 3, 7} to fulfill its demand. Employing this methodology for the remaining two vehicles leads to the decoded solution for evaluation.

3.3. GIS

To begin with, the population is divided into four equally sized subpopulations. The first subpopulation is randomly generated to ensure diversity within the initial population. The remaining individuals are generated using the GIS to produce high-quality initial solutions. The GIS independently generates initial solutions for different objectives, forming the following four initial subpopulations: (1) The first subpopulation is generated using a random strategy to explore diversity; (2) The second subpopulation employs the GIS-Distance strategy (Algorithm 1 as follows, in Section 3.3) to reduce transportation costs based on distance allocation; (3) The third subpopulation utilizes the GIS-Time (Algorithm 2 as follows) strategy to increase user satisfaction based on time allocation; (4) The fourth subpopulation adopts the GIS-Carbon (Similar to Algorithm 1, where line 6 is replaced by sorting by carbon emissions) strategy, considering optimal carbon emission allocation. This method aids in establishing an initial population that exhibits advantages in both solution quality and diversity, specifically addressing various objectives within the HGCVRPTW.
Algorithm 1 GIS-Distance
        Input:
        The position of spot pos, the positions of tasks tpos, the number of tasks m, the number of vehicles n, the capacities of vehicles capacity, the demands of tasks demand.
        Output:
        The individual generated by GIS-Distance allocation A
        1: AΦ
        2: now_positionpos
        3: sequence ← [1, 2, …, m]        
        4: shuffle(sequence)
        4: For index in sequence do
        5:   tmp_taskstpos[index]
        6:   list_indexSort_distance(now_position, tmp_tasks)
        7:   For v in list_index do
        8:     If capacity[v] >= demand[index] then
        9:        capacity[v] ← capacity[v] − demand[index]
        10:       A[v] ← A[v]∪index
        11:       now_position[v]tpos[tmp_tasks]
        12:     End if
        13:   End for
        14: End for
Algorithm 2 GIS-Time
        Input:
        The number of tasks m, the number of vehicles n, the capacities of vehicles capacity, the ready time of tasks Rtime, the due time of tasks Dtime, the demands of tasks demand.
        Output:
        The individual generated by GIS-Time allocation A
        1: AΦ
        2: now_due_time ← 0
        3: sequence ← [1, 2, …, m]
        4: sequenceSort_ready_time(sequence, Rtime)
        5: For index in sequence do
        6:    pmin_index(now_due_time)
        7:   A[p] ← A[p]∪index
        8:   now_due_time[p]Dtime[index]
        9: End for

3.4. Crossover Operation

When tackling complex optimization problems, evolutionary algorithms often encounter challenges such as becoming trapped in local optima, leading to a loss of population diversity. This limitation may restrict the ability of the algorithm to conduct comprehensive global searches. To overcome this challenge, crossover operations are introduced into evolutionary algorithms. In biology, crossover resembles the exchange of genetic information among different individuals. In evolutionary algorithms, crossover operations aim to generate new solutions by combining favorable characteristics from different individuals. This information exchange aids in preserving population diversity and facilitates the algorithm in escaping local optima, enabling a more comprehensive exploration of the solution space.
For sequence crossover, ensuring the legitimacy of individuals is crucial. Thus, a crossover process, as depicted in Figure 3, is designed. Initially, two individuals are randomly selected from the population as crossover parents. Next, the chromosome is traversed to identify the crossed sections. In this context, only the first m positions undergo crossover, while the subsequent n positions are unaffected. In Figure 3, positions 3, 4, 6, and 9 marked with the crossover probability are identified. In the subsequent step, the genes at corresponding positions in x2 are directly assigned to x1. Subsequently, the modified x1 undergoes validation. Duplicate elements in x1 are identified, and the missing elements from x2 are inserted into the positions of the duplicate elements in x1. This process yields the resultant offspring c1 after crossover. Notably, after the exchange, the genes 1 and 3 appear twice in x1. To ensure the correctness of the crossover operation, we replace the original positions (highlighted in red) of the 1 and 3 genes in the chromosome with the missing genes 9 and 7 from x2 (highlighted in red). This generates the final offspring individual c1, with the missing genes inserted in the same order as they appear in x2 (i.e., 9, 7).

3.5. AMMO

The encoding primarily consists of two main components: the task allocation sequence and the task allocation quantity. Figure 4 and Figure 5 represent the mutation processes for the task allocation sequence and the task allocation quantity, respectively. Task allocation sequence mutation comprises three primary operations: swap; insert; and group insert. Figure 4a,b illustrate the swap operation, where it can occur within the same allocation, representing changes in task execution order, or between different allocations, signifying changes in task assignments.
Insert involves placing a block into any position, while group insert maintains the relative positions within the exchanged block when inserted into another position. Both insert and group insert operations may alter the task sequence and allocation. Task allocation quantity encompasses two operations: task quantity swap and task quantity redistribution. To minimize the disruption caused by redistribution, the maximum difference between the quantity before and after the disturbance is set to 1, as depicted in Figure 5b.
During the early stages of evolution, emphasis is often placed on global exploration and probing of unknown solution spaces. Higher intensity perturbations may be employed to explore a broader search space, reduce selection pressure, increase population diversity, and aid the algorithm in escaping local optima. As evolution progresses, the algorithm tends to focus more on local exploration and a finer exploration of the regions surrounding local optima. Different mutation strategies impart varying levels of disturbance at different evolutionary stages. Hence, an adaptive selection of mutation operations is proposed in our AMoGA-GIS algorithm. Initially, the selection probability for each mutation strategy is uniform. In each generation, the frequency of selecting a strategy and the dominant relationship between the generated solution and the original solution are recorded. A strategy with a higher probability, which produces a solution that dominates the original solution, is more likely to be chosen and accelerate the evolution process.

3.6. The Complete AMoGA-GIS

The complete AMoGA-GIS is depicted in Algorithm 3. Line 1 initializes the population, employing the GIS to generate optimal subpopulations for each objective. Lines 4–8 involve randomly selecting an individual and performing a crossover operation with the current individual j. Line 9 executes the proposed AMMO to obtain the final individual, which is directly incorporated into the population. Line 12 involves the statistical tracking of the success rate of the current operators, which determines the selection probabilities for the next-generation operators based on their success rates. Line 13 employs an elitist selection strategy, eliminating solutions with lower Pareto ranks from the current population.
Algorithm 3 AMoGA-GIS
        Input:
        The number of generation Gen, the size of population n.
        Output:
        The solutions set P
        1: P ← GIS();
        2: For i = 1 to Gen do
        3:    For j = 1 to n do
        4:      indrandint(n);
        5:      While ind == j
        6:         indrandint(n); // Randomly selecting individuals from the population
        7:      End while
        8:      vcrossover(j, ind); // according to Section 3.4
        9:      uAMMO(v); // according to Section 3.5
        10:        PPu;
        11:    End for
        12:    Reallocate_probability(); // Reallocate the selection probabilities of mutation operators
        13:    Elimination of individuals with low Pareto grade;
        14: End for

4. Experiments

In this section, we first outline the steps for transforming VRPTW datasets into compliant instances for HGCVRPTW. Next, we conduct tests on the evaluation set and compare it against the commonly used three-objective algorithm NSGAIII [27]. Finally, we execute disintegration experiments to assess the employed strategies.

4.1. Parameter Settings

We utilized Gehring and Homberger’s extended VRPTW benchmark [28], comprising 200 customer instances, and modified and supplemented parameters. Firstly, in the original benchmark, all task service times are set to 90. To ensure task heterogeneity, we introduced a 0.5 disturbance to the task service times, where all task service times Tservice ∈ {t|90∗(1 − 0.5) < t < 90∗(1 + 0.5)}. Secondly, we introduced a 0.3 disturbance to the vehicle capacities to create vehicular heterogeneity. Finally, we augmented the dataset by introducing carbon emission costs p for each route, where p ∈ {0.8, 1.0, 1.2}, representing excellent, normal, and poor carbon emission levels for respective routes. To ensure fairness in experimentation, the overall evaluation is uniformly set to 10,000 assessments.
Furthermore, we conducted tests using four different task distribution scenarios to evaluate the performance of the algorithm. The distribution of map locations is illustrated in Figure 6, where the red dots represent warehouses, and the blue dots represent points that require planning and allocation.

4.2. Effectiveness of AMoGA-GIS

To demonstrate the effectiveness of our algorithm, a comparative analysis is conducted with the NSGAIII algorithm, utilizing the performance metrics of IGD and HV. The IGD metric measures the distance between the solution set and the Pareto frontier. As the exact Pareto frontier for this problem is uncertain, we adopted the solution set obtained from 50,000 evaluations of the NSGAIII algorithm as the actual Pareto frontier. The HV metric utilized a reference point set at the maximum position for each dimension within the solution set.
Table 1 presents a comparative analysis of the AMoGA-GIS algorithm’s performance against the NSGA-III, focusing on the metrics of IGD and HV. In the function sets C1 and C2, our algorithm has shown a notable advantage, with a 28.88% reduction in the IGD and a remarkable 325.52% increase in the HV, signifying a marked improvement in the quality of solutions. For the subsequent function sets, designated as R and RC, our algorithm continues to outperform, with a 32.58% and 302.08% enhancement in the IGD and HV metrics, respectively. This consistent excellence across different metrics not only highlights the algorithm’s effectiveness across various scenarios but also underscores its robustness and general applicability within the problem domain.
The consistent performance of the AMoGA-GIS algorithm across these diverse metrics suggests that it is versatile and effective for a wide range of scenarios, not limited to specific instances. This versatility is a testament to the algorithm’s robust design and its potential for broader application in the field. Figure 7 is a visual representation of the results for all 40 test problems, and it can be observed that our algorithm generally outperforms the comparative algorithm in all test cases, indicating that our algorithm is capable of effectively solving the HCGVRPTW problems.

4.3. The Component Analysis

To validate the effectiveness of the proposed strategies, we conducted ablation experiments on our strategies. On the one hand, we replaced the random initialization step of NSGAIII with our proposed GIS population initialization strategy to examine the enhancing effect of GIS on the algorithm. On the other hand, the NSGAIII-GIS, the MoGA-GIS, and the AMoGA-GIS algorithms constituted tests for the adaptive mutation strategy. The NSGAIII-GIS can be considered an NSGAIII that incorporates GIS but still uses a single mutation strategy, while the MoGA-GIS employs the eight mutation operators without adaptation. The overall experimental results are presented in Table 2, with bold values indicating the best performance in each evaluation metric.
As depicted in Table 2, the AMoGA-GIS consistently achieves optimal results, surpassing the performance of NSGAIII in the majority of cases. The rare exceptions, where NSGAIII outperforms, are noted but do not detract from the overall superiority of our approach. It can be observed that after incorporating the GIS strategy into NSGAIII, the relative difference in IGD compared to AMOGA-GIS improved by 3% (i.e., 29.62% and 26.01%), while the improvement in HV was nearly doubled (i.e., 316.26% and 167.32%). Moreover, the enhancement in MoGA-GIS after adding the adaptive strategy increases by 0.86% and 5.21% in the average IGD and HV, respectively. The incorporation of our eight carefully designed mutation operators is a key factor in this success, significantly enhancing the spatial search efficiency of the algorithm and facilitating a rapid convergence toward optimal solutions.
Furthermore, Figure 8 presents a visual representation of the results that corroborates the effectiveness of our algorithmic components, which not only substantiates the numerical data but also illustrates the tangible benefits of our enhancements in a more accessible format. The visual results in Figure 8, coupled with the quantitative data from Table 2, collectively demonstrate the efficacy of our mutation operators in improving the exploration and exploitation capabilities of the algorithm. This leads to a more effective search process that is not only efficient in reaching optimal solutions but also robust against local optima traps.
NSGAIII, with the inclusion of the GIS strategy, generally achieved better IGD results, especially in the C2 problem, where the NSGAIII-GIS demonstrated a significant lead. On HV, the NSGAIII-GIS also exhibited good performance, demonstrating the promoting effect of the GIS strategy.
Furthermore, for the adaptive search operators, their effectiveness varied across different test problems. In the C1 and R problem sets, adaptive search operators generally took a leading position. However, in the C2 and RC test sets, algorithms without adaptive operators achieved better results. This variability may stem from different sensitivities of problem sets to the search process. Adaptive operators provide more opportunities for optimal strategies from the previous generation to be carried over to the current one, potentially overshadowing superior strategies in the current generation and leading to slower convergence. In such cases, a fair selection may be more suitable for a more efficient convergence. Overall, our proposed algorithm demonstrates excellent performance in addressing the HGCVRPTW problem.

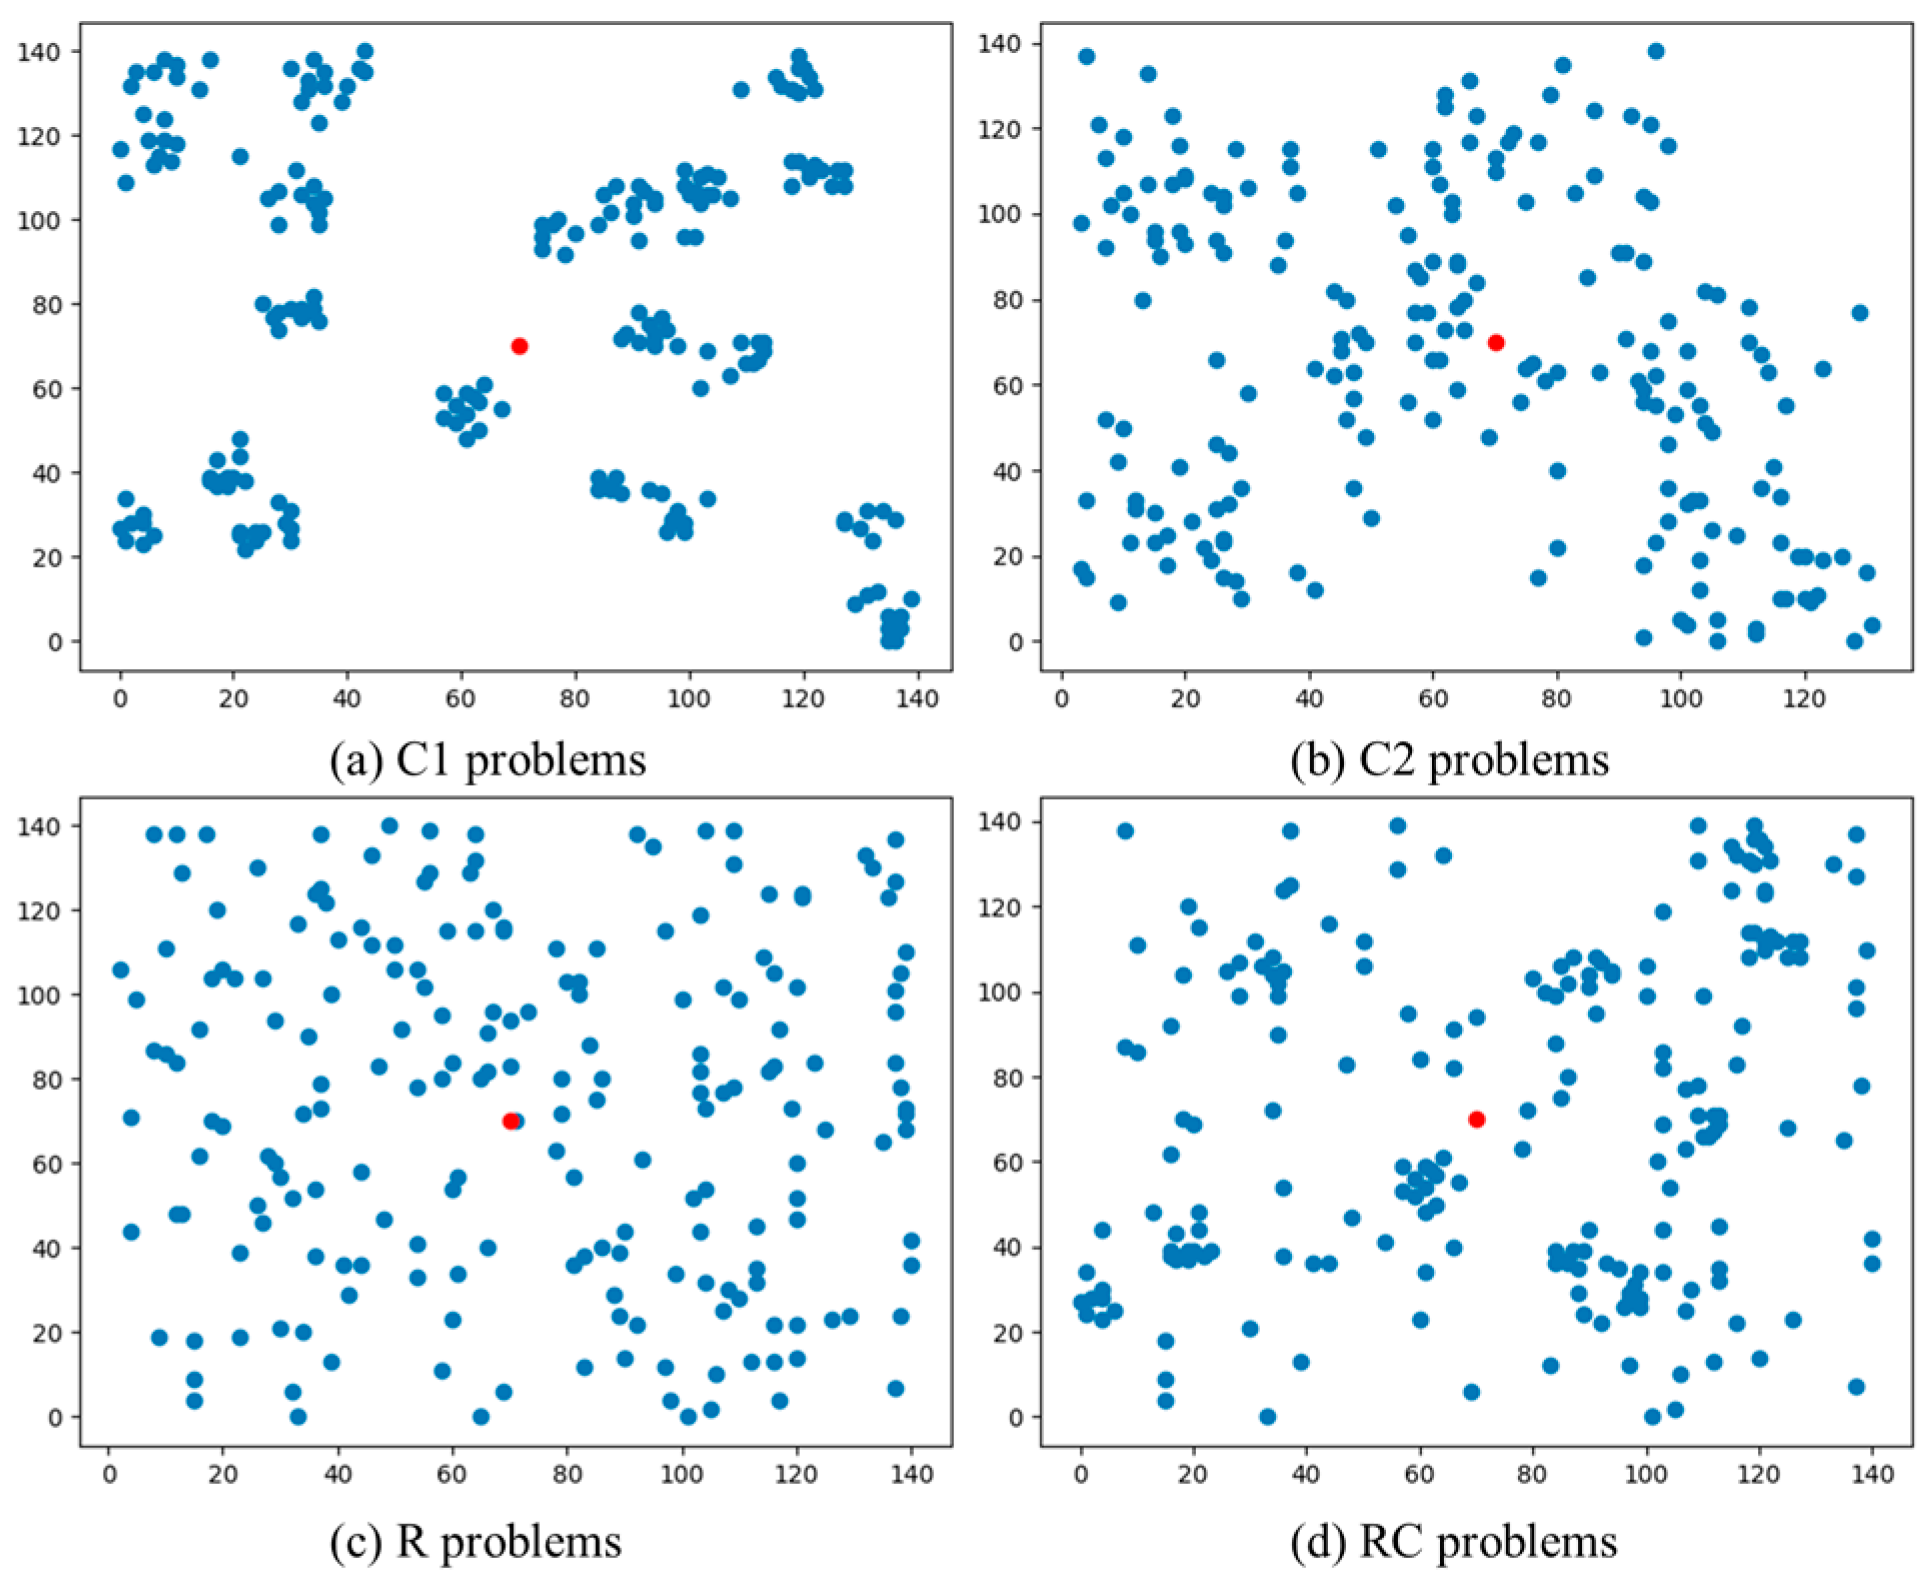
4.4. The Distribution of Solutions

To observe the population distribution under different problems and further validate the algorithm’s effectiveness from various objectives, we present the landscape of the four test problems in Figure 9. The first column shows the three-dimensional objective distribution for each algorithm, while the second, third, and fourth columns depict the dual-objective distributions of customer satisfaction and route length, route length and carbon emissions, and customer satisfaction and carbon emissions, respectively. Rows 1 to 4 in Figure 9 represent the C1, C2, R, and RC problems, respectively.
From Figure 9, it is evident that our proposed algorithm performs well across different dimensions. Note that the population in the route length and carbon emissions plot for the C1 problem is mostly concentrated along a straight line, while for C2, R, and RC, it is more scattered. This observation may be attributed to the fact that, for the C1 problem, the proposed algorithm model demonstrates a positive correlation, where the carbon emission metric for routes cannot significantly impact the overall outcome. This insight provides direction for potential improvements to our model in the future.

5. Conclusions

This paper introduced the heterogeneous green city vehicle routing problem with time windows, aiming to address the limitations of traditional VRPTW models in comprehensively accounting for diverse stakeholder interests and practical considerations in urban logistics. The HGCVRPTW considers heterogeneous vehicle attributes, recipient time sensitivity, and environmental impacts of varying road congestion levels. To effectively solve this problem, an adaptive multi-objective genetic algorithm with the GIS is proposed, which generates high-quality initial solutions tailored for different objectives and ensures the diversity of the population. Additionally, the AMMO is designed to provide opportunities for solution improvement in different evolutionary stages. The experimental results demonstrated that AMoGA-GIS achieved superior performance over NSGAIII in most benchmarks. Further component analysis validated the effectiveness of the proposed GIS and AMMO in enhancing the search capability of AMoGA-GIS.

6. Discussion

While we aimed to incorporate multiple stakeholder interests, there may still be other relevant factors and perspectives not fully considered in this study, which could influence the overall effectiveness of the proposed solution. Additionally, while environmental considerations such as power consumption and pollution were addressed, this study did not encompass all potential environmental impacts, including noise pollution and other ecological effects.
In future work, we aim to broaden the range of stakeholder perspectives and enhance the incorporation of environmental factors. This includes addressing additional environmental impacts beyond those previously considered, thereby developing a more comprehensive and effective solution. Furthermore, integrating more practical considerations into the HGCVRPTW model, such as adapting to dynamic environments and managing disruptions, will better align the model with real-world urban logistics applications. We believe that these enhancements will extend the classical VRPTW and inspire further research in holistic and practical vehicle routing optimization for urban logistics.

Author Contributions

W.Z., investigation, conceptualization, methodology, writing—review and editing; X.B., formal analysis, software, data curation; X.M., resources, supervisionAll authors have read and agreed to the published version of the manuscript.

Funding

This research was funded by the National Key Research and Development Program of China, grant number 2022YFB3305000.

Institutional Review Board Statement

Not applicable.

Informed Consent Statement

Not applicable.

Data Availability Statement

The data presented in this study are openly available in [Gehring and Homberger, “Extended SOLOMON’s VRPTW instances.” https://www.sintef.no/projectweb/top/vrptw/homberger-benchmark/, 1999], reference number [28].

Conflicts of Interest

The authors declare no conflicts of interest.

References

  1. Crainic, T.G.; Ricciardi, N.; Storchi, G. Models for evaluating and planning city logistics systems. Transp. Sci. 2009, 43, 432–454. [Google Scholar] [CrossRef]
  2. Dantzig, G.B.; Ramser, J.H. The truck dispatching problem. Manag. Sci. 1959, 6, 80–91. [Google Scholar] [CrossRef]
  3. Cao, E.; Lai, M. The open vehicle routing problem with fuzzy demands. Expert Syst. Appl. 2010, 37, 2405–2411. [Google Scholar] [CrossRef]
  4. Lei, H.; Laporte, G.; Guo, B. The capacitated vehicle routing problem with stochastic demands and time windows. Comput. Oper. Res. 2011, 38, 1775–1783. [Google Scholar] [CrossRef]
  5. Balseiro, S.R.; Loiseau, I.; Ramonet, J. An ant colony algorithm hybridized with insertion heuristics for the time dependent vehicle routing problem with time windows. Comput. Oper. Res. 2011, 38, 954–966. [Google Scholar] [CrossRef]
  6. Solomon, M.M. Algorithms for the vehicle routing and scheduling problems with time window constraints. Oper. Res. 1987, 35, 254–265. [Google Scholar] [CrossRef]
  7. Prodhon, C.; Prins, C. Metaheuristics for vehicle routing problems. In Metaheuristics; Springer: Berlin/Heidelberg, Germany, 2016; pp. 407–437. [Google Scholar]
  8. Kaboudani, Y.; Ghodsypour, S.H.; Kia, H.; Shahmardan, A. Vehicle routing and scheduling in cross docks with forward and reverse logistics. Oper. Res. 2020, 20, 1589–1622. [Google Scholar] [CrossRef]
  9. Rajabi-Bahaabadi, M.; Shariat-Mohaymany, A.; Babaei, M.; Vigo, D. Reliable vehicle routing problem in stochastic networks with correlated travel times. Oper. Res. 2021, 21, 299–330. [Google Scholar] [CrossRef]
  10. Dablanc, L. Goods transport in large European cities: Difficult to organize, difficult to modernize. Transp. Res. Part A Policy Pract. 2007, 41, 280–285. [Google Scholar] [CrossRef]
  11. Konstantakopoulos, G.D.; Gayialis, S.P.; Kechagias, E.P. Vehicle routing problem and related algorithms for logistics distribution: A literature review and classification. Oper. Res. 2022, 22, 2033–2062. [Google Scholar] [CrossRef]
  12. Kim, G.; Ong, Y.S.; Heng, C.K.; Tan, P.S.; Zhang, N.A. City vehicle routing problem (City VRP): A review. IEEE Trans. Intell. Transp. Syst. 2015, 16, 1654–1666. [Google Scholar] [CrossRef]
  13. Altabeeb, A.M.; Mohsen, A.M.; Ghallab, A. An improved hybrid firefly algorithm for capacitated vehicle routing problem. Appl. Soft Comput. 2019, 84, 105728. [Google Scholar] [CrossRef]
  14. Goksal, F.P.; Karaoglan, I.; Altiparmak, F. A hybrid discrete particle swarm optimization for vehicle routing problem with simultaneous pickup and delivery. Comput. Ind. Eng. 2013, 65, 39–53. [Google Scholar] [CrossRef]
  15. Wang, C.; Mu, D.; Zhao, F.; Sutherland, J.W. A parallel simulated annealing method for the vehicle routing problem with simultaneous pickup–delivery and time windows. Comput. Ind. Eng. 2015, 83, 111–122. [Google Scholar] [CrossRef]
  16. Schneider, M.; Stenger, A.; Goeke, D. The electric vehicle-routing problem with time windows and recharging stations. Transp. Sci. 2014, 48, 500–520. [Google Scholar] [CrossRef]
  17. Dedović, U.; Gušavac, B.A. Optimal vehicle routing in consumer goods distribution: A gnu linear programming kit-based analysis. Acadlore Trans. Appl. Math. Stat. 2023, 1, 87–95. [Google Scholar] [CrossRef]
  18. Wang, J.; Weng, T.; Zhang, Q. A two-stage multiobjective evolutionary algorithm for multiobjective multidepot vehicle routing problem with time windows. IEEE Trans. Cybern. 2019, 49, 2467–2478. [Google Scholar] [CrossRef] [PubMed]
  19. Srivastava, G.; Singh, A.; Mallipeddi, R. NSGA-II with objective-specific variation operators for multiobjective vehicle routing problem with time windows. Expert Syst. Appl. 2021, 176, 114779. [Google Scholar] [CrossRef]
  20. Kuo, R.J.; Luthfiansyah, M.F.; Masruroh, N.A.; Zulvia, F.E. Application of improved multi-objective particle swarm optimization algorithm to solve disruption for the two-stage vehicle routing problem with time windows. Expert Syst. Appl. 2023, 225, 120009. [Google Scholar] [CrossRef]
  21. Mukherjee, P.; Ramanathan, A.; Dey, S. Efficient vehicle routing problem: A machine learning and evolutionary computation approach. In Proceedings of the Companion Conference on Genetic and Evolutionary Computation (GECCO ‘23 Companion), Lisbon, Portugal, 15–19 July 2023; ACM: New York, NY, USA, 2023; pp. 3–4. [Google Scholar]
  22. Azadi, A.H.S.; Khalilzadeh, M.; Antucheviciene, J.; Heidari, A.; Soon, A. A sustainable multi-objective model for capacitated-electric-vehicle-routing-problem considering hard and soft time windows as well as partial recharging. Biomimetics 2024, 9, 242. [Google Scholar] [CrossRef]
  23. Gülmez, B.; Emmerich, M.; Fan, Y. Multi-objective optimization for green delivery routing problems with flexible time windows. Appl. Artif. Intell. 2024, 38, 2325302. [Google Scholar] [CrossRef]
  24. Huang, G.; Qi, Y.; Cai, Y.; Luo, Y.; Huang, H. A grey wolf optimizer algorithm for multi-objective cumulative capacitated vehicle routing problem considering operation time. Biomimetics 2024, 9, 331. [Google Scholar] [CrossRef] [PubMed]
  25. Khoo, T.S.; Mohammad, B.B. The parallelization of a two-phase distributed hybrid ruin-and-recreate genetic algorithm for solving multi-objective vehicle routing problem with time windows. Expert Syst. Appl. 2021, 168, 114408. [Google Scholar] [CrossRef]
  26. Costa, J.G.C.; Mei, Y.; Zhang, M.J. Learning to select initialisation heuristic for vehicle routing problems. In Proceedings of the Genetic and Evolutionary Computation Conference (GECCO ‘23), Lisbon, Portugal, 15–19 July 2023; ACM: New York, NY, USA, 2023; pp. 266–274. [Google Scholar]
  27. Deb, K.; Jain, H. An evolutionary many-objective optimization algorithm using reference-point-based nondominated sorting approach, part I: Solving problems with box constraints. IEEE Trans. Evol. Comput. 2013, 18, 577–601. [Google Scholar] [CrossRef]
  28. Gehring and Homberger. Extended SOLOMON’s VRPTW Instances. 1999. Available online: https://www.sintef.no/projectweb/top/vrptw/homberger-benchmark/ (accessed on 22 July 2024).
Figure 1. The diagram of AMoGA-GIS.
Applsci 14 06594 g001
Figure 2. The representation of solution. The orange represents the tasks of the first vehicle V1, yellow represents the tasks of the second vehicle V2, and green represents the tasks of the third vehicle V3.
Applsci 14 06594 g002
Figure 3. The crossover operation. The gene positions selected for crossover under probabilistic selection are highlighted with an orange background, where relevant genes from x2 are assigned to x1. The positions marked in red font indicate the genes to be legalized and the missing genes in x1 are identified in x2 and assigned to x1, resulting in the final legalized offspring c1.
Applsci 14 06594 g003
Figure 4. The mutation operations for allocation sequence. The orange represents the tasks of the first vehicle V1, yellow represents the tasks of the second vehicle V2, and green represents the tasks of the third vehicle V3. The arrows looping between two blocks indicate the exchange of the blocks, while an arrow pointing from one block to a gap signifies the insertion of the block into that gap.
Applsci 14 06594 g004
Figure 5. The mutation operations for task allocation quantity. The orange represents the tasks of the first vehicle V1, yellow represents the tasks of the second vehicle V2, and green represents the tasks of the third vehicle V3. The white represents the allocation between three vehicles. The arrows looping between two blocks indicate the exchange of the blocks, while an arrow pointing from one block to a gap signifies the insertion of the block into that gap.
Applsci 14 06594 g005
Figure 6. The distribution of tasks. The red dots represent warehouses, and the blue dots represent points that require planning and allocation.
Applsci 14 06594 g006
Figure 7. The comparison results between NSGAIII and AMoGA-GIS.
Applsci 14 06594 g007
Figure 8. The component analysis results of AMoGA-GIS.
Applsci 14 06594 g008
Figure 9. The distribution of solutions to different problems.
Applsci 14 06594 g009
Table 1. The comparison results between NSGAIII and AMoGA-GIS.
FuncIGDHVFuncIGDHV
NSGAIIIAMoGA-GISNSGAIIIAMoGA-GISNSGAIIIAMoGA-GISNSGAIIIAMoGA-GIS
C1_16.05 × 1055.03 × 1051.08 × 10123.76 × 1012R_17.28 × 1055.44 × 1052.51 × 10111.48 × 1012
C1_27.90 × 1054.32 × 1054.72 × 10116.29 × 1012R_26.36 × 1054.58 × 1054.74 × 10112.41 × 1012
C1_37.14 × 1055.46 × 1053.44 × 10112.65 × 1012R_34.68 × 1053.76 × 1051.11 × 10121.63 × 1012
C1_47.64 × 1054.92 × 1052.92 × 10112.38 × 1012R_46.59 × 1055.23 × 1051.80 × 10111.37 × 1012
C1_58.10 × 1056.00 × 1051.10 × 10126.14 × 1012R_56.78 × 1054.73 × 1053.51 × 10112.46 × 1012
C1_69.25 × 1056.56 × 1054.11 × 10115.72 × 1012R_65.74 × 1054.13 × 1051.13 × 10123.67 × 1012
C1_74.90 × 1053.59 × 1055.46 × 10111.91 × 1012R_78.20 × 1055.41 × 1051.76 × 10112.05 × 1012
C1_87.33 × 1056.37 × 1056.55 × 10111.81 × 1012R_85.54 × 1054.90 × 1057.11 × 10111.47 × 1012
C1_96.21 × 1055.43 × 1052.13 × 10123.00 × 1012R_95.29 × 1054.22 × 1052.13 × 10116.48 × 1011
C1_108.07 × 1055.00 × 1055.94 × 10116.75 × 1012R_106.01 × 1053.86 × 1054.14 × 10113.27 × 1012
C2_12.40 × 1051.46 × 1051.73 × 10125.48 × 1012RC_14.15 × 1052.69 × 1051.45 × 10123.02 × 1012
C2_22.43 × 1055.38 × 1041.70 × 10124.70 × 1012RC_26.16 × 1052.61 × 1051.08 × 10129.35 × 1012
C2_35.64 × 1053.98 × 1051.31 × 10126.70 × 1012RC_36.27 × 1056.72 × 1052.34 × 10122.56 × 1012
C2_41.21 × 1051.80 × 1053.00 × 10125.18 × 1012RC_44.02 × 1052.71 × 1052.88 × 10111.42 × 1012
C2_54.34 × 1051.97 × 1051.76 × 10127.91 × 1012RC_54.71 × 1052.33 × 1051.50 × 10127.27 × 1012
C2_68.53 × 1056.43 × 1051.17 × 10124.72 × 1012RC_65.98 × 1054.10 × 1054.24 × 10113.88 × 1012
C2_78.99 × 1058.19 × 1051.80 × 10127.67 × 1012RC_75.52 × 1054.03 × 1051.31 × 10122.79 × 1012
C2_83.24 × 1051.30 × 1052.12 × 10127.55 × 1012RC_86.51 × 1053.74 × 1051.04 × 10127.23 × 1012
C2_96.40 × 1053.59 × 1051.97 × 10129.86 × 1012RC_95.39 × 1053.30 × 1056.79 × 10113.30 × 1012
C2_107.52 × 1055.75 × 1052.80 × 10113.92 × 1012RC_106.01 × 1055.22 × 1048.48 × 10112.93 × 1012
results(19/0/1)(20/0/0)results(19/1/0)(20/0/0)
avg6.16 × 1054.38 × 1051.22 × 10125.21 × 1012avg5.86 × 1053.95 × 1057.98 × 10113.21 × 1012
better28.88%325.52%better32.58%302.08%
Table 2. The component analysis of AMoGA-GIS.
FuncIGDHV
NSGAIIINSGAIII-GISMoGA-GISAMoGA-GISNSGAIIINSGAIII-GISMoGA-GISAMoGA-GIS
C1_1* 6.05 × 1057.48 × 1054.91 × 1055.03 × 105* 1.08 × 10123.49 × 10113.40 × 10123.76 × 1012
C1_27.90 × 105* 6.08 × 1054.63 × 1054.32 × 105* 4.72 × 10112.38 × 10125.77 × 10126.29 × 1012
C1_37.14 × 105* 6.57 × 1055.56 × 1055.46 × 1053.44 × 1011* 1.13 × 10121.52 × 10122.65 × 1012
C1_47.64 × 105* 6.50 × 1055.46 × 1054.92 × 1052.92 × 1011* 1.00 × 10121.84 × 10122.38 × 1012
C1_5* 8.10 × 1058.81 × 1056.00 × 1055.07 × 105* 1.10 × 10126.78 × 10115.60 × 10126.14 × 1012
C1_69.25 × 105* 7.32 × 1056.78 × 1056.56 × 1054.11 × 1011* 3.62 × 10123.91 × 10125.72 × 1012
C1_7* 4.90 × 1054.98 × 1053.43 × 1053.59 × 105* 5.46 × 10112.37 × 10111.15 × 10121.91 × 1012
C1_8* 7.33 × 1057.63 × 1055.62 × 1056.37 × 1056.55 × 1011* 7.89 × 10112.16 × 10121.81 × 1012
C1_9* 6.21 × 1057.77 × 1055.58 × 1055.43 × 105* 2.13 × 10126.55 × 10114.15 × 10123.00 × 1012
C1_108.07 × 105* 7.23 × 1055.56 × 1055.00 × 1055.94 × 1011* 1.13 × 10125.33 × 10126.75 × 1012
C2_1* 2.40 × 1053.62 × 1052.15 × 1051.46 × 105* 1.73 × 10121.29 × 10125.39 × 10125.48 × 1012
C2_22.43 × 105* 8.42 × 1051.73 × 1045.38 × 1041.70 × 1012* 5.32 × 10125.79 × 10124.70 × 1012
C2_3* 5.64 × 1056.94 × 1054.85 × 1053.98 × 1051.31 × 1012* 1.33 × 10126.35 × 10126.70 × 1012
C2_41.21 × 105* 6.85 × 1041.45 × 1051.80 × 105* 3.00 × 10128.61 × 10114.00 × 10125.18 × 1012
C2_54.34 × 105* 3.02 × 1051.83 × 1051.97 × 1051.76 × 1012* 6.66 × 10128.92 × 10127.91 × 1012
C2_68.53 × 105* 7.49 × 1055.49 × 1056.43 × 1051.17 × 1012* 3.63 × 10126.20 × 10124.72 × 1012
C2_78.99 × 105* 8.58 × 1057.99 × 1058.19 × 1051.80 × 1012* 3.35 × 10126.41 × 10127.67 × 1012
C2_83.24 × 105* 2.52 × 1051.98 × 1051.30 × 1052.12 × 1012* 4.88 × 10127.22 × 10127.55 × 1012
C2_96.40 × 105* 5.63 × 1052.79 × 1053.59 × 1051.97 × 1012* 2.62 × 10121.25 × 10139.86 × 1012
C2_107.52 × 105* 6.73 × 1056.40 × 1055.75 × 1052.80 × 1011* 2.34 × 10122.84 × 10123.92 × 1012
R_1* 7.28 × 1057.36 × 1055.17 × 1055.44 × 105* 2.51 × 10111.87 × 10111.87 × 10121.48 × 1012
R_2* 6.36 × 1057.08 × 1054.85 × 1054.58 × 105* 4.74 × 10112.88 × 10112.01 × 10122.41 × 1012
R_3* 4.68 × 1055.52 × 1053.93 × 1053.76 × 105* 1.11 × 10122.62 × 10111.54 × 10121.63 × 1012
R_46.59 × 105* 6.30 × 1055.48 × 1055.23 × 1051.80 × 1011* 5.65 × 10111.03 × 10121.37 × 1012
R_56.78 × 105* 6.46 × 1054.36 × 1054.73 × 1053.51 × 1011* 4.18 × 10112.15 × 10122.46 × 1012
R_6* 5.74 × 1056.70 × 1054.63 × 1054.13 × 1051.13 × 1012* 1.82 × 10112.46 × 10123.67 × 1012
R_78.20 × 105* 7.57 × 1055.96 × 1055.41 × 1051.76 × 1011* 4.26 × 10111.82 × 10122.05 × 1012
R_8* 5.54 × 1056.86 × 1054.12 × 1054.90 × 105* 7.11 × 10111.93 × 10112.37 × 10121.47 × 1012
R_95.29 × 105* 4.67 × 1054.40 × 1054.22 × 1052.13 × 1011* 2.59 × 10116.38 × 10116.48 × 1011
R_10* 6.01 × 105* 6.01 × 1053.90 × 1053.86 × 105* 4.14 × 10113.59 × 10112.92 × 10123.27 × 1012
RC_1* 2.69 × 1054.52 × 1052.89 × 1054.15 × 1051.45 × 1012* 6.72 × 10111.73 × 10123.02 × 1012
RC_26.16 × 105* 5.15 × 1053.91 × 1052.61 × 1051.08 × 1012* 1.91 × 10127.14 × 10129.35 × 1012
RC_3* 6.27 × 1057.54 × 1056.69 × 1056.72 × 105* 2.34 × 10124.23 × 10111.80 × 10122.56 × 1012
RC_44.02 × 105* 3.99 × 1052.12 × 1052.71 × 1052.88 × 1011* 4.01 × 10112.09 × 10121.42 × 1012
RC_5* 4.71 × 105* 4.75 × 1052.91 × 1052.33 × 1051.50 × 1012* 1.86 × 10125.30 × 10127.27 × 1012
RC_65.98 × 105* 5.00 × 1053.43 × 1054.10 × 105* 4.24 × 10111.45 × 10123.32 × 10123.88 × 1012
RC_7* 5.52 × 1055.92 × 1052.99 × 1054.03 × 1051.31 × 1012* 6.28 × 10114.43 × 10122.79 × 1012
RC_86.51 × 105* 4.61 × 1053.62 × 1053.74 × 1051.04 × 1012* 3.29 × 10125.23 × 10127.23 × 1012
RC_95.39 × 105* 3.53 × 1053.11 × 1053.30 × 1056.79 × 1011* 3.44 × 10125.12 × 10123.30 × 1012
RC_104.61 × 105* 3.72 × 1051.57 × 1055.22 × 1048.48 × 1011* 1.50 × 10124.55 × 10122.93 × 1012
avg5.94 × 1055.65 × 1054.22 × 1054.18 × 1051.01 × 10121.57 × 10124.00 × 10124.21 × 1012
better29.62%26.01%0.86%0%316.26%167.32%5.21%0%
* representing the winners of NSGAIII and NSGAIII-GIS. Bold values indicating the best performance in each evaluation metric.
Disclaimer/Publisher’s Note: The statements, opinions and data contained in all publications are solely those of the individual author(s) and contributor(s) and not of MDPI and/or the editor(s). MDPI and/or the editor(s) disclaim responsibility for any injury to people or property resulting from any ideas, methods, instructions or products referred to in the content.

