Article

Chloride Resistance of Assembled Bridge Piers Reinforced with Epoxy-Coated Steel Bars

1
College of Civil Engineering and Architecture, Zhejiang University, Hangzhou 310058, China
2
China Railway Design Corporation, Tianjin 300308, China
3
Guangxi Xinfazhan Communication Group Co., Ltd., Nanning 530029, China
*
Author to whom correspondence should be addressed.
Appl. Sci. 2024, 14(15), 6609; https://doi.org/10.3390/app14156609 (registering DOI)
Submission received: 23 June 2024 / Revised: 15 July 2024 / Accepted: 22 July 2024 / Published: 28 July 2024
(This article belongs to the Section Civil Engineering)

Abstract

:
To reveal the influence of joint type and epoxy-coated steel bar surface damage on the durability of assembled bridge piers, this study simulated the potential damage to epoxy-coated steel bars at various stages of an actual construction process by bending, scratching, and knocking. The pier inter-segmental joint and the pier-bearing platform joint were designed to highlight the critical zones affecting the durability of sea-crossing bridge substructures. The migration of chloride ions into the concrete was accelerated by applying a constant voltage DC electric field. The electrochemical indexes of epoxy-coated steel bars and chloride ion content in concrete were measured regularly. Results show that the corrosion risk and corrosion rate of steel bars increase significantly when the damaged area ratio of epoxy coating is higher than 5%. The chloride ion transport rate at the interface of the pier-bearing platform joint is about 5 times that of the pier inter-segmental joint. The service life of the pier-bearing platform joint is only 1/2 that of the pier inter-segmental joint when epoxy-coated steel bars with the same treatment are used.

1. Introduction

Steel bar corrosion is the primary cause of deterioration in concrete structures [1], leading to significant losses worldwide each year [2,3]. In the United States alone, the direct corrosion costs for highway bridges amounted to approximately USD 8.3 billion in 2014, and the American Society of Civil Engineers (ASCE) predicted that infrastructure maintenance will necessitate an investment of around USD 2 trillion by 2025 [4]. Consequently, enhancing the corrosion resistance of steel bars in concrete remains a critical focus in durability research.
Epoxy-coated steel bars are currently one of the most commonly used corrosion-resistant steel bars in major coastal engineering projects. Since its introduction in the 1970s [4,5,6], epoxy-coated steel bars have been widely regarded as having excellent corrosion resistance [5,7,8,9]. Therefore, early research mainly focused on mechanical properties, such as bond strength between epoxy-coated steel bars and concrete [4,10,11], with less emphasis on corrosion behavior. However, some reports and related studies suggest that the corrosion resistance of epoxy-coated steel bars may not be as excellent as previously thought. Since the 1990s, there have been some reports on the corrosion of epoxy-coated steel bars in some newly constructed projects [4,12]. Investigations suggested that the main cause of premature corrosion can be attributed to the damage of the epoxy coating on the surface of steel bars during transportation, processing, and installation, which reduces the protective effect on the internal steel bars [2,13]. According to the literature statistics by Yan L et al. [4], the research focus on epoxy-coated steel bars has gradually shifted from mechanical properties to corrosion behavior since the 2000s. Huang et al. [8] found that corrosion of epoxy-coated steel bars often occurs at the damaged areas of the coating. Wei Jie et al. [2] employed a 1 mm diameter drill to create pre-existing damage to the epoxy coatings and found that corrosion was prone to occur in damaged areas of epoxy-coated steel bars in concrete simulating solutions with pH values below 9.2 and different pH values containing 0.6 mol/L NaCl. Cao et al. [14] conducted electrochemical corrosion analysis on epoxy-coated steel bars with undamaged coatings and pre-existing coating damages. The results showed that epoxy-coated steel bars with untreated surfaces exhibited a steep polarization curve slope with no corrosion characteristics. In contrast, steel bars with damaged coatings exhibited significant corrosion polarization curve characteristics, indicating a significant decrease in corrosion resistance. Additionally, the larger the area of coating damage, the faster the corrosion rate. Wang X et al. [9] studied the effect of pre-exposure loading on the corrosion behavior of epoxy-coated steel bars under wet–dry cyclic conditions. They suggested that loading caused cracks in the concrete protective layer and micro-cracks in the coating and generated tensile stress in the steel bars, leading to separation between the coating and the steel substrate, thereby accelerating the corrosion of epoxy-coated steel bars.
Compared with the traditional cast-in-place concrete structure, the assembled concrete structure has the advantages of labor savings, fast construction speed, and less pollution to the environment, and it has been promoted for use [15]. However, the presence of a loose and porous transition layer at the interface of the assembled joint is prone to form a chloride ion transport pathway, leading to premature corrosion of the steel bar and deterioration of the structural durability [16,17]. Emmons P.H. et al. [18] studied the new and old concrete bond area by dividing it into three parts: new concrete, old concrete, and interface zone. Qin et al. [19] concluded that uncoordinated shrinkage of old and new concrete is an important reason for the existence of defects at the old and new concrete interface. The mechanical properties and durability of the interface between old and new concrete can be improved by adding expansion agents to the concrete in the backing zone. Saito et al. [20] showed that appropriate compressive stress can improve the chloride resistance of concrete. Therefore, for an assembled concrete bridge in the chloride environment, the durability of the prefabricated joint should be addressed.
From existing studies, the following shortcomings can be concluded: (1) Almost all of the studies used specimens containing the interface between the old and new concrete to simulate the assembled connection joint and did not restore the actual assembled joint type or the influence of the construction process; (2) The methods for introducing damage to the epoxy coating on the steel bar surface were too simplistic, mostly involving scratching, peeling, or drilling to remove a regular area, resulting in concentrated surface damage that did not accurately replicate actual damage in engineering practice; (3) Few studies have linked the corrosion of epoxy-coated steel bars with chloride ion penetration processes, thereby failing to reflect the variety of corrosion behavior with the spatial and temporal distribution of chloride ions. Therefore, to understand the corrosion behavior of epoxy-coated steel bars with surface damage in assembled concrete bridge piers in a chloride environment, the steel bars were embedded into two typical connection joints of the assembled pier of a sea-crossing railway bridge. To simulate the frequent damage types that may exist in the construction process, the epoxy-coated steel bars were treated in three different ways: bending, scratching, and knocking. By testing the electrochemical indexes of steel bars and the chloride ion content in concrete, the critical chloride ion contents of the surface-damaged epoxy-coated steel bars were determined for both types of joints. Finally, based on the obtained parameters, the service life of the assembled concrete bridge pier joints was predicted using a numerical method. The results can provide valuable insight into the application of epoxy-coated steel bars in such prefabricated sea-crossing bridges.

2. Materials, Specimens, and Methods

2.1. Experimental Materials and Mix Proportions

The epoxy-coated steel bars used in this study were sourced from Fusteel Co., Ltd. (Huzhou, China). The internal carbon steel bar is 16 mm in diameter and HRB400 in strength grade. The external epoxy coating was fusion bonded to the surface of the reinforcement by electrostatic spraying at 230 °C. The construction materials included ordinary Portland cement with a grade of 42.5, crushed stone as coarse aggregate with a maximum particle size of 20 mm, and manufactured sand as fine aggregate. Additives such as Class I fly ash and S105-grade ground granulated blast furnace slag (GGBS) were incorporated. The concrete admixtures featured PCA®-IV water reducer and HME®-II expansive agent, both produced by Sobute New Materials Co., Ltd. (Nanjing, China). The YM15 anchorage system and φs 15.2 mm (0.6″) steel strand from Liuzhou OVM Machinery Co., Ltd. (Liuzhou, China) were utilized, complemented by C80 grade high-strength non-shrink grouting mortar. The positive and negative electrodes employed in the electromigration test were stainless-steel mesh sheets with an aperture of 10 mm and a wire diameter of 1 mm. The specific concrete mix proportions used are detailed in Table 1.

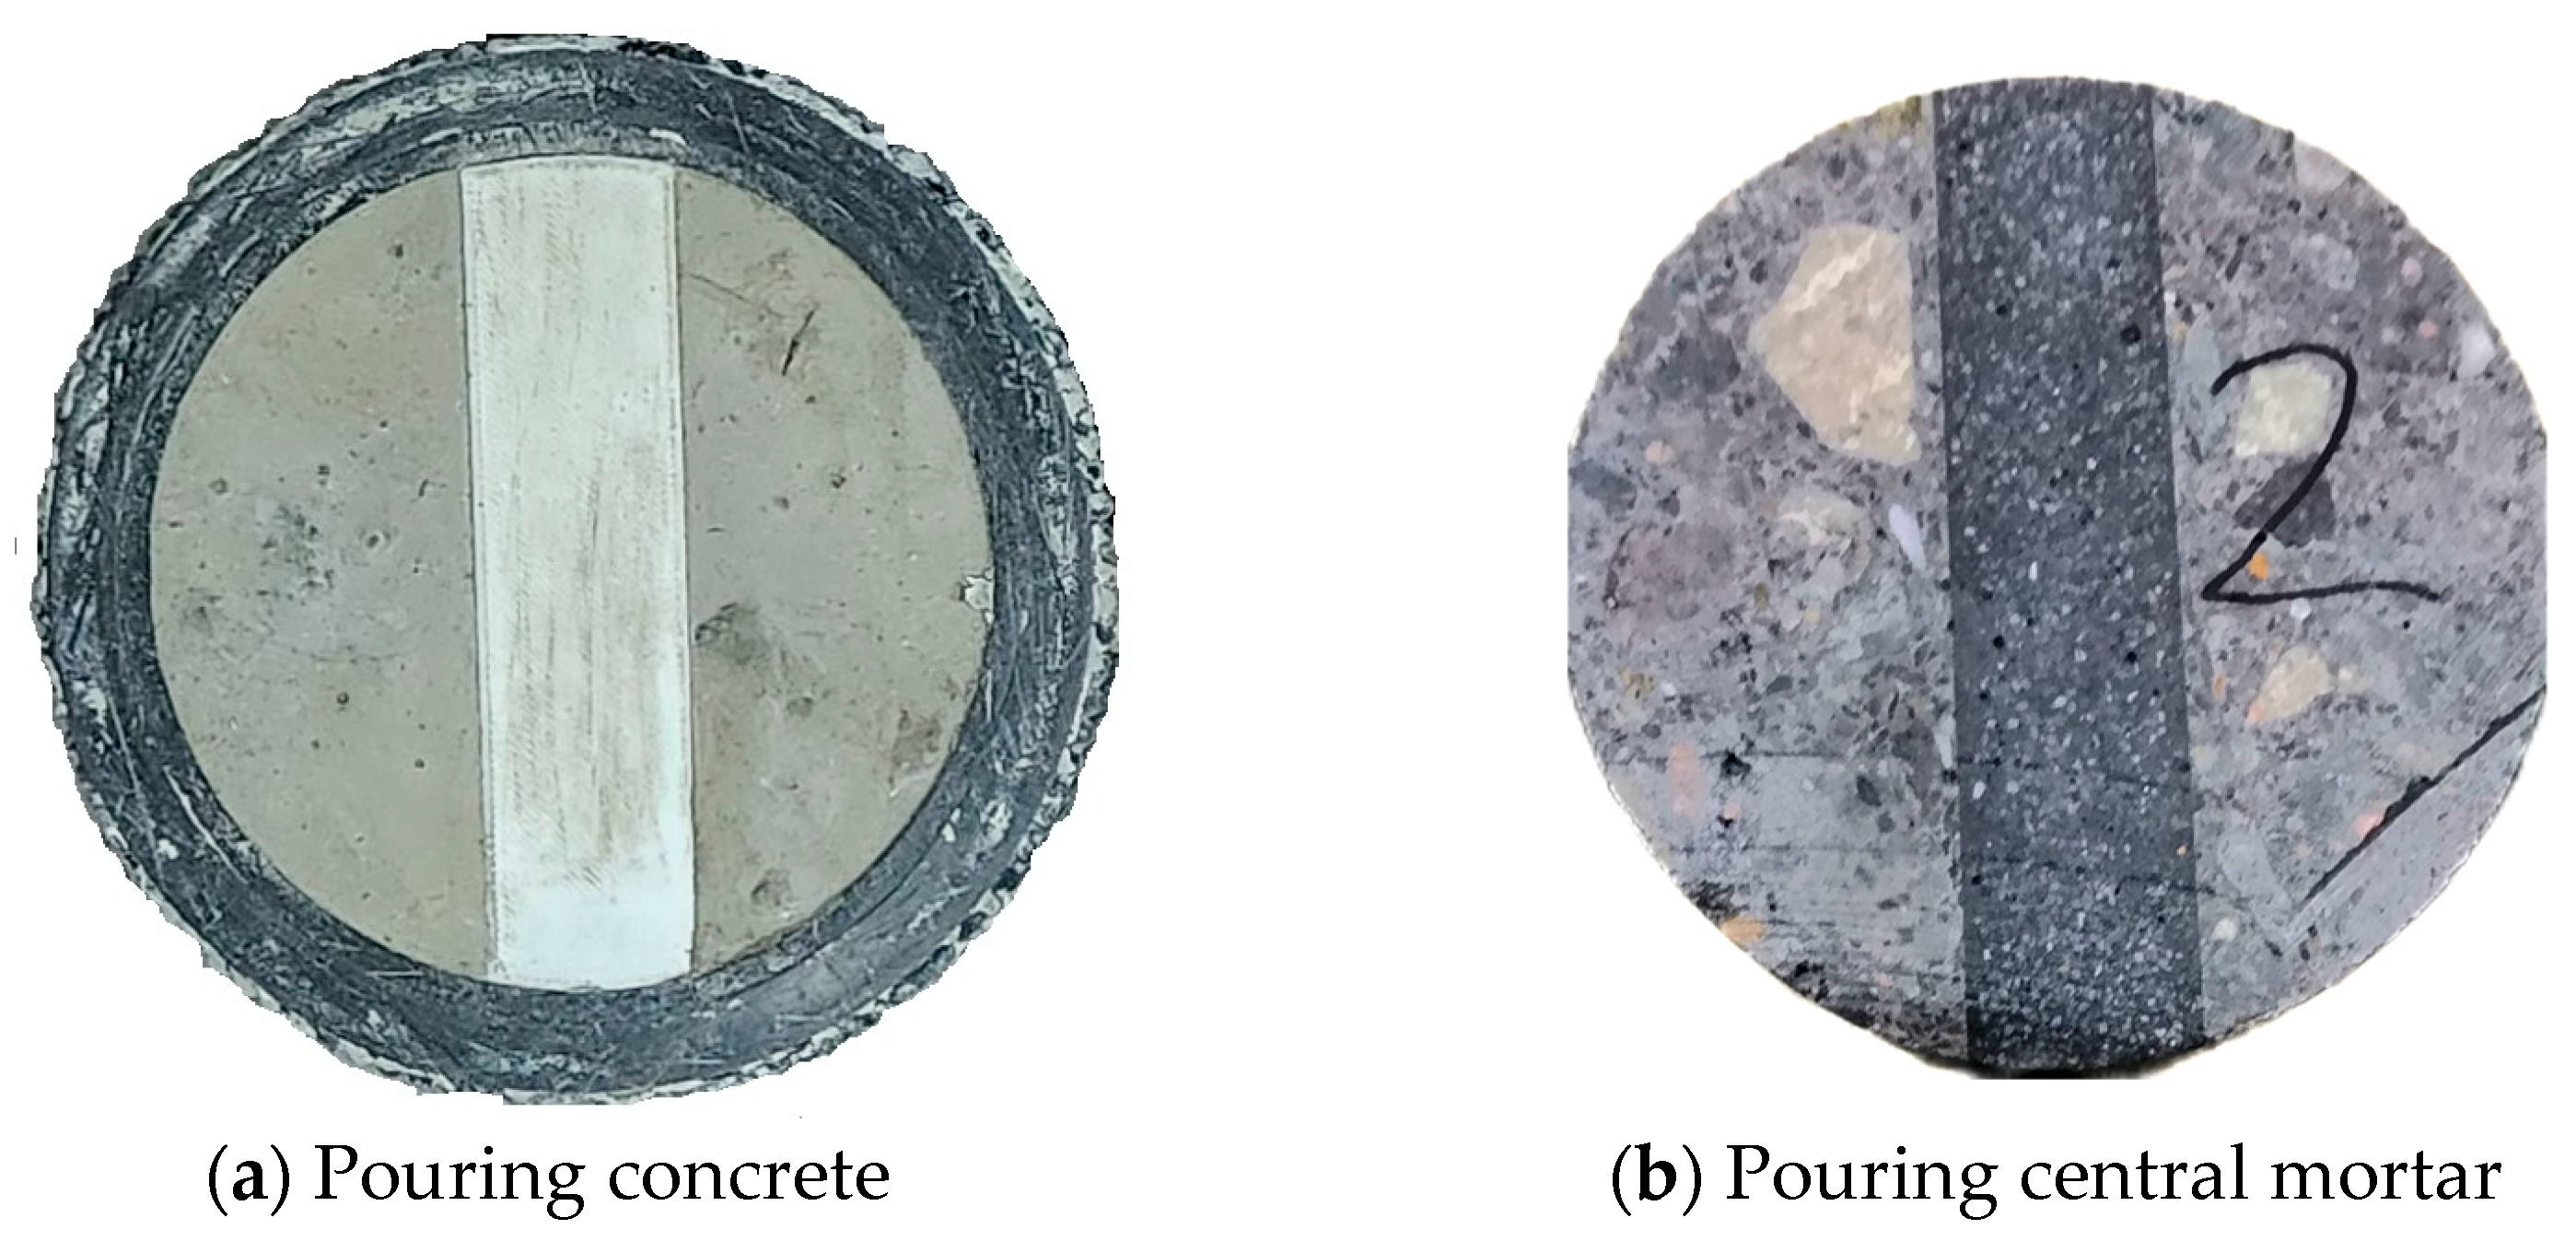
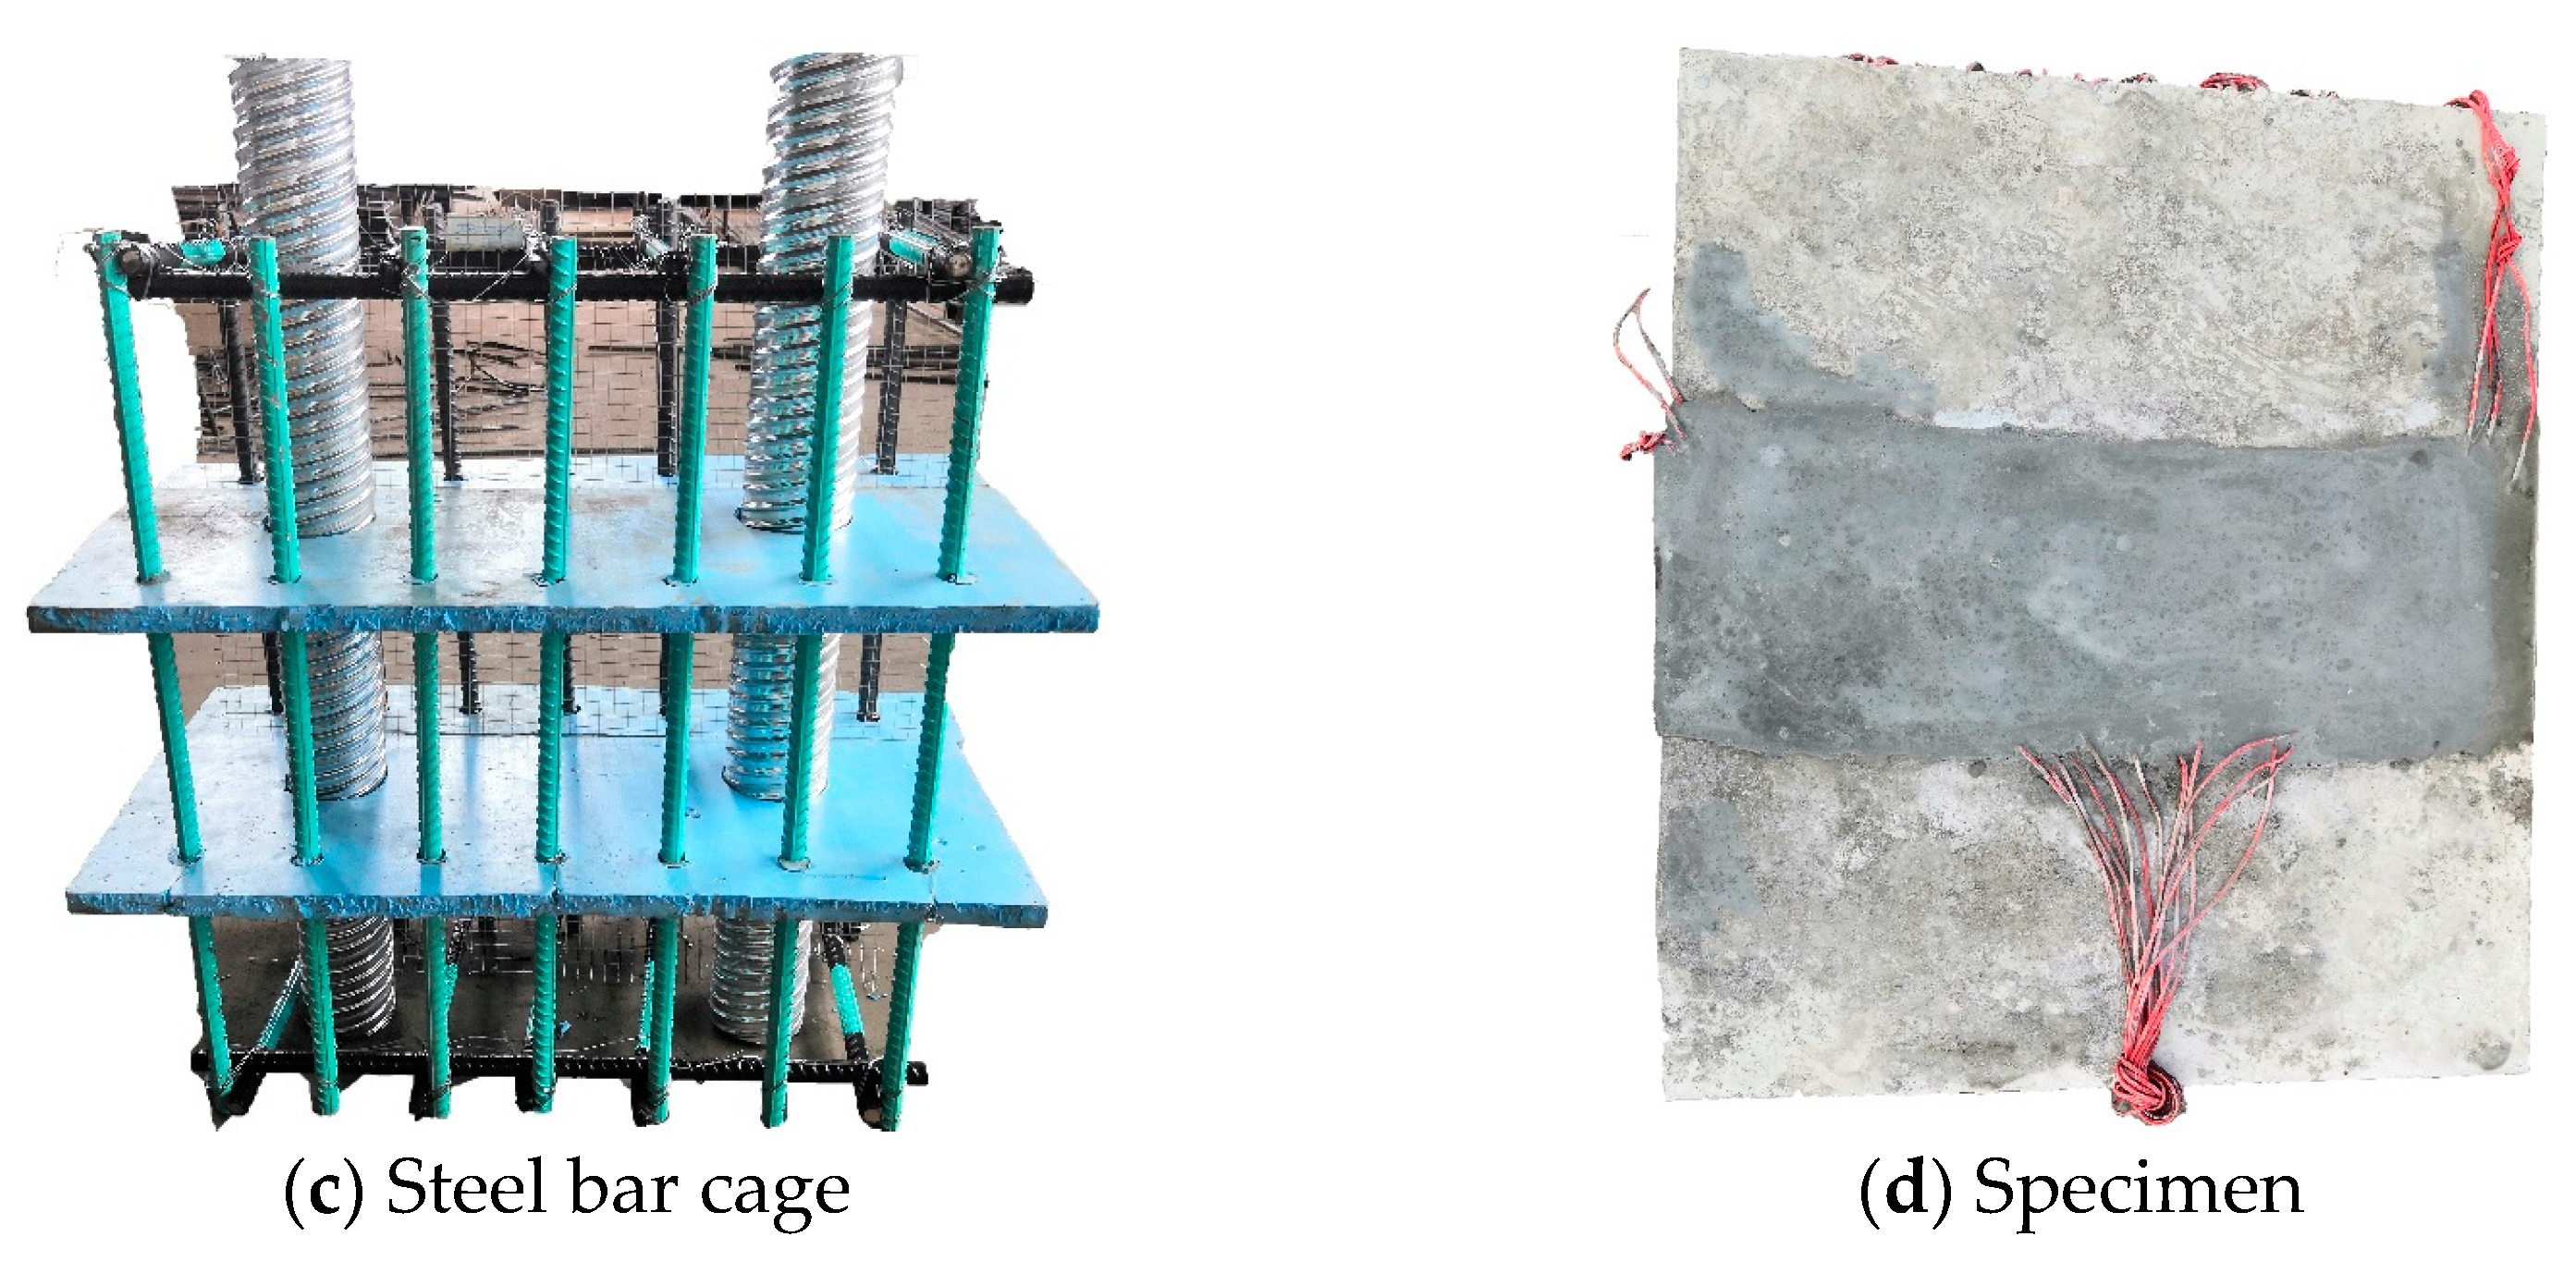
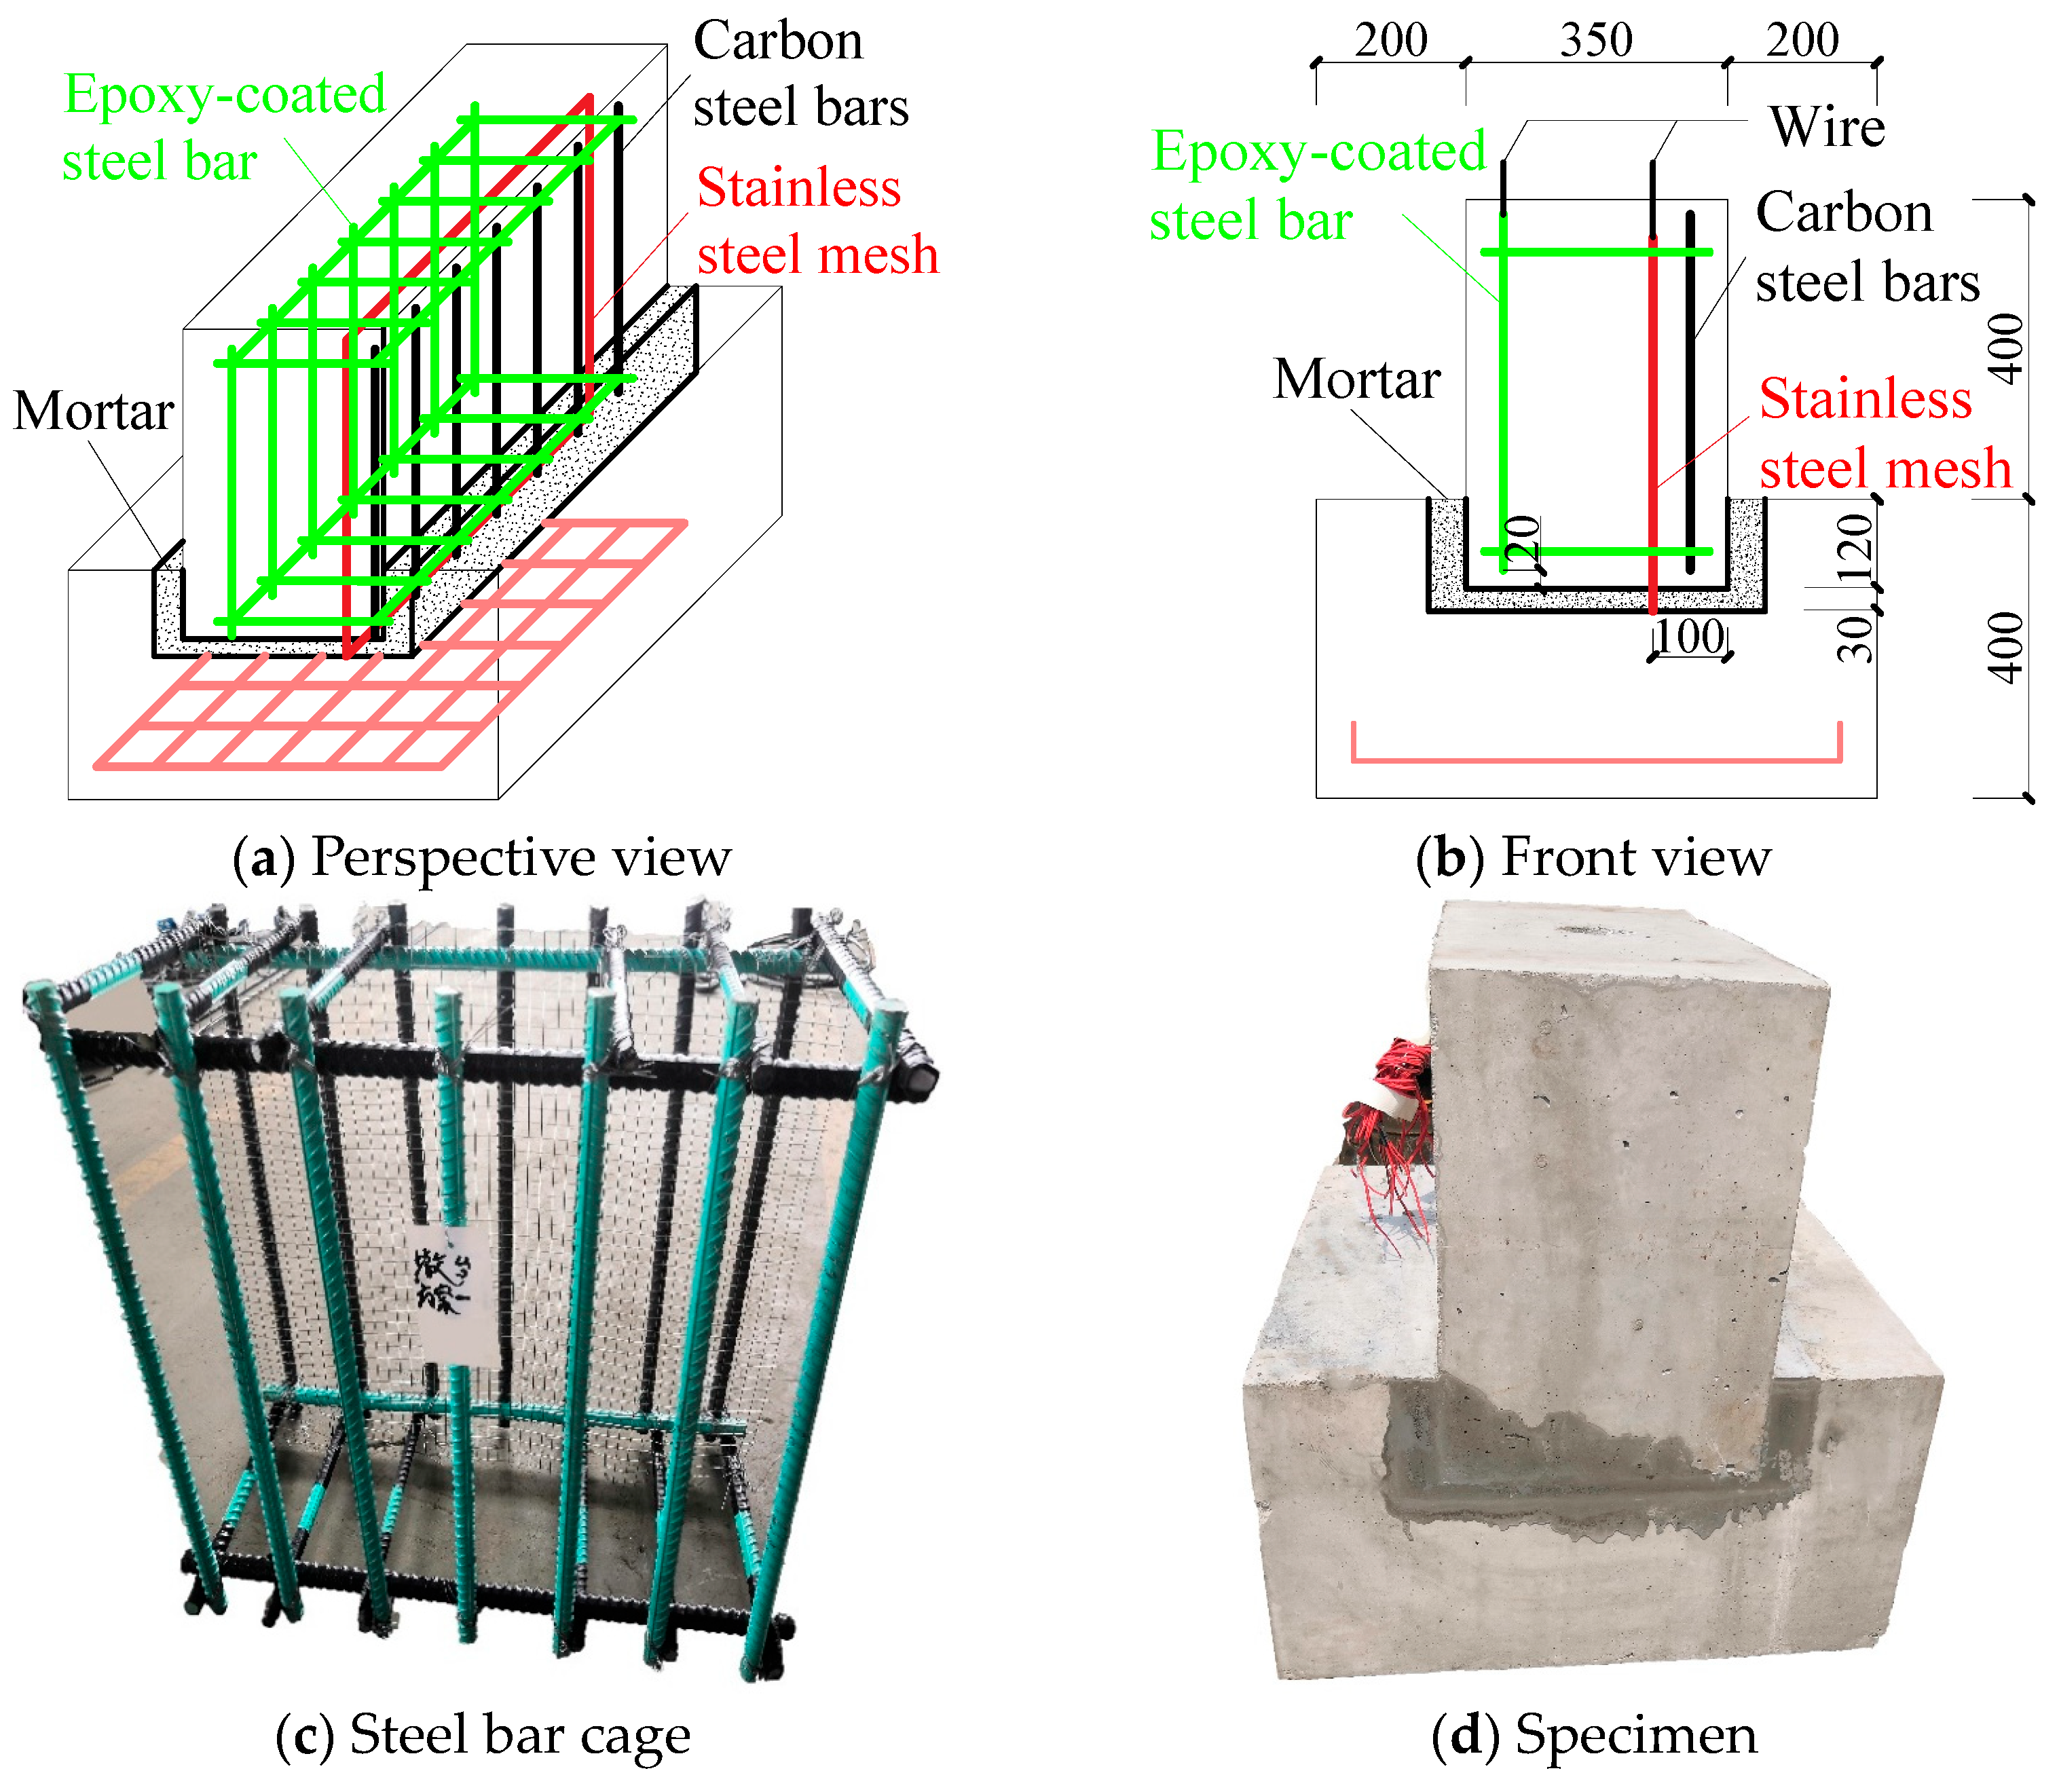
2.2. Specimen Design and Fabrication

Two typical joints used in sea-crossing bridge piers were adopted in the experimental study. Joint 1, using a post-cast strip with prestressing between pier segments, is shown in Figure 1. Joint 2, using a grouted connection between the pier base segment and bearing platform, is detailed in Figure 2. The construction process of Joint 1 involved pouring C50 concrete into the formwork to manufacture the upper and lower pier bodies with continuous steel bars passing through. After curing for 28 days, C60 concrete was poured into the reserved post-pouring strip section in the middle of the specimen. Once the concrete reached the design strength, 7-φs 15.2 mm self-locking prestressed steel strands were inserted into the corrugated pipes and prestressed with a controlled stress of 640 MPa. For Joint 2, both the pier body and the bearing platform were prefabricated using C50 concrete with grooves reserved. After the concrete reached the design strength, the two parts were lifted and aligned according to the dimensions shown in Figure 2b, followed by grouting the grooves with a high-strength non-shrinkage mortar.
On one side of the reinforcing cage, a stainless-steel mesh was fixed as the anode of the electromigration system. The protective layer thickness of the epoxy-coated steel bars is 35 mm. To test their corrosion electrochemical signals, a wire was led out from each end and side of the steel bars. The remaining steel bars were not the focus of this experiment but acted as auxiliary steel bars to form the reinforcing cage for specimen shaping. To avoid short circuits during the electromigration experiment and mutual interference of the steel bars during electrochemical testing, insulated electrical tape was wound at each lap joint of the reinforcing cage. Three specimens were fabricated for Joint 1, while six specimens were fabricated for Joint 2.
Each specimen consisted of 3 untreated epoxy-coated steel bars and 4 steel bars with pre-damaged epoxy coating treated in different methods. The epoxy-coated steel bars were subjected to bending, scratching, and knocking treatments to simulate various types of coating damage that might occur during the construction. The areas of coating damage were measured using a 3D Laser Scanner and used as the surface area of the working electrode for subsequent electrochemical tests. The steel bars with various types of coating damage are illustrated in Figure 3.

2.3. Experimental Method

2.3.1. Electromigration Method

To ensure that only one side of the specimen was exposed to chloride ion erosion, other surfaces of the specimen, except for the erosion side, were sealed with epoxy resin. After the epoxy resin was completely cured, the specimens were placed in a container filled with a 15% sodium chloride solution, with the water level controlled to be 10 cm below the top surface of the specimens. The stainless-steel mesh inside the specimen served as the anode of the electromigration test and was connected to the positive pole of the DC-stabilized power supply. The stainless-steel mesh fixed on the erosion side of the specimen surface was connected to the negative pole of the power supply as the cathode of the electromigration test. The electromigration test consists of 12 cycles, with the power held at 50 volts for the first 7 days of each cycle and turned off on the 8th day. Figure 4 illustrates the design diagram of the electromigration system.

2.3.2. Electrochemical Testing Method

The electrochemical testing instrument used is the CS350H electrochemical workstation (Wuhan Corrtest Instrument Co., Ltd., Wuhan, China), with a potential control range of ±10 V and a potential sensitivity of 10 μV. Electrochemical testing was performed during the last 3 h of the power-off phase of each cycle described in Section 2.3.1. The circuit connection adopted a three-electrode system (as shown in Figure 5). The working electrode (WE) was connected to the wire led out from the tested steel bar, the counter electrode (CE) was connected to the wire led out from the stainless-steel mesh inside the specimen, and the reference electrode (RE) was connected to the saturated calomel electrode (SCE), with its lower end connected to the specimen through a wet sponge placed on the surface of the specimen directly above the tested steel bar. During the test, the open-circuit potential of the test should stabilize (with fluctuations less than 0.5 mV/min) before dynamic potential scanning. The scanning range was ±100 mV, and the scanning rate was 0.5 mV/s to obtain the polarization curves of each steel bar within the measured range.
For the linear portion (Tafel linear segment) of the E log i polarization curve, extrapolating it to intersect at the self-corrosion potential ( E c o r r ) , the intersection point represents the logarithm of the corrosion current density ( log i c o r r ) of the tested steel bar (as shown in Figure 6a). For the E i polarization curve, the slope of the linear segment (within ±5 mV range of E c o r r ) represents the polarization resistance Rp of the tested steel bar (as shown in Figure 6b).

2.3.3. Chloride Ion Content Testing Method

Before testing, the NaCl solution in the container was emptied. A drill with a diameter of 8 mm was used to extract powder at the pier and interface locations after the surface of the specimen was dry. The positions and depths of the powder drilling are illustrated in Figure 7. At each location of Joint 1 and pier segment of Joint 2, samples of at least 5 g were collected every 5 mm, drilling to a depth of 50 mm. Along the interface of Joint 2, samples were collected every 10 mm, drilling to a depth of 150 mm to ensure sufficient powder collection. After drilling, the collected powder samples were bagged and labeled, and the holes were filled with cement paste.
Before testing, the powder samples were dried, passed through a 200-mesh sieve, and weighed. Then, the powder was transferred into a centrifuge tube containing 30 mL of deionized water. After vigorous shaking, the suspension was stood for 24 h before filtering. The rapid chloride ion concentration tester (RCT) was used to measure the chloride ion concentration in the filtrate. Finally, Equation (1) was adopted to calculate the chloride ion content in the concrete (in mass percentage).
W C l = m C l m s × 100 % = C C l V 0 M C l m s × 100 %
where W C l is the chloride ion content in the concrete (%); m C l and m s are the masses of chloride ions and concrete powder in the measured sample (g), respectively; C C l is the concentration of chloride ions in the filtrate (mol/L); V 0 is the volume of the solution (0.03 L); M C l is the molar mass of chloride ions (35.45 g/mol).

3. Results and Discussion
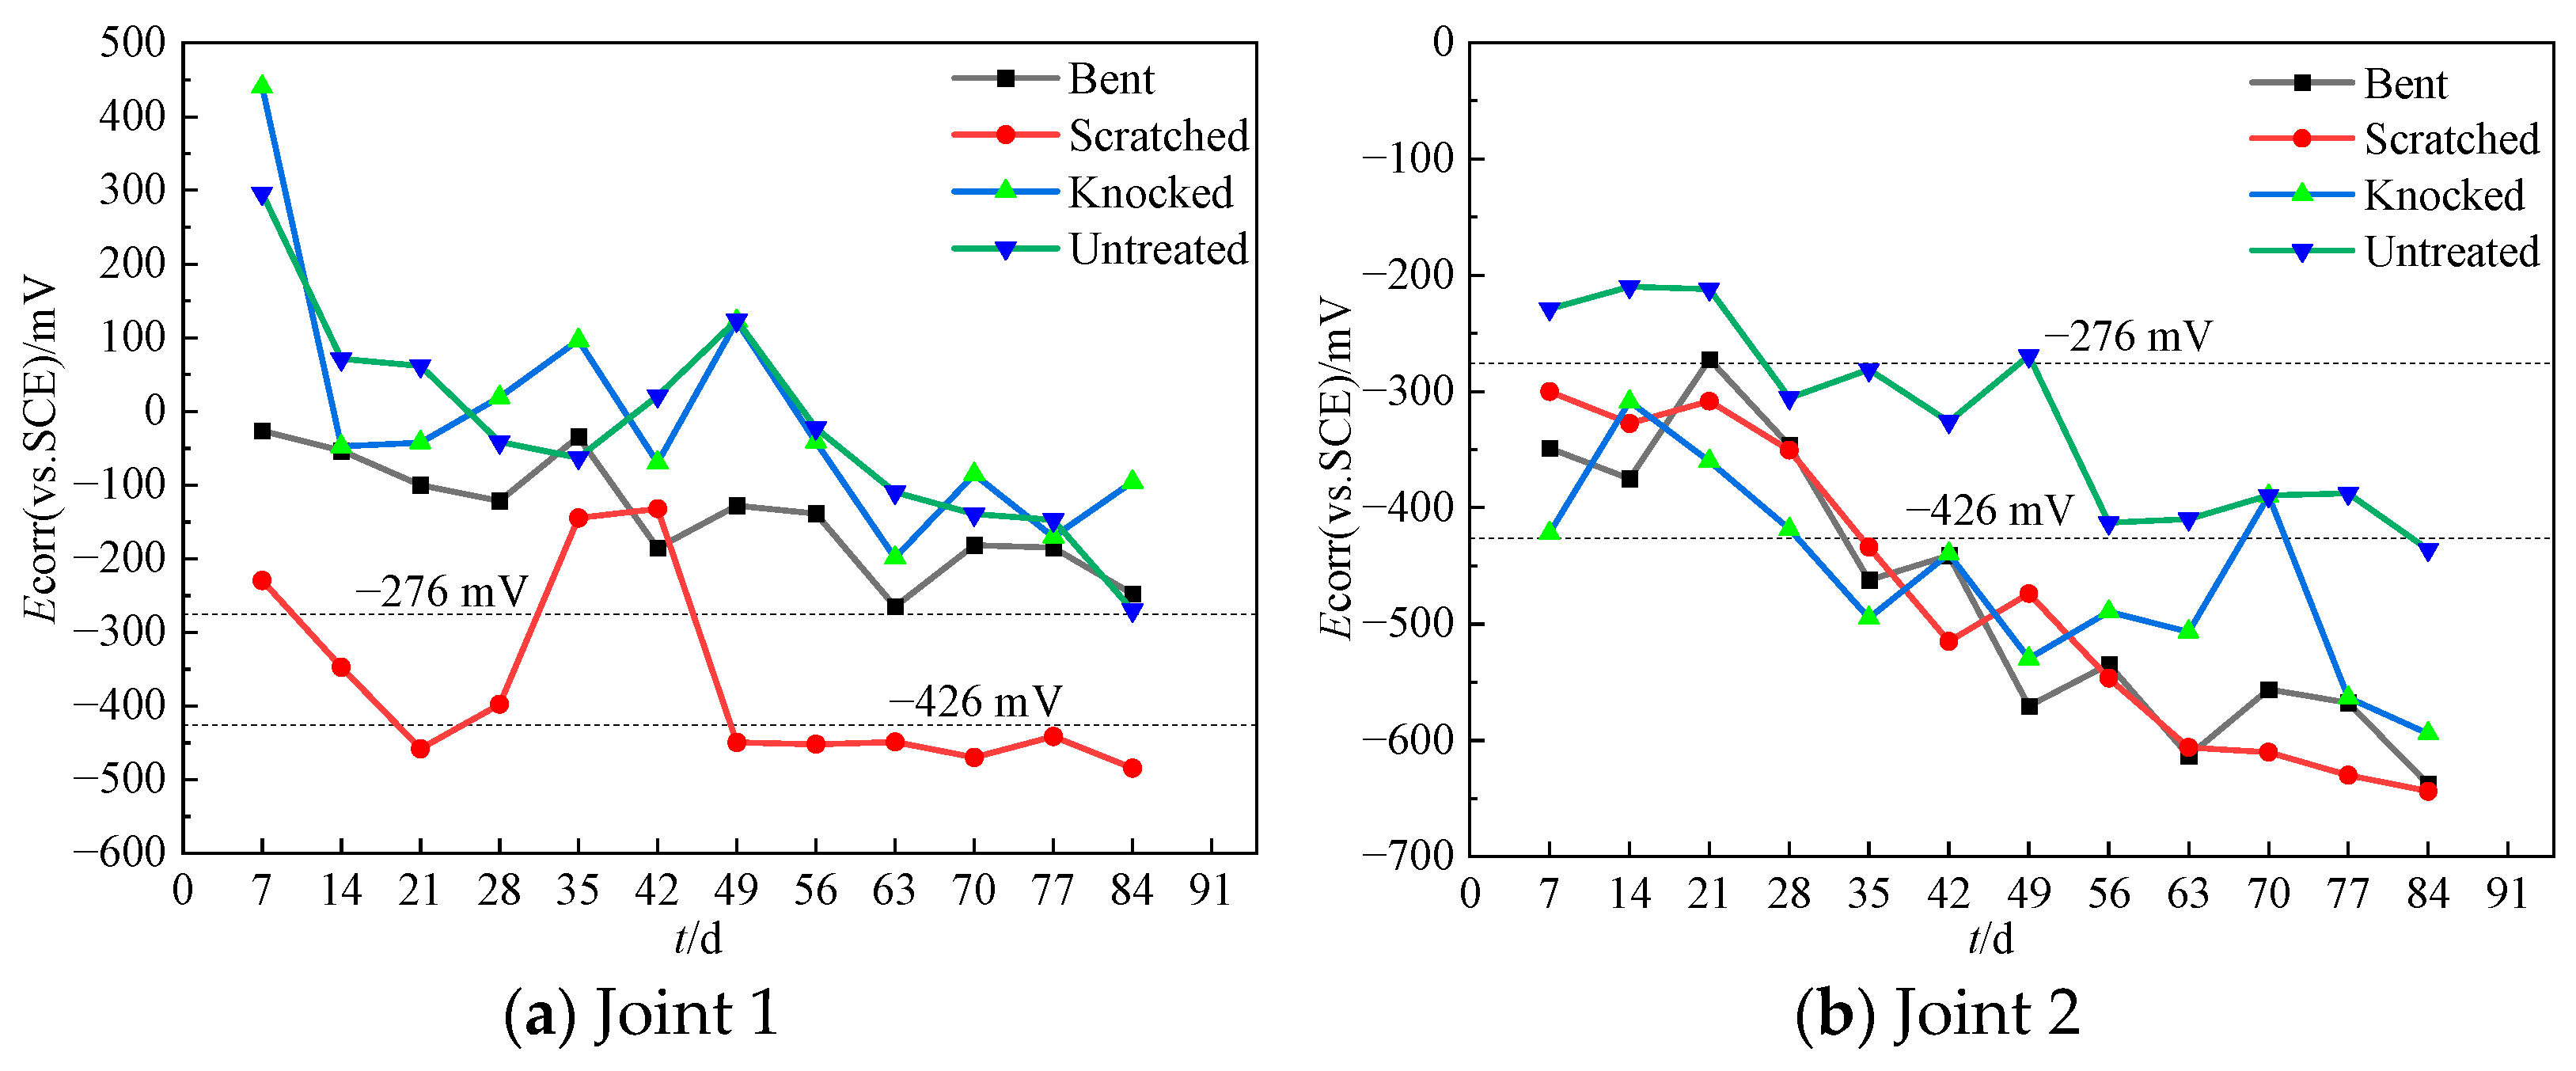
3.1. Self-Corrosion Potential ( E c o r r )

As shown in Figure 8, the open circuit potentials of all steel bars generally decrease with the increase in migration time (excluding power-off time), indicating an increasing risk of corrosion for the steel bars. The untreated epoxy-coated steel bars also exhibit self-corrosion potential curves similar to those of metals. This is because although the epoxy coatings on these steel bars were intact along their length, their ends were not sealed with epoxy resin, which was necessary to form an electrical circuit for polarization curve testing.
The self-corrosion potential curve of the epoxy-coated steel bar subjected to scratching treatment in Joint 1 is significantly lower than the other three curves, indicating the highest probability of corrosion. This increased risk is due to the severe surface coating damage that occurs after the scratched treatment. According to measurements (see Figure 9), the damaged area ratio of the scratched steel bars is above 5%, while the damaged area ratios for knocked and bent steel bars range from 3% to 4%. As shown in Figure 3, after the scratching treatment, the bright steel bar substrate was exposed, indicating deeper and more thorough damage to the epoxy coating as compared to other treatments. The self-corrosion potential curves of the steel bars subjected to bending/knocking and those with untreated coating show little difference, indicating that in Joint 1, corrosion resistance remains relatively unaffected as long as the epoxy coating damage ratio does not surpass 5%. The self-corrosion potential of steel bars in Joint 2 is lower than that in Joint 1, and the trend of self-corrosion potential decreasing over time is more pronounced. Significant defects at the interface between the pier and the grouting layer in Joint 2, which allow chloride ions to penetrate the specimen along the joint interface at a faster rate and accelerate the degradation of the passive film on the steel bar surface, are responsible for this trend. According to ASTM standard C876-22b [21], when E c o r r v s . S C E < 276   m V , the corrosion probability reaches 90%, and when E c o r r v s . S C E < 426   m V , severe corrosion of the steel bar is occurred. Under these criteria, the steel bars treated with scratching in Joint 1 started to corrode around 10 days of electromigration, while the remaining steel bars did not have significant corrosion risk until the end of electromigration. In Joint 2, all steel bars with damaged coatings started to corrode after 21 days of electromigration, while the untreated steel bars experienced a sharp drop in self-corrosion potential after 49 days of electromigration and maintained at a lower level, indicating that chloride ions easily reached the steel bar surface through the grouting interface. Since the criteria in ASTM C876-22b [21] are based on steel bars without coatings on the surface, there are inevitably differences in the electrochemical properties of steel bars with damaged epoxy coatings. Therefore, it is necessary to incorporate additional indicators to comprehensively assess the corrosion condition of the steel bars.

3.2. Corrosion Current Density ( i c o r r )

As illustrated in Figure 10, the corrosion current density curves of all steel bars generally exhibit a distinct upward trend as the electromigration time increases, indicating that the corrosion rate of the steel bars is gradually accelerating. The corrosion current density curves for various steel bars, whether at Joint 1 or Joint 2, exhibit a descending order from highest to lowest: scratched > bent > knocked > untreated.
The corrosion rate of scratched steel bars is significantly higher than the others, suggesting that as the damage to the epoxy coating increases, the corrosion rate of the steel bar also tends to rise, with this phenomenon being more pronounced at Joint 1. This observation is consistent with the aforementioned rules [21] related to self-corrosion potential. It is considered that corrosion of steel bars begins when the corrosion current density exceeds 1 μA/cm2 [22]. In Joint 1, steel bars treated with scratching began to corrode as early as 7 days of electromigration, and subsequently, their corrosion current density continued to rise. In contrast, the remaining three types of steel bars maintained a corrosion current density below 1 μA/cm2 until 42 days of electromigration, displaying stable fluctuations. This suggests that the passive film on the surface of the steel bars remains intact, and its substantial resistance contributes to a lower corrosion current density. After 42 days of electromigration, the bent steel bars showed a noticeable increase in corrosion current density, indicating a compromise in the passive film that initiated corrosion. Steel bars subjected to knocking and those untreated began to corrode around the 63rd to 70th day, but their corrosion rate remained relatively low until the 84th day. At the same electromigration times, the corrosion current densities of all steel bars in Joint 2 were higher than those in Joint 1. This means that the grouting interface in Joint 2 was less resistant to chloride ions than the post-cast strip interface in Joint 1. Chloride ions reached the steel bar surface more quickly and accumulated in higher concentrations within the same specimens, leading to earlier and more rapid corrosion of the steel bars. In Joint 2, steel bars treated with scratching and bending began to corrode after 7 days and 14 days of electromigration, respectively, and their corrosion current densities exceeded 10 μA/cm2 at the 60th and 75th day, respectively, indicating a rapid corrosion state. Knocked and untreated steel bars also began to corrode within the 28th to 35th day interval.

3.3. Polarization Resistance ( R p )

As shown in Figure 11, the polarization resistance of all steel bars exhibits a decreasing trend with increasing electromigration time. This decrease is attributed to the gradual breakdown of the passive film on the steel bars due to the increasing chloride ion content in the concrete, which results in a reduction in polarization resistance, indicating a decline in the corrosion resistance of the steel bars. In both Joint 1 and Joint 2, the polarization resistance of the various steel bars follows this order: untreated > knocked > bent > scratched. This suggests that the corrosion resistance of the steel bars decreases as the damage rate to the epoxy coating increases.
The polarization resistance of steel bars in Joint 2 is lower than that in Joint 1 at the same electromigration time, suggesting more pronounced defects at the interface of Joint 2. The faster arrival of chloride ions at the surface of the steel bars and their gradual accumulation accelerated the destruction of the passive film on the steel bars, consistent with the conclusions drawn from self-corrosion potential and corrosion current density measurements previously mentioned. It is considered that when polarization resistance falls below 25,000 Ω·cm2 [23,24], the passive film on the surface of the steel bars is completely compromised, initiating a stable corrosion process. Based on this criterion, scratched steel bars in Joint 1 began to corrode after 10 days of electromigration, while those bent started corroding after 46 days of electromigration. Steel bars were subjected to knocking, and those untreated did not begin to corrode until the final period of electromigration, approximately between the 77th and 84th days. At Joint 2, the corrosion started for scratched steel bars on the 8th day, for bent steel bars on the 18th day, for knocked steel bars on the 30th day, and for untreated steel bars on the 45th day. The polarization resistance curves of Joint 2 decrease rapidly before the 35th day and then stabilize after the 49th day, following the order of the damaged area ratio. This suggests that during the early phase of electromigration, the passive film on the steel bars gradually dissolved but did not completely disappear, resulting in a noticeable decline in polarization resistance. In the later phase of electromigration, after the complete destruction of the passive film, the corrosion resistance of the steel bars (reflected in polarization resistance) was primarily determined by the integrity of the epoxy coating, which was not degraded by chloride ions. Consequently, the stabilization of polarization resistance in the later stages of electromigration aligns with the degree of coating damage.

3.4. Chloride Ion Content ( W C l )

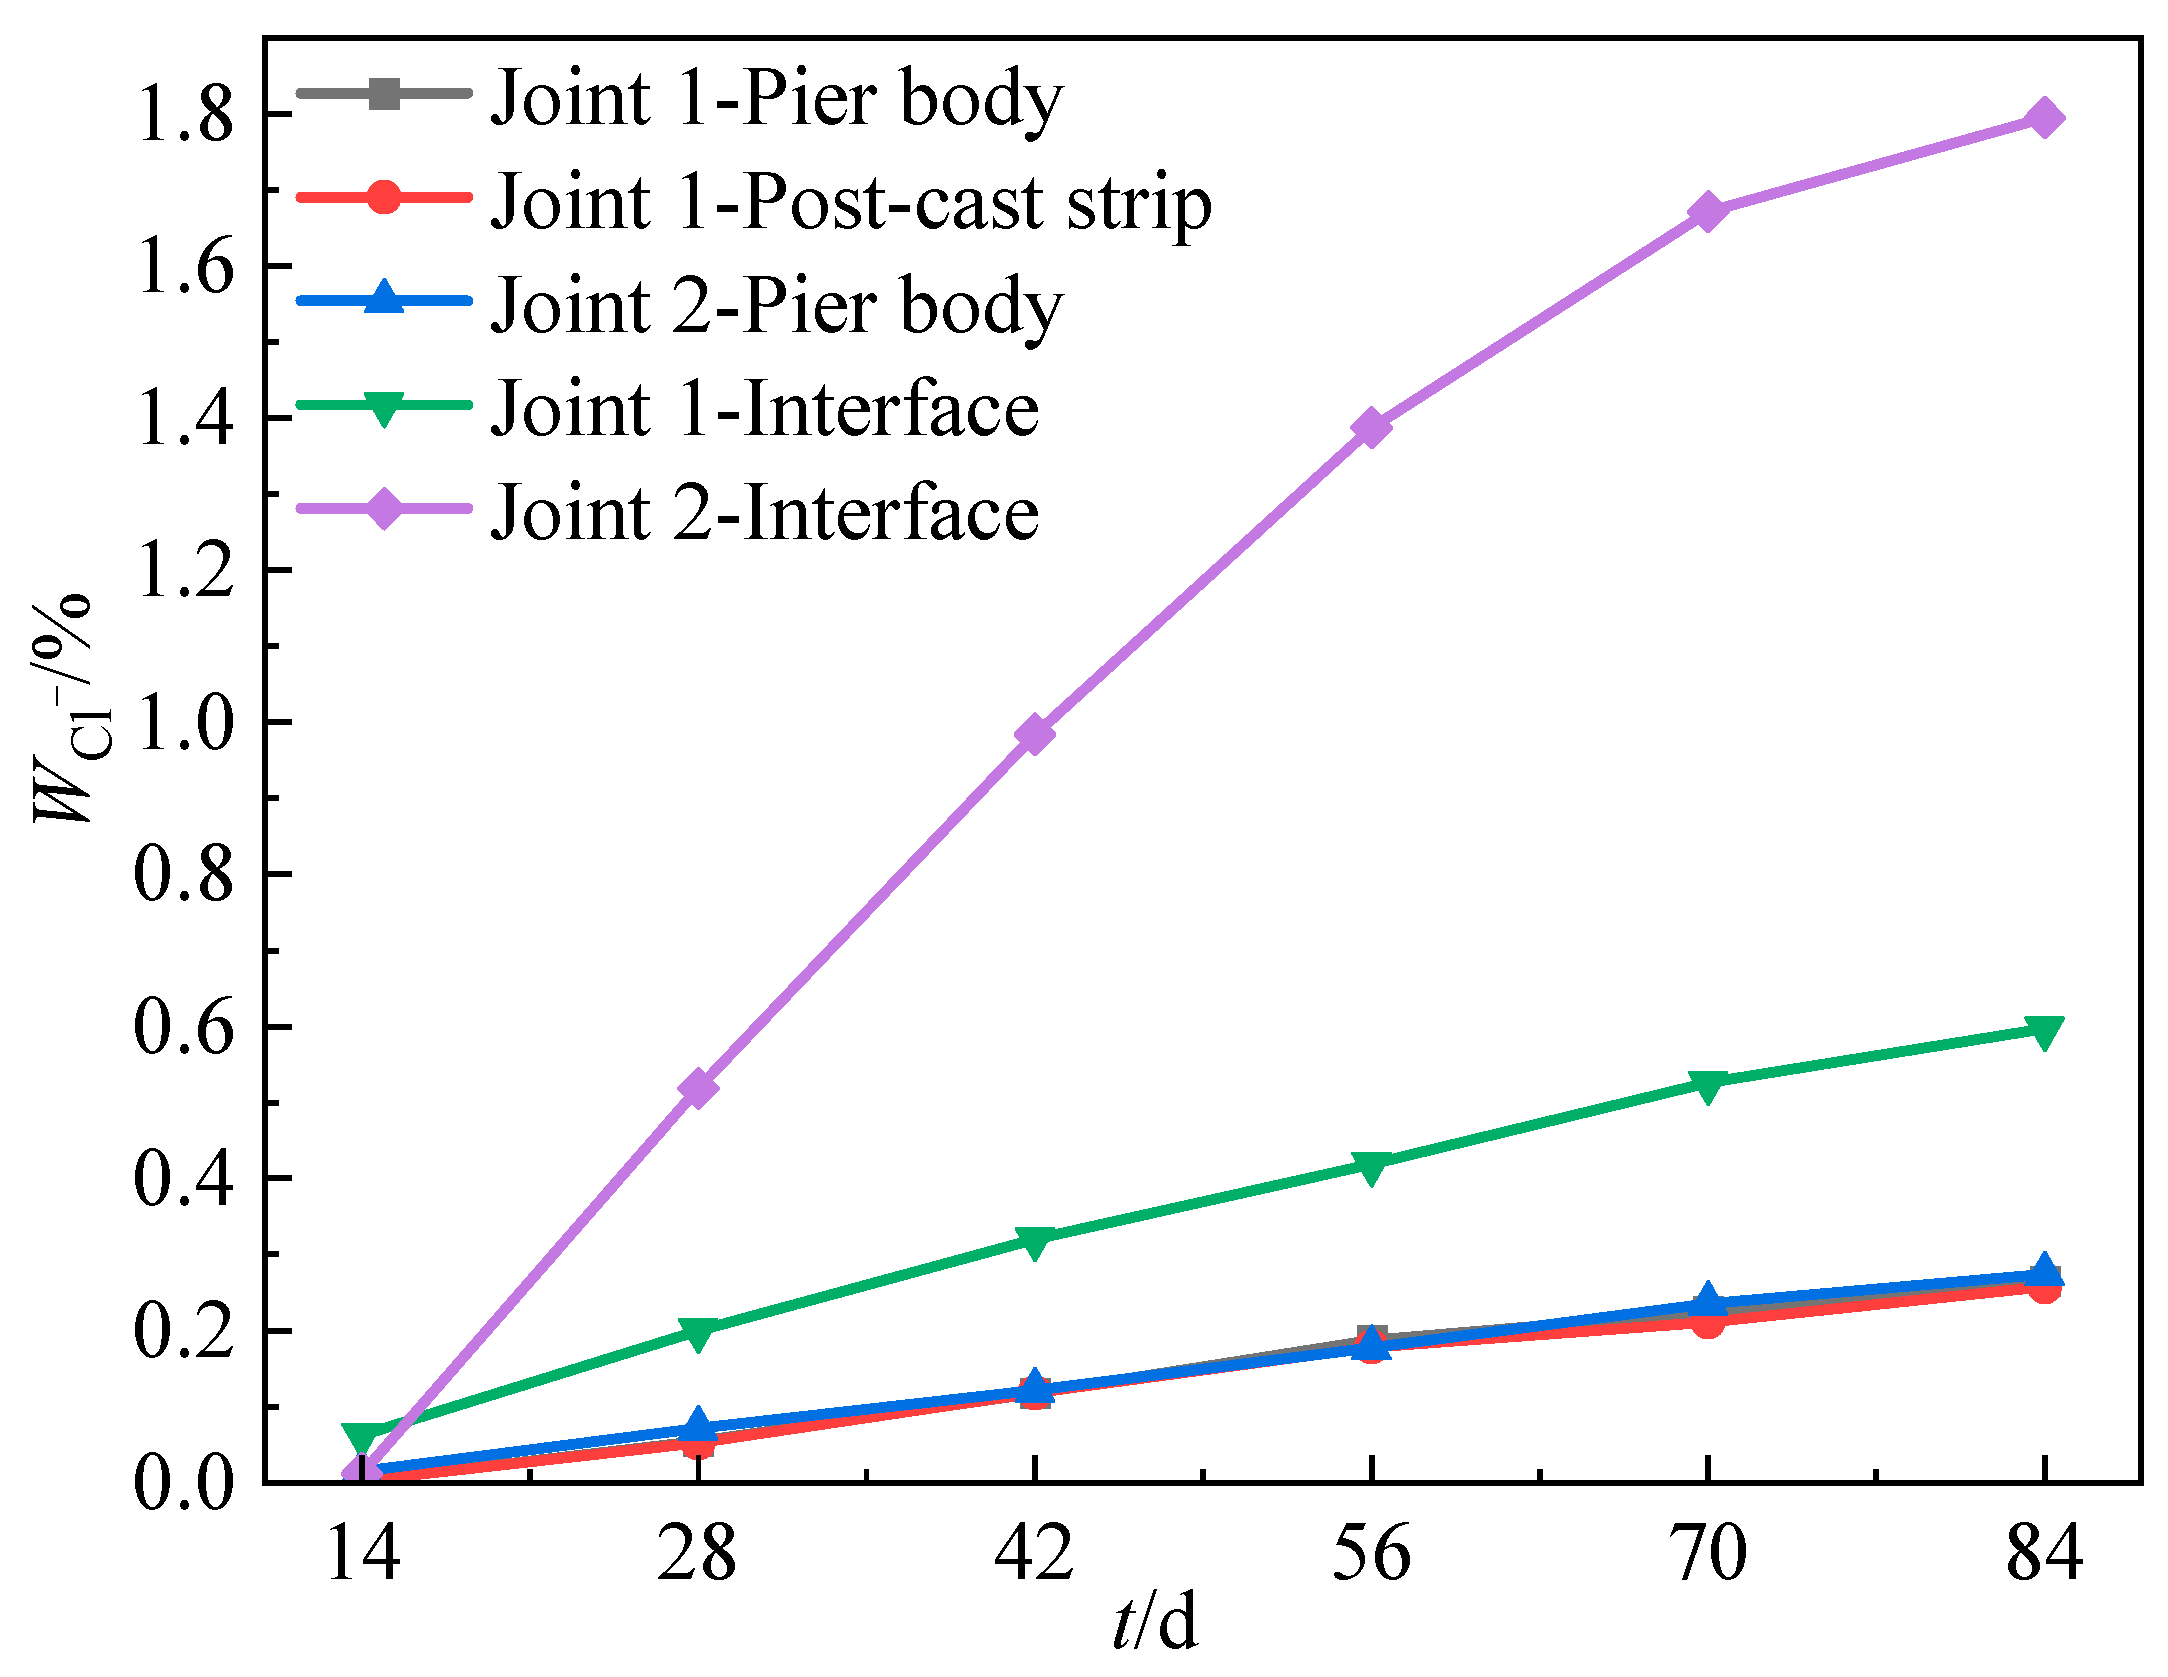
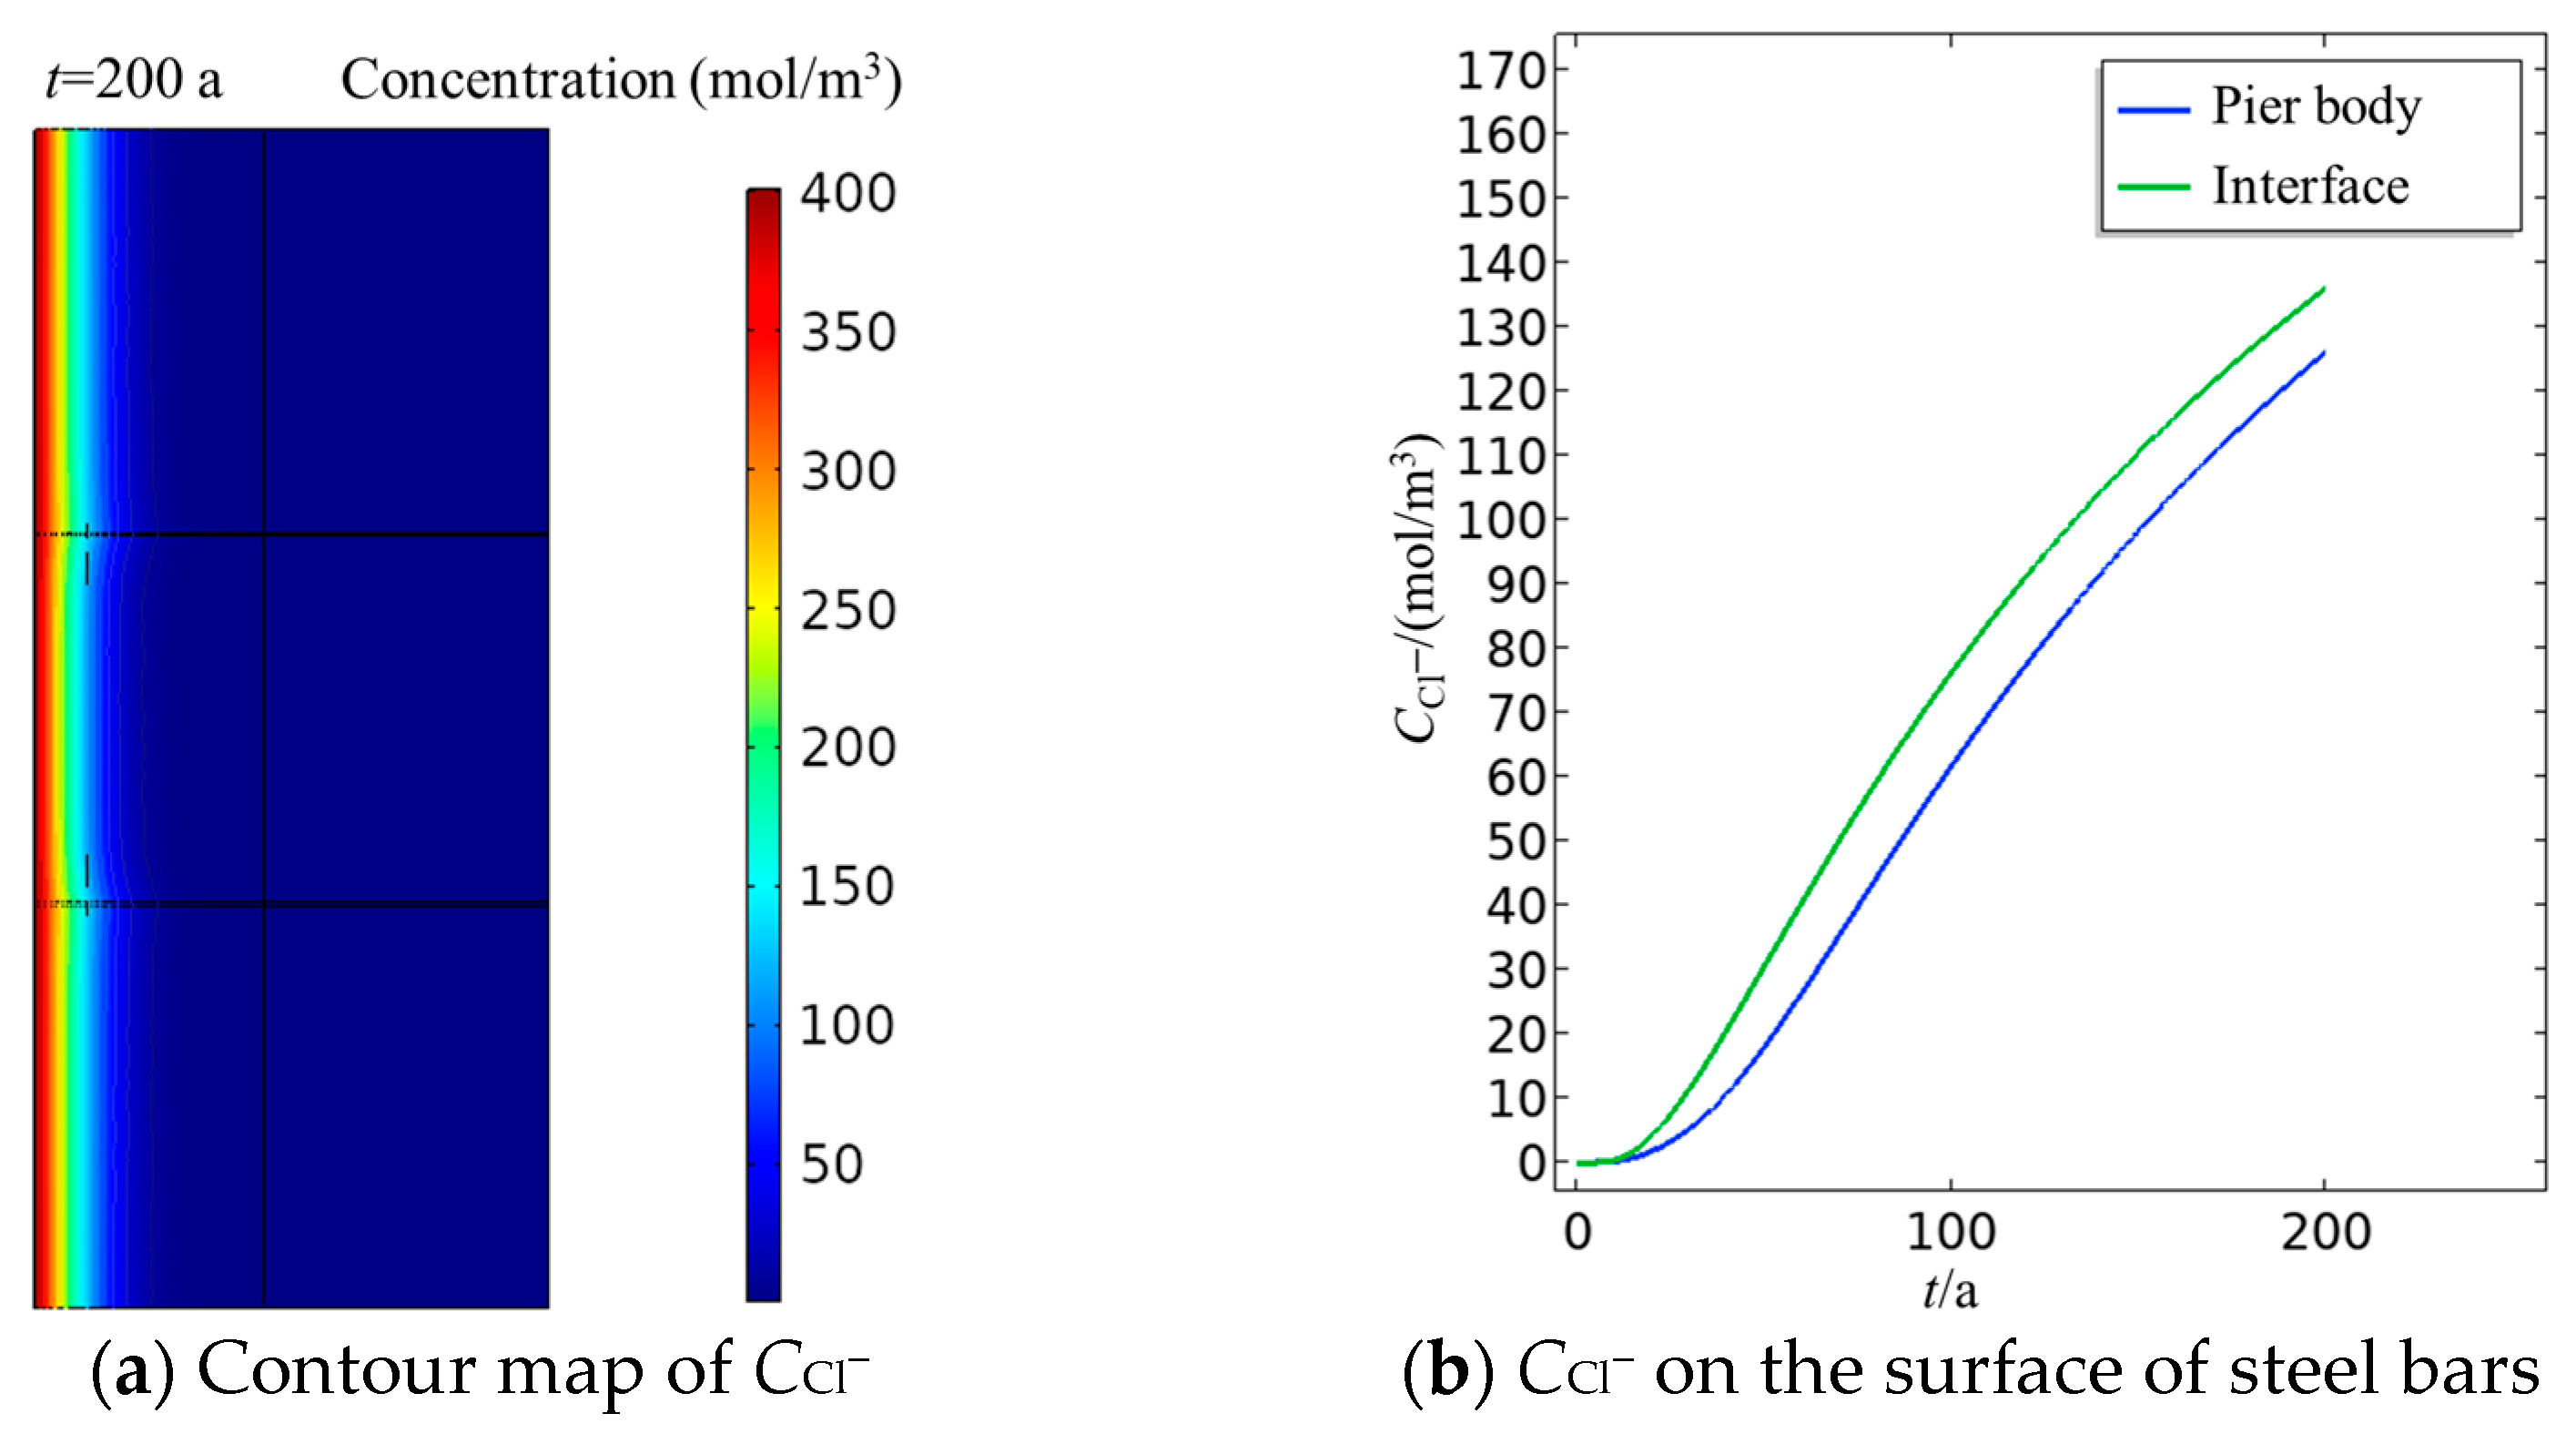
3.4.1. Spatial and Temporal Distribution of Chloride Ion Content

Figure 12 illustrates the spatial and temporal distribution of chloride ion content in the concrete at the post-cast strip and the assembled interface in Joint 1. As the depth increases, the chloride ion content gradually decreases. In Figure 12a, the curves become more stable when the depth is more than 30 mm. The chloride contents shown in Figure 12b are slightly larger than those in Figure 12a, indicating that the presence of defects at the interface between the post-cast strip and the pier body enhances the migration of chloride ions into the interior of the specimen. The spacing between adjacent curves decreases progressively from bottom to top, indicating that during the initial phase of the electromigration experiment, the chloride ion content in the concrete increased rapidly. As the electromigration proceeded, the difference in chloride ion concentration between the inside and outside of the specimen gradually lessened, leading to a gradual deceleration in the increasing rate of chloride ion content.
Figure 13 presents the spatial and temporal distribution of chloride ion content in the concrete at the pier body and the grouting interface in Joint 2. The pattern of the curves is similar to that observed in Figure 12. However, the chloride ion content at the interface of Joint 2 is obviously higher than that of Joint 1, indicating that the interface defects of Joint 2 are more significant. By comparing Figure 12b with Figure 13b, it can be concluded that the chloride ion transport rate at the interface of Joint 2 is about 5 times that of Joint 1.

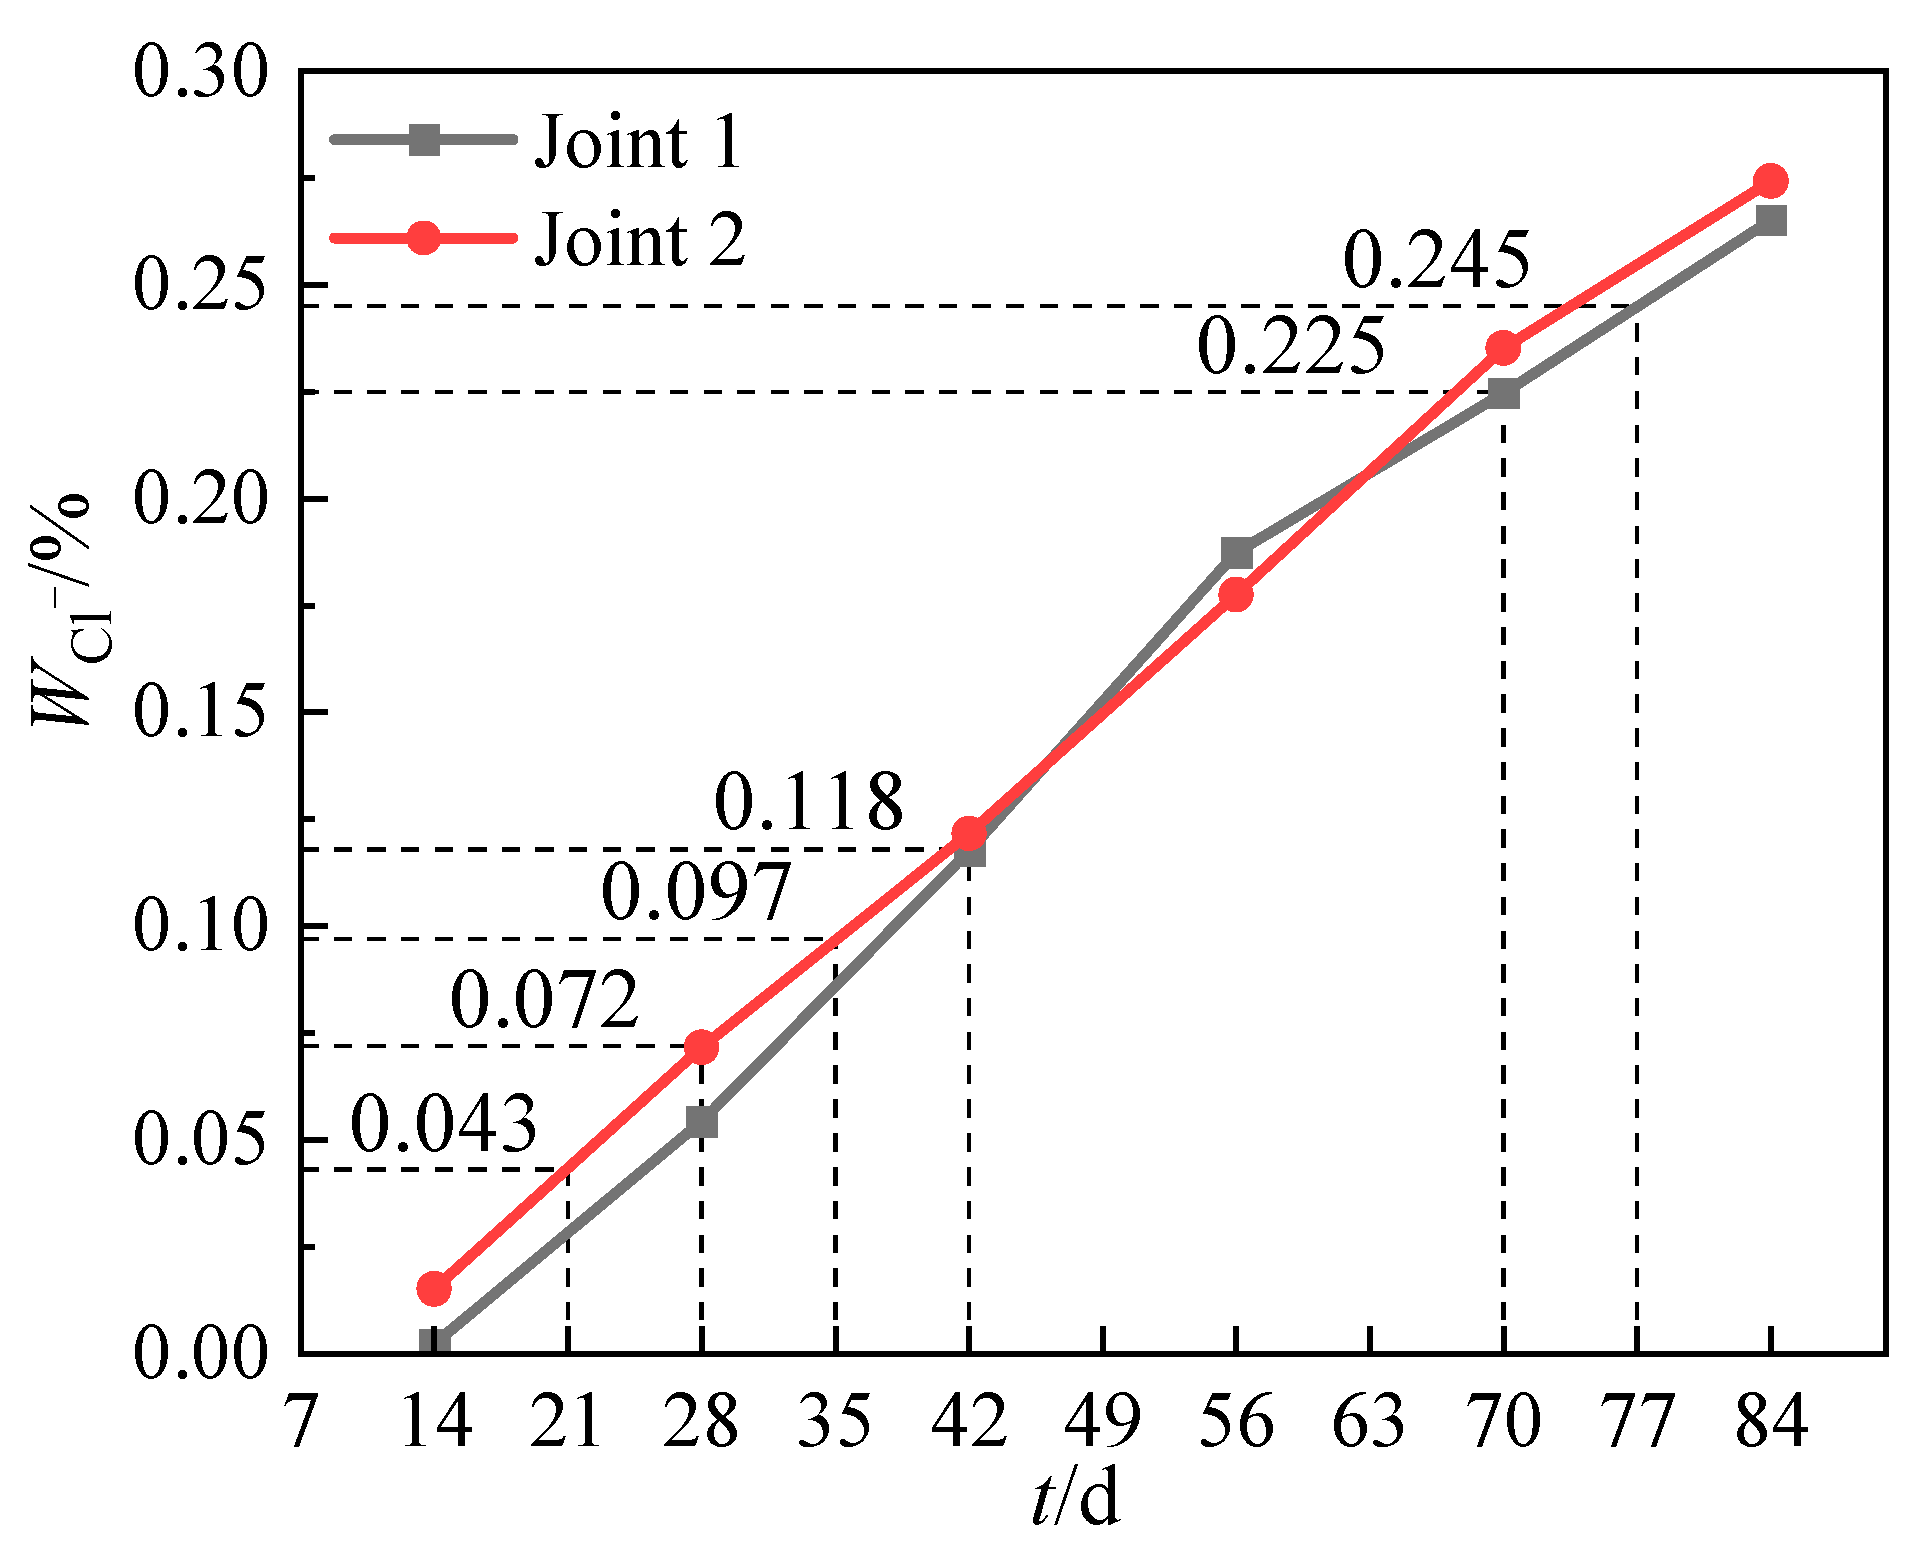
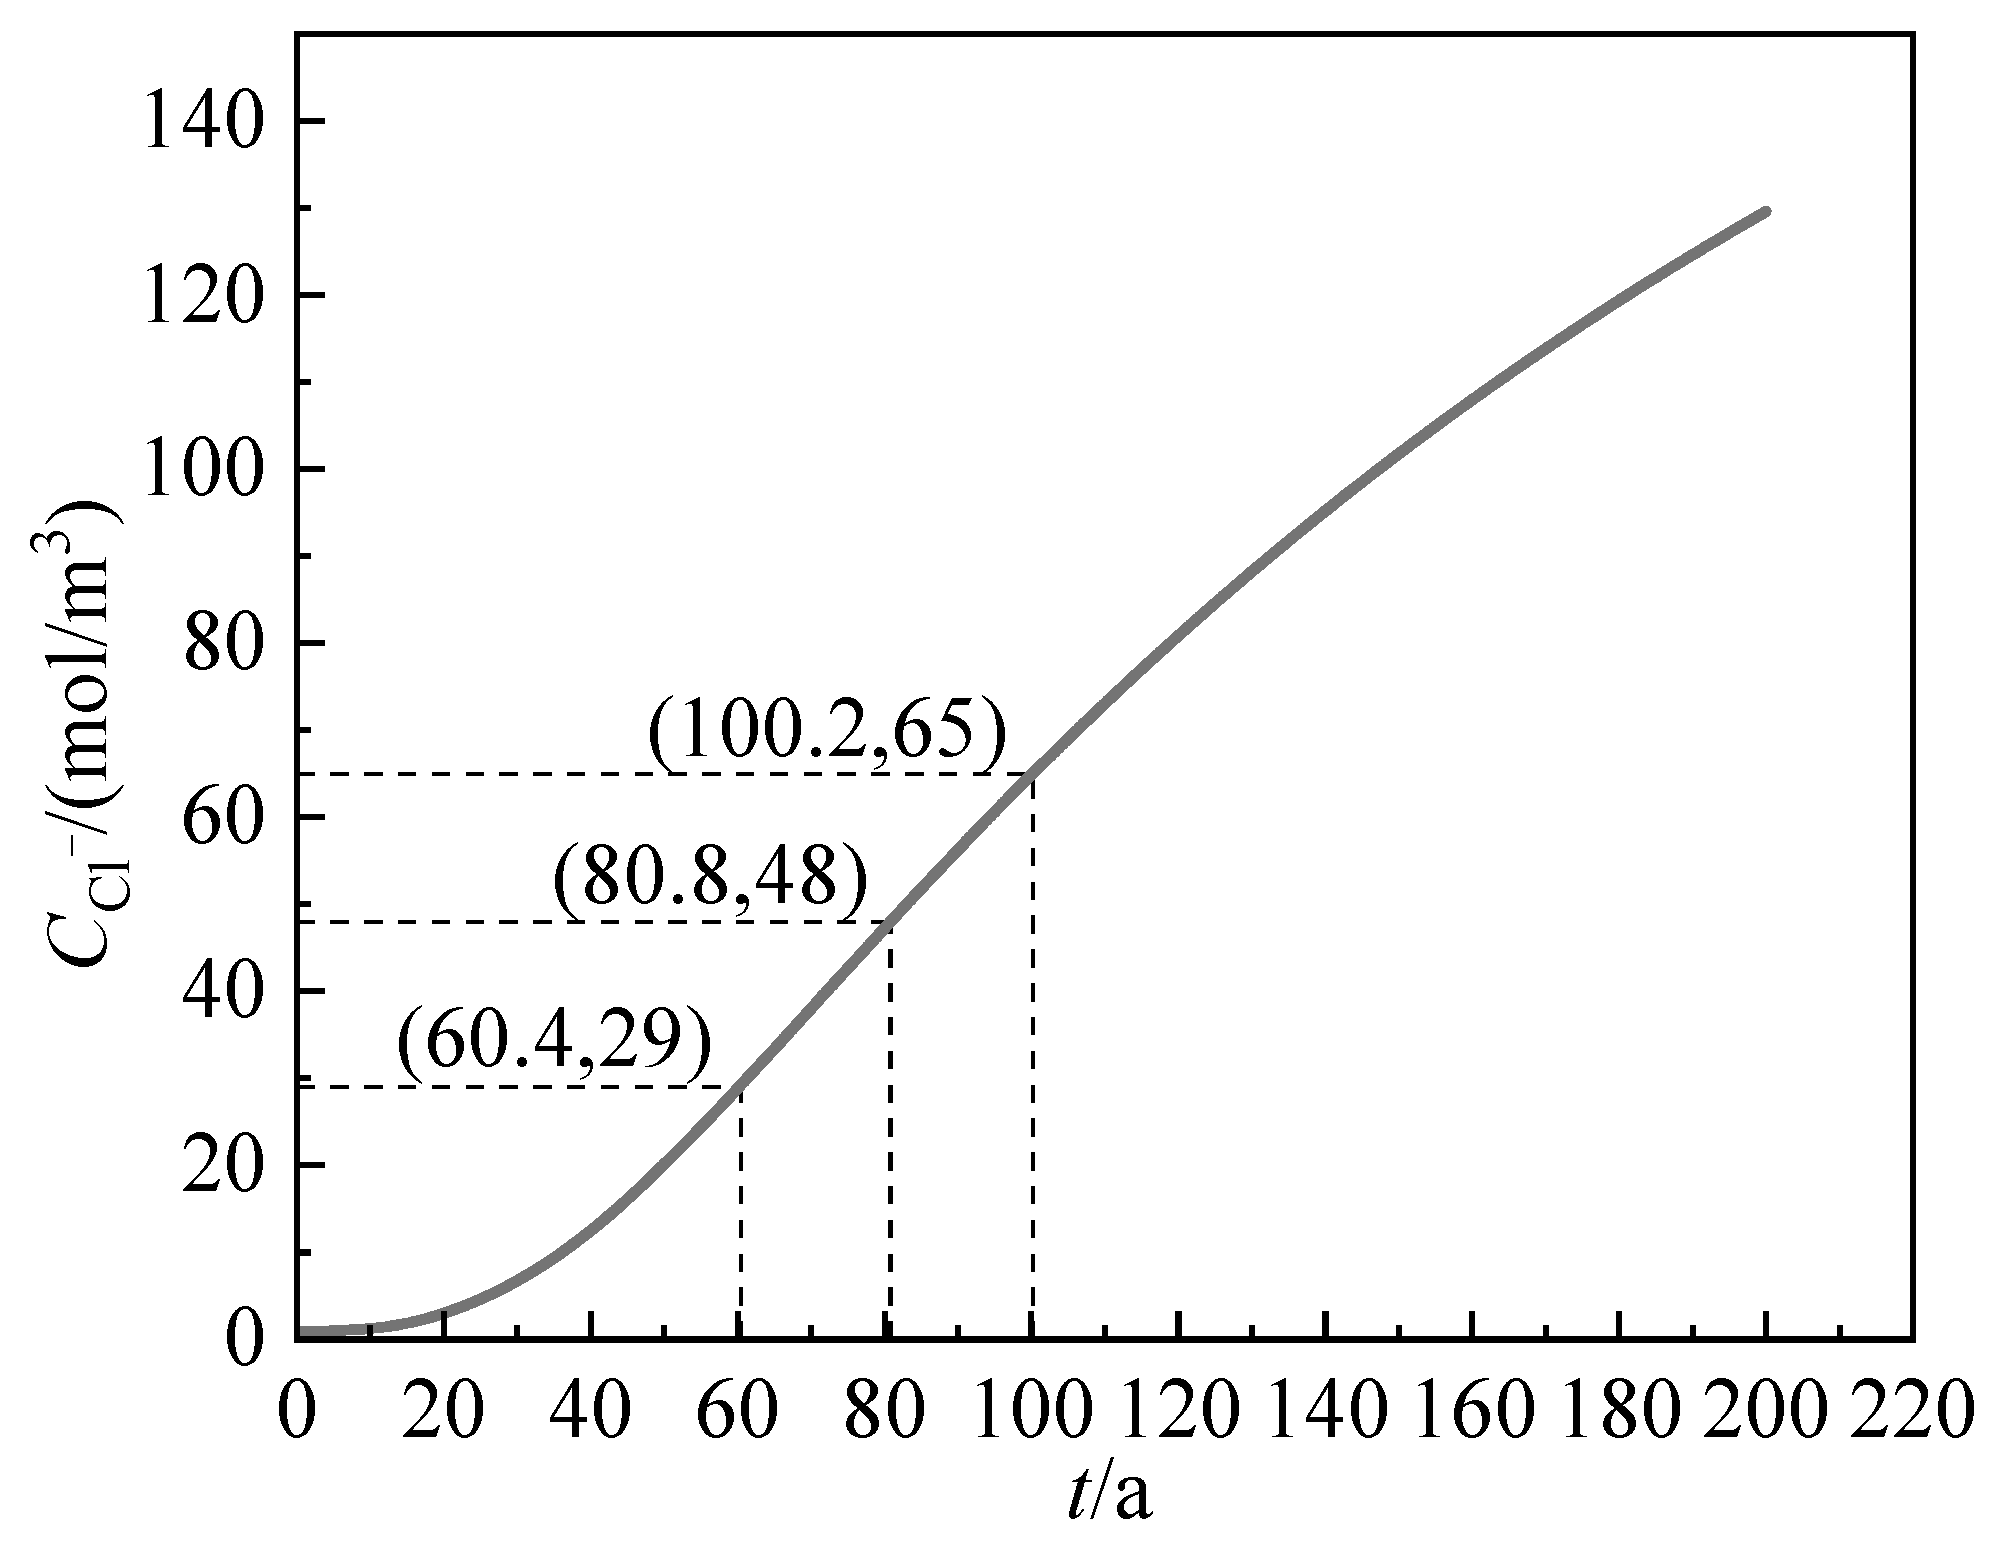
3.4.2. Chloride Ion Content on the Surface of Steel Bars

Figure 14 shows the chloride ion content on the surface of steel bars at different locations. The chloride ion content at various locations in Joint 1 and the pier body in Joint 2 refers to the chloride levels at a depth of 35 mm from the surface. The chloride ion content on the surface of steel bars at the grouting interface in Joint 2 refers to the content in concrete closest to the lower end of the steel bar (a depth of 155 mm in Figure 13b). From Figure 14, it is evident that the chloride ion content on the surface of the steel bars at the grouting interface in Joint 2 is significantly higher than that at other locations, emphasizing the more significant defects at the grouting interface of Joint 2, which facilitate the ingress of chloride ions into the concrete. The chloride ion content on the surface of the steel bars at the post-cast strip interface in Joint 1 is slightly higher than that in the pier body and post-cast strip concrete, indicating that there are also some defects at the post-cast strip interface of Joint 1, but they are less than those in Joint 2. Hence, the chloride ion resistance at the post-cast strip interface in Joint 1 is considerably better than that at the grouting interface in Joint 2. To be clear, there is a 20-mm protective layer between the end of the steel bar and the grouting interface in Joint 2 (see Figure 2b). This means that the chloride ion content shown in Figure 14 for the surface of the steel bars in Joint 2 is not actually on the steel bar surface, but at the closest point in the grouting interface. The values are only used as a reference for comparing the resistance to chloride ion penetration of the assembled joints.

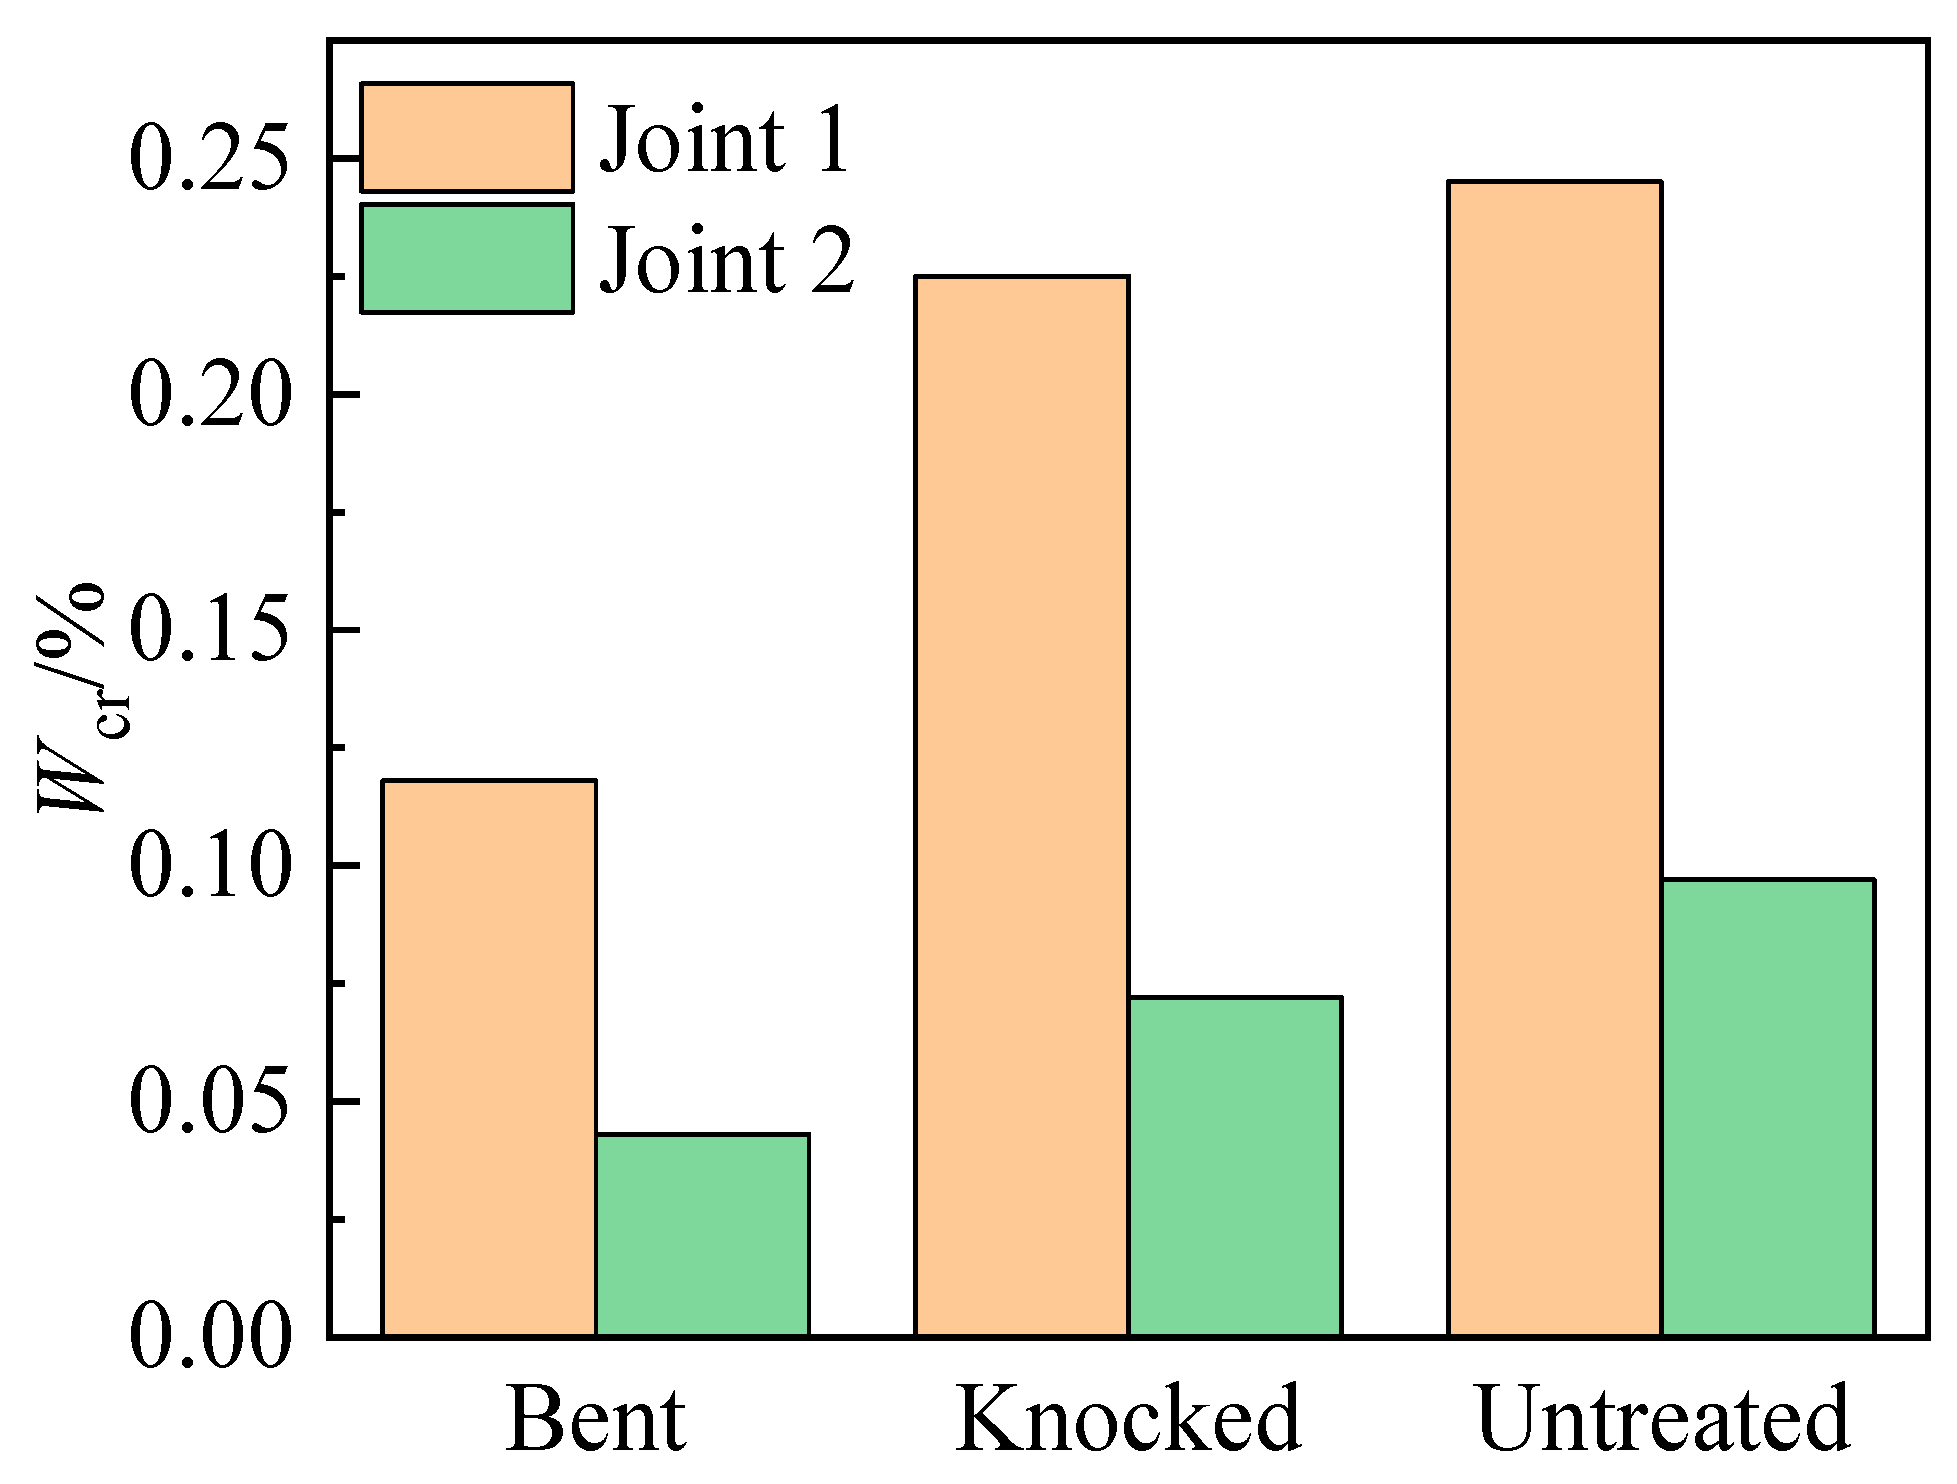
3.4.3. Critical Chloride Ion Content

The critical chloride ion content refers to the minimum chloride ion content at which the passive film on the surface of steel bars begins to break down [25]. Considerable research has been conducted by scholars to determine the critical chloride ion content, but the results have shown significant variability [25,26,27]. Due to the highly alkaline environment inside the concrete, the passive film may regenerate even after an initial breakdown when the chloride ion content is low, implying that the steel bars have not necessarily begun to corrode. Therefore, to obtain the critical chloride ion content that can induce corrosion of steel bars, it is necessary to assess the actual rust condition of the steel bars. By conducting a comprehensive analysis of the electrochemical indicators presented in Section 3.1, Section 3.2 and Section 3.3 and applying the previously mentioned criteria for judging steel bar corrosion, the initiation times of corrosion for various steel bars in both joints were determined, as shown in Table 2.
The critical chloride ion content can be determined by correlating the time when steel bars begin to corrode with the chloride ion content on their surfaces. The chloride ion content on the surfaces of steel bars in the pier bodies of Joint 1 and Joint 2 is obtained from Figure 14. The process of determining the critical chloride ion content is detailed in Figure 15.
The critical chloride ion content for each type of steel bar is presented in Figure 16. Due to the absence of chloride ion content data for day 7, the critical chloride ion content for scratched steel bars cannot be determined. The critical chloride ion content is directly proportional to the integrity of the epoxy coating, arranged in order from highest to lowest as follows: untreated > knocked > bent > scratched. Additionally, for the same treatment, the critical chloride ion content of epoxy-coated steel bars in Joint 1 is twice that in Joint 2. This indicates that the critical chloride ion content depends on the defect level of the concrete joint. The presence of assembled interfaces can lead to localized corrosion of the steel bars, thereby reducing the critical chloride ion content.

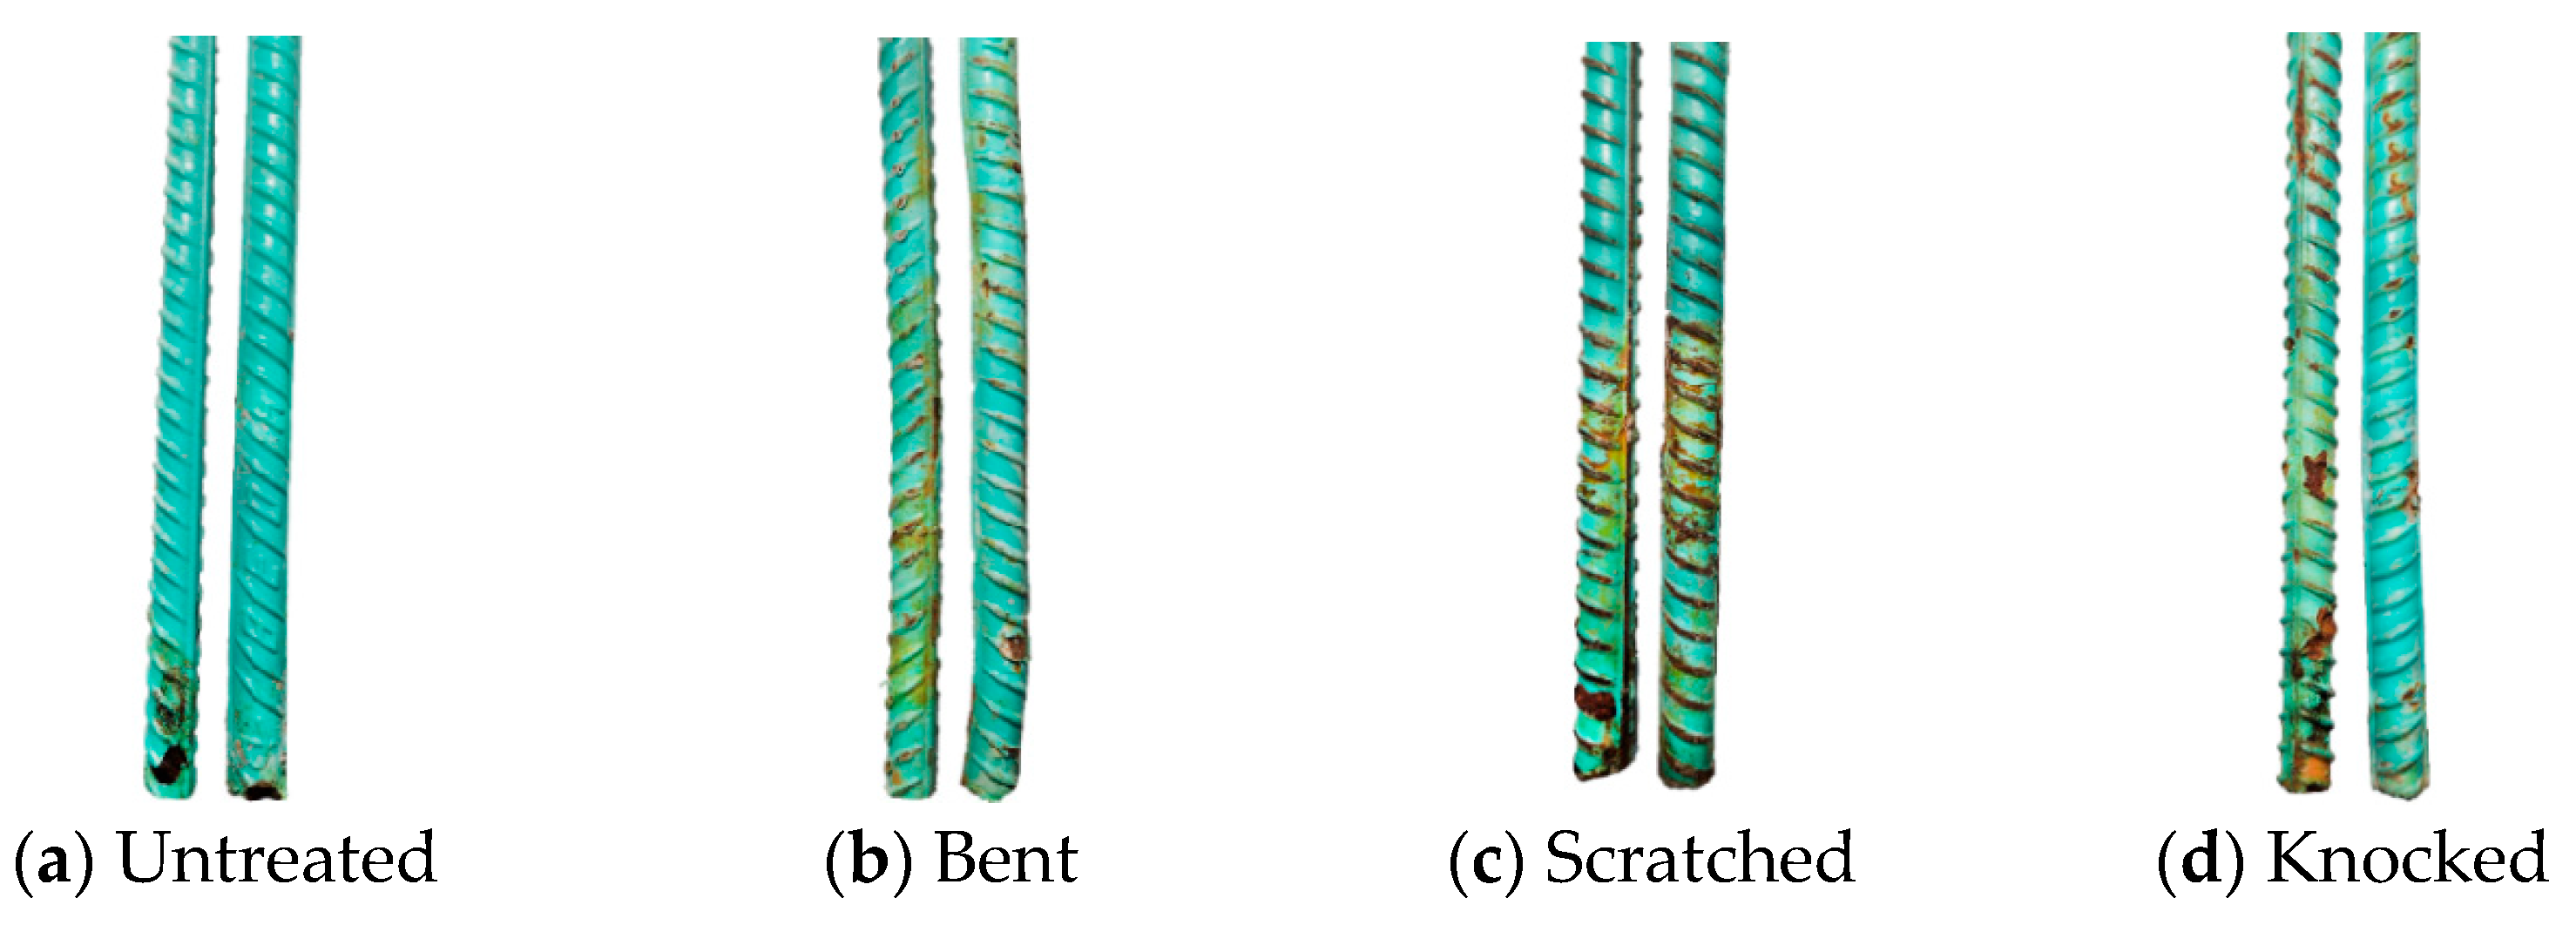
3.5. Corrosion Morphology

Figure 17 and Figure 18 illustrate the corrosion morphology of steel bars extracted from specimens after the experiment. For each joint type, two representative photographs of each treatment method for steel bars are displayed. Both Joint 1 and Joint 2 present a descending order of corrosion severity for the various types of steel bars: scratched, bent, knocked, and untreated. It is consistent with the epoxy coating integrity law in Figure 9. Moreover, the degree of corrosion for the same type of steel bar is greater in Joint 2 than in Joint 1, which is consistent with the conclusions drawn from electrochemical tests and chloride ion content results. The untreated steel bars also exhibit slight corrosion due to the lack of epoxy coating protection at their ends.

4. Service Life Prediction

4.1. Determination of DNSSD

4.1.1. D n s s d and D n s s m

Assuming that the bridge pier joints are in a saturated state due to prolonged immersion in seawater, the transport process of chloride ions can be described using Fick’s second law:
  C x , t t = D n s s d 2 C x , t x 2
where C ( x , t ) represents the volumetric concentration of chloride ions (in mol/m3 or kg/m3) at a distance x from the erosion surface after a duration of t ; The non-steady-state diffusion coefficient for chloride ions, D n s s d , can be determined by measuring the chloride ion concentrations at various depths within the concrete through natural diffusion experiments and obtained by regression analysis using the analytical solution, Equation (3), derived from Equation (2):
C x , t = C 0 + C s C 0 1 erf x 2 D n s s d t
where, C 0 = C ( x , 0 ) ; C s = C ( 0 , t ) ; e r f is the error function, erf z = 2 π 0 z exp z 2 d z .
Due to the naturally slow diffusion process of chloride ions in concrete, the duration required for natural diffusion experiments is excessively long. In engineering practice, the method involving the application of an external electric field, as specified in NT BUILD 492 [28], is commonly used to accelerate the transport process of chloride ions in concrete. This method is employed to determine the non-steady state migration coefficient ( D n s s m ) of chloride ions in concrete, thereby assessing the concrete’s resistance to chloride ion permeability. Relevant study [29] indicates that there is a relationship between D n s s d and D n s s m as described in Equation (4):
ln D n s s d = B ln D n s s m + ln A + ε
By fitting a substantial amount of actual engineering data [29], the values obtained are as follows: B = 1.0 , A = 0.5 , and ε ~ N ( 0 , 0.3 2 ) . Substituting B = 1.0 , A = 0.5 , and ε = 0 into Equation (4) results in Equation (5):
D n s s d = D n s s m 2

4.1.2. The Correction of Diffusion Coefficient

In concrete, chloride ions exist as free and bound chloride ions. It is primarily the free chloride ion that causes corrosion of steel bars. During the transport process of free chloride ions within the concrete, physical adsorption and chemical binding occur, partially converting them into bound chloride ions. To account for the effects of adsorption and binding, scholars have proposed a modification of the chloride ion diffusion coefficient according to Equation (6) [30]:
D c = D 1 + 1 ω e C b C f
where D c represents the modified chloride ion diffusion coefficient accounting for adsorption and binding effects; D is the unmodified chloride ion diffusion coefficient; ω e is the volume ratio of evaporable pore water to concrete, typically assumed to be 8% [31]; C b denotes the content of bound chloride ions; and C f represents the content of free chloride ions.
Under specified conditions of temperature and chloride ion concentration range, the relationship between the content of bound chloride ions ( C b ) and the content of free chloride ions ( C f ) is known as the chloride binding isotherm. Currently, commonly used models of chloride binding isotherms [32] include the Linear Binding Isotherm (Equation (7)), the Langmuir Isotherm (Equation (8)), and the Freundlich Isotherm (Equation (9)).
C b = α C f
C b = α C f 1 + β C f
C b = α C f β
Among these, the Freundlich isotherm has been shown to fit the data best [32]. However, the Linear Binding Isotherm is often used in numerical simulations to reduce the workload of modeling and improve computational efficiency [33]. In this chapter, the Linear Binding Isotherm is adopted, referencing the isotherm used in the studies by Martin et al. under similar water-to-cement ratios and environmental chloride ion concentration conditions [33]. Using α = 0.2 , Equation (7) is substituted into Equation (6) to derive the modified chloride ion diffusion coefficient considering the effects of chloride ion adsorption and binding, as shown in Equation (10):
D c = 0.28571 D
Thus, by using Equations (5) and (10) and incorporating the D n s s m values for various materials and interfaces, the value of D N S S D can be obtained, which is one of the most crucial parameters for numerical simulations of the chloride ion diffusion process, as shown in Equation (11):
D N S S D = 0.14286 D n s s m

4.1.3. Experimental Determination of D n s s m

The non-steady-state diffusion coefficients ( D n s s m ) of chloride ions for different materials and interfaces were determined using the method specified in NT BUILD 492 [28]. The material specimens (C50, C60 concrete or mortar) were obtained by cutting a 50 mm thick part from the middle of φ100 mm × 100 mm cylinders according to NT BUILD 492 [28], and the interface specimens (post-cast strip interface or grouting interface) were prepared directly in the φ100 mm × 50 mm cylinder mold. Taking the grouting interface specimen as an example, the fabrication process was divided into two steps: firstly, C50 concrete was poured in both sides, and then the center block was replaced by mortar, as shown in Figure 19. The D n s s m for different materials and interfaces are calculated according to Equation (12), and the results are shown in Table 3.
Figure 19. Fabrication of the grouting interface specimen.
Applsci 14 06609 g019
D n s s m = 0.0239 273 + T L U 2 t x d 0.0238 273 + T L x d U 2
where
  • U : applied voltage, V;
  • T : average value of the initial and final temperatures in the anolyte solution, °C;
  • L : thickness of the specimen;
  • x d : average value of the penetration depths, mm;
  • t : test duration, hour.
Table 3. D n s s m for different materials and interfaces.
Specimen No.U/VT/°CL/mmt/hxd/mmDnssm
ValueAverage
C50-A6016502410.62.3262.765
C50-B602414.53.243
C50-C602412.32.725
C60-A60248.71.8842.319
C60-B602412.22.701
C60-C602410.82.373
M-A604813.51.5031.602
M-B604814.31.598
M-C604815.21.704
CC-A502437.610.51311.673
CC-B502441.511.644
CC-C502445.712.863
CM-A602424.45.5936.151
CM-B602427.16.238
CM-C602428.76.621

4.2. Modeling Methods

This chapter employs the Nernst-Planck Equation for chemical substance transport within COMSOL Multiphysics software (v. 6.0) to simulate the natural diffusion process of chloride ions in seawater for assembled bridge pier joints, which are modeled at twice the size of the test specimens. The concrete surface layer with a thickness of 1 mm is defined on the erosion side of the model, and its chloride ion content is set to C s as the boundary condition. The non-steady-state diffusion coefficients for chloride ions at various locations ( D N S S D ) can be calculated from Equation (11) combined with D n s s m in Table 3. The specific value of each parameter is presented in Table 4:
Where C s represents the chloride ion concentration in the concrete surface of the bridge pier; c is the thickness of the protective layer for the steel bars; W refers to the thickness of the interface; D C 50 , D C 60 , D M , D C C , D C M and D 0 respectively denote the non-steady-state diffusion coefficients of C50 concrete, C60 post-cast concrete, high-strength non-shrink mortar, the interface of the post-cast strip, grouting interface, and in aqueous solutions. The tidal and splash zones display significantly higher chloride ion concentrations than those submerged in seawater due to the cyclic wetting and drying processes, making them critical for service life prediction. Therefore, C s is determined as the chloride ion concentration in the surface concrete of the tidal or splash zones. Due to the considerable variability in the chloride ion concentration ( C s ) in tidal and splash zones, as found in studies [34,35,36], this chapter employs the empirical formula provided by DuraCrete [37] for calculations, as illustrated in Equation (13).
  C s = 0.0776 R w / b ρ b M C l
where R w / b is the water-cement ratio of the concrete ( R w / b = 0.366); ρ b is the density of the cementitious material, indicating the mass of cementitious material per cubic meter of concrete (500 kg/m3); M C l is the molar mass of chloride ions (35.45 × 10⁻³ kg/mol). Substituting them into Equation (13) yields C s = 400.587   m o l / m ³ .
Utilizing symmetry, the simulation was conducted for chloride ion erosion on only one side. The following presents chloride ion concentration contour maps and time-varying curves of chloride ion concentrations on the surface of the steel bars for two types of joints. The service life of each joint, when employing different types of steel bars, was determined based on the chloride ion concentration at the surface of the pier body’s steel bars reaching the critical chloride ion concentration. Since Figure 16 provides the critical chloride ion content, it is necessary to perform a unit conversion using Equation (14):
      C c r = ρ c o n W c r M C l
where C c r represents the critical chloride ion concentration, expressed as the amount of chloride ions per cubic meter of concrete (mol/m3); ρ c o n is the density of the concrete, taken from Table 1 for C50 concrete (2365 kg/m3); W c r is the critical chloride ion content for various types of steel bars obtained from Figure 16, expressed as the mass ratio of chloride ions to concrete per unit volume (%). Using Equation (14), the critical chloride ion concentrations for various types of steel bars are converted and listed in Table 5.

4.3. Simulation Results

Figure 20 presents the numerical simulation results of Joint 1, including a contour map of chloride ion concentrations after 200 years of natural diffusion and time-varying curves of chloride ion concentrations on the surface of steel bars over a 200-year simulation period. From Figure 20a, it is evident that the chloride ion concentrations are ranked from highest to lowest as follows: post-cast strip interface > pier body > post-cast strip. This ranking corresponds to the order of the chloride ion diffusion coefficients ( D N S S D ) for each material and interface. Although the D N S S D at the post-cast strip interface is 4 to 5 times higher than that of the adjacent concrete, the concentration and penetration depth of chloride ions at the interface do not show a proportional relationship due to the two-dimensional diffusion of chloride ions. In Figure 20b, the chloride ion concentration on the surface of the steel bars within the post-cast strip interface is higher than that within the pier body segment associated with defects at the interface, which facilitates a faster transportation rate of chloride ions. Additionally, the distance between the two curves gradually increases during the early stages of diffusion and then slows down in the later stages, indicating that as chloride ion diffusion progresses, the concentrations at different locations on the steel bar surfaces reach a certain level and gradually stabilize.
As the critical chloride ion concentration values for the steel bars in Table 5 correspond to the concentration on the surface of bars within the pier body, the data from the time-varying curve of chloride ion concentration on the surface of steel bars within the pier body in Figure 20b were exported and re-plotted usingOrigin 2022. Then, the service life of Joint 1 using different types of steel bars can be predicted, as illustrated in Figure 21. The results indicate that even using bent steel bars with a coating damaged area ratio of about 4%, the service life of Joint 1 can still reach 122 years, while using steel bars that have been knocked or untreated could extend the service life to over 200 years (assuming no epoxy coating aging effects). This demonstrates that Joint 1 has a strong resistance to chloride ion erosion and that the integrity of the epoxy coating has a significant impact on the joint’s service life.
Figure 22 presents the numerical simulation results of Joint 2, including a contour map of chloride ion concentrations after 200 years of natural diffusion and time-varying curves of chloride ion concentrations on the surface of steel bars over a 200-year simulation period. Due to the effects of concrete and mortar shrinkage, coupled with the lack of prestressing, the vertical grouting interface in Joint 2 is prone to cracking (as evidenced in Figure 13b, where the chloride ion content at the grouting interface in Joint 2 is considerably high). Considering the most unfavorable scenario, the diffusion coefficient of chloride ions at the vertical grouting interface in Joint 2 is assumed to be the same as that in water. In Figure 22a, the chloride ion concentration at the grouting interface is significantly higher than at other locations, consistent with the phenomena observed in Section 3.4 of the experiments. In Figure 22b, the term “interface” refers to the chloride ion concentration at the steel bar end located 40 mm from the grouting interface, where the chloride ion concentration on the surface of the interface bars is significantly greater than that on the surface of the pier body bars, suggesting that localized corrosion is likely to initiate at the bar ends first.
Figure 23 displays the service life predictions for Joint 2, which are similar to those for Joint 1. The service life for bent steel bars is 60.4 years; for knocked steel bars, it is 80.8 years; and for untreated steel bars, it is 100.2 years; all significantly shorter than the service life of Joint 1. When using bent steel bars, the service life is reduced by more than half from 122 years for Joint 1 to 60.4 years for Joint 2. This indicates that the interface quality has a significant impact on the joint’s service life. Interface cracking, which allows chloride ion solutions to directly penetrate the interior of the joint, significantly reduces its service life. Improved design and construction strategies are needed to prevent interface cracking and enhance the joint’s durability.

5. Conclusions

We conducted experimental research on the corrosion resistance of pre-damaged epoxy-coated steel bars and the durability of assembled bridge pier joints through electromigration, combined with electrochemical indicators and chloride ion content. Numerical simulation methods were used to predict the service life of two types of joints when epoxy-coated steel bars with various types of damage were used. The following conclusions were drawn:
(1)
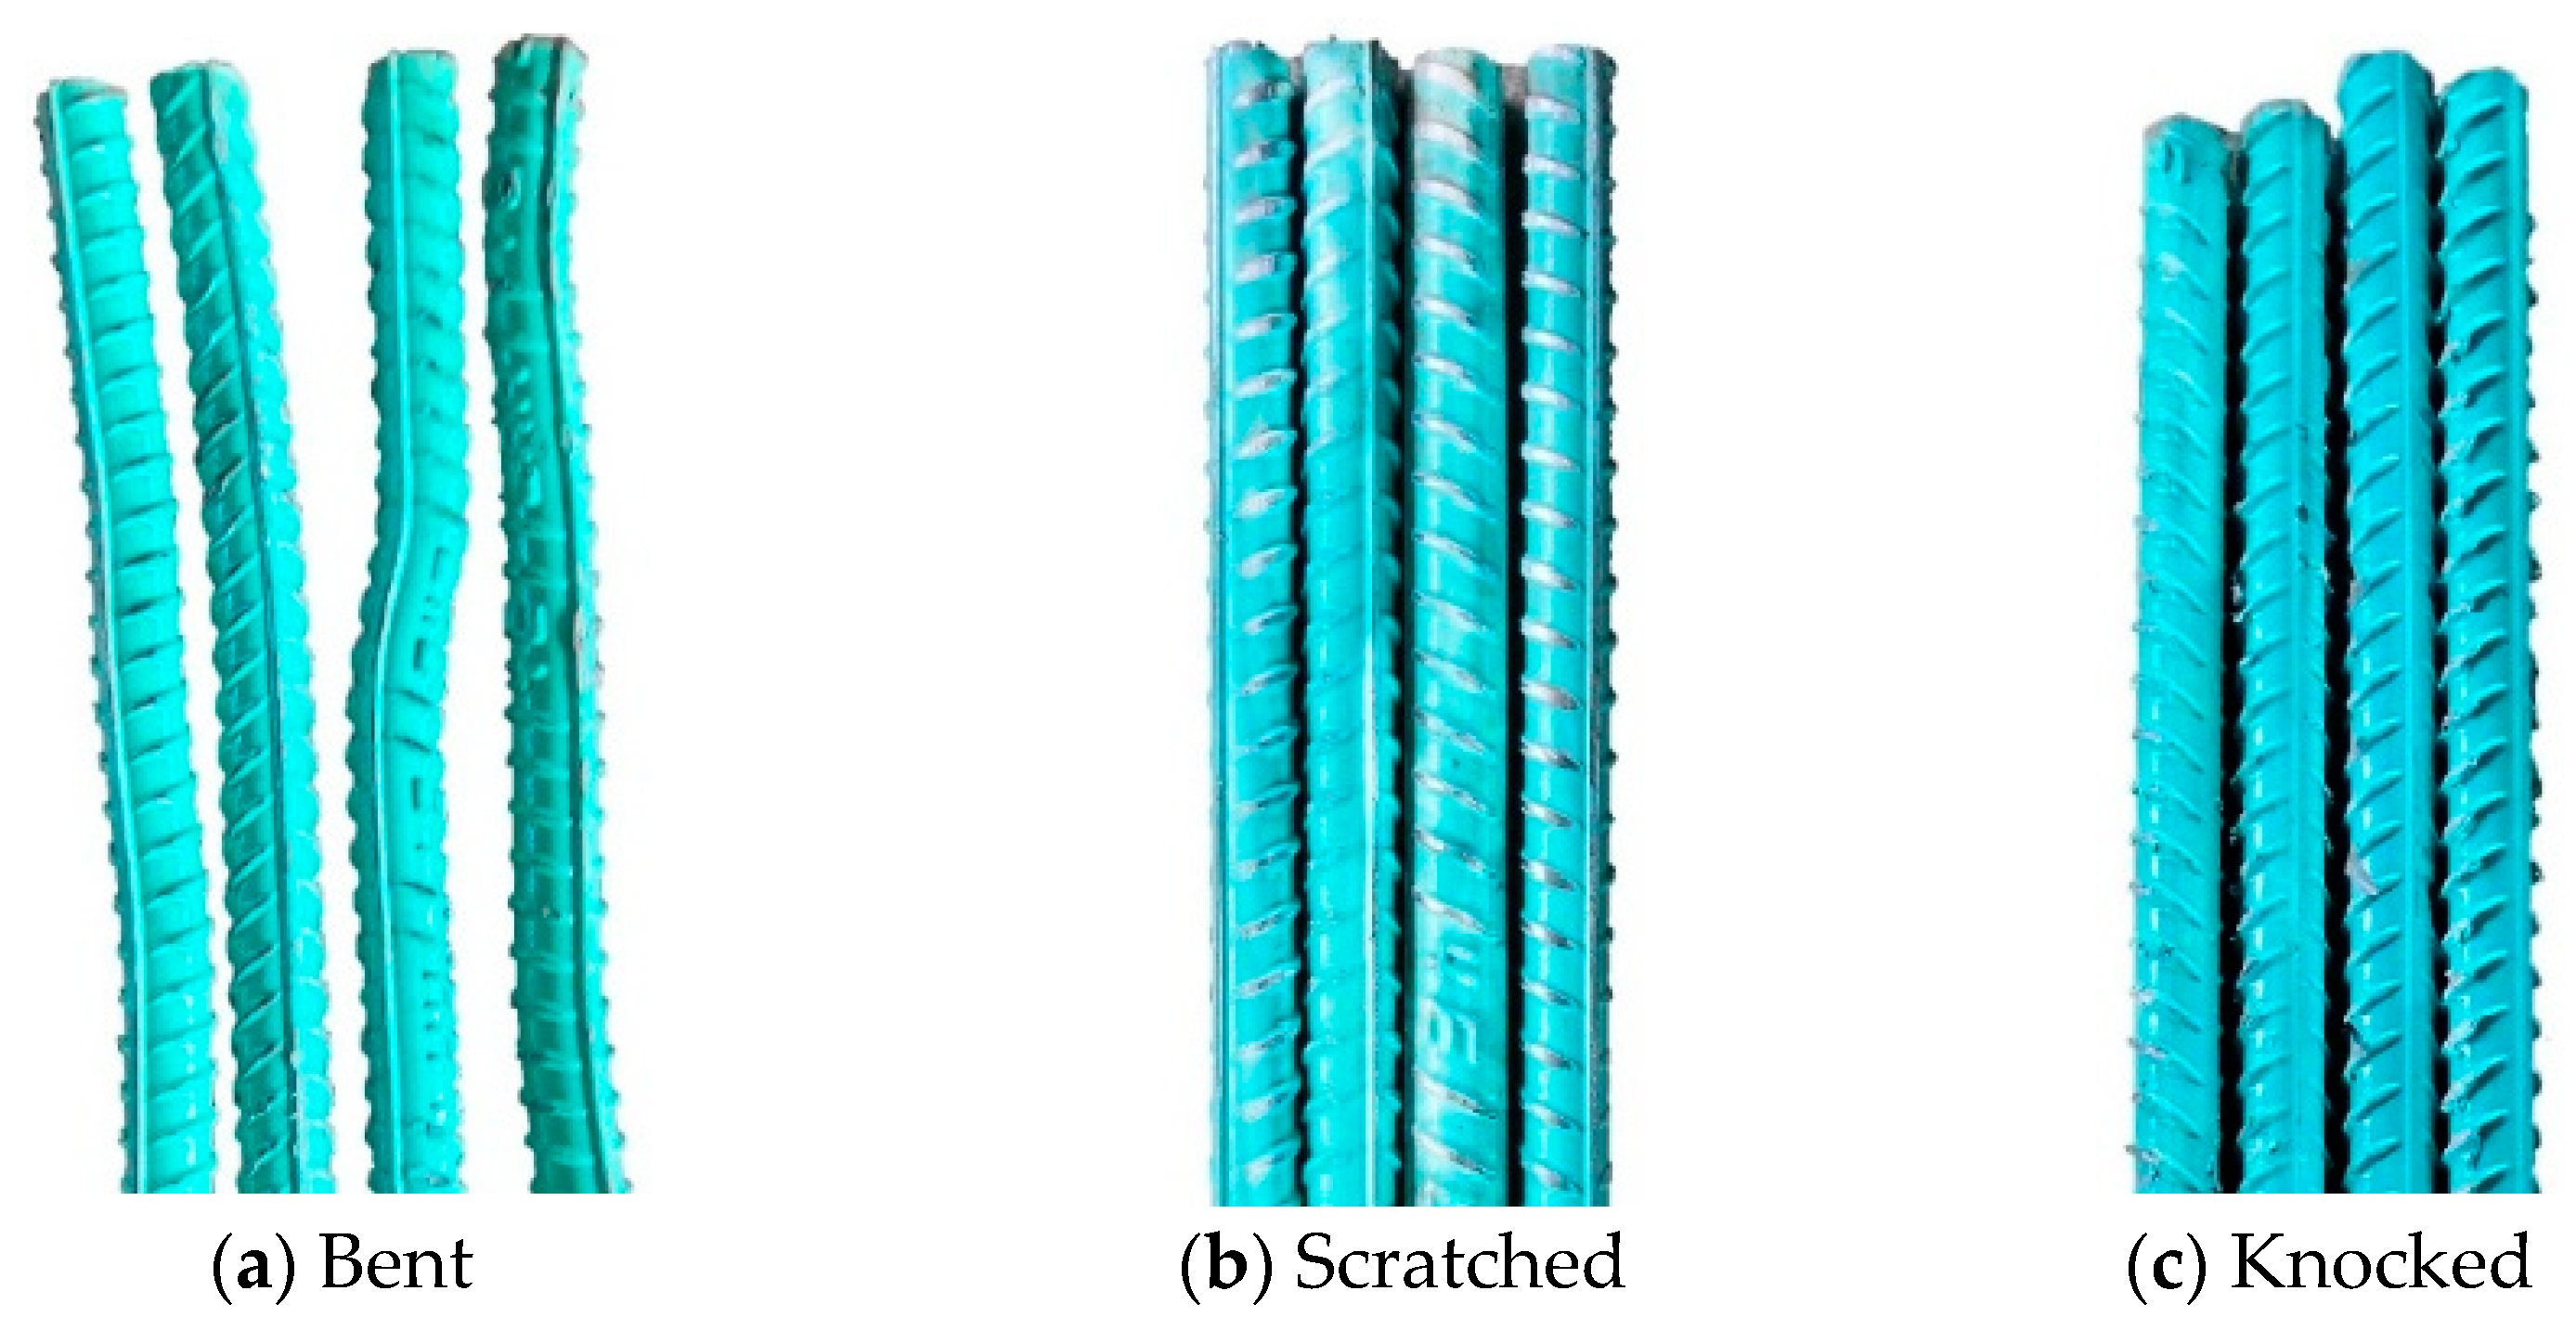
The corrosion resistance of the steel bars is directly related to the integrity of the epoxy coating. The ranking from highest to lowest corrosion resistance is untreated > knocked > bent > scratched. The corrosion risk and corrosion rate of steel bars increase significantly when the damaged area ratio of the epoxy coating is higher than 5%.
(2)
For assembled bridge piers, the quality of the connection interfaces between components significantly impacts the chloride resistance. The grouting interface of Joint 2 exhibits more defects than the prestressed post-cast strip interface of Joint 1. The chloride ion transport rate at the interface of Joint 2 is about 5 times that of Joint 1.
(3)
The types of assembled interface affect the corrosion behavior of the steel bars. The critical chloride ion content of the same type of steel bars in Joint 2 is less than 40% of that in Joint 1, and the initial rust time is less than 1/2 of that in Joint 1.
(4)
The numerical simulation suggests that the integrity of the epoxy coating and the type of joint significantly influence the service life. For Joint 1, the service life can reach up to 100 years regardless of the treatment of the steel bars. In contrast, Joint 2 achieves a service life of approximately 100 years only when using untreated epoxy-coated steel bars. This underscores the importance of proper joint design and the prevention of epoxy coating damage as critical strategies to enhance the durability of assembled piers in cross-sea bridges.

Author Contributions

Conceptualization, H.W., H.X. and T.H.; methodology, H.W. and D.F.; validation, H.X.; formal analysis, H.X. and T.H.; software, investigation, data curation, visualization, writing—original draft preparation, D.F.; resources, funding acquisition, writing—review and editing, H.W.; supervision, H.X. and T.H.; project administration, H.W., H.X. and T.H.; All authors have read and agreed to the published version of the manuscript.

Funding

This research was funded by the R&D Program of Guangxi Province, grant number AB22035031; the National Science Foundation of China, grant number 52279141, 52079123; the R&D Program of Zhejiang Province, grant number 2023C01154, 2022C04005, 2021C01022; the Shanxi-Zheda Institute of New Materials and Chemical Engineering, grant number 2021SZ-TD010, 2022SZ-TD016; and the Centre for Balance Architecture, Zhejiang University.

Institutional Review Board Statement

Not applicable.

Informed Consent Statement

Not applicable.

Data Availability Statement

The raw data supporting the conclusions of this article will be made available by the authors on request.

Acknowledgments

The authors would like to extend our gratitude to Fengqing Song, Bing Zhou, Zhiwei Chen, and Cong Zhao for their help during the experimental process and to Xiaoyan Sun for her guidance during the writing of the paper.

Conflicts of Interest

Author Hongquan Xu was employed by the company China Railway Design Corporation. Author Tingquan He was employed by the company Guangxi Xinfazhan Communication Group Co., Ltd. The remaining authors declare that the research was conducted in the absence of any commercial or financial relationships that could be construed as a potential conflict of interest.

References

  1. Mehta, P.K. Durability of Concrete—Fifty Years of Progress? ACI Symp. Publ. 1991, 126, 1–32. [Google Scholar] [CrossRef]
  2. Wei, J.; Wei, Y.; Li, J.; Zhao, H.; Lv, C.; Dong, J.; Ke, W.; He, X. Corrosion Behavior of Damaged Epoxy Coated Steel Bars Under the Coupling Effect of Chloride Ion and Carbonization. Acta Metall. Sin. 2020, 56, 885–897. [Google Scholar] [CrossRef]
  3. Elmoaty, A.E.M.A. Four-years carbonation and chloride induced steel corrosion of sulfate-contaminated aggregates concrete. Constr. Build. Mater. 2018, 163, 539–556. [Google Scholar] [CrossRef]
  4. Yan, L.; Deng, W.; Wang, N.; Xue, X.; Hua, J.; Chen, Z. Anti-Corrosion Reinforcements Using Coating Technologies—A Review. Polymers 2022, 14, 4782. [Google Scholar] [CrossRef]
  5. Yadav, M.; Dey, I.; Ghosh, S.K. A comparative study on the microstructure, hardness and corrosion resistance of epoxy coated and plain rebars. Mater. Res. Express 2022, 9, 056504. [Google Scholar] [CrossRef]
  6. Pérez-Claros, E.; Andrawes, B. Concrete Bridge Deck Reinforced with Textured and Nontextured Epoxy-Coated Bars. J. Bridge Eng. 2023, 28, 04023023. [Google Scholar] [CrossRef]
  7. Ahmad, S.; Al-Tholaia, M.M.H. Evaluation of corrosion resistance of coated steel strips embedded in mortar under chloride exposure. Anti-Corros. Methods Mater. 2015, 62, 29–36. [Google Scholar] [CrossRef]
  8. Huang, G.; Wu, B.; Shen, Y.; Wang, L.; Li, G. Comparative experiment of steel bar corrosion at concrete construction joints. Front. Mater. 2022, 9, 1094696. [Google Scholar] [CrossRef]
  9. Wang, X.-H.; Gao, Y. Corrosion behavior of epoxy-coated reinforced bars in RC test specimens subjected to pre-exposure loading and wetting-drying cycles. Constr. Build. Mater. 2016, 119, 185–205. [Google Scholar] [CrossRef]
  10. Assaad, J.J.; Issa, C.A. Bond strength of epoxy-coated bars in underwater concrete. Constr. Build. Mater. 2012, 30, 667–674. [Google Scholar] [CrossRef]
  11. Kayyali, O.A.; Yeomans, S.R. Bond and slip of coated reinforcement in concrete. Constr. Build. Mater. 1995, 9, 219–226. [Google Scholar] [CrossRef]
  12. Manning, D.G. Corrosion performance of epoxy-coated reinforcing steel: North American experience. Constr. Build. Mater. 1996, 10, 349–365. [Google Scholar] [CrossRef]
  13. Keßler, S.; Angst, U.; Zintel, M.; Gehlen, C. Defects in epoxy coated reinforcement and their impact on service life of concrete structures. Struct. Concr. 2015, 16, 398–405. [Google Scholar] [CrossRef]
  14. Cao, H.; Lyu, Z.; Dong, W.; Zhao, Z.; Gan, W.; Wang, Y. Corrosion Experimental Research on Local Damage of Epoxy-Coated Steel Bars in Concrete under Marine Environment. Front. Mater. 2022, 8, 821716. [Google Scholar] [CrossRef]
  15. Guaygua, B.; Sánchez-Garrido, A.J.; Yepes, V. A systematic review of seismic-resistant precast concrete buildings. Structures 2023, 58, 105598. [Google Scholar] [CrossRef]
  16. Carrara, P.; Lorenzis, L.D. Consistent identification of the interfacial transition zone in simulated cement microstructures. Cem. Concr. Compos. 2017, 80, 224–234. [Google Scholar] [CrossRef]
  17. Semendary, A.A.; Svecova, D. Factors affecting bond between precast concrete and cast in place ultra high performance concrete (UHPC). Eng. Struct. 2020, 216, 110746. [Google Scholar] [CrossRef]
  18. Emmons, P.H.; Vaysburd, A.M.; Mcdonald, J.E. Concrete repair in the future turn of the century-Any problem? Concr. Int. 1994, 16, 42–49. [Google Scholar] [CrossRef]
  19. Qin, R.; Hao, H.; Rousakis, T.C.; Lau, D. Effect of shrinkage reducing admixture on new-to-old concrete interface. Compos. Part B Eng. 2019, 167, 346–355. [Google Scholar] [CrossRef]
  20. Saito, M.; Ishimori, H. Chloride permeability of concrete under static and repeated compressive loading. Cem. Concr. Res. 1995, 25, 803–808. [Google Scholar] [CrossRef]
  21. ASTM C-876-22b; Standard Test Method for Corrosion Potentials of Uncoated Reinforcing Steel in Concrete. ASTM International: West Conshehoken, PA, USA, 2022. [CrossRef]
  22. Mundra, S.; Samson, G.; Masi, G.; Achenbach, R.; Bastidas, D.M.; Bernal, S.A.; Bignozzi, M.C.; Criado, M.; Cyr, M.; Gartner, N.; et al. Application of electrochemical methods for studying steel corrosion in alkali-activated materials. Mater. Corros. 2023, 74, 988–1008. [Google Scholar] [CrossRef]
  23. Chai, W.; Li, W.; Ba, H. Experimental Study on Predicting Service Life of Concrete in the Marine Environment. Open Civ. Eng. J. 2011, 5, 93–99. [Google Scholar] [CrossRef]
  24. Videm, K.; Myrdal, R. Electrochemical Behavior of Steel in Concrete and Evaluation of the Corrosion Rate. Corrosion 1997, 53, 734–742. [Google Scholar] [CrossRef]
  25. Angst, U.; Elsener, B.; Larsen, C.K.; Vennesland, Ø. Critical chloride content in reinforced concrete—A review. Cem. Concr. Res. 2009, 39, 1122–1138. [Google Scholar] [CrossRef]
  26. Zhang, M.; Sun, S.; Liu, K.; Li, T.; Yang, H. Research on the critical chloride content of reinforcement corrosion in marine concrete—A review. J. Build. Eng. 2023, 79, 107838. [Google Scholar] [CrossRef]
  27. Cao, Y.; Gehlen, C.; Angst, U.; Wang, L.; Wang, Z.; Yao, Y. Critical chloride content in reinforced concrete—An updated review considering Chinese experience. Cem. Concr. Res. 2019, 117, 58–68. [Google Scholar] [CrossRef]
  28. NT BUILD 492; Concrete, Mortar and Cement-Based Repair Materials: Chloride Migration Coefficient from Non-Steady-State Migration Experiments. Nordtest: Espoo, Finland, 1999.
  29. Zhang, Q.M.; Li, Q.; Li, K.; Fan, Z.H. Quality control for concrete durability when subjected to chloride diffusion in Hong Kong-Zhuhai-Macau sea link project. Gongcheng Lixue/Eng. Mech. 2015, 32, 175–182. [Google Scholar] [CrossRef]
  30. Collepardi, M.; Marcialis, A.; Turriziani, R. Penetration of Chloride Ions into Cement Pastes and Concretes. J. Am. Ceram. Soc. 1972, 55, 534–535. [Google Scholar] [CrossRef]
  31. Sergi, G.; Yu, S.W.; Page, C.L. Diffusion of chloride and hydroxyl ions in cementitious materials exposed to a saline environment. Mag. Concr. Res. 1992, 44, 63–69. [Google Scholar] [CrossRef]
  32. Yuan, Q.; Shi, C.; De Schutter, G.; Audenaert, K.; Deng, D. Chloride binding of cement-based materials subjected to external chloride environment—A review. Constr. Build. Mater. 2009, 23, 1–13. [Google Scholar] [CrossRef]
  33. Martín-Pérez, B.; Zibara, H.; Hooton, R.D.; Thomas, M.D.A. A study of the effect of chloride binding on service life predictions. Cem. Concr. Res. 2000, 30, 1215–1223. [Google Scholar] [CrossRef]
  34. Safehian, M.; Ramezanianpour, A.A. Prediction of RC structure service life from field long term chloride diffusion. Comput. Concr. 2015, 15, 589–606. [Google Scholar] [CrossRef]
  35. Li, Q.; Li, K.; Zhou, X.G.; Zhang, Q.; Fan, Z.H. Model-based durability design of concrete structures in Hong Kong-Zhuhai-Macau sea link project. Struct. Saf. 2015, 53, 1–12. [Google Scholar] [CrossRef]
  36. Valipour, M.; Pargar, F.; Shekarchi, M.; Khani, S.; Moradian, M. In situ study of chloride ingress in concretes containing natural zeolite, metakaolin and silica fume exposed to various exposure conditions in a harsh marine environment. Constr. Build. Mater. 2013, 46, 63–70. [Google Scholar] [CrossRef]
  37. Gjørv, O.E. Durability of Concrete Structures. Arab. J. Sci. Eng. 2011, 36, 151–172. [Google Scholar] [CrossRef]
Figure 1. Design and fabrication diagram of Joint 1.
Applsci 14 06609 g001aApplsci 14 06609 g001b
Figure 2. Design and fabrication diagram of Joint 2.
Applsci 14 06609 g002
Figure 3. Three types of coating damage.
Applsci 14 06609 g003
Figure 4. Design diagram of electromigration system.
Applsci 14 06609 g004
Figure 5. Schematic diagram of electrochemical test.
Applsci 14 06609 g005
Figure 6. Schematic diagram of potentiodynamic polarization curve fitting.
Applsci 14 06609 g006
Figure 7. Schematic diagram of drilling powder.
Applsci 14 06609 g007
Figure 8. Self-corrosion potential.
Applsci 14 06609 g008
Figure 9. Damage area ratio of epoxy coating.
Applsci 14 06609 g009
Figure 10. Corrosion current density.
Applsci 14 06609 g010
Figure 11. Polarization resistance.
Applsci 14 06609 g011
Figure 12. The chloride ion content in Joint 1.
Applsci 14 06609 g012
Figure 13. The Chloride ion content in Joint 2.
Applsci 14 06609 g013
Figure 14. Chloride ion content on the steel bar surface.
Applsci 14 06609 g014
Figure 15. Determination of critical chloride ion content.
Applsci 14 06609 g015
Figure 16. Critical chloride ion contents for various damaged steel bars.
Applsci 14 06609 g016
Figure 17. Corrosion morphology of bar in joint 1.
Applsci 14 06609 g017
Figure 18. Corrosion morphology of bar in joint 2.
Applsci 14 06609 g018
Figure 20. Numerical simulation results of Joint 1.
Applsci 14 06609 g020
Figure 21. The service life prediction for Joint 1.
Applsci 14 06609 g021
Figure 22. Numerical simulation results of Joint 2.
Applsci 14 06609 g022
Figure 23. The service life prediction for Joint 2.
Applsci 14 06609 g023
Table 1. Mix proportions of concrete.
Strength GradeMix Proportion/(kg·m−3)
WaterCementFine AggregateCoarse AggregateFly AshGGBSPCA®-IVHME®-II
C50183340736942601003.50
C60142.5325639113550503.575
Table 2. The initiation times of corrosion.
Joint TypeJoint 1Joint 2
TreatmentScratchedBentKnockedUntreatedScratchedBentKnockedUntreated
Initial corrosion time/d74270777212835
Table 4. Parameters of the model.
Cs (mol/m3)c (mm)W (mm)DNSSD (×10−12m2/s)
DC50DC60DMDCCDCMD0
400.5877050.3950.3310.2291.6680.8792032
Table 5. Critical chloride ion concentration.
Joint TypeJoint 1Joint 2
Treatment MethodBentKnockedUntreatedBentKnockedUntreated
C c r / (mol/m3)79150163294865
Disclaimer/Publisher’s Note: The statements, opinions and data contained in all publications are solely those of the individual author(s) and contributor(s) and not of MDPI and/or the editor(s). MDPI and/or the editor(s) disclaim responsibility for any injury to people or property resulting from any ideas, methods, instructions or products referred to in the content.

