Article

Enhancing Manufacturing Excellence with Digital-Twin-Enabled Operational Monitoring and Intelligent Scheduling

School of Technology, Beijing Forestry University, Beijing 100083, China
*
Author to whom correspondence should be addressed.
Appl. Sci. 2024, 14(15), 6622; https://doi.org/10.3390/app14156622 (registering DOI)
Submission received: 19 April 2024 / Revised: 1 May 2024 / Accepted: 3 May 2024 / Published: 29 July 2024
(This article belongs to the Special Issue Digital and Sustainable Manufacturing in Industry 4.0)

Abstract

:
This research examines the potential of digital twin (DT) technology for reformation within China’s traditional solid-wood-panel processing industry, which currently suffers from production inefficiencies and the slow adoption of digital technology. The research centers around developing a digital twin system, elucidating improvements in manufacturing efficiency, waste management, process simulation, and real-time monitoring. These capabilities facilitate immediate problem solving and offer transparency in the process. The digital twin system is comprised of physical, transport, virtual, and application layers, employing a MySQL database and using the Open Platform Communications Unified Architecture (OPC UA) protocol for communication. The application of this system has led to heightened production efficiency and better material use in the solid-wood-panel manufacturing line. Integrating the dynamic selection adaptive genetic algorithm (DSAGA) into the virtual layer drives the system’s efficiency forward. This evolved approach has allowed for an enhancement of 8.93% in the scheduling efficiency of DSAGA compared to traditional genetic algorithms (GAs), thereby contributing to increased system productivity. Real-time mapping and an advanced simulation interface have strengthened the system’s monitoring aspect. These additions enrich data visualization, leading to better comprehension and a holistic process view. This research has ignited improvements in solid-wood-panel production, illustrating the tangible benefits and representing progress in incorporating digital technology into traditional industries. This research sets a path for transforming these industries into smart manufacturing by effectively bridging the gap between physical production and digital monitoring. Furthermore, the adjustability of this approach extends beyond solid-wood-panel production, indicating the capability to expedite movement towards intelligent production in various other manufacturing sectors.

1. Introduction

The shift towards digital processes underscores the urgency for updating traditional manufacturing practices to meet the contemporary needs for heightened efficiency and product quality. Upgrades to traditional production methods are required to decrease idle times and improve equipment utilization, which in turn can reduce production costs and bolster market competitiveness.
The advancement of information technology has catalyzed the digital transformation of production environments through the adoption of intelligent production and monitoring techniques. Central to this transformation is digital twin technology, which heralds a new era in production monitoring. This technology establishes a virtual counterpart to the physical production layer, providing a real-time depiction of physical assets.
The advantages of digital twin technology in smart manufacturing manifest in several ways: (1) The ability to simulate and optimize the production process in real time, coupled with monitoring and adjusting production schedules, enhances capacity and optimizes resource utilization [1]. (2) Real-time data monitoring and analysis enable status assessments for machinery, early fault detection, and maintenance recommendations, which could lead to minimized downtime and reduced repair expenses [2]. (3) Detailed simulations and analyses are provided throughout the product manufacturing process, which can help decision making and scheduling, ultimately improving product performance and quality [3].
In this environment, the conventional solid-wood-panel manufacturing industry is particularly impacted due to its early stages of adopting digital tools [4]. Nonetheless, the success of digital twin technology in other areas, like aerospace, suggests it could be used in solid-wood-panel production to better plan schedules, reduce waste, and boost productivity [5]. Digital twins are changing the manufacturing sector, transforming everything from initial design [1] to after-sales service [6] with the help of synchronized, real-time data and simulations. Incorporating these systems requires addressing challenges related to data security, learning complexity, and considerable investments [3].
An evident demand exists for modernizing China’s solid-wood-panel manufacturing through automation and digital methods. By employing more effective wood resource management and refining production practices, this initiative will guide the industry toward a more sustainable and economically beneficial path.
The adoption of digital twin technology in the manufacturing sector, especially within specialized domains like solid-wood-panel manufacturing, has prompted an analytical examination of current research through a comprehensive literature review. This study strategically utilized Boolean operators “AND”, “OR”, and “NOT” in databases to refine the search scope, focusing on “digital twin AND solid-wood-panel manufacturing” for targeted results on digital-physical system integration, as well as “machine learning OR artificial intelligence NOT general manufacturing” to exclude generalist studies and focus on those relevant to intelligent manufacturing processes. Moreover, “genetic algorithms AND production scheduling” was included to capture studies at the intersection of optimization techniques and manufacturing operations, ensuring comprehensive coverage of key areas pertinent to the study. Soori et al. [7] explored the potential of augmenting CNC machine efficiency by integrating machine learning and AI, showcasing significant automation enhancements. However, their study did not delve into the specific complexities and requirements of solid-wood-panel manufacturing, a sector defined by its unique material properties and intricate production methods. Similarly, Wang et al. [8] investigated intelligent systems for production line monitoring, highlighting critical improvements like real-time surveillance and waste management. Yet, their research was limited to monitoring activities, not extending to simulations crucial for all-encompassing workshop management. Building on these themes, Wu and Zhu [9] detailed their advances in digital twin technology for custom panel furniture, noting progress but needing more critical analysis on scalability and the detailed necessities for broader implementation in solid-wood-panel manufacturing. Echoing a parallel sentiment, Ouyang et al. [10] commented on the fast-paced development of digital twin research, pinpointing the lack of a standardized definition which hampers the creation of concrete strategies necessary for the meticulous operations of solid-wood-panel manufacturing where precision and flexibility are paramount.
In the domain of production scheduling, the innovative use of artificial neural networks (ANNs) by Hopfield and Tank [11] underscored the potential for neural-network-based optimization. Despite its revolutionary insights, the approach proved cost-prohibitive for SMEs due to the extensive data training and specialized knowledge requirements. Further, Wu et al. [12] explored genetic algorithms (GAs) focusing on machining operations, failing to fully embrace the heterogeneous and complex nature of solid-wood-panel manufacturing. Bhoskar et al. [13] acknowledged the benefits of GAs in mechanical engineering, highlighting AI’s capability to refine design processes. Nonetheless, the adaptability of GAs was called into question, as their static nature restricts the exploration of solutions within the dynamic and complex variables pertinent to actual production settings. This revised literature review, enhanced by a strategic use of Boolean operators, not only identifies the impactful contributions of existing research but also illuminates the connections between them, thereby solidifying the theoretical foundation of this study. It underlines the exigencies and opportunities within the solid-wood-panel manufacturing industry, driving towards a comprehensive understanding and addressing the intricacies of integrating digital twin technologies for optimized manufacturing outcomes.
Against this backdrop, this study focuses on three principal enhancements in the solid-wood-panel manufacturing domain. Initially, it develops a digital twin-based simulation system to reflect and assess the production line accurately. Additionally, the research establishes a system for monitoring the operational state, which maintains consistent observance and efficacy throughout the production cycle. Moreover, a new production scheduling algorithm known as the dynamic selection adaptive genetic algorithm (DSAGA), based on genetic algorithms (GAs) [14], is conceived and implemented within the monitoring system to refine the scheduling of the production line dynamically. DSAGA employs an adaptive dynamic selection strategy that allows for the acquisition of optimum solutions to advance production efficiency on the solid-wood-panel production line.
The digital twin setup effectively duplicates and simulates intricate production operations, aiding precise resource management and minimizing waste. In parallel, DSAGA introduces an adaptive approach to scheduling, refining decision making in the manufacturing process through real-time data alignment, thus marking the study’s contribution to advancing intelligent manufacturing practices in the solid-wood-panel industry.

2. Materials and Methods

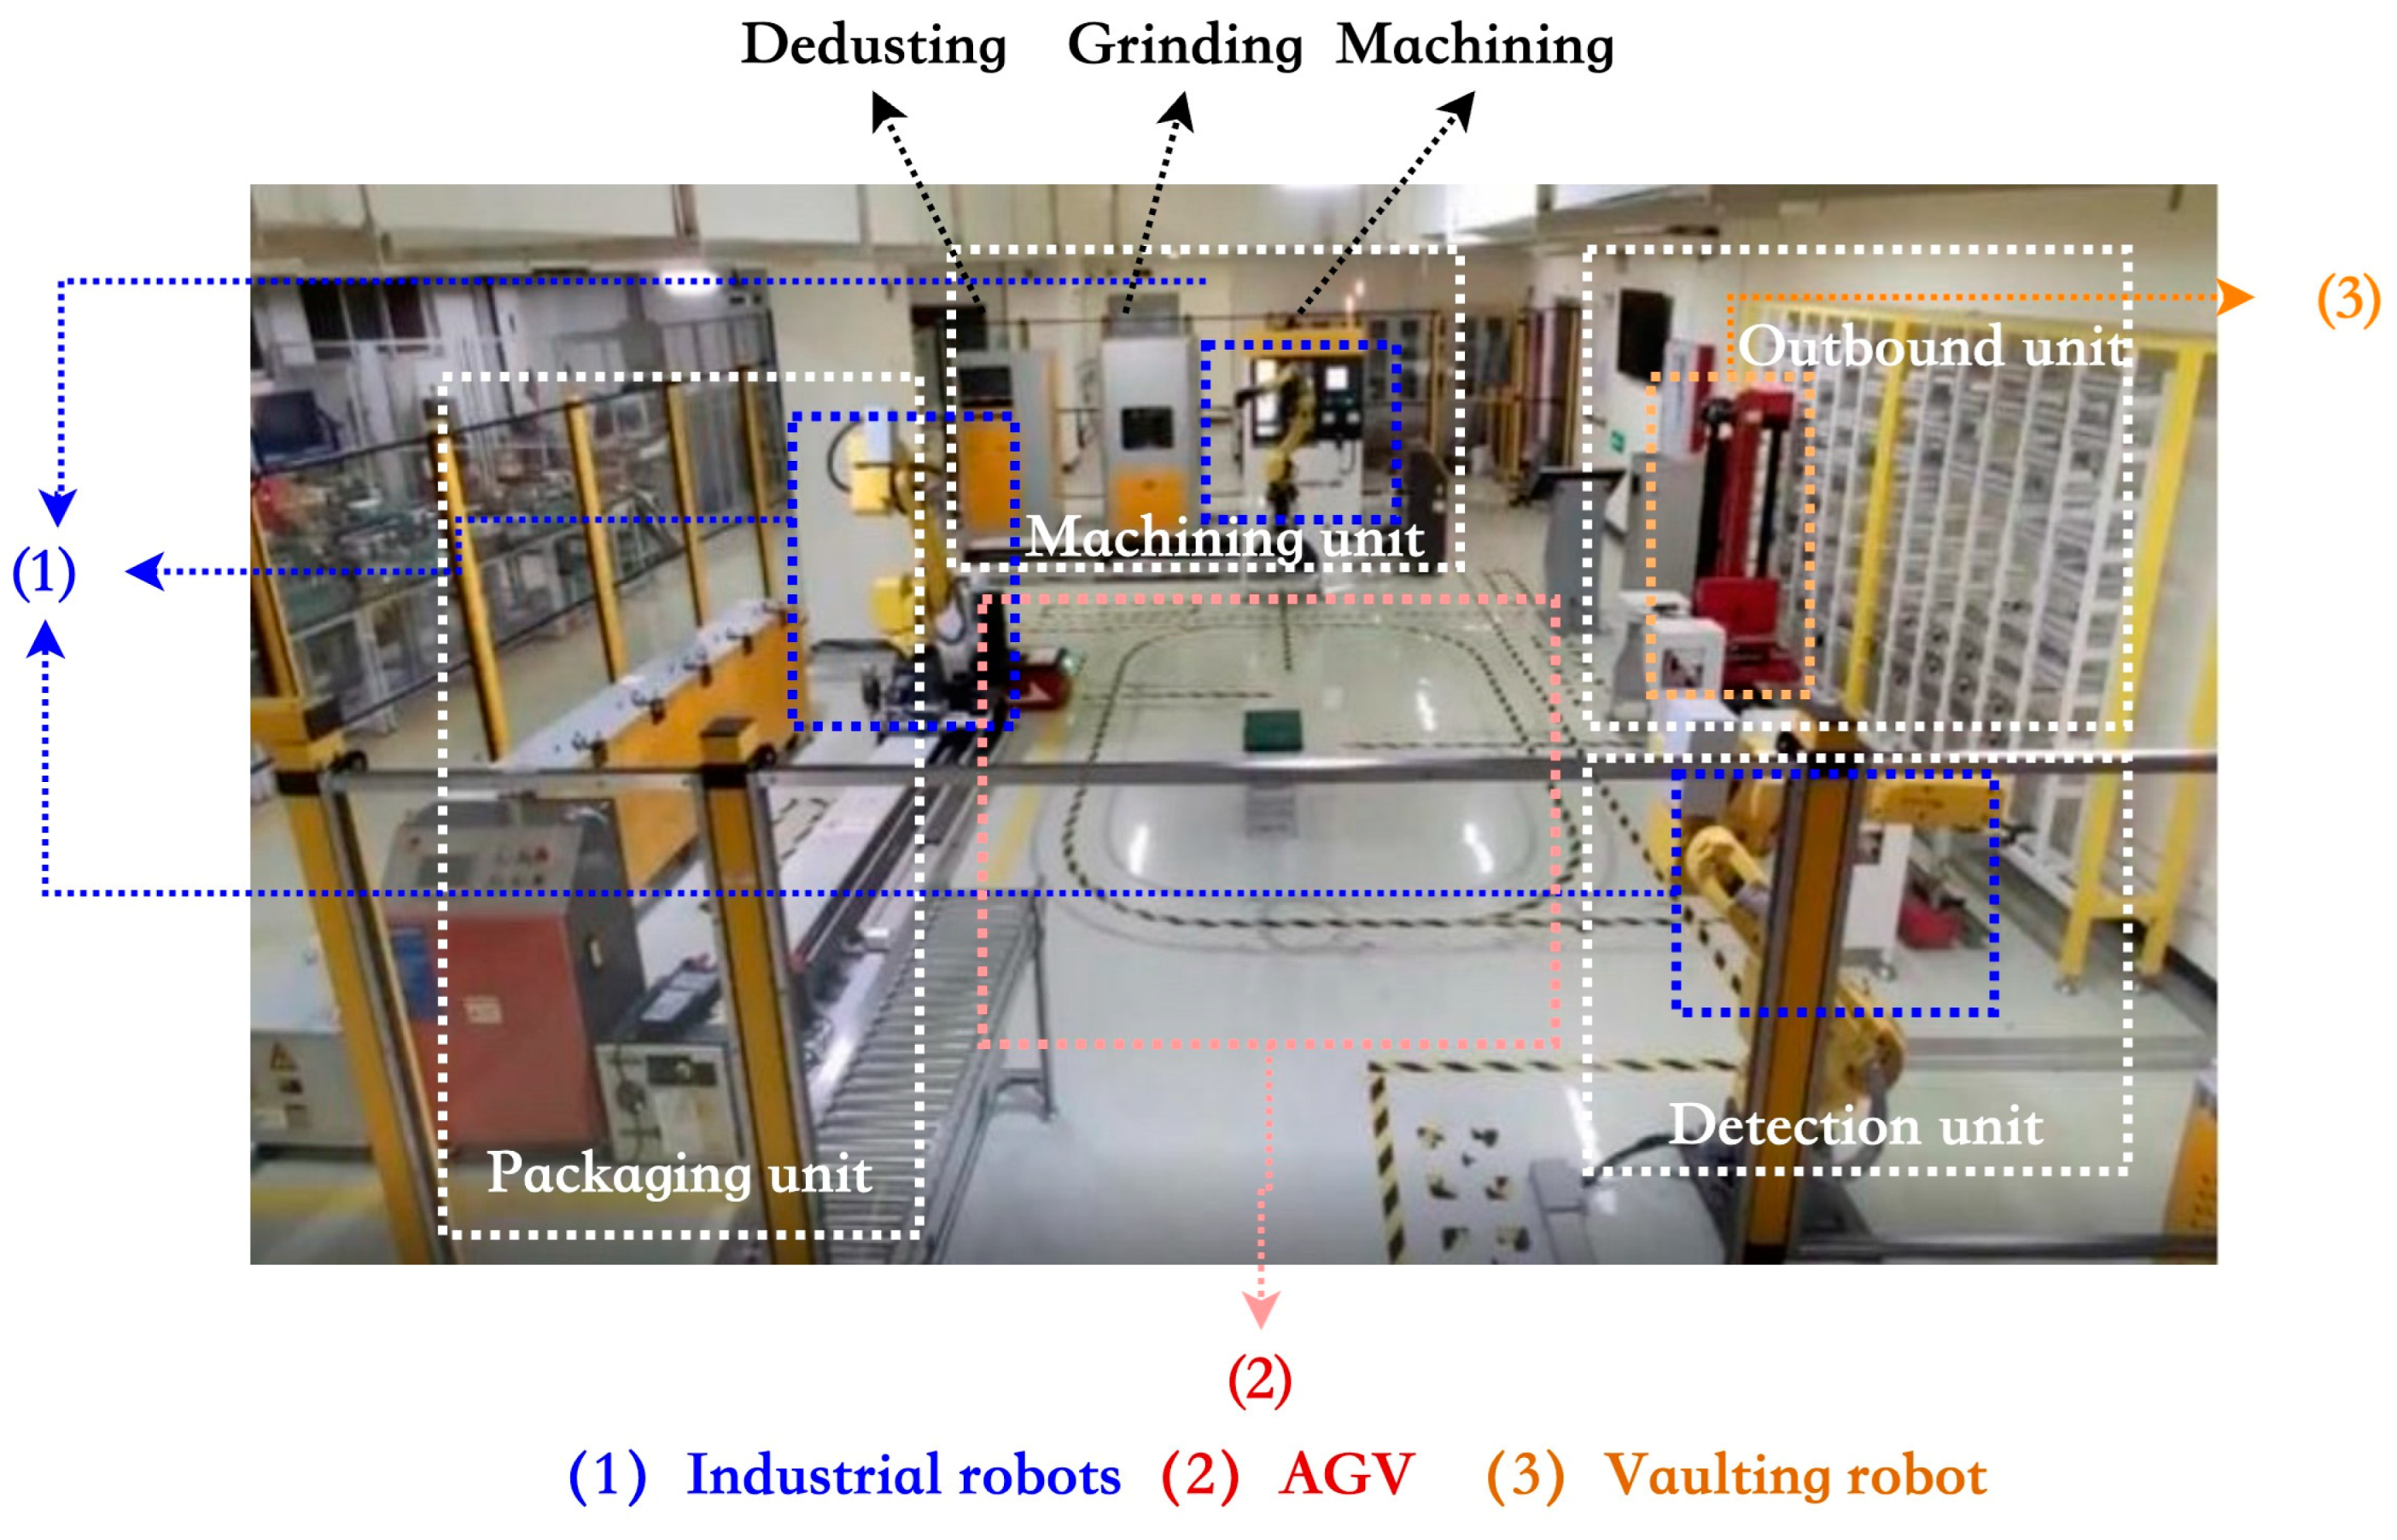
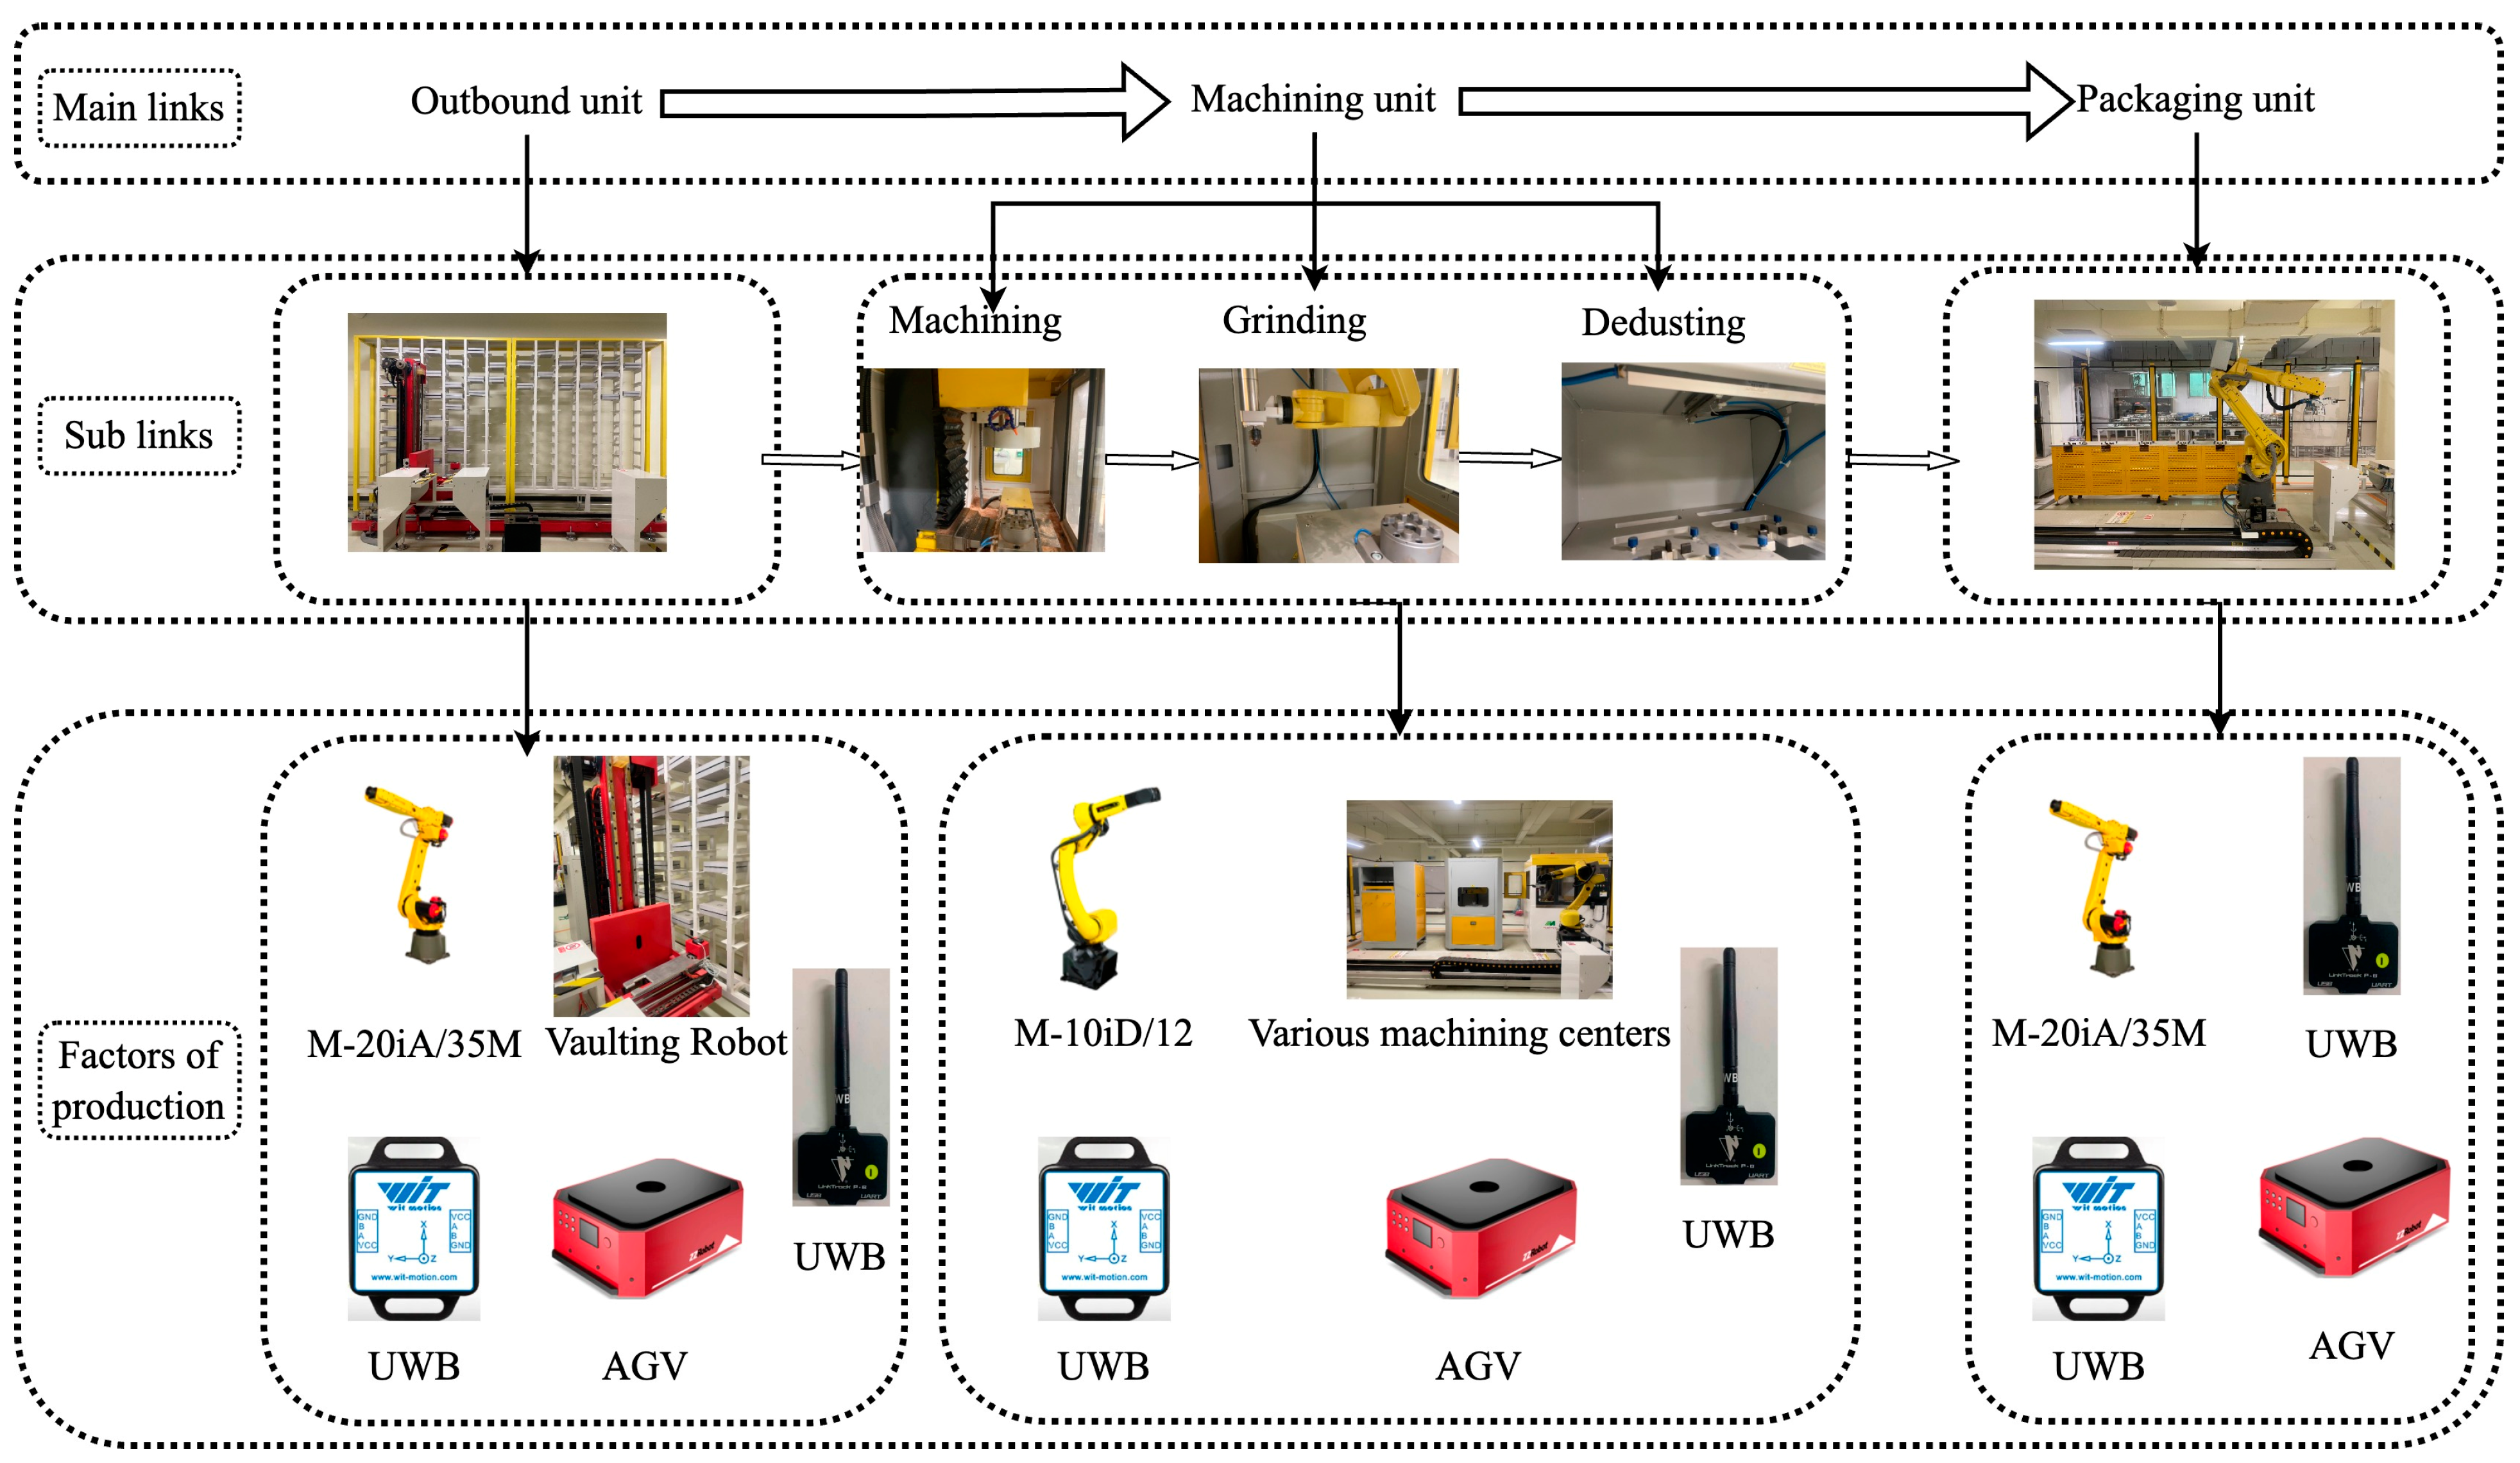
2.1. Detailed Analysis of Solid-Wood-Panel Processing: Workflow and Key Technologies

This study examines the integration of digital twin technology in manufacturing wooden photograph frames, showcasing its application within the broader context of solid-wood-panel processing. The section is visually supported by Figure 1.
Figure 1 outlines the essential stages of the manufacturing process, including wood edge inspection, pallet arrangement, machining, grinding, dedusting, packaging, and final storage preparation. For detailed analysis and digital twin application, these stages are grouped into five units: the outbound unit, machining, grinding, dedusting, and packaging.
The workflow begins with the inspection of wood panels. Once verified, a robotic arm transfers the panels to the outbound unit. Subsequently, another robot systematically positions the panels for the respective processing stages. Automated guided vehicles (AGVs) transport the pallets between operational units, sequentially handling machining, grinding, and dedusting tasks. Once these processes are complete, the panels are conveyed to the packaging phase, where they are assembled into frames, boxed, and prepared for storage and distribution. Figure 2 presents a detailed information model for the processing of solid-wood panels.
Furthermore, Figure 2 delineates the main links, the sublinks, and various factors of production. This model serves as a schematic representation that aids in understanding the application of digital twin technology within this specialized setting. After analyzing the solid-wood-panel processing line, this study notes the following production elements as necessary.
Automated guided vehicles (AGVs) play a role in transporting materials between units in the solid-wood-panel processing lines. These industrial vehicles are designed to load goods automatically, navigating through predefined routes to designated locations where they can also autonomously unload these goods. In this study, light-load lifting AGVs from Zhongzhi Robotics Company were selected, equipped with magnetic navigation, and bolstered by safety mechanisms including eight-point ultrasonic, infrared, and a safety touch edge. The image of AGV is shown in Figure 3.
For the solid-wood-panel processing line, two models of industrial robots, M-20iA/35M and M-10iD/12, Shanghai, China, were selected as subjects for this study. An actual image of these industrial robots is depicted in Figure 4. The mentioned robots utilize servo control technology, which allows for easy installation and ensures high-speed stability during operation. Considering the need for a more extensive reach radius in the depalletizing and packaging units for grasping tasks, the M-20iA/35M model is employed in these units, offering a reach radius of 1813 mm. Conversely, the processing unit utilizes the M-10iD/12 model of industrial robot, which has a reach radius of 1441 mm.
Positioning and ranging sensors are necessary to ascertain the precise locations of the automated storage and retrieval system (ASRS) robots, AGVs, and other horizontal motion processing equipment. The LinkTrackP-B model based on UWB (Ultra-Wideband) technology from the Nooploop company, Shenzhen, China was selected for this experiment. This UWB positioning and ranging sensor enhances its locational accuracy through the installation of an NAUWB01 external antenna into the screw hole. An actual image of the LinkTrackP-B model sensor is illustrated in Figure 5.
In this study, the focus is not limited to positioning and ranging sensors for horizontal and vertical directions; it also encompasses a range of angular data generated by the rotational movement of the industrial robot’s base, the forward and backward tilt of the first and second arm sections, the rotation and swing of the wrist, and the wrist joint’s free rotation. Hence, the implementation of attitude sensor devices is indispensable. For this purpose, the WT901C-485 model nine-axis sensor from WitMotion Intelligent Technology Co., Ltd., Shenzhen, China, was employed. An actual image of this sensor is shown in Figure 6.

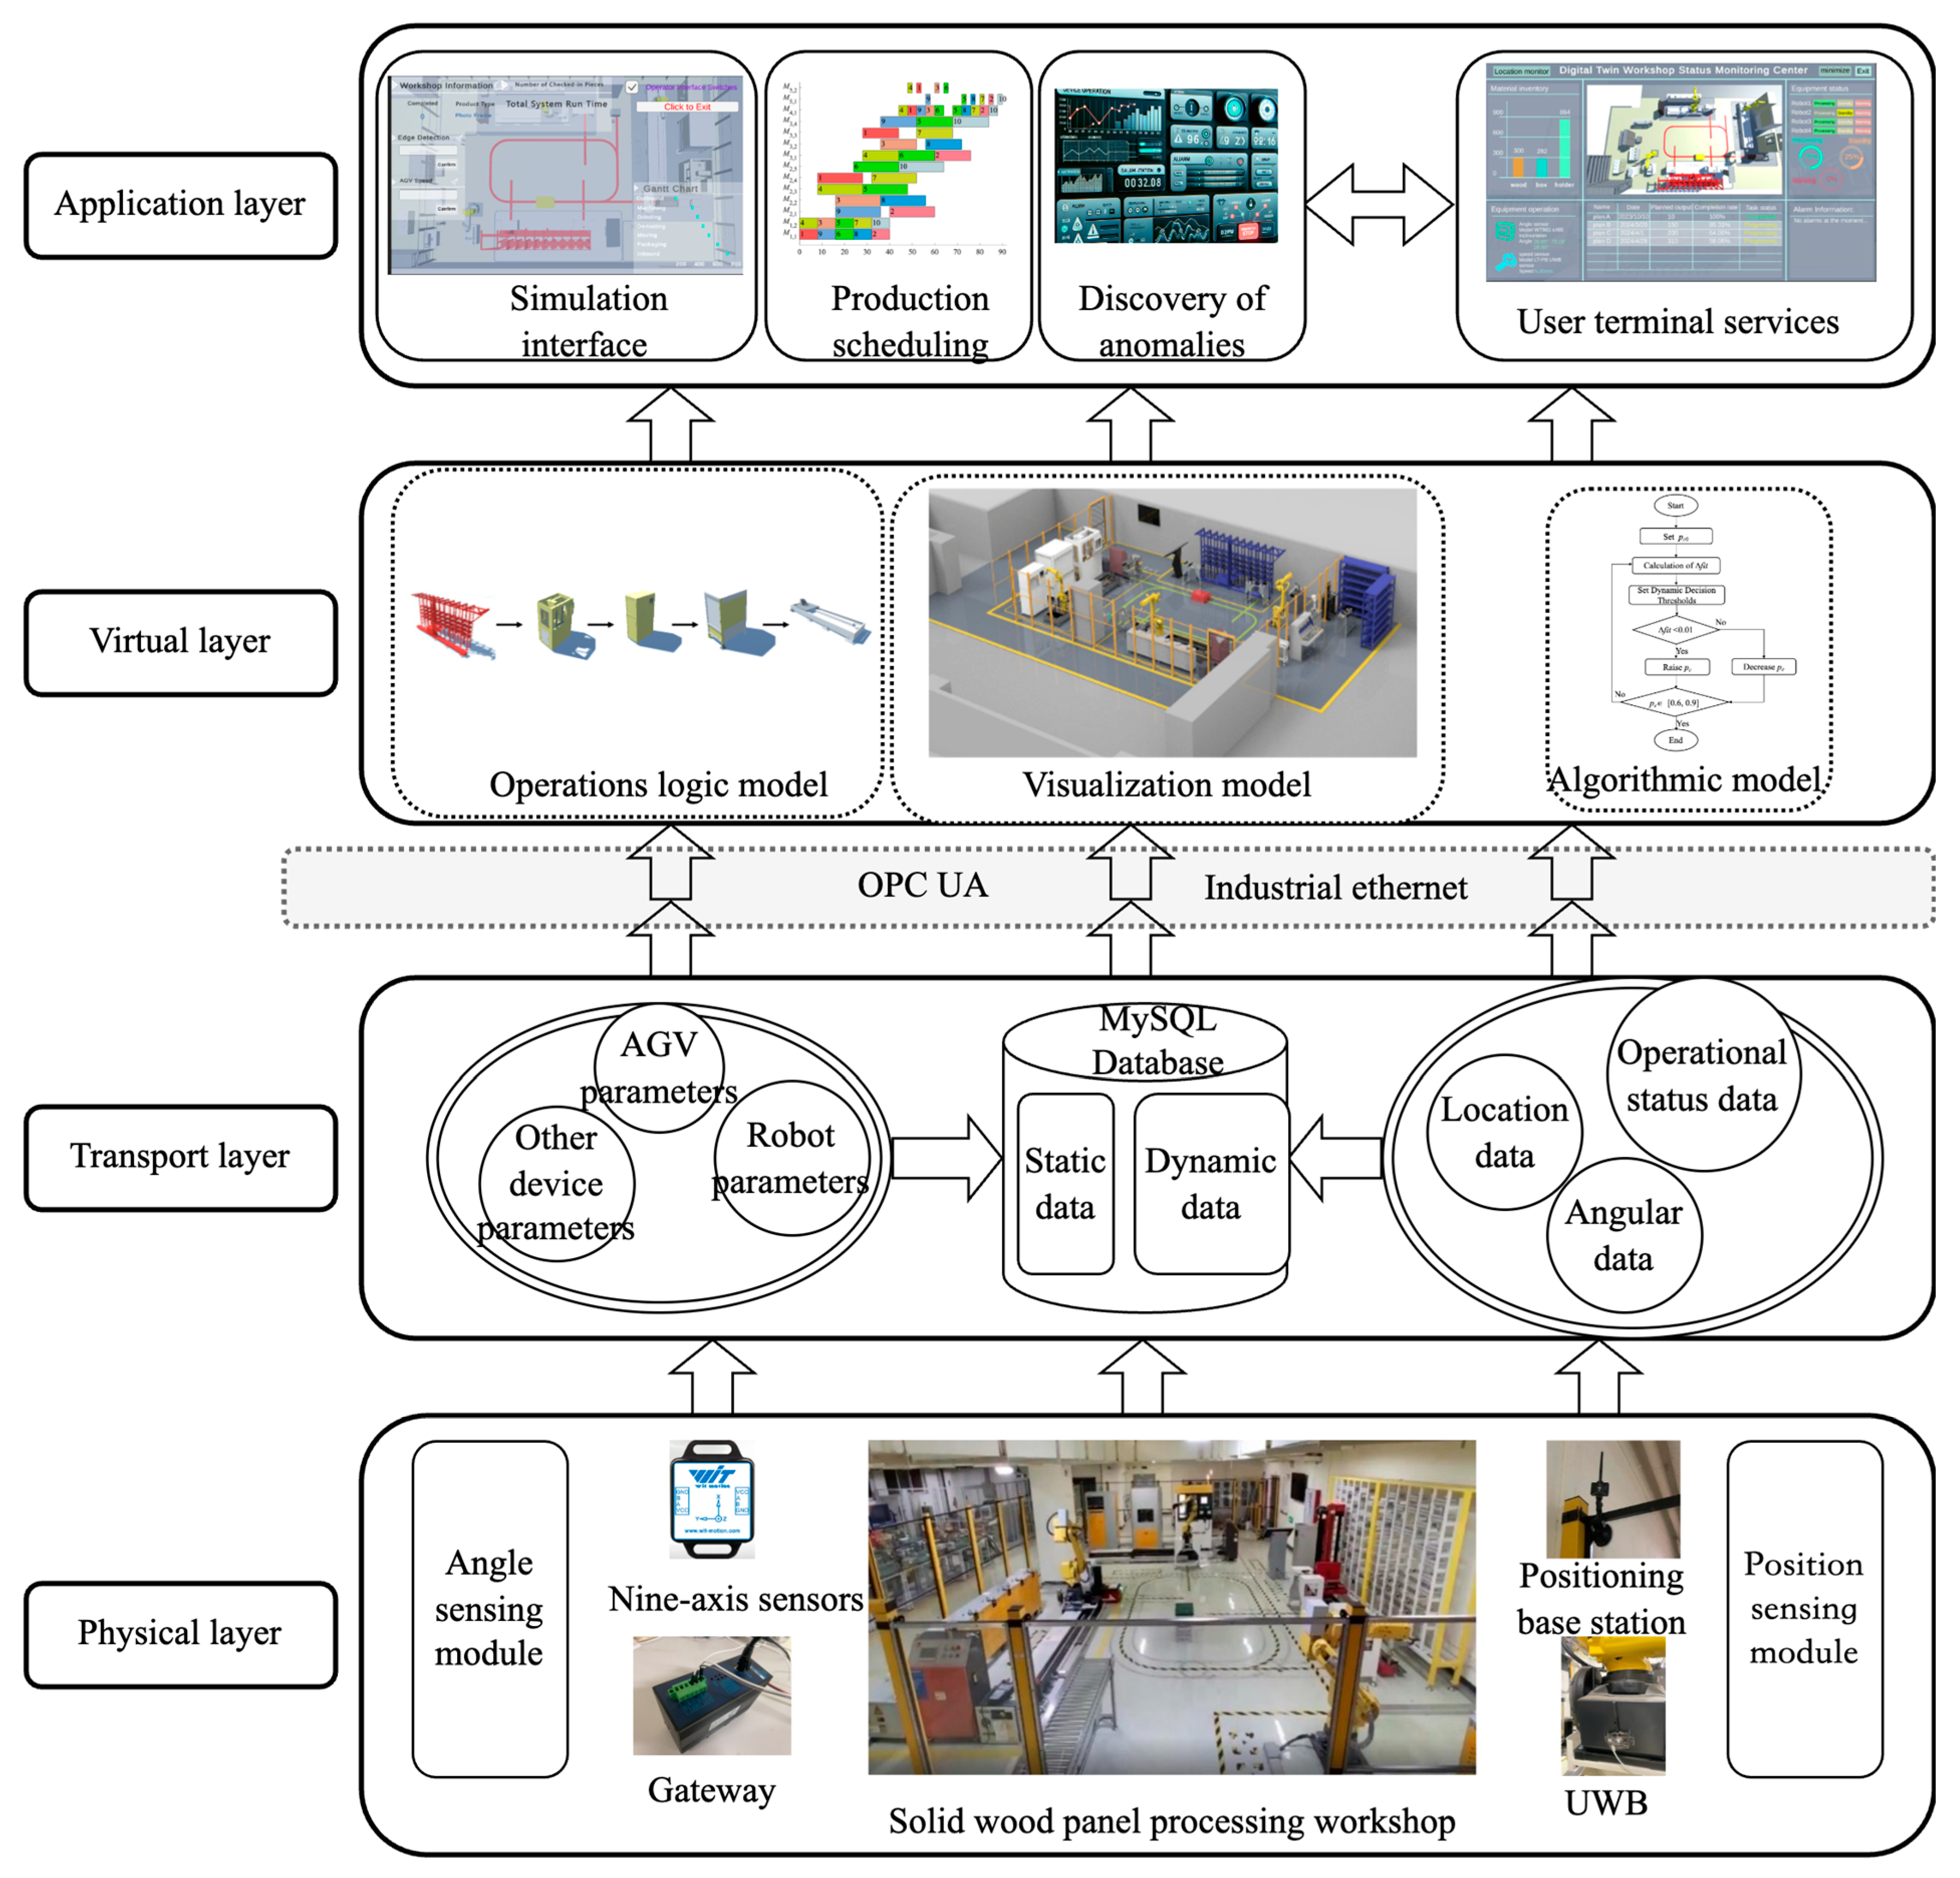
2.2. Framework of Digital Twin System for Solid-Wood-Panel Processing

A monitoring system must be established to enhance the oversight of production processes and identify potential issues. Efficient surveillance provides prompt access to dynamically evolving manufacturing processes, swiftly resolving problems. Visualization of real-time monitoring data in a three-dimensional (3D) format adds clarity and comprehensiveness to the monitoring process.
Building upon the five-dimensional model architecture established for digital twins [15], as outlined in Equation (1) [6], the digital twin framework is segmented into five integral components: the physical entity (PE), virtual entity (VE), services (Ss), digital data (DD), and the connections (CN) between these components. This structure underscores the comprehensive nature of the digital twin monitoring system, encompassing the physical, transport, virtual, and application layers.
M D T = ( P E , V E , S s , D D , C N )
Figure 7 displays a schematic diagram depicting the interrelationships among the four layers of the digital twin system applied to solid-wood-panel processing.

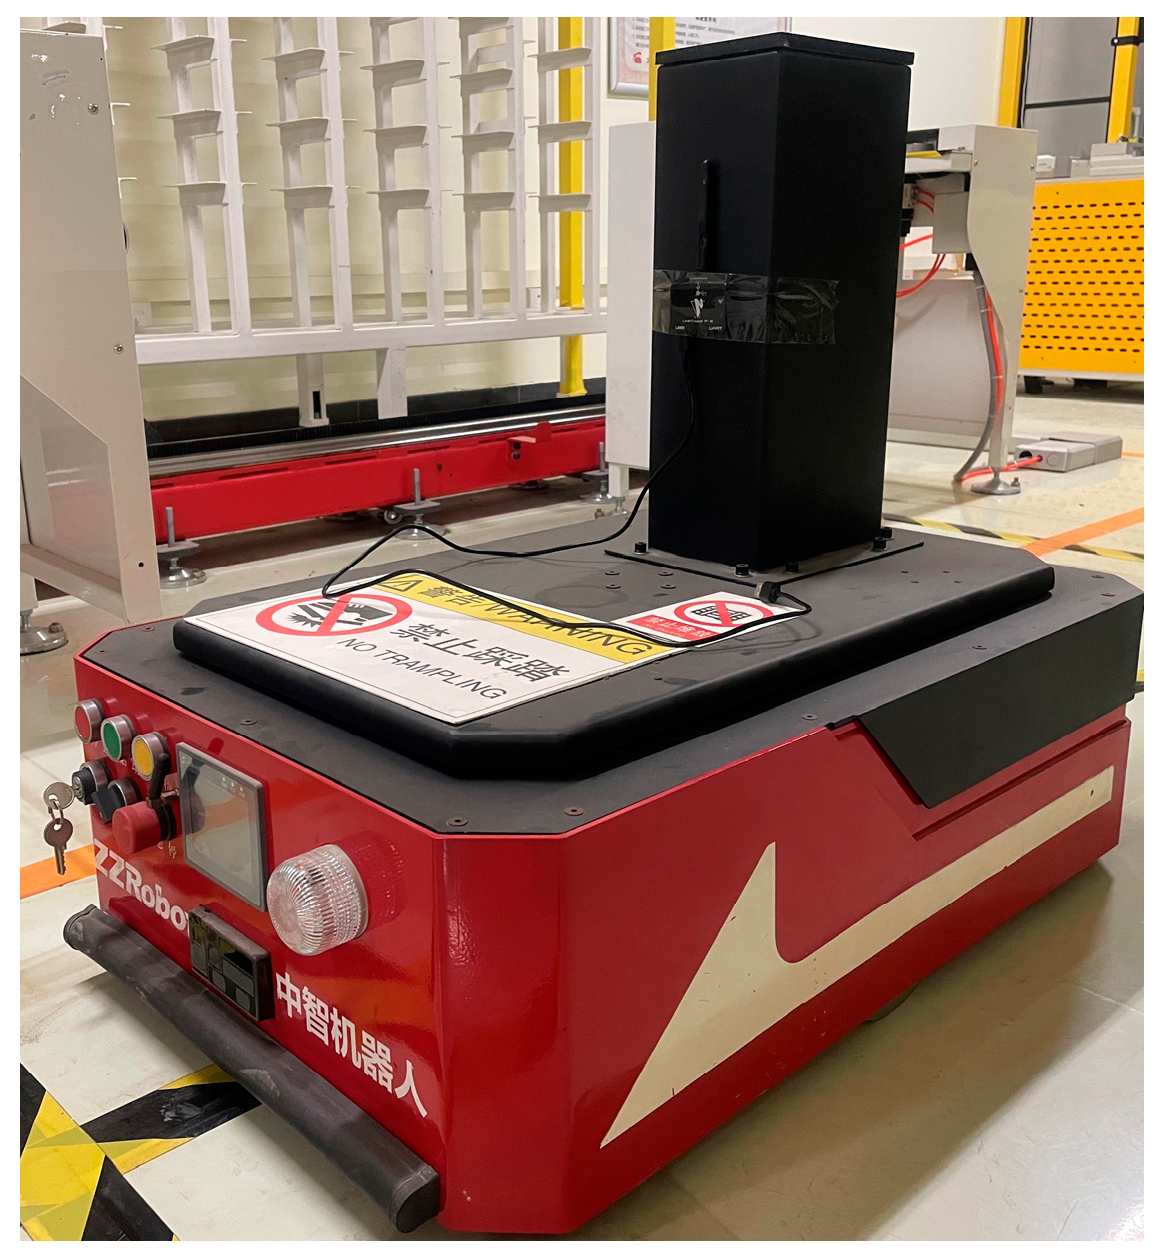
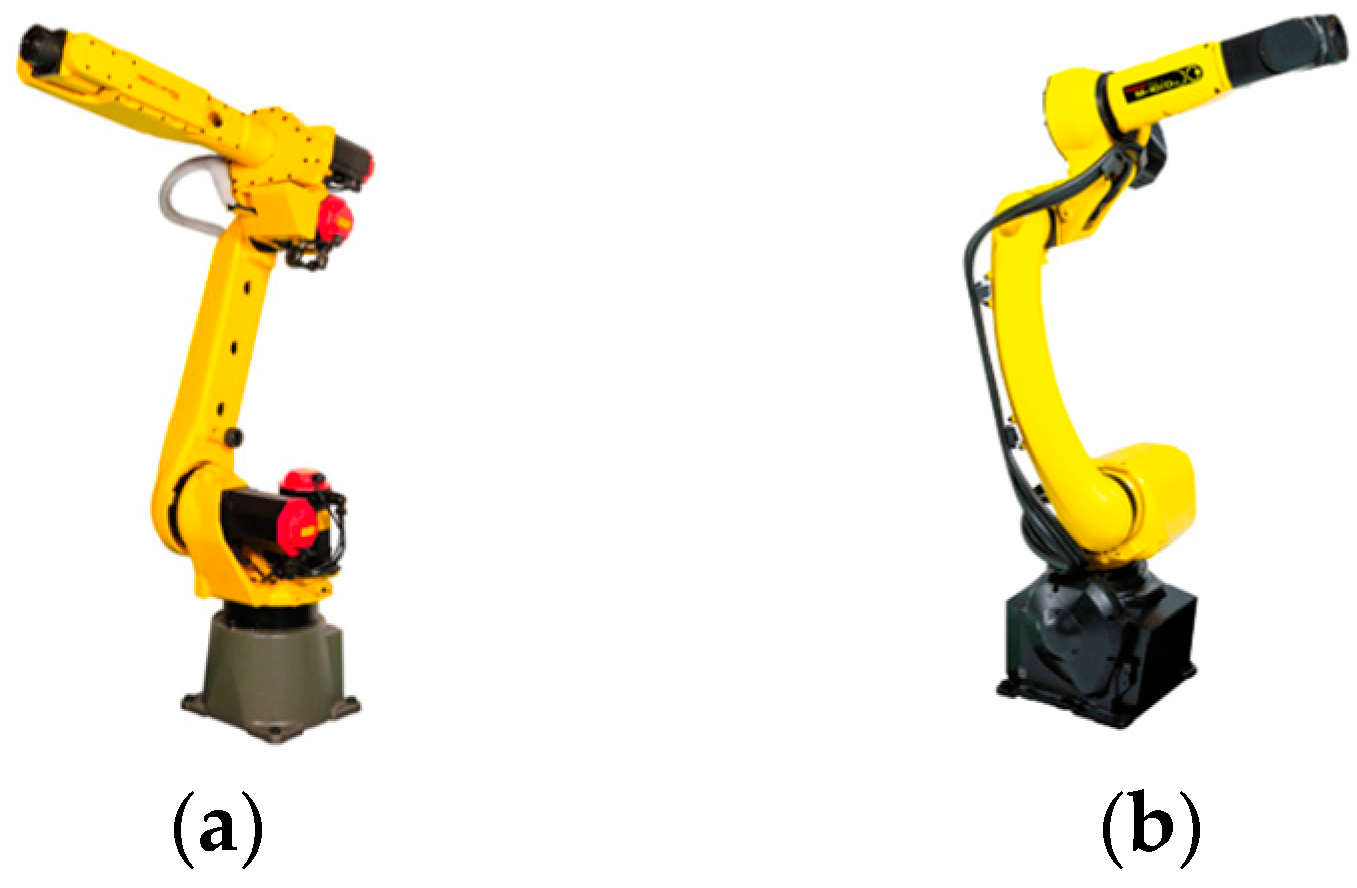
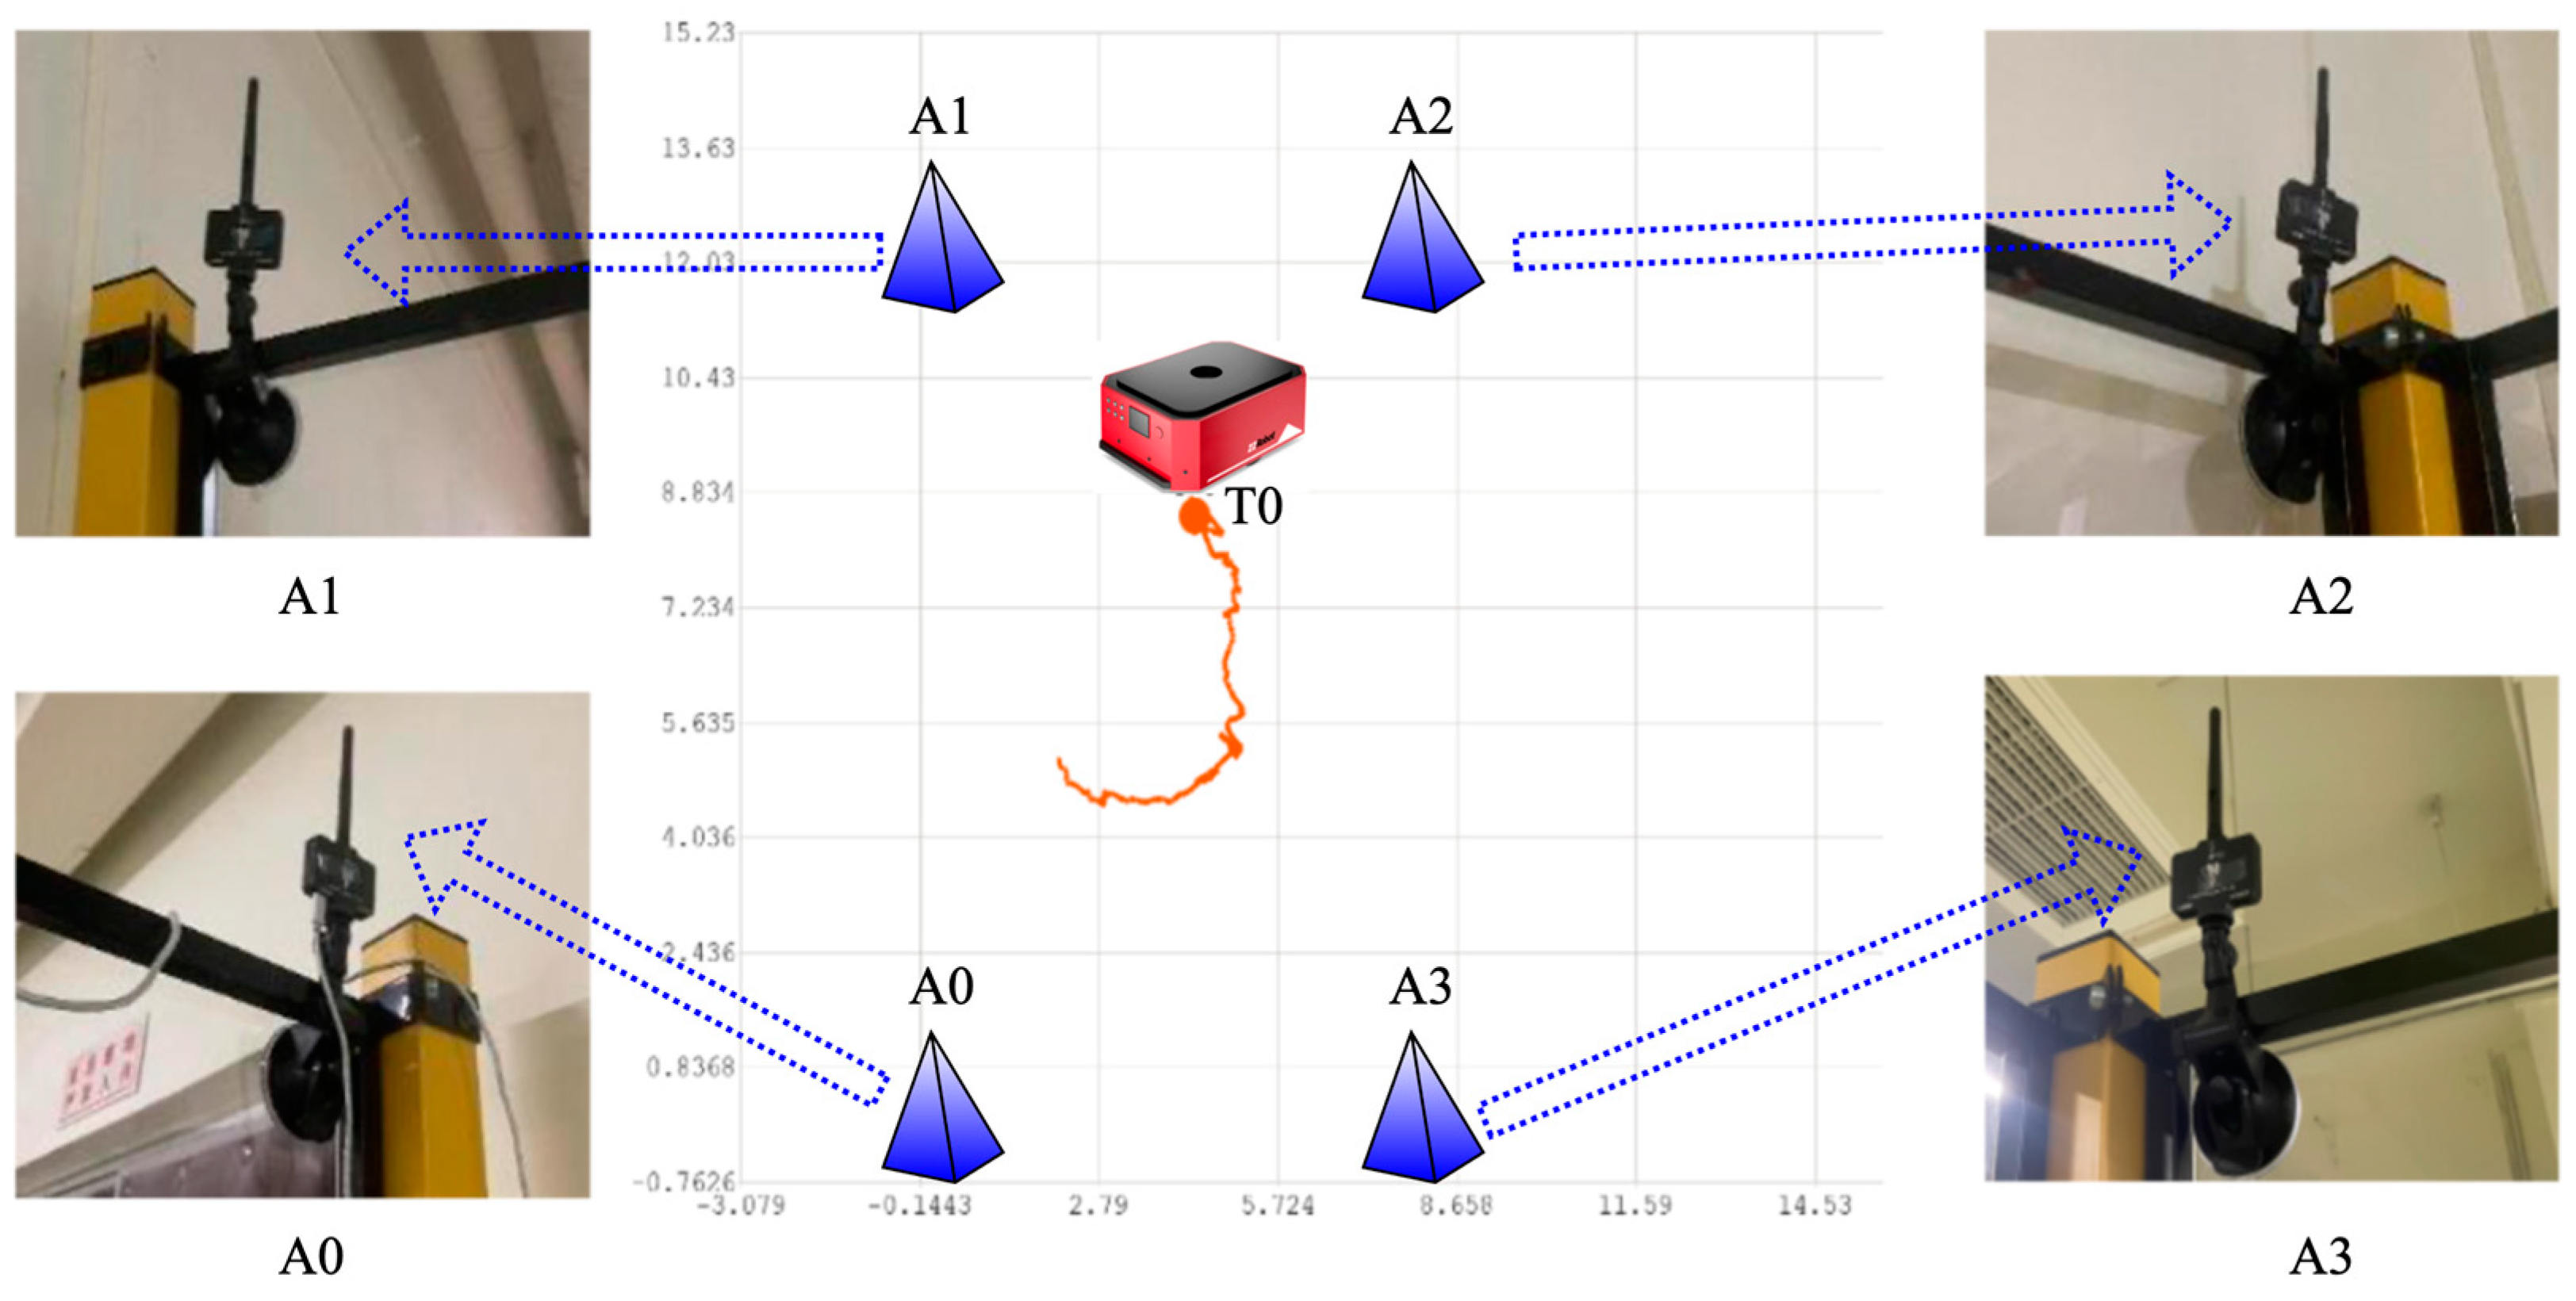
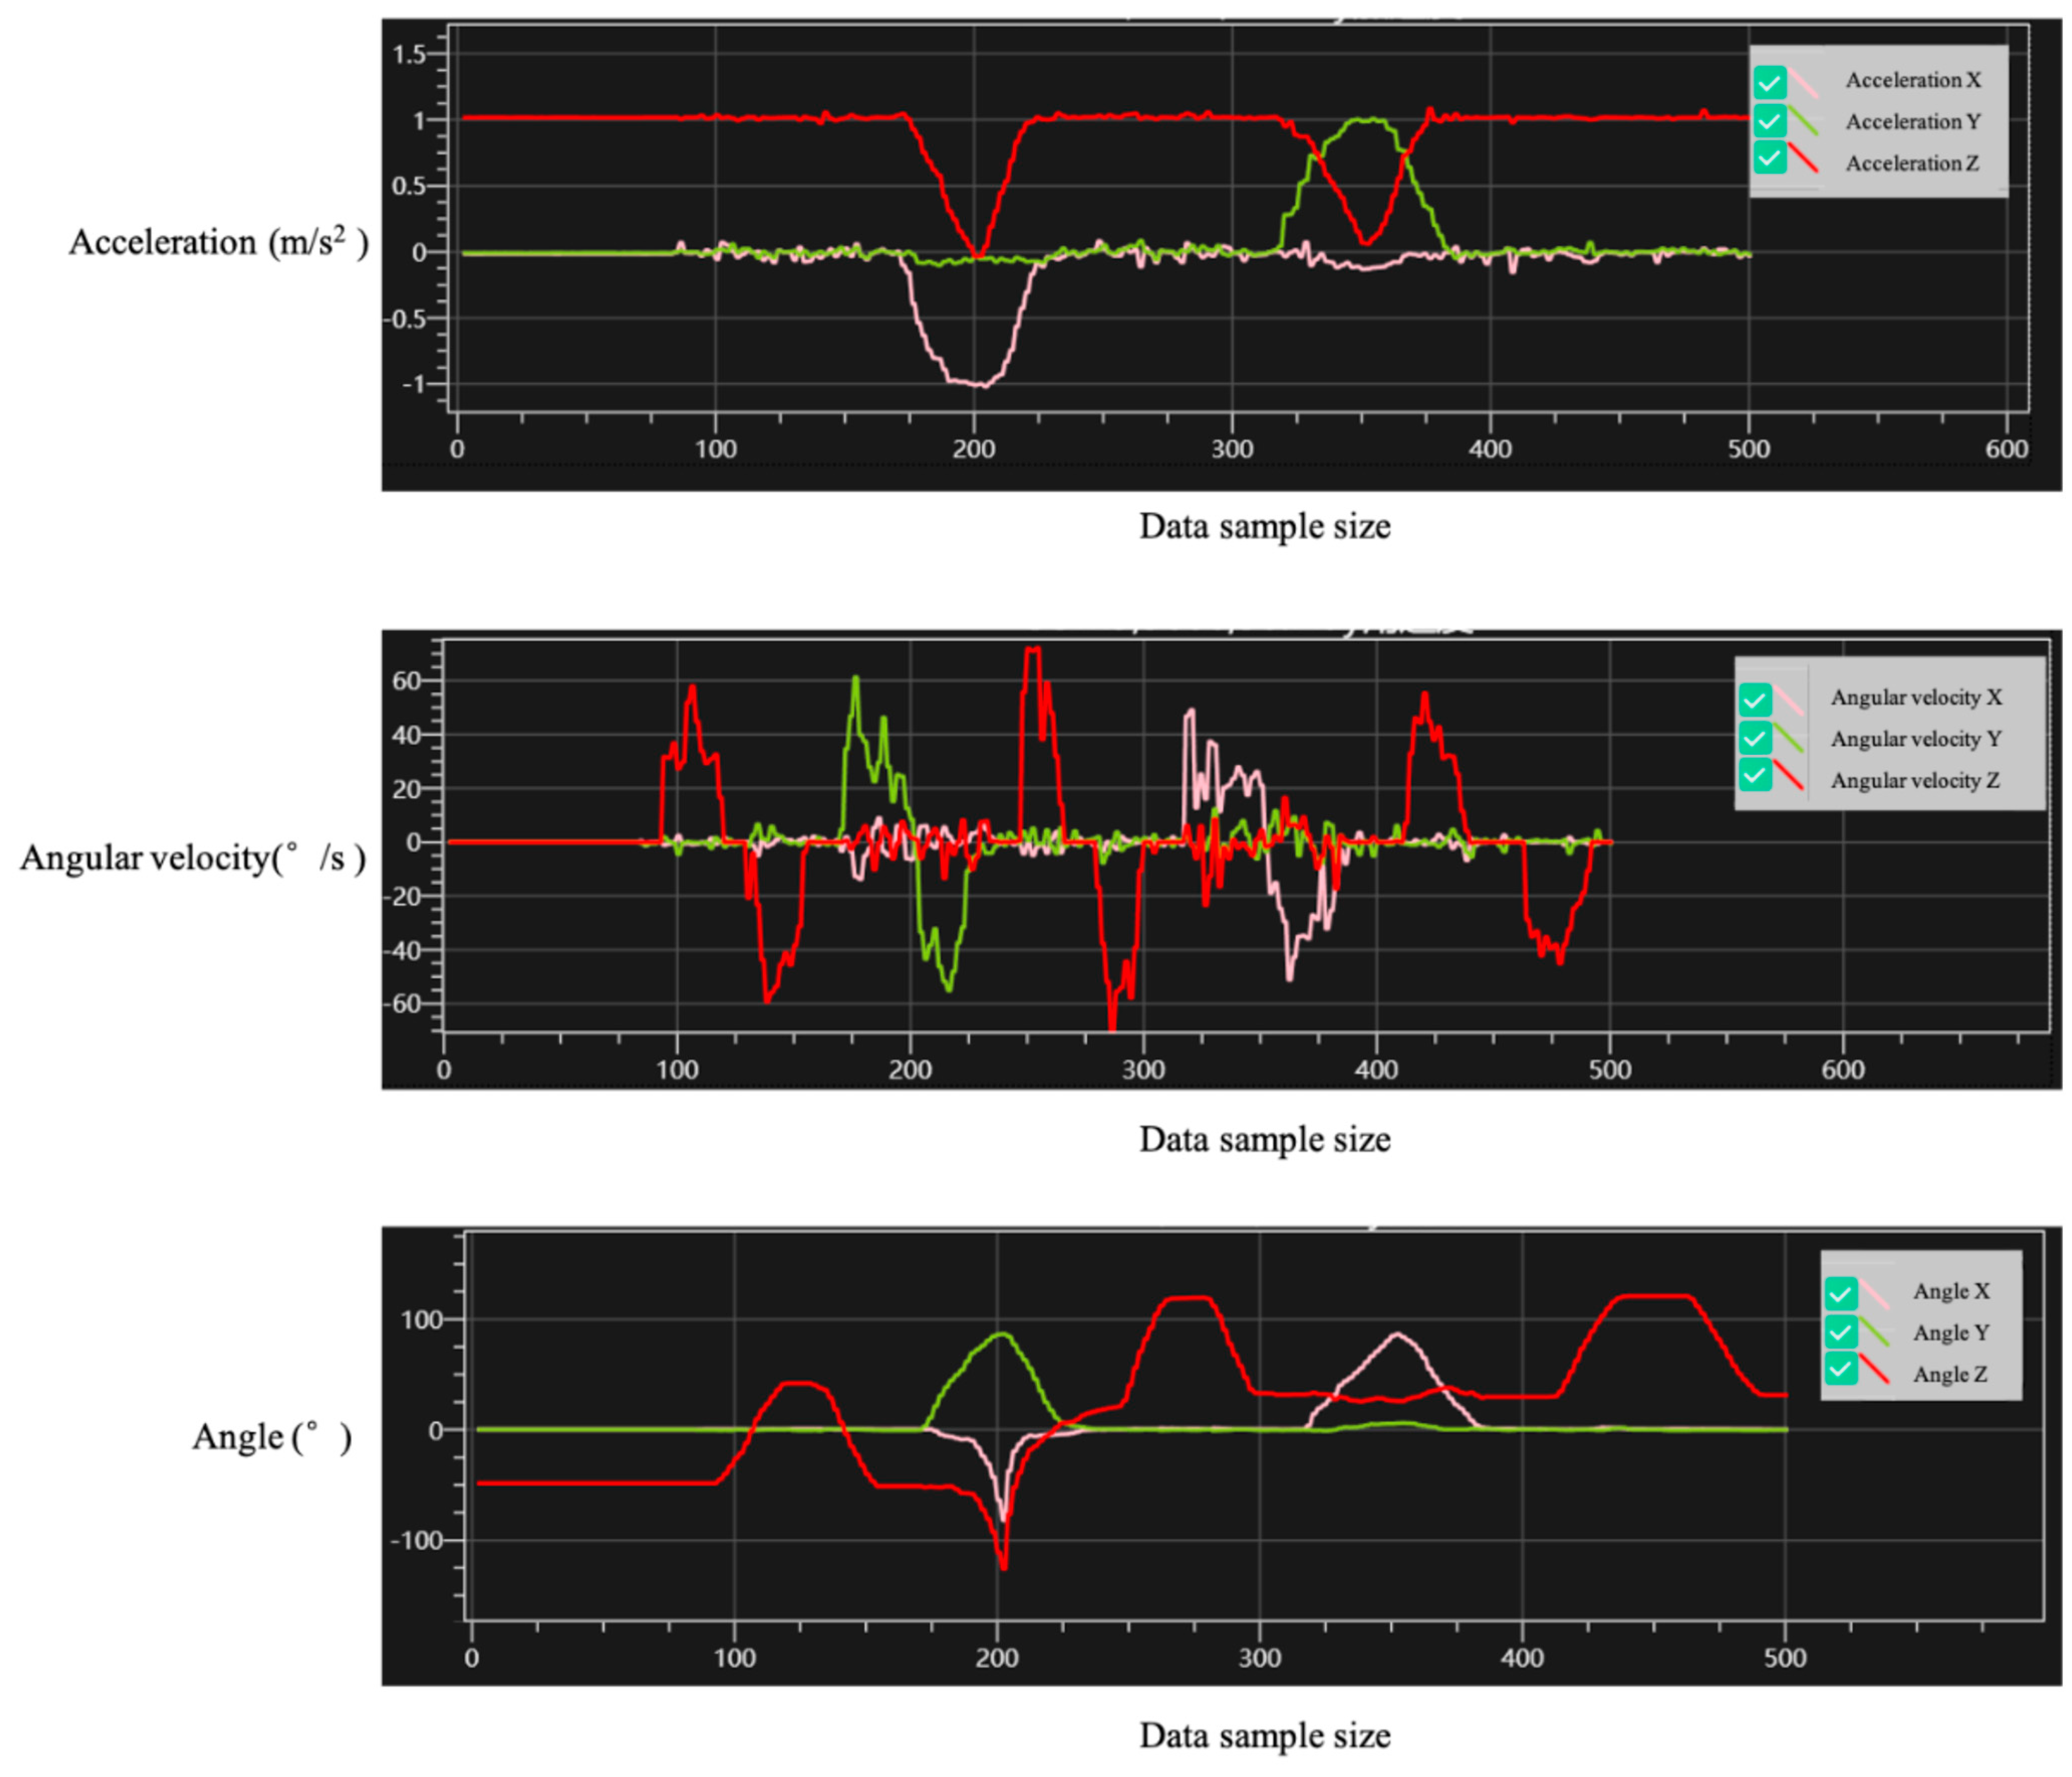
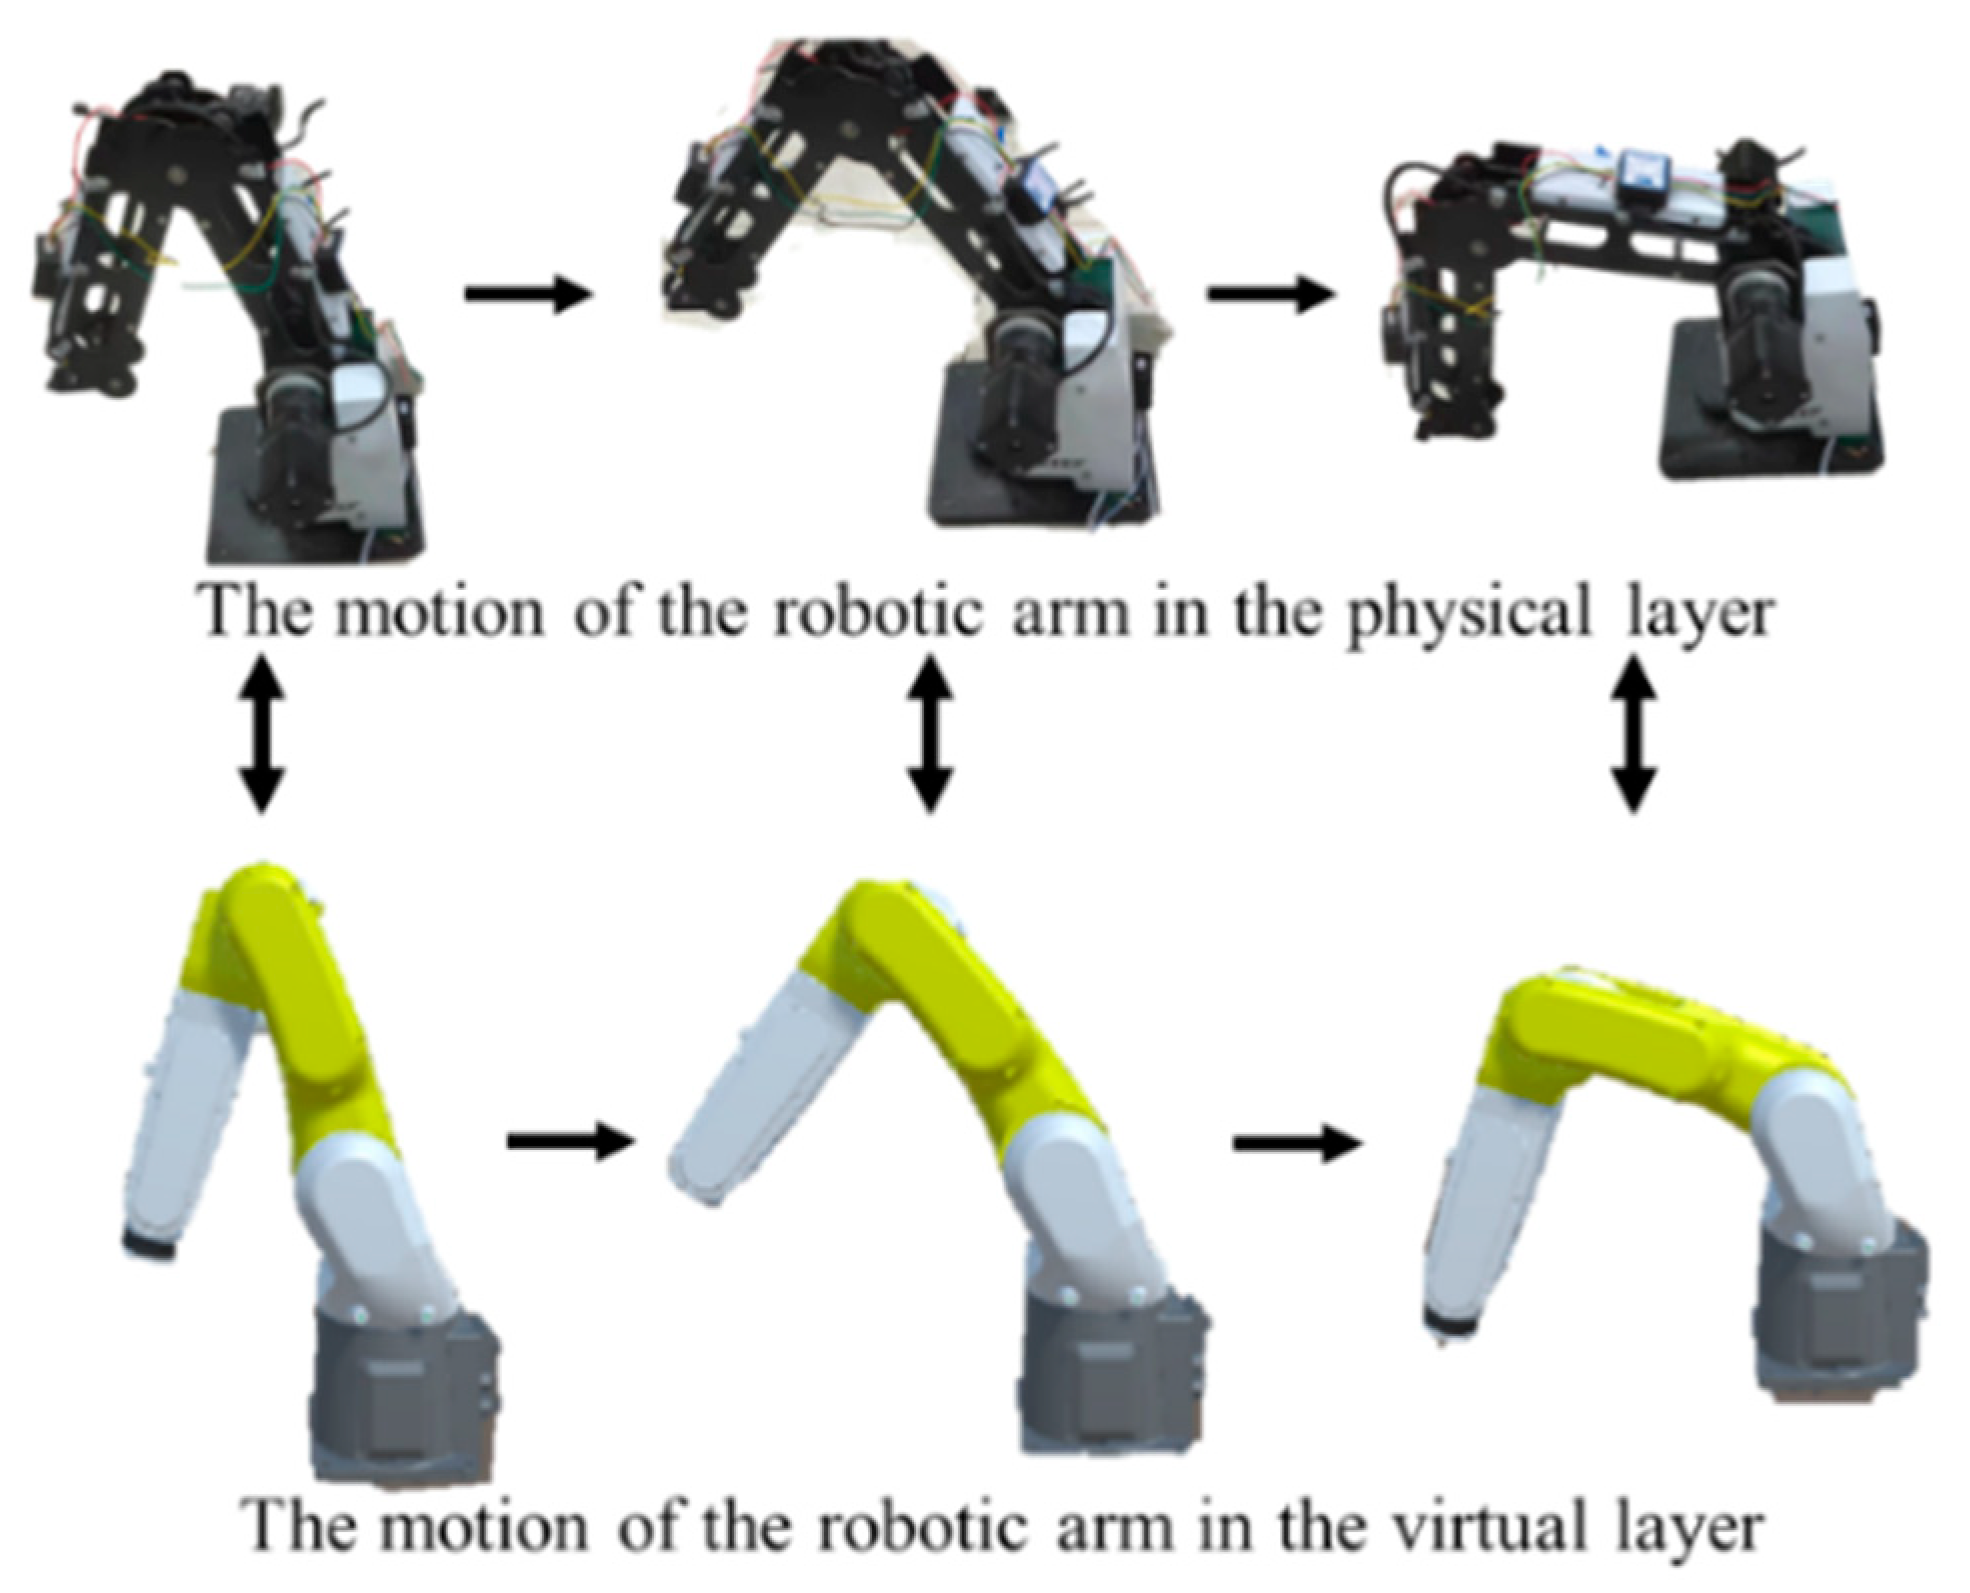
2.2.1. Physical Layer

The production site’s physical layer is the cornerstone of the digital twin system, rendering a faithful representation of the actual manufacturing process for solid-wood-panel processing. This layer includes solid-wood panels; production; and transportation equipment such as industrial robots, storage equipment, sensors, automated guided vehicles (AGVs), and the encompassing production environment. Industrial robots are integral to the operational dynamics, adeptly handling tasks like inspection, assembly, and material transfer through meticulously strategized route mapping.
Operational data collected from sensors, along with equipment metrics, form the fundamental data set that informs the development and refinement of the virtual layer. The interplay between the physical and virtual layers facilitates the smooth carrying out of production tasks. It enables the digital twin system to accurately replicate and align with the processes within the solid-wood-panel manufacturing workflow, contributing to increased efficiency and optimization.

2.2.2. Virtual Layer

In the digital twin system, the virtual layer is a paramount component, primarily composed of virtual entities. It is a real-time representation of the physical entities (PEs) [16], encapsulating their static and dynamic attributes. With an established connection [17], the virtual layer remains synchronized with the physical layer. It incorporates the integral components of the solid-wood-panel processing system in addition to its inherent production logic.
This production logic entails the geometric characteristics, dimensions, compositions, colors, and primary specifications of varied equipment types. It includes aspects such as the spatial configuration of each piece of equipment, the installation of industrial robots, and the hierarchical organization of the production equipment.
The digital twin model of solid-wood-panel processing can be divided into digital twin models of the production equipment, transportation equipment, and environment [18].
D = D 1 D 2 D 3
In Equation (2), D is the digital twin model of the solid-wood-panel processing, with D1, D2, and D3 indicating the production equipment, transportation equipment, and environment, respectively.
D1 requires a geometric model and precise coordinates to mirror the physical counterpart [19]; the behavior criterion is established as
D 1 = { A 1 , L 1 }
Here, A1 is the geometric model of the production equipment and L1 is the precise positioning of the production equipment.
D2 requires a geometric representation of the equipment, along with its accurate positioning and kinematic posture [20]. The behavior criterion is set forth as follows:
D 2 = { A 2 , L 2 , G }
A2 is the geometric model of the transport device, L2 is the precise positioning of the transport device, and G is the attitude toward the device.
D3 necessitates the inclusion of a geometric model of the environment, complemented by additional factors such as temperature and humidity [21]. Hence, its behavioral criterion is articulated as follows:
D 3 = { A 3 , E }
where A3 is the geometric model of the environment and E represents the other required data.
Establishing an accurate virtual layer is necessary for a digital twin system in solid-wood-panel processing. This layer serves as a mirror representation of the operational state of the connected physical layer. To ensure comprehensive alignment, the geometric model of the virtual layer must synchronize with the physical layer’s specifications.
The geometric model of the virtual layer encompasses information on the shape, dimensions, color, placement, and logical interconnections of machinery involved in solid-wood-panel processing, including manufacturing and transportation apparatus. To enhance the resemblance of this virtual model to the physical layer objects, 3dsMax and SolidWorks were employed for generating equipment models. These models were subsequently imported into Unity3D for visualization and rendering.
Based on the detailed classification of the digital twin model for solid-wood-panel processing and the defined behavioral criteria, creating the virtual layer part of the complete digital twin model for solid-wood-panel processing can be devised.

2.2.3. Transport Layer

The transportation layer is a bridge between the physical and virtual realms, enabling data flow. The digital twin’s transportation operation utilizes a structured, layered architecture, with each distinct layer serving integrated roles. This architecture includes a sensor, microcontroller, and a combined gateway and database layer, all orchestrated for efficient data transfer.
The sensor layer collects real-time data via various devices, such as angle sensors, LINKTRACK ultra-wideband (UWB) positioning systems, and environmental monitors that record metrics like temperature and humidity. Accurate data collection from these sensors is crucial, feeding into the advanced processing layers.
The microcontroller layer is a hub for various transmission protocols, handling data and directing it to the gateway and database infrastructure. Utilizing the Open Platform Communications Unified Architecture (OPC UA) Remote Terminal Unit (RTU) protocol boosts data transfer efficiency.
The conjoined gateway and database layers are for the continuity of data flow, allowing real-time data to be promptly uploaded into a MySQL database for swift detection and analysis. In coordination with the microcontroller, the gateway implements commands via the OPC UA-RTU protocol, enabling adequate data access and retrieval.
Figure 8 illustrates the detailed interplay within this four-layer structure, highlighting the systematic data management integral to the digital twin system.
The Unity3D software integrates with MySQL database through the digital twin virtual layer interface. This proficient integration allows for the dynamic visualization of the data stored within the digital twin virtual layer, thus enabling real-time monitoring of the system. The system’s architecture epitomizes an efficient and methodical approach to data collection, analysis, and visualization, meticulously crafted to meet the demands of solid-wood-panel manufacturing.
Commands are dispatched through the control interface, activating the necessary sensors for data acquisition, which is then relayed to the microcontroller’s internal registers via 485 communications. Employing the OPC UA protocol, the gateway forges a communication link with the microcontroller to access specific commands and retrieve the data stored within the internal registers. Subsequently, the microcontroller channels the acquired data to the MySQL database through the gateway, enabling data storage and management functionalities. Establishing this link allows the virtual layer to interact with the MySQL database and process the data accordingly. Figure 8 illustrates the comprehensive architecture of the virtual layer.
The architecture of the system’s transport layer encompasses sensor, microcontroller, gateway, and database components. Data are classified into static and dynamic types; static data involve parameters tied to machinery, robotic arms, and AGVs, collected via serial communication, whereas dynamic data, such as position and operational status, are procured through UWB positioning tags and communication interfaces like OPC UA. These data are then processed by the microcontroller, transferred to the gateway, and ultimately stored within the MySQL database for subsequent visualization.
The transport layer’s architecture is designed to handle the gathering, transmitting, and presenting of various sensor data types, offering users a suite of real-time monitoring and visualization capabilities.
The integration of positioning ranging sensors is invaluable for accurately positioning AGVs and other horizontally mobile processing equipment. After thoroughly assessing various positioning techniques, a UWB positioning ranging sensor was selected for this study. Table 1 contrasts the merits and demerits of these different positioning techniques.
The UWB positioning system can operate across zero-, one-, two-, and three-dimensional spaces, with the ability to precisely identify and determine objects’ X–Y coordinates in a two-dimensional space. The system effectively pinpoints the exact location of AGVs and other horizontal movement devices. Figure 9a demonstrates the two-dimensional positioning within the solid-wood-panel-processing system context. Positioning anchors are located at the four corners of the physical layer, designated as points A0, A1, A2, and A3. AGVs, equipped with positioning tags, communicate with the positioning base station through UWB pulse signals, which collect these data and forward them to a positioning server. An algorithm then processes these data to calculate the accurate coordinates of the positioning tags, facilitating the tracking of device movement via continuous data transmission.
The base station of the UWB positioning system was interfaced with the positioning server of the solid-wood-panel-processing system through an Ethernet connection. This server was integrated with specialized software that utilized a trilateration technique to ascertain the locations. Figure 9b depicts a schematic that illustrates this trilateration method, visually explaining the location determination process using three reference points.
The coordinates of the three reference nodes A, B, and C are (xa, ya), (xb, yb), and (xc, yc), respectively, and the distances to the positioned nodes O are da, db, and dc, respectively. Three circles were determined: A, B, and C, with radii of da, db, and dc, respectively. The intersection point O(x, y) of the three circles is the position of the established points [22]. Thus, we obtain Equation (6).
( x x a ) 2 + ( y y a ) 2 = d a ( x x b ) 2 + ( y y b ) 2 = d b ( x x c ) 2 + ( y y c ) 2 = d c
By resolving the mentioned equation, one can accurately derive the coordinates of the position point O as follows [22]:
x y = 2 ( x a x c ) 2 ( y a y c ) 2 ( x b x c ) 2 ( y b y c ) 1 x a 2 x c 2 + y a 2 y c 2 + d c 2 d a 2 x b 2 x c 2 + y b 2 y c 2 + d c 2 d b 2
In solid-wood-panel processing production, the production elements that require the placement of UWB positioning tags include AGVs, stacker robots, and the bases of industrial robots. Their specific deployment is illustrated in Figure 10. Figure 10a illustrates the installation of UWB tags on AGVs, and Figure 10b shows the placement of UWB tags on the bases of industrial robots [22]. A calibration algorithm based on established methods was implemented to mitigate sensor bias in the UWB positioning and ranging sensors [23], which proactively calibrates the sensors by correcting for known biases before initiating the data collection cycle.
This study leveraged WT901C-485 nine-axis angle sensors to precisely determine the orientation of industrial robots, capturing essential variables for position definition. These sensors monitor rotational operations, feeding the data into a system where it was refined into angular metrics showcased on a virtual interface, facilitating accurate robot pose acquisition. Figure 11a shows the sensor mounted on the base, tracking its rotational angle in real time. Figure 11b displays a nine-axis sensor on the industrial robot’s arm. For the nine-axis attitude sensors, an error compensation protocol was employed to enhance measurement precision [24]. This included adjusting sensor readings by considering environmental influences and inherent sensor distortions. Systematic errors identified during this correlation process were rectified within the sensor’s firmware, ensuring that the angular data relayed from the robot’s critical joints were accurate and reliable.
By incorporating UWB positioning and OPC UA protocols, the transport layer of this system significantly improved the accuracy of equipment operational state assessments. Unity3D was utilized for data visualization streamlines the workflow, thus enhancing efficiency in solid-wood-panel processing with reduced waste and better resource utilization. The integration of digital twin technology via the transport layer marks a significant innovation in manufacturing, boosting productivity and advancing resource management.

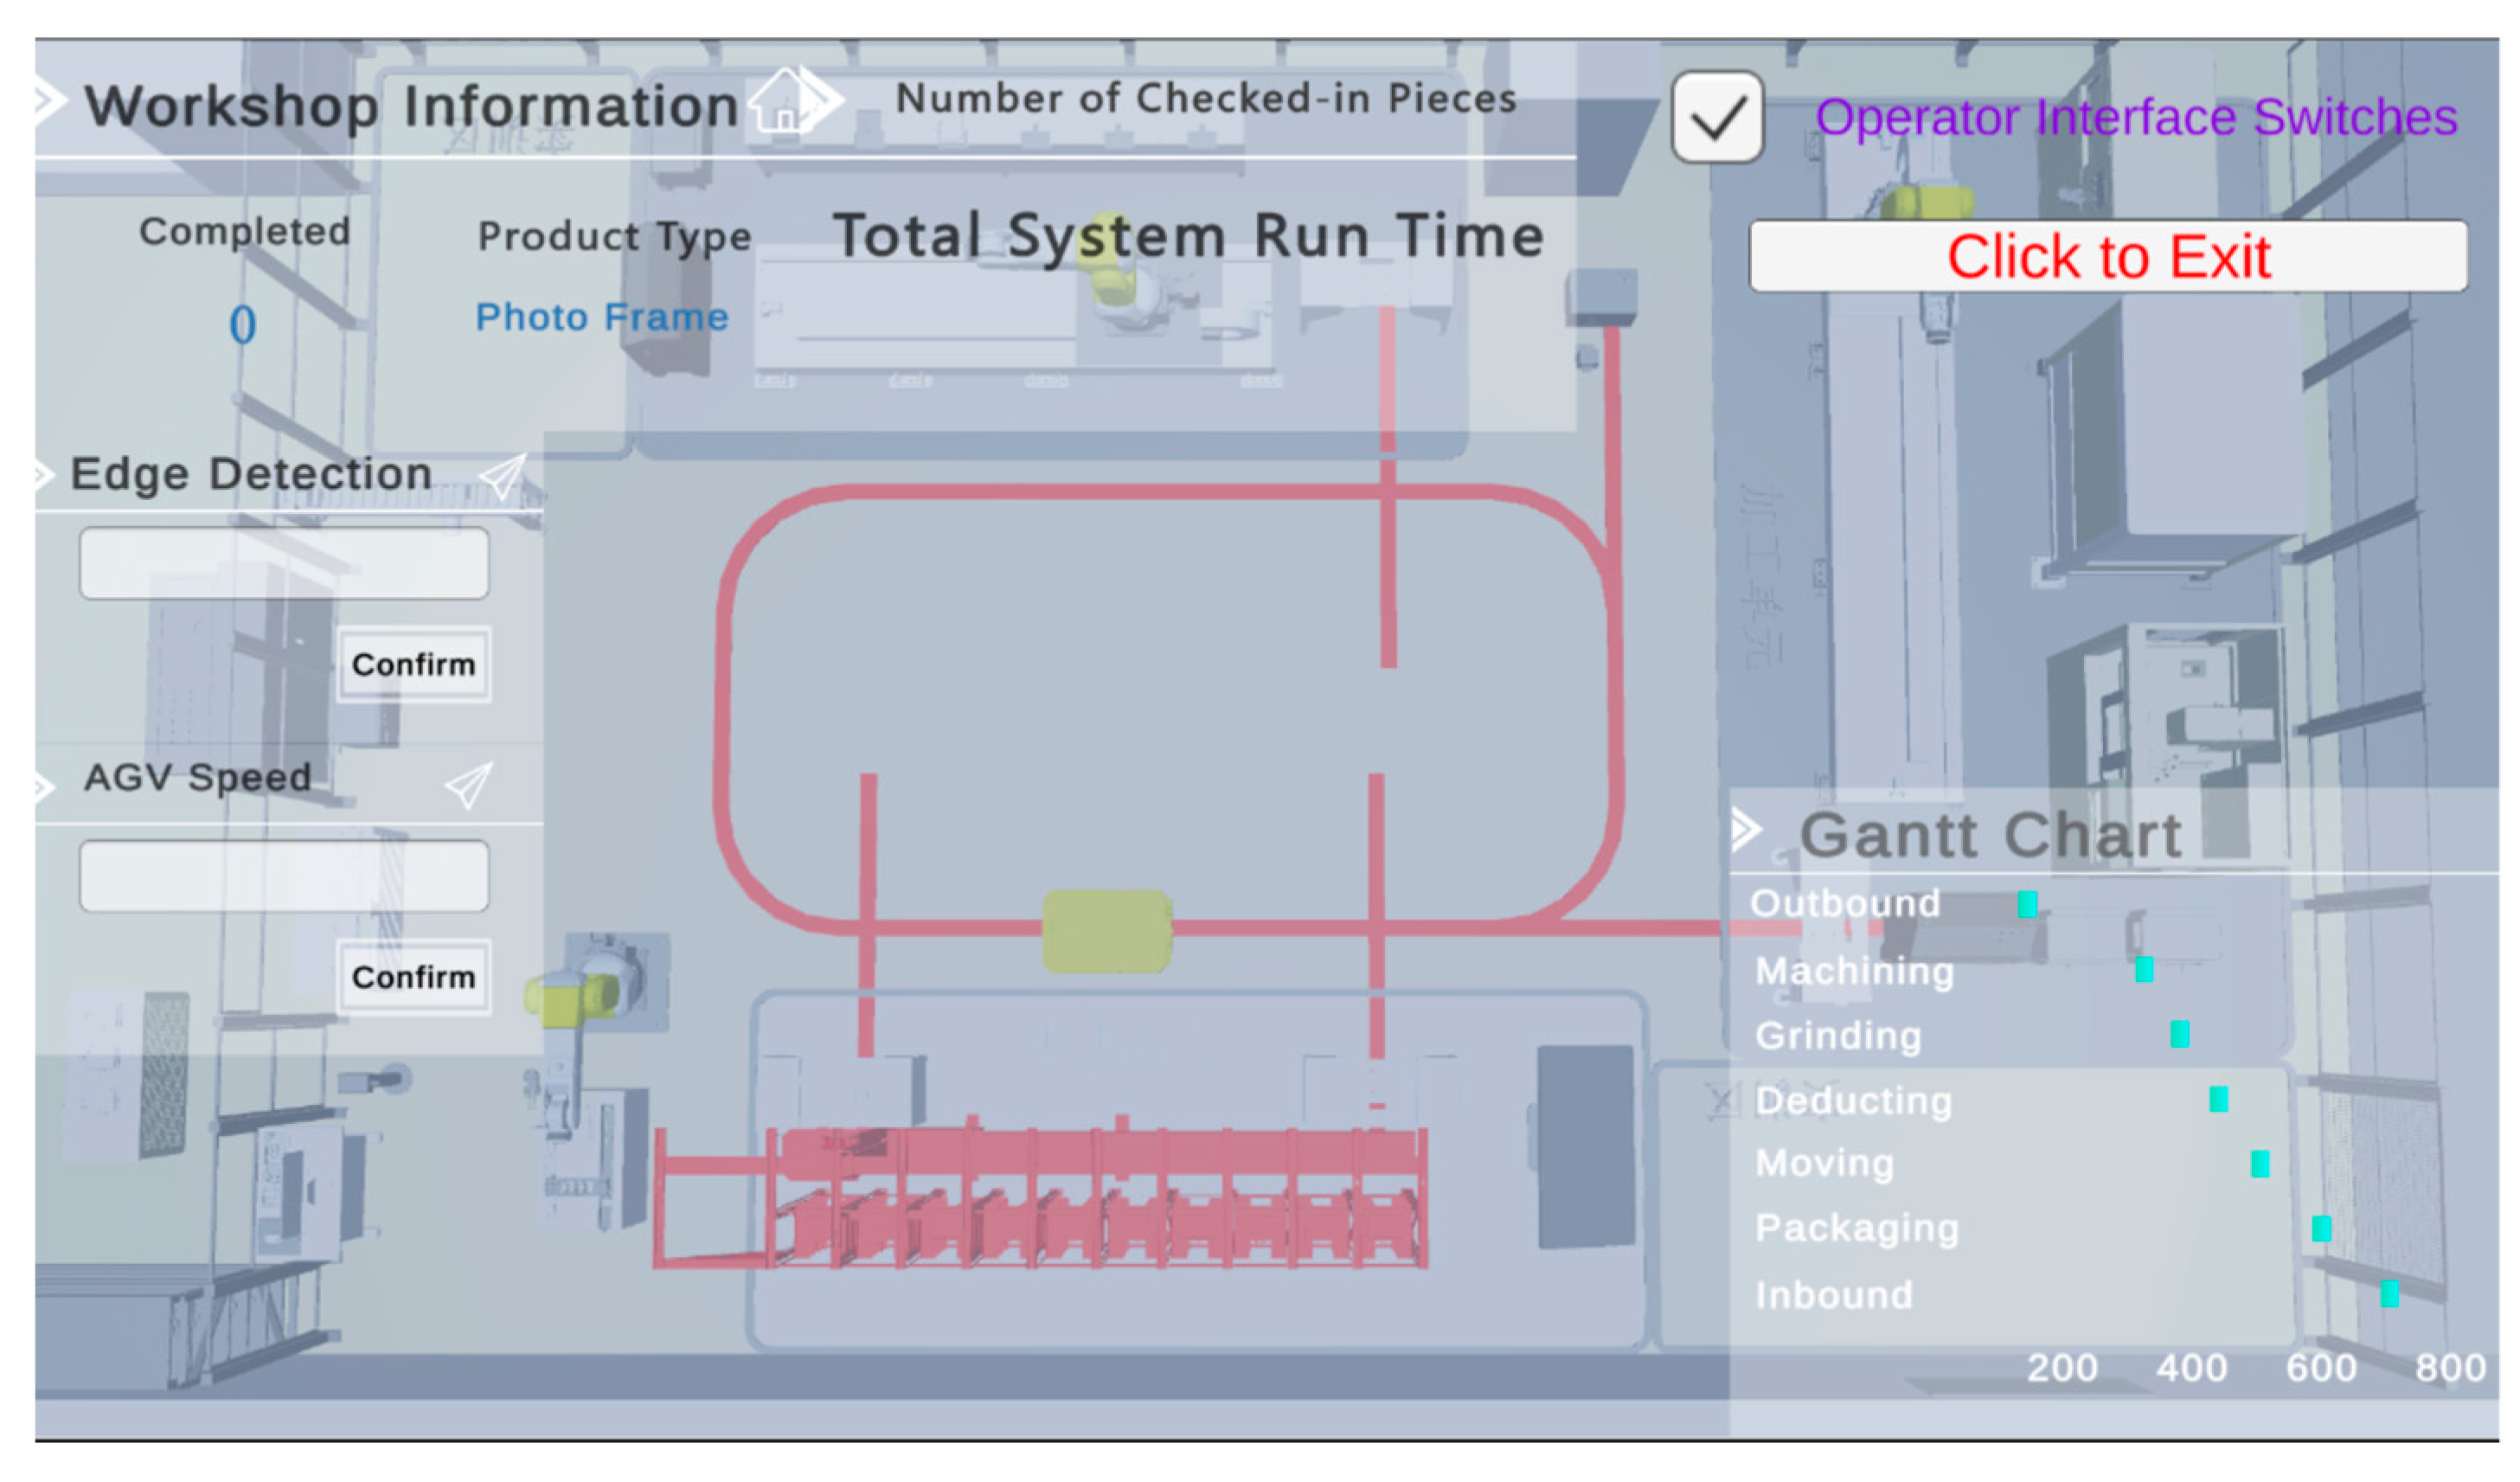
2.2.4. Application Layer

The application layer provides the simulation functionality, scheduling various production parameters within a 3D visual interface and displaying the outcomes after scheduling. Insights from the simulation can guide adjustments to the production elements within the solid-wood-panel-processing system, aiding in production efficiency.
This layer is the primary interface for user interaction, offering services such as 3D real-time mapping and monitoring, operational status recreation, simulation, and scheduling. The 3D mapping feature enables users to observe the operational status of the physical production systems within a three-dimensional framework. It captures every production element, noting parameters like position and speed. Attributes such as speed, acceleration, angle, and torque along each axis of the industrial robot are also effectively gauged.
Three-dimensional real-time mapping provides a more intuitive representation of system data than conventional monitoring methods, allowing earlier identification of potential issues and enhancing the production environment’s safety. Real-time monitoring also facilitates root cause analysis of unexpected conditions, enabling resolution using detailed data from the digital twin. In production parameters, the application layer offers simulation and scheduling capabilities within the 3D visualization interface, showing production outcomes and permitting system adjustments based on simulation outcomes to improve production processes. The overall technical route is illustrated in Figure 12.

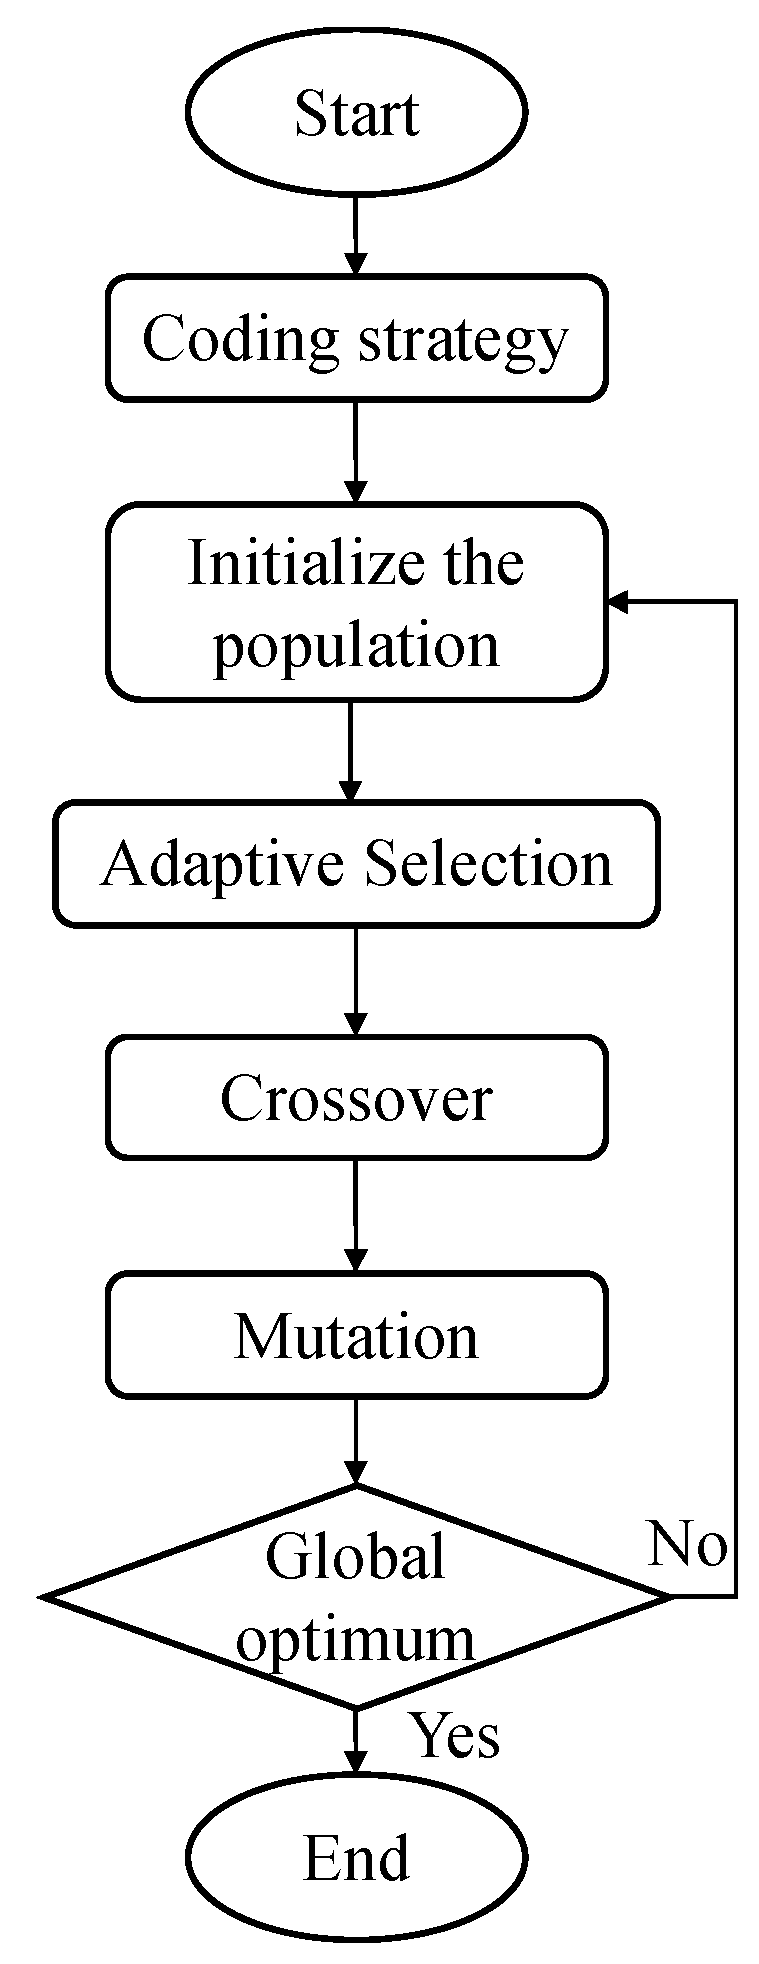
2.3. Dynamic Selection Adaptive Genetic Algorithm (DSAGA)

The scheduling challenge in solid-wood-panel processing is identified as the flexible job-shop scheduling problem (FJSP) [25], wherein operations are not limited to preassigned processing equipment but can select from various available options, introducing a degree of flexibility in machining processes.
This study introduces the dynamic selection adaptive genetic algorithm (DSAGA) as an optimization solution to address FJSP. The algorithm, drawing from natural selection and genetics principles, iteratively evolves to seek an optimal scheduling solution. DSAGA is adept at addressing complex optimization tasks, such as FJSP and the traveling salesman problem, which are categorized as NP-hard due to their intricate combinatorial properties. These tasks entail organizing manufacturing processes, allocating specific workpieces to respective operations, and selecting suitable machines for each machining task. Figure 13 presents the flow of the DSAGA in a detailed flowchart.
Three enhancements contribute to DSAGA. First, integrating a dynamic selection strategy improves the algorithm’s adaptability by adjusting selection intensity based on the problem’s specific needs and the current population’s fitness level. Second, implementing the partially mapped crossover (PMX) technique during the crossover phase facilitates a more effective recombination of genetic traits [26]. Third, introducing an innovative mutation operation aids in expanding the pool of potential solutions, thus reducing the risk of premature convergence [27]. Together, these strategic improvements boost the algorithm’s searching efficiency and enhance the quality of generated solutions.
The subsequent analysis will detail DSAGA through its algorithmic flowchart, methodically examining the five components: coding strategy and initialization of the population, objective function, adaptive selection operation, crossover operation, and mutation operation.

2.3.1. Coding Strategy and Initialize the Population

The coding strategy plays a role in defining the representation of solutions within a chromosome or genome for computational analysis [28]. In genetic algorithms, there are several approaches to coding, such as decimal, integer, and floating-point coding, each offering a different method of encapsulating problem solutions for algorithmic processing. Decimal coding is selected in DSAGA due to its direct representation, simplifying the manipulation and interpretation of solutions, which is suitable for solid-wood-panel processing [29]. Here, a stochastic sequence w 1 w 2 w N is utilized as the chromosomal representation, where the subscript of the stochastic sequence satisfies [30]
0 w i 1   ( i = 1,2 , , N )
Every random sequence uniquely represents an individual in the population sequentially. The initial population comprises a collection of individuals generated randomly at the commencement of the process. Each individual signifies a potential solution. A modified circular algorithm is utilized to establish the initial population, taking into account the initial circle, designated as C, which is formed randomly, allowing for a broad exploration of the solution space right from the start [31].
C = π 1 π u 1 π u π u + 1 π v 1 π v π v + 1 π N
Swap the order between u and v resulting in a new solution [32].
π 1 π u 1 π v π v 1 π u + 1 π u π v + 1 π N
Let
f = d π u 1 π v + d π u π v + 1 d π u 1 π u + d π v π v + 1
if Δf < 0, replace the old solution with the new one and continue this process until no further modifications can be made, thus obtaining a relatively good feasible solution. Continue this approach until M feasible solutions are generated and convert these M solutions into their corresponding chromosomal encodings.

2.3.2. Objective Function

The objective function, serving as a mathematical evaluative measure in genetic algorithms, assesses the fitness of a solution or an individual [33]. For FJSP, the objective function is identified as the maximum completion time, implying that the goal is to minimize this value for optimal scheduling efficiency. Equation (12) can provides a direct way to evaluate the productivity of the manufacturing process [34].
m i n T M = m i n ( m a x ( T i , j ) )
Here, Ti,j denotes the completion time of the ith workpiece on the jth machine, representing the required completion time for machine Mi,j. TM signifies the maximum completion time among all workpieces. The objective of optimizing the objective function is to reduce the total duration of completion for all processes [34].

2.3.3. Adaptive Selection Operation

This study introduces a genetic algorithm that incorporates an evolutionary-state dynamic selection strategy [35]. This method dynamically adjusts the selection strategy by real-time monitoring of the population’s genetic diversity and fitness indicators [36]. Detailed descriptions of the mathematical models and decision points can be found in the following sections.
The population diversity H(t) is initially defined as a measure of genetic diversity, comparable to the Shannon diversity index in ecology [37]:
H t = i = 1 n p i l o g p i
where pi represents the frequency of the ith allele within the population [37]. This metric assists in the monitoring of genetic diversity within the population each generation.
Furthermore, the average fitness A(t) and the best fitness B(t) are calculated to evaluate the performance of the overall population and the optimal individuals. These metrics are defined by the following formulas [27]:
A t = 1 N i = 1 N f x i
B t = m a x f x i 1 i N
where N denotes the size of the population and f(xi) is the fitness function of the individual [27].
Based on the dynamic thresholds CH, CA, and CB, conditions for transitioning between selection methods can be established.
C H :   H t < H
C A :   A t A t 1 A t 1 < A
C B :   B t B t 1 B t 1 < B
Here, ΔH, ΔA, and ΔB are sensitivity thresholds for a decrease in diversity, slow growth in average fitness, and best fitness, respectively [38]. The selection function S(t), based on the aforementioned conditions, controls when and how to transition between different selection strategies to enhance the search capacity of the genetic algorithm and prevent premature convergence. The strategies employed include and transition between roulette wheel selection [27], tournament selection [39], and elite strategy [36].
S t = r o u l e t t e   w h e e l   s e l e c t i o n , i f   C H   i s   T r u e t o u r n a m e n t   s e l e c t i o n , i f   C A   a n d   C B   a r e   T r u e e l i t i s m   p r e s e r v a t i o n   m e t h o d s ,   o t h e r w i s e

2.3.4. Crossover Operation

The crossover operation, a fundamental element of genetic algorithms, mirrors the genetic exchange found in biological evolution [40]. Its principal function is to utilize gene selection from multiple parent individuals to produce offspring with unique combinations of traits, potentially enhancing their characteristics by inheriting the best attributes of their parents.
Among the crossover techniques available in genetic algorithms, single-point crossover, multi-point crossover, uniform crossover [41], and PMX (partially mapped crossover) [42] operation have gained prominence. Employing a single-point crossover technique requires modifications to the algorithm due to its potential effects [43]. In single-point crossover, a randomly selected position divides two parent chromosomes into two segments, and offspring are generated by exchanging fragments from the parents. This approach could disrupt advantageous gene combinations on the chromosomes. Within the scheduling problems, this could lead the algorithm to local optima, resulting in premature convergence [44]. On the other hand, multi-point crossover is a genetic procedure that divides the chromosome into several segments by randomly choosing multiple sites, thereby facilitating information exchange between these sections. This process also helps leave some initial chromosome information intact without altering it [45].
Considering uniform crossover may lead to a disregard for the local structure of the parent chromosome, ensuing potential disruption to the overall structure, which could make it challenging to retain specific universal features of the parent chromosome. This study identified the PMX operation as the preferred crossover method, owing to its broad adoption in genetic algorithms. The PMX procedure functions by choosing a crossover point between two parent individuals and then initiating gene segment exchanges, ensuring the preservation of certain parent information while also enabling new combinations in the offspring.
The crossover operation entails a random selection of the crossover point, followed by dividing the gene fragments of both parents into two sections. Subsequently, gene portions located beyond the crossover point from one parent are transferred to an offspring. The procedure also includes identifying unique genes from the second parent that retain their original sequence and incorporating them into the offspring’s genome. Finally, gene segments anterior to the crossover point are completed, ensuring that the offspring’s genetic sequence is of uniform length.
In solving FJSP with the highest degree of efficacy, setting the crossover rate as close to 1 as feasible is crucial [46], ensuring comprehensive population evolution. Set the crossover rate, denoted as [47]
p c = 0.8
This rate, commonly applied in genetic algorithm implementations, facilitates hastening convergence to the optimum solution while preserving enough genetic diversity to prevent premature convergence, thereby contributing to the algorithm’s enhanced performance. This aspect is particularly relevant in applications like FJSP, where the diffusion of advantageous traits from parent chromosomes throughout the population is used to identify the best possible solution.

2.3.5. Mutation Operation

The mutation operation emulates the occurrence of genetic mutation in the context of biological evolution [48]. It stochastically alters the gene values within an individual’s chromosome based on a specific probability. The mutation operation introduces novel combinations of genes, enhancing the variety of the search space and preventing the occurrence of locally optimal solutions.
For FJSP, given the relatively lower propensity for variability in the inheritance process, setting the mutation rate as [49,50]
p m = 0.3
is advised, a value derived from copious experimental validation, which ideally suits the problem’s nature.
The decision to set a mutation rate at 0.3 strikes a balance between the need for introducing new genetic variations and preserving effective solutions within the genetic algorithm framework. An increase in the mutation rate elevates the likelihood of incorporating new genetic information into the population, fostering diversity and supporting optimization efforts. Nevertheless, an excessively high mutation rate might destabilize successful configurations and decelerate the convergence process. A mutation rate of 0.3 is thus considered optimal as it ensures adequate diversity without impacting the performance of well-adapted individuals [46]. The mutation occurs when a randomly generated number is less than or equal to the probability. This procedure initiates with the newly created entity undergoing mutation, followed by an evaluation of its fitness. The process entails selecting a specific workpiece operation for mutation at random, affecting the overall procedure. A machine for the selected operation is then randomly chosen from the available pool, with subsequent adjustments to machine allocations and process durations for the affected individual. This iterative mechanism repeats until mutation has been applied across all individuals.
In summary, DSAGA signifies a progression in digital twin technology for solid-wood-panel manufacturing, differentiated by its adaptive selection strategy. This approach enables DSAGA to adjust selection pressure based on the algorithm’s development stage, offering flexibility that is absent in GA. This adaptability enhances exploration within the search space and the quality of solutions generated. Furthermore, DSAGA, incorporating PMX operation and a calculated mutation strategy, effectively merges advantageous traits from multiple parents and introduces new genetic variations. By maintaining sufficient genetic diversity and preventing early convergence, these mechanisms collectively improve the algorithm’s capacity to explore the search space, elevate solution quality, and sustain population diversity. Consequently, DSAGA emerges as a more effective and reliable approach for addressing complex manufacturing challenges in solid-wood-panel production, ensuring optimal operational performance and efficiency.

3. Results

3.1. Results of Digital Twin Model Construction

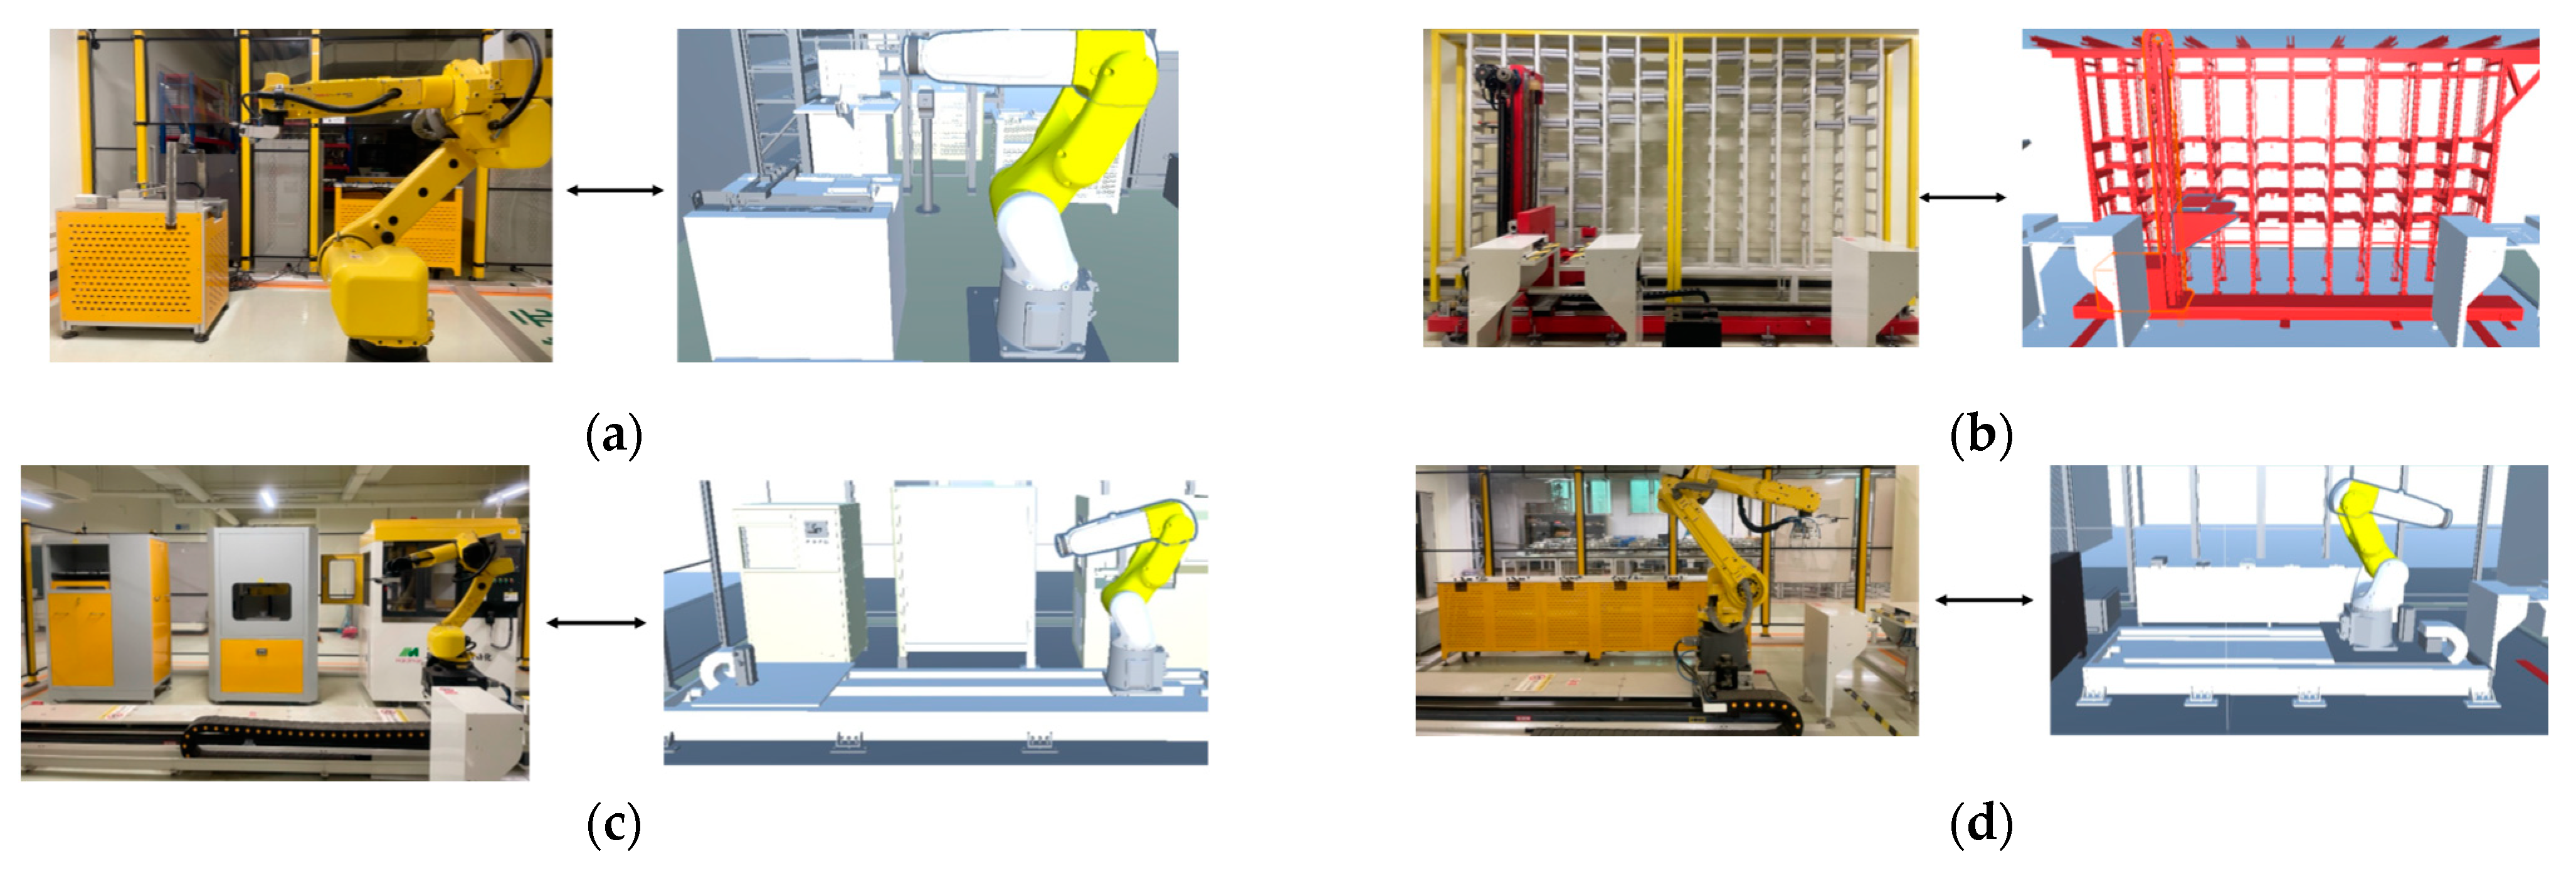
3.1.1. Construction Results of the Virtual and Transmission Layers

During the creation of the digital twin system, Unity3D was used to adjust the colors of the virtual layer geometric model, aligning it with the physical layer. A comprehensive color optimization process was also applied to the entire model to enhance the visual clarity of the virtual layer. Figure 14 shows a comparison of color changes before and after this optimization.
The positioning tags communicate with the positioning base station through UWB pulse signals. After collecting data from the tags, the base station forwards it to the positioning server. An algorithm then processes the data to determine the precise coordinates of the positioning tags, enabling the creation of a continuous motion track. The resulting trajectory, reflecting the movement over time, is depicted in Figure 15.
Figure 15 presents the results obtained by the UWB positioning and ranging sensor. Similarly, in acquiring the industrial robot’s posture, the WT901C-485 transmits real-time data through its built-in communication module, facilitating immediate updates and feedback. A supervisory computer controls the overall system and serves as the monitoring center, receiving information from the sensors to acquire real-time posture data. Figure 16 displays a selection of data samples for acceleration, angular velocity, and angle as recorded by the supervisory computer of the WT901C-485.
Figure 16 showcases the collection of acceleration, angular velocity, and angle measurements from WT901C-485 nine-axis sensors during solid-wood-panel processing activities. For acceleration, depicted in separate curves, the yellow line represents acceleration along the X-axis (lateral movements), the green line for acceleration along the Y-axis (forward/backward movements), and the red line for acceleration along the Z-axis (upward/downward movements). Similarly, the angular velocity graph uses yellow, green, and red curves to illustrate rotation rates around the X-axis (roll motion), Y-axis (pitch motion), and Z-axis (yaw motion), respectively. The angle graph further breaks down the orientation data into roll angle X (RollH, RollL) with a yellow curve, pitch angle Y (PitchH, PitchL) in green, and heading angle Z (YawH, YawL) in red, providing a comprehensive view of the robotic arm’s orientation in three-dimensional space. The consistent data collection frequency of 5 hertz for acceleration, angular velocity, and angle, totaling 23,912 samples each, ensures a detailed and accurate representation of the robotic arm’s operational dynamics.
The solid-wood-panel processing production status monitoring data sensing system achieves the collection and transmission of various sensor data, allowing for real-time monitoring. This study conducted preliminary tests on a small mechanical arm model to ensure the smooth operation of the attitude acquisition scheme. Initially, three attitude sensors were placed on the small mechanical arm model’s forearm, middle arm, and upper arm. Each sensor had six variables: Roll angle X (RollH RollL), Pitch angle Y (PitchH PitchL), and Heading angle Z (YawH YawL), capturing the desired rotation posture of the industrial robot. During the data collection, the final data obtained were stored in the microcontroller’s buffer for easy access by the supervisory computer. After computation, the collected data were converted into angular data, resulting in the actual angle data of the industrial robot displayed on the gateway’s virtual page, as shown in Figure 17.

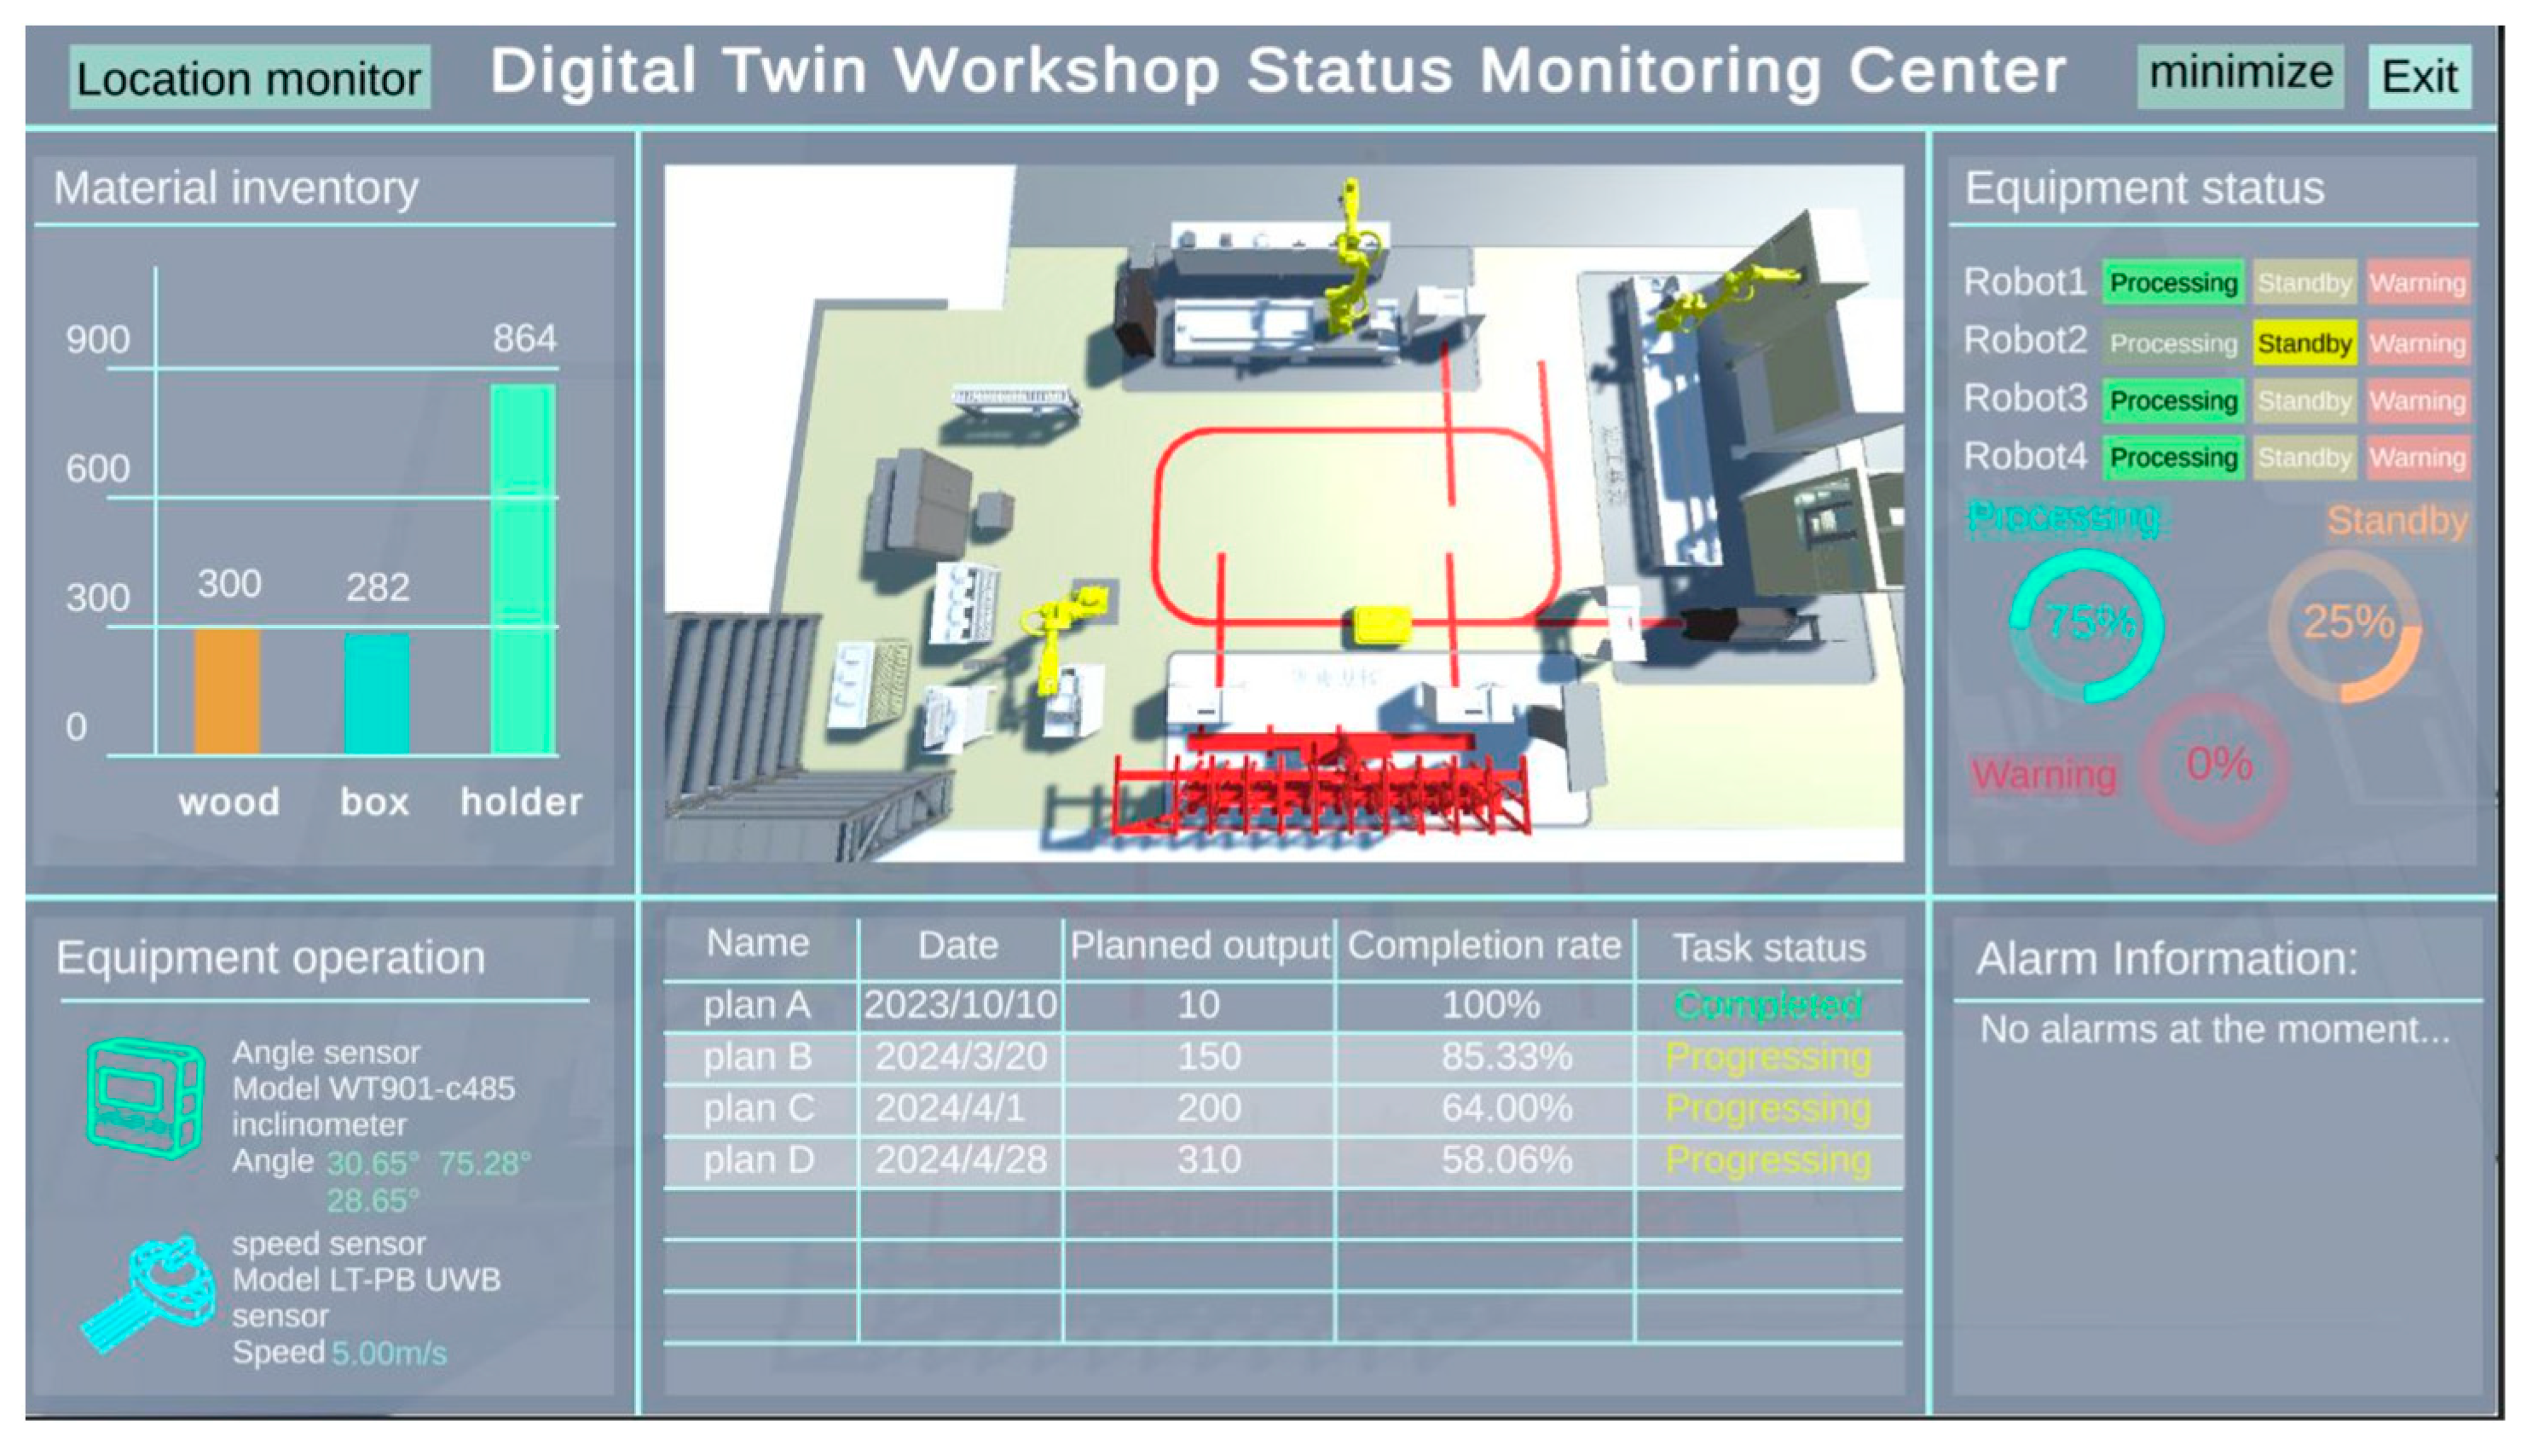
3.1.2. Construction Results of the Application Layer

The application layer for the digital twin model dedicated to solid-wood-panel processing encapsulates two key functionalities: the simulation platform and real-time mapping.
The simulation platform, developed in the Unity3D environment specifically for solid-wood-panel processing (as detailed in Figure 18), adopts a dynamic production Gantt chart. This chart adjusts and reshapes according to the manufacturing process’s variations, ensuring accurate reflection of the physical operations and demonstrating simulation capabilities. Here, users can alter parameters such as AGV speed within defined fields and observe the effects on the production simulation, enabling interactive exploration of the production possibilities.
Shifting to the real-time mapping aspect, this functionality mirrors the physical production line in real time (as illustrated in Figure 19), tracing the operational status of various equipment, monitoring the progress status of tasks, and providing immediate alarm information. This meticulous tracking functionality plays a dual role: maintaining an accurate visualization of the physical layer at the user interface and demonstrating a potent ability for real-time problem detection.
The solid-wood-panel processing production has a real-time status monitoring page for the entire production workshop. Based on the solid-wood-panel processing production status monitoring data sensing system, this interface can reflect the manufacturing state. The mapping effects of the individual processing units are depicted in Figure 20. The virtual-actual mapping of the inspection unit is demonstrated in Figure 20a, while the outbound unit’s virtual-actual mapping is shown in Figure 20b. The mapping for the processing unit is presented in Figure 20c, and the packaging unit’s mapping is displayed in Figure 20d.
By integrating simulation and real-time mapping within a single application layer, the digital twin model offers a comprehensive tool for solid-wood-panel processing that delivers insights and capabilities for real-time monitoring and simulation.

3.2. Application and DSAGA in Solid-Wood-Panel Production

Table 2 outlines the equipment quantity and duration time used across diverse manufacturing activities within the simulation interface. An observation was the consistency of the equipment employed for equivalent operations. This indicates that the time required to complete each operation remained constant, regardless of the specific process. Furthermore, it is crucial to emphasize that each solid wood piece underwent processing in a stipulated order sequentially rather than simultaneously across all steps. This systematic approach highlights the meticulous precision that closely mirrors the solid-wood-panel manufacturing process.
Data on actual production lines were collected through systematic observations and measurements. A methodological approach was employed where each stage of the solid-wood-panel processing line was subjected to ten test runs, and the data were collated. The average duration times for each stage were calculated by systematically observing and measuring multiple iterations. For the outbound unit process, which involves panel preparation and transport to the machining units, the average duration was determined to be approximately 478 s. The machining stage, where primary shaping and cutting occur, showed an average duration of 1196 s across the ten runs. In the grinding phase, focused on panel surface smoothing, an average duration of 966 s was recorded per run. The dedusting stage, which is for removing residual wood particles and ensuring surface finish quality, was observed to have an average duration of 241 s per run. Lastly, the packaging unit, which finalizes the panels for shipment, was completed with an average time of 118 s, indicating a swift closure to the production cycle. By averaging the recorded times across multiple trials, these measurements provide a scientifically substantiated rationale for the time allocations for each production stage.
Simulation experiments within the MATLAB environment have supported the operational efficiency and improved performance of DSAGA. A quantitative model representative of a production line, as illustrated in Table 2, processed ten solid-wood panels to evaluate DSAGA’s utility in manufacturing contexts. The outcomes of these MATLAB simulations are depicted in Figure 21 and Figure 22.
Figure 21 displays the production scheduling Gantt chart, outlining the timeframe for each wood panel to occupy a specific machine. Each wood panel was assigned a unique identification number, and corresponding colors were used consistently throughout the chart to enhance visual differentiation. This Gantt chart facilitates the clear visualization of scheduling, conveying the algorithm’s role in refining the scheduling process and ensuring timely interactions between wood panels and production units.
Figure 22 presents the convergence trends for DSAGA, with the red curve representing the optimal value and the blue curve depicting the average value. The chart illustrates that the maximum completion time for the best solution stabilizes after fifteen iterations, as indicated by the makespan on the vertical axis, leveling out at 5403 s.
Altogether, these figures contribute to a comprehensive analysis of DSAGA’s application in virtual production environments, providing evidence of its effectiveness in optimizing manufacturing schedules.

4. Discussion

The development of the digital twin system underscores the revolutionary impact of digital technology in the solid-wood-panel-processing industry, proposing a path toward achieving intelligent production. The digital twin system integrates physical and virtual layers, provides real-time operational monitoring alongside production process simulation, and offers unprecedented control and transparency. Moreover, the simulation platform, tailored for solid-wood-panel processing, employs a dynamic Gantt chart reflecting the real-time manufacturing process. This interactive tool allows for the alteration of variables such as AGV speed, thereby offering a vivid depiction of the production process and modeling potential outcomes of adjustments in the production parameters. Combined with real-time mapping, this simulation aspect facilitates comprehensive monitoring and control of the operations, rendering the production process transparent and easily manageable.
This system has multiple practical applications. It enhances production efficiency, optimizes resource use, and reduces production costs and energy usage. The system’s real-time monitoring and intelligent scheduling capabilities allow for the immediate detection and resolution of production issues. Optimization strategies can be rapidly implemented to minimize production interruptions, enhancing the manufacturing operations’ reliability and sustainability. Additionally, the convenience of optimizing production procedures and minimizing waste and energy consumption yields a reduction of adverse environmental impacts.
Now shifting focus to DSAGA, this methodology’s superiority over conventional algorithms can be clearly observed. As evidenced in Table 3, DSAGA improves maximum completion time, reducing it to 5403 s, compared to GA, which typically takes 99 min.
The percentage deviation of the maximum completion time was calculated to demonstrate the superiority of the proposed method over the alternative algorithms. To evaluate the performance of DSAGA, Equation (22) was introduced as a measurement criterion [51].
P = T x T 0 T x × 100 %
Here, Tx is the maximum completion time of GA, and T0 is the maximum completion time of DSAGA. With an increase in P, the efficiency of the production line employing the algorithm declines, suggesting a decrease in algorithmic performance. As observed in Table 4, the algorithms demonstrate efficiency, with DSAGA surpassing the traditional version, resulting in an 8.93% enhancement in efficiency.
This study establishes a foundation for intelligent production systems in the solid-wood-processing industry, driving the move towards further digitization and innovation in manufacturing. By integrating digital twin technology with DSAGA, this effort charts a course for transforming and elevating China’s wood-processing industry. This approach aims to boost competitiveness while promoting environmental sustainability.

5. Conclusions

An advanced platform for detailed 3D visualization was crafted. This platform has opened the door for real-time monitoring and process simulations, fostering transparency and comprehensibility. A noteworthy outcome of this study is creating a comprehensive platform that merges real-time monitoring, process simulation, and production scheduling into a singular digital twin system. This blend enables real-time operational state monitoring of the physical layer, predictive optimization, and system alerts, setting a new standard in solid-wood-panel processing. The value of this work rests on three main pillars. Firstly, constructing an intuitive 3D simulation interface provides a robust process visualization and management tool. Secondly, real-time mapping accurately mirrors physical production processes, providing a platform for swift problem detection and resolution. Lastly, introducing the DSAGA methodology within this virtual environment boosts the system’s operational efficiency, far exceeding the performance of traditional algorithms.
The development of this advanced 3D visualization platform signifies progress in solid-wood-panel processing by integrating real-time monitoring and predictive optimization. The flexibility of this system indicates potential applications not only in various production systems but also in the logistics and healthcare sectors, among others. This step forward exemplifies the impact of intelligent manufacturing practices across different industries. Expanding the digital twin framework beyond wood manufacturing to include diverse materials and processes sets the stage for widespread innovation in manufacturing practices.
To harness the full potential of digital twin technology within the manufacturing domain, it is necessary to extend research in several key areas. Firstly, future studies should scrutinize how adapting digital twin technology for various scales of wood processing enterprises can optimize production. Such an investigation is to validate technology scalability and appropriateness across disparate business models within the wood industry. Secondly, incorporating advanced technologies such as artificial intelligence (AI) and machine learning (ML) could substantially enhance the predictive analytics and optimization capabilities of the digital twin framework. By converging AI and ML with digital twin technology, manufacturing can benefit from process efficiency and quality control, driving competitive edges. Lastly, a rigorous assessment of the long-term effects of digital twin technology’s implementation is warranted to offer insights into business performance, cost efficiency, and environmental sustainability. Investigating these impacts will provide a holistic understanding, enabling industries to utilize digital twin technology to its ultimate effectiveness.
Drawing from the substantial promise shown by digital twin technology in the current study, these proposed research initiatives are expected to propel industry-wide adoption and innovation. Future exploration in these directions will not only contribute to the knowledge in smart manufacturing but will also spur the development of increasingly intelligent production systems fitting for the evolving manufacturing landscape.

Author Contributions

Conceptualization, J.Y.; methodology, J.Y.; software, J.Y., Y.W. and J.H; validation, J.Y.; formal analysis, J.Y.; investigation, L.T.; resources, Y.Z. and J.W.; data curation, Y.W., J.H. and L.T.; writing—original draft preparation, J.Y.; writing—review and editing, J.W.; visualization, J.W.; supervision, Y.Z. and J.W.; project administration, J.W.; funding acquisition, J.W. All authors have read and agreed to the published version of the manuscript.

Funding

This research was funded by Beijing Forestry University Excellent Experimenter Item, grant number BJFUSY20220707.

Institutional Review Board Statement

Not applicable.

Informed Consent Statement

Not applicable.

Data Availability Statement

Data are contained within the article.

Conflicts of Interest

The authors declare no conflicts of interest.

References

  1. Tao, F.; Cheng, J.; Qi, Q.; Zhang, M.; Zhang, H.; Sui, F. Digital Twin-Driven Product Design, Manufacturing and Service with Big Data. Int. J. Adv. Manuf. Technol. 2018, 94, 3563–3576. [Google Scholar] [CrossRef]
  2. Aivaliotis, P.; Georgoulias, K.; Chryssolouris, G. The Use of Digital Twin for Predictive Maintenance in Manufacturing. Int. J. Comput. Integr. Manuf. 2019, 32, 1067–1080. [Google Scholar] [CrossRef]
  3. Wang, Y.; Wu, Z. Digital Twin-Based Production Scheduling System for Heavy Truck Frame Shop. Proc. Inst. Mech. Eng. Part C J. Mech. Eng. Sci. 2022, 236, 1931–1942. [Google Scholar] [CrossRef]
  4. Tao, F.; Zhang, H.; Qi, Q.; Zhang, M.; Liu, W.; Cheng, J. Ten questions about digital twins: Analysis and thinking. Comput. Integr. Manuf. Syst. 2020, 26, 1–17. [Google Scholar] [CrossRef]
  5. Make More Digital Twins. Available online: https://www.nature.com/articles/d41586-019-02849-1 (accessed on 9 January 2024).
  6. Tao, F.; Zhang, M.; Liu, Y.; Nee, A.Y.C. Digital Twin Driven Prognostics and Health Management for Complex Equipment. CIRP Ann. 2018, 67, 169–172. [Google Scholar] [CrossRef]
  7. Soori, M.; Arezoo, B.; Dastres, R. Digital Twin for Smart Manufacturing, A Review. Sustain. Manuf. Serv. Econ. 2023, 2, 100017. [Google Scholar] [CrossRef]
  8. Wang, B.; Tao, F.; Fang, X.; Liu, C.; Liu, Y.; Freiheit, T. Smart Manufacturing and Intelligent Manufacturing: A Comparative Review. Engineering 2021, 7, 738–757. [Google Scholar] [CrossRef]
  9. Wu, X.; Zhu, J. Discussion on digital twin model of intelligent workshop for panel custom furniture. Wood Sci. Technol. 2023, 37, 25–32. [Google Scholar]
  10. Ouyang, Z.; Wu, Y.; Tao, T.; Dai, X.; Huang, Y.; Chen, X.; Wang, X.; Hao, S.; Zhan, X. Construction of furniture digital twin workshop and key technology prospects for “Made in China 2025”. Furnit. Inter. Decor. 2022, 29, 1–7. [Google Scholar] [CrossRef]
  11. Hopfield, J.J.; Tank, D.W. “Neural” Computation of Decisions in Optimization Problems. Biol. Cybern. 1985, 52, 141–152. [Google Scholar] [CrossRef]
  12. Wu, P.; He, Y.; Li, Y.; He, J.; Liu, X.; Wang, Y. Multi-Objective Optimisation of Machining Process Parameters Using Deep Learning-Based Data-Driven Genetic Algorithm and TOPSIS. J. Manuf. Syst. 2022, 64, 40–52. [Google Scholar] [CrossRef]
  13. Bhoskar, T.; Kulkarni, O.K.; Kulkarni, N.K.; Patekar, S.L.; Kakandikar, G.; Nandedkar, V. Genetic Algorithm and Its Applications to Mechanical Engineering: A Review. Mater. Today Proc. 2015, 2, 2624–2630. [Google Scholar] [CrossRef]
  14. Goldberg, D.E.; Lingle, R. Alleles, Loci, and the Traveling Salesman Problem. In Proceedings of the First International Conference on Genetic Algorithms and Their Applications; Psychology Press: London, UK, 1985; ISBN 978-1-315-79967-4. [Google Scholar]
  15. Tao, F.; Zhang, M.; Cheng, J.; Qi, Q. Digital Twin Workshop: A New Paradigm for Future Workshop. Comput. Integr. Manuf. Syst. 2017, 23, 1–9. [Google Scholar]
  16. Tao, F.; Cheng, Y.; Cheng, J.; Zhang, M.; Xu, W.; Qi, Q. Theory and Technologies for Cyber-Physical Fusion in Digital Twin Shop-Floor. Comput. Integr. Manuf. Syst. 2017, 23, 1603–1611. [Google Scholar]
  17. Grieves, M.; Vickers, J. Digital Twin: Mitigating Unpredictable, Undesirable Emergent Behavior in Complex Systems. In Transdisciplinary Perspectives on Complex Systems: New Findings and Approaches; Kahlen, F.-J., Flumerfelt, S., Alves, A., Eds.; Springer International Publishing: Cham, Switzerland, 2017; pp. 85–113. ISBN 978-3-319-38756-7. [Google Scholar]
  18. Xu, J.; Kong, D.; Wang, Z.; Zhao, Z.; Yu, C. Construction of Digital Twin System of Rice Supply Chain Based on Industrial Internet. Trans. Chin. Soc. Agric. Mach. 2023, 3, 372–381. [Google Scholar]
  19. Zhang, Q.; Liu, Z.; Duan, J.; Qin, J. A Novel Method of Digital Twin-Based Manufacturing Process State Modeling and Incremental Anomaly Detection. Machines 2023, 11, 151. [Google Scholar] [CrossRef]
  20. Yan, B.; Yang, F.; Qiu, S.; Wang, J.; Cai, B.; Wang, S.; Zaheer, Q.; Wang, W.; Chen, Y.; Hu, W. Digital Twin in Transportation Infrastructure Management: A Systematic Review. Intell. Transp. Infrastruct. 2023, 2, liad024. [Google Scholar] [CrossRef]
  21. Kang, T.; Mo, Y. A Comprehensive Digital Twin Framework for Building Environment Monitoring with Emphasis on Real-Time Data Connectivity and Predictability. Dev. Built Environ. 2024, 17, 100309. [Google Scholar] [CrossRef]
  22. Duru, A.; Şehirli, E.; Kabalcı, İ. Ultra-Wideband Positioning System Using TWR and Lateration Methods. In Proceedings of the Fourth International Conference on Engineering & MIS 2018, Istanbul, Turkey, 19–20 June 2018; Association for Computing Machinery: New York, NY, USA; pp. 1–4. [Google Scholar]
  23. Benouakta, A.; Ferrero, F.; Lizzi, L.; Staraj, R. Advancements in Industrial RTLSs: A Technical Review of UWB Localization Devices Emphasizing Antennas for Enhanced Accuracy and Range. Electronics 2024, 13, 751. [Google Scholar] [CrossRef]
  24. Luo, J.; Zhou, X.; Zeng, C.; Jiang, Y.; Qi, W.; Xiang, K.; Pang, M.; Tang, B. Robotics Perception and Control: Key Technologies and Applications. Micromachines 2024, 15, 531. [Google Scholar] [CrossRef]
  25. Grieves, M. Deep Reinforcement Learning for Inventory Optimization with Non-Stationary Uncertain Demand. Eur. J. Oper. Res. 2024, 314, 433–445. [Google Scholar]
  26. Haupt, R.L.; Haupt, S.E. Practical Genetic Algorithms; John Wiley & Sons: Hoboken, NJ, USA, 2023; Volume 7. [Google Scholar]
  27. Goldberg, D.E. Genetic Algorithms in Search, Optimization, and Machine Learning; Addison-Wesley Pub. Co.: Boston, MA, USA, 1989. [Google Scholar] [CrossRef]
  28. Zhang, G.; Gao, L.; Shi, Y. An Effective Genetic Algorithm for the Flexible Job-Shop Scheduling Problem. Expert. Syst. Appl. 2011, 38, 3563–3573. [Google Scholar] [CrossRef]
  29. Dong, W.; Li, Y.; Zheng, B.; Zen, S.; Zhang, J. A New Evolutionary Algorithm Based on the Decimal Coding. Wuhan Univ. J. Nat. Sci. 2002, 7, 150–156. [Google Scholar]
  30. Jenkins, W.M. A Decimal-Coded Evolutionary Algorithm for Constrained Optimization. Comput. Struct. 2002, 80, 471–480. [Google Scholar] [CrossRef]
  31. Yong-Kui, L. Algorithm for Circle Approximation and Generation. Comput.-Aided Des. 1993, 25, 169–171. [Google Scholar] [CrossRef]
  32. Si, S. Mathematical Modeling Algorithms and Applications; National Defense Industry Press: Arlington, VA, USA, 2011; ISBN 978-7-118-07647-9. [Google Scholar]
  33. Allahverdi, A. The Third Comprehensive Survey on Scheduling Problems with Setup Times/Costs. Eur. J. Oper. Res. 2015, 246, 345–378. [Google Scholar] [CrossRef]
  34. Pinedo, M.L. Scheduling: Theory, Algorithms, and Systems; Springer: Berlin/Heidelberg, Germany, 2016. [Google Scholar]
  35. Fogel, D.B. Evolutionary Computation: Toward a New Philosophy of Machine Intelligence; Wiley-IEEE Press: Hoboken, NJ, USA, 2011. [Google Scholar]
  36. Goldberg, D.E.; Deb, K. A Comparative Analysis of Selection Schemes Used in Genetic Algorithms. In Foundations of Genetic Algorithms; Elsevier: Amsterdam, The Netherlands, 1991; Volume 1, pp. 69–93. ISBN 978-0-08-050684-5. [Google Scholar]
  37. Shannon, C.E. A Mathematical Theory of Communication. Bell Syst. Tech. J. 1948, 27, 379–423. [Google Scholar] [CrossRef]
  38. Deb, K.; Goldberg, D. An Investigation of Niche and Species Formation in Genetic Function Optimization. Comput. Sci. Math. 1989, 6, 42–50. [Google Scholar]
  39. Back, T. Selective Pressure in Evolutionary Algorithms: A Characterization of Selection Mechanisms. In Proceedings of the First IEEE Conference on Evolutionary Computation. IEEE World Congress on Computational Intelligence, Orlando, FL, USA, 27–29 June 1994. [Google Scholar]
  40. Adaptive Probabilities of Crossover and Mutation in Genetic Algorithms|IEEE Journals & Magazine|IEEE Xplore. Available online: https://ieeexplore.ieee.org/document/286385 (accessed on 4 April 2024).
  41. Deb, K.; Agrawal, S.; Pratap, A.; Meyarivan, T. A Fast Elitist Non-Dominated Sorting Genetic Algorithm for Multi-Objective Optimization: NSGA-II. In Proceedings of the Parallel Problem Solving from Nature PPSN VI; Schoenauer, M., Deb, K., Rudolph, G., Yao, X., Lutton, E., Merelo, J.J., Schwefel, H.-P., Eds.; Springer: Berlin/Heidelberg, Germany, 2000; pp. 849–858. [Google Scholar]
  42. Konak, A.; Coit, D.W.; Smith, A.E. Multi-Objective Optimization Using Genetic Algorithms: A Tutorial. Reliab. Eng. Syst. Saf. 2006, 91, 992–1007. [Google Scholar] [CrossRef]
  43. Crossover in Genetic Algorithm. Available online: https://www.geeksforgeeks.org/crossover-in-genetic-algorithm/ (accessed on 26 April 2024).
  44. Katoch, S.; Chauhan, S.S.; Kumar, V. A Review on Genetic Algorithm: Past, Present, and Future. Multimed. Tools Appl. 2021, 80, 8091–8126. [Google Scholar] [CrossRef]
  45. De Jong, K.A.; Spears, W.M. A Formal Analysis of the Role of Multi-Point Crossover in Genetic Algorithms. Ann. Math. Artif. Intell. 1992, 5, 1–26. [Google Scholar] [CrossRef]
  46. Hassanat, A.; Almohammadi, K.; Alkafaween, E.; Abunawas, E.; Hammouri, A.; Prasath, V.B.S. Choosing Mutation and Crossover Ratios for Genetic Algorithms—A Review with a New Dynamic Approach. Information 2019, 10, 390. [Google Scholar] [CrossRef]
  47. De Jong, K.A. An Analysis of the Behavior of a Class of Genetic Adaptive Systems. Ph.D. Thesis, University of Michigan, Ann Arbor, MI, USA, 1975. [Google Scholar]
  48. Wang, L.; Zheng, D. An Effective Hybrid Optimization Strategy for Job-Shop Scheduling Problems. Comput. Oper. Res. 2024, 6, 585–596. [Google Scholar] [CrossRef]
  49. Bäck, T. Optimal Mutation Rates in Genetic Search. In Proceedings of the 5th International Conference on Genetic Algorithms, Urbana-Champaign, IL, USA, 1 June 1993; Morgan Kaufmann Publishers Inc.: San Francisco, CA, USA; pp. 2–8. [Google Scholar]
  50. Holland, J.H. Adaptation in Natural and Artificial Systems: An Introductory Analysis with Applications to Biology, Control, and Artificial Intelligence; MIT Press: Cambridge, MA, USA, 1992. [Google Scholar]
  51. Wang, J. Solution method for scheduling of mixed flow shop for panel furniture with buffer constraints. J. For. Eng. 2023, 8, 198–204. [Google Scholar]
Figure 1. Processing flow diagram.
Applsci 14 06622 g001
Figure 2. Information model of the entire solid-wood-panel production process.
Applsci 14 06622 g002
Figure 3. Image of AGV.
Applsci 14 06622 g003
Figure 4. (a) M-20iA/35M; (b) M-10iD/12.
Applsci 14 06622 g004
Figure 5. (a) UWB; (b) NAUWB01 external antenna; (c) post-combination UWB.
Applsci 14 06622 g005
Figure 6. Nine-axis sensor physical image.
Applsci 14 06622 g006
Figure 7. Four-layer relationship diagram of the digital twin surveillance system.
Applsci 14 06622 g007
Figure 8. Transport layer architecture.
Applsci 14 06622 g008
Figure 9. (a) Schematic of two-dimensional spatial positioning. (b) Schematic of three-sided measurement method.
Applsci 14 06622 g009
Figure 10. (a) UWB tags installed on AGV. (b) UWB tags installed on the bases of industrial robots.
Applsci 14 06622 g010
Figure 11. (a) Nine-axis sensor mounted on industrial robot base. (b) Nine-axis sensor mounted on the arm of an industrial robot.
Applsci 14 06622 g011
Figure 12. Technology architecture.
Applsci 14 06622 g012
Figure 13. Flowchart of DSAGA.
Applsci 14 06622 g013
Figure 14. (a) Initial model. (b) Model after coloring.
Applsci 14 06622 g014
Figure 15. Motion trajectory diagram.
Applsci 14 06622 g015
Figure 16. Acceleration, angular velocity, and angle curve.
Applsci 14 06622 g016
Figure 17. Real-time mapping of the physical layer to the virtual layer.
Applsci 14 06622 g017
Figure 18. Interactive simulation interface of the application layer for solid-wood-panel processing.
Applsci 14 06622 g018
Figure 19. Production efficiency monitoring system.
Applsci 14 06622 g019
Figure 20. (a) Inspection unit mapping. (b) Outbound unit mapping. (c) Machining unit mapping. (d) Packaging unit mapping.
Applsci 14 06622 g020
Figure 21. Gantt chart scheduling results.
Applsci 14 06622 g021
Figure 22. Convergence comparison chart.
Applsci 14 06622 g022
Table 1. Comparison of each type of positioning technology.
Positioning TechnologyPrecisionSecurityAnti-InterferenceCost
Bluetooth2–10 mHighLowLow
RFIDRegional targetingLowLowerLower
Wi-Fi5–10 mLowerHighLow
UWB6–15 mHigherHigherHigh
Table 2. Number of equipment for each process.
ProcessDuration TimeNumber
Outbound478 s2
Machining1196 s5
Grinding966 s4
Dedusting241 s1
Packaging118 s2
Table 3. Comparison of different methods.
MethodMaximum Completion Time
DSAGA5403 s
GA5933 s
Table 4. Percentage deviation for maximum completion time.
MethodGA
P/%8.93
Disclaimer/Publisher’s Note: The statements, opinions and data contained in all publications are solely those of the individual author(s) and contributor(s) and not of MDPI and/or the editor(s). MDPI and/or the editor(s) disclaim responsibility for any injury to people or property resulting from any ideas, methods, instructions or products referred to in the content.

