Article

Band-Pass and Band-Stop Filter Frequency Selective Surface with Harmonic Suppression

by
Dong Hyee Hwang
,
Taeyong Jeong
,
Jun Hee Kim
and
Keum Cheol Hwang
*
Department of Electrical and Computer Engineering, Sungkyunkwan University, Suwon 16419, Republic of Korea
*
Author to whom correspondence should be addressed.
Appl. Sci. 2024, 14(15), 6633; https://doi.org/10.3390/app14156633
Submission received: 18 June 2024 / Revised: 14 July 2024 / Accepted: 16 July 2024 / Published: 29 July 2024

Abstract

:
This study investigated a frequency-selective surface (FSS) that is used to suppress harmonics affecting the performance and accuracy of radar systems. One side of the FSS features a metal grid structure, and when converted into an equivalent circuit model, it exhibits the characteristics of a band-pass filter with an L and C parallel structure. The other side of the FSS features a metallic loop structure and when represented as an equivalent circuit model, it exhibits the characteristics of a band-stop filter with an L and C series structure. The reflection coefficient ( S 11 ) and transmission coefficient ( S 21 ) of the FSS designed based on theory are compared using a CST studio suite and Keysight’s Advanced Design System. In addition, the transmission coefficients are verified through actual measurements, wherein the measured transmission coefficient is −0.1 dB at 3.0 GHz and approximately −50 dB at the harmonic frequency of 6.0 GHz. The designed FSS is attached to an actual radar system, and the 2D radiation pattern and maximum gain are measured during steering in boresight, azimuth ( 30 ) and elevation ( 30 ) directions. At 3.0 GHz, the maximum gain in boresight is 17.25 dB without the FSS and 17.12 dB with the FSS. At 6.0 GHz, the maximum gain is 12.79 dB without the FSS and 2.69 dB with the FSS. At 3.0 GHz, the maximum gain during azimuth steering is 16.13 dB without the FSS and 16.68 dB with the FSS, and the maximum gain during elevation steering is 15.74 dB without the FSS and 15.90 dB with the FSS.

1. Introduction

Radar systems emit electromagnetic waves into space through an antenna. When this wave hits an object, it is reflected and returned to the antenna. The receiver then captures the reflected wave, which is processed using “Time Delay” and “Doppler Shift” technology. This processing helps to determine the location and speed of the object. Radar systems play a significant role in various fields, including air traffic control, weather monitoring, and military surveillance [1,2]. Recently, various studies have been conducted on harmonic nonlinear radar, which detects harmonic signals radiating from a target, unlike a conventional radar method, which detects signals reflected from the target. The reception frequency of nonlinear radar utilizes the harmonic signal of the transmission frequency as the operating band. Nonlinear radar systems are advantageous for detecting targets in more complex environments than conventional radar systems and provide improved identification using high-resolution radar imaging [3,4,5]. However, nonlinear signals and noise generated by electronic components within the radar system occur at multiple times the operating frequency, leading to degradation in system performance. Nonlinear radars typically use bistatic radar structures, and the harmonic coupling from the transmitter to adjacent receivers reduces the accuracy and reliability of radar systems. They detect the presence of non-existent targets or increase the noise level of the radar signal, thereby making it difficult to detect distant targets. Additionally, there is a disadvantage in that the system requires more power to reduce the noise caused by harmonic signals. To effectively suppress harmonics, multiple filters can be applied to the transmitter. However, a matching network is required within the system, which increases the weight and price of the system and reduces the system gain due to the insertion loss. Therefore, various studies have been conducted on antennas and frequency-selective surfaces using harmonic suppression filters (HSFs). Representative examples include a filter-integrated antenna [6,7], research using an impedance transformer [8,9], and various harmonic canceling techniques. Additionally, research has been conducted to effectively transmit the target frequency band using a frequency-selective surface that implements band-pass filter characteristics [10,11,12,13,14].
Frequency Selective Surfaces (FSS) enhance radar system performance by selectively allowing or blocking specific frequency bands. Composed of periodic arrays of metal patches or slots, FSS exhibit band-pass or band-stop filter characteristics, reducing interference and improving the signal-to-noise ratio. Despite these advantages, challenges persist in achieving harmonic suppression alongside wide-angle beam steering, stable broadband performance, and precise fabrication. In this paper, we propose an FSS that combines band-pass filter (BPF) and band-stop filter (BSF) characteristics to suppress harmonics and enable wide-angle beam steering. The proposed FSS, featuring a metal grid structure and a metallic loop structure, was analyzed using CST Studio Suite and Keysight’s Advanced Design System. Experimental measurements verified significant harmonic suppression and stable performance during beam steering. Specifically, the measured transmission coefficient ( S 21 ) was −0.1 dB at 3.0 GHz and approximately −50 dB at 6.0 GHz. The FSS, when attached to an actual radar system, showed a maximum gain of 17.12 dB at 3.0 GHz (with FSS) compared to 17.25 dB (without FSS), and at 6.0 GHz, 2.69 dB (with FSS) compared to 12.79 dB (without FSS). During azimuth steering at 3.0 GHz, the gain was 16.68 dB (with FSS) compared to 16.13 dB (without FSS), and during elevation steering, it was 15.90 dB (with FSS) compared to 15.74 dB (without FSS). This study provides a comprehensive FSS design combining harmonic suppression and wide-angle beam steering, validated through simulations and practical radar system implementations.

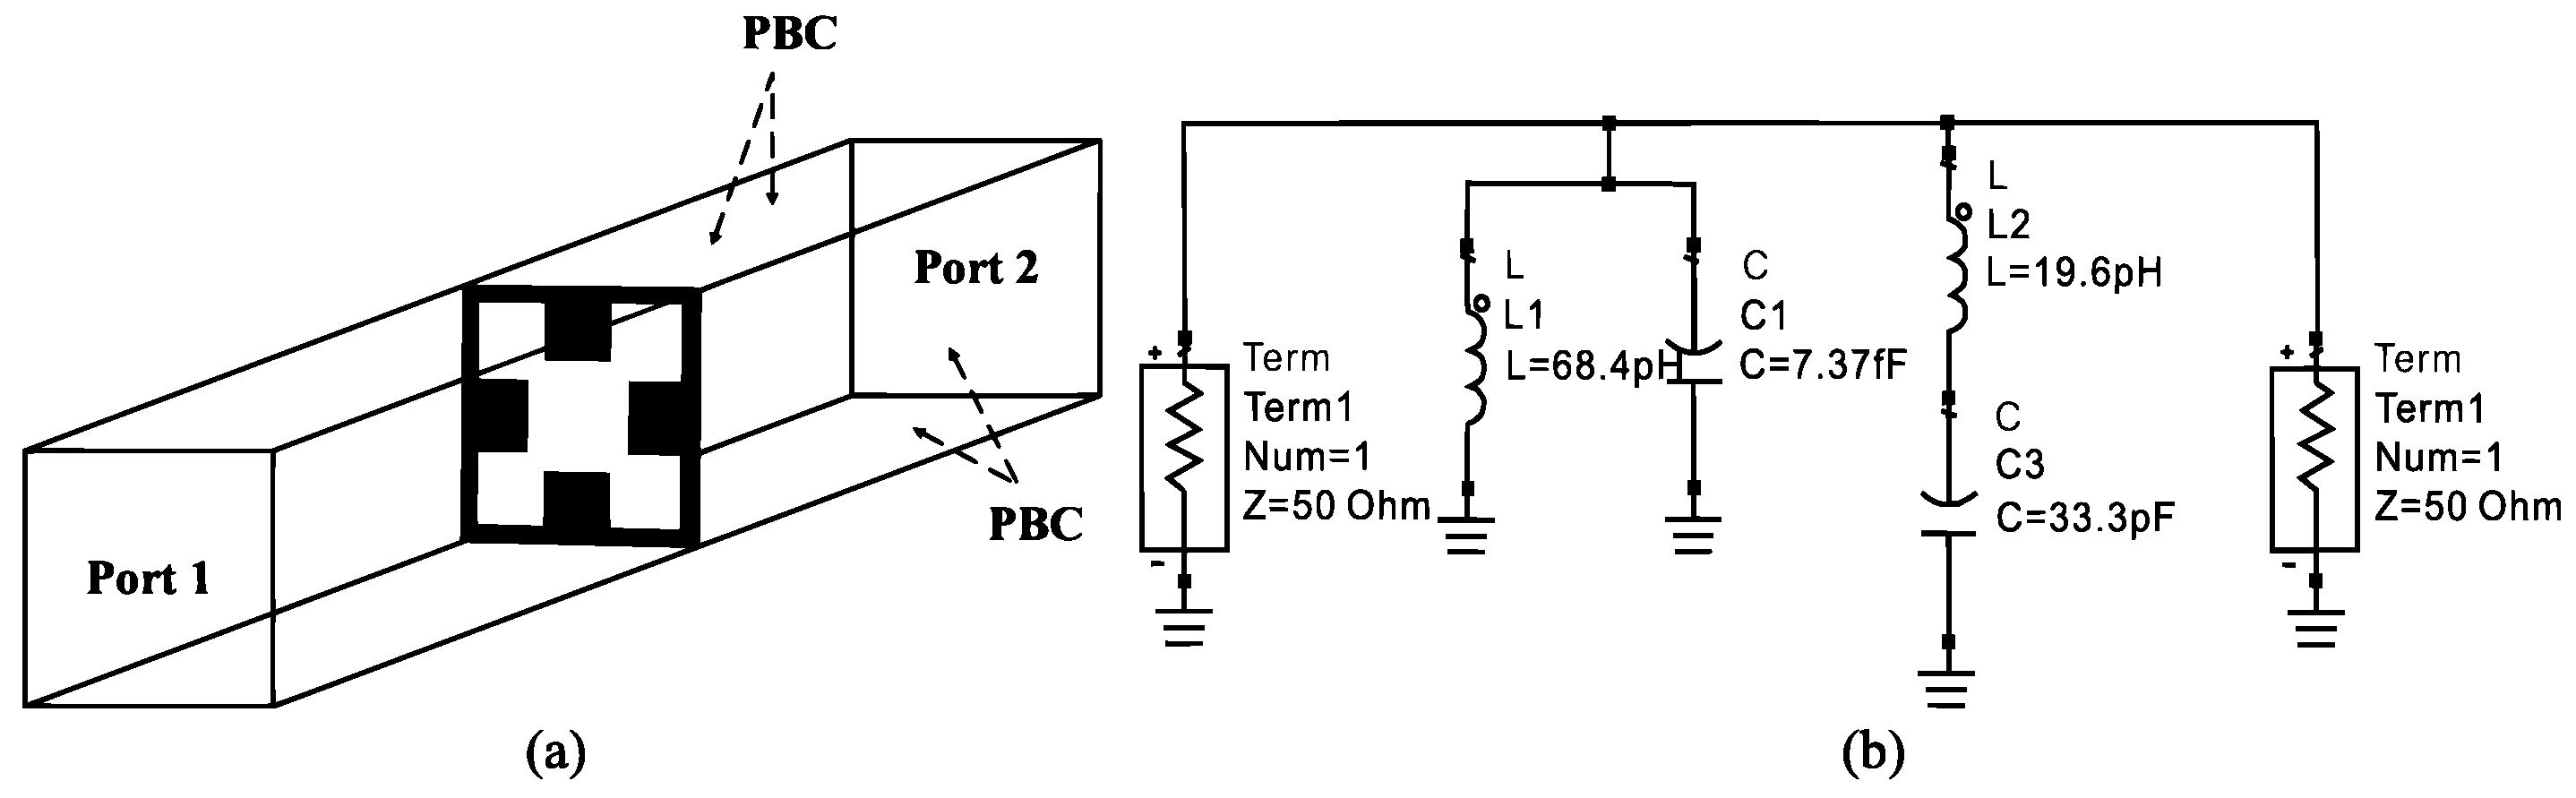
2. Design of Proposed Frequency Selective Surface with Harmonic Suppression

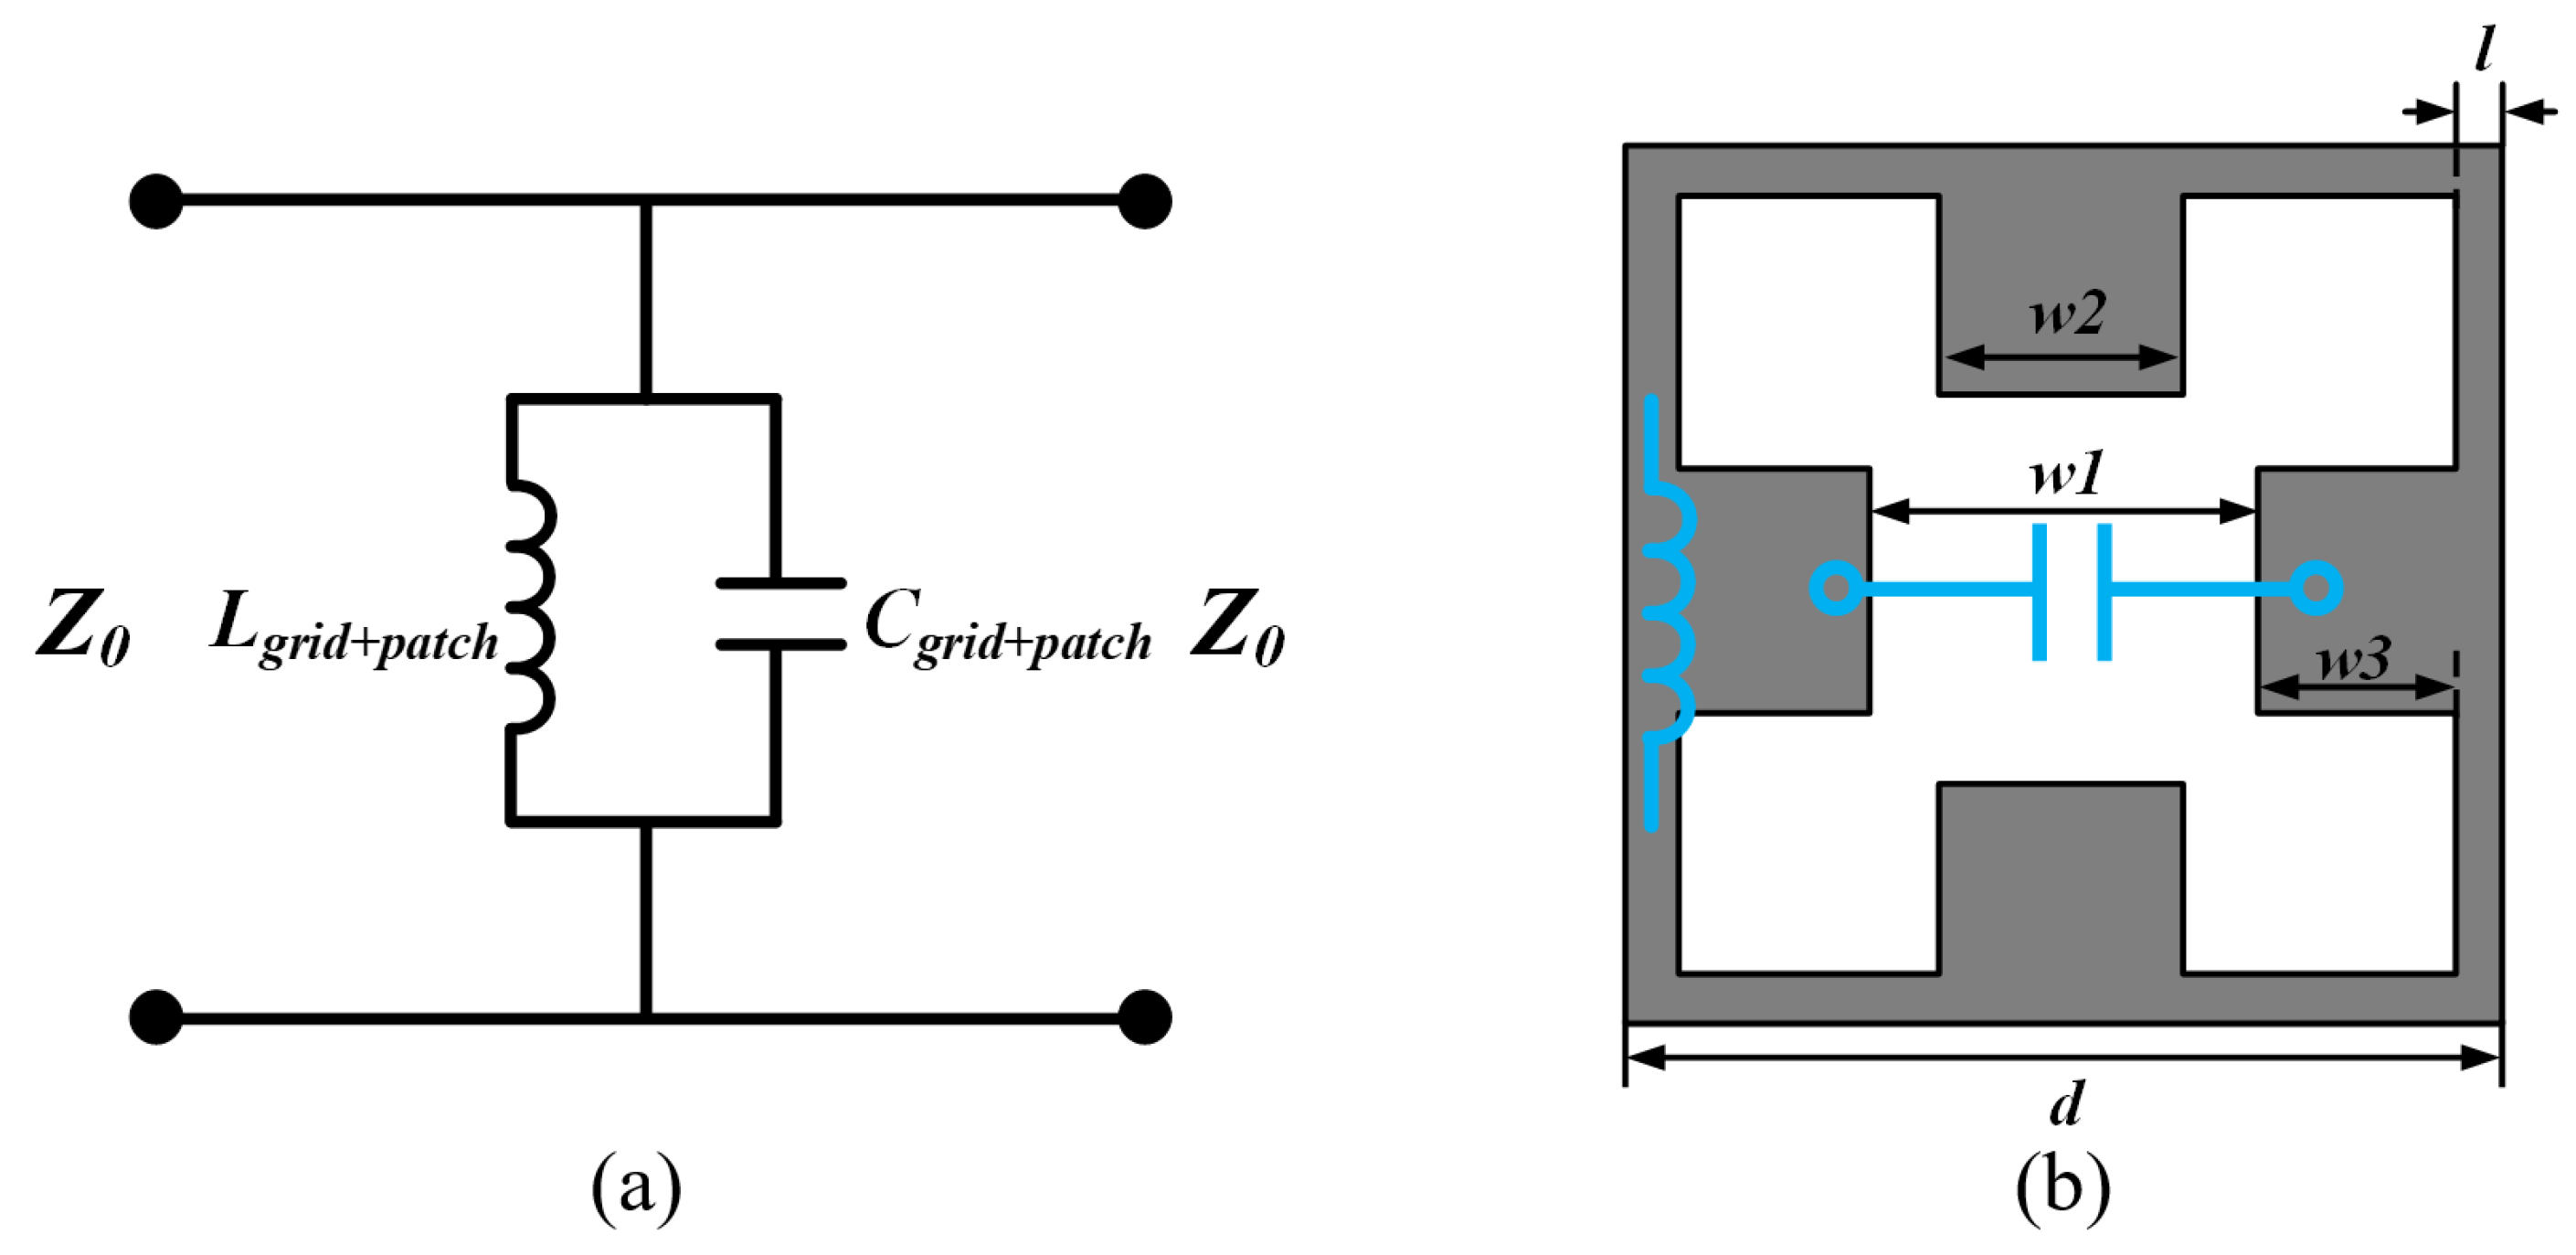
2.1. Design of Proposed Grid Structure with Band-Pass Filter Characteristics

When metal is arranged periodically in a grid shape on a thin dielectric substrate, thin metals resembling wires generate magnetic fields around them in response to changes in the applied current [15]. This effect is similar to that of inductance, which is one of the characteristics of an electric circuit in the direction of the electric field. Additionally, in the H-field direction, it produces an effect similar to capacitance, which is one of the characteristics of an electric circuit. Therefore, depending on the incident direction of the electromagnetic wave, the direction parallel to the E-field is expressed in TE mode, and the direction parallel to the H-field is expressed in TM mode. Equation (1) represents the inductance component of the grid-wire structure. When patches are periodically placed on the same surface plane of a thin dielectric substrate, a capacitance occurs between the patches. The mathematical expression of this is shown in Equation (2). Figure 1a shows the band-pass filter, which consists of a parallel LC circuit, represented as an equivalent circuit model (EC model). In this study, we propose an FSS with the structure shown in Figure 1b to design a band-pass filter operating at 3.0 GHz. This is a Grid+Patch structure in which the patches are attached to all sides of the symmetrical square wire, allowing for both a grid and a patch to coexist simultaneously. The L and C values of Grid + Patch are the same as those for Equations (3) and (4) [16]. When a patch is added to the grid form, the total inductance in this structure is obtained by multiplying the L value of the grid by the wire length, as shown in Equation (3). The total capacitance of the structure can be expressed as the product of the existing capacitance and the length of the patch, as shown in Equation (4). The parameter d represents the unit cell size, defining the size of the repeating unit in the periodic grid structure. The parameter l indicates the thickness of the grid wire, which is the width of the metallic strip and plays a crucial role in determining the inductive component of the grid structure. The parameter w 1 denotes the distance between the patches, defining the gap between adjacent patches in the grid structure, and influences the total capacitive component of the grid. Parameter w 2 represents the size of each patch, specifically the width of the patches, which affects the electrical properties between the patches and the grid structure. Lastly, the parameter w 3 indicates the distance from the end of the grid wire to the patch, defining the gap between the grid structure and the patch, which is essential for adjusting the overall electrical characteristics. μ 0 is the permeability of the vacuum state and μ e f f is the relative permeability. ϵ 0 is the permittivity of the vacuum state and ϵ e f f is the relative permittivity.
L g r i d = μ 0 μ e f f 1 2 π ln ( 1 sin ( π l / 2 d ) )
C g r i d = ϵ 0 ϵ e f f 2 π ln ( 1 sin ( π w 1 / 2 d ) )
L g r i d + p a t c h = d · L g r i d
C g r i d + p a t c h = ( d w 1 ) · C g r i d

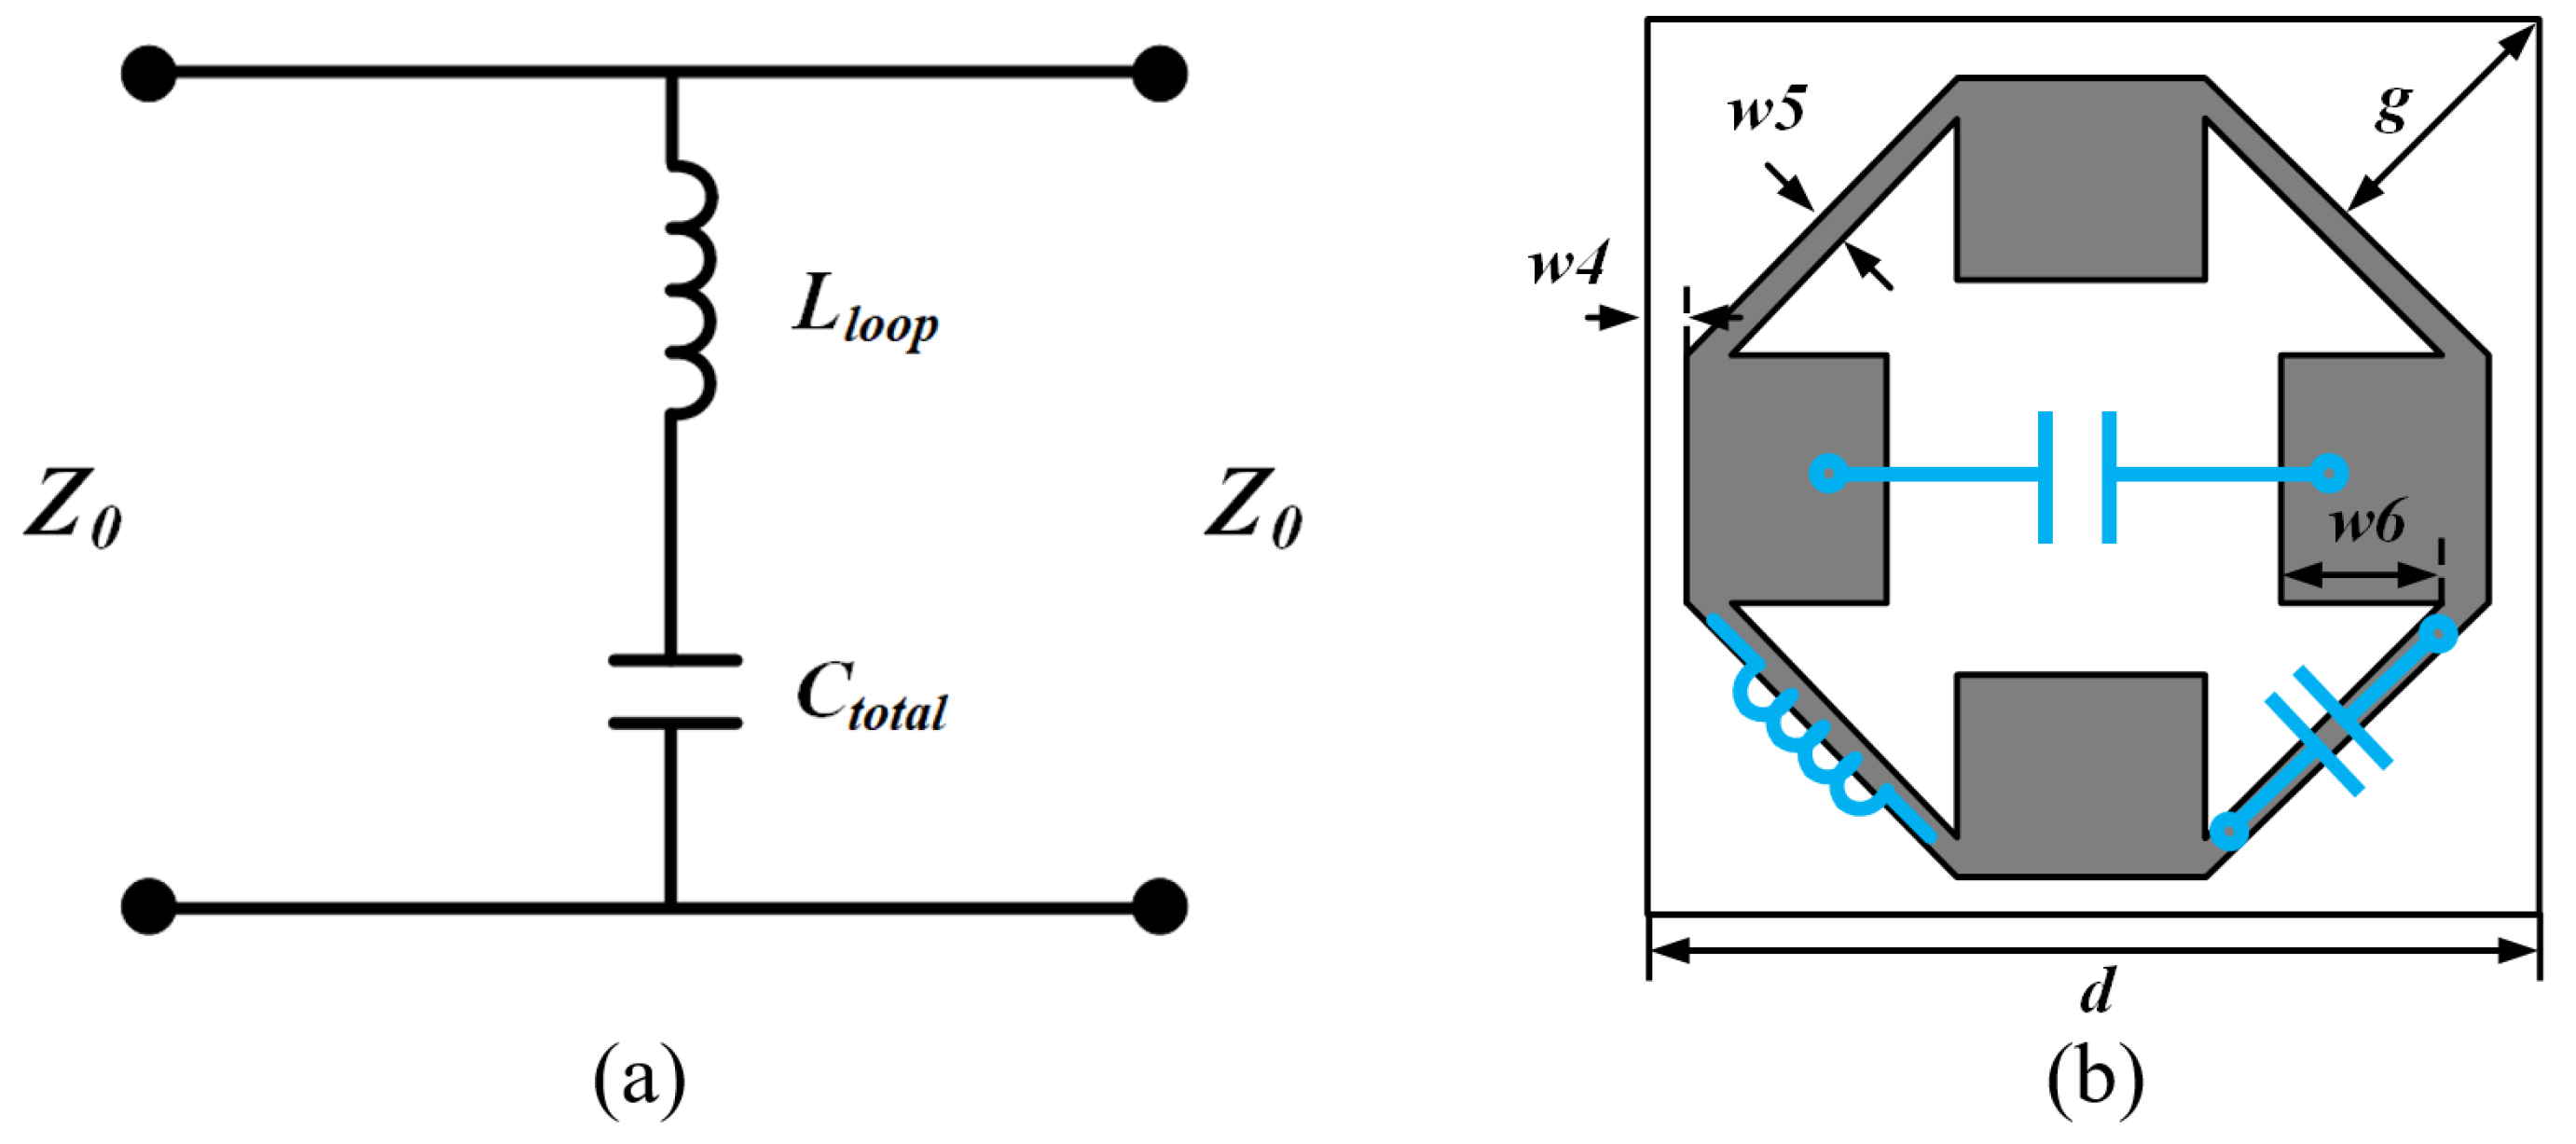
2.2. Design of Proposed Loop Structure with Band-Stop Filter Characteristics

Using the EC approximation method developed by Marcuvitz [15], the thin metal was periodically placed in a loop on the same plane as the dielectric. The loop exhibited both inductance and capacitance components. In particular, the square loop structure has a significant inductance component in TE mode and a capacitance component in TM mode. If the loop structure is expressed as an EC Model, it becomes a band-stop filter where the L and C components are in series, as shown in Figure 2a. The reactance component of the loop structure is represented by Equation (5), whereas the susceptance component is represented by Equation (6) [17].
Here, G in Equation (7) represents Green’s theorem as a second-order integral. To design an FSS that acts as a band-stop filter at 6.0 GHz, an FSS with the structure shown in Figure 2b is proposed. This is essentially a square loop shape, but the resonance frequency was lowered owing to the high value of C. Patches were attached to each corner to solve this. The capacitance ( C p a t c h ) between the patches within the loop was configured in a series. The C p a t c h value was obtained using Equation (2). The value of C t o t a l was obtained from parallel calculations of C l o o p and C p a t c h , as shown in Equation (10) [18].
X T E = w 5 · L l o o p Z 0 = d cos ( θ ) λ · ( ln ( csc ( π w 5 2 d ) ) + G ( d , w 5 , λ , θ ) )
B T E = w 5 · C l o o p Y 0 = 4 d sec ( θ ) λ · ( ln ( csc ( π g 2 d ) ) + G ( d , w 5 , λ , θ ) )
G ( d , w 5 , λ , θ ) = 0.5 ( 1 β 2 ) 2 [ ( 1 β 2 4 ) ( A + + A ) + 4 β 2 A + A ] ( 1 β 2 4 ) + β 2 ( 1 + β 2 2 β 4 8 ) ( A + + A ) + 2 β 6 A + A
A ± = 1 ( d sin θ λ ± 1 ) 2 d 2 λ 2 1
β = sin ( π w 5 2 d )
C t o t a l = C l o o p | | C p a t c h
To implement wide-angle beam steering characteristics in both the azimuth and elevation directions, the radio waves entering the FSS must be less affected by polarization. The proposed loop structure was designed to minimize the impact of the TE and TM modes by rotating it by 45 in the direction of the radio waves.
Parameter d represents the unit cell size, defining the overall dimension of one repeating unit in the periodic FSS structure. This parameter is crucial as it sets the basic scale for the entire design. Parameter w 4 indicates the gap between the unit cell and the loop, representing the distance between the edge of the loop and the boundary of the unit cell. This gap influences the overall capacitive and inductive characteristics of the loop structure. Parameter w 5 defines the loop thickness, which is the width of the metallic loop strip and is important for determining the inductive properties of the loop structure. Parameter w 6 denotes the size of the parasitic patches attached to the loop. These patches are used to fine-tune the electrical characteristics of the loop, especially its capacitive properties. Lastly, parameter g represents the distance between the loops, indicating the gap between adjacent loop structures in the periodic array. This parameter affects the coupling between loops and the overall filtering characteristics of the FSS. These parameters are essential in designing the loop structure to achieve the desired band-stop filter characteristics. By carefully adjusting these parameters, the performance of the FSS can be optimized for specific frequency-selective properties, including effective harmonic suppression. The optimized design parameters of the proposed Frequency Selective Surface (FSS) with the characteristics of a Band Pass Filter and a Band Stop Filter are shown in Table 1.

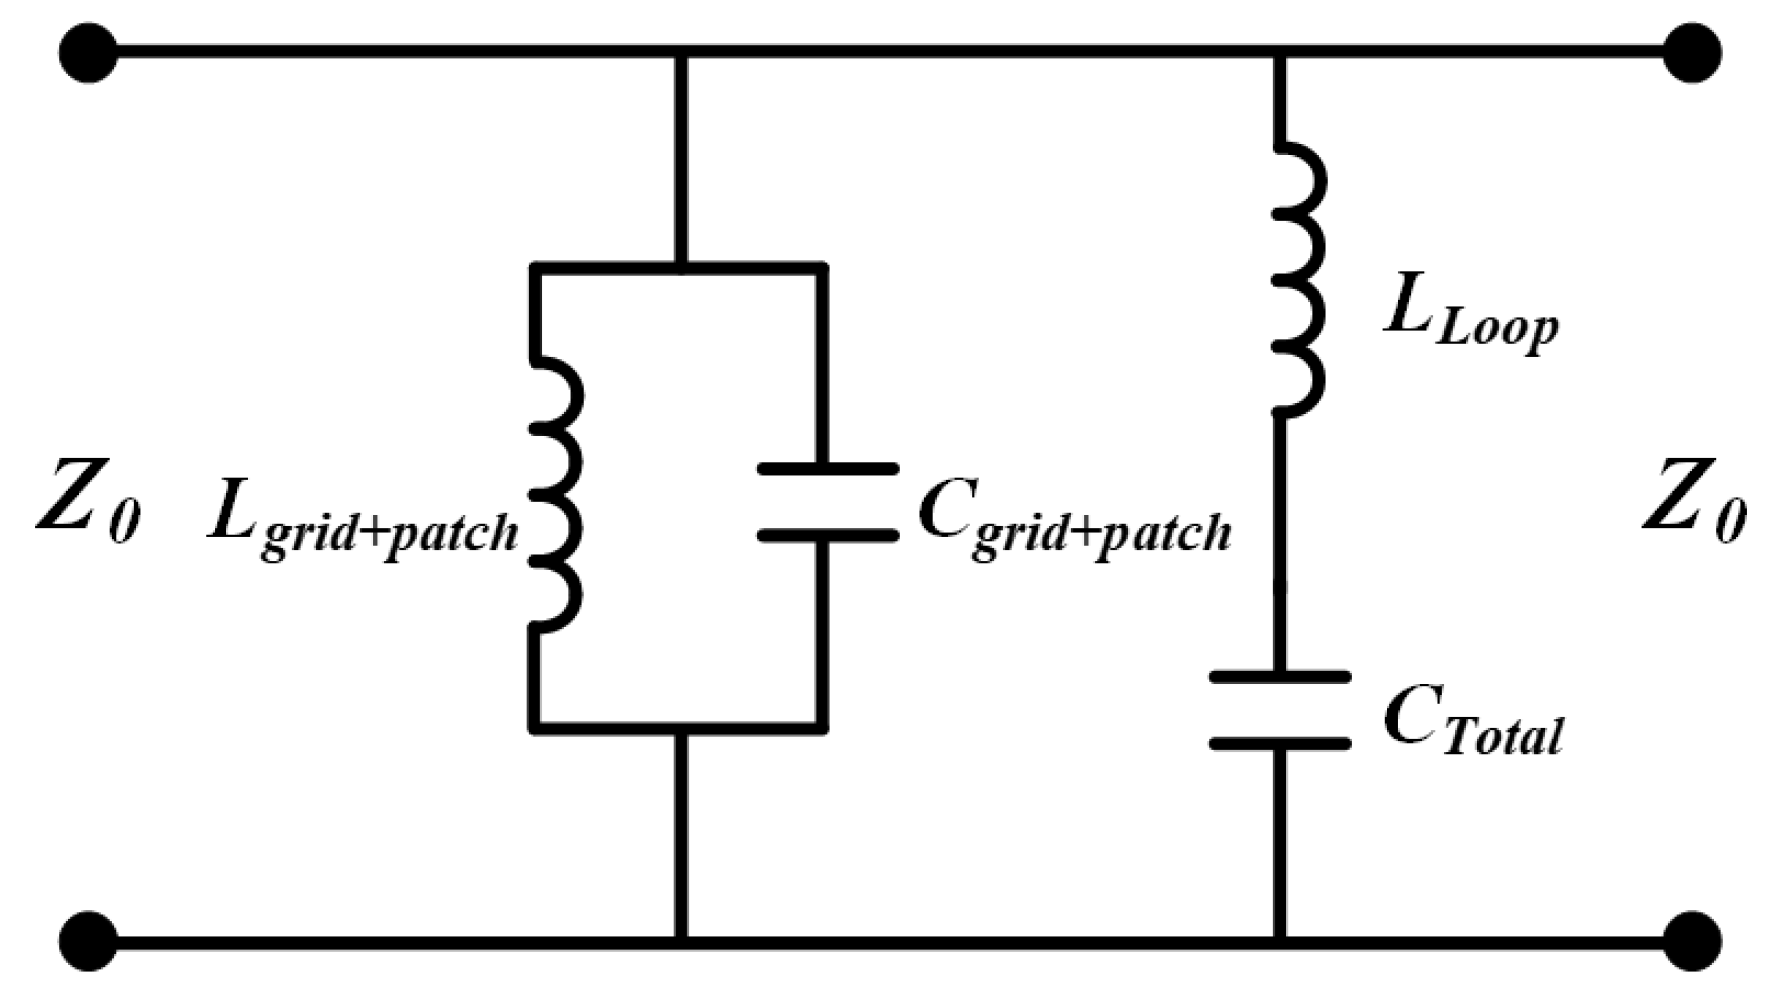
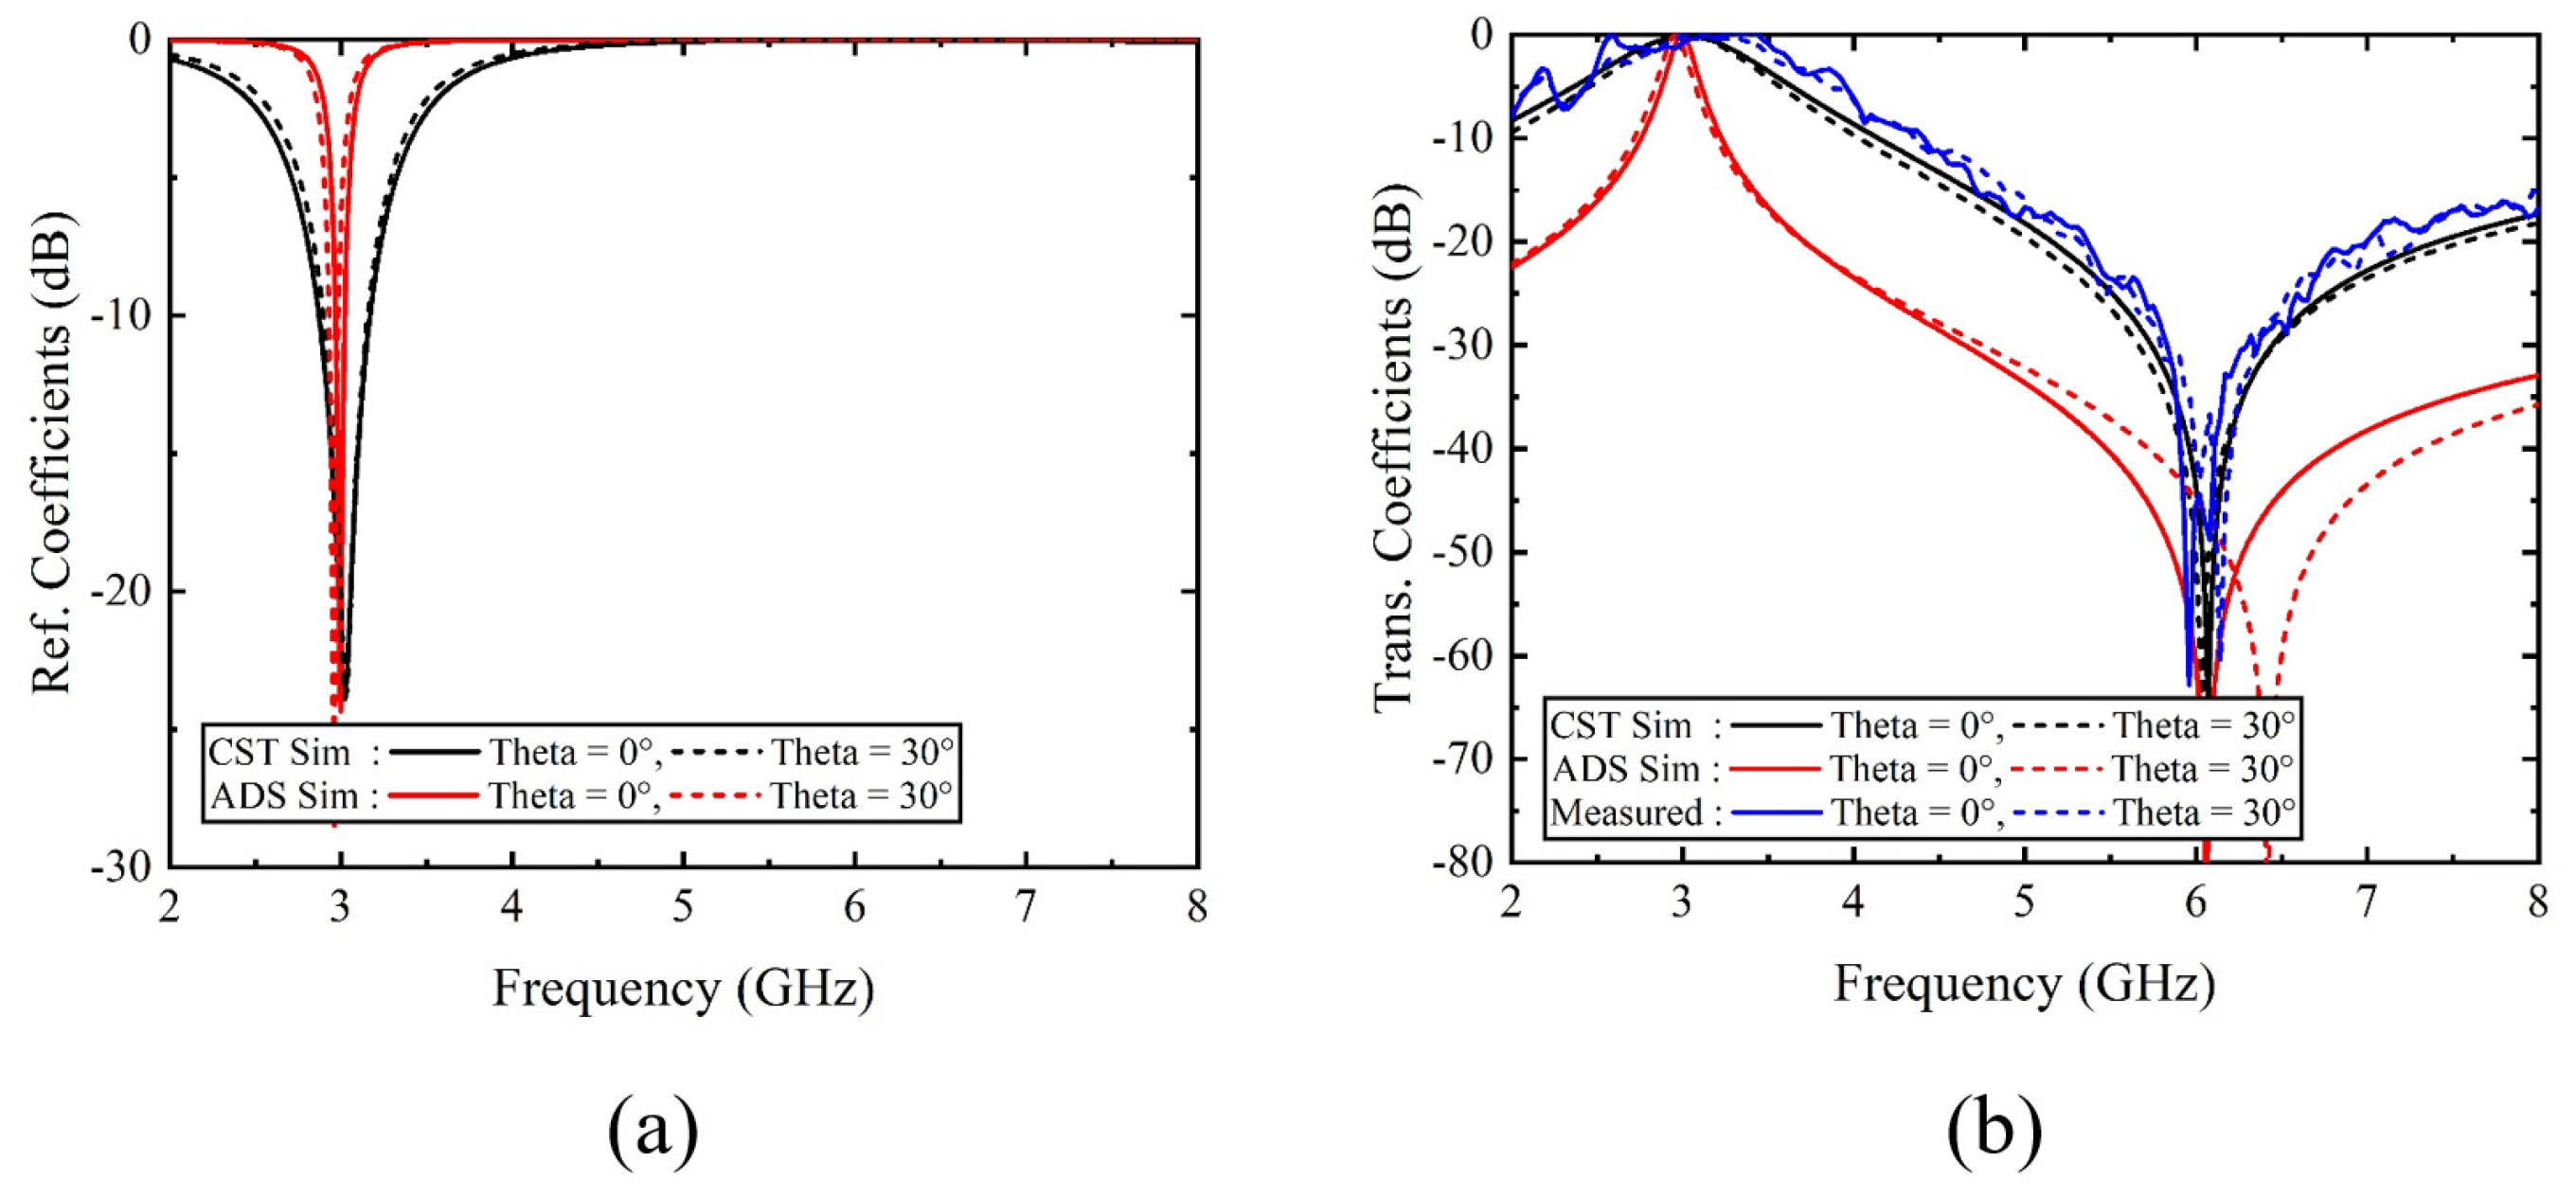
2.3. The Reflection Coefficient and Transmission Coefficient Results of the Proposed FSS

The equivalent circuit model (EC model) of the proposed Frequency Selective Surface (FSS), which integrates both the grid and loop structures, is illustrated in Figure 3. This model provides a theoretical basis for understanding the behavior of the FSS in response to electromagnetic waves. The grid structure of the manufactured FSS is shown in Figure 4a, and the loop structure is depicted in Figure 4b. These structures were meticulously designed to achieve the desired band-pass and band-stop filter characteristics. To comprehensively compare the reflection and transmission coefficient characteristics of the designed FSS with measured values, two distinct simulation methods were utilized. First, the CST Studio Suite was employed for unit cell simulation, as shown in Figure 5a. In this setup, the unit cell of the designed FSS was placed inside a waveguide with periodic boundary condition (PBC) walls. This configuration allowed for the measurement of the reflection coefficient ( S 11 ) and the transmission coefficient ( S 21 ) by adjusting the angle of incidence. By varying the angle, we could examine the wide-angle beam steering characteristics of the FSS, thereby ensuring that the FSS performs effectively under different incident angles. In parallel, the Advanced Design System (ADS) simulation provided by Keysight was used to validate the results, as shown in Figure 5b. This method involved inserting the calculated values of inductance (L) and capacitance (C) into the final EC model to evaluate the reflection and transmission coefficients. The dual approach of using both CST and ADS simulations ensured a robust analysis and cross-validation of the results. The wide-angle beam steering characteristics were specifically examined by changing the incident angle ( θ ). When ( θ ) is 0°, the component values were determined as follows: L g r i d + p a t c h = 68.4 pH, C g r i d + p a t c h = 7.37 fF, L l o o p = 19.6 pF, and C t o t a l = 33.3 pF. These values were critical in achieving the desired filtering characteristics. Table 2 provides a detailed summary of these parameter values. For the accurate measurement of the transmission coefficient of the FSS, an experimental setup was established, as depicted in Figure 6b. A standard horn antenna was positioned at the ports of a Vector Network Analyzer (VNA). The FSS was mounted on a centrally located rotating device placed between the horn antennas. This setup allowed for the precise measurement of the transmission coefficient ( S 21 ). By rotating the device, the transmission coefficient was measured at various angles, and the results were calculated by subtracting the S 21 values with the FSS from the S 21 values without the FSS. This method ensured that any discrepancies due to external factors were minimized. Figure 7a presents the simulation results for the reflection coefficient ( S 11 ). At the operational frequency of 3.0 GHz, both CST and ADS simulations demonstrated that the FSS met the criterion of −10 dB or less for S 11 , indicating effective reflection suppression. Even when the beam was steered at 30 , the reflection coefficient remained stable at −10 dB, showcasing the FSS’s capability to maintain performance across different angles. Figure 7b compares the simulation and measurement results for the transmission coefficient ( S 21 ). In the operating band of 3.0 GHz, the FSS operated as a band-pass filter with a minimal transmission loss of −0.1 dB. At the harmonic frequency of 6.0 GHz, the FSS exhibited band-stop filter characteristics with a significant transmission attenuation of approximately −50 dB. This substantial reduction in transmission at the harmonic frequency confirmed the FSS’s effectiveness in harmonic suppression, validating both the theoretical design and practical implementation of the FSS.
Additionally, a parameter sweep study was conducted to investigate the effects of various parameters on the performance of the band-pass and band-stop filters. For the band-pass filter, it was observed that increasing w 1 resulted in an increase in the resonant frequency of the operating band. This phenomenon occurs because the capacitance ( C g r i d ) decreases as w 1 increases. Similarly, an increase in the inductance (L) also led to an increase in the resonant frequency of the operating band, which can be attributed to the decrease in the inductance ( L g r i d ). In the harmonic band, increasing w 5 caused the resonant frequency of the harmonic to shift to the left, indicating a lower frequency. This shift is due to the increase in the inductance ( L l o o p ). Regarding the substrate parameters, increasing the dielectric constant of the substrate resulted in a shift of the overall resonant frequency to a lower frequency. Conversely, decreasing the dielectric constant caused the overall resonant frequency to shift to a higher frequency. When the thickness of the substrate was increased, the overall resonant frequency shifted to a higher frequency. On the other hand, reducing the thickness of the substrate caused the resonant frequency to shift to a lower frequency. Through this parameter sweep study, we aimed to minimize transmission loss by using a substrate with the lowest possible dielectric constant and reducing the substrate thickness as much as possible.

3. Method for Beam Steering

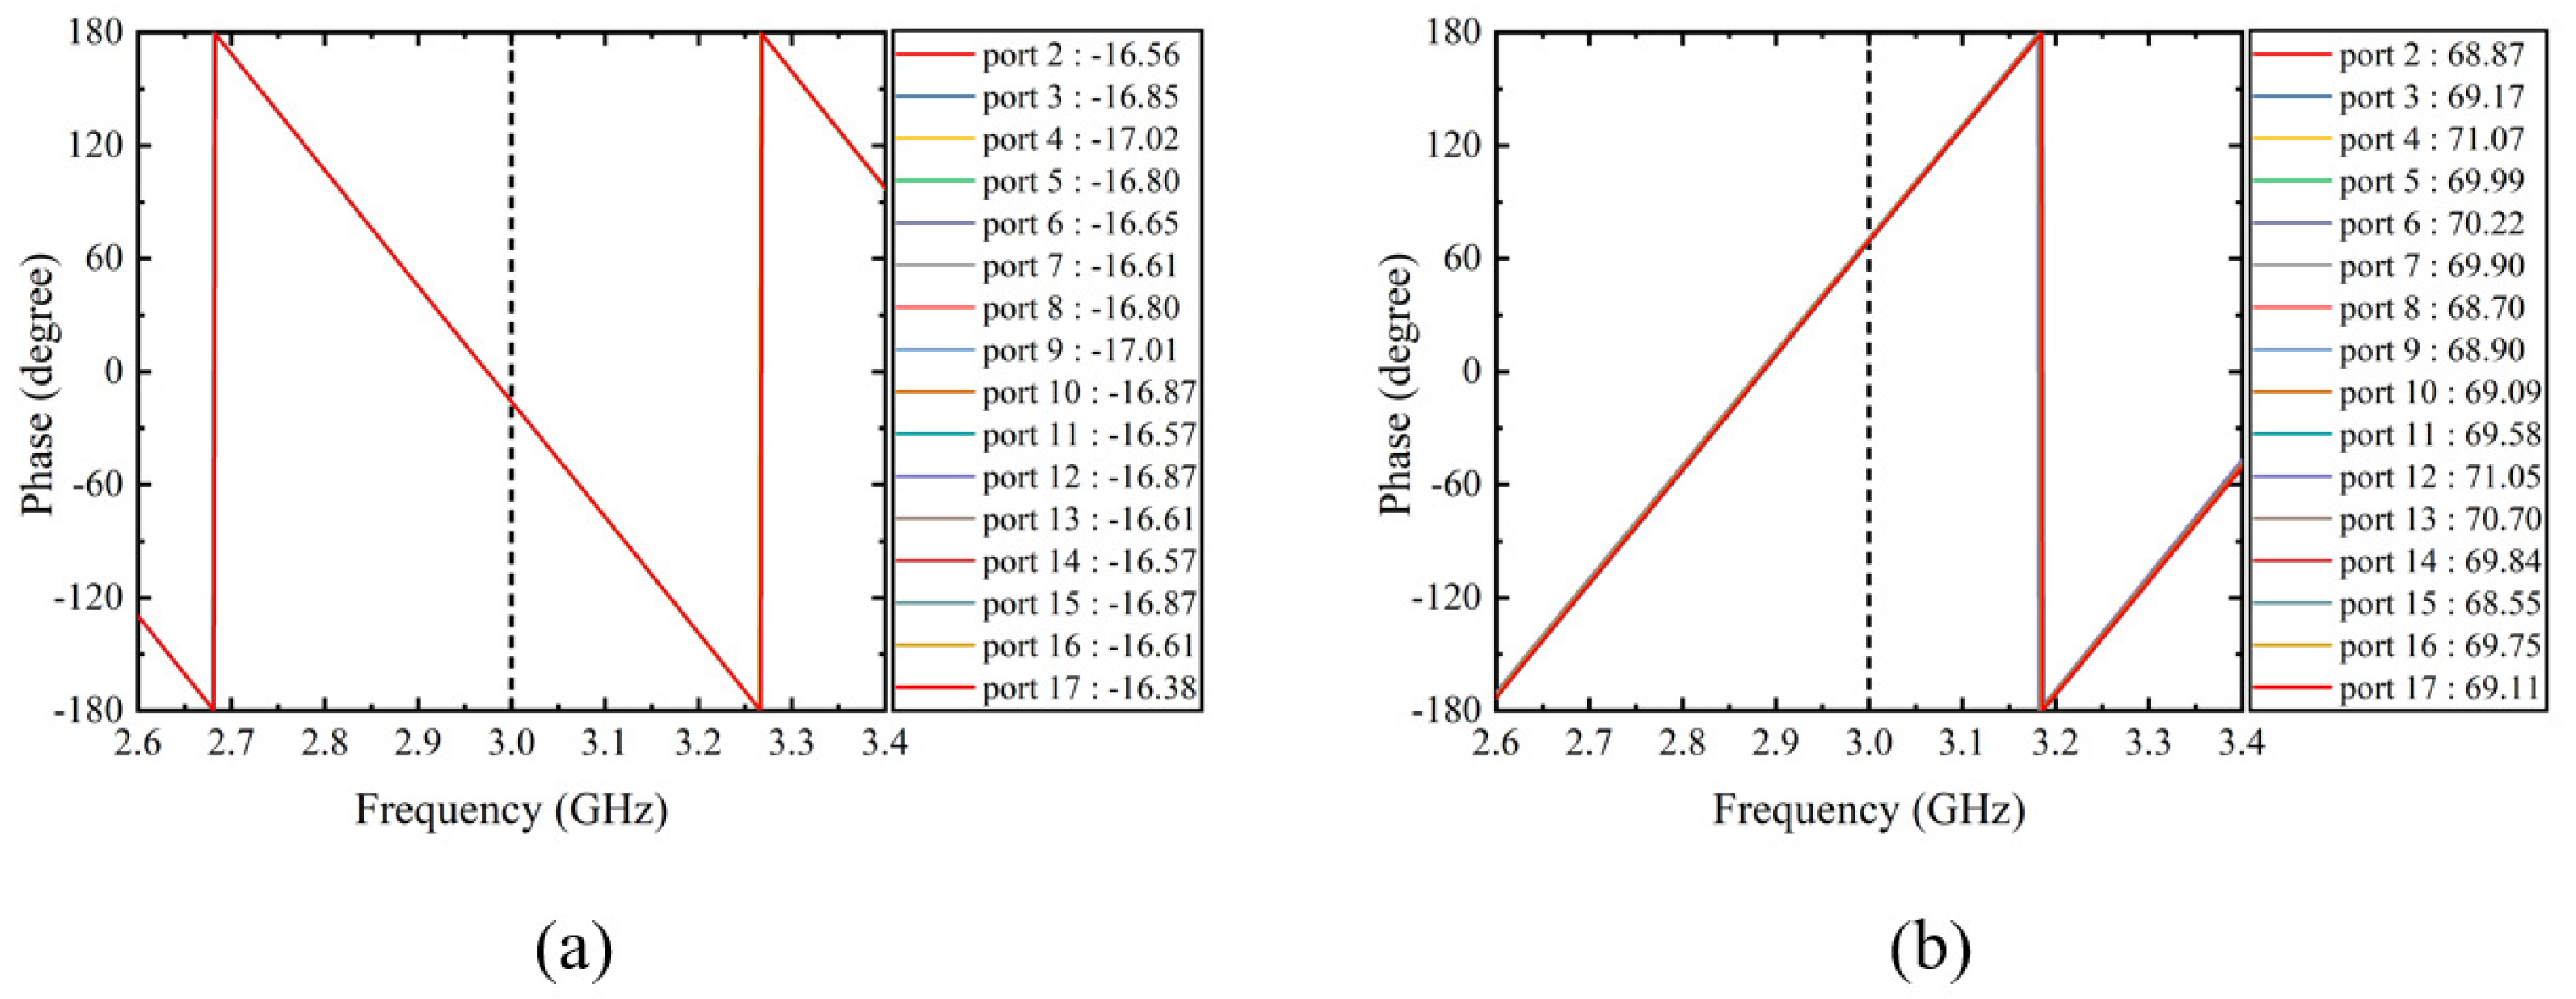
3.1. Phase Calculation for Electronic Beam Steering

In the previous section, we designed the antenna for the radar system. In this section, we will design a power divider. In a radar system, each element of the antenna array must be supplied with the same power to minimize mutual interference and improve accuracy. In a radar system that is actually in operation, a power amplifier exists for each channel. Through this, the same power is supplied. Additionally, the amplitude can be adjusted for beam steering. However, since this paper will conduct a simple beam steering test, a power divider that can apply the same voltage to each antenna element is sufficient. The designed power divider must minimize the phase difference between each output port. If you use such a carefully designed power distributor, you can secure an ideal beam pattern during frontal steering. Basically, the power divider is designed in the form of a power of 2 to make it easier to match the impedance of the feed line and is widely used as a method of minimizing the phase difference between output ports. Additionally, because the voltage is divided in half, there is almost no voltage difference between each port. To ensure smooth impedance matching between the input and output of the power divider, the power divider was designed considering the Quarter Wave Transformer (QWT). QWT was inserted into the part where each feed line is divided into two branches. Since the antenna array of the radar system covered in this experiment is 4 × 4, a 16-channel power divider was designed. The designed power divider is shown in Figure 8a. The power divider actually manufactured based on this is shown in Figure 8b.
First, a simulation was performed to measure the phase of each port. The phase of each port is shown in Figure 9a. At 3.0 GHz, the phase difference between ports was approximately 0 . 5 , which was almost non-existent. The phase difference of the actually manufactured power divider is shown in Figure 9b. The phase differences between the simulation results and the actually measured power distributor ports are all about 0 . 5 , which is similar to the simulation results. The gain (dB) of the measured output ports can be obtained through simple calculation by extracting the real and magnitude values separately. Figure 10a is the result of simulating the gain of each port. It can be seen that the remaining values, except for S 11 , have the same power distribution of approximately −12.7 dB. Figure 10b is the result of actually measuring the gain of each port. Likewise, it can be seen that the power is distributed almost equally for the remaining values, except for S 11 , at about −12.8 dB.

3.2. Phase Calculation for Electronic Beam Steering

There are two primary methods for beam steering in radar systems: mechanical beam steering and electronic beam steering. Mechanical beam steering involves physically rotating the antenna to align it with the desired beam steering angle. However, this method requires separate manufacturing of rotating components, leading to increased system size and slower mechanical movement. On the other hand, electronic beam steering adjusts the beam pattern by applying varying phase and amplitude differences to each element of the array antenna. This method enables faster beam steering compared to mechanical methods, and since the antenna remains fixed, there is no need for additional mechanical parts. Consequently, electronic beam steering offers the advantage of reducing system size and enabling real-time beam steering. In this paper, we propose implementing an Active Electronically Scanned Array (AESA) using phase differences. While conventional radar systems adjust phase and amplitude through phase shifters and power amplifiers for each channel, our experiment focuses solely on creating phase differences to verify the performance of Frequency Selective Surfaces (FSS) within the AESA.
First, a power divider will be utilized to ensure uniform amplitude distribution across all channels. Subsequently, the signal will be transmitted to each antenna via coaxial cables. To adjust the phase, the simplest approach is to manipulate the electrical distance, thereby altering the phase at the desired frequency. Consequently, the length of the coaxial cable between the power distributor and the antenna is adjusted accordingly to achieve the desired phase. Through simulation and measurement, it was verified that the Frequency Selective Surface (FSS) designed in the preceding section is capable of beam steering up to 30 . Therefore, to achieve a 30 beam steering angle, the incident phase on each antenna element needs to be calculated. The Array Factor of Planar Array, denoted by Equation (11), can be rearranged by isolating the common variable I 0 , leading to Equation (12). Further manipulation employing Euler’s formula results in Equation (13). Subsequently, Equation (14) represents Ψ x , while Equation (15) represents Ψ y .
By changing the formula in this manner, you can obtain the phase difference based on the desired azimuth and elevation angles, provided that you know the spacing between antenna elements on the x-axis and y-axis. Reversing Equations (14) and (15), you can determine that the phase difference of the coaxial cable to be used is approximately 108°. The type of cable selected is the RMF-085 model, a multi-flexible cable. Considering the impedance characteristics of the corresponding coaxial cable, the electrical length can be calculated for each antenna line. The resulting length difference is approximately 21 mm. This indicates that by adjusting the cable length by ±21 mm relative to the reference cable, a phase difference of 108° can be achieved.
A F = n = 1 N I 1 n m = 1 M I m 1 e j ( m 1 ) ( k d x sin θ cos π + β x ) e j ( n 1 ) ( k d y sin θ cos π + β y )
A F = I 0 m = 1 M e j ( m 1 ) ( k d x sin θ cos π + β x ) n = 1 N e j ( n 1 ) ( k d y sin θ cos π + β y )
A F n ( θ , Ψ ) = ( 1 M sin M 2 Ψ x sin Ψ x 2 ) ( 1 N sin M 2 Ψ y sin Ψ y 2 )
Ψ x = k d x sin θ cos π + β x
Ψ y = k d y sin θ cos π + β y

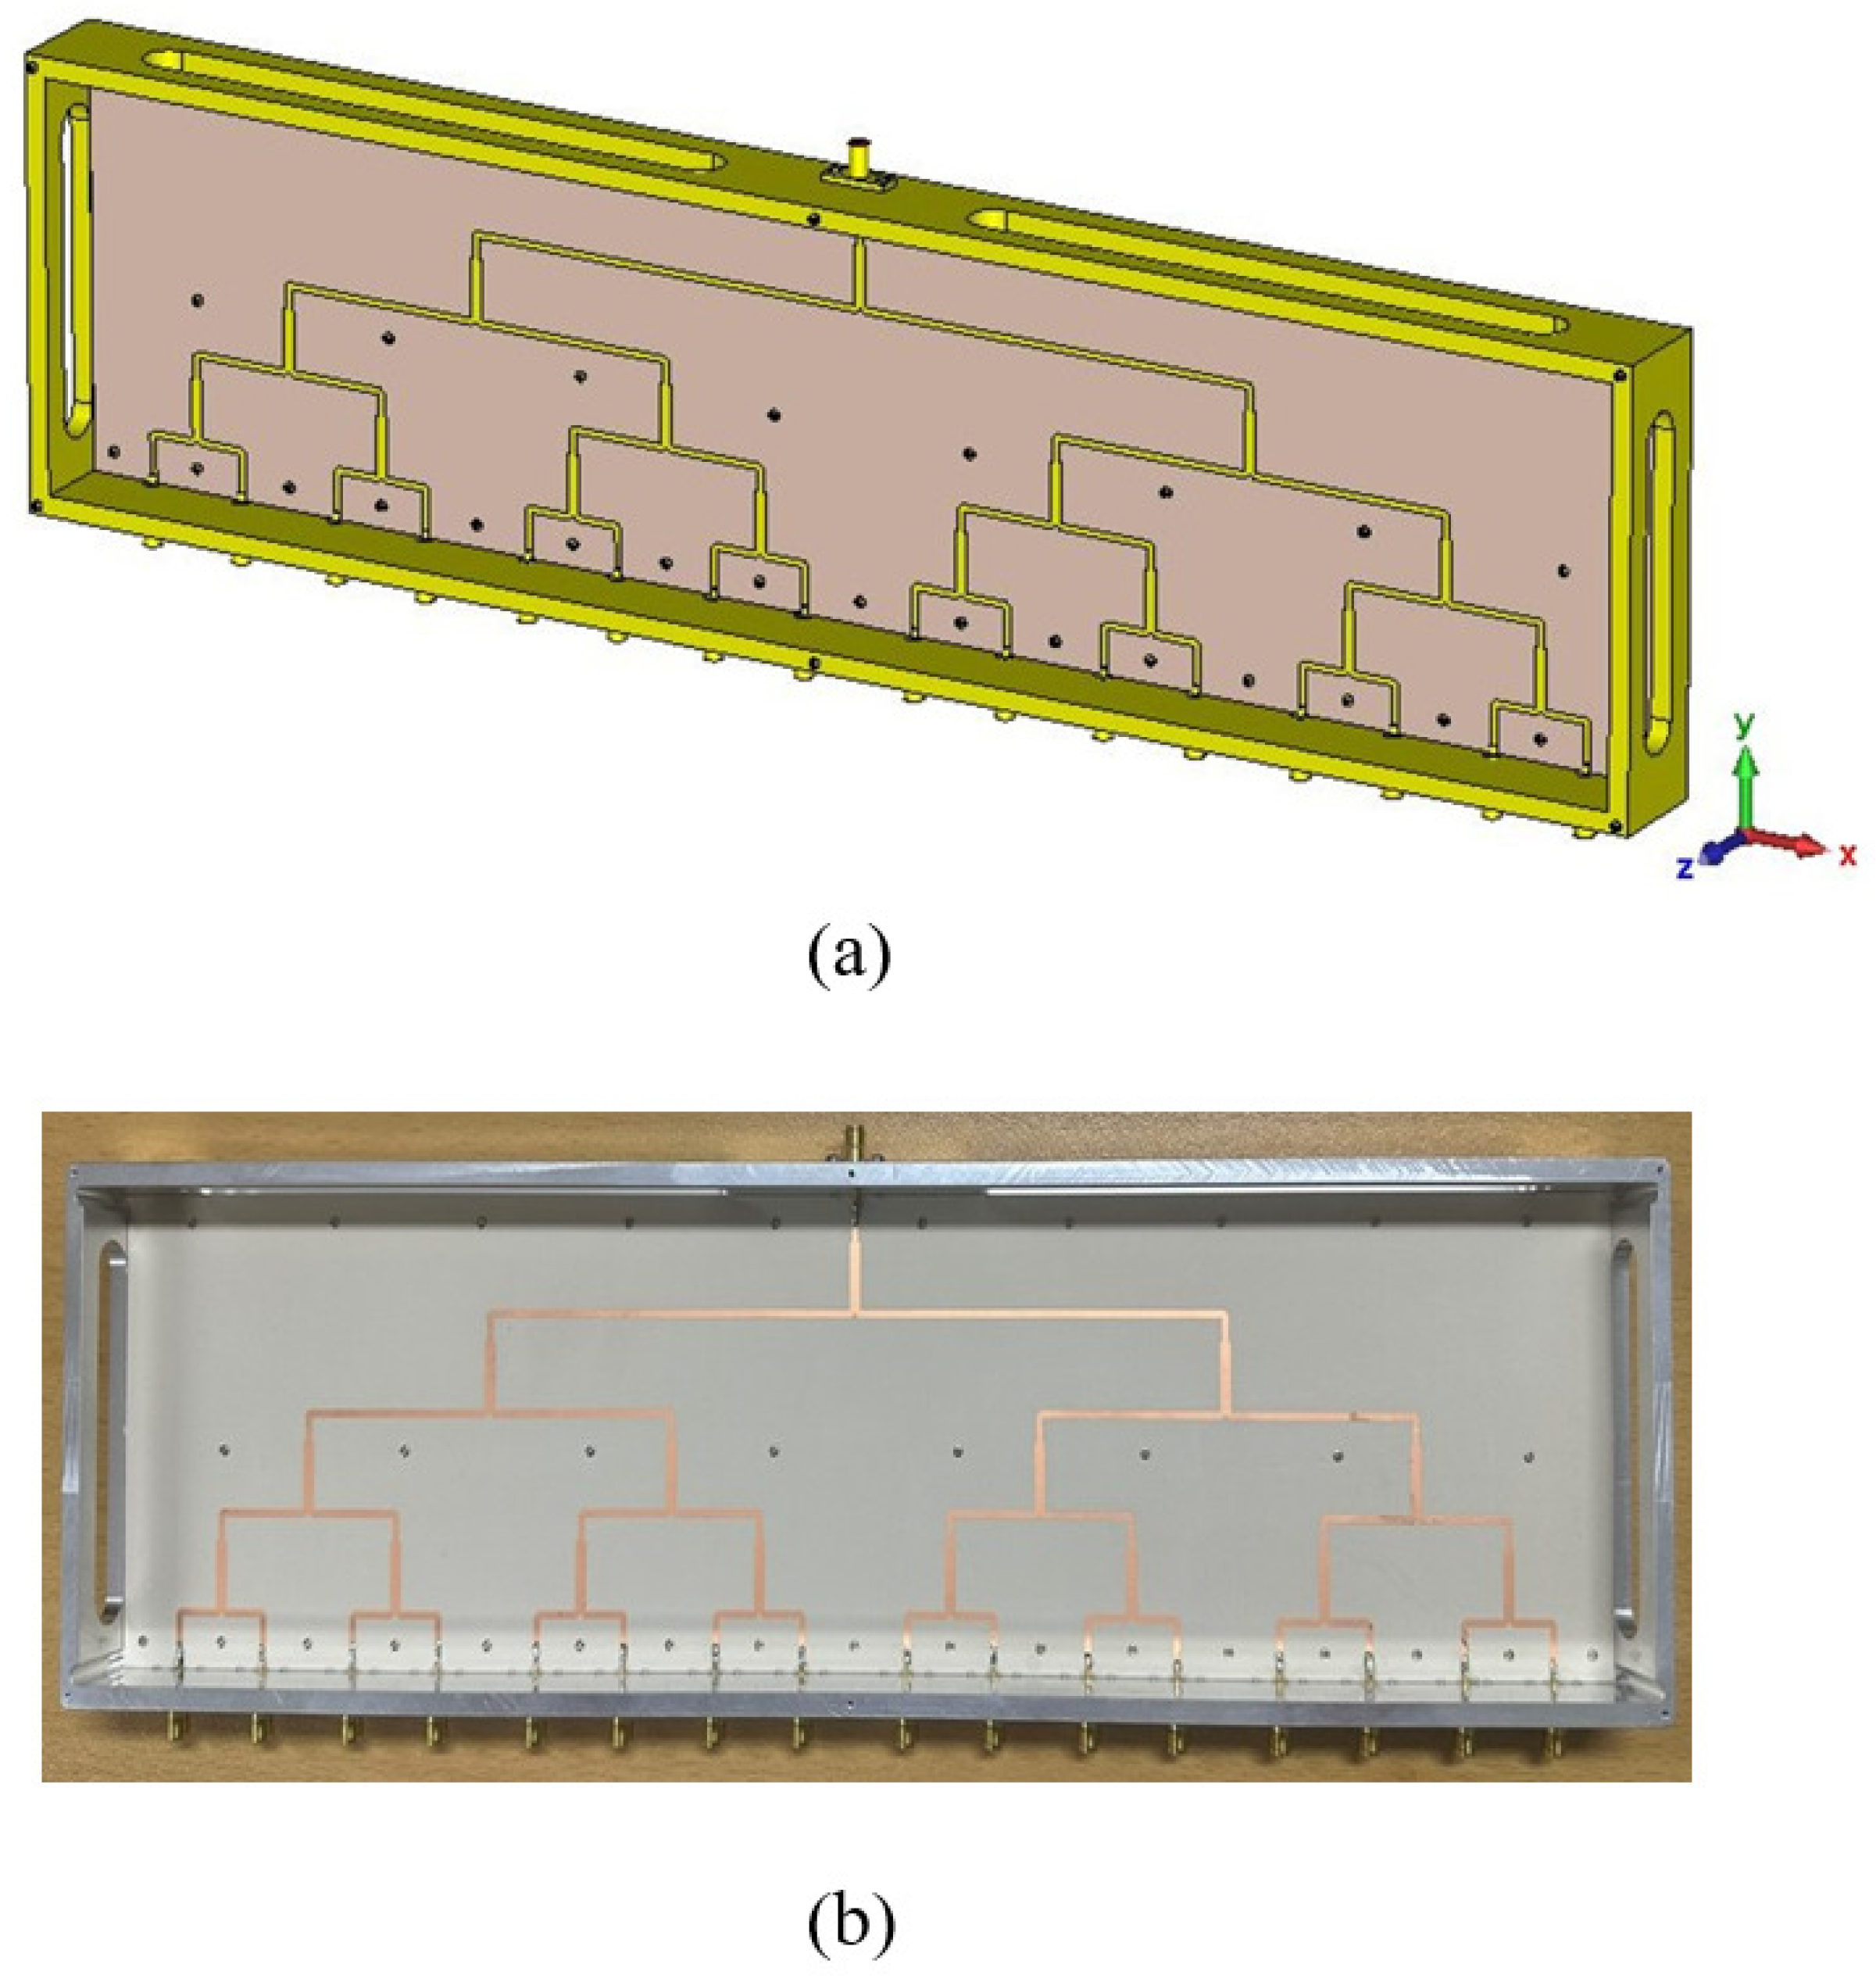
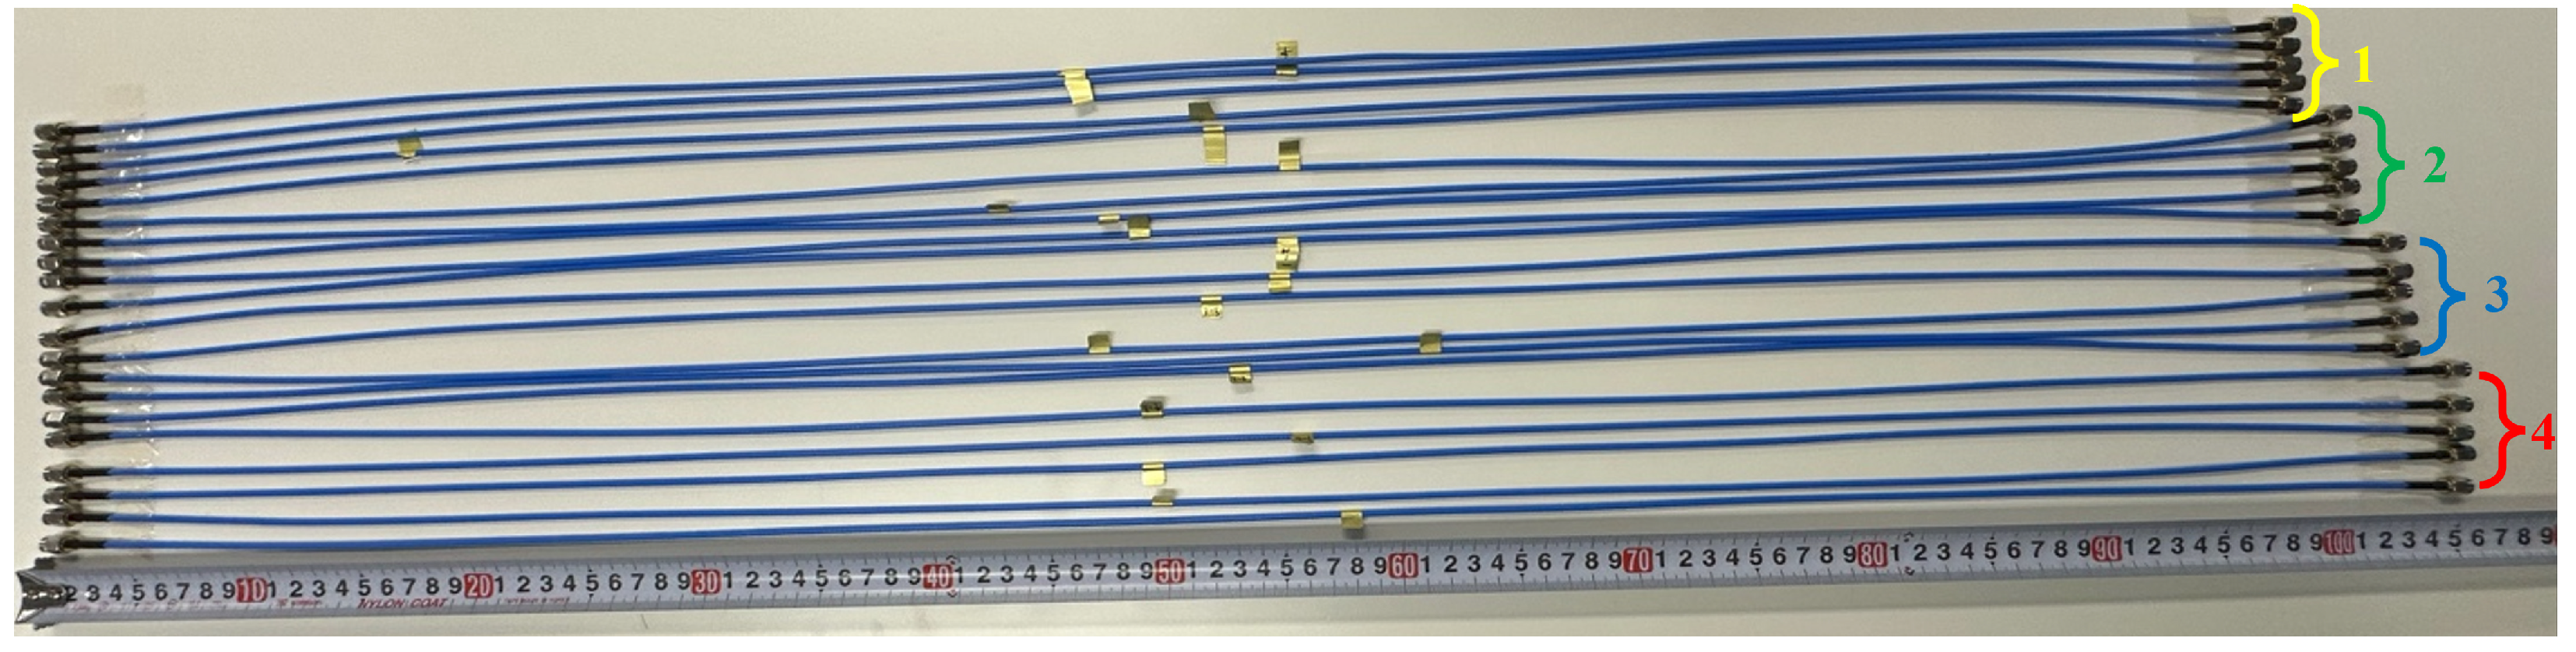
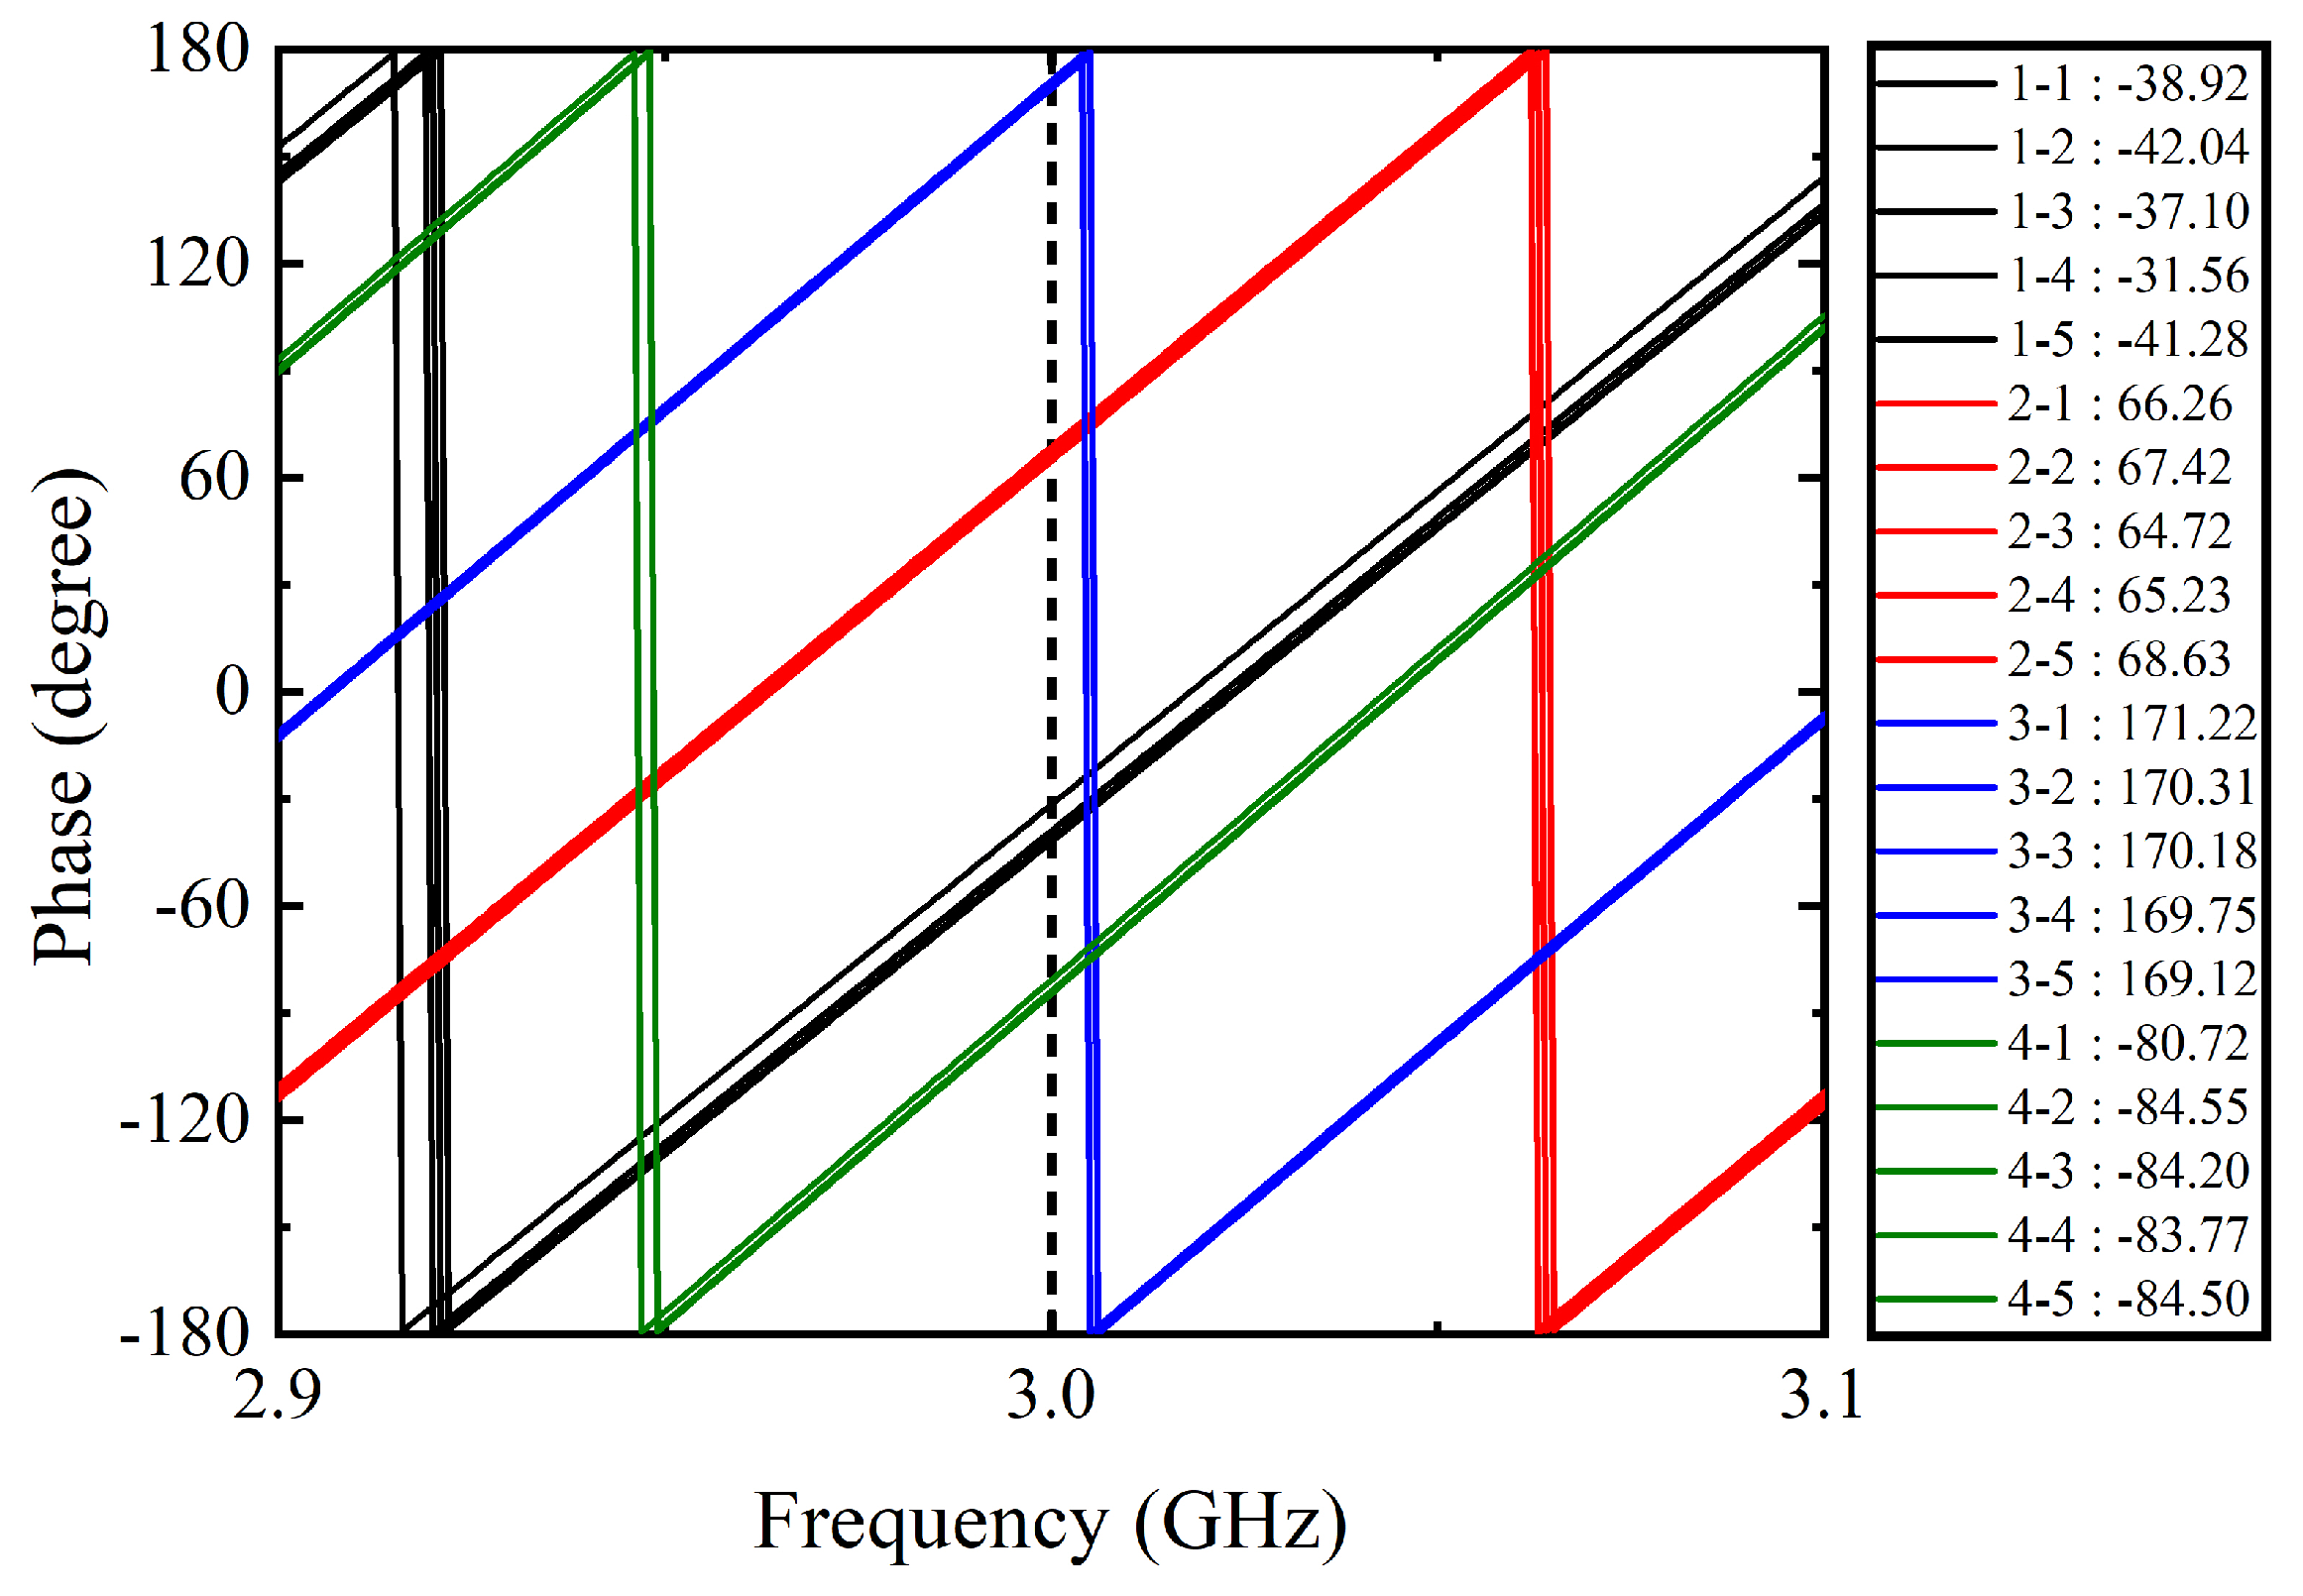
3.3. Measured Result Analysis of the Fabricated Coaxial Cable

The 4 × 4 array antenna designed for the experiment features uniform element spacing on both the X and Y axes, enabling the utilization of the same cables for azimuth and elevation beam steering tests. The cables were manufactured at lengths of 1021 mm, 1042 mm, and 1063 mm, relative to a reference length of 1000 mm. The manufactured coaxial cable is depicted in Figure 11. To validate the accuracy of the manufactured cables, each phase was computed using a Vector Network Analyzer (VNA). The calculated phases are presented in Figure 12. Notably, there exists a deviation of approximately 3 across each batch. While this may introduce some degree of inaccuracy in beam steering outcomes, it is deemed negligible for the small-scale 4 × 4 array employed in this paper. Consequently, the phase was adjusted accordingly using the respective cables.

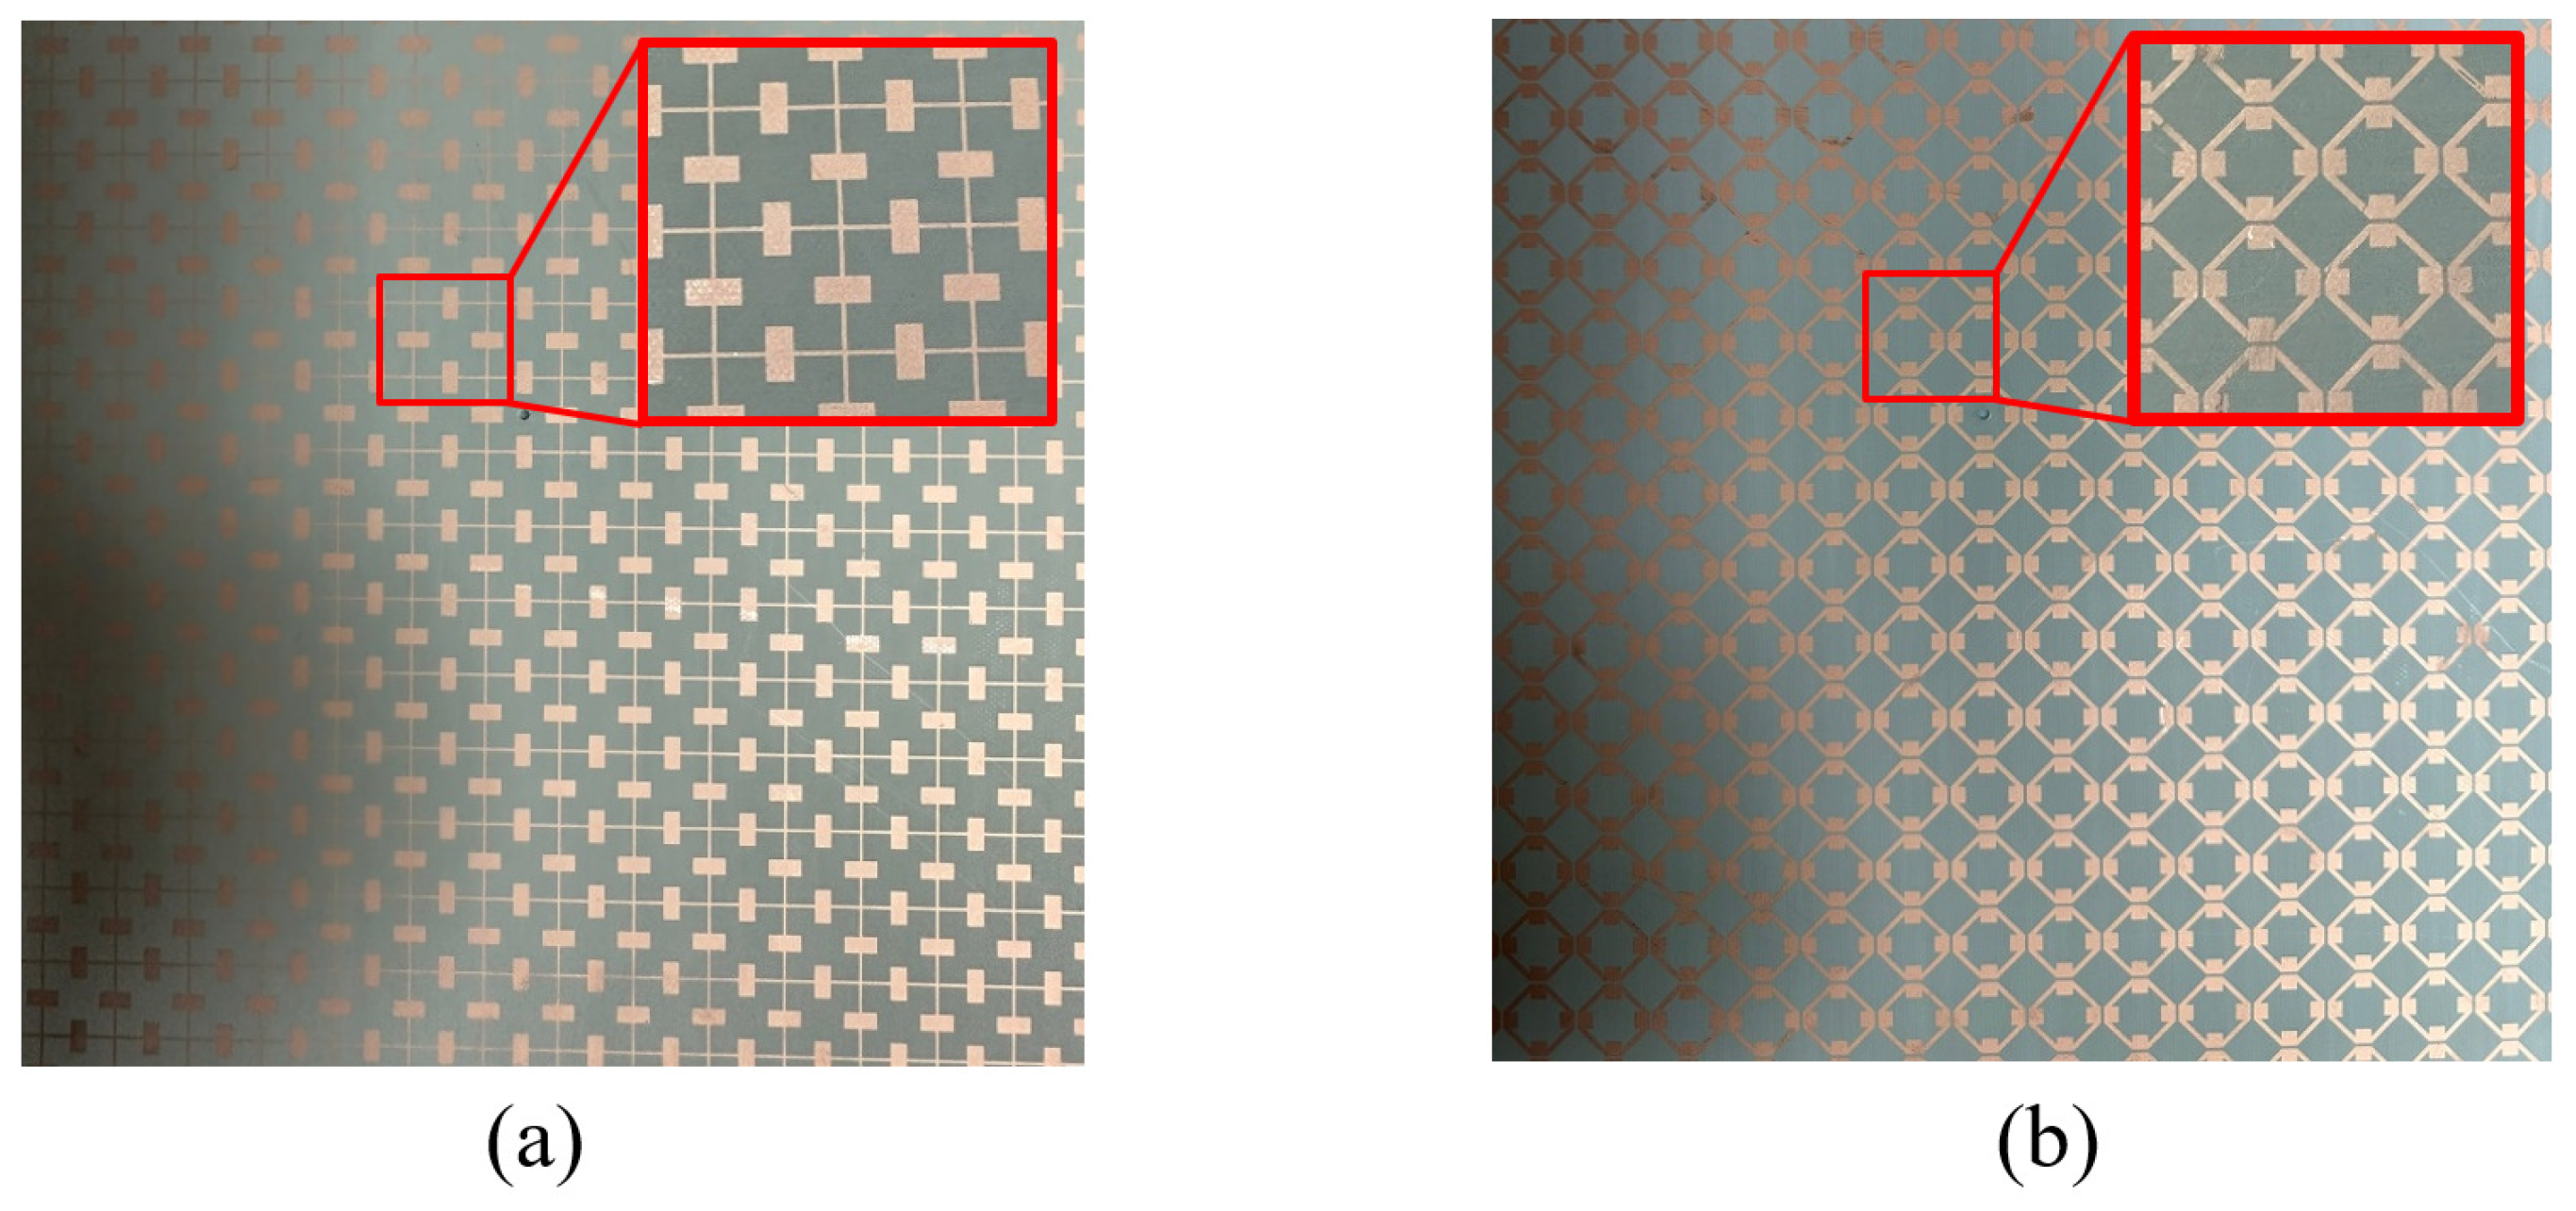
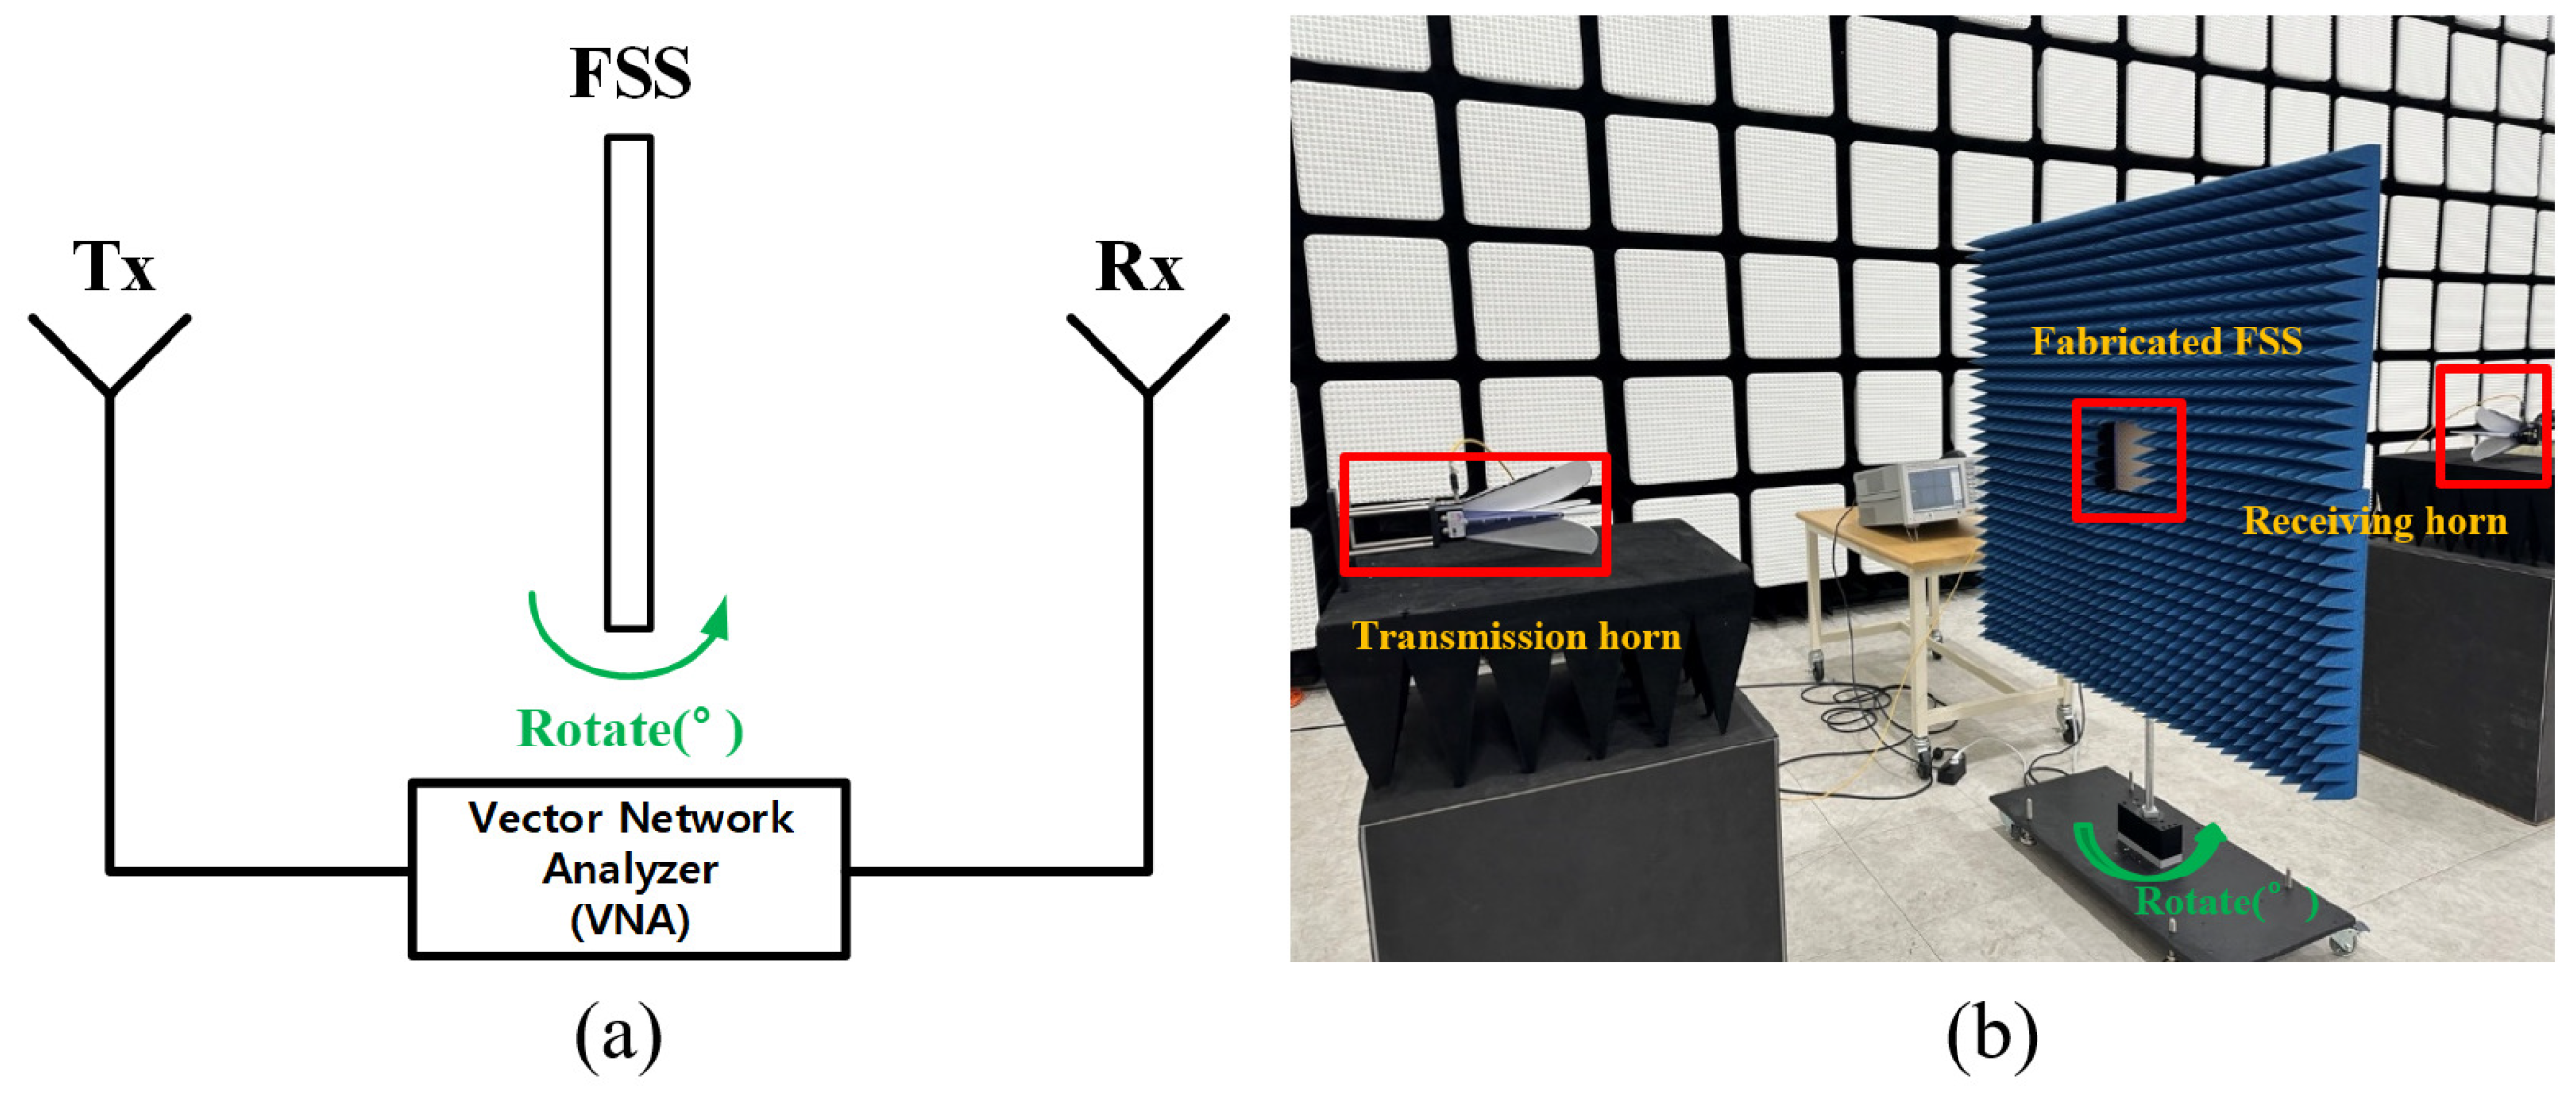
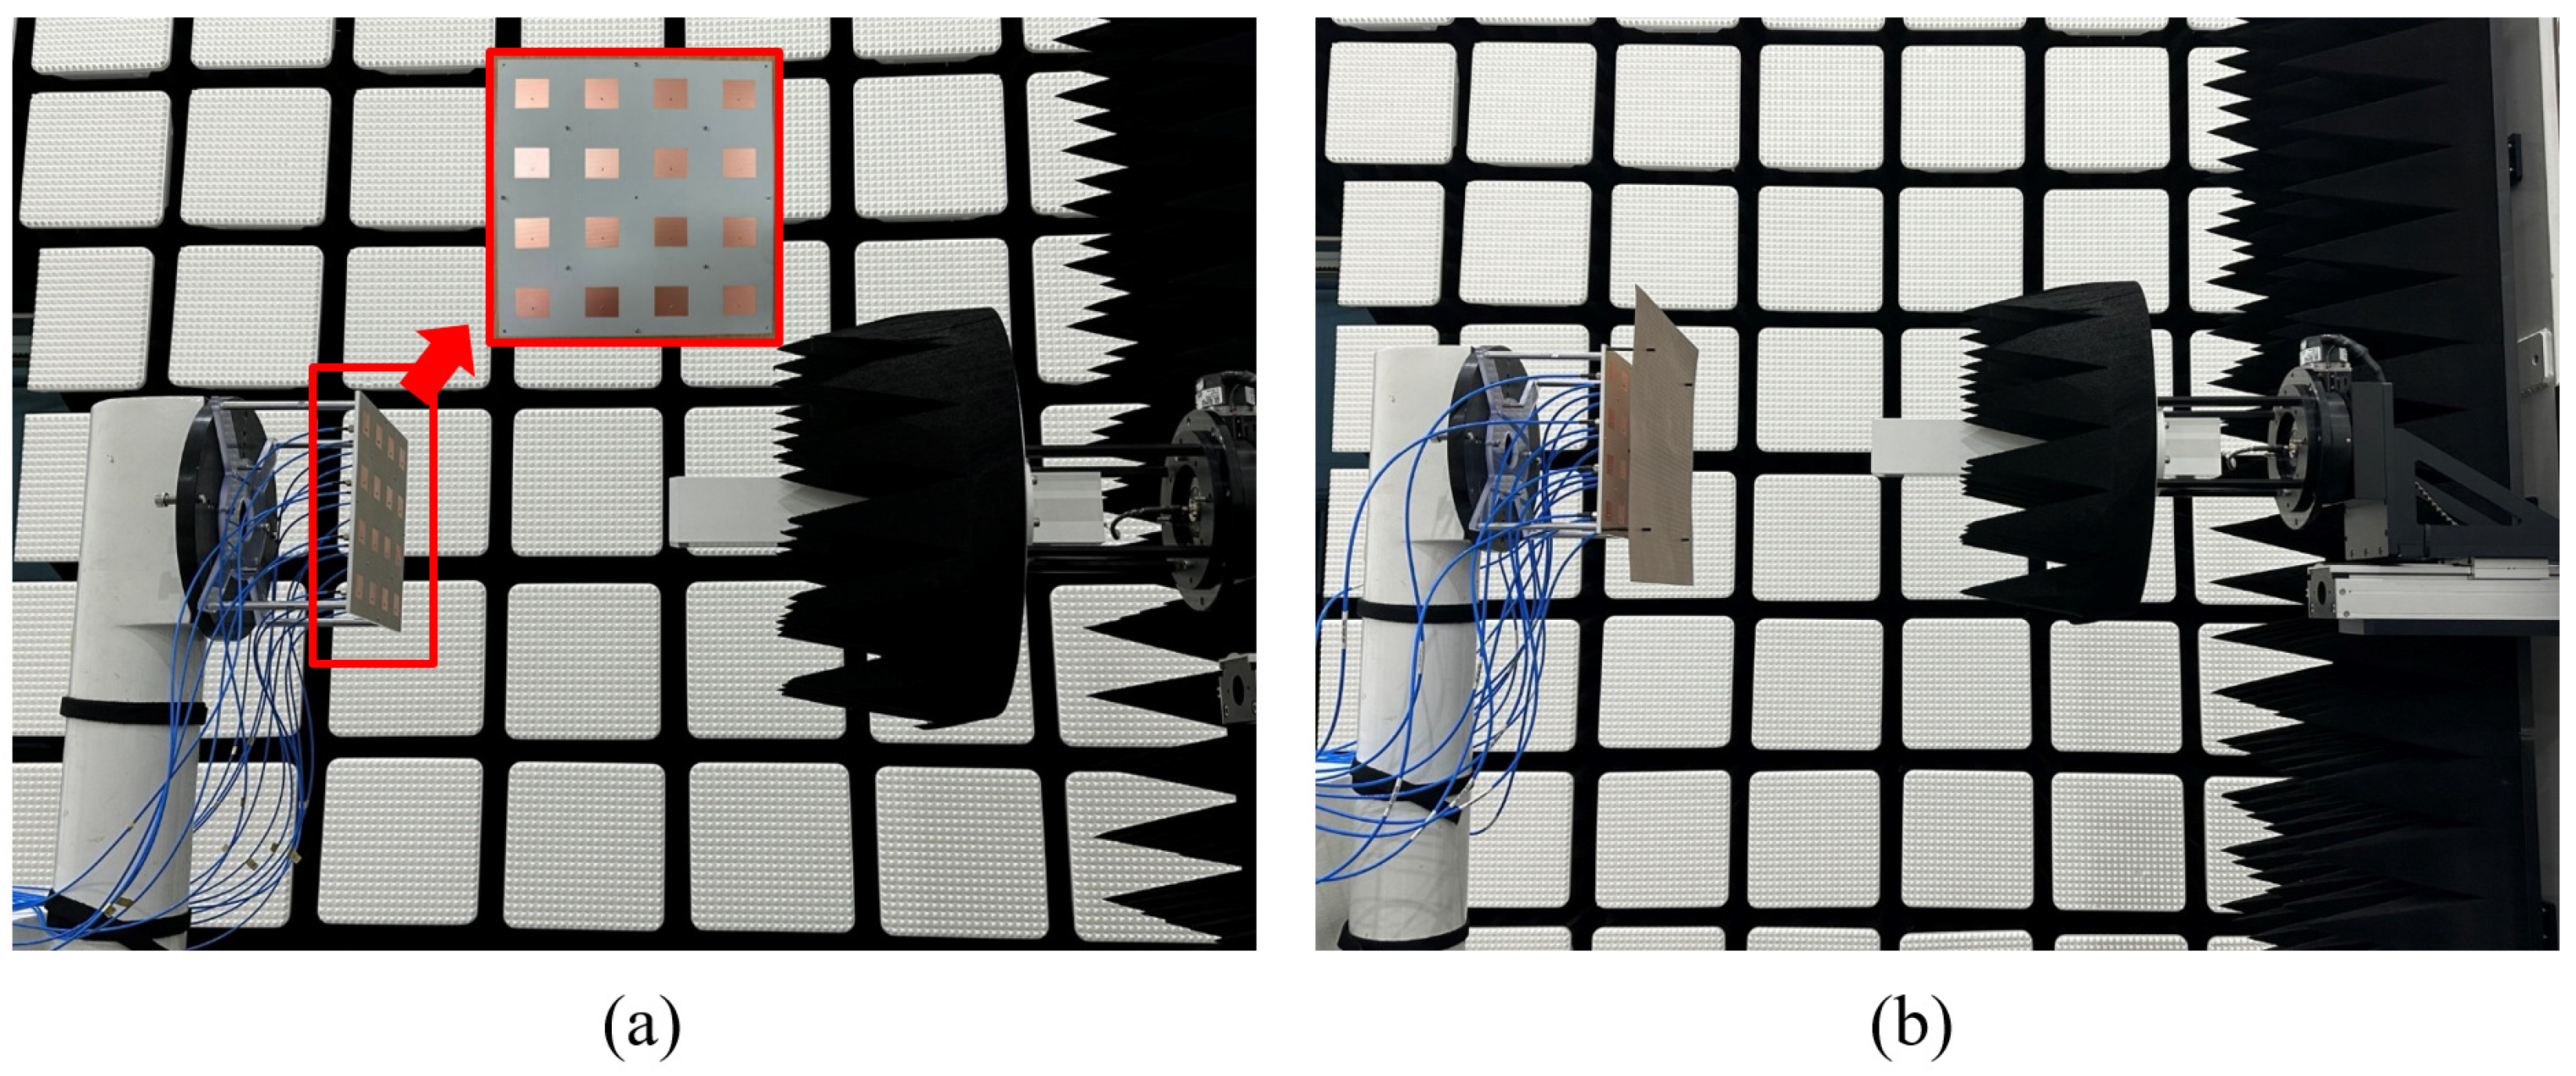
4. Measured Result Analysis of the Proposed FSS

To check whether the FSS operates as a BPF or BSF when attached to an actual radar system, a 4 × 4 array patch antenna with an operating frequency of 3.0 GHz was designed. The manufactured FSS was suspended in the air at a distance of 50 mm (0.5 λ ) above the array antenna with a Teflon post. To measure the radiation pattern and gain of the array patch antenna with the FSS, measurements were conducted in an anechoic near-field chamber. The measurements were performed using the near-field measurement method, and the beam pattern was confirmed using a near-field-to-far-field conversion method. The measurement environment is shown in Figure 13a when the FSS does not exist and in Figure 13b when the FSS exists. To ensure the reliability of the experimental results, repeated and comparative experiments were conducted. Multiple measurements were performed under identical conditions to assess the consistency and reproducibility of the data. The results from these repeated experiments were compared to ensure that the variations were within acceptable limits. Comparative experiments were also carried out by measuring the performance of the antenna system with and without the FSS and by comparing the experimental results with theoretical predictions and simulations.
Figure 14a shows the radiation pattern measured at 3.0 GHz. The maximum gain without the FSS was 17.25 dB, and with the FSS, the maximum gain was 17.12 dB. This shows that the FSS operated correctly using a band-pass filter. Figure 14b shows the maximum gain for each frequency near the operating frequency range. Measurement and simulation results showed similar trends not only at the operating frequency of 3.0 GHz but also in the remaining frequency bands. Figure 15a is the radiation pattern measured at 6.0 GHz. When the FSS is not present, the maximum gain is about 12.79 dB, and when present, the maximum gain is 2.69 dB, which is reduced by 10.1 dB due to the FSS. These results show that the FSS suppresses harmonics. Electronic beam steering was implemented using an array antenna to confirm the wide-angle beam steering characteristics of the FSS. To implement electronic beam steering, there must be a phase difference between each port. The phase at 3.0 GHz was adjusted by modifying the length of the coaxial cable connecting the power divider to the port. Figure 16a shows the radiation pattern during the 30 azimuth beam steering. The maximum gain during steering at an azimuth of 30 is 16.13 dB without the FSS and 16.68 dB with the FSS. Figure 16b shows the radiation pattern during the 30 elevation beam steering. The maximum gain when steering at 30 of elevation is 15.74 dB without the FSS and 15.90 dB with the FSS.

5. Results

In this study, we proposed and investigated a Frequency Selective Surface (FSS) with harmonic suppression and wide-angle beam steering characteristics. The FSS design integrated a grid structure for band-pass filter characteristics and a loop structure for band-stop filter characteristics, both implemented on a dielectric substrate. The proposed FSS aimed to suppress unwanted harmonics while maintaining efficient signal transmission at the desired operational frequencies.
Extensive parameter sweep studies were conducted to understand the influence of various design parameters on the performance of the FSS. It was observed that increasing the width between patches ( w 1 ) led to a higher resonant frequency of the operating band due to the reduction in grid capacitance ( C g r i d ). Similarly, increasing the inductance (L) resulted in a higher resonant frequency, attributed to a decrease in grid inductance ( L g r i d ). In the harmonic band, increasing the loop thickness ( w 5 ) caused the harmonic resonant frequency to shift to a lower frequency, which was due to an increase in loop inductance ( L l o o p ). These findings were critical in fine-tuning the FSS design for optimal performance. Regarding the substrate parameters, increasing the dielectric constant shifted the overall resonant frequency to a lower range, whereas decreasing the dielectric constant caused a shift to a higher frequency. Additionally, increasing the substrate thickness resulted in a higher overall resonant frequency, while reducing the thickness shifted the resonance to a lower frequency. These substrate effects were carefully considered to minimize transmission loss and achieve the desired filtering characteristics. To validate the performance of the proposed FSS, a series of measurements were conducted using a 4 × 4 array patch antenna operating at 3.0 GHz. The FSS was positioned above the array antenna, and measurements were taken in an anechoic near-field chamber. The results demonstrated that the FSS operated correctly as a band-pass filter at 3.0 GHz, with minimal transmission loss and effective suppression of harmonics at 6.0 GHz.
Repeated and comparative experiments were performed to ensure the reliability and consistency of the experimental results. Multiple measurements under identical conditions confirmed the reproducibility of the data, and comparative experiments validated the performance of the antenna system with and without the FSS. The experimental findings were cross-verified with theoretical models and simulations, which further confirmed the accuracy and credibility of the results. The measured radiation patterns and maximum gain values indicated that the FSS maintained efficient signal transmission while effectively suppressing harmonics. The 2D radiation pattern and maximum gain were measured during steering in the boresight, azimuth ( 30 ), and elevation ( 30 ) directions. At 3.0 GHz, the maximum gain in boresight was 17.25 dB without the FSS and 17.12 dB with the FSS. At 6.0 GHz, the maximum gain was 12.79 dB without the FSS and 2.69 dB with the FSS, demonstrating harmonic suppression of 10.1 dB. Furthermore, the proposed FSS exhibited wide-angle beam steering capabilities, validated through electronic beam steering experiments. The phase adjustments for beam steering were achieved by modifying the length of the coaxial cables, and the results showed consistent performance across different steering angles. The maximum gain during azimuth steering at 30 was 16.13 dB without the FSS and 16.68 dB with the FSS, while during elevation steering at 30 , it was 15.74 dB without the FSS and 15.90 dB with the FSS. Table 3 shows that this paper demonstrates superior research results, as it maintains beam steering characteristics while having the lowest insertion loss compared to other studies.
Although the designed FSS demonstrated effective harmonic suppression and wide-angle beam steering in radar systems, this study has several limitations and suggests directions for future research. Firstly, the current study focused on a single frequency band (3.0 GHz for operation and 6.0 GHz for harmonics). Future research could explore optimizing FSS structures for multi-band applications, broadening the technology’s applicability in more diverse communication systems. Additionally, the FSS was tested under controlled conditions, and further studies should evaluate its performance in more complex environments, such as urban or highly reflective settings, to ensure robustness and reliability in practical applications.
Moreover, while this study has demonstrated the effectiveness of FSS in radar systems, future research could investigate using FSS to reduce interference between base stations in cellular networks, decrease the Radar Cross Section (RCS) of stealth aircraft, or enhance indoor communication quality in commercial office buildings. By addressing these limitations and exploring these future research directions, the potential applications and performance of FSS can be significantly enhanced, paving the way for more efficient and versatile electromagnetic wave control solutions in various fields.

Author Contributions

Conceptualization, D.H.H. and K.C.H.; methodology, D.H.H.; software, D.H.H.; validation, D.H.H.; formal analysis, D.H.H. and K.C.H.; investigation, D.H.H. and T.J.; measurement D.H.H., J.H.K., and T.J.; resources, D.H.H.; data curation, D.H.H.; draft preparation, D.H.H.; writing—review and editing, D.H.H. and K.C.H.; supervision, K.C.H.; project administration, K.C.H.; funding acquisition, K.C.H. All authors have read and agreed to the published version of the manuscript.

Funding

This research was supported by the Challengeable Future Defense Technology Research and Development Program through the Agency for Defense Development (ADD) funded by the Defense Acquisition Program Administration (DAPA) in 2023 (No.912902601).

Institutional Review Board Statement

Not applicable.

Informed Consent Statement

Not applicable.

Data Availability Statement

The data presented in this study are available in the article.

Conflicts of Interest

The authors declare no conflicts of interest.

References

  1. Curlander, J.C.; McDonough, R.N. Synthetic Aperture Radar: Systems and Signal Processing, 1st ed.; John Wiley, Inc.: Hoboken, NJ, USA, 1991. [Google Scholar]
  2. Skolnik, M. Introduction to Radar Systems; McGraw-Hill Education: New York, NY, USA, 2001. [Google Scholar]
  3. Harger, R.O. Harmonic radar systems for near-ground in-foliage nonlinear scatterers. IEEE Trans. Aerosp. Electron. Syst. 1976, 12, 230–245. [Google Scholar]
  4. Aniktar, H.; Baran, D.; Karav, E.; Akkaya, E.; Birecik, Y.S.; Sezgin, M. Getting the bugs out: A portable harmonic radar system for electronic countersurveillance applications. IEEE Microw. Mag. 2015, 16, 40–52. [Google Scholar] [CrossRef]
  5. Mazzaro, G.J.; Martone, A.F.; Ranney, K.I.; Narayanan, R.M. Nonlinear Radar for Finding RF Electronics: System Design and Recent Advancements. IEEE Trans. Microw. Theory Tech. 2017, 65, 1716–1726. [Google Scholar]
  6. Yun, J.; Trinh-Van, S.; Park, J.Y.; Yang, Y.; Lee, K.Y.; Hwang, K.C. Cavity-Backed Patch Filtenna for Harmonic Suppression. IEEE Access 2020, 8, 221580–221589. [Google Scholar] [CrossRef]
  7. Jeong, T.; Lee, J.S.; Lee, D.G.; Kim, J.H.; Park, J.; Hwang, D.H.; Hwang, K.C. Quasi-Isotropic Hybrid Dielectric Resonator Antenna—Bow-Tie Patch with Harmonic Suppression. Appl. Sci. 2022, 12, 3842. [Google Scholar] [CrossRef]
  8. Zhang, J.; Zhu, L.; Wu, Q.; Liu, N.; Wu, W. A Compact Microstrip-Fed Patch Antenna With Enhanced Bandwidth and Harmonic Suppression. IEEE Trans. Antennas Propag. 2016, 64, 5030–5037. [Google Scholar] [CrossRef]
  9. Liu, Z.X.; Zhu, L.; Liu, N.W. A Compact Omnidirectional Patch Antenna With Ultrawideband Harmonic Suppression. IEEE Trans. Antennas Propag. 2020, 68, 7640–7645. [Google Scholar] [CrossRef]
  10. Munk, B.A. Frequency Selective Surfaces: Theory and Design; John Wiley, Inc.: New York, NY, USA, 2000. [Google Scholar]
  11. Sheng, X.-J.; Fan, J.-J.; Liu, N.; Zhang, C.-B. A miniaturized dual-band FSS with controllable frequency resonances. IEEE Microw. Wirel. Components Lett. 2017, 27, 915–917. [Google Scholar] [CrossRef]
  12. Wu, W.J.; Mo, Y.; Chen, L.; Wang, C.; Ni, C. Design of a FSS Radome with High Harmonic Emission Suppression. In Proceedings of the 2019 International Symposium on Antennas and Propagation (ISAP), Xi’an, China, 27–30 October 2019; pp. 1–3. [Google Scholar]
  13. Yu, S.; Kou, N.; Ding, Z.; Zhang, Z. Harmonic-Absorption Frequency Selective Rasorber Based on Non-Resonant FSS and Resistive-Sheet. IEEE Trans. Microw. Theory Tech. 2021, 69, 3737–3745. [Google Scholar] [CrossRef]
  14. Yang, X.; Luyen, H.; Xu, S.; Behdad, N. Design Method for Low-Profile, Harmonic-Suppressed Filter-Antennas Using Miniaturized-Element Frequency Selective Surfaces. IEEE Antennas Wirel. Propag. Lett. 2019, 18, 427–431. [Google Scholar] [CrossRef]
  15. Marcuvitz, N. Waveguide Handbook; Peregrinus: Stevenage, UK, 1986. [Google Scholar]
  16. Luukkonen, O.; Simovski, C.; Granet, G.; Goussetis, G.; Lioubtchenko, D.; Raisanen, A.V.; Tretyakov, S.A. Simple and accurate analytical model of planar grids and high-impedance surfaces comprising metal strips or patches. IEEE Trans. Antennas Propag. 2008, 56, 1624–1632. [Google Scholar] [CrossRef]
  17. Lee, C.K.; Langley, R.J. Equivalent-circuit models for frequency selective surfaces at oblique angles of incidence. IEE Proc. H-Microwaves Opt. Antennas 1985, 132, 395–399. [Google Scholar] [CrossRef]
  18. Langley, R.J.; Parker, E.A. Equivalent circuit model for arrays of square loops. Electron. Lett. 1982, 18, 294–296. [Google Scholar] [CrossRef]
Figure 1. Configuration of the proposed grid structure: (a) equivalent circuit model, (b) frequency selective surface grid design.
Applsci 14 06633 g001
Figure 2. Configuration of the proposed loop structure: (a) equivalent circuit model (b) frequency selective surfaces loop design.
Applsci 14 06633 g002
Figure 3. Equivalent circuit model for a band-pass filter and band-stop filter.
Applsci 14 06633 g003
Figure 4. Photographs of the FSS structures: (a) top view (grid + patch) (b) bottom view (loop).
Applsci 14 06633 g004
Figure 5. Simulation setup: (a) CST unit cell (b) ADS s-parameter.
Applsci 14 06633 g005
Figure 6. S-parameter measurement setup: (a) block diagram, (b) the free space measurement system.
Applsci 14 06633 g006
Figure 7. Comparison of the simulated and measured results: (a) S 11 (b) S 21 .
Applsci 14 06633 g007
Figure 8. A 16-channel power divider: (a) simulation, (b) fabricated.
Applsci 14 06633 g008
Figure 9. Phase difference for each port: (a) simulation, (b) measured.
Applsci 14 06633 g009
Figure 10. Amplitude (dB) difference for each port: (a) simulation (b) measured.
Applsci 14 06633 g010
Figure 11. Fabricated coaxial cable with different lengths.
Applsci 14 06633 g011
Figure 12. Measured phase difference.
Applsci 14 06633 g012
Figure 13. Radiation pattern measurement setup: (a) without FSS, (b) with FSS.
Applsci 14 06633 g013
Figure 14. Comparison of the simulated and measured results: (a) radiation pattern @3.0 GHz, (b) maximum gain.
Applsci 14 06633 g014
Figure 15. Comparison of the simulated and measured results: (a) radiation pattern @6.0 GHz, (b) maximum gain.
Applsci 14 06633 g015
Figure 16. Comparison of the simulated and measured results during beam steering @3.0 GHz: (a) azimuth, (b) elevation.
Applsci 14 06633 g016
Table 1. Optimized design parameters of the proposed FSS (unit: mm).
ParameterValueParameterValue
h0.25 w 3 2
d10.5 w 4 0.3
l0.3 w 5 0.91
w 1 5.9 w 6 0.68
w 2 2.3g3.12
Table 2. Summary of the LC Values for ECM.
ParameterValueParameterValue
L g r i d + p a t c h 68.4 pH C g r i d + p a t c h 7.37 fF
L l o o p 19.6 pH C t o t a l 33.3 pF
Table 3. Comparison of various FSS.
RefFSS Filter TypeUnit Cell Size (Length × Width) [ λ ]HeightInsertion Loss [dB]Harmonic SuppressionBeam Tilting
[11]Dual Band-Pass Filter0.113 × 0.1131 mm0.5N/AAzi, Ele ( 60 )
[12]Band-Stop Filter0.150.16 mm0.5oN/A
[13]Dual Band-Pass Filter0.123 nm0.98oAzi, Ele ( 30 )
[14]Dual Band-Pass Filter0.25.5 mm0.3oAzi, Ele ( 60 )
Proposed WorkBand-Pass, Band-Stop Filter0.1050.25 mm0.12oAzi, Ele ( 30 )
Disclaimer/Publisher’s Note: The statements, opinions and data contained in all publications are solely those of the individual author(s) and contributor(s) and not of MDPI and/or the editor(s). MDPI and/or the editor(s) disclaim responsibility for any injury to people or property resulting from any ideas, methods, instructions or products referred to in the content.

