
The Vibration Response to the High-Pressure Gas Expansion Method: A Case Study of a Hard Rock Tunnel in China


Abstract
1. Introduction
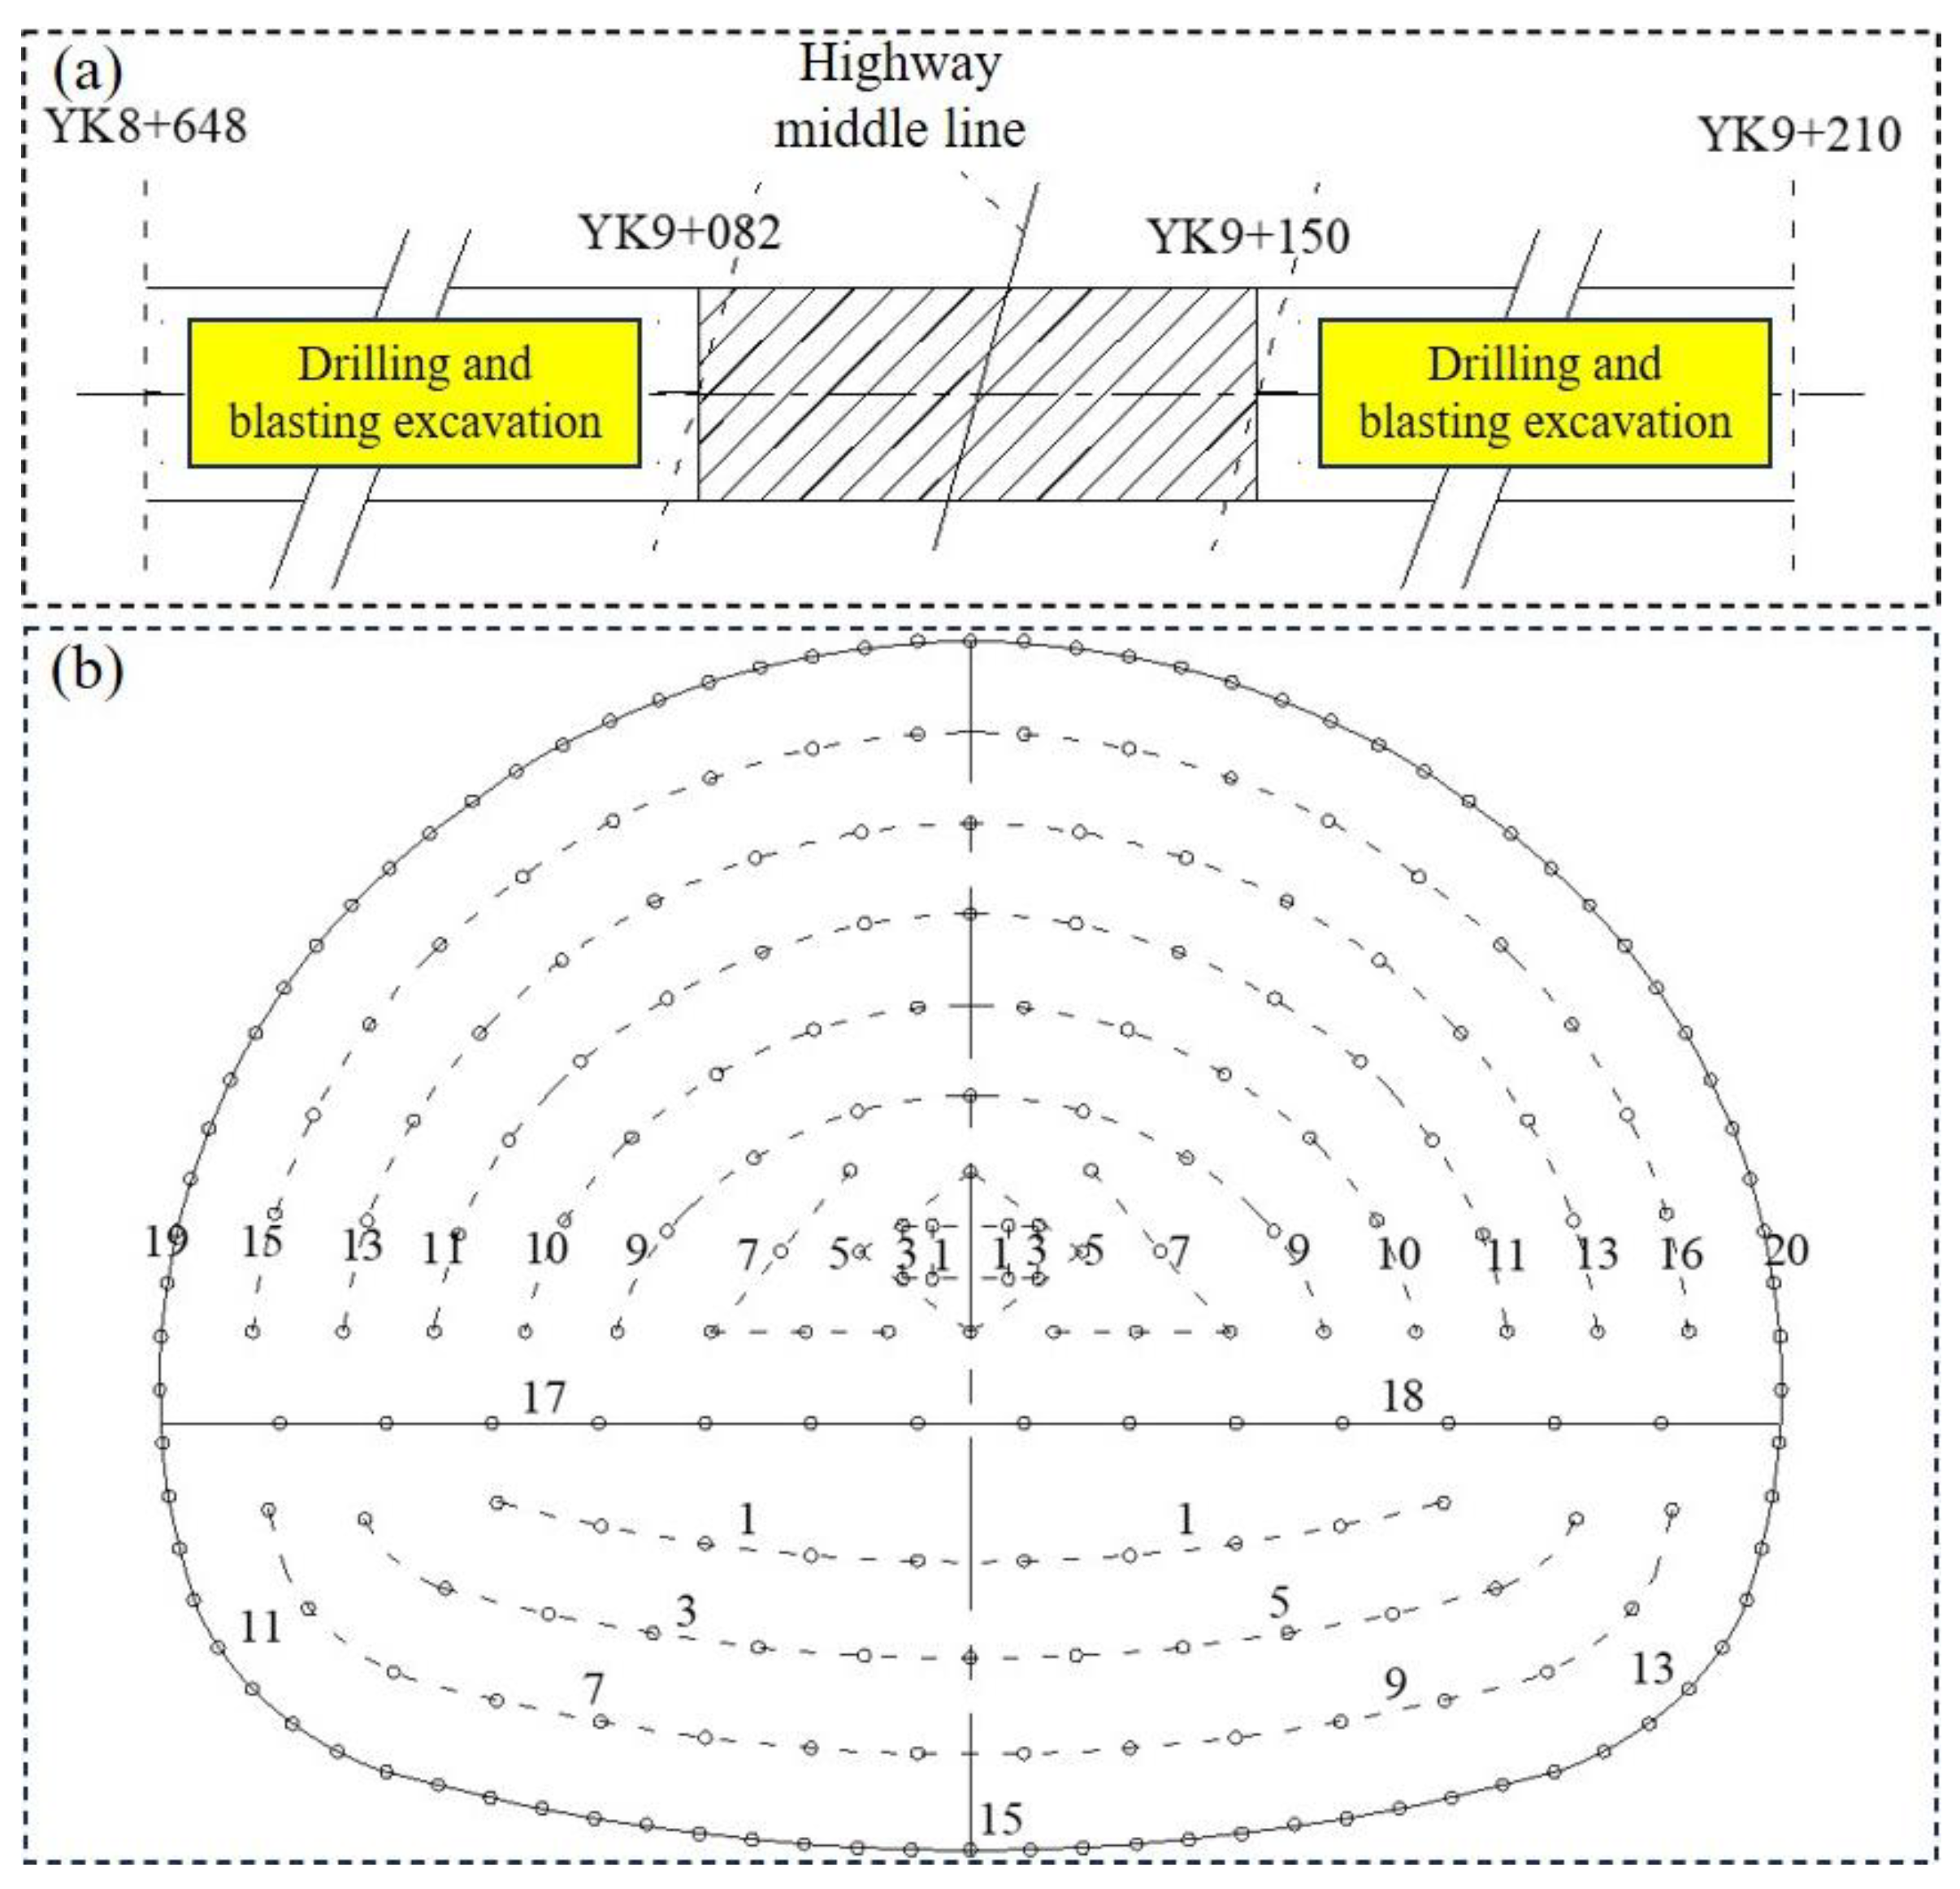
2. Project Overview
3. Rock Breaking Design Program
3.1. Dynamite Blasting
3.1.1. Schematic Design
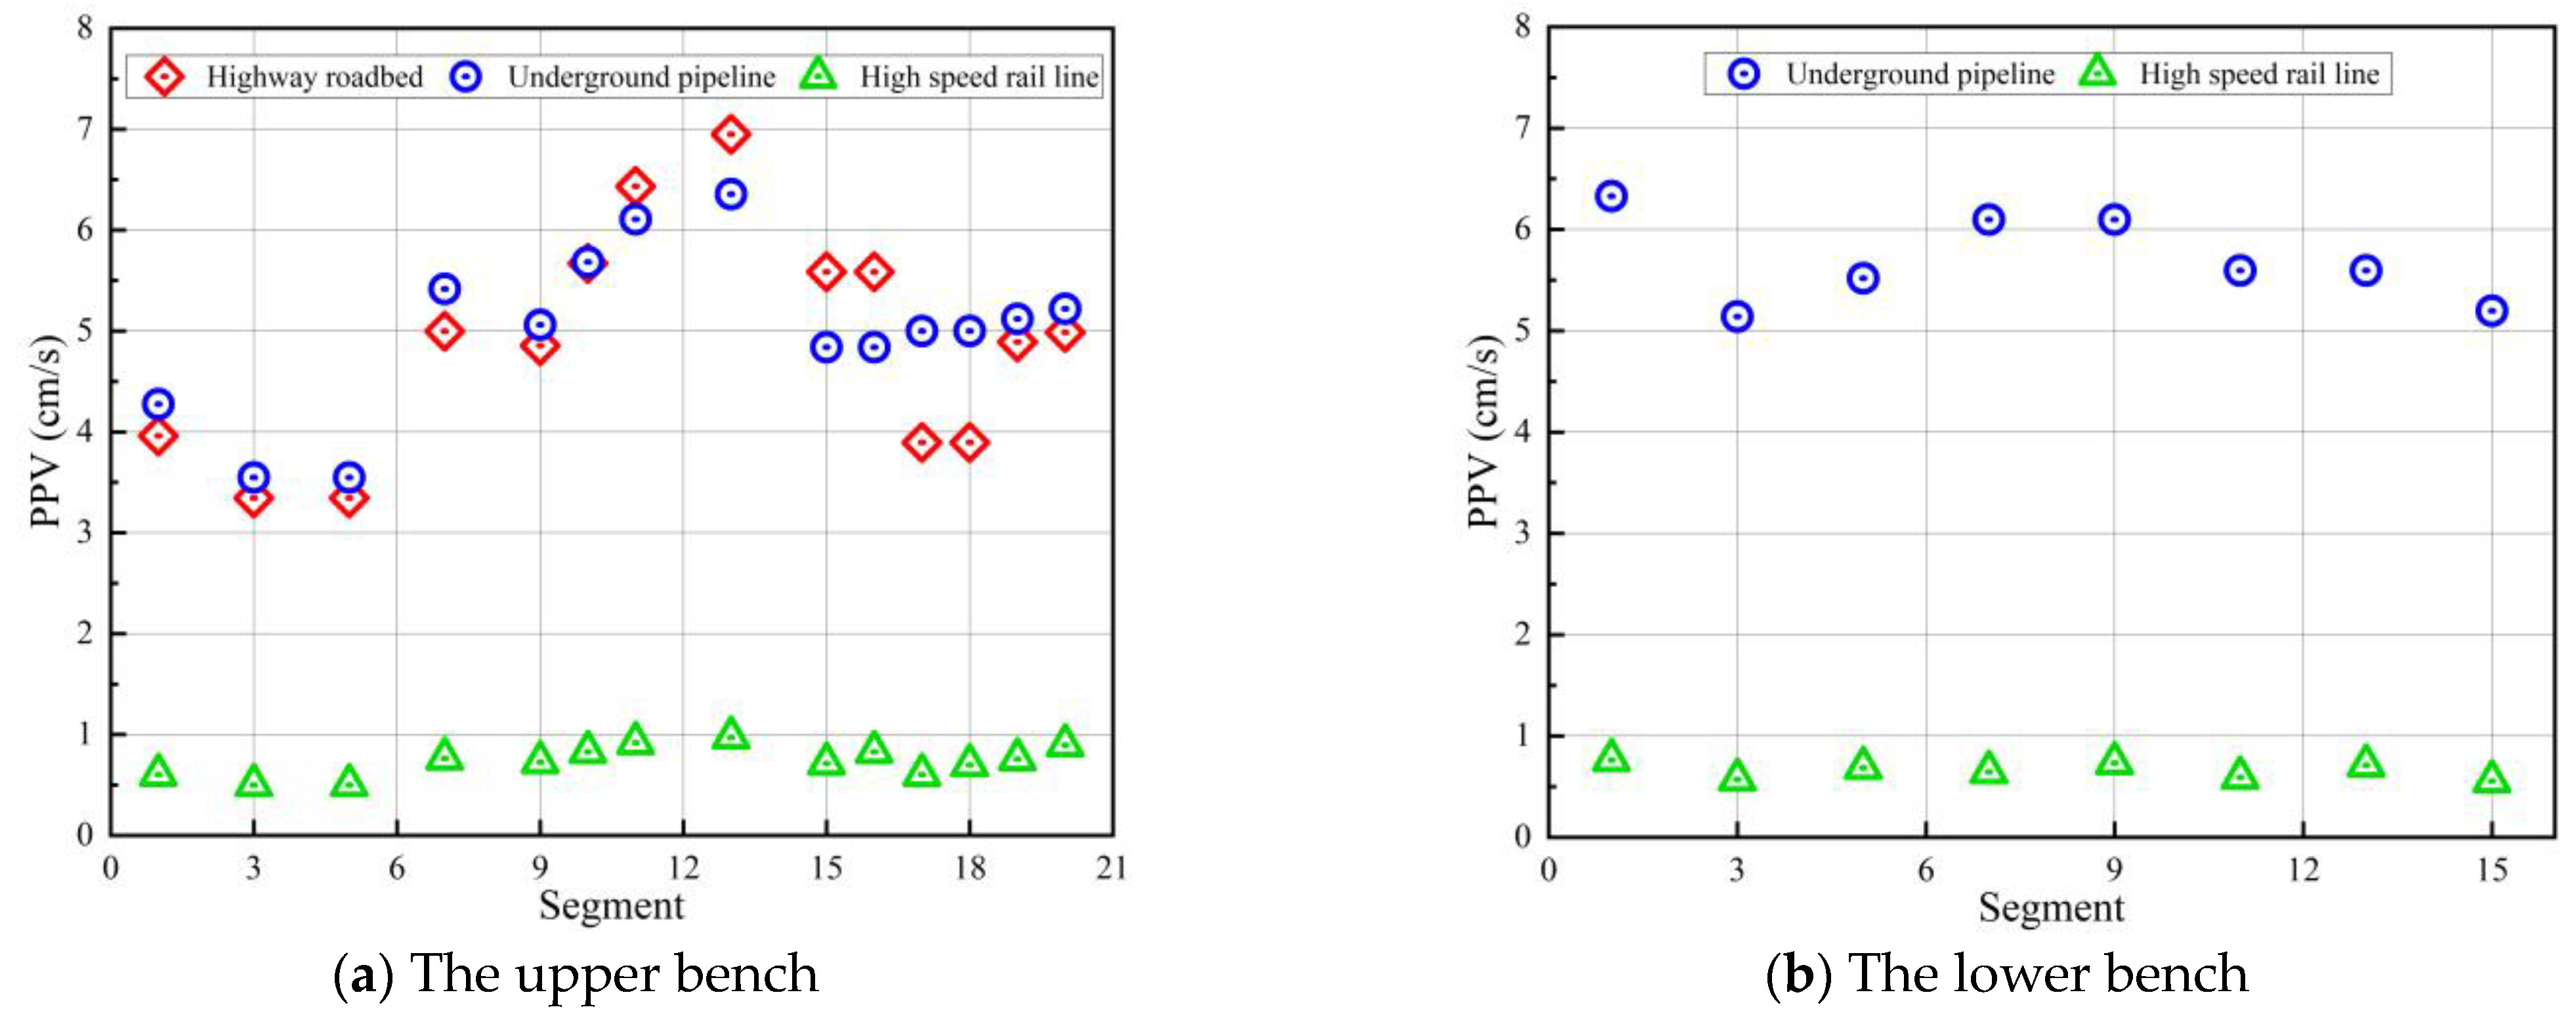
3.1.2. Monitoring and Fitting
3.2. HPGEM
3.2.1. Schematic Design
3.2.2. Monitoring and Fitting
4. Comparison of the Dynamite Blasting and HPGEM
5. Conclusions
- (1)
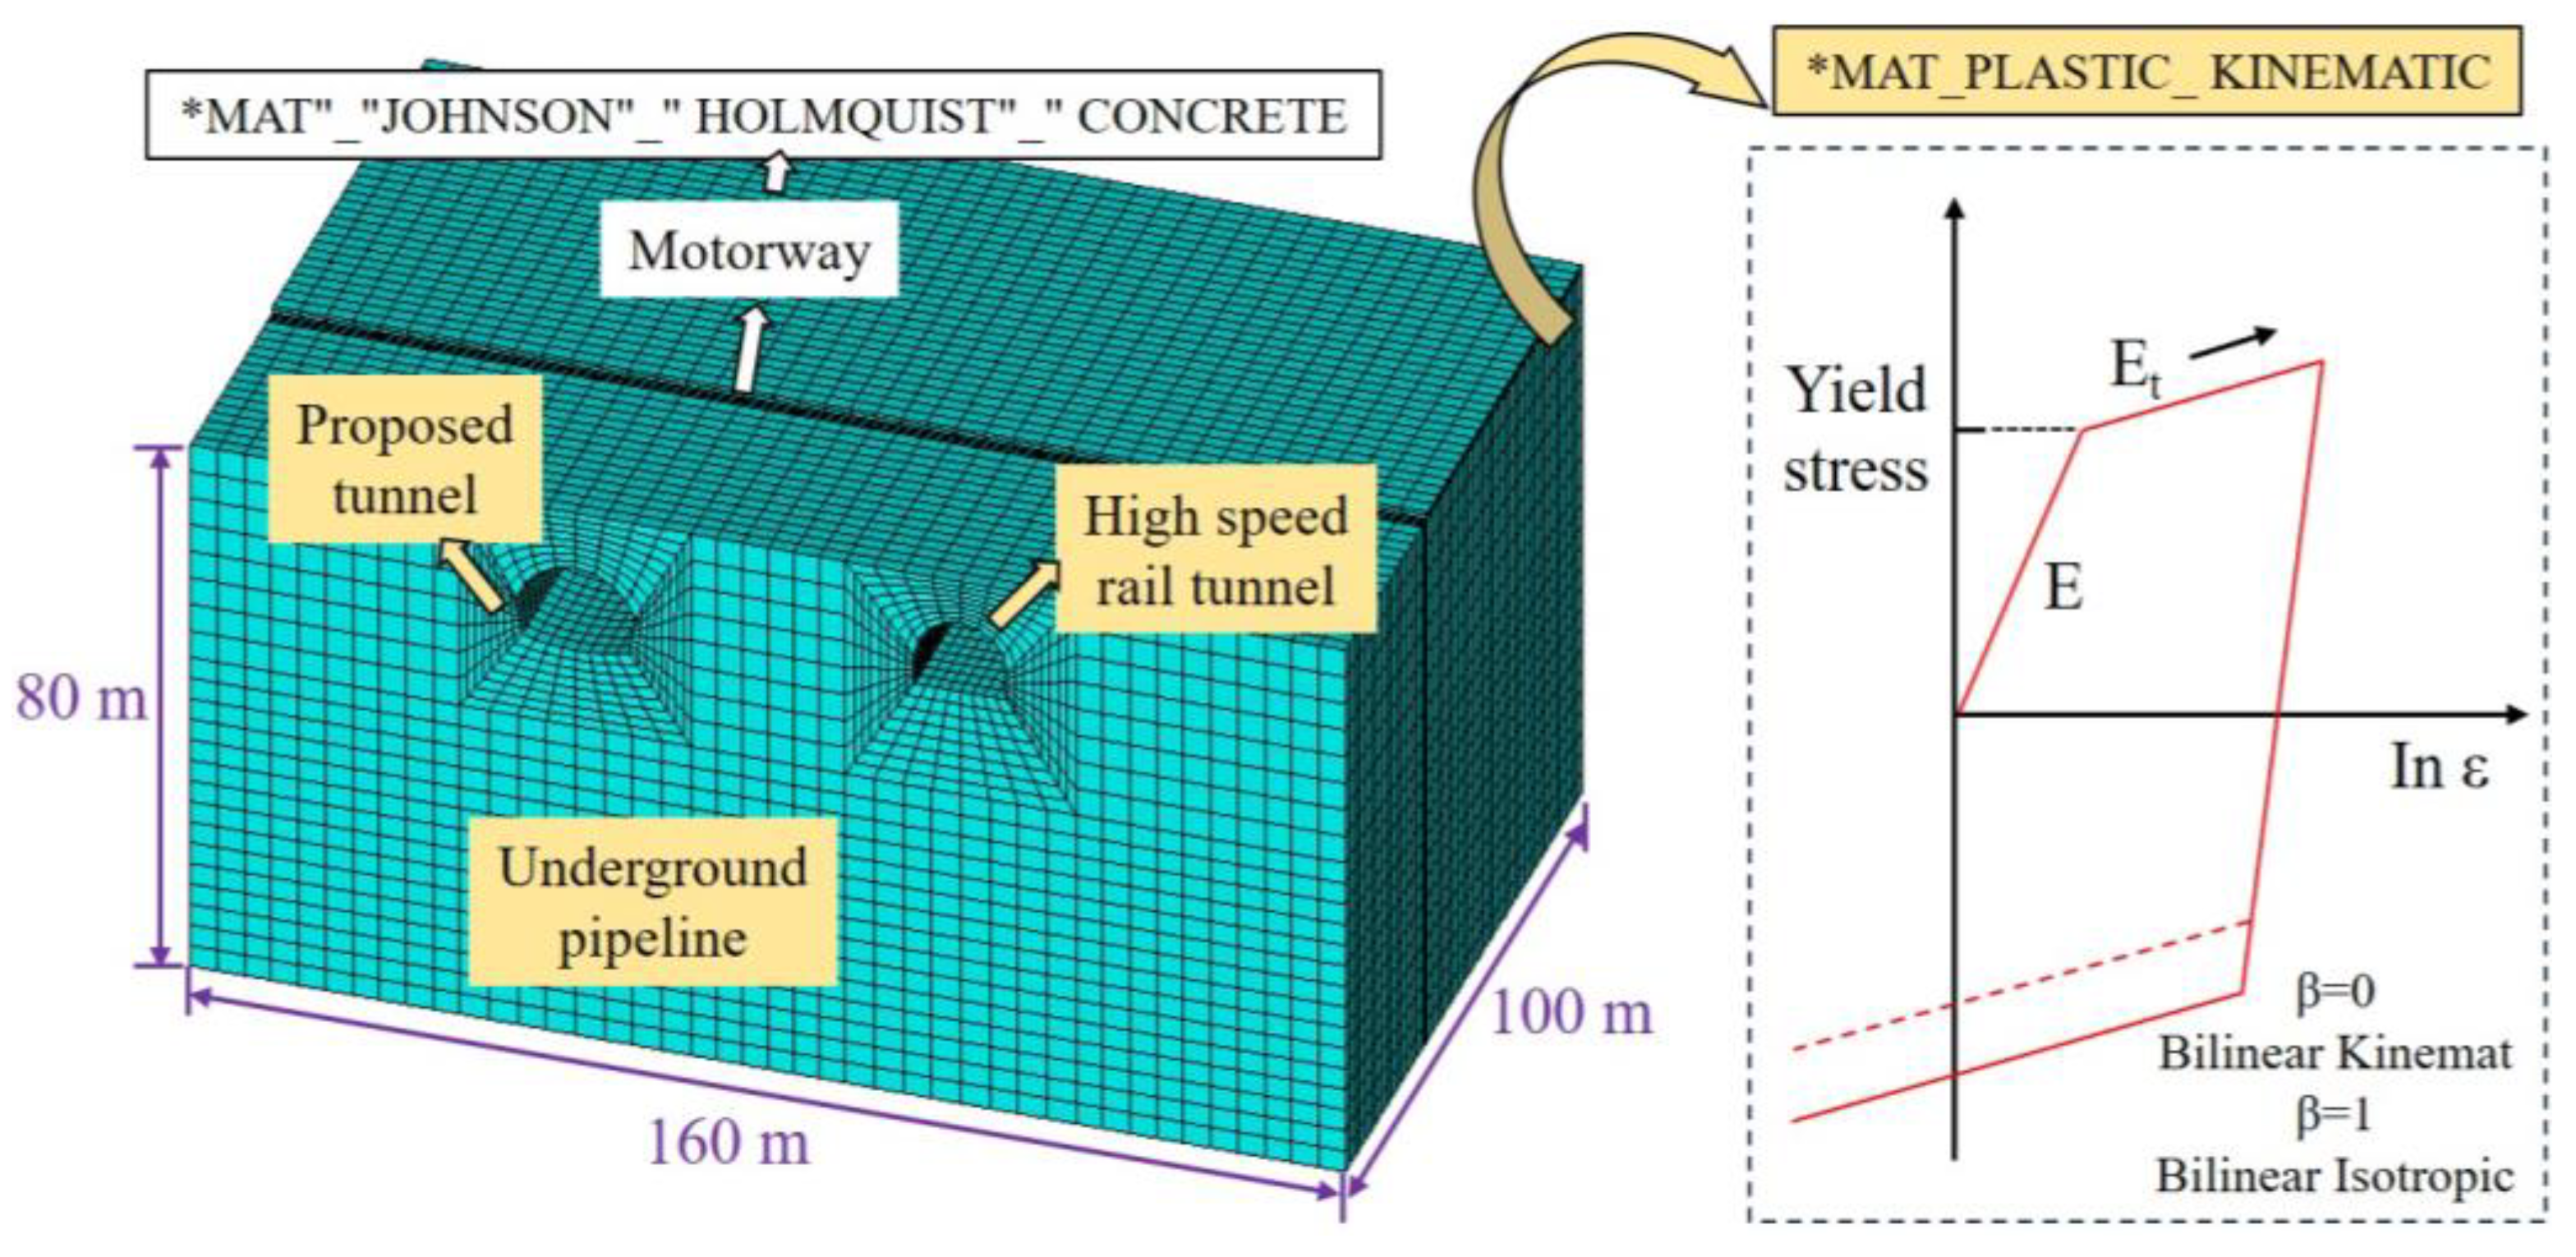
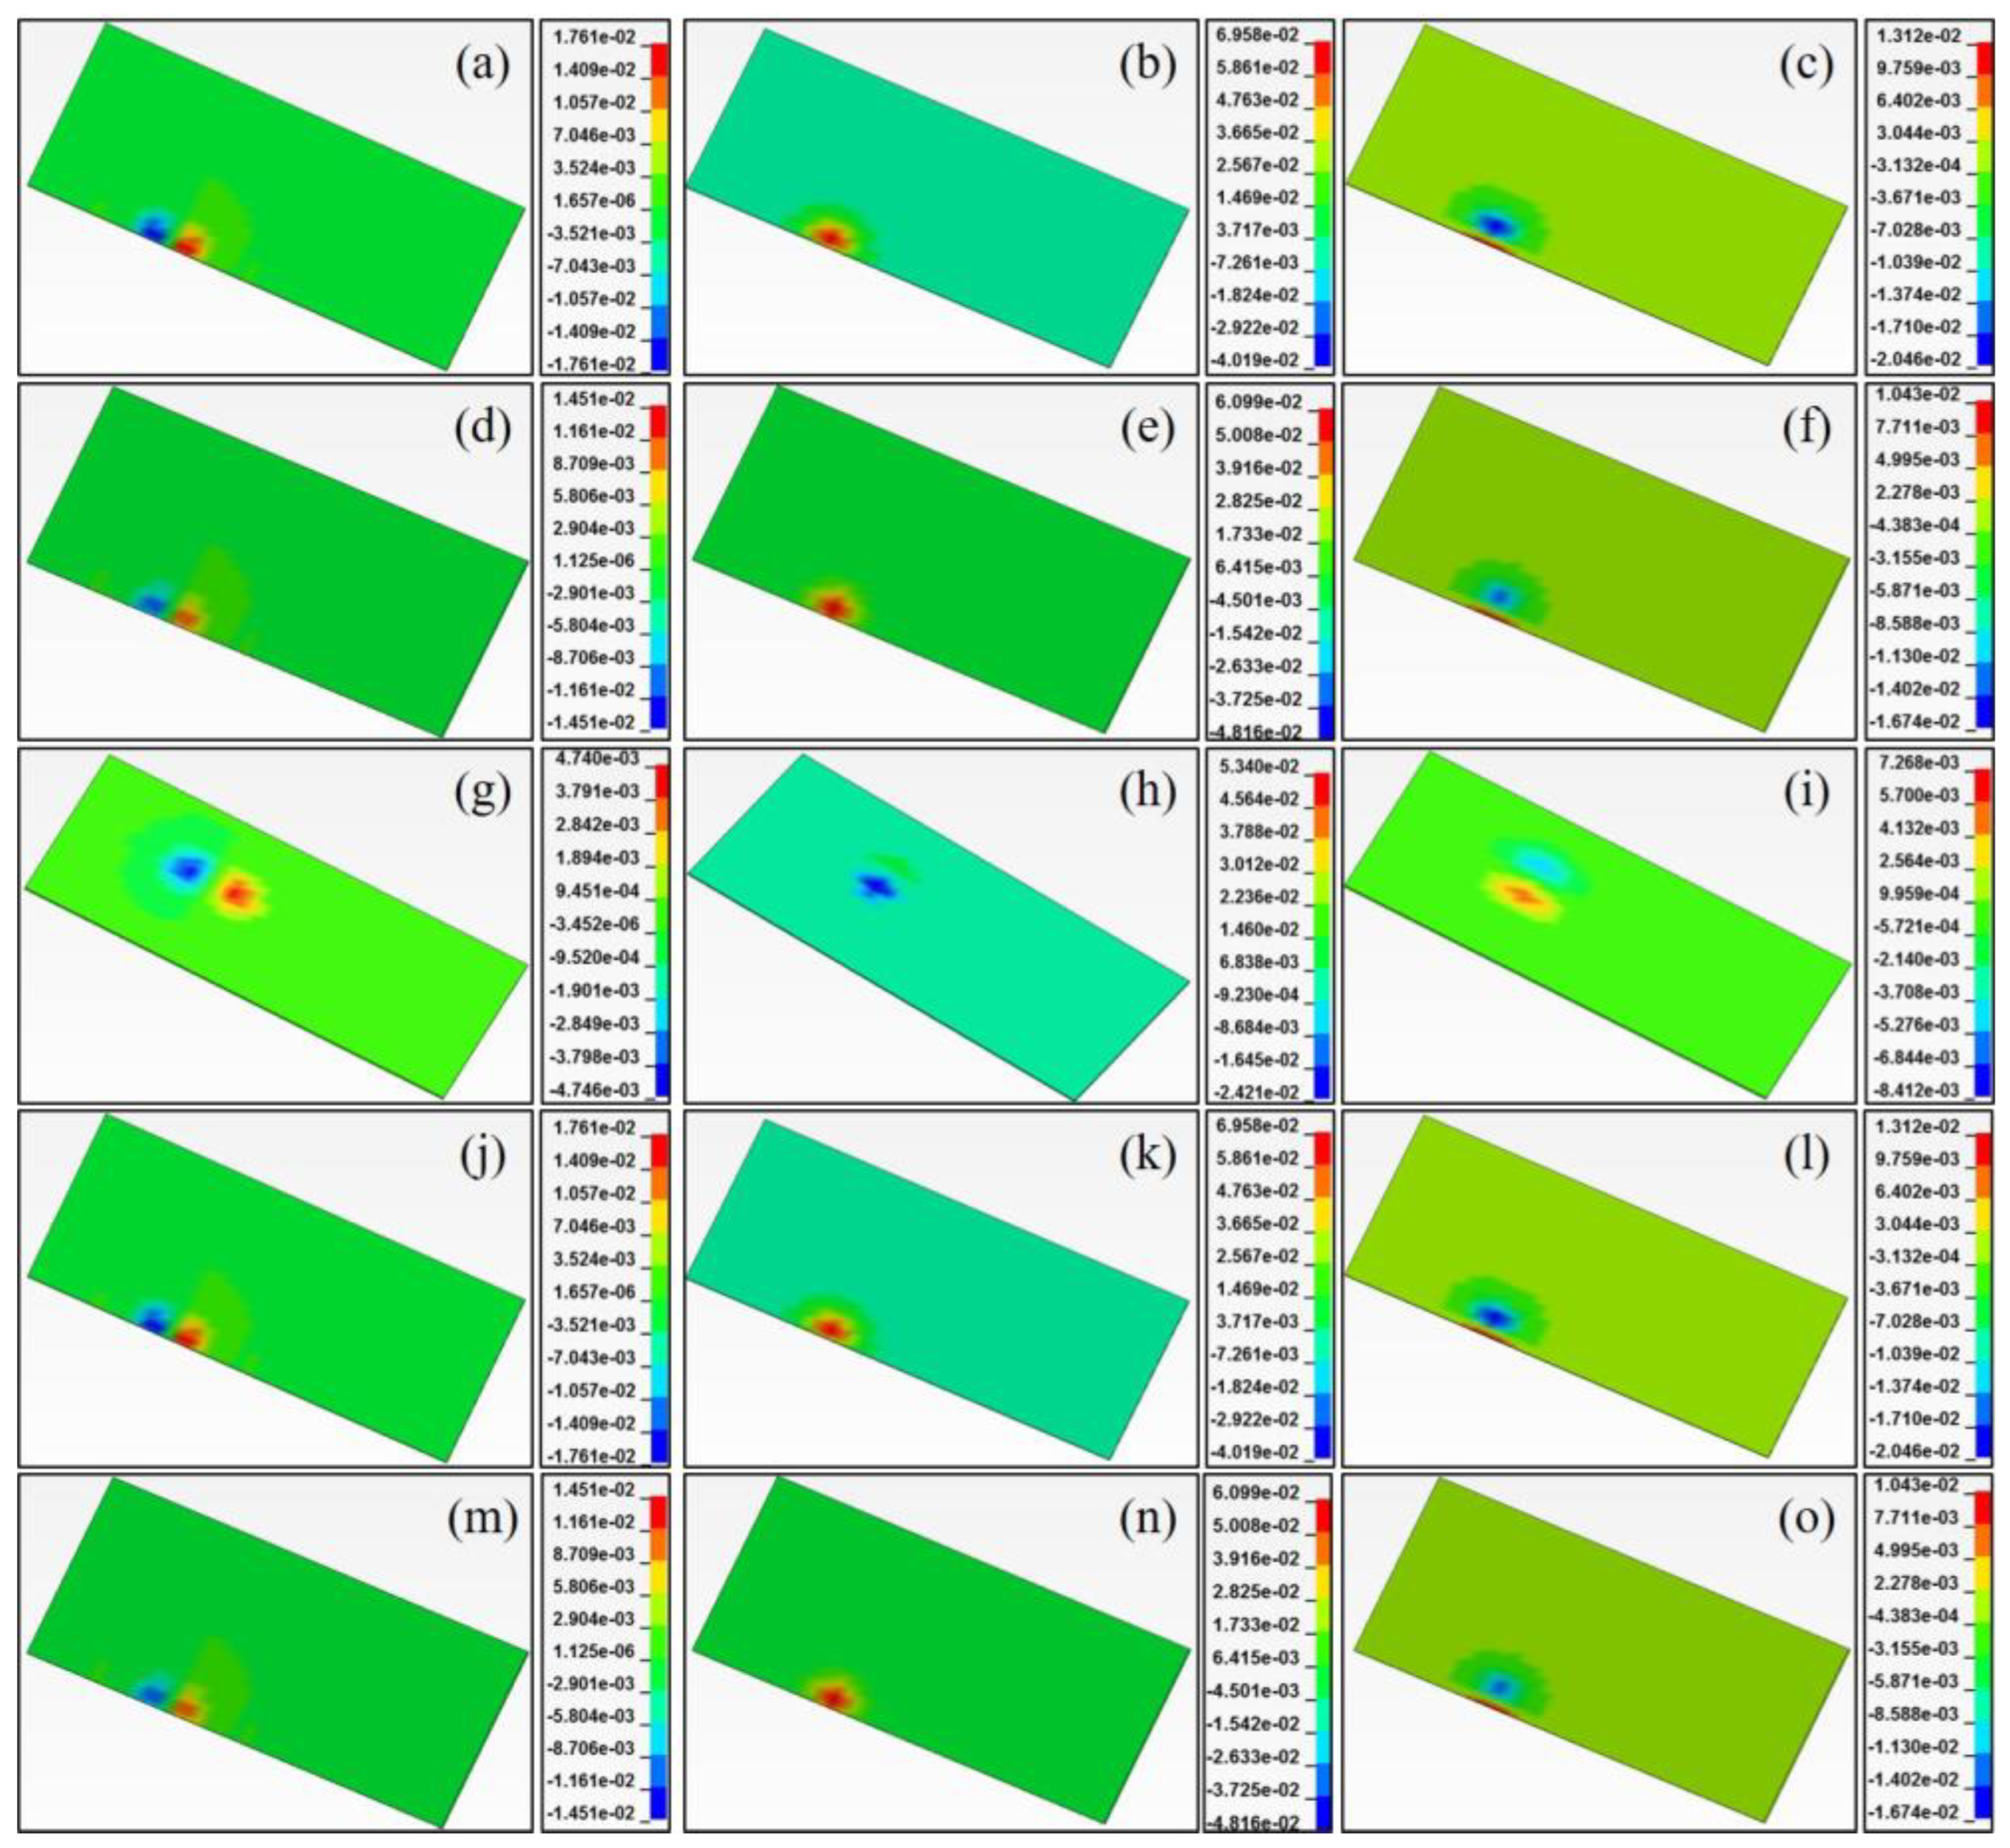
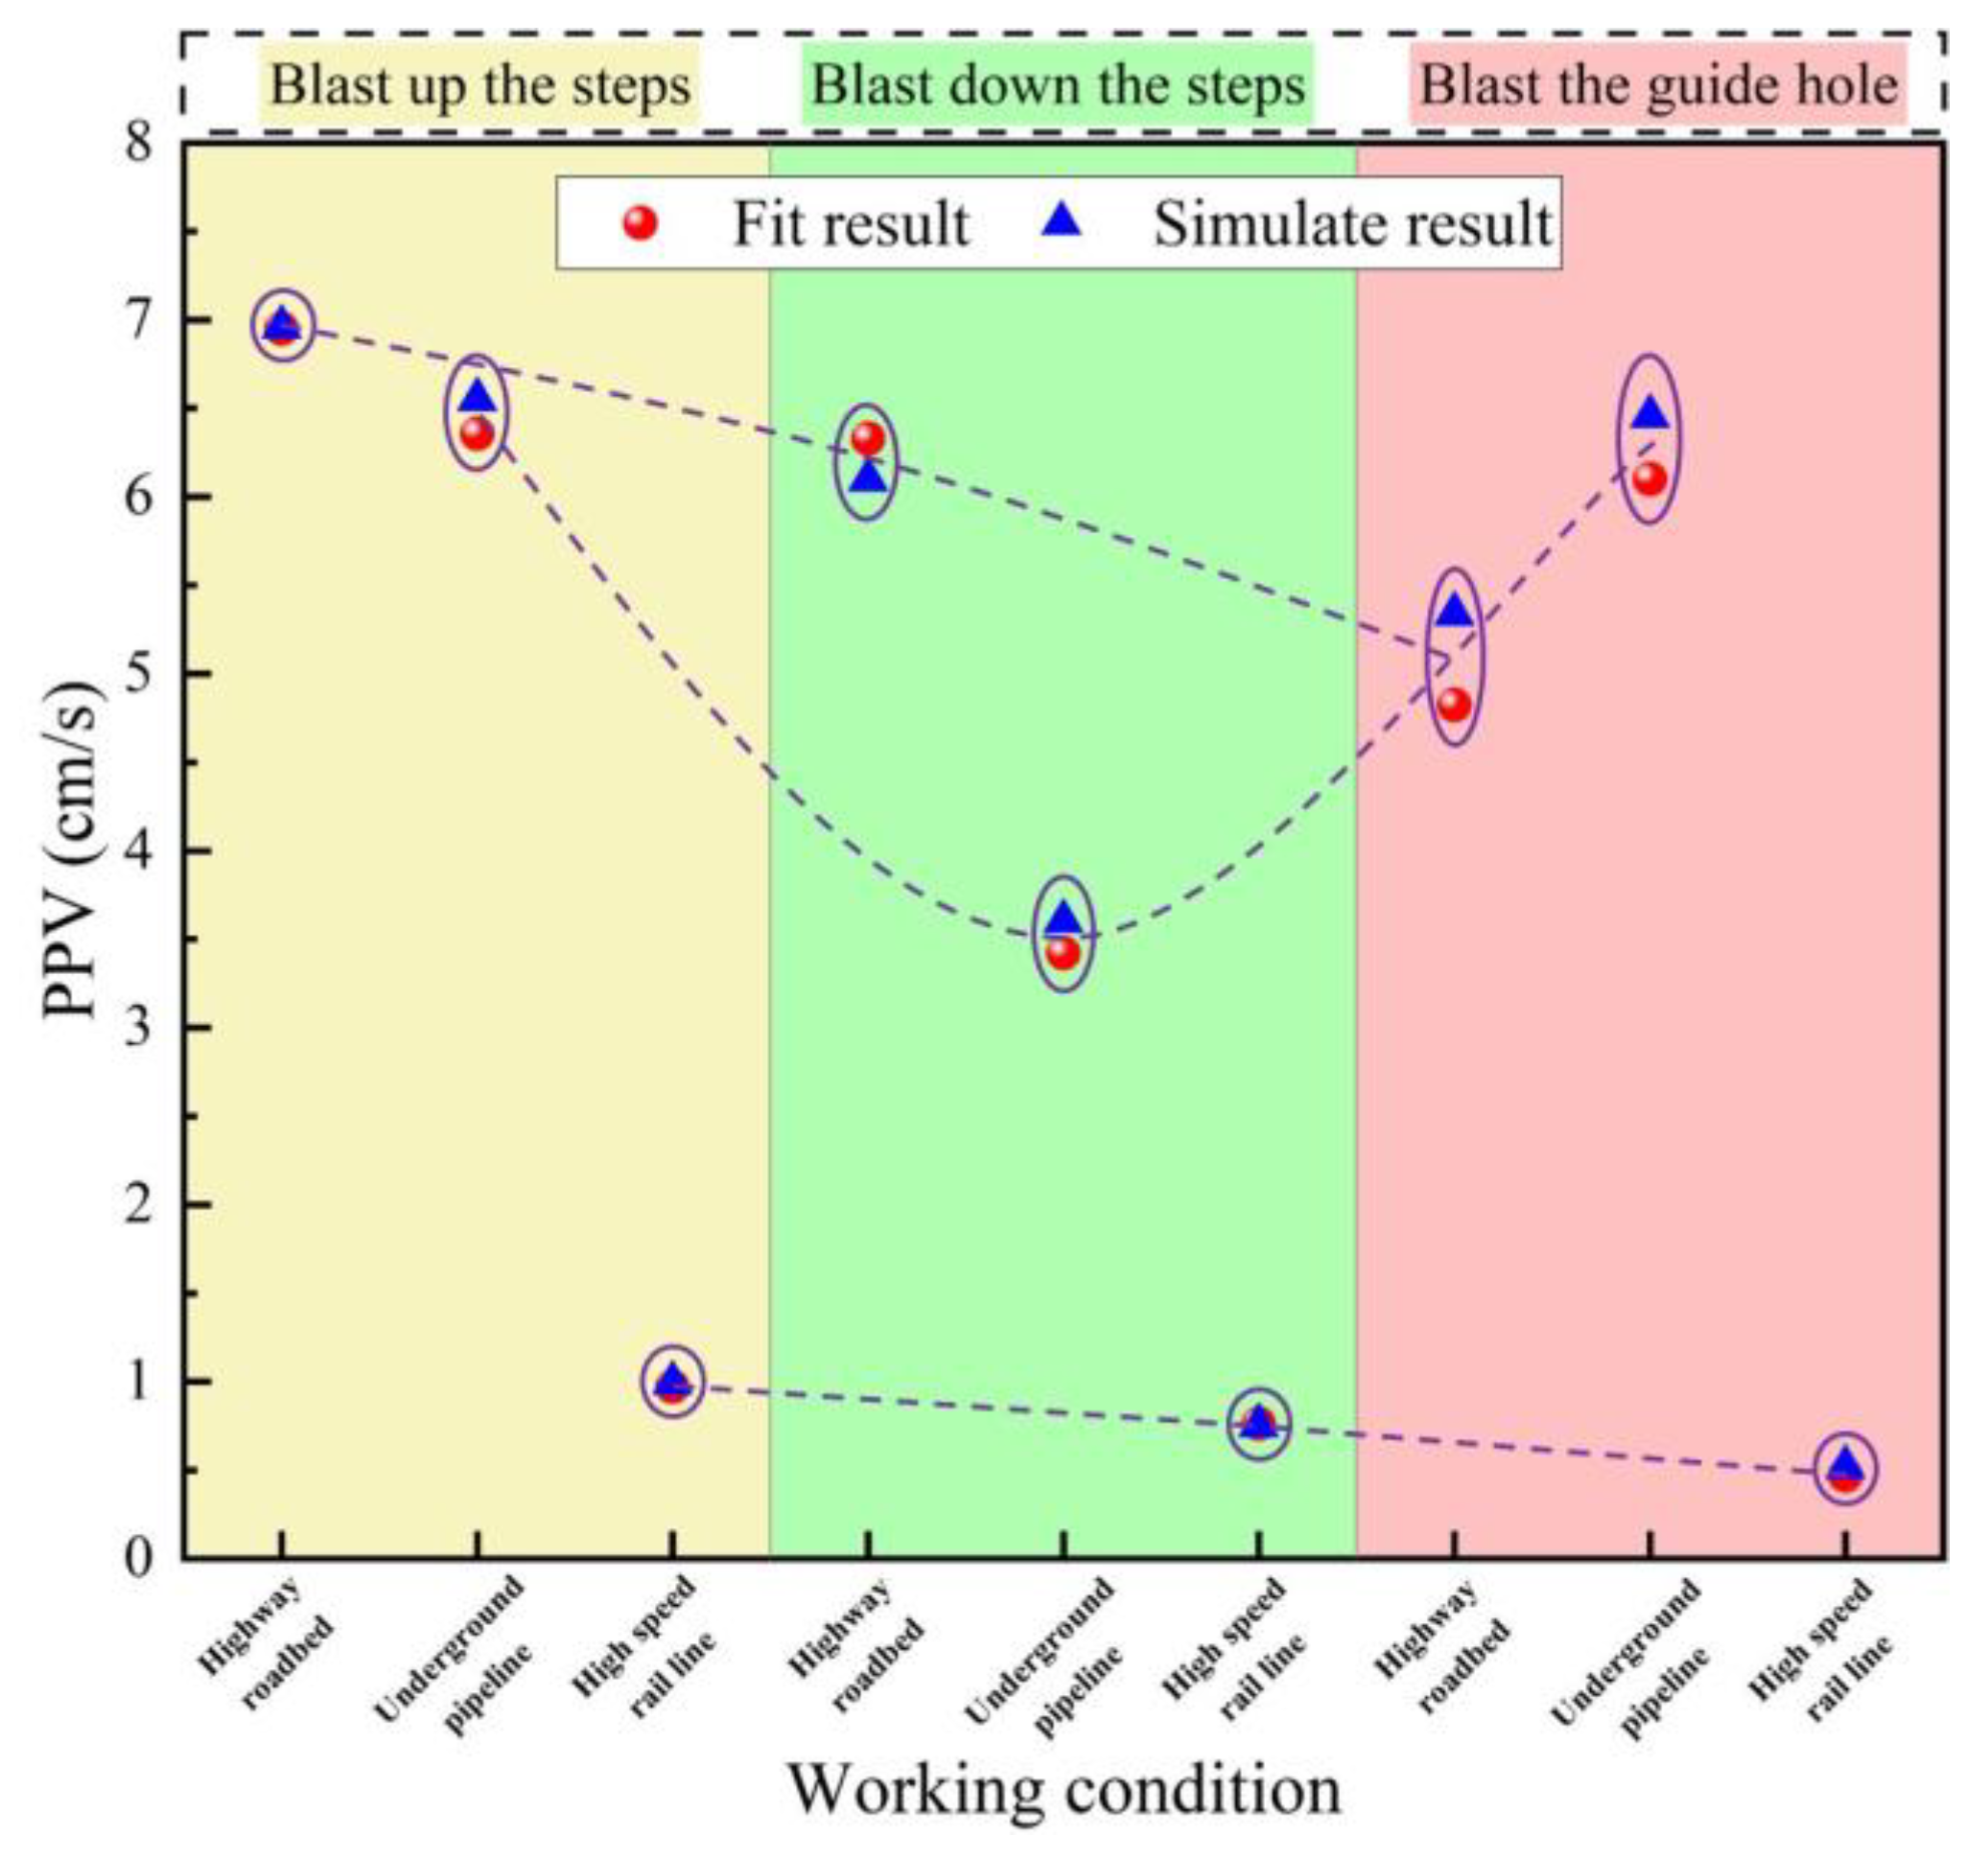
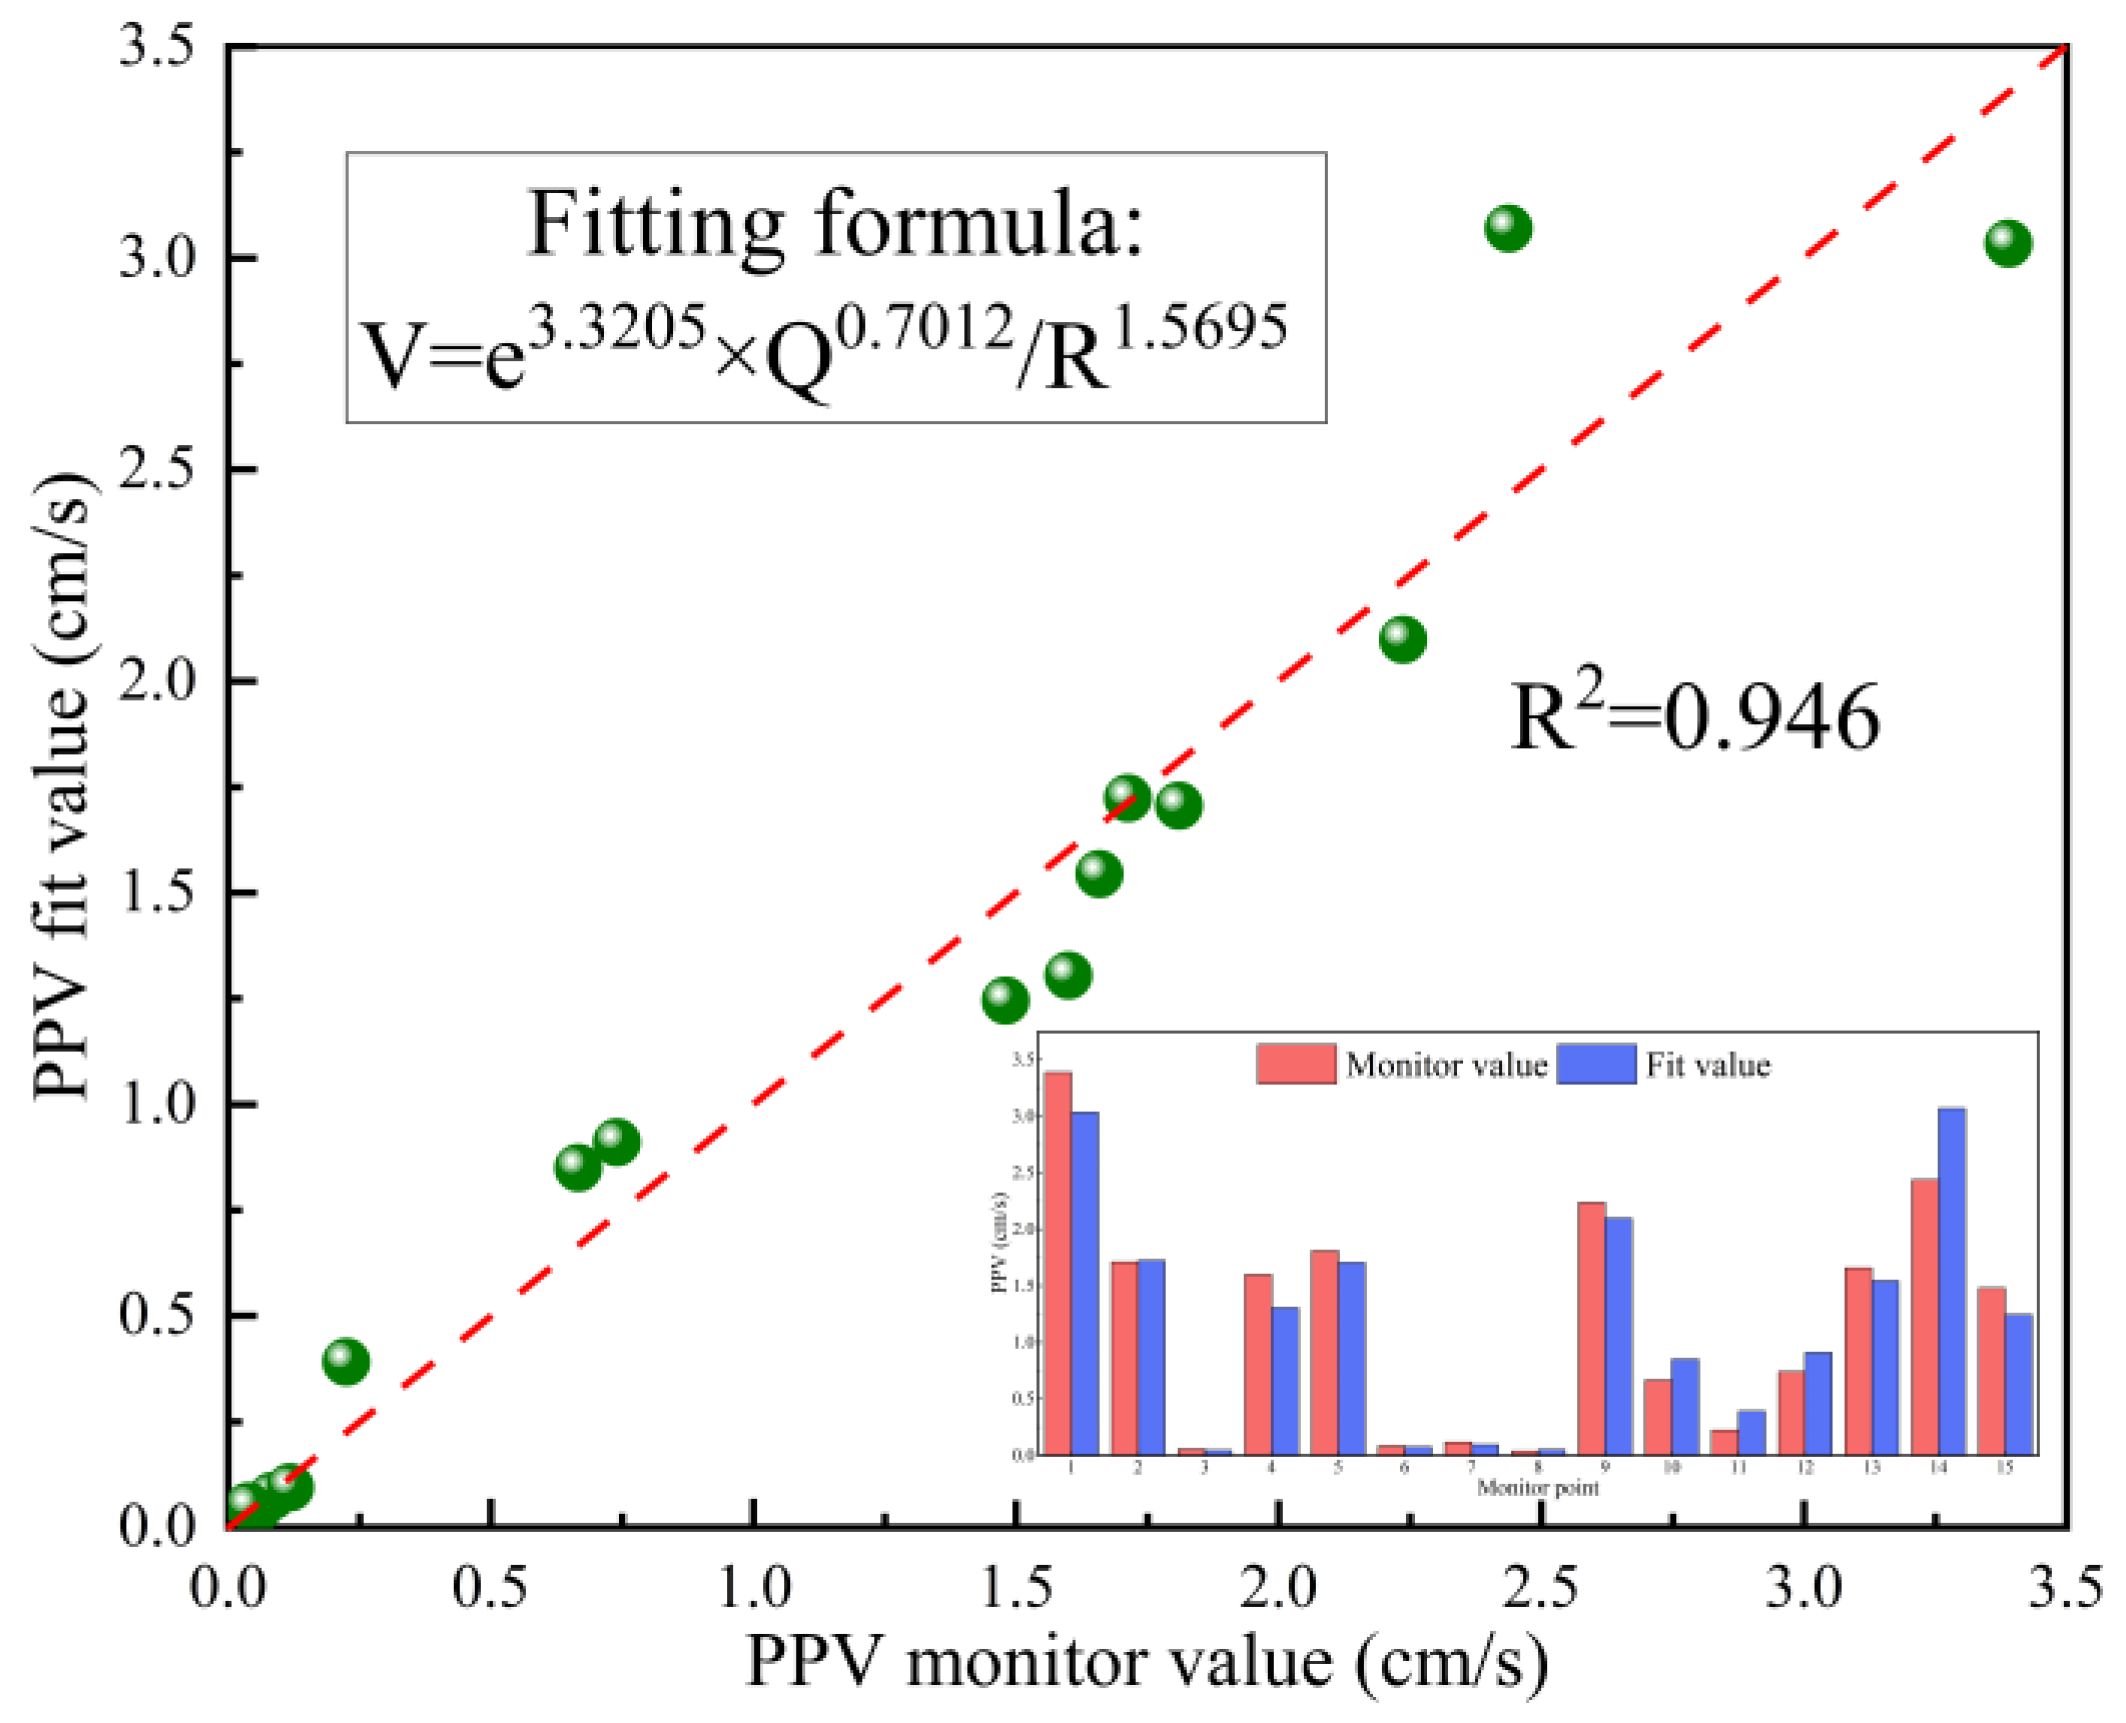
- Firstly, field tests were conducted on traditional blasting with explosives. The peak vibration velocity prediction formula was fitted based on Sadowski’s formula. Combined with the maximum allowable vibration velocity given by the design, the maximum segmental loading of the project was calculated, and the force and vibration of the buildings near the tunnel during the maximum segmental loading of blasting under three working conditions were obtained through numerical simulation.
- (2)
- With reference to the dynamite blasting method, field tests of the high-pressure gas expansion method of rock breaking were carried out to determine its optimal hollowing method and rock-breaking effect. Based on the vibration velocities monitored in the field, the vibration attenuation law was explored and the prediction formula for the peak vibration velocity was established.
- (3)
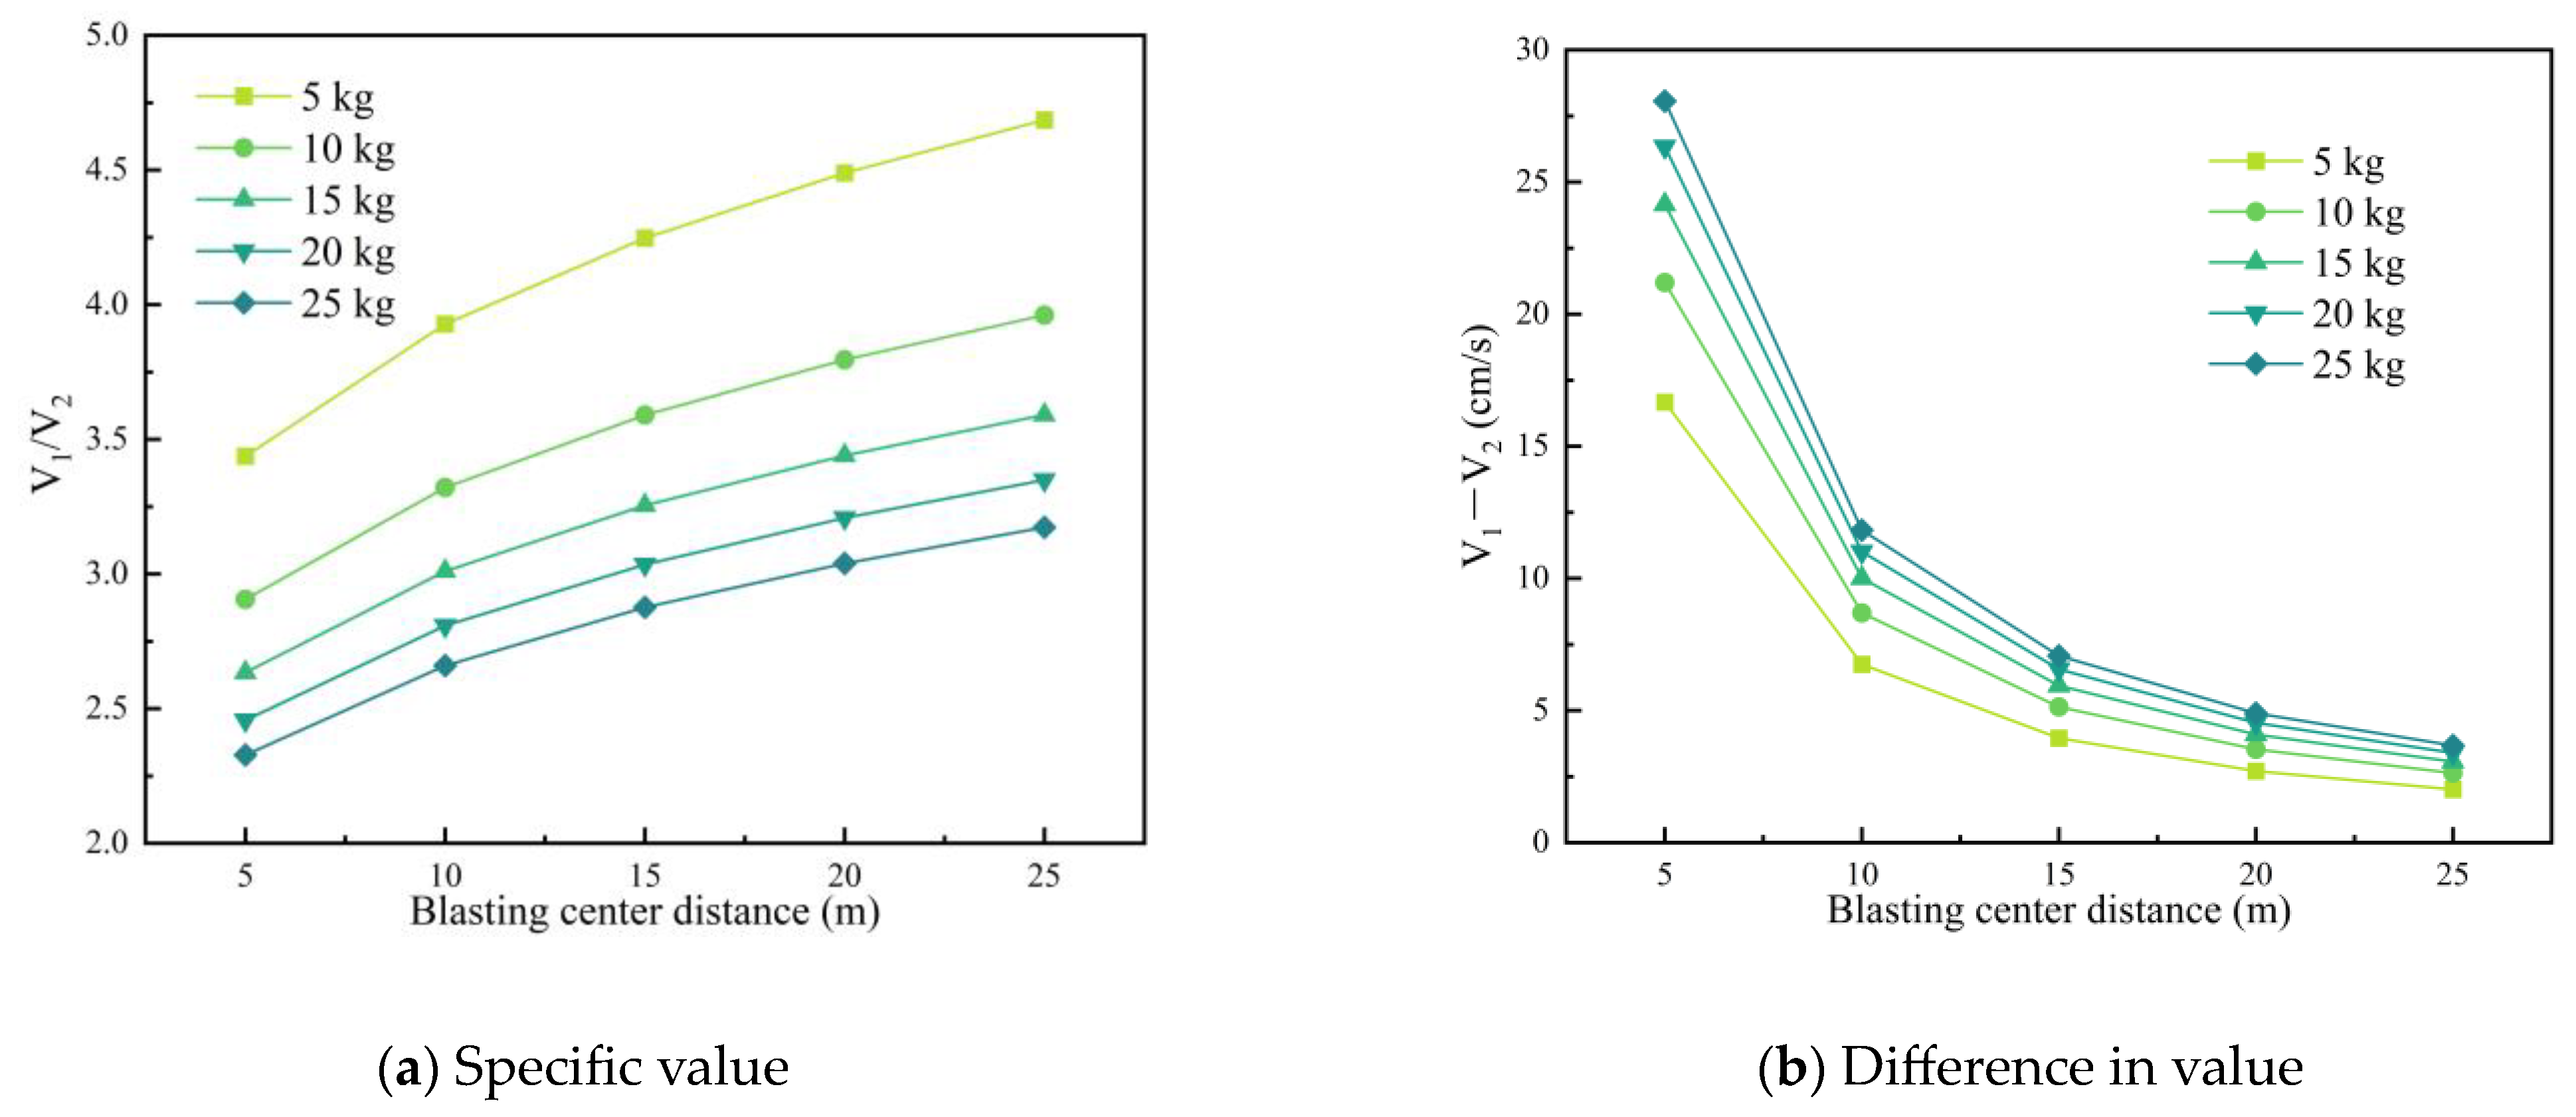
- A comparative analysis of the dynamite blasting method and the high-pressure gas expansion method was carried out, with emphasis on the effects of different agent qualities, blasting center distances, and the application of engineering difficulties on the PPV. The relationship between the maximum agent quantity and the volume of rock breakage under the limit case, and a practical implementation scheme are discussed.
- (4)
- The study demonstrates that the high-pressure gas expansion method has low vibration and excellent rock-breaking effect, and is fully capable of replacing explosives in some special areas.
Author Contributions
Funding
Data Availability Statement
Conflicts of Interest
References
- Nicholls, H.R.; Johnson, C.F.; Duvall, W.I. Blasting Vibrations and Their Effects on Structures; US Government Printers: Washington, DC, USA, 1971; ISBN 1-61344-013-8. [Google Scholar]
- Xia, Y.; Jiang, N.; Zhou, C.; Meng, X.; Luo, X.; Wu, T. Theoretical Solution of the Vibration Response of the Buried Flexible HDPE Pipe under Impact Load Induced by Rock Blasting. Soil Dyn. Earthq. Eng. 2021, 146, 106743. [Google Scholar] [CrossRef]
- Maidl, B.; Schmid, L.; Ritz, W.; Herrenknecht, M. Hardrock Tunnel Boring Machines; John Wiley & Sons: Hoboken, NJ, USA, 2008; ISBN 978-3-433-01676-3. [Google Scholar]
- Zheng, Y.L.; Zhang, Q.B.; Zhao, J. Challenges and Opportunities of Using Tunnel Boring Machines in Mining. Tunn. Undergr. Space Technol. 2016, 57, 287–299. [Google Scholar] [CrossRef]
- Bilgin, N.; Copur, H.; Balci, C. Mechanical Excavation in Mining and Civil Industries; CRC Press: Boca Raton, FL, USA, 2013; ISBN 1-4665-8474-2. [Google Scholar]
- Kim, H.; Ha, S.; Rehman, H.; Yoo, H. Analysis of Mechanical Excavation Characteristics by Pre-Cutting Machine Based on Linear Cutting Tests. Appl. Sci. 2023, 13, 1205. [Google Scholar] [CrossRef]
- Torno, S.; Toraño, J.; Ulecia, M.; Allende, C. Conventional and Numerical Models of Blasting Gas Behaviour in Auxiliary Ventilation of Mining Headings. Tunn. Undergr. Space Technol. 2013, 34, 73–81. [Google Scholar] [CrossRef]
- Wang, B.; Li, H.; Shao, Z.; Chen, S.; Li, X. Investigating the Mechanism of Rock Fracturing Induced by High-Pressure Gas Blasting with a Hybrid Continuum-Discontinuum Method. Comput. Geotech. 2021, 140, 104445. [Google Scholar] [CrossRef]
- Huai-de, P.; Dun-wen, L.; Fu-jiao, C.; Ying-hua, J. Test on High Pressure Gas Expansion Rock Fragmentation in Hard Rock Tunnel. Rock Soil Mech. 2018, 39, 242–248. [Google Scholar]
- Peng, H.; Li, D.; Sheng, J.; Dai, B.; Da, Q. A Rock Mass Classification Method for Tuff Tunnel Based on the High-Pressure Gas Expansion Method. J. Eng. 2023, 2023, 1–10. [Google Scholar] [CrossRef]
- Liu, D.; Tang, Y.; Cai, C.; Jian, Y. A Rock Fracturing Method Using High-Pressure Gas Expansion: Case Study on Its Application in Hangzhou-Lin’an Intercity Railway. Adv. Civ. Eng. 2021, 2021, e6654471. [Google Scholar] [CrossRef]
- Liu, D.; Wang, C.; Tang, Y.; Chen, H. Application of High-Pressure Gas Expansion Rock-Cracking Technology in Hard Rock Tunnel near Historic Sites. Appl. Sci. 2023, 13, 1017. [Google Scholar] [CrossRef]
- Duvall, W.I.; Fogelson, D.E. Review of Criteria for Estimating Damage to Residences from Blasting Vibrations; US Department of the Interior, Bureau of Mines: Washington, DC, USA, 1962; Volume 5968. [Google Scholar]
- Singh, P.K. Blast Vibration Damage to Underground Coal Mines from Adjacent Open-Pit Blasting. Int. J. Rock Mech. Min. Sci. 2002, 39, 959–973. [Google Scholar] [CrossRef]
- Zhou, J.; Shi, X.; Li, X. Utilizing Gradient Boosted Machine for the Prediction of Damage to Residential Structures Owing to Blasting Vibrations of Open Pit Mining. J. Vib. Control 2016, 22, 3986–3997. [Google Scholar] [CrossRef]
- Norén-Cosgriff, K.M.; Ramstad, N.; Neby, A.; Madshus, C. Building Damage Due to Vibration from Rock Blasting. Soil Dyn. Earthq. Eng. 2020, 138, 106331. [Google Scholar] [CrossRef]
- Yue, H.Z.; Yu, C.; Li, H.B.; Zhou, C.B.; Chen, S.H.; Shao, Z.S. The Effect of Blast-Hole Arrangement, Delay Time, and Decoupling Charge on Rock Damage and Vibration Attenuation in Multihole Blasting. Shock Vib. 2022, 2022, e2110160. [Google Scholar] [CrossRef]
- Wang, X.; Li, J.; Zhao, X.; Liang, Y. Propagation Characteristics and Prediction of Blast-Induced Vibration on Closely Spaced Rock Tunnels. Tunn. Undergr. Space Technol. 2022, 123, 104416. [Google Scholar] [CrossRef]
- Lv, J.; Liu, Z.; Huang, J. The Vibration Propagation and Damage Distribution Characteristics of Deep-Buried Underground Cavern Blasting. Mech. Time-Depend. Mater. 2023, 1–25. [Google Scholar] [CrossRef]
- Zhang, Y.; He, H.; Khandelwal, M.; Du, K.; Zhou, J. Knowledge Mapping of Research Progress in Blast-Induced Ground Vibration from 1990 to 2022 Using CiteSpace-Based Scientometric Analysis. Environ. Sci. Pollut. Res. 2023, 30, 103534–103555. [Google Scholar] [CrossRef] [PubMed]
- Wu, X.; Gong, M.; Wu, H.; Hu, G.; Wang, S. Vibration Reduction Technology and the Mechanisms of Surrounding Rock Damage from Blasting in Neighborhood Tunnels with Small Clearance. Int. J. Min. Sci. Technol. 2023, 33, 625–637. [Google Scholar] [CrossRef]
- Dehghani, H.; Ataee-pour, M. Development of a Model to Predict Peak Particle Velocity in a Blasting Operation. Int. J. Rock Mech. Min. Sci. 2011, 48, 51–58. [Google Scholar] [CrossRef]
- Wei, J.; Wang, W.; Wu, J. Numerical Investigation of inside Peak Particle Velocities for Predicting the Vibration Influence Radius of Vibratory Pile Driving. Soil Dyn. Earthq. Eng. 2022, 153, 107103. [Google Scholar] [CrossRef]
- Hu, J.-H.; Shang, J.-L.; Luo, X.-W.; Zhou, K.-P. Monitoring of Single-Hole Blasting Vibration and Detection of Its Attenuation Law by Using Multiple Linear Regression. Zhendong Yu Chongji J. Vib. Shock 2013, 32, 49–53. [Google Scholar]
- Jiang, N.; Zhou, C.; Lu, S.; Zhang, Z. Effect of Underground Mine Blast Vibrations on Overlaying Open Pit Slopes: A Case Study for Daye Iron Mine in China. Geotech. Geol. Eng. 2018, 36, 1475–1489. [Google Scholar] [CrossRef]
- Ghasemi, E.; Kalhori, H.; Bagherpour, R. A New Hybrid ANFIS–PSO Model for Prediction of Peak Particle Velocity Due to Bench Blasting. Eng. Comput. 2016, 32, 607–614. [Google Scholar] [CrossRef]
- Nguyen, H.; Bui, X.-N.; Bui, H.-B.; Cuong, D.T. Developing an XGBoost Model to Predict Blast-Induced Peak Particle Velocity in an Open-Pit Mine: A Case Study. Acta Geophys. 2019, 67, 477–490. [Google Scholar] [CrossRef]


| Lithology | ||
|---|---|---|
| Hard rock | 50~150 | 1.3~1.5 |
| Medium hard rock | 150~250 | 1.5~1.8 |
| Soft rock | 250~350 | 1.8~2.0 |
| Monitoring Point No. | R (m) | Q (kg) | PPV (cm/s) | Main Vibration Frequency (Hz) |
|---|---|---|---|---|
| 1 | 26 | 20 | 4.52 | 108.108 |
| 2 | 28 | 22 | 4.25 | 98.199 |
| 3 | 35 | 18 | 2.93 | 116.280 |
| 4 | 42 | 24 | 2.64 | 166.166 |
| 5 | 31 | 15 | 2.98 | 85.107 |
| 6 | 39 | 18 | 2.69 | 109.863 |
| 7 | 28 | 17 | 3.67 | 94.933 |
| 8 | 13 | 17 | 11.78 | 88.889 |
| 9 | 53 | 14 | 1.56 | 200.911 |
| 10 | 50 | 12 | 1.39 | 192.667 |
| 11 | 40 | 11 | 1.96 | 145.752 |
| 12 | 24 | 12 | 3.79 | 90.909 |
| 13 | 35 | 12 | 2.47 | 100.122 |
| Location | PPV Control Value (cm/s) | R at Minimum PPV (m) | Q (kg) |
|---|---|---|---|
| HR | 7 | 5.70 | 0.53 |
| UP | 7 | 4.64 | 0.29 |
| HSRT | 1 | 50.00 | 5.15 |
| Parameters | β (g/cm3) | D (cm/μs) | P (MPa) | A (MPa) | B (MPa) |
| Value | 1.2 | 0.48 | 0.097 | 2.144 | 1.82 × 10⁻³ |
| Parameters | R1 | R2 | ω | E0 (J/cm3) | V0 |
| Value | 4.2 | 0.9 | 0.15 | 3.60 × 10³ | 0 |
| Parameters | ρ (g/cm3) | E (MPa) | γ | ET (MPa) | σs (MPa) |
|---|---|---|---|---|---|
| Rock | 2.6 | 6.00 × 10¹⁰ | 0.27 | 1.30 × 10³ | 4.00 × 10³ |
| Concrete | 2.25 | 3.00 × 10¹⁰ | 0.2 | 2.50 × 10² | 2.40 × 10³ |
| Hollowing Type | Expansion Pipe Number | Gas Generated Agent Quality (kg) | Rock Breakage Amount (m3) | Unit Consumption (kg/m3) |
|---|---|---|---|---|
| Wedge-shaped hollowing | 6 | 3 | 2.40 | 1.25 |
| Large-diameter hollow Straight-hole hollowing | 8 | 4 | 2.87 | 1.39 |
| Number | (kg) | R (m) | Monitor PPV (cm/s) | Calculate PPV’ (cm/s) |
|---|---|---|---|---|
| 1 | 0.5 | 3 | 3.389 | 3.034 |
| 2 | 0.5 | 4.3 | 1.713 | 1.724 |
| 3 | 0.5 | 43.6 | 0.057 | 0.045 |
| 4 | 1 | 7 | 1.600 | 1.305 |
| 5 | 1 | 5.9 | 1.810 | 1.706 |
| 6 | 1 | 43.6 | 0.084 | 0.074 |
| 7 | 1.5 | 45 | 0.118 | 0.095 |
| 8 | 1.5 | 65 | 0.039 | 0.051 |
| 9 | 1.5 | 6.2 | 2.237 | 2.098 |
| 10 | 1.5 | 11 | 0.667 | 0.850 |
| 11 | 1.5 | 18 | 0.225 | 0.391 |
| 12 | 5 | 18 | 0.740 | 0.910 |
| 13 | 7 | 15 | 1.659 | 1.544 |
| 14 | 15 | 13.6 | 2.438 | 3.070 |
| 15 | 20 | 27.5 | 1.480 | 1.245 |
| Number | Q (kg) | R (m) | (cm/s) | (cm/s) |
|---|---|---|---|---|
| 1 | 5 | 5 | 23.509 | 6.839 |
| 2 | 5 | 10 | 9.051 | 2.304 |
| 3 | 5 | 15 | 5.179 | 1.219 |
| 4 | 5 | 20 | 3.485 | 0.776 |
| 5 | 5 | 25 | 2.563 | 0.547 |
| 6 | 10 | 5 | 32.314 | 11.120 |
| 7 | 10 | 10 | 12.442 | 3.746 |
| 8 | 10 | 15 | 7.119 | 1.983 |
| 9 | 10 | 20 | 4.790 | 1.262 |
| 10 | 10 | 25 | 3.523 | 0.889 |
| 11 | 15 | 5 | 38.923 | 14.776 |
| 12 | 15 | 10 | 14.986 | 4.979 |
| 13 | 15 | 15 | 8.575 | 2.635 |
| 14 | 15 | 20 | 5.770 | 1.677 |
| 15 | 15 | 25 | 4.244 | 1.182 |
| 16 | 20 | 5 | 44.417 | 18.079 |
| 17 | 20 | 10 | 17.102 | 6.091 |
| 18 | 20 | 15 | 9.785 | 3.224 |
| 19 | 20 | 20 | 6.584 | 2.052 |
| 20 | 20 | 25 | 4.843 | 1.446 |
| 21 | 25 | 5 | 49.207 | 21.141 |
| 22 | 25 | 10 | 18.946 | 7.123 |
| 23 | 25 | 15 | 10.840 | 3.770 |
| 24 | 25 | 20 | 7.294 | 2.400 |
| 25 | 25 | 25 | 5.365 | 1.691 |
| Location | Q (kg) | R (m) | (cm/s) | (cm/s) | V/V1 |
|---|---|---|---|---|---|
| HR | 0.53 | 5.70 | 7 | 1.152 | 0.165 |
| UP | 0.29 | 4.64 | 7 | 1.032 | 0.147 |
| HSRL | 5.15 | 50.00 | 1 | 0.188 | 0.188 |
| Location | Q (kg) | R (m) | (cm/s) | (cm/s) | ||
|---|---|---|---|---|---|---|
| Upper bench | HR | 6.80 | 13.45 | 6.950 | 1.795 | 0.258 |
| UP | 6.80 | 14.324.00 | 6.355 | 1.626 | 0.256 | |
| HSRL | 6.80 | 56.00 | 0.972 | 0.191 | 0.197 | |
| Lower bench | HR | 4.00 | 12.037.00 | 6.330 | 1.473 | 0.233 |
| UP | 4.00 | 56.00 | 0.762 | 0.132 | 0.173 | |
| Pilot | HR | 1.00 | 9.23 | 4.823 | 0.845 | 0.175 |
| UP | 1.00 | 7.79 | 6.100 | 1.103 | 0.181 | |
| HSRL | 1.00 | 50.00 | 0.471 | 0.060 | 0.127 | |
| Location | (cm/s) | R (m) | Dynamite Blasting | HPGEM | m2/m1 | A2/A1 | ||||
|---|---|---|---|---|---|---|---|---|---|---|
| Q (kg) | Unit Consumption (kg/m3) | Rock Breakage Amount A1 (m3) | (kg) | Unit Consumption (kg/m3) | Rock Breakage Amount A2 (m3) | |||||
| HR | 7 | 5.7 | 0.53 | 0.6 | 0.881 | 6.930 | 0.87 | 7.965 | 13.10 | 9.04 |
| UP | 7 | 4.64 | 0.29 | 0.475 | 4.372 | 5.026 | 15.33 | 10.57 | ||
| HSRL | 1 | 50 | 5.15 | 8.576 | 55.776 | 64.110 | 10.85 | 7.48 | ||
| Location | (cm/s) | R (m) | Dynamite Blasting | HPGEM | m2/m1 | A2/A1 | |||||
|---|---|---|---|---|---|---|---|---|---|---|---|
| Q (kg) | Unit Consumption (kg/m3) | Rock-Breakage Amount A1 (m3) | Q (kg) | Unit Consumption (kg/m3) | Rock-Breakage Amount A2 (m3) | ||||||
| Upper bench | HR | 6.950 | 13.45 | 6.80 | 0.91 | 7.45 | 46.86 | 0.87 | 53.86 | 6.89 | 7.23 |
| UP | 6.355 | 14.32 | 6.80 | 7.45 | 47.49 | 54.58 | 6.98 | 7.33 | |||
| HSRL | 0.972 | 56.00 | 6.80 | 7.45 | 69.03 | 79.34 | 10.15 | 10.65 | |||
| Lower bench | HR | 6.330 | 12.04 | 4.00 | 0.73 | 5.52 | 31.99 | 36.77 | 8.00 | 6.67 | |
| UP | 0.762 | 56.00 | 4.00 | 5.52 | 48.78 | 56.07 | 12.20 | 10.16 | |||
| Guide hole | HR | 4.823 | 9.23 | 1.00 | 0.9 | 1.12 | 11.98 | 13.77 | 11.99 | 12.34 | |
| UP | 6.100 | 7.79 | 1.00 | 1.12 | 11.45 | 13.17 | 11.46 | 11.80 | |||
| HSRL | 0.471 | 50.00 | 1.00 | 1.12 | 19.06 | 21.90 | 19.06 | 19.63 | |||
Disclaimer/Publisher’s Note: The statements, opinions and data contained in all publications are solely those of the individual author(s) and contributor(s) and not of MDPI and/or the editor(s). MDPI and/or the editor(s) disclaim responsibility for any injury to people or property resulting from any ideas, methods, instructions or products referred to in the content. |
© 2024 by the authors. Licensee MDPI, Basel, Switzerland. This article is an open access article distributed under the terms and conditions of the Creative Commons Attribution (CC BY) license (https://creativecommons.org/licenses/by/4.0/).
Share and Cite
Peng, H.; Sheng, J.; Da, Q.; Dai, B.; Zhang, L.; Tan, L. The Vibration Response to the High-Pressure Gas Expansion Method: A Case Study of a Hard Rock Tunnel in China. Appl. Sci. 2024, 14, 6645. https://doi.org/10.3390/app14156645
Peng H, Sheng J, Da Q, Dai B, Zhang L, Tan L. The Vibration Response to the High-Pressure Gas Expansion Method: A Case Study of a Hard Rock Tunnel in China. Applied Sciences. 2024; 14(15):6645. https://doi.org/10.3390/app14156645
Chicago/Turabian StylePeng, Huaide, Jia Sheng, Qi Da, Bing Dai, Lei Zhang, and Lihai Tan. 2024. "The Vibration Response to the High-Pressure Gas Expansion Method: A Case Study of a Hard Rock Tunnel in China" Applied Sciences 14, no. 15: 6645. https://doi.org/10.3390/app14156645
APA StylePeng, H., Sheng, J., Da, Q., Dai, B., Zhang, L., & Tan, L. (2024). The Vibration Response to the High-Pressure Gas Expansion Method: A Case Study of a Hard Rock Tunnel in China. Applied Sciences, 14(15), 6645. https://doi.org/10.3390/app14156645