Abstract
Jinan City in China is known for its abundant spring water, and the protection of underground spring water transport channels is a key issue that needs to be paid attention to in Jinan subway construction. In areas where underground spring water transport channels are easily disturbed, when the shield tunnel passes through a composite formation with a permeable layer in the middle and an impermeable layer in the upper and lower parts, the underground spring water transportation channel is blocked, the spring veins are damaged, and the underground spring water is blocked in the upstream, resulting in an increase in the water pressure difference on both sides of the tunnel. In this paper, based on the working principle of a new type of pipe segment with a diversion function, a diversion function pipe model test box is designed and fabricated. Using this model box, the working state of the diversion function pipe segments is simulated. An earth pressure box and pore water pressure gauges are embedded in the model box to measure the earth pressure and pore pressure around the pipe under seepage unsymmetrical pressure. Strain gauges are attached in a circular shape on the inner side of the pipe to measure and calculate the strain and stress of the pipe. Through model tests, the effective repair of the diversion pipe on blocking groundwater flow and the relief effect of the unsymmetrical pressure of the pipe are verified.
1. Introduction
The Jinan Urban Rail Transit underground construction is located in an area with complex hydrogeological conditions, where the protection of the groundwater ecosystem, especially limestone fissures, karstic voids, and pebble interlayers as the key conduits for groundwater movement, is an urgent technical challenge. To resolve these engineering issues, it is necessary to focus on the key scientific issue of the groundwater flow mechanism around the tunnel during the construction and operation process of the metro, and to analyze the pore water pressure, effective stress, and total stress distribution of the surrounding rock and soil, as well as the stress and deformation of the pipe segments [1,2,3,4]. Wang Kezhong [5] designed a complex physical simulation of the flow field during the construction process based on the Jinpin second-level hydropower station diversion tunnel project in China. Zou Jinfeng [6] reconstructed the mechanical model, considering the combined action of permeability and axial force, and proposed a solution for the stress–strain behavior of the softened surrounding rock. Zhang Bingqiang [7] used the principle of the mirror method to derive an analytical solution to the non-Darcy seepage field for shallowly buried single-hole and double-hole soft clay layer circular tunnels. Zhu Chengwei [8,9] adopted the methods of angle preservation transformation and superposition to deduce the steady-state seepage field analytical solution for twin parallel tunnels. Guo Yufeng [10] used the method of angle preservation transformation and the Schwartz iteration method to obtain high-precision solutions, overcoming the large errors of the superposition method near the tunnel.
The pore water pressure distribution in the rock and soil surrounding tunnels is of great significance for shield segment loading and groundwater flow pathways. Chen Fben et al. [11,12,13] employed numerical methods to analyze the characteristics of pore water pressure distribution around tunnels. Liu Yin et al. [14,15,16] used analytical methods to derive formulas for calculating pore pressure in the surrounding soil under different conditions. Zhang Dongmei et al. [17,18,19,20,21,22,23] conducted indoor experiments and field monitoring to propose that tunnel leakage often occurs at the joints between shield segments and injection holes, and that the pore pressure around the leaking area decreases, mainly influenced by the total water head difference between the surface and the tunnel’s water infiltration boundary. Huang Hongwei et al. [24,25,26,27,28] utilized numerical simulation to find that long-term seepage leads to a significant increase in the internal forces of the shield segments at the arch of a tunnel, causing the tunnel to deform into an elliptical shape, and the unloading effect of the erosion process results in the shield segments lifting significantly. Li Xue et al. [29,30,31,32,33,34] concluded from monitoring data that the calculated axial force of the shield segments using the commonly used correctional methods in design is less than the actual axial force, which should be given attention during the design phase of shield segments.
In the current literature, there is a greater focus on the deformation and stress distribution of shield tunnel segments and the surrounding rock and soil under the influence of seepage action. However, studies on the complete blocking of groundwater flow functions in underground structures are relatively scarce. Professor Hashimoto, the President of the Japan Geo-Research Institute, once introduced groundwater into the underground structure through a penetrating sidewall of a tunnel, allowed it to circulate inside the structure through pipes, and then flow out into the surrounding formation on the other side of the tunnel sidewall for the protection and restoration of groundwater ecology. This paper introduces a new type of pipe segment with a diversion function, and based on its working principle, designs, fabricates, and conducts indoor model tests using a guide function pipe model test box. This study aims to analyze the repair effect of the diversion function pipe on the blockage of groundwater flow in subway barriers and the relief effect of seepage unsymmetrical pressure.
2. Materials and Methods
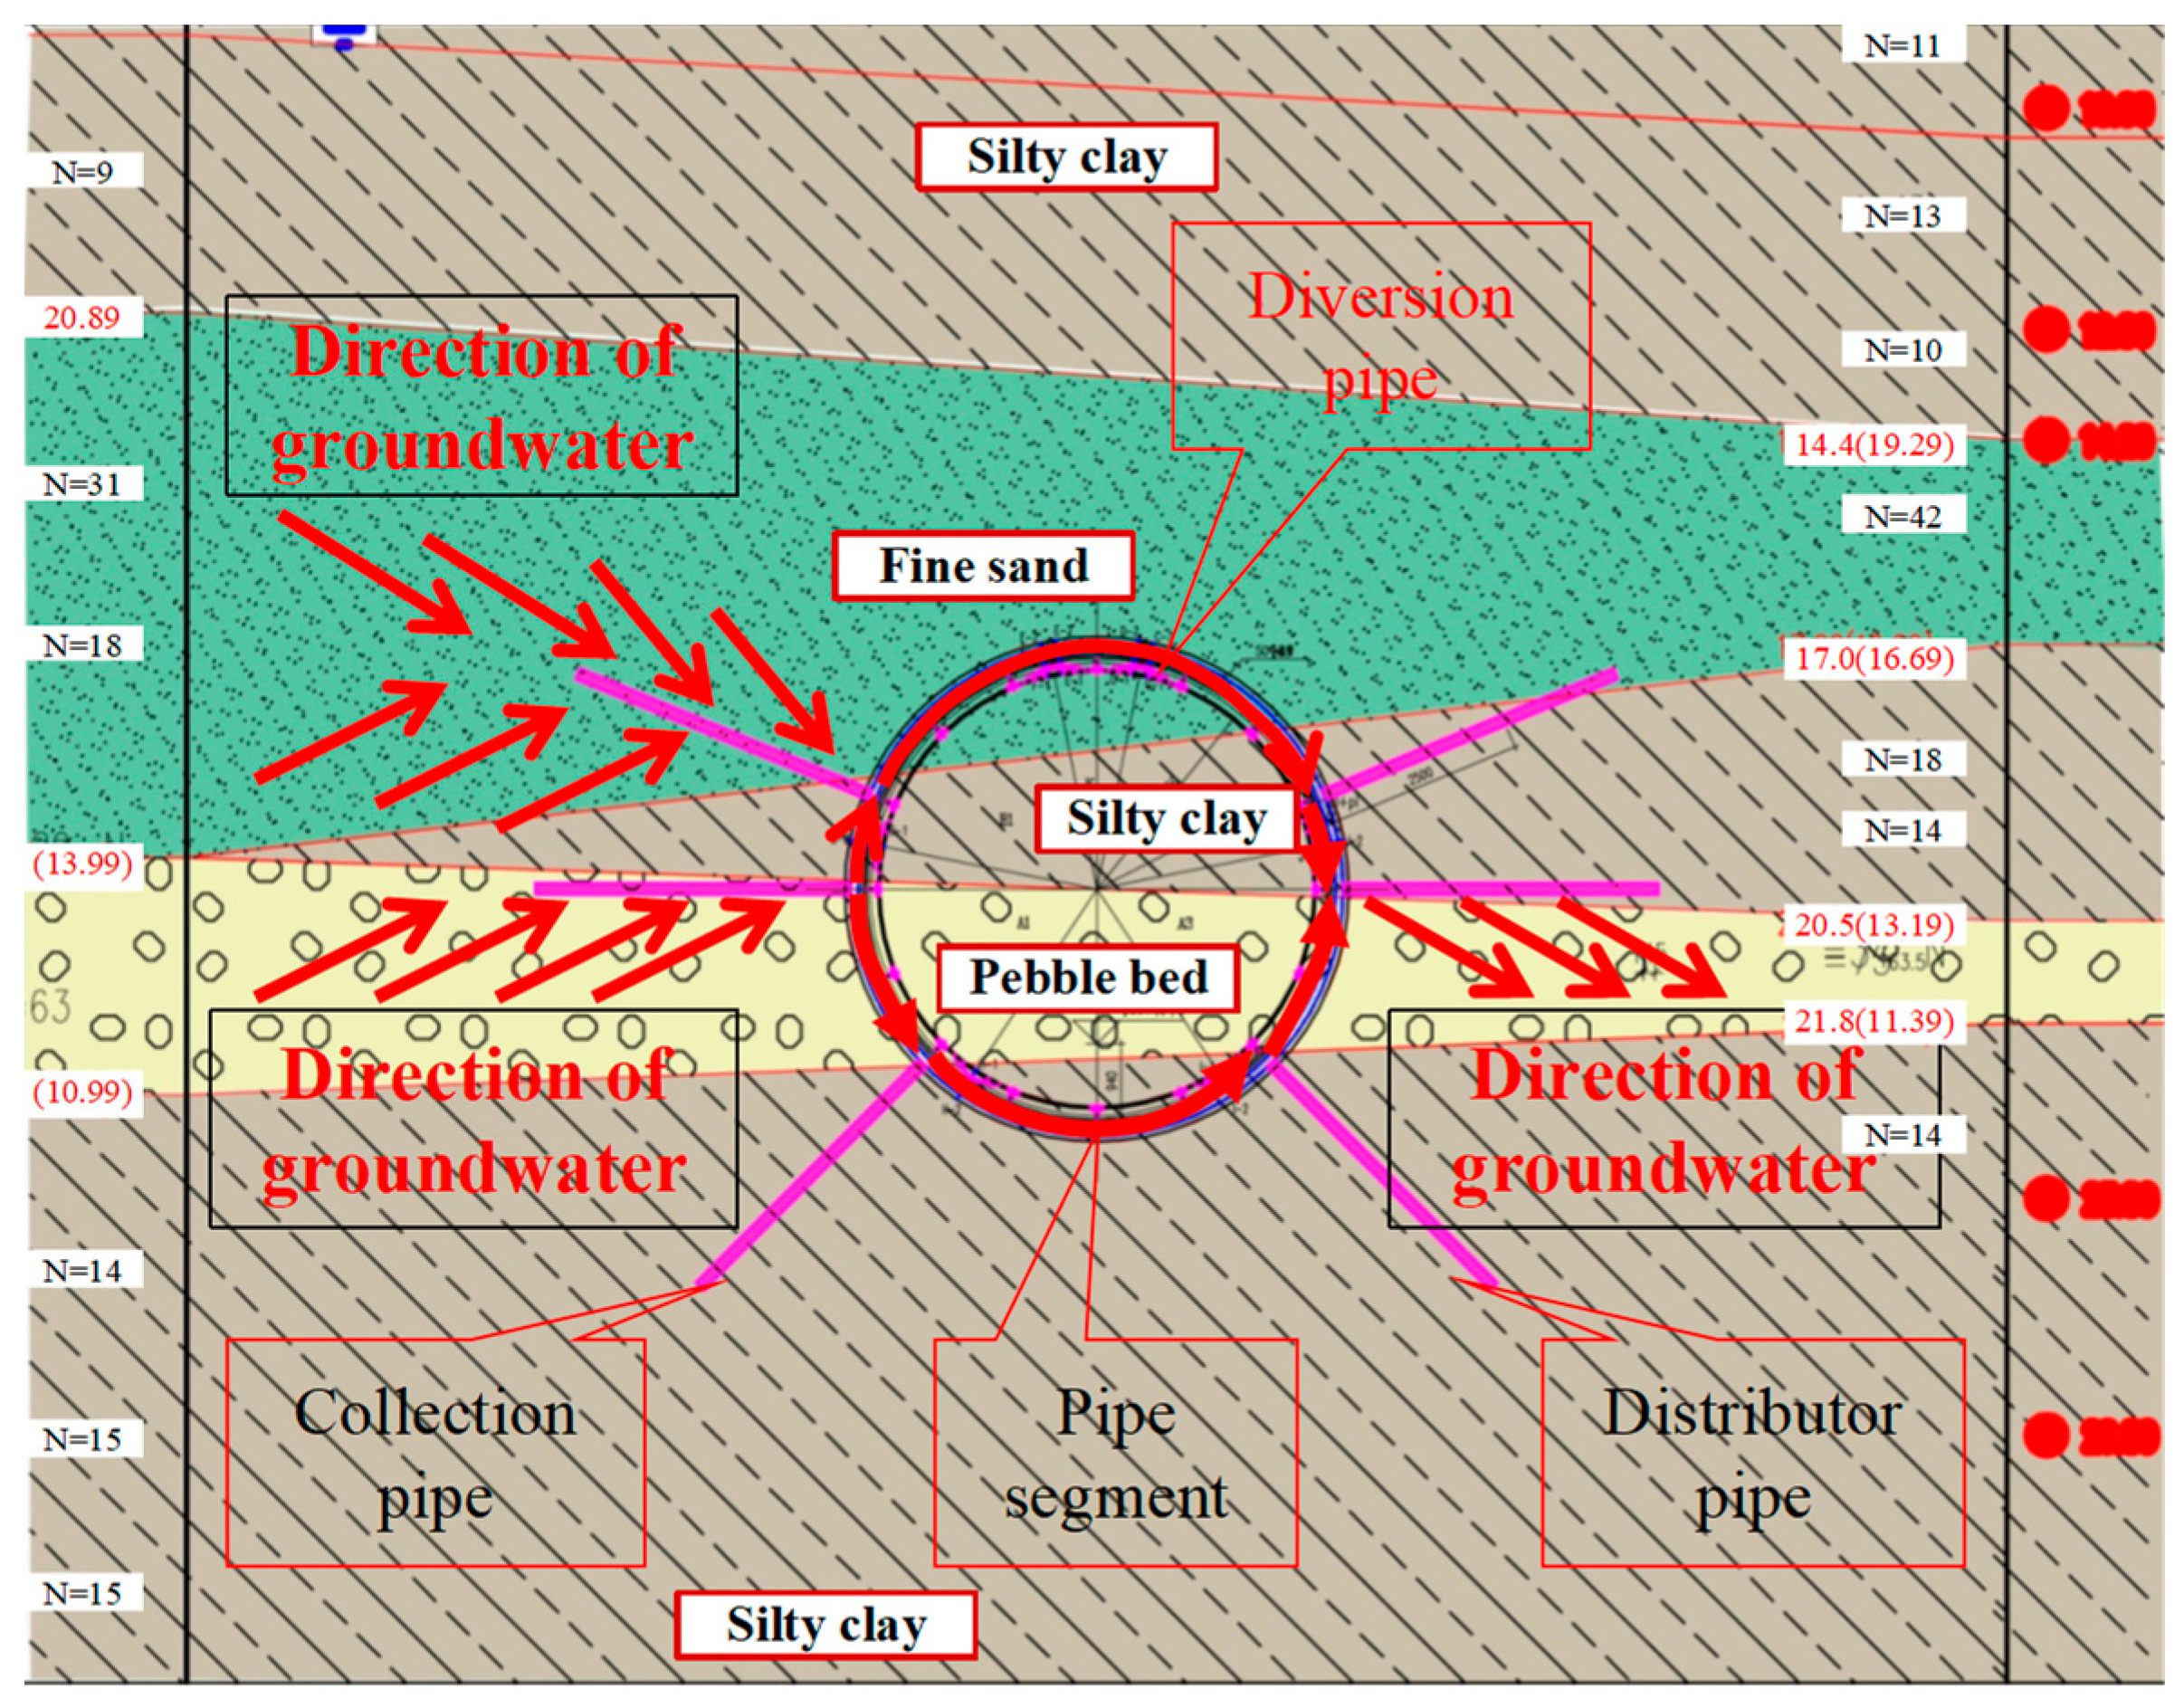
The R1 line of Jinan subway is located between Wang Fu Zhuang station and Da Yang Zhuang station, constructed using shield tunneling methods. The section between Jinan West Station and Yan Ma Zhuang West Station on the R1 line passes through strata where two clay layers containing pebble layers alternate, and these strata contain a large amount of groundwater, often with artesian properties. The pebble layer serves as the main channel for groundwater flow. In some sections, the shield-laid tunnel lining blocks the groundwater transportation passage completely, causing upstream back-water, and the lining is subjected to lateral seepage pressure, which makes the operation and maintenance of the tunnel linings challenging, as shown in Figure 1.
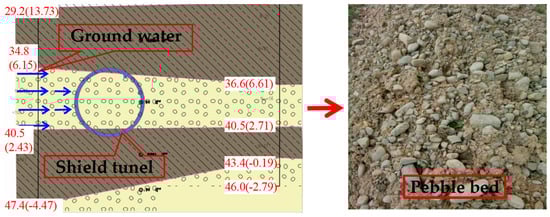
Figure 1.
Shield tunneling through upper and lower impermeable water transport interlayers (pebbly strata).
3. Design and Fabrication of Diversion Function Pipe Segment Model Test Box
3.1. Working Principle of Diversion Function Pipe Segment
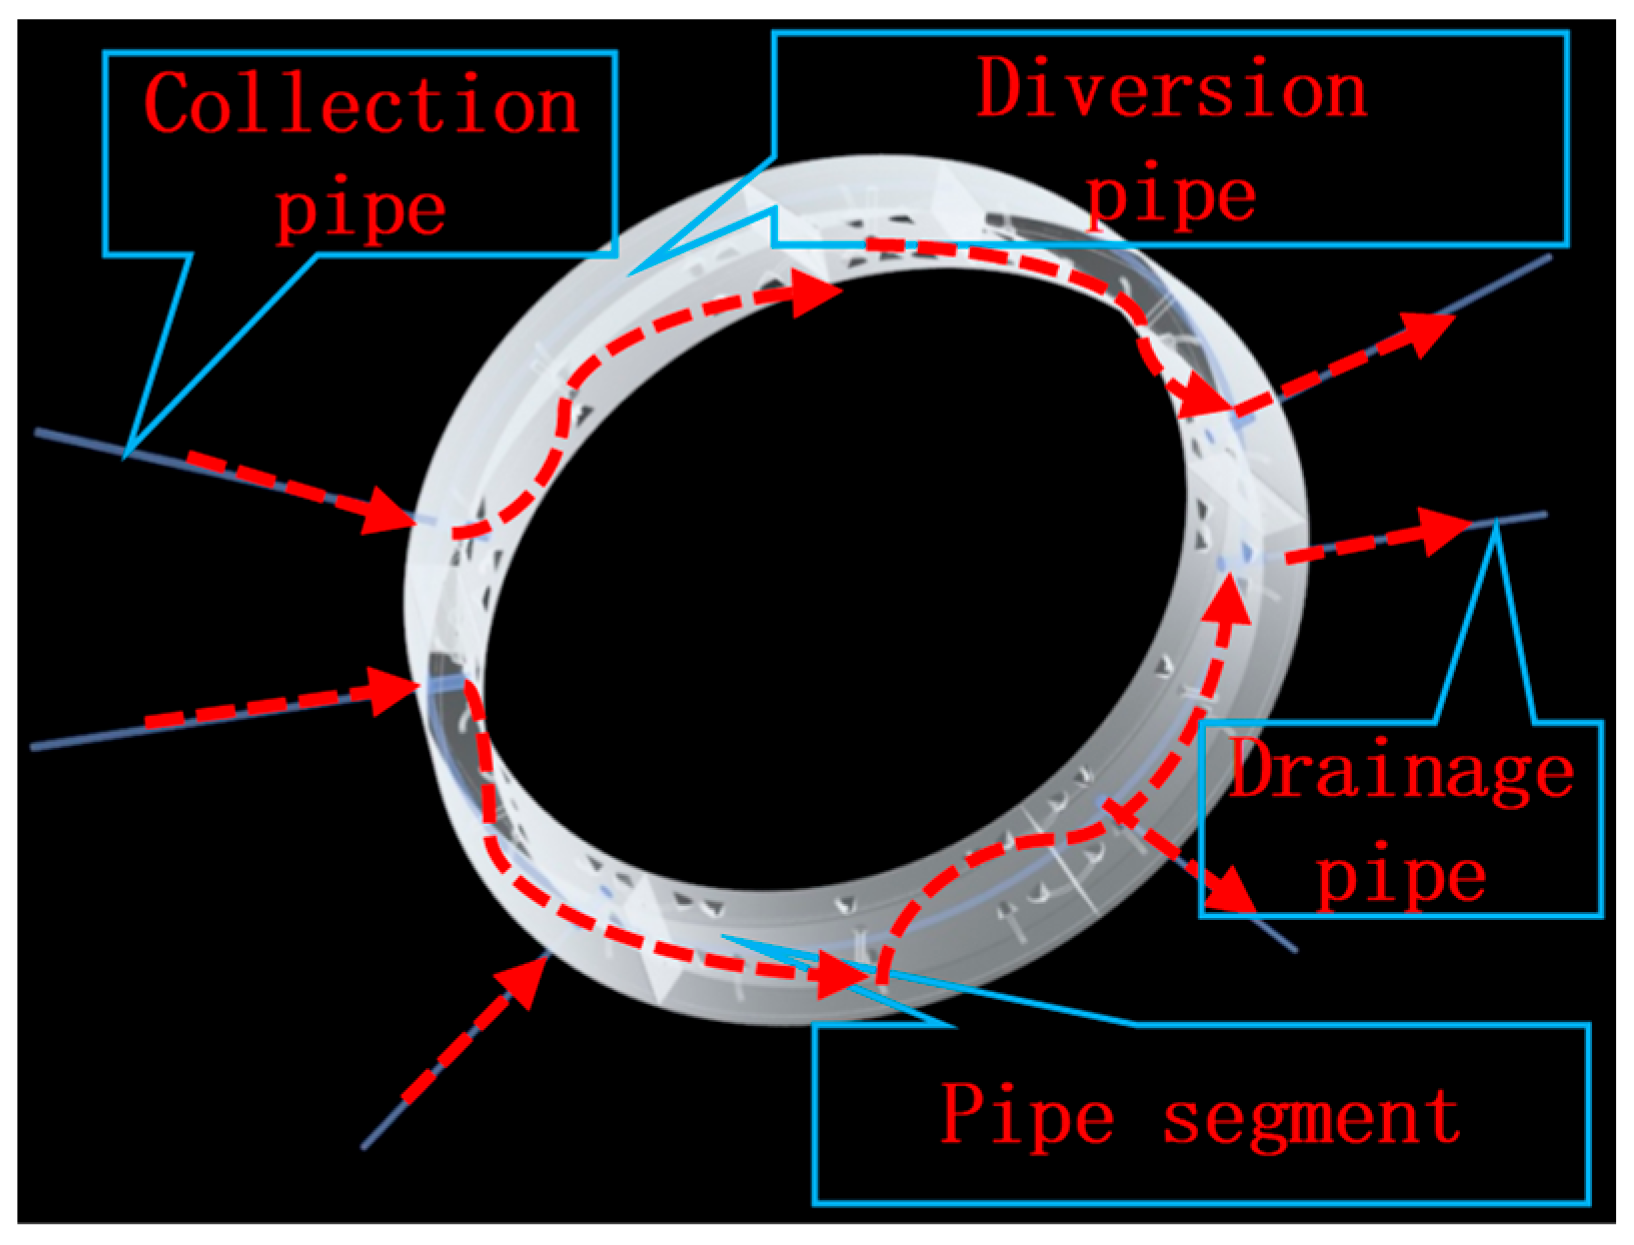
To solve issues such as the destruction of groundwater transport channels due to the barrier effect of shield tunneling, the accumulation of upstream water, and the increase in water pressure difference on both sides of the tunnel, a novel pipe segment with a diversion function has been designed. The guide function pipe segment mainly consists of pipe segments, diversion pipes, and distribution pipes. The diversion pipes are pre-embedded inside the concrete pipe segments, and they are used to connect the collection pipes with the distribution pipes. The collection and distribution pipes are used to divert water from one side of the pipe segment to the other. The diversion pipe and distribution pipes form a transportation channel for water, as shown in Figure 2.
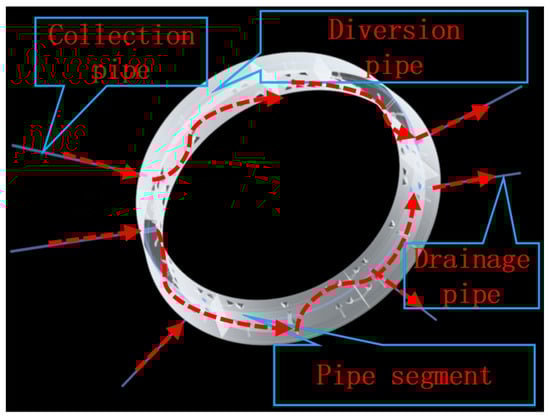
Figure 2.
Operating concept of diversion function pipe segments.
Groundwater can flow into the pipe segments through the collection pipe, and then to the ground via the opposite side’s collection pipe, repairing the flow function of groundwater obstructed by the shield-laid pipe segments. The flow of groundwater is supplemented, and the water pressure difference on both sides of the tunnel is reduced, protecting the aquifer system and the ecological environment of groundwater, alleviating unsymmetrical pressure on the pipe segments, as shown in Figure 3.
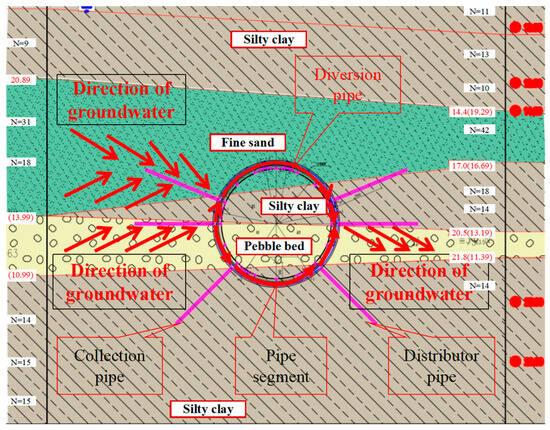
Figure 3.
Schematic diagram of groundwater flow through diversion function pipe segments.
3.2. Design of the Diversion Function Pipe Model Test Box
Pore water pressure and earth pressure around the guide function pipe segments are the key indicators for evaluating the restoration of groundwater flow function. The stress state of the guide function pipe segments under different water pressures is crucial for the operation and durability of the pipe segment. However, field monitoring faces challenges, such as multiple interference factors, high costs, and great difficulties, making it extremely difficult to achieve effective monitoring. Building a scaled model test box that simulates the working condition of the guide function pipe segment (referred to as the “test box”) is an effective solution to this problem.
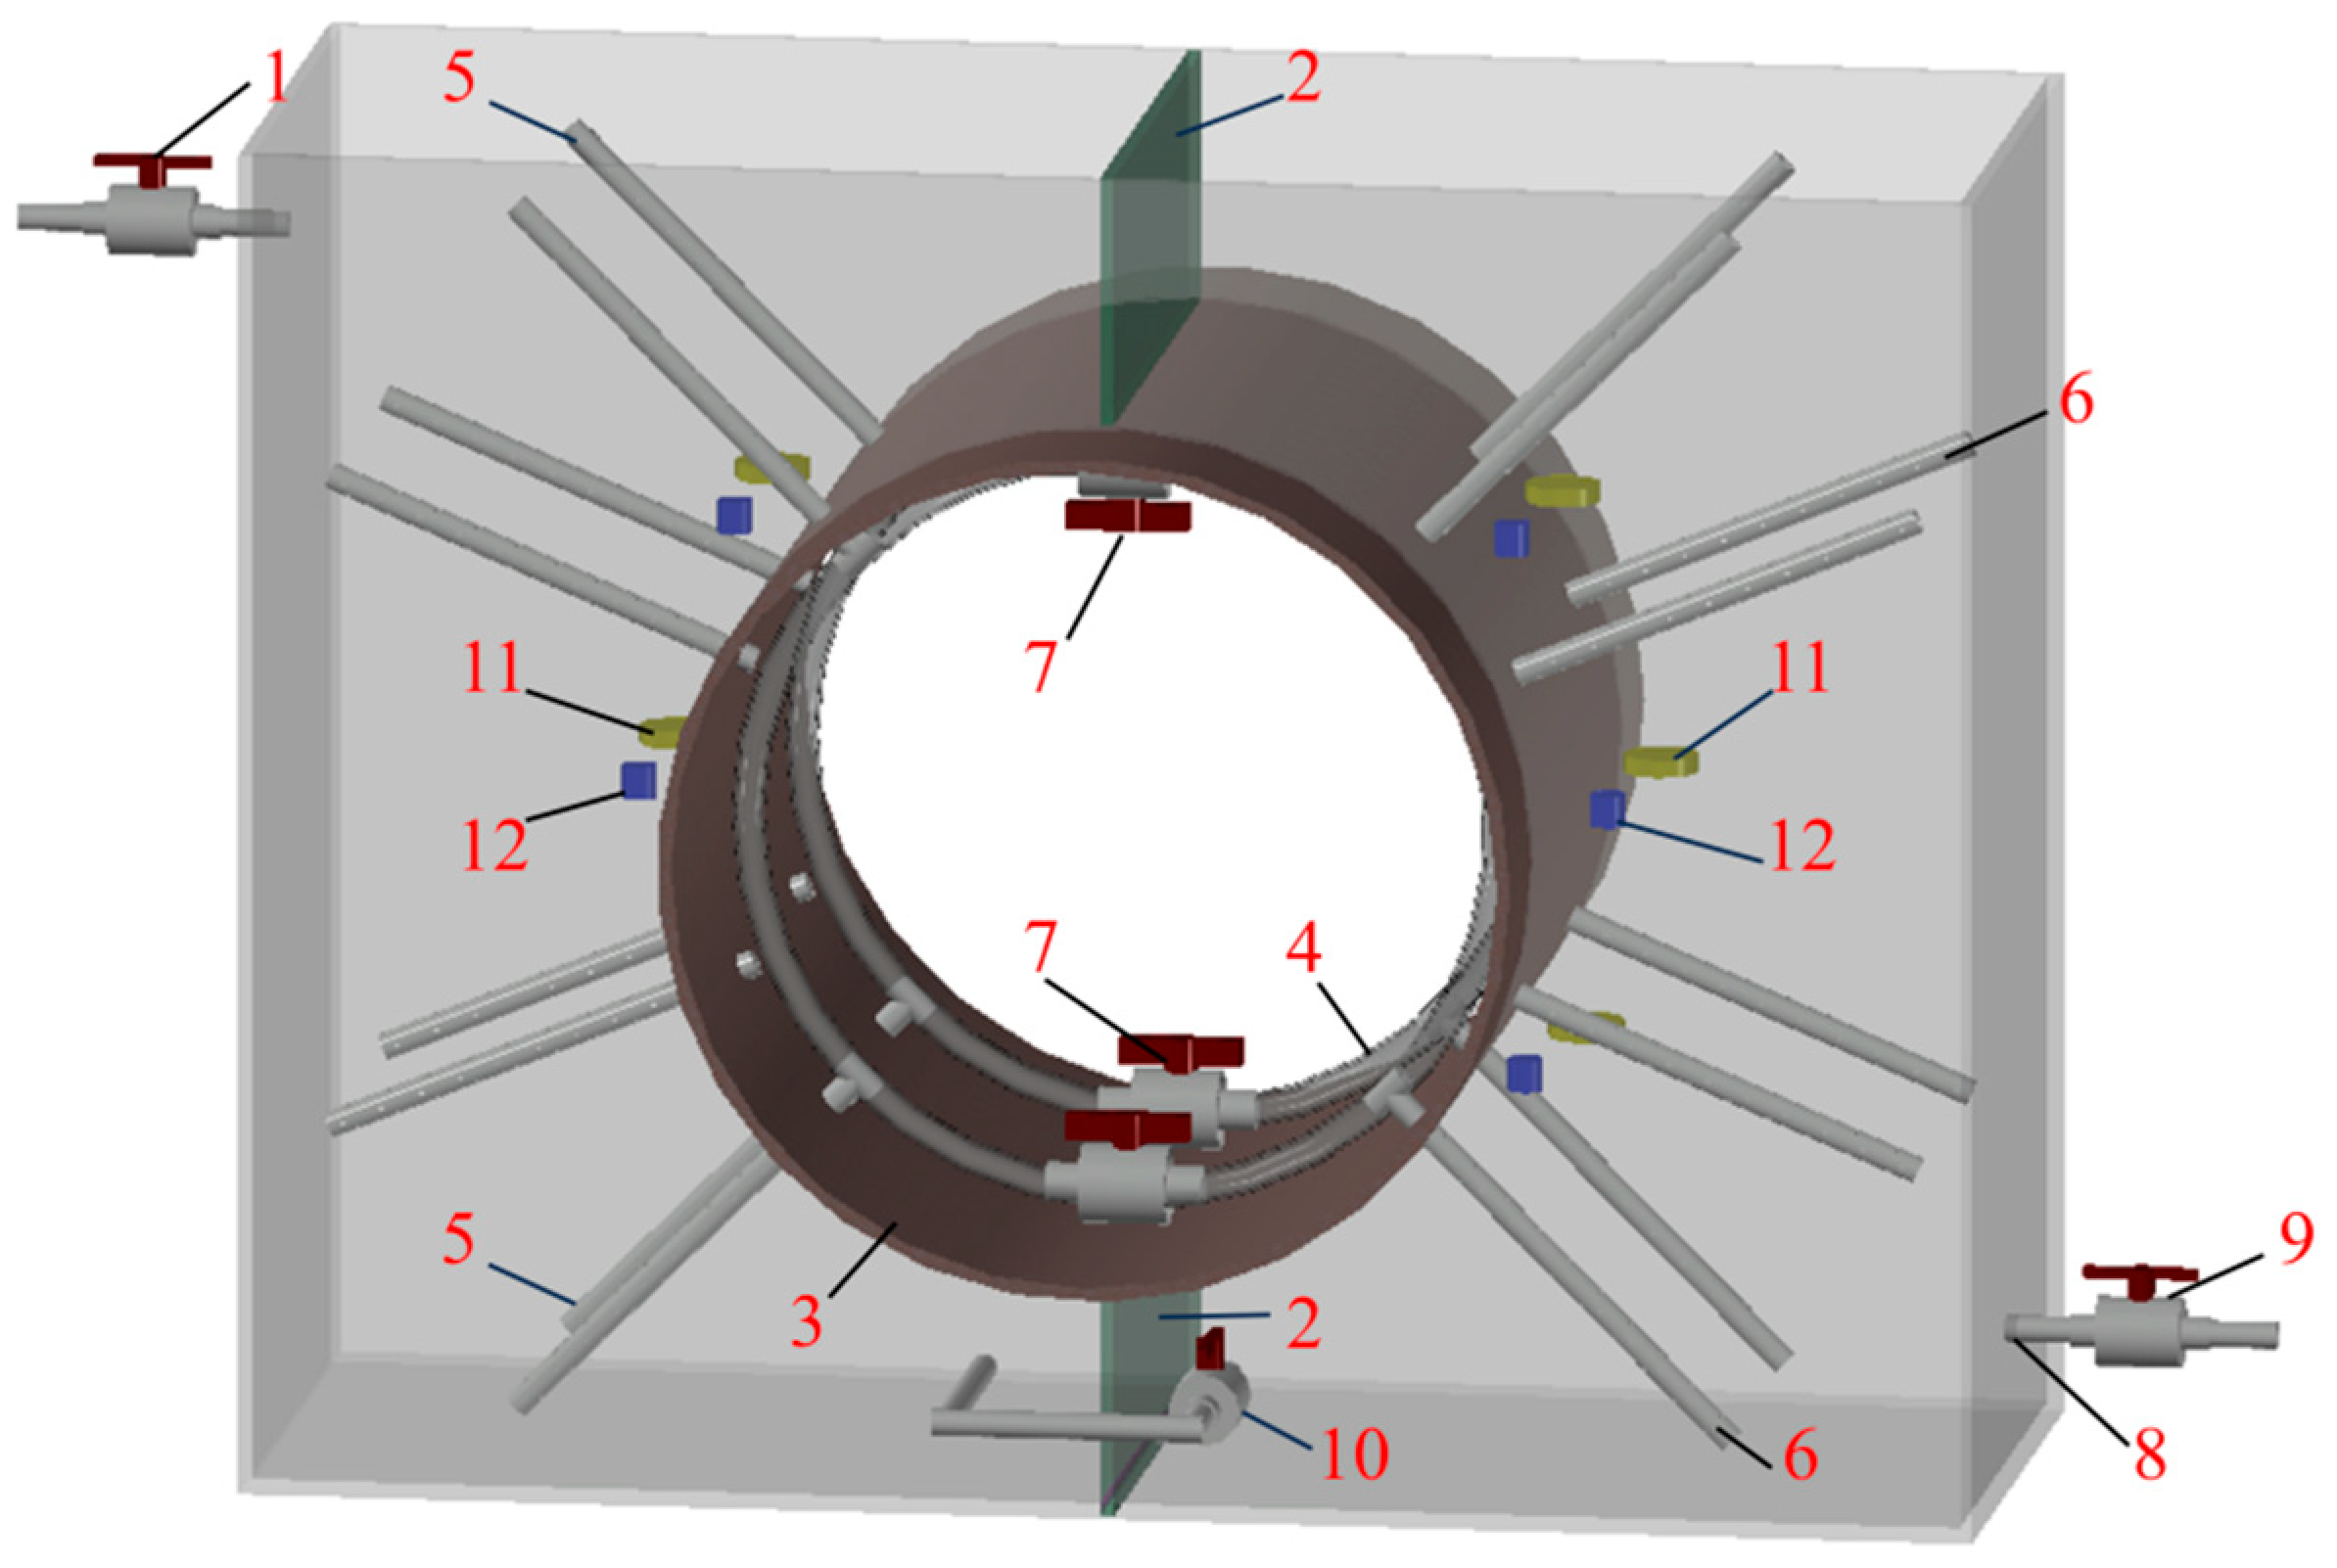
The test box is constructed from 10 mm thick tempered glass using the lamination method, with dimensions of 1280 mm × 480 mm × 1000 mm, as shown in Figure 4. The joints between the tempered glass pieces are bonded with special adhesive to ensure the box has good sealing performance. The model box is filled with sieved, medium-grained sand to simulate the permeable pebble layer.
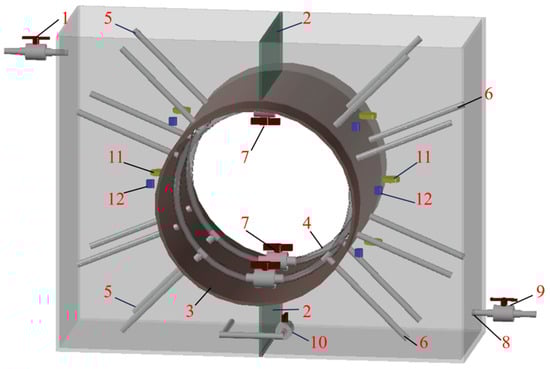
Figure 4.
A schematic diagram of the model test box.
In Figure 4, the water injection and pressure hole (1) is located on the upper middle position of the left sidewall of the test box, with a diameter of 20 mm, mainly used for injecting water and increasing pressure. The upper and lower glass partitions (2) are used to simulate the impervious layers. The iron rings (3) simulate the pipe segments of the tunnel, plastic soft tubes 4 simulate the diversion pipe, arranged in a ring shape within the iron ring, simulating a 20 mm diameter hole reserved on the pipe segments. The collection pipe (5) and drainage pipe (6) pass through the reserved holes, distributed on both sides of the glass partition, connected to the diversion pipe with three-way connections, and the diversion pipe is equipped with upper and lower switches (7) to control the flow rate of the diversion flow. The blowoff hole (8) is located at the lower middle position of the right sidewall of the test box, with a diameter of 20 mm. The switch (9) is installed at the blowoff hole, controlling the flow speed of the water from the blowoff hole, and the drainage hole (10) is located on the front sidewall of the test box, one on each side, symmetrically distributed, with a diameter of 20 mm, mainly used for draining water during the experiment.
The model box with layered sand filling, the earth pressure cell, and the pore water pressure gauges are buried symmetrically at the side of the pipe section at distances of 0.3 m, 0.5 m, and 0.7 m from the bottom of the model box, respectively, with one earth pressure cell (11) and one pore water pressure gauges (12) buried on both sides at the same height around the model box, and strain gauges are attached at eight test points on the inner side of the pipe section along its longitudinal center, every 45° apart, including above, below, left, right, left-up, right-up, left-down, and right-down, with strain gauges attached circumferentially inside the pipe section to measure the radial deformation of the pipe.
At the beginning of the experiment, water is continuously injected into the model box through the water injection hole. The incoming water on one side of the intake flows into the diversion pipe through the collection pipe, and then into the dispersal pipe on the other side, and finally into the sand layer through the dispersal pipe. Meanwhile, the switch to the relief hole is opened, allowing water to flow out of the relief hole. Under stable water injection conditions, the water level on the left side of the model box remains unchanged. The switch of the diversion pipe and the relief hole work together to adjust the flow rates of the diversion pipe and the relief hole. A constant water pressure difference is maintained between the partitions on both sides of the model box, which is set to a certain value. The data from the earth pressure cell and pore water pressure gauges are monitored, and the distribution of earth pressure and pore water pressure around the pipe segment is analyzed.
3.3. Fabrication of the Model Box
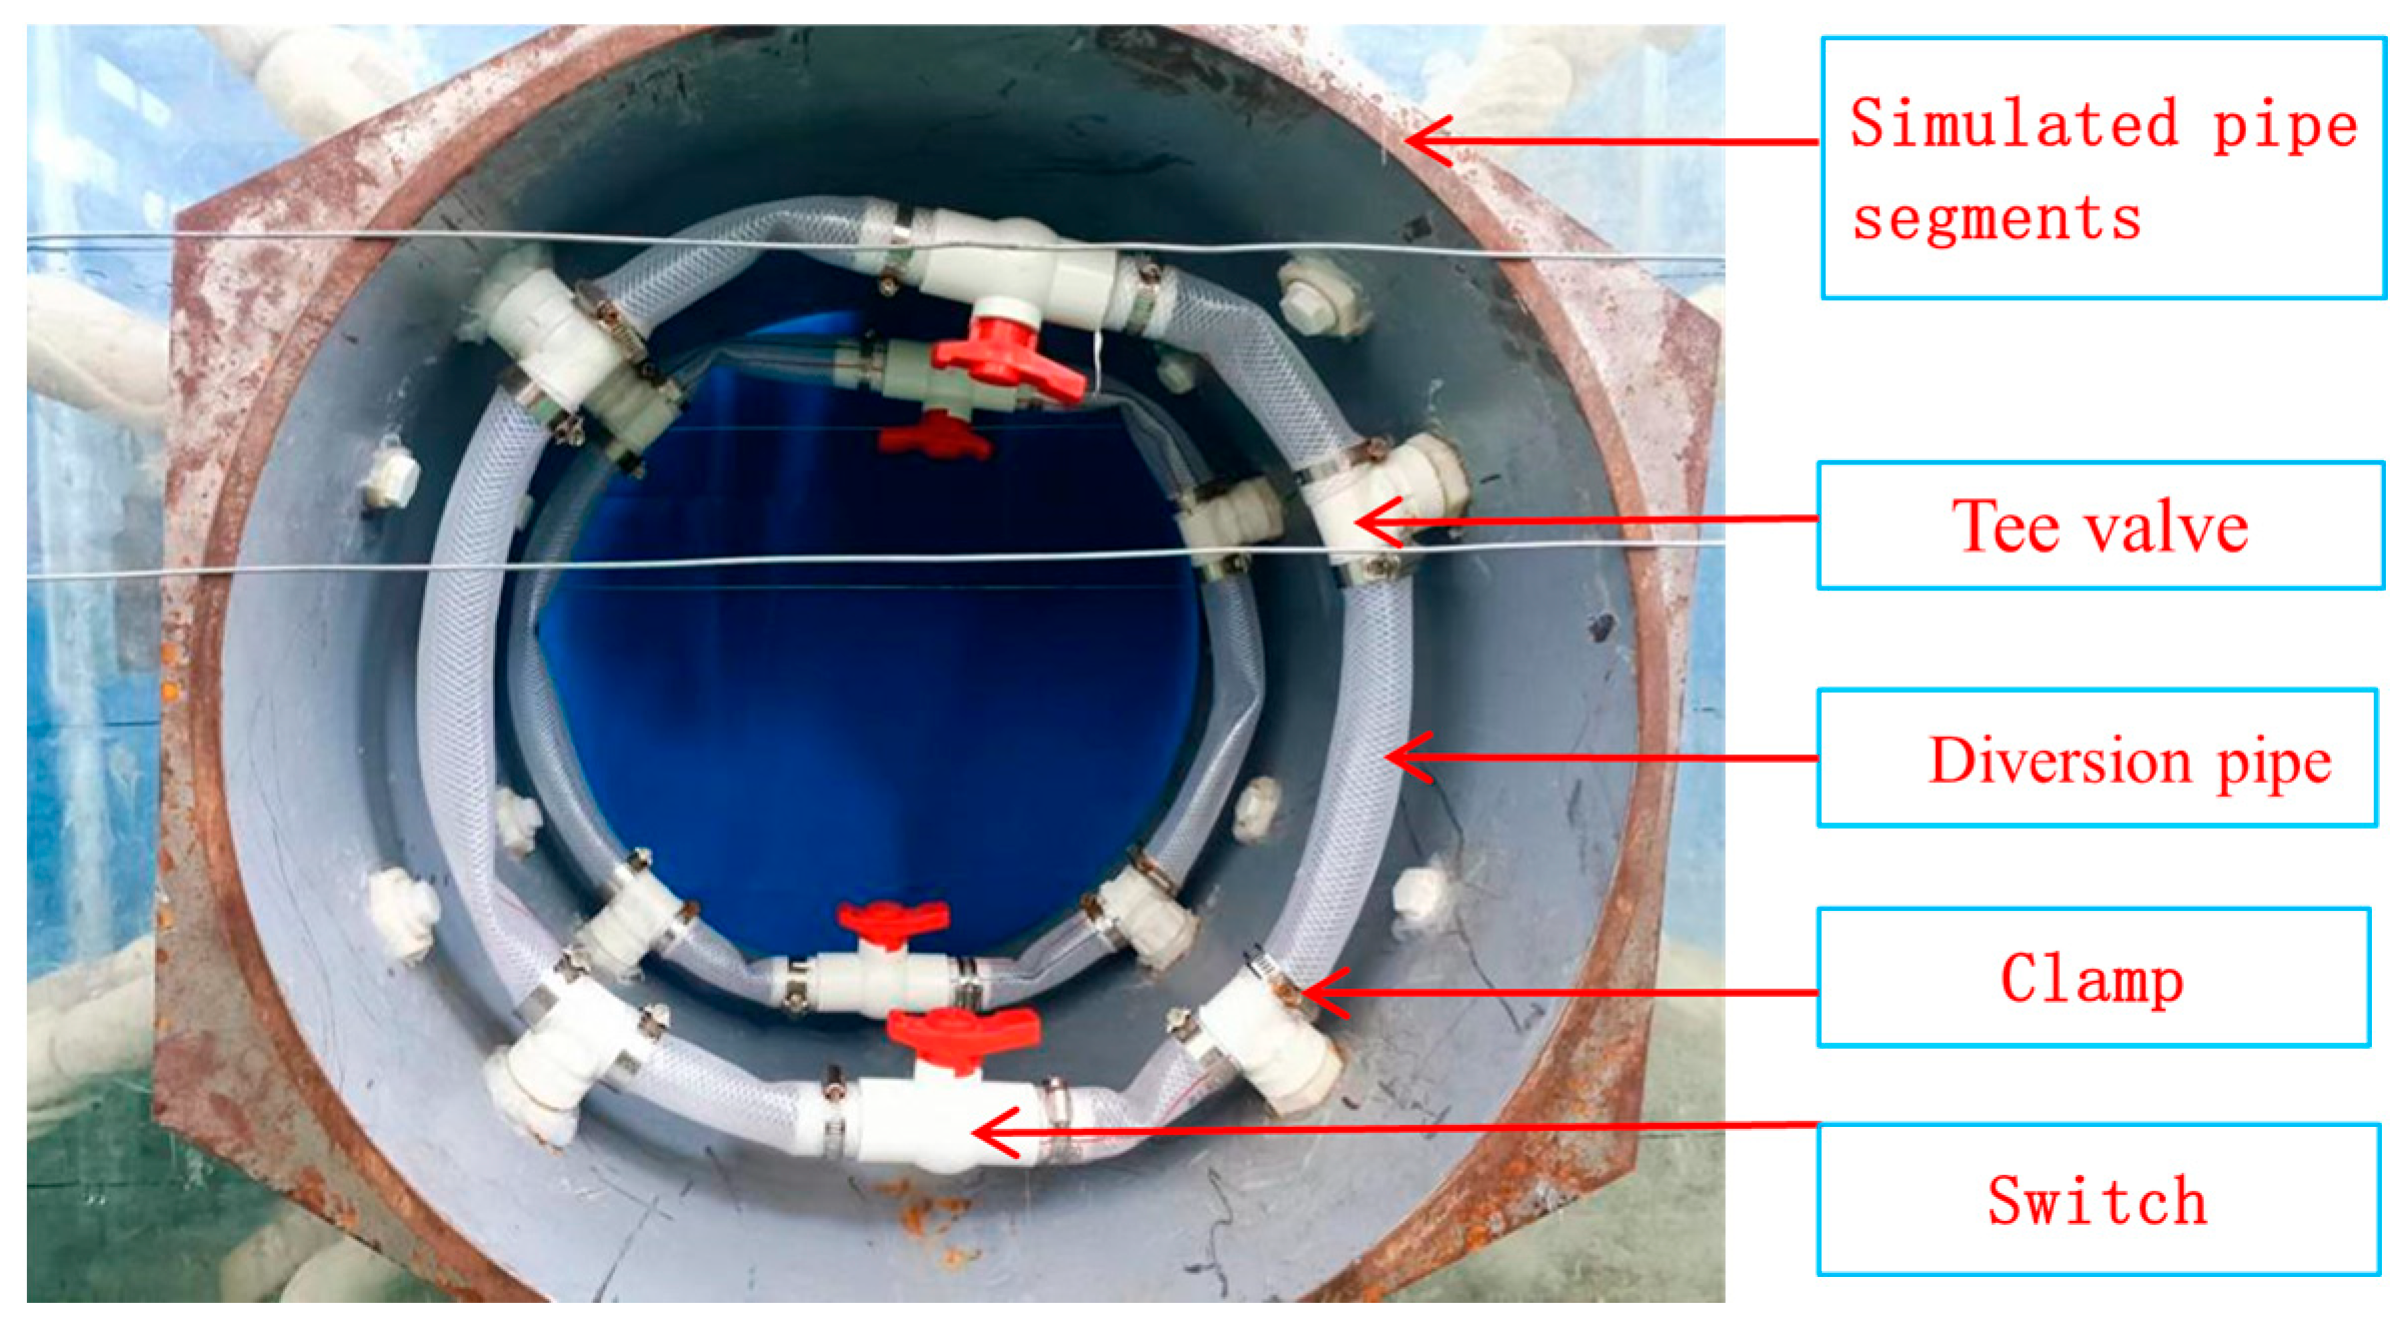
The simulated pipe segment are made from 630 mm diameter, 700 mm long, and 10 mm thick iron rings. Holes with a diameter of 20 mm are punched at the designed intervals on the iron rings. The collection and dispersal pipes are made from PPR (Polypropylene Random) pipes with a diameter of 20 mm and a wall thickness of 2.5 mm. Each collection or dispersal pipe is 32 cm long, and 20 mm diameter holes at 3 cm intervals are cross-drilled to create a perforated tube, ensuring that water can flow from the collection pipe into the diversion pipe, and finally exit from the dispersal pipe. The connection between the collection and dispersal pipes and the sealing plastic fittings is made using hot fusion, as shown in Figure 5. A layer of filter cloth is wrapped around the outside of the collection and dispersal pipes and fixed with rubber bands to prevent soil from entering the diversion function pipe and blocking the flow of water. The completed collection and dispersal pipes are installed in the designated holes of the pipe segments, as shown in Figure 6.
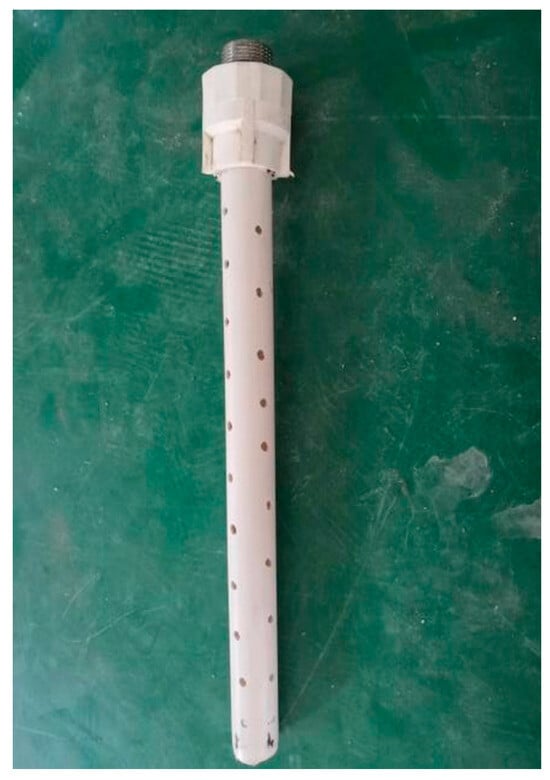
Figure 5.
Collector–distributor pipe.
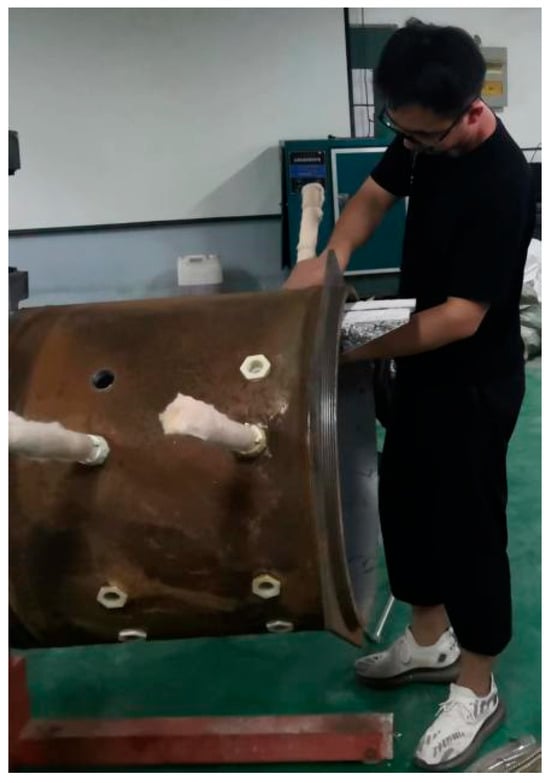
Figure 6.
Installation of collector–distributor pipes.
The diversion pipe is made of transparent plastic hose with easily stretchable ends for convenient connection, with a diameter of 25 mm and a wall thickness of 2.5 mm. It is connected to the plastic fittings through a tee joint. The diversion pipe, tee, and flow control valve connection are all secured with clamps, as shown in Figure 7. All the connections are sealed properly to prevent any leakage.
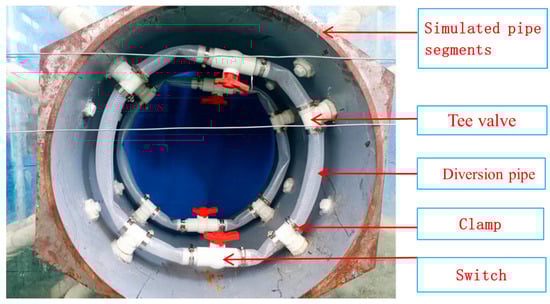
Figure 7.
Connection of the infusion tube to the collector–distributor pipes.
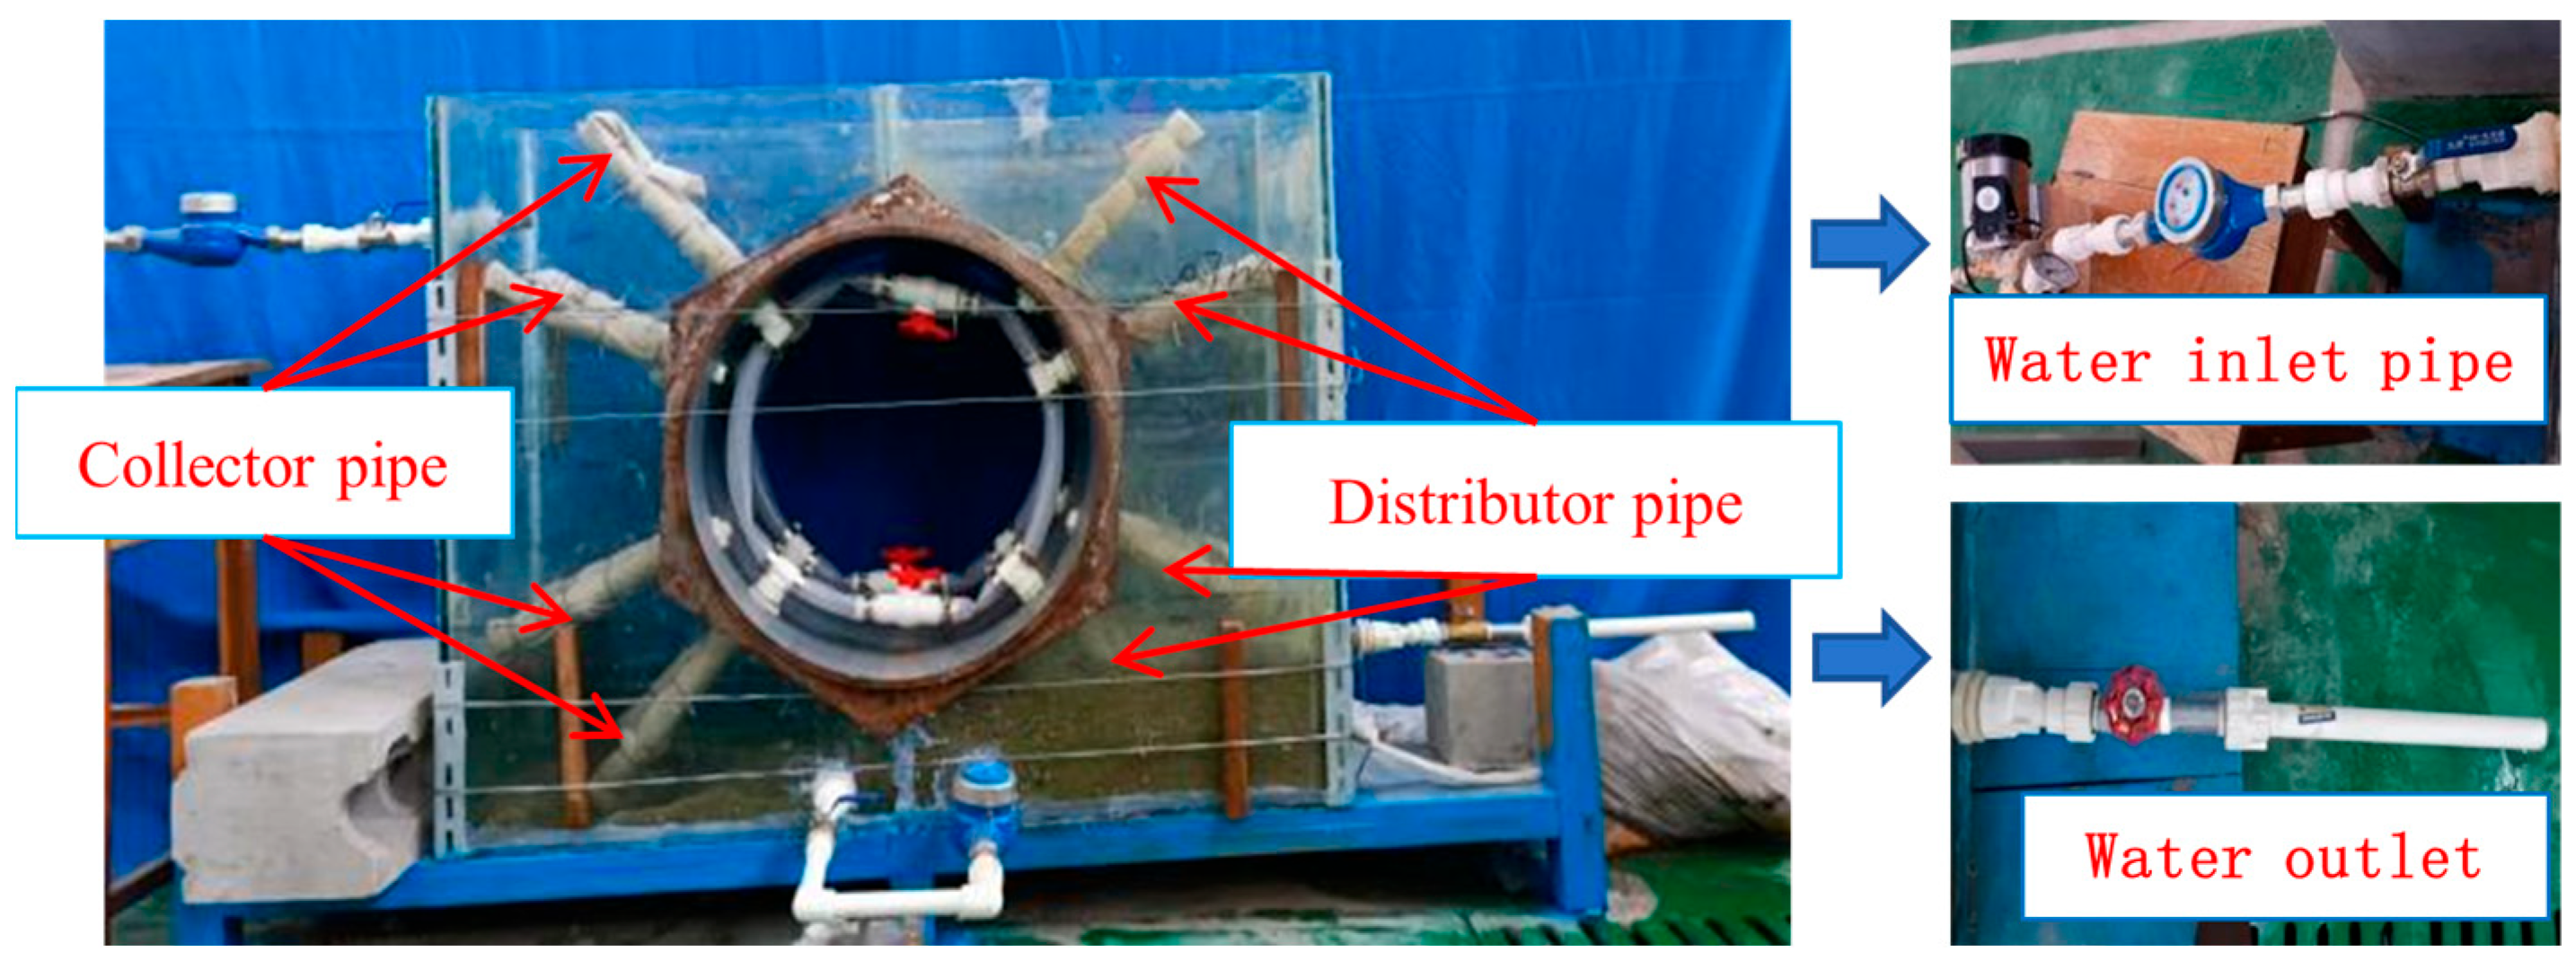
The feedwater pipe is equipped with a booster pump, water meter, and valve. After assembly, it is installed at the water injection and pressurization opening of the glass tank. The PPR pipe is connected to the internal thread through a tee joint via heat fusion, and then connected to the valve. To strengthen the glass tank and enhance its ability to bear internal water and soil loads, angle irons are reinforced at the bottom of each edge of the glass tank, and additional angle irons are reinforced every 25 cm above using wire to wrap and fix them. The overall structure of the diversion function pipe test box before filling with sand is shown in Figure 8.
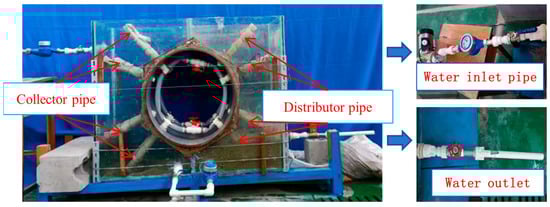
Figure 8.
Overall structure of model box of diversion function pipe segment.
3.4. Layered Sand Filling of the Test Box and Instrumentation Embedment
3.4.1. Layered Sand Filling of the Test Box
Before filling the test box with sand, the model box is filled with water to observe if there are any leaks at the seams and pipe connections. Subsequently, the water is drained through the drainage hole. During the experiment, the sand is layered using the rainfall method and compacted within the model box, maintaining a consistent height of 1.0 m from the bottom of the model box. Each layer of sand is filled to a height of 0.2 m, with strict control over the quality and height of each layer to ensure that the soil in the model box is dense and saturated. The test elements are buried simultaneously with the sand, as shown in Figure 9.
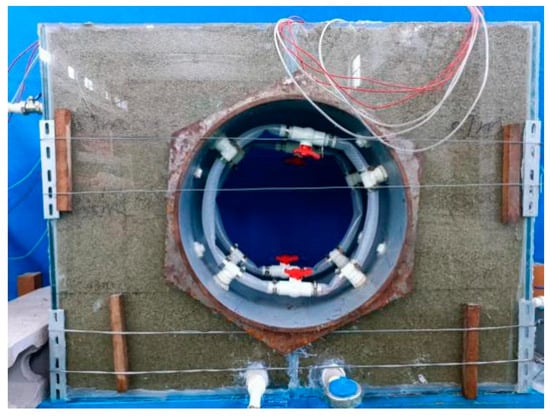
Figure 9.
Layered sand filling for model box.
3.4.2. Instrumentation Embedment in the Test Box
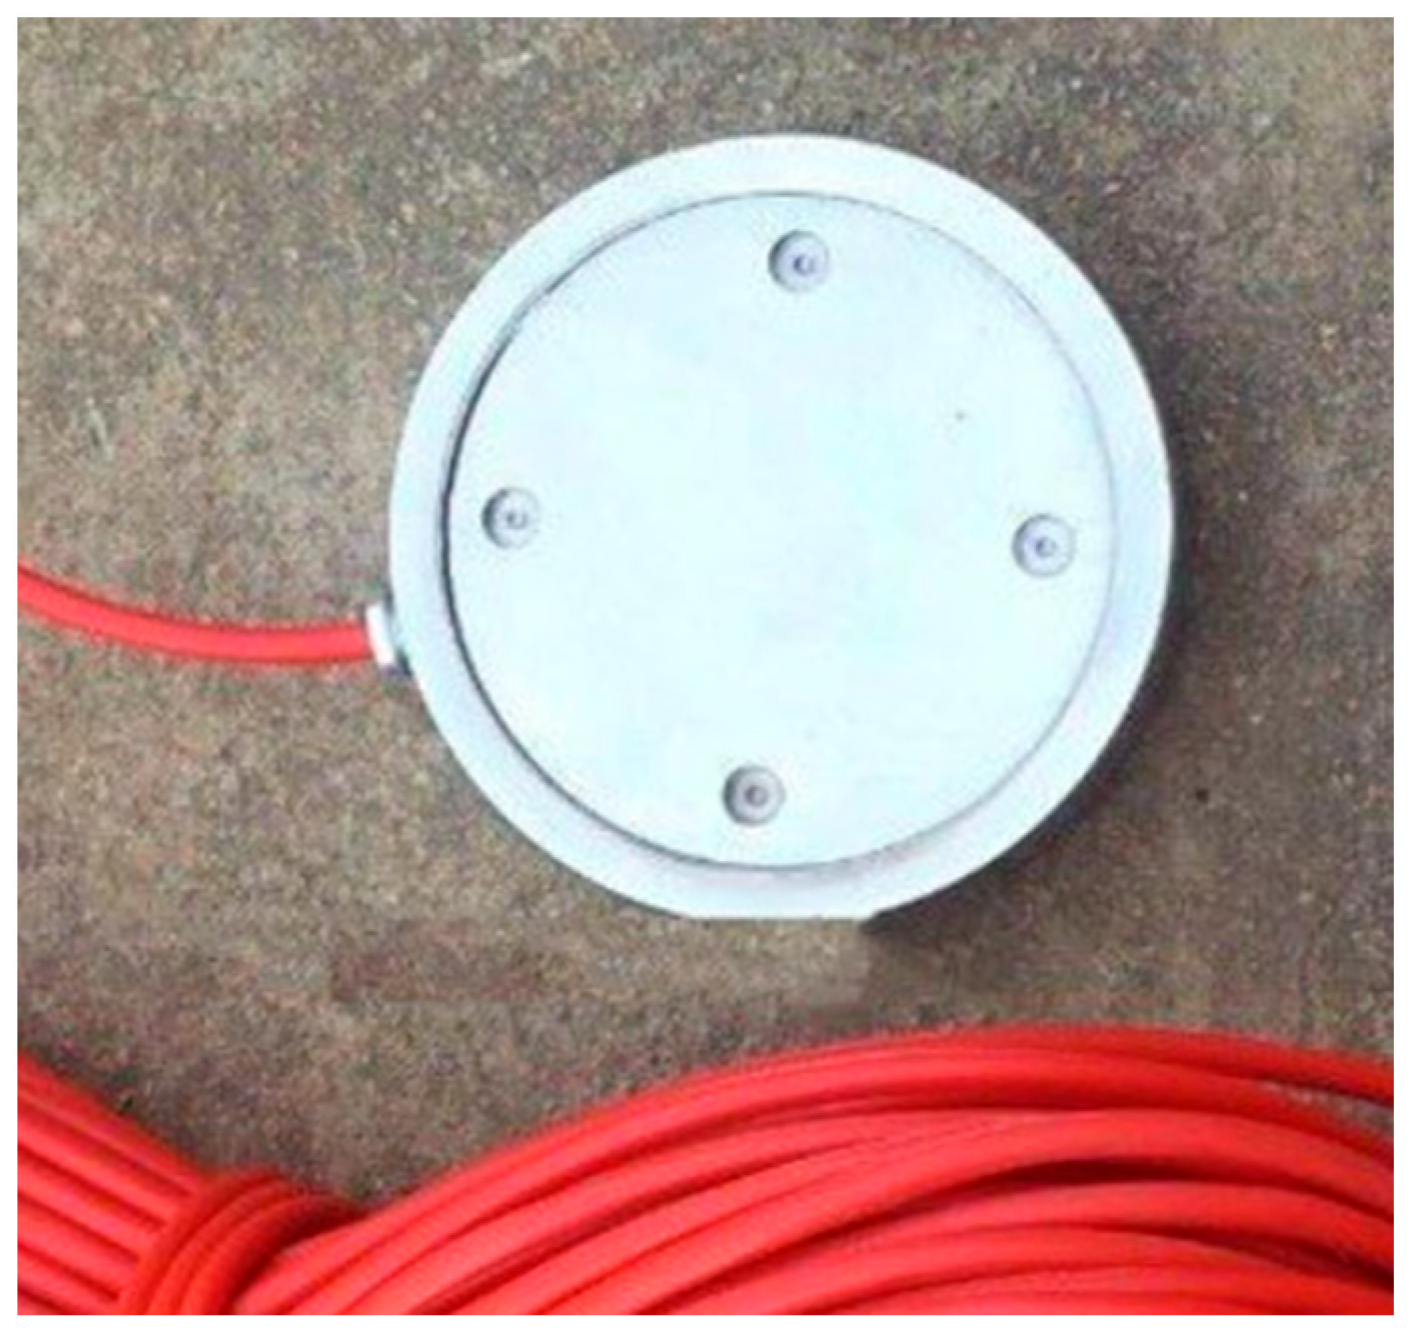
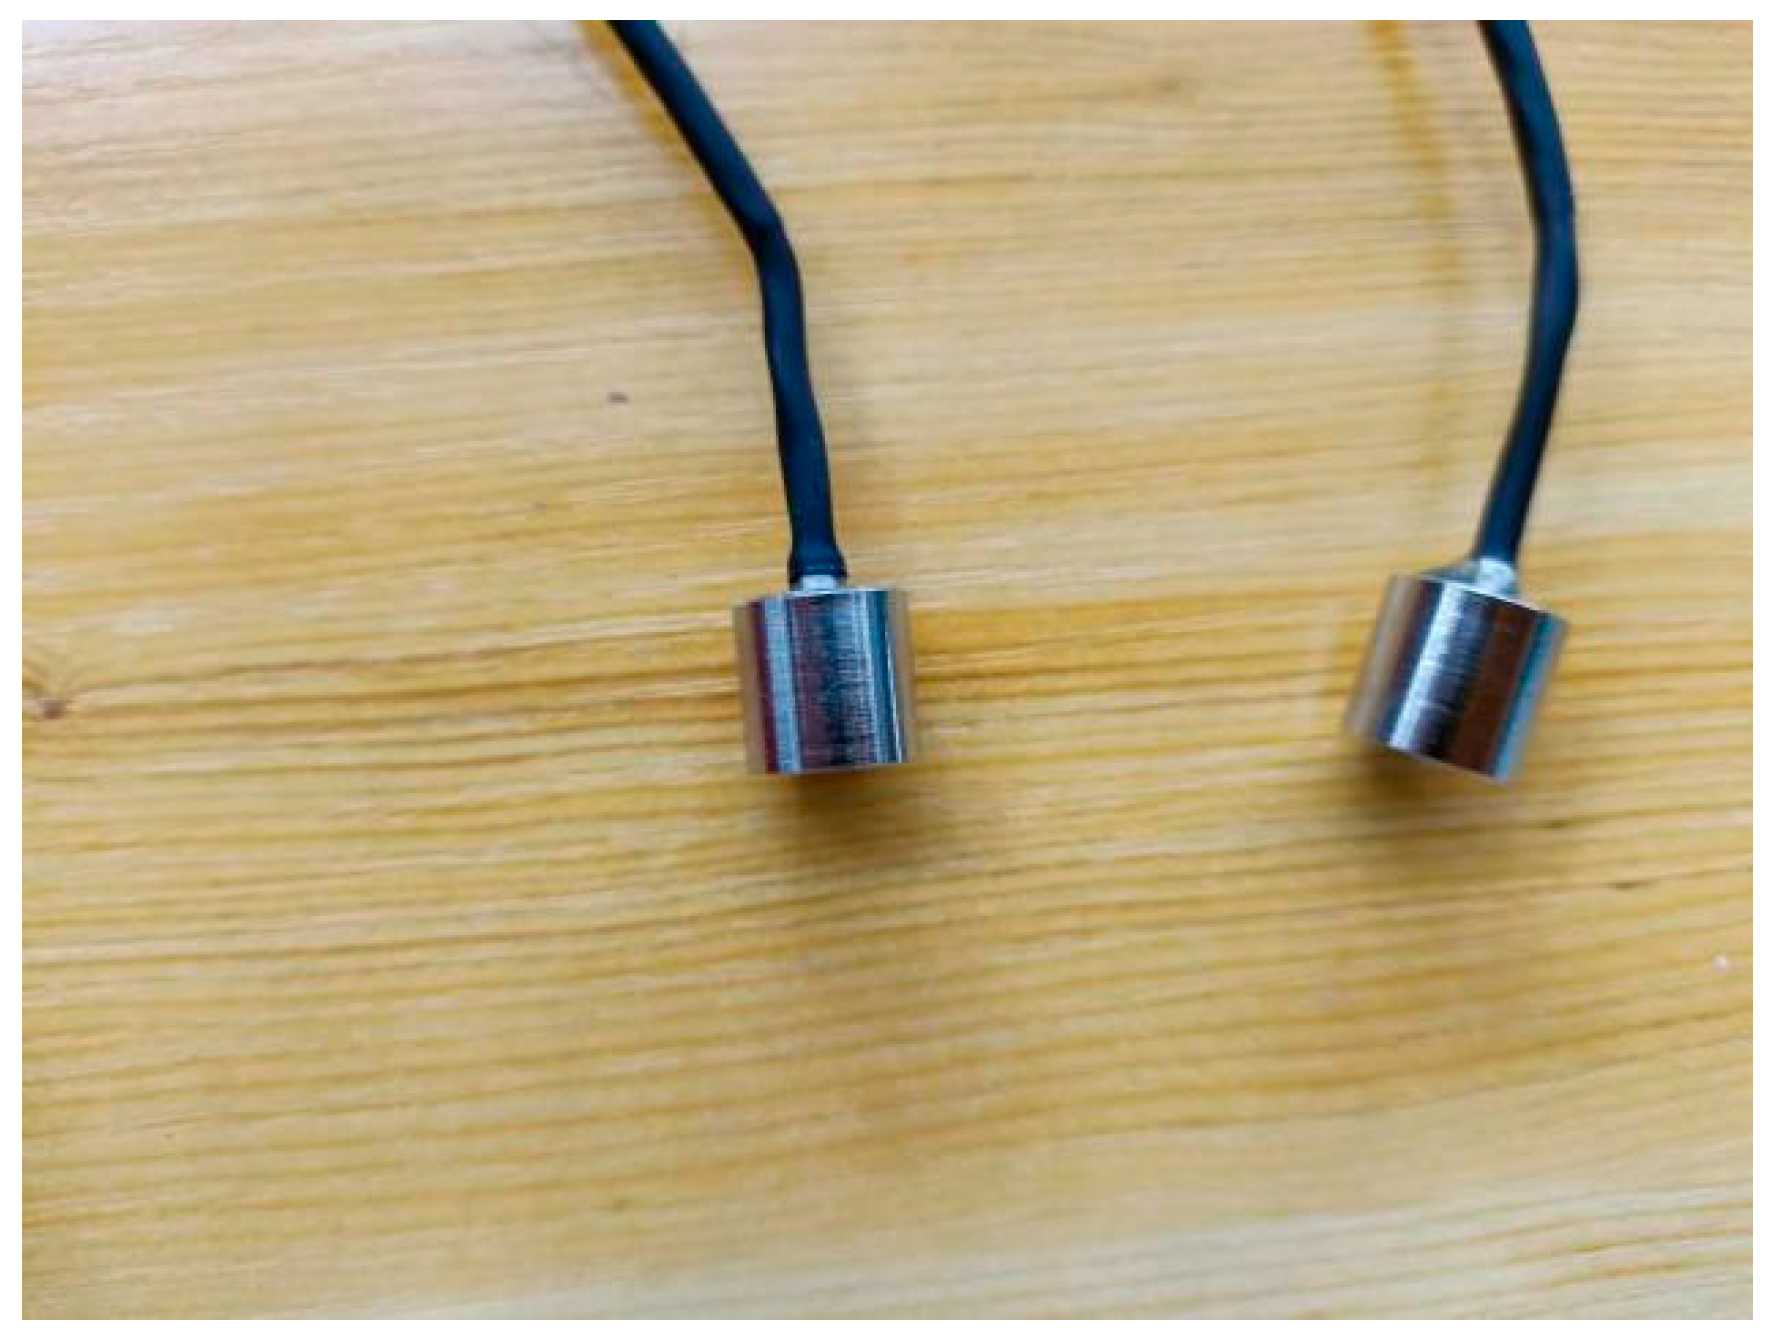
The test elements primarily consist of two types of sensors: earth pressure cells and pore water pressure gauges. Earth pressure cells employ the Y2000 series foil miniature pressure cell, as shown in Figure 10. This pressure cell is a membrane-type transducer, featuring a deformable membrane affixed with specialized foil strain gauges. The force exerted on the pressure cell is determined by measuring the strain values of the foil strain gauges. The pore water pressure gauges use the Y3000 thin film conversion-type pore water pressure sensor, as depicted in Figure 11. This sensor has a deformable membrane attached to specialized foil resistance strain gauges. The force exerted on the pore water pressure sensor is determined by measuring the strain values of the foil resistance strain gauges.

Figure 10.
Earth pressure cell.
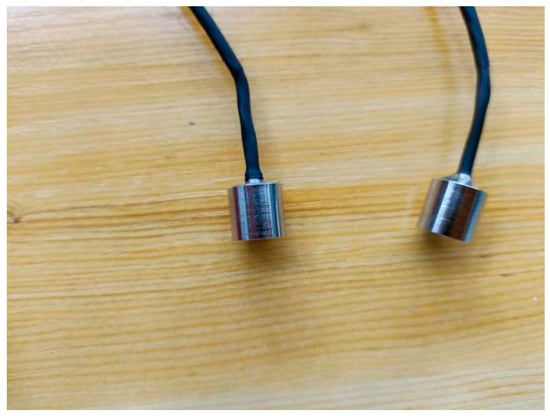
Figure 11.
Pore pressure cell.
The main technical specifications of the earth pressure cell and pore water pressure gauges are listed in Table 1.

Table 1.
Main technical indicators of earth pressure cell and pore water pressure cell.
Before installing the earth pressure cell and pore water pressure gauges, their leads are first connected to a static strain acquisition instrument. Then, the earth pressure cell and pore water pressure gauges are placed in the designated locations, and layers of sand are continuously added into the model box. When placing the earth pressure cell and pore water pressure gauges, we ensure that there is a layer of medium sand between them and the tunnel segments. After all elements have been installed and the model box is filled with sand, the earth pressure and pore water pressure are recorded on both sides of the segments in real time at this moment. The recorded values of earth pressure and pore water pressure are used as the initial values.
3.4.3. Strain Gauge Application
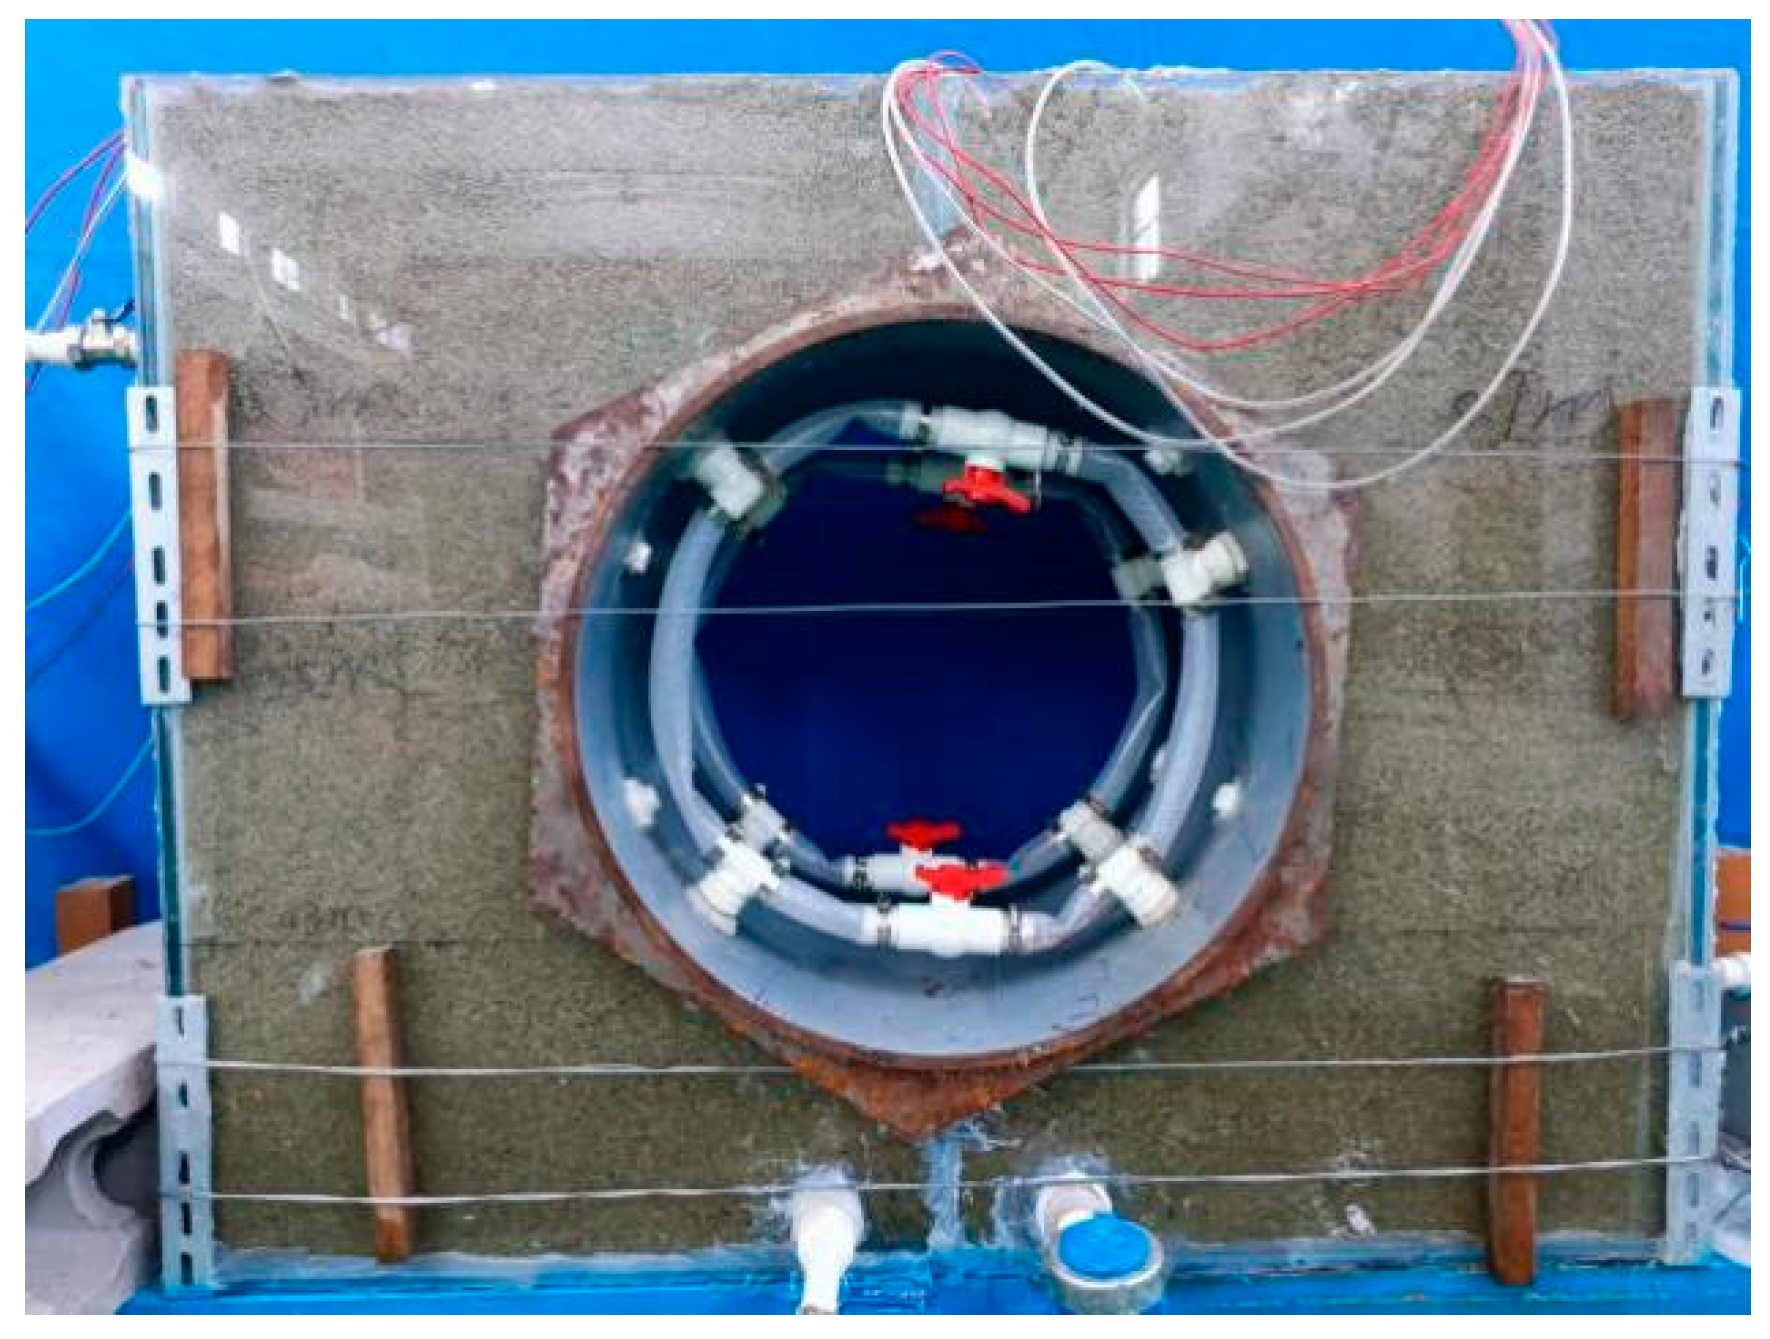
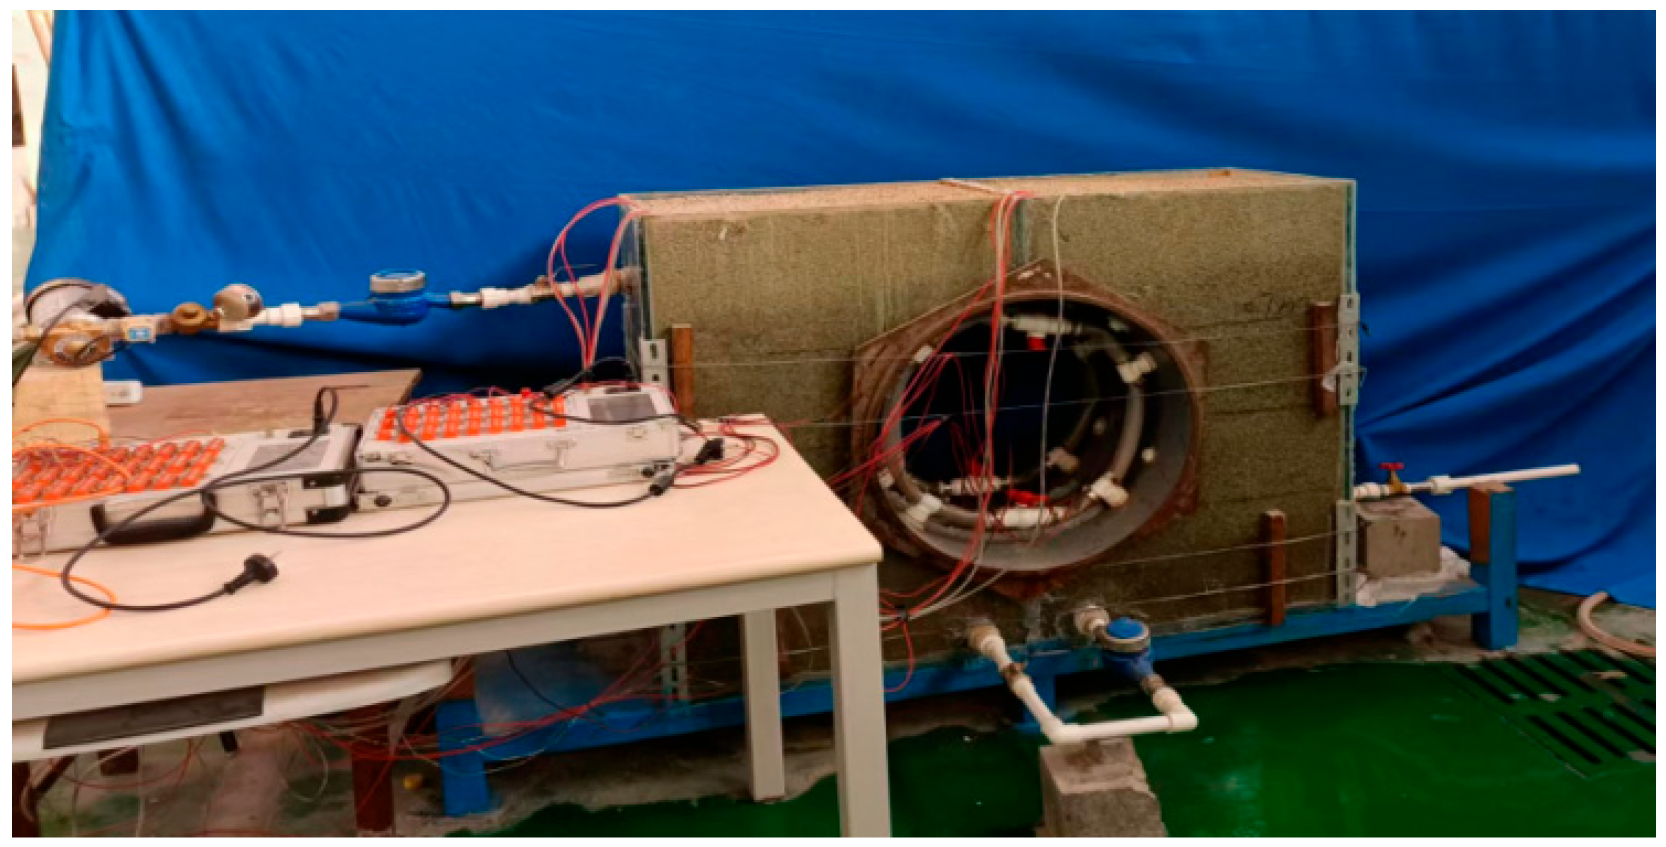
Before filling the model box with sand and introducing water, strain gauges are pasted on the inner side of the pipe segment, and the strain gauge lead wire is connected to the static strain collection instrument. Upon the completion of the sand filling and model box construction, live data from the acquisition instrument are immediately captured at this instant, which are considered the initial strain values for the pipe segment. The test box for the diversion function pipe model is shown in Figure 12.
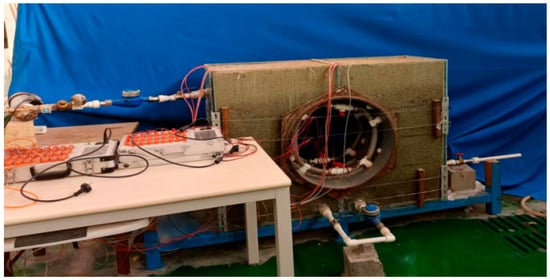
Figure 12.
Model box of diversion function pipe segments.
During the experiment, pressure differences of 0.5 kPa, 1.0 kPa, 1.5 kPa, 2.0 kPa, and 2.5 kPa are maintained between the left and right sides of the model box, and the data from the earth pressure cell, pore water pressure gauges, and strain gauges are recorded. This will allow us to determine the distribution of strain within the tunnel lining segments and the surrounding earth pressure and pore water pressure. For each condition, 5 separate tests are conducted, and the data from these tests are analyzed to draw corresponding conclusions.
4. Analysis of Test Results for Diversion Function Pipe Segment Models
4.1. Analysis of Strain in the Pipe Segment under Different Pressures
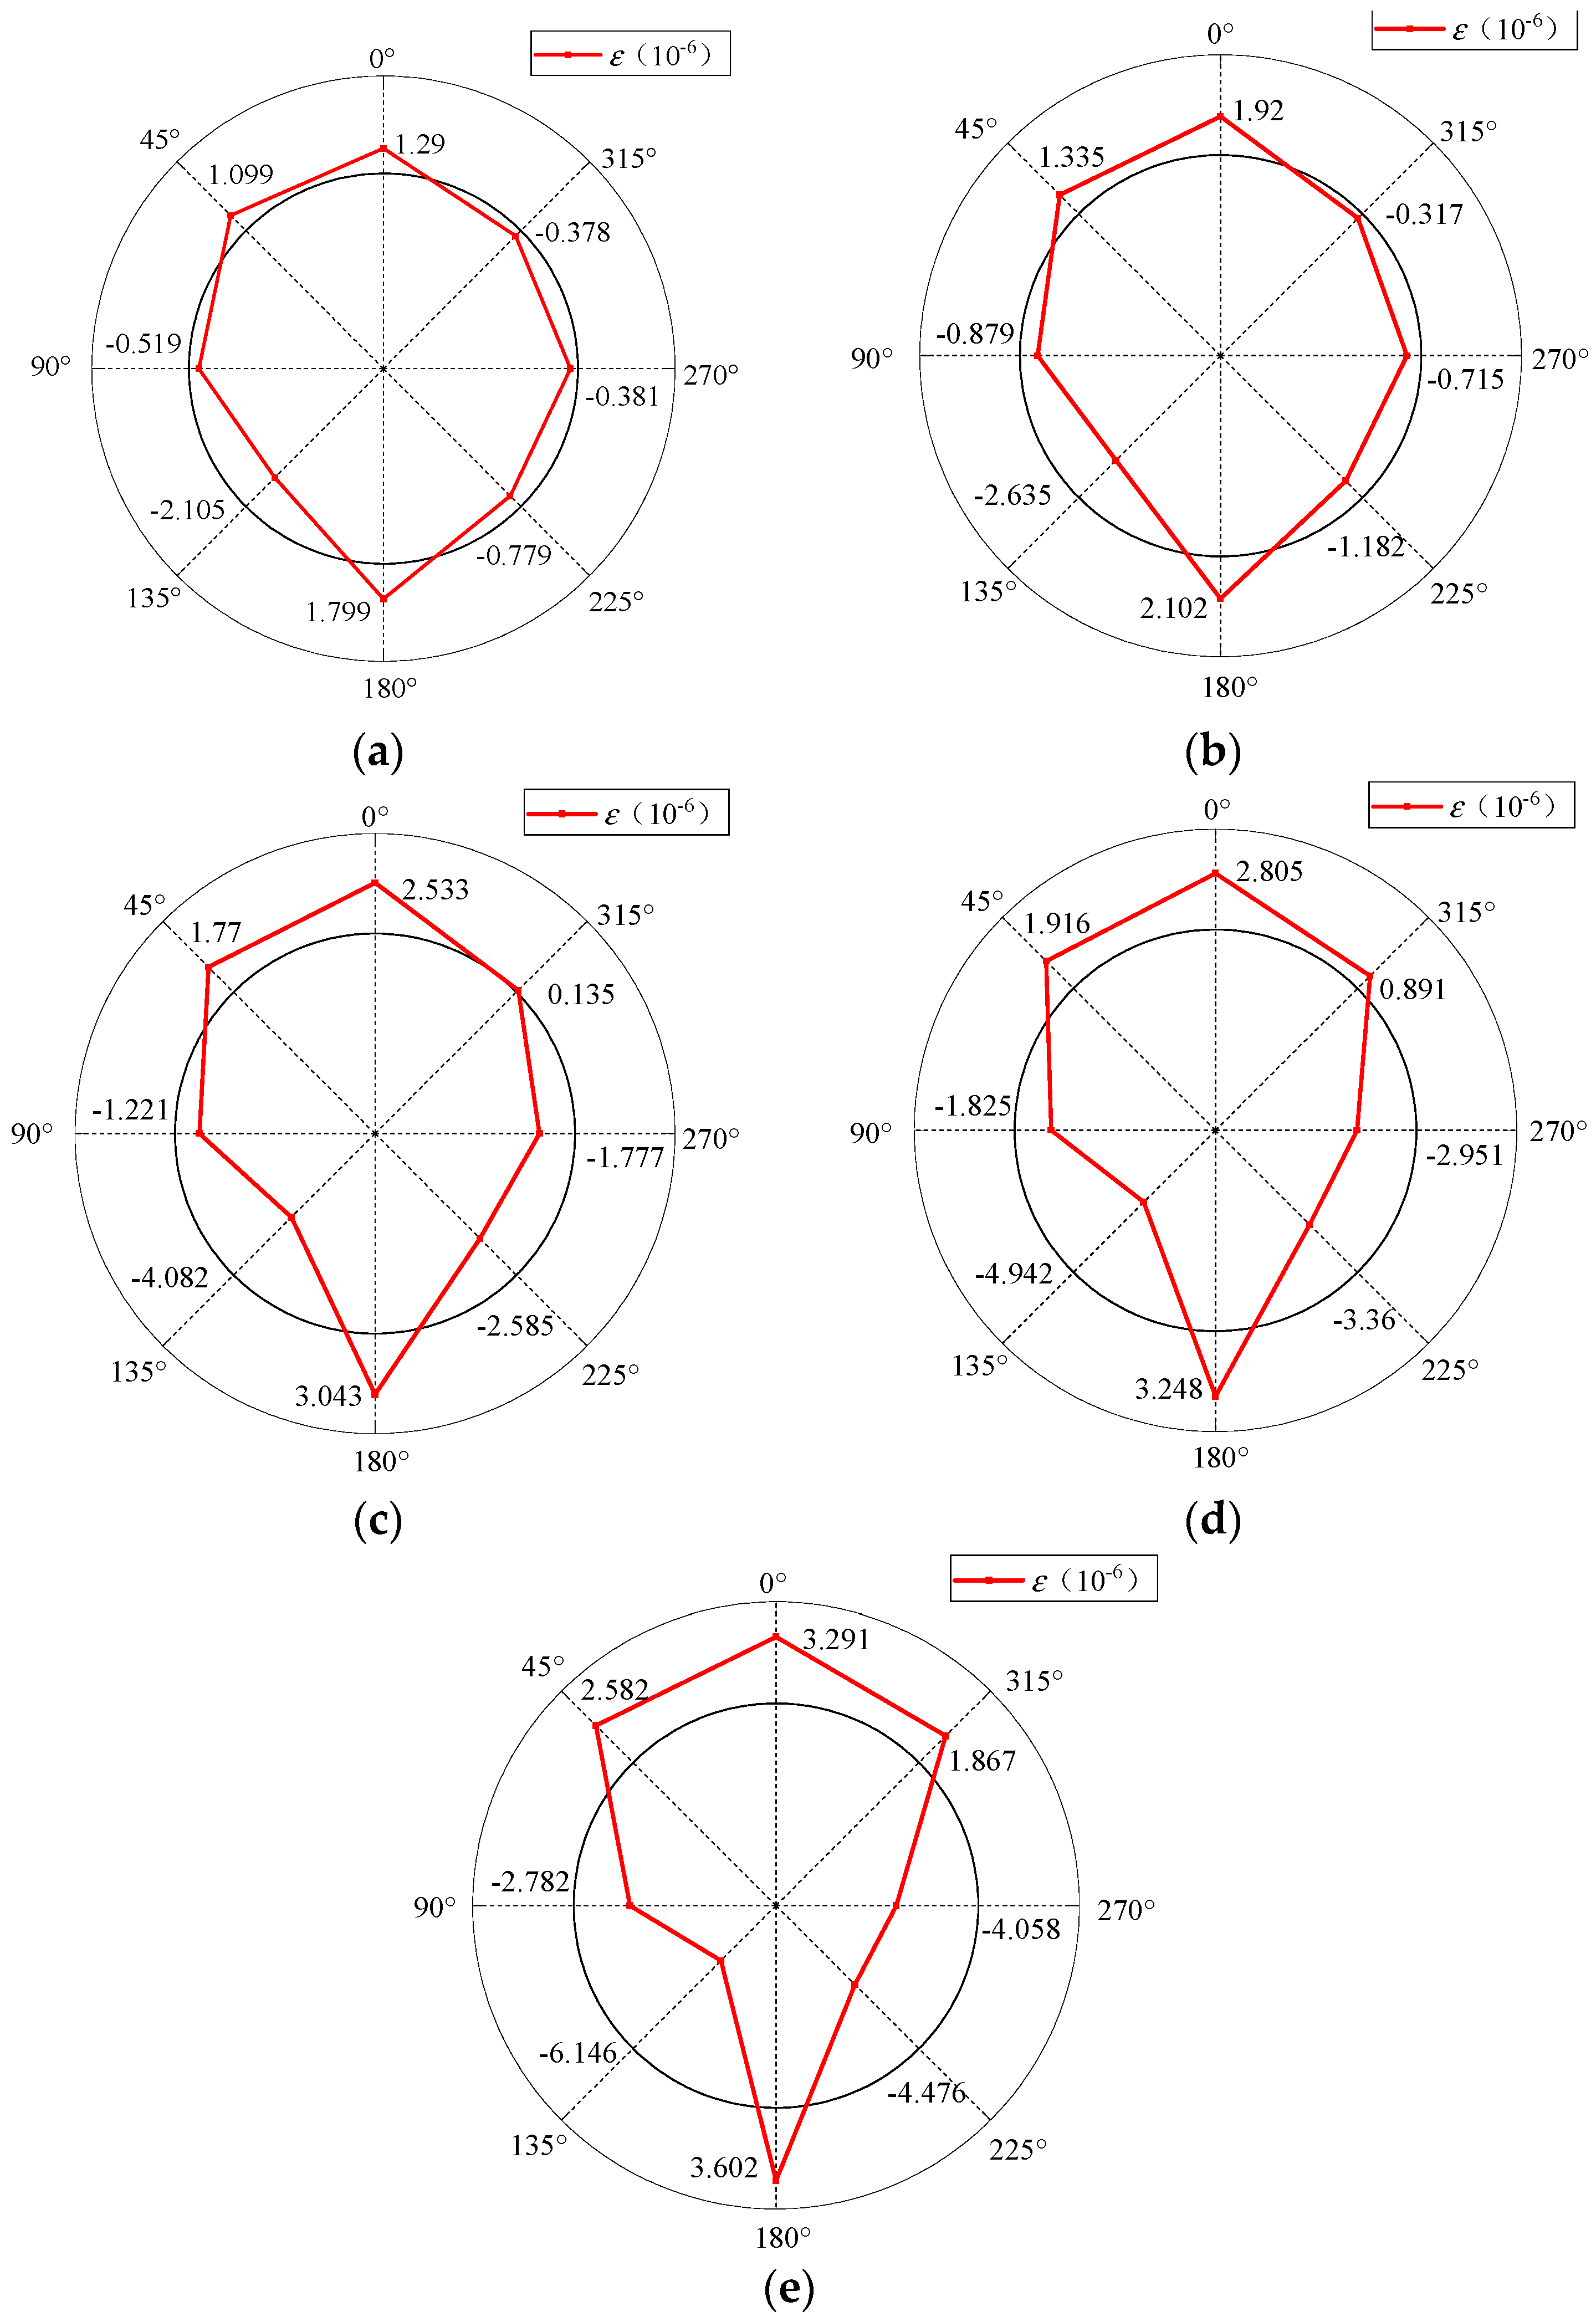
From Figure 13a–e, it is evident that under the different pressures applied to both the sides of the pipe segment, the strain distribution is not uniform. Compressive strains are observed at the top, left upper, and bottom of the segments, while tensile strains are present on the inner side, indicating a tendency to bulge outwards. The maximum compressive strain occurs at the bottom, with a significant value also found at the top. The tensile strain is greatest at the lower left and right sides, where the segment shows a tendency to concave inward. The strain values on the left side of the segment are greater than those on the right, but the difference is relatively small. The tensile strain on the upper right side decreases as the pressure difference increases, and even becomes compressive at 1.5 kPa before increasing again with further increases in the pressure difference. This phenomenon occurs because within the model test box, the pipe segments are mainly subjected to unsymmetrical pressure from the sand and water on both the sides. The sand and water compress the segments from both the left and right, causing the top and bottom to experience compressive forces and a tendency to bulge outward. Additionally, the left and right sides of the segments are pulled inward, resulting in a concave shape. The left and right lower sides experience greater pressure from the sand and water than the upper parts, leading to slightly higher strain values in these locations compared to those in the other areas where tension is experienced.

Figure 13.
Segments strain under different pressures. (a) Pressure difference 0.5 kPa. (b) Pressure difference 1.0 kPa. (c) Pressure difference 1.5 kPa. (d) Pressure difference 2.0 kPa. (e) Pressure difference 2.5 kPa.
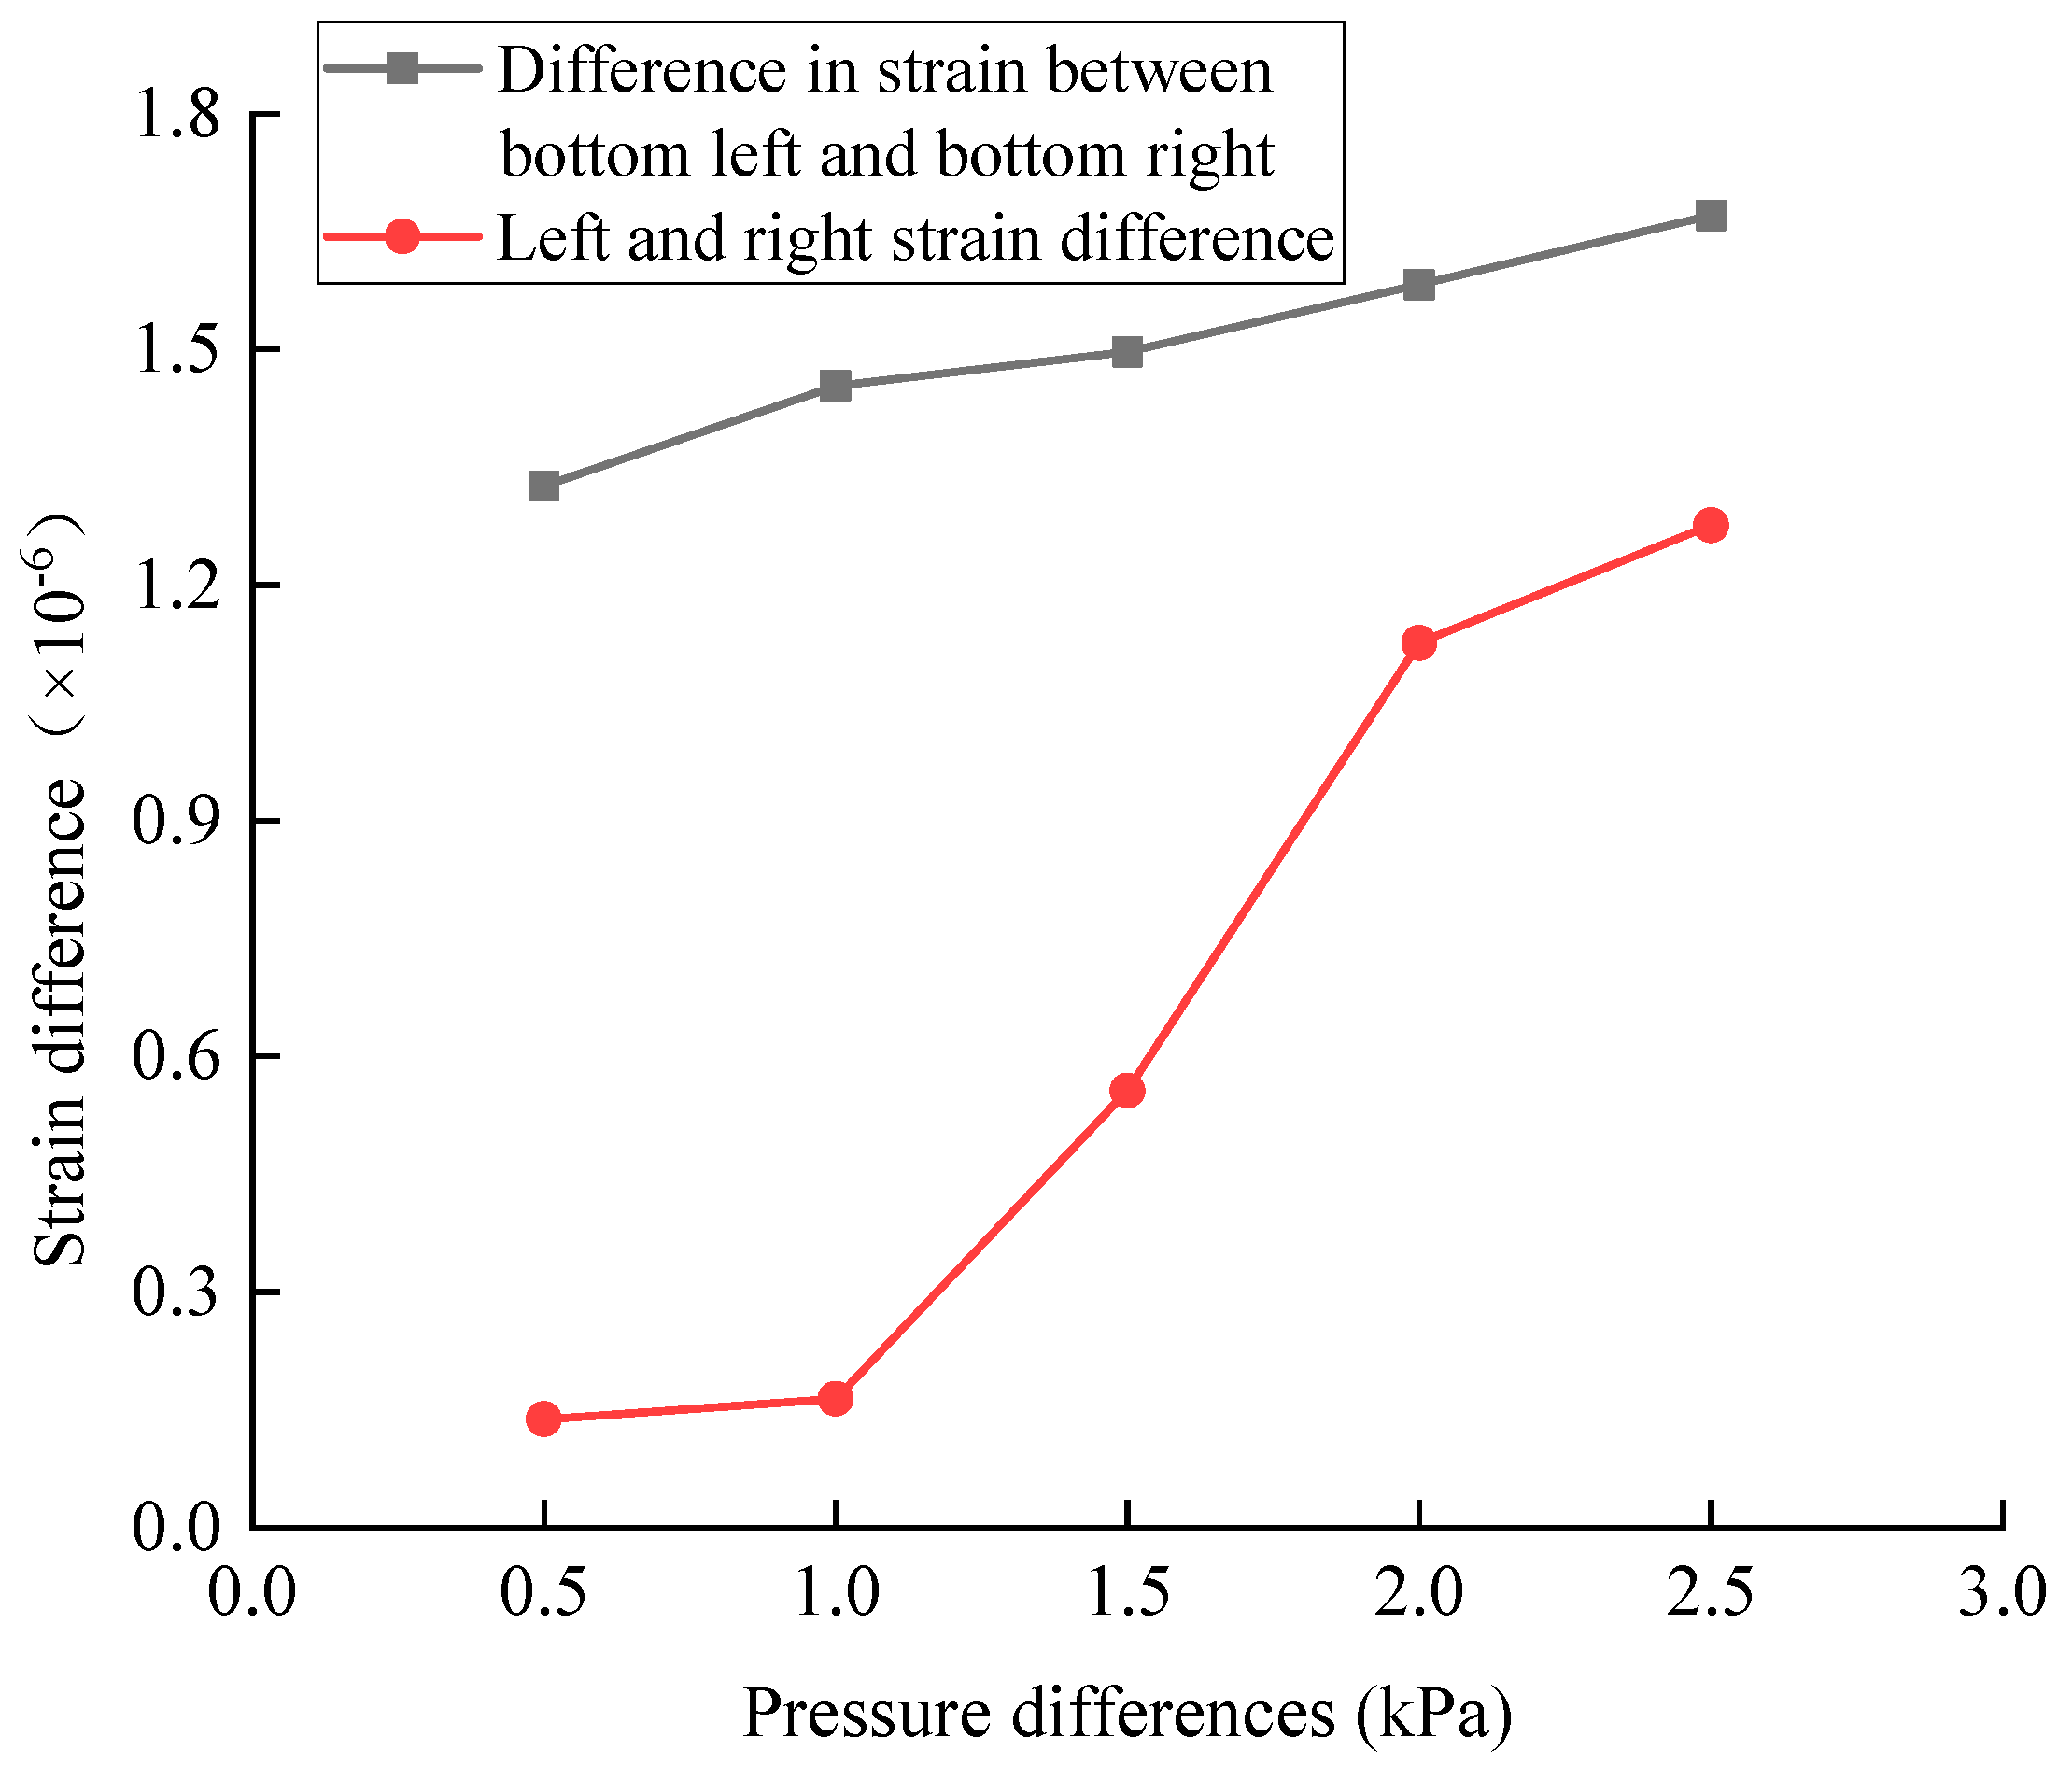
Figure 14 summarizes the correlation between the strain differences on the left and right sides, as well as the left down and right down areas, with the pressure difference.
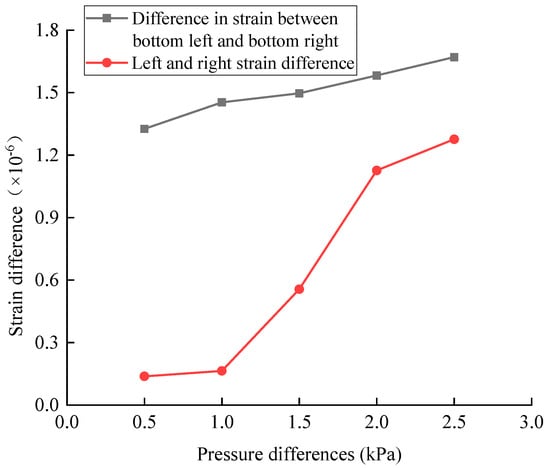
Figure 14.
Change in strain difference in symmetric positions.
It can be observed that when the pressure differences across the pipe segment are 0.5 kPa, 1.0 kPa, 1.5 kPa, 2.0 kPa, and 2.5 kPa, the strain differences between the left bottom and right bottom symmetric positions of the segment are 1.326, 1.453, 1.497, 1.582, and 1.67, respectively, and the strain differences between the left and right positions of the segment are 0.138, 0.164, 0.556, 1.126, and 1.276, respectively. The strain difference at the symmetric positions increases continuously with the increase in the pressure difference on both the sides. Due to the influence of the unsymmetrical pressure acting on the pipe segment, the distribution and variation in strain are not uniform. The larger the pressure difference is, the less apparent the symmetry of the strain values in the segment is, making it more susceptible to damage.
4.2. Analysis of Earth Pressure Distribution on Both Sides of the Pipe Segment under Different Pressures
4.2.1. Distribution and Variation in Earth Pressure on Both Sides of the Pipe Segment
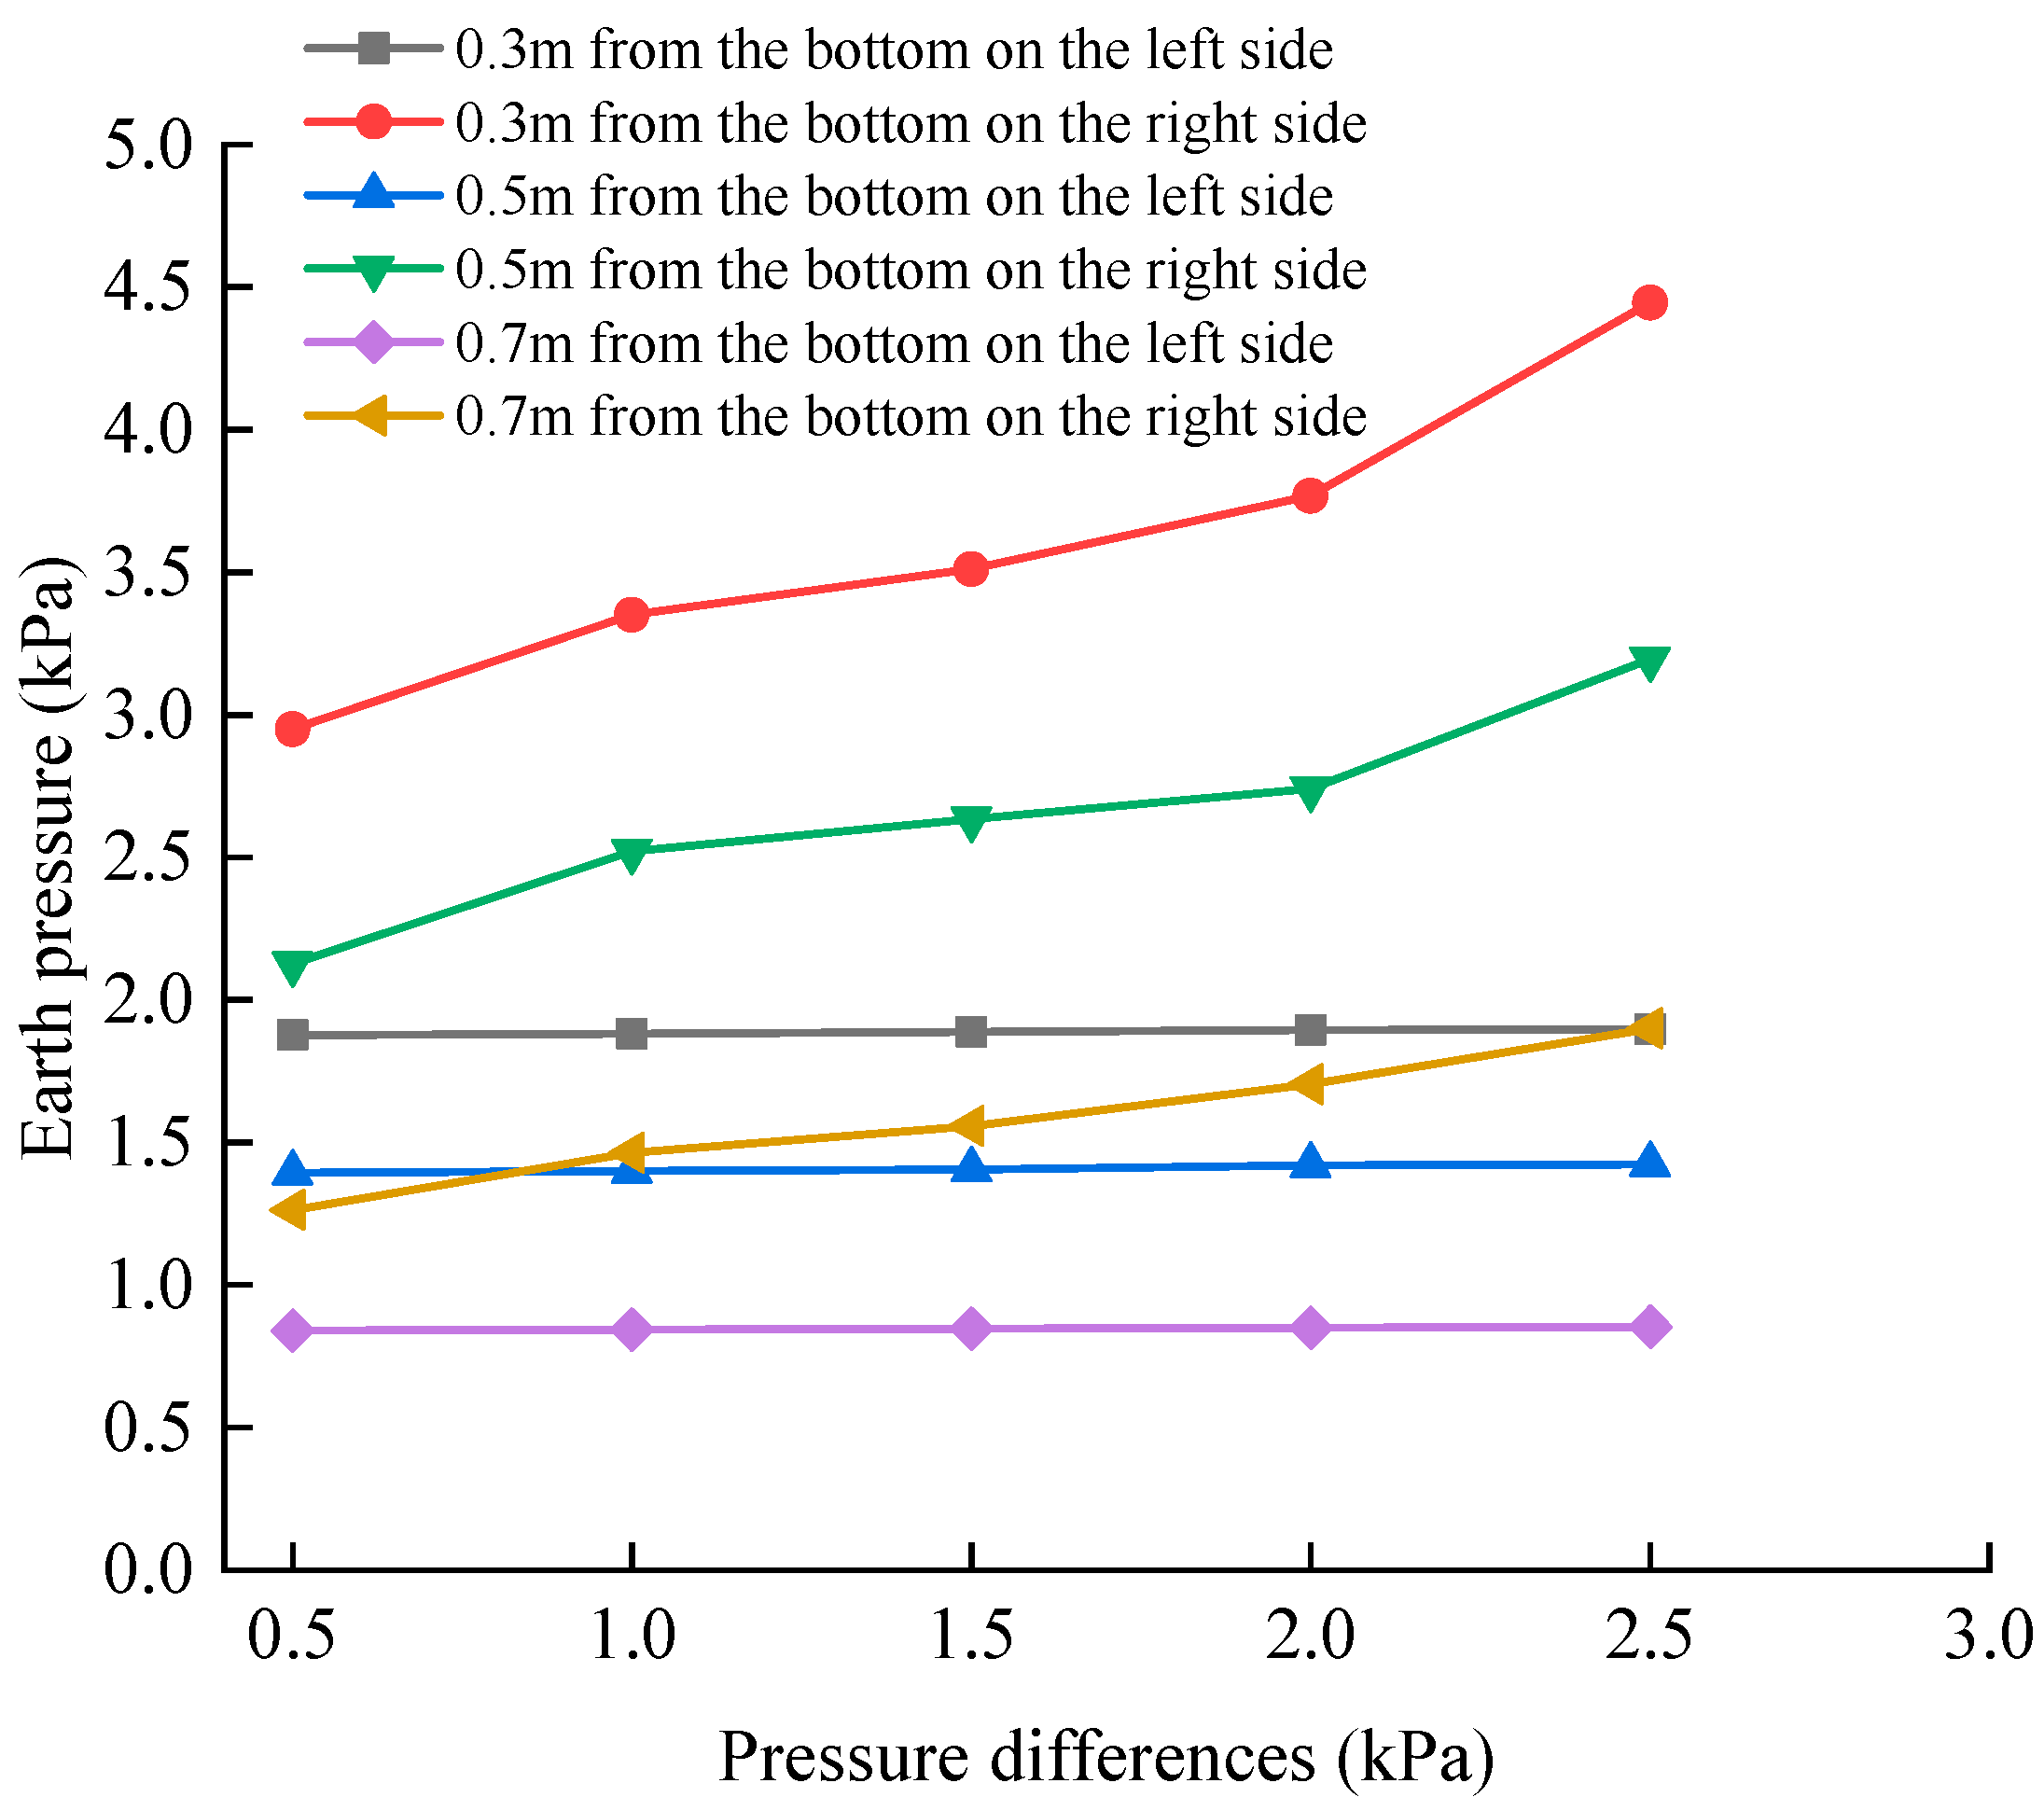
The distribution and variation in earth pressure around the pipe segment on both the sides change with the alteration in pressure difference, as depicted in Figure 15. On the left side, at distances of 0.3 m, 0.5 m, and 0.7 m from the bottom, the earth pressure around the pipe segment increases with the rise in pressure difference. The earth pressure increases by 1%, 2.2%, and 1.6%, respectively, as the pressure difference grows from 0.5 kPa to 2.5 kPa, indicating a minimal increase in left side earth pressure. Similarly, on the right side, at distances of 0.3 m, 0.5 m, and 0.7 m from the bottom, the earth pressure around the pipe segment also increases with the increase in pressure difference. The earth pressure increases significantly by 50.7%, 50.3%, and 50.3%, respectively, within the same pressure difference range. Moreover, under the same pressure difference, the earth pressure value at a distance of 0.3 m from the bottom on the right side is consistently higher than those at the other five positions.
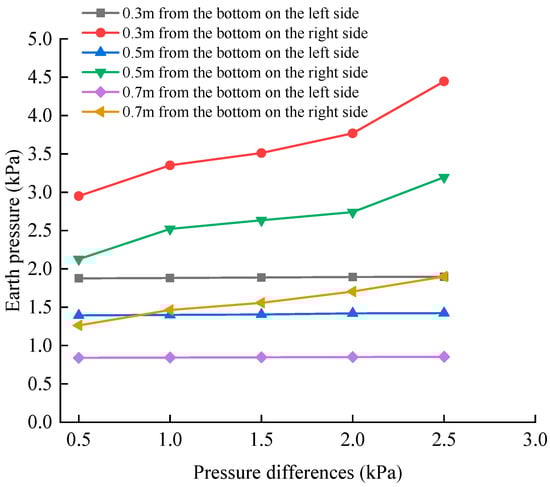
Figure 15.
Variation in earth pressure at each measurement point.
This is because when the pressure difference between the two sides is adjusted, there is only a slight fluctuation in the water level on the left side, and there is minimal change in earth pressure. On the right side, the decrease in the water level is used to increase the pressure difference on both the sides. The effective stress on the right side increases, manifesting as an ongoing increase in earth pressure.
4.2.2. Variation in Earth Pressure on Both Sides of the Pipe Segment at Different Depths
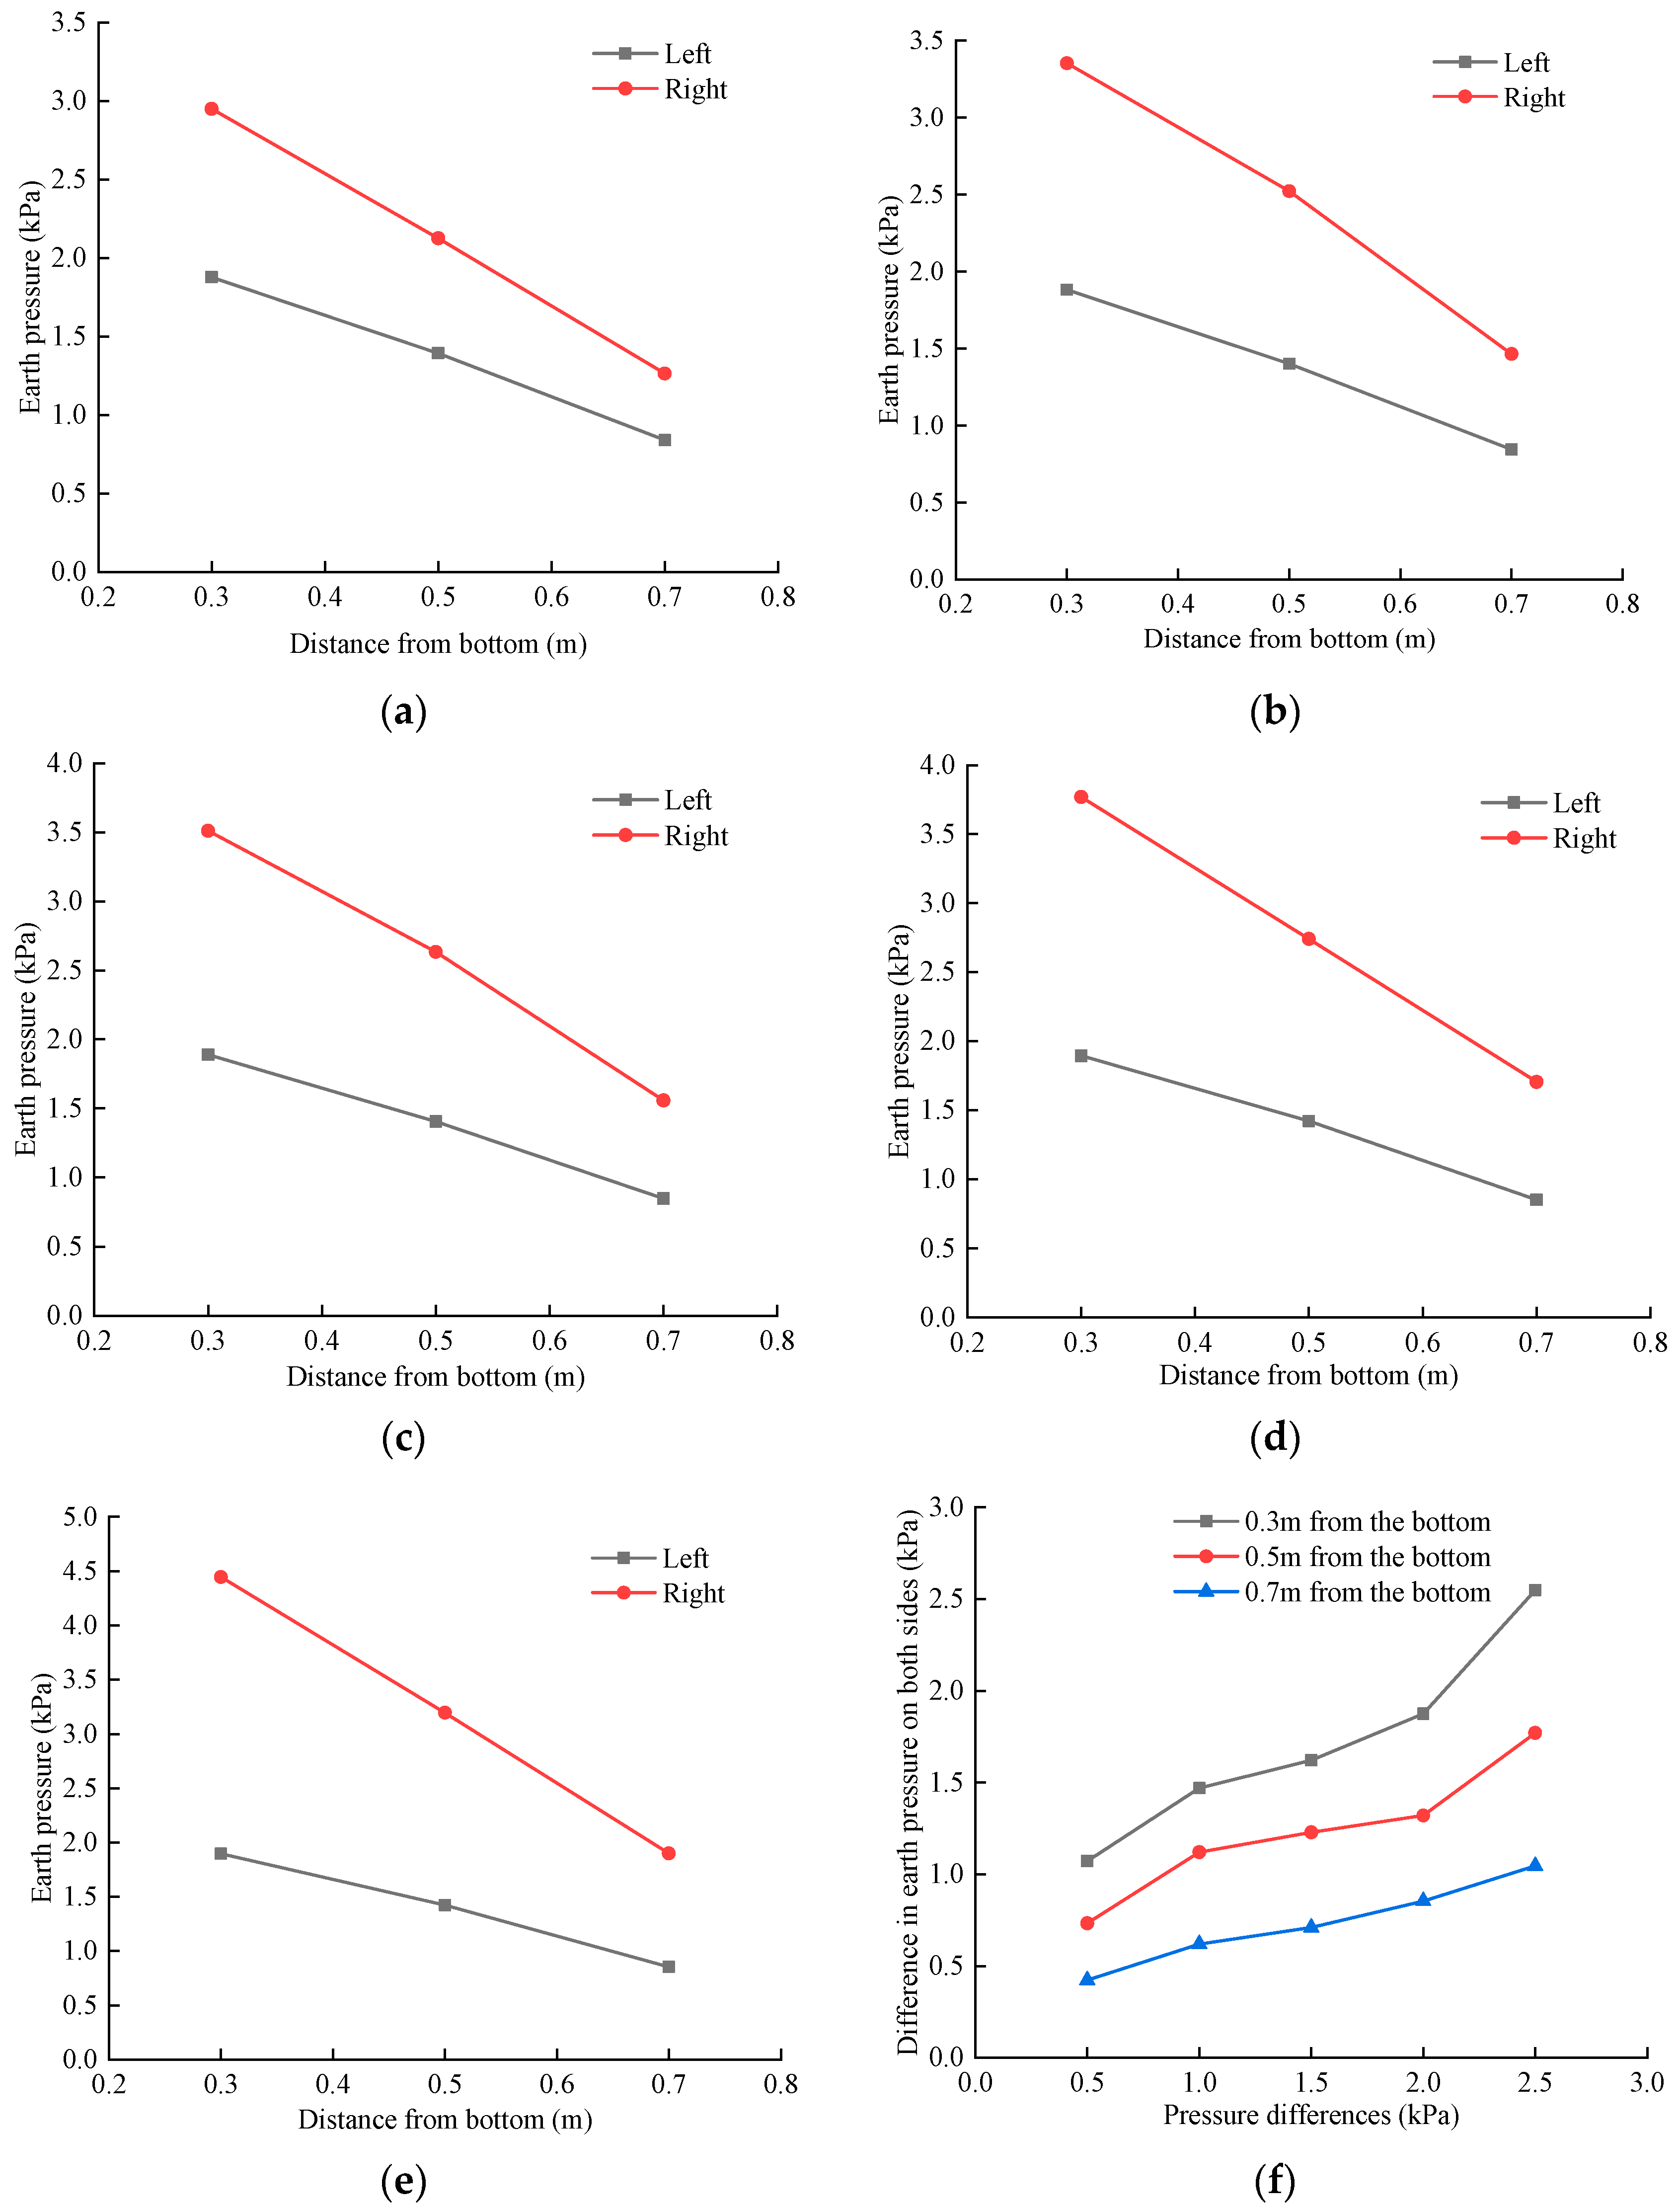
The analysis of the change in earth pressure on both the sides of the pipe segment, as illustrated in Figure 16a–f, reveals that while the earth pressure on the right side of the pipe segment is greater than that on the left, the difference in earth pressure between the two sides is greatest at a depth of 0.3 m, followed by 0.5 m, and it is the lowest at 0.7 m. The earth pressure difference between the two sides of the pipe segment increases with the increase in differential pressure. The greater the depth of the location is, the greater the impact is, resulting in a pipe segment with higher unsymmetrical pressure. This, in turn, increases the possibility of its bending and deformation, which is prone to causing the leakage of the node of the pipe segment and operational and maintenance difficulties. The channelization of the pipe segment is an effective method of reducing the pressure difference between the two sides, thereby protecting the spring system and groundwater ecology. It also weakens the influence of unsymmetrical pressure on the pipe segment and alleviates the difficulties in the operation and maintenance of the pipe segment.
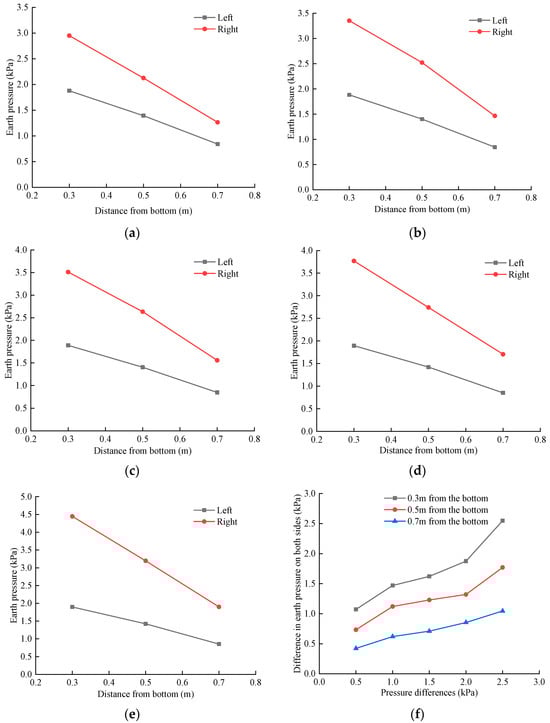
Figure 16.
Variation in earth pressure. (a) Pressure difference 0.5 kPa. (b) Pressure difference 1.0 kPa. (c) Pressure difference 1.5 kPa. (d) Pressure difference 2.0 kPa. (e) Pressure difference 2.5 kPa. (f) Changes in earth pressure difference on both sides of pipe segments.
4.3. Analysis of Pore Water Pressure on Both Sides of the Pipe Segment under Different Pressures
4.3.1. Distribution and Change in Pore Water Pressure on Both Sides of the Pipe Segment
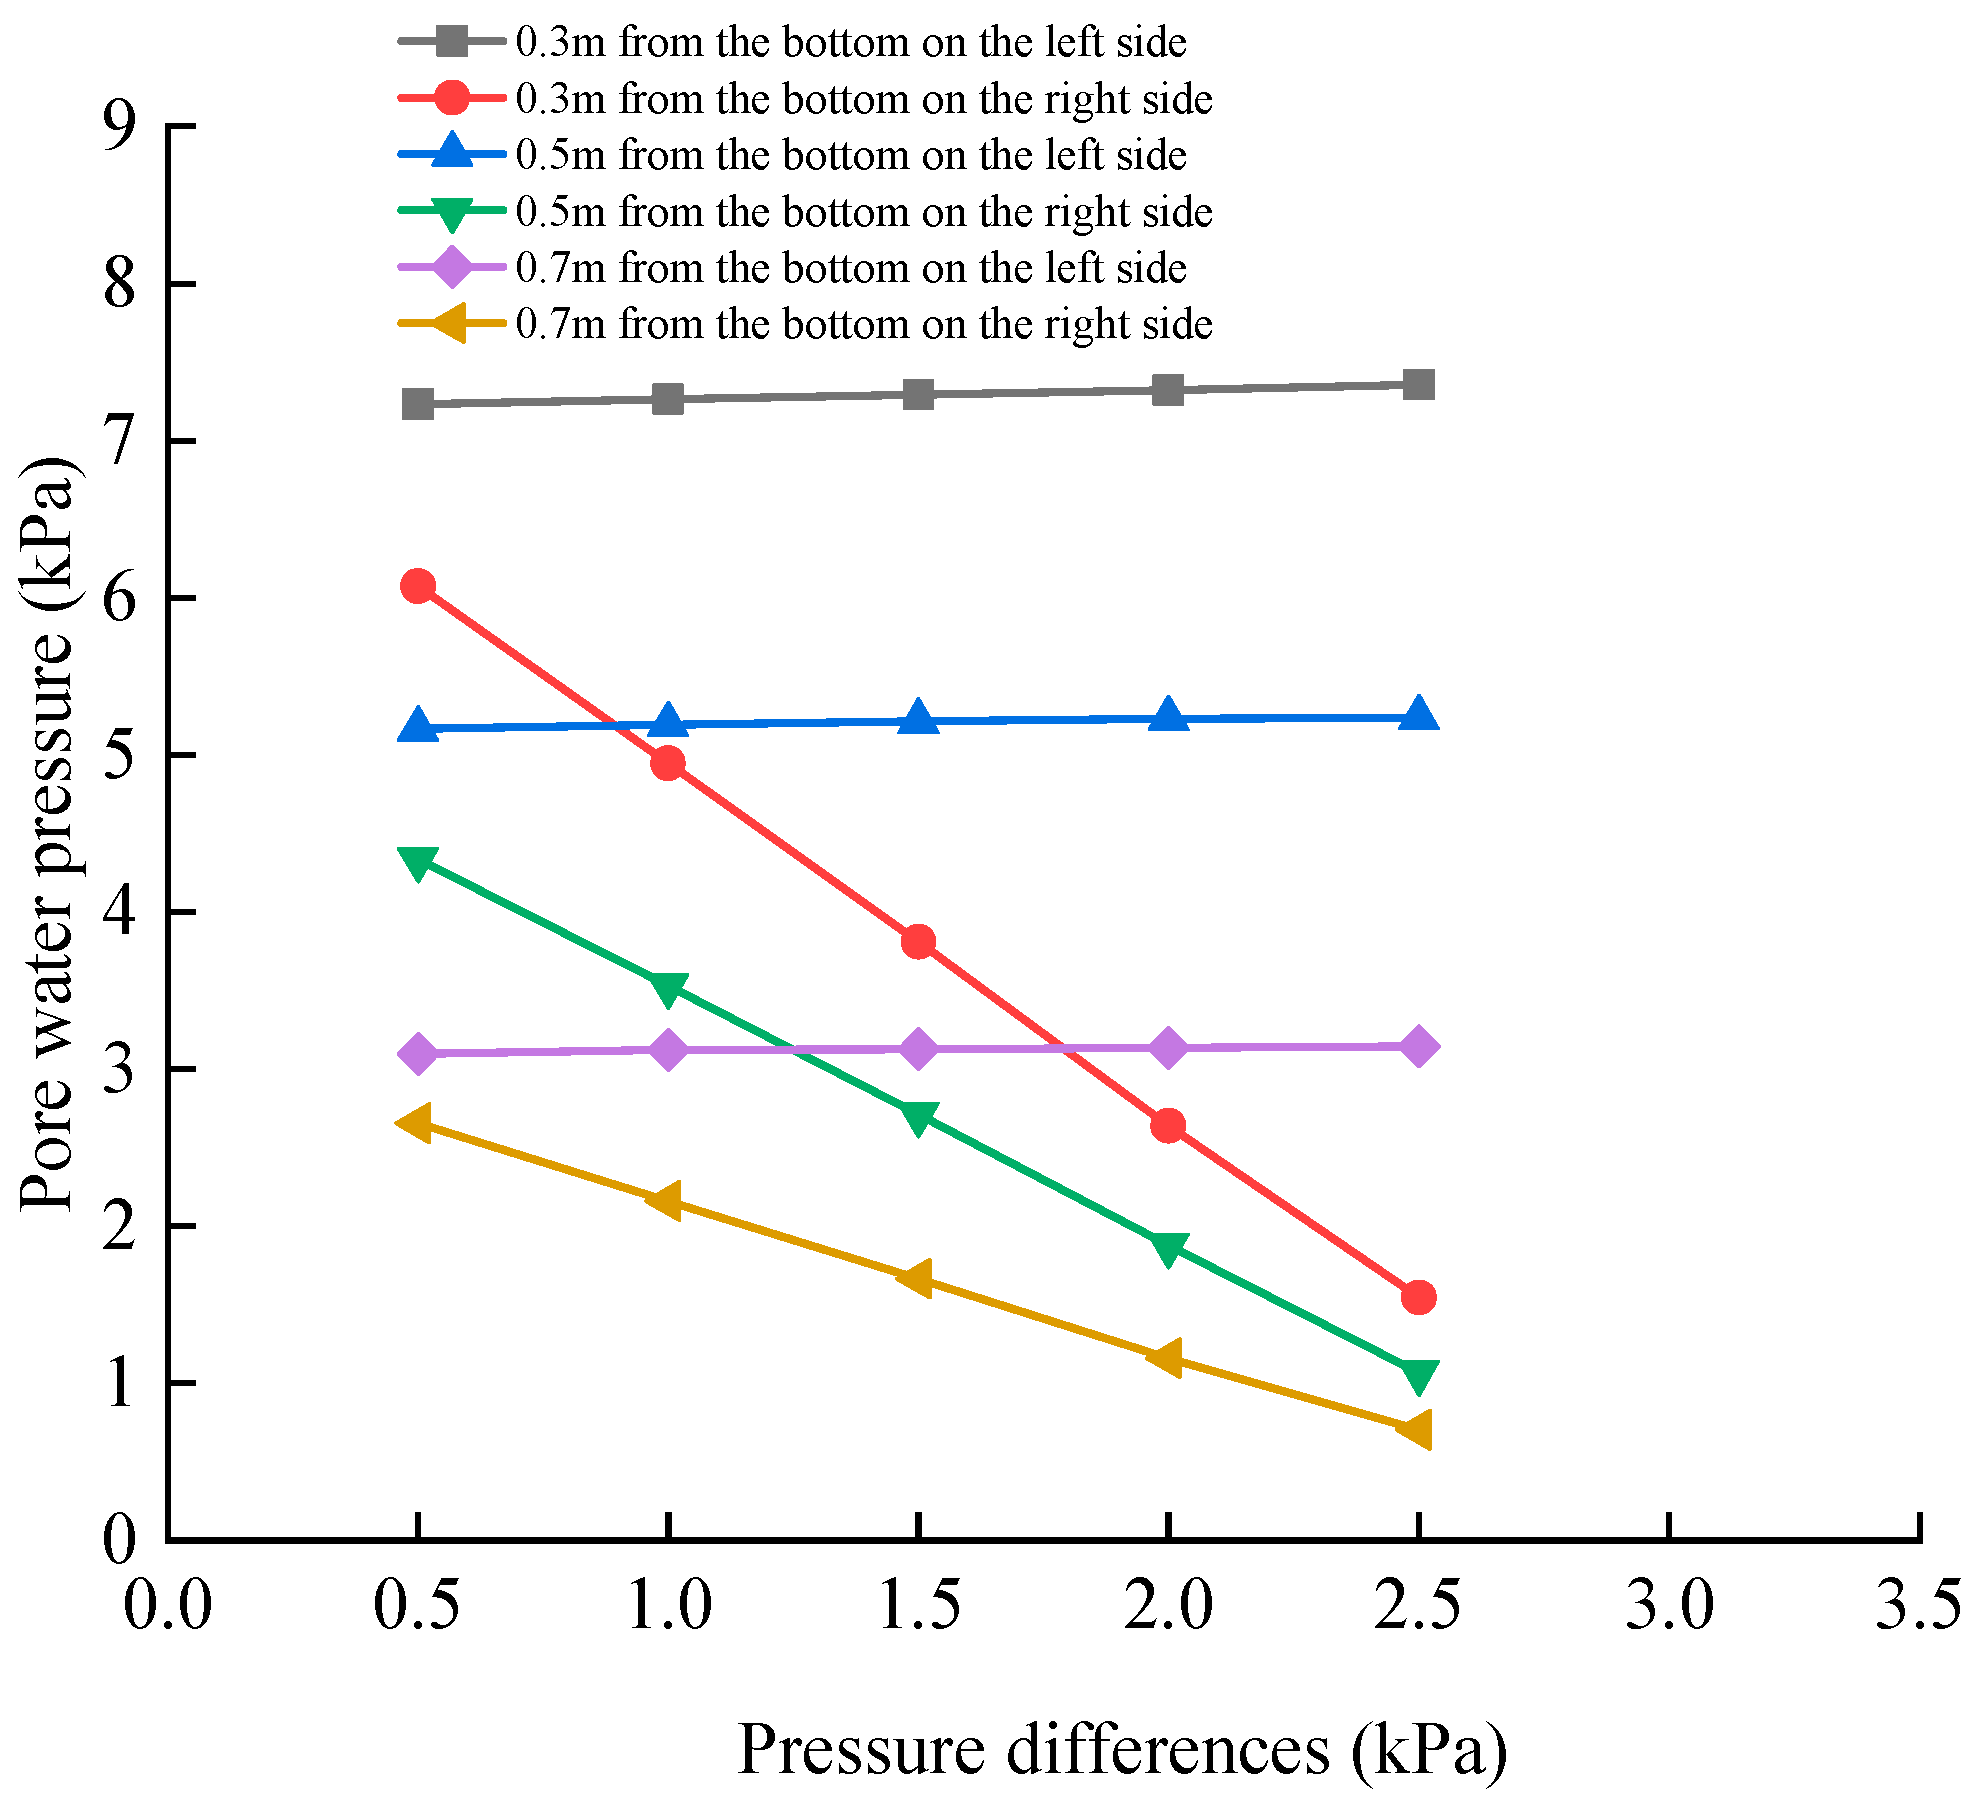
As illustrated in Figure 17, when the pressure differential is identical, the pore water pressure value at a depth of 0.3 m from the bottom on the left side is greater than the pore water pressure values at the other five measurement points. The pore water pressure around the pipe segment at 0.3 m, 0.5 m and 0.7 m from the bottom on the left side decreases with the increase in pressure difference between the two sides. When the pressure difference is increased from 0.5 kPa to 2.5 kPa, the pore water pressure decreases by 1.7%, 1.4%, and 1.5%, respectively. It can be observed that the pore water pressure loss on the left side is smaller. The pore water pressure around the pipe segment at 0.3 m, 0.5 m and 0.7 m from the bottom on the right side also decreased with the increase in pressure difference between the two sides. When the pressure difference increased from 0.5 kPa to 2.5 kPa, the pore water pressure decreased by 74.6%, 75.4% and 73.5%, respectively. The pore pressure loss on the right side was larger.
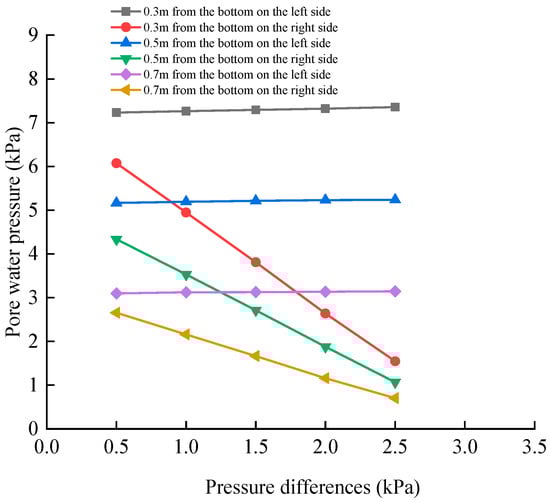
Figure 17.
Variation in pore pressure at each measurement point.
The pore water pressure values at the three measurement points on the left side remain essentially unchanged with an increase in pressure difference, whereas those at the three measurement points on the right side decrease as the pressure difference between the two sides increases. This can be interpreted as the first two water level heights being equal. When adjusting the pressure difference between the two sides of the water level, the left side exhibits slight fluctuations, but remains essentially unchanged. Consequently, the change in pore water pressure on the left side is minimal, while on the right side, it increases as the water level decreases. As the water level on the right side continues to decline, the pressure difference between the two sides of the water column also remains constant.
4.3.2. Changes in Pore Water Pressure on Both Sides of the Pipe Segment at Different Depths
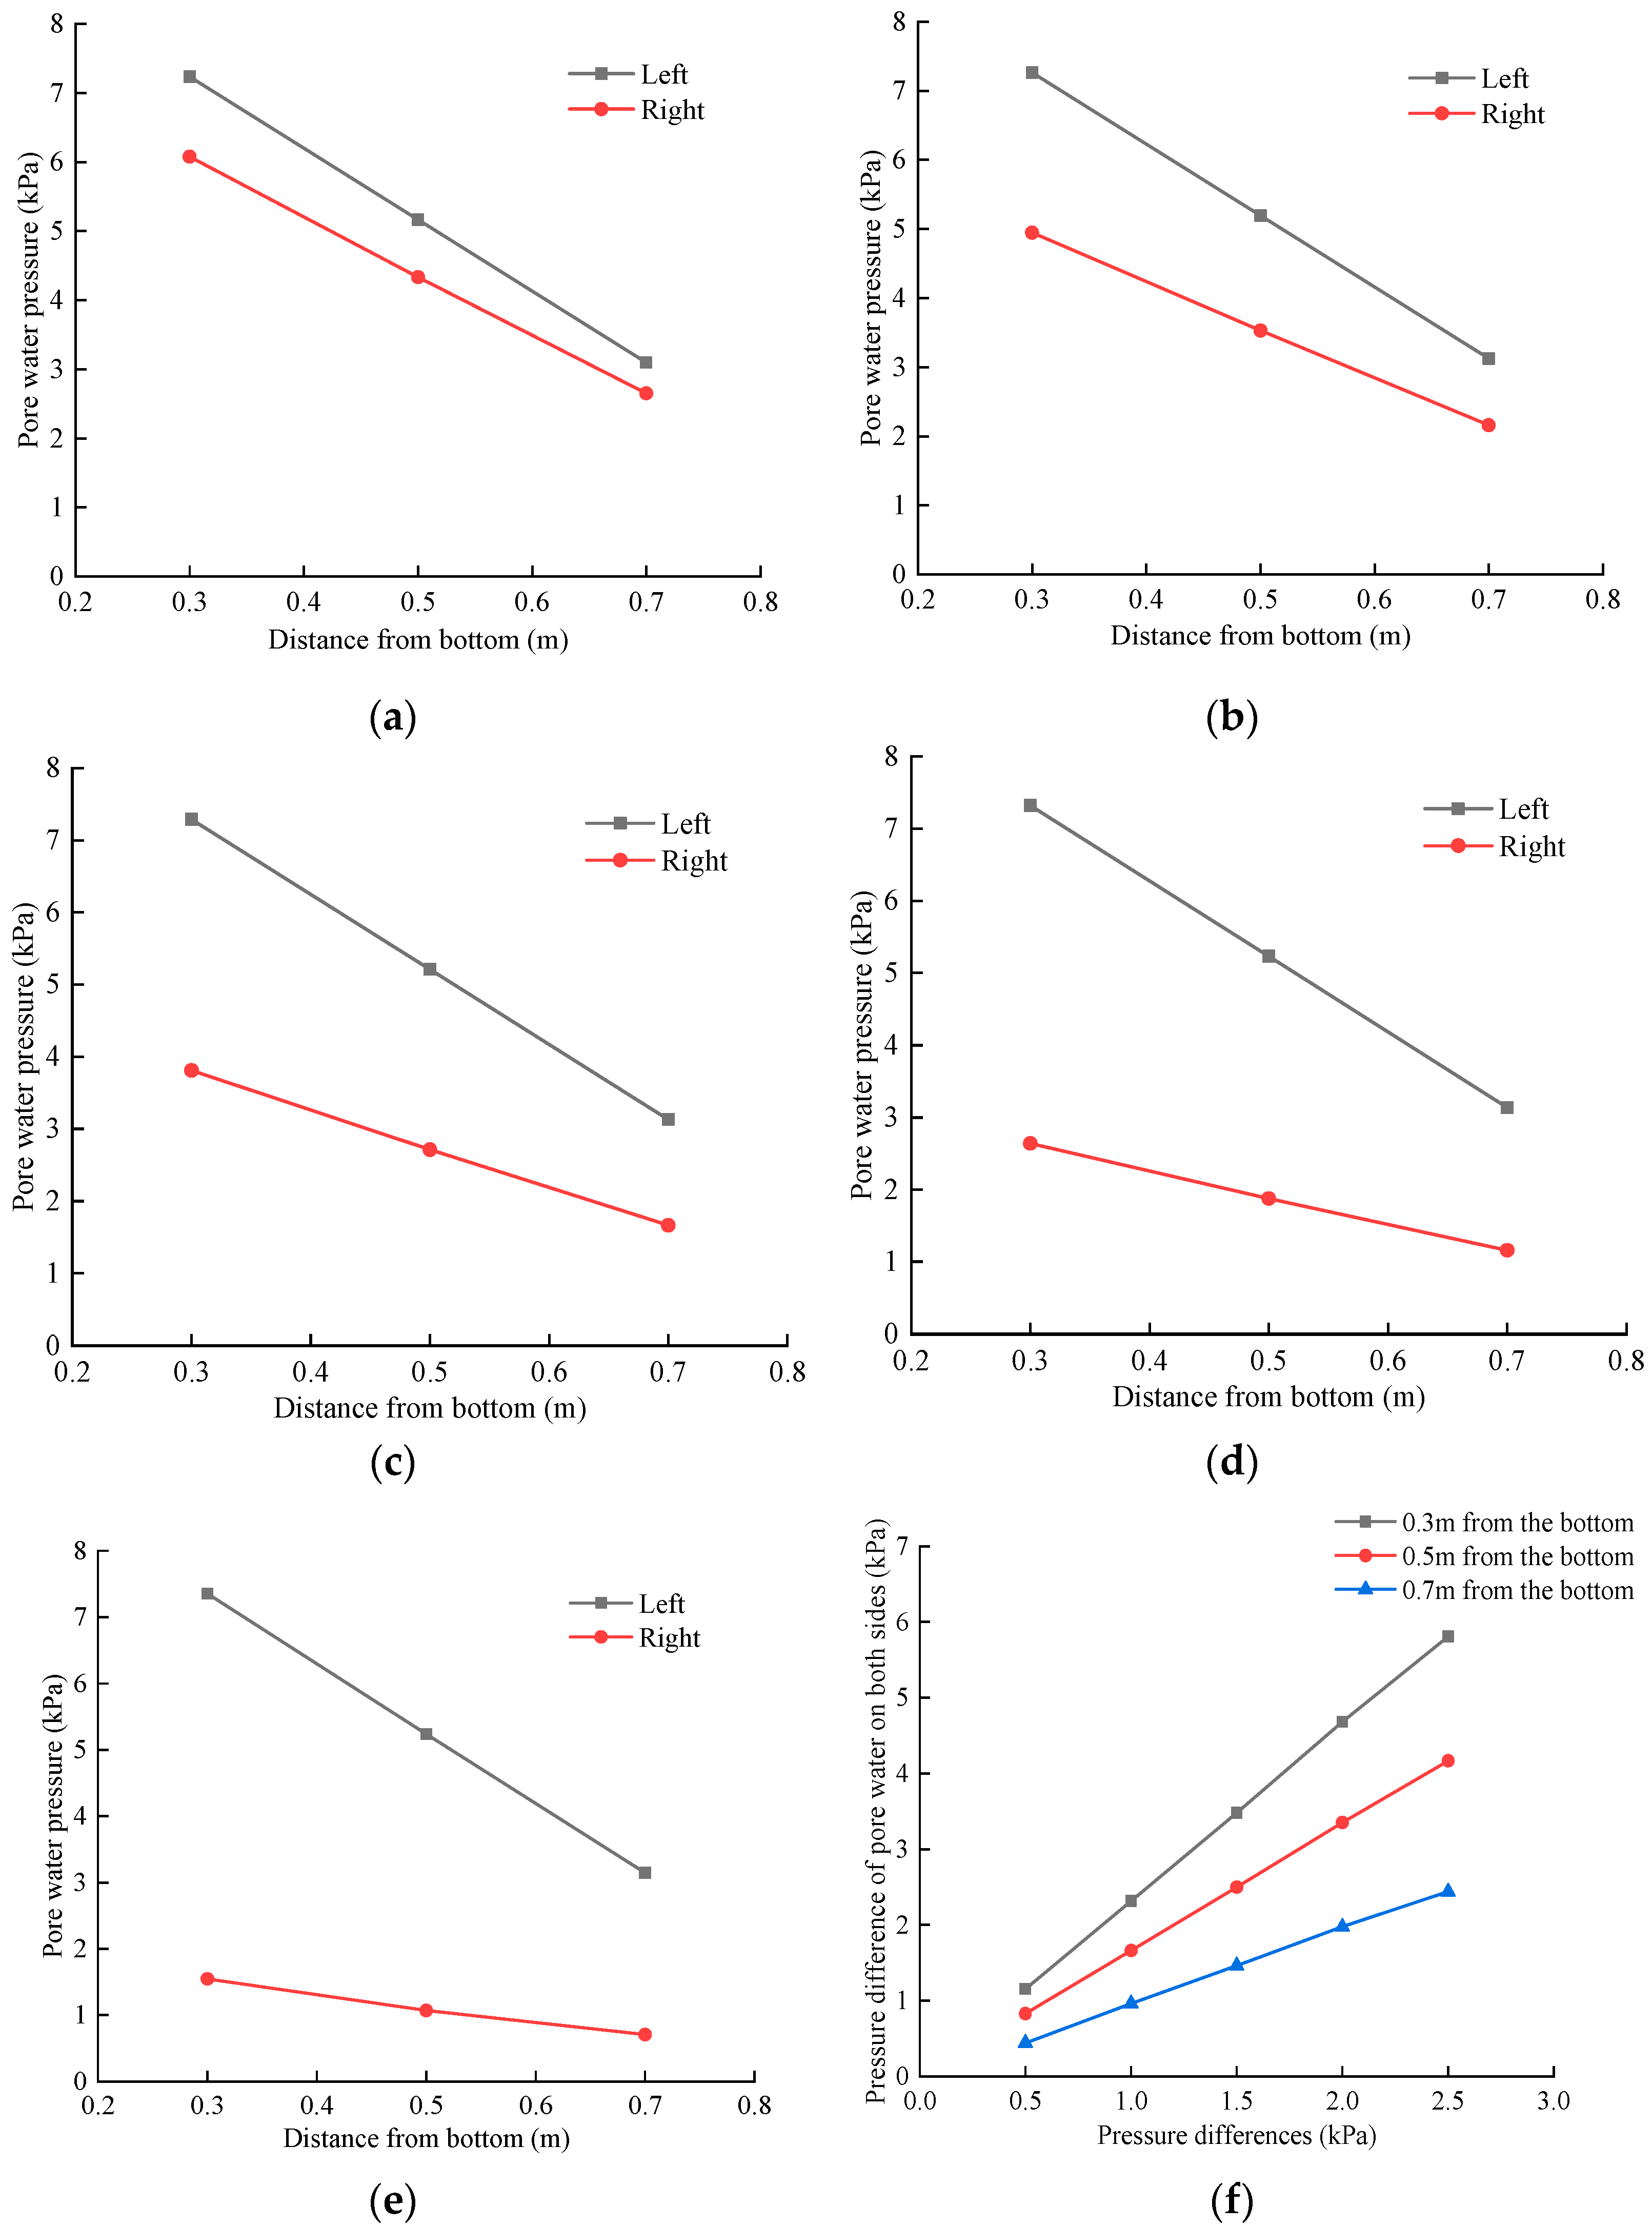
Figure 18a–f illustrates that the pore water pressure on the left and right sides of the pipe segment increases with depth, exhibiting a linear trend with depth. The pore water pressure values on the left and right sides of the pipe segment differ significantly. With increasing depth, the difference between the two values increases. At a depth of 0.3 m, the pore water pressure is subject to a notable unsymmetrical pressure, resulting in greater deformation. The left pore water pressure is higher than the right pore water pressure. The greater the pressure difference is, the greater the influence of unsymmetrical pressure on the pipe segment under pore water pressure is. The closer the pipe segment is to the bottom, the greater the influence of unsymmetrical pressure is, and the more likely it is to deform. Consequently, the design of the diversion function of the pipe segment can facilitate the flow of pressure water on both sides, thereby reducing the pressure difference between the two sides. This approach effectively addresses the issue of unsymmetrical pressure on both the sides of the pipe segment.
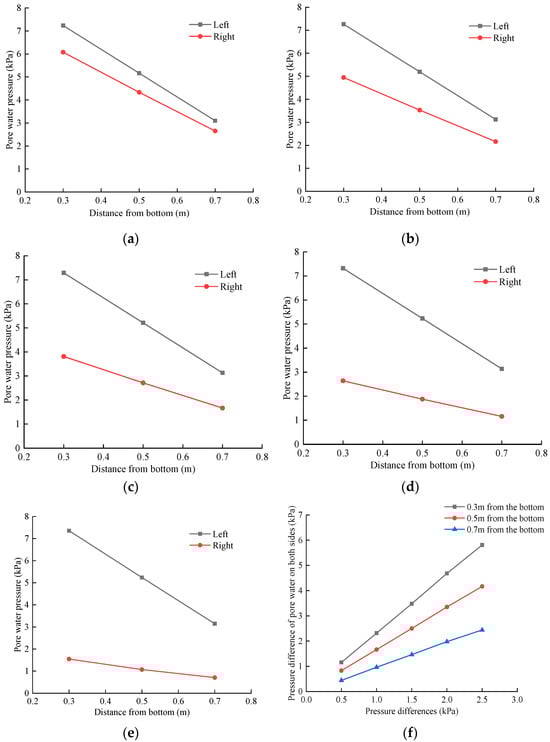
Figure 18.
Variation in pore pressure. (a) Pressure difference 0.5 kPa. (b) Pressure difference 1.0 kPa. (c) Pressure difference 1.5 kPa. (d) Pressure difference 2.0 kPa. (e) Pressure difference 2.5 kPa. (f) Changes in pore pressure difference on both sides of pipe segments at different depths.
4.4. Analysis of Total Stresses on Both Sides of the Pipe Segment under Different Differential Pressures
4.4.1. Distribution and Variation in Total Stress on Both Sides of the Pipe Segment
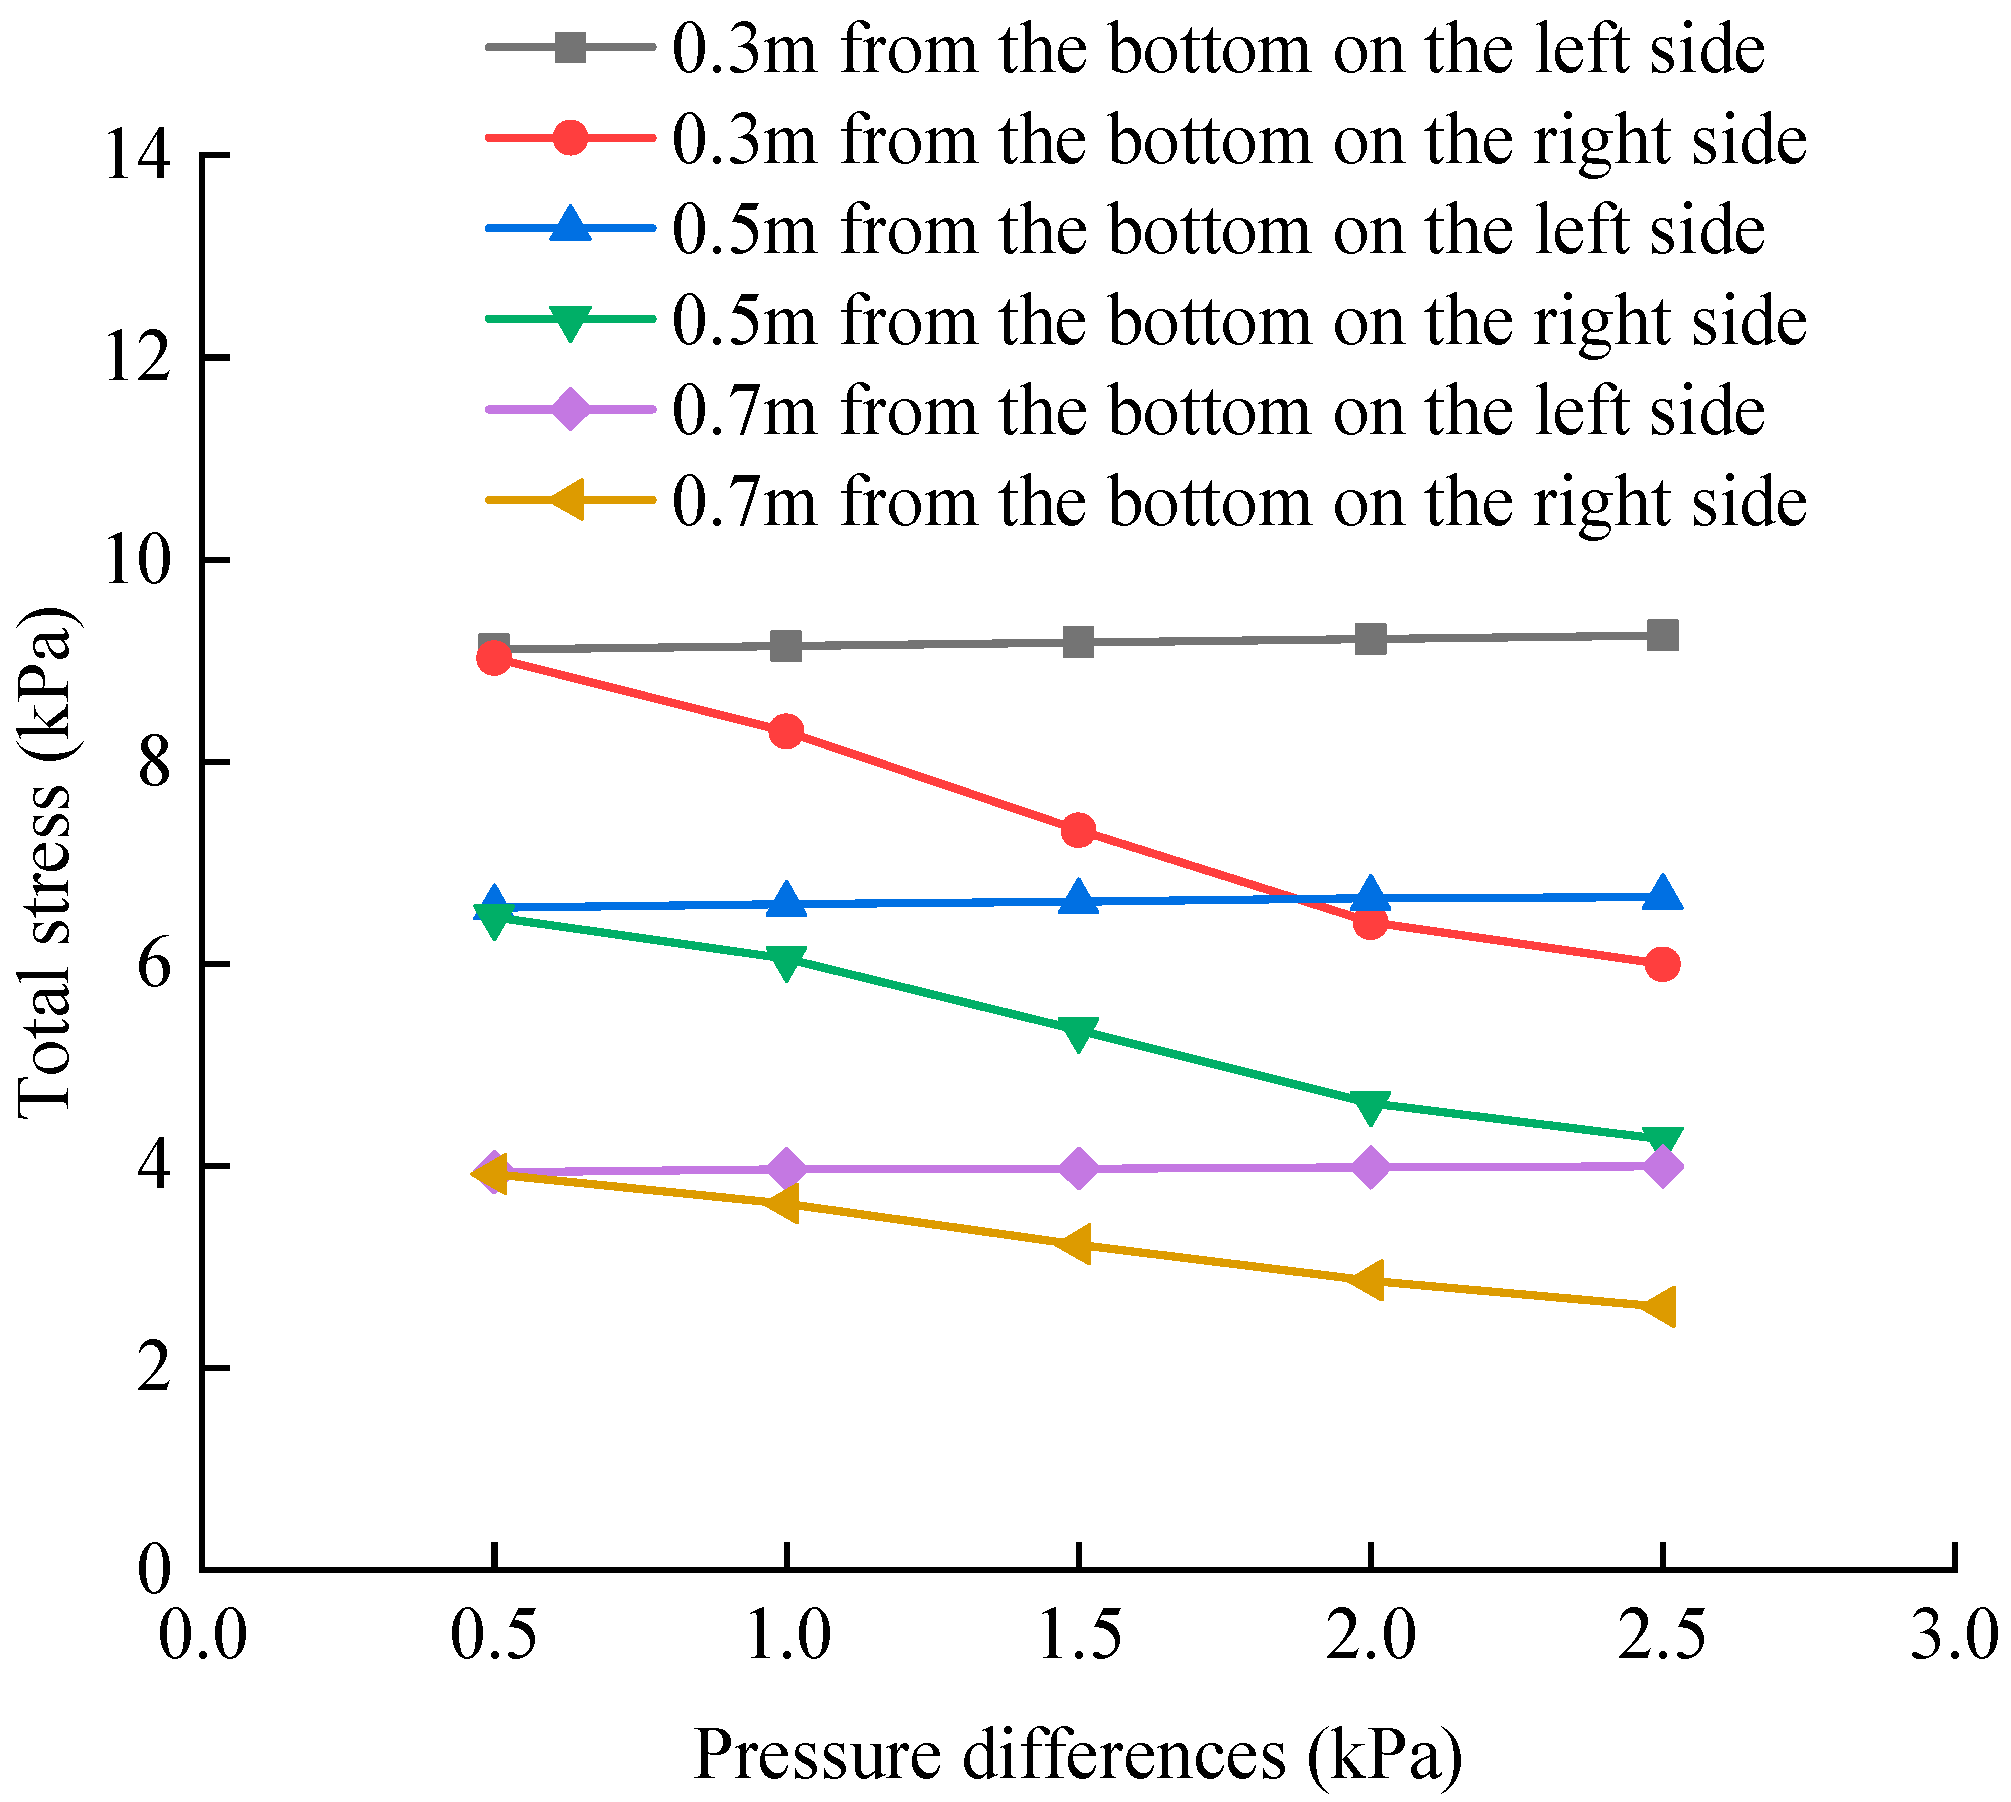
The quantitative analysis of the change in total stress at each measurement point as a function of the pressure difference between the two sides of the pipe segment is required. Figure 19 illustrates that as the differential pressure rises from 0.5 kPa to 2.5 kPa, the total stresses on the left side of the pipe segment at 0.3 m, 0.5 m, and 0.7 m from the bottom increase by 1.5%, 1.6%, and 1.5%, respectively. Notably, the increase in the total stress on the left side of the pipe segment is comparatively less pronounced. The total stress around the pipe segment at 0.3 m, 0.5 m, and 0.7 m from the bottom on the right side decreases with the increase in differential pressure. The total stress decreases by 33.6%, 34%, and 33.5%, respectively. The change in the total stress on the right side of the pipe segment is more affected by the increase in differential pressure.
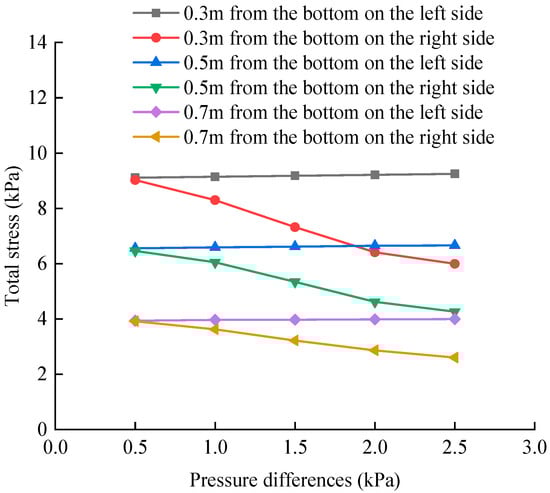
Figure 19.
Variation in total stress at each measurement point.
When the pressure difference between the two sides is altered, the sand and water levels on the left side remain largely unchanged, while the total stress on the left side is only minimally affected. In contrast, the water level on the right side declines, resulting in a notable increase in the effective stress on the right side and a reduction in the pore water pressure. However, the decline in the pore water pressure is greater than the rise in the effective stress, leading to a decrease in the total stress on the right side as the pressure difference increases.
4.4.2. Variation in Total Stress on Both Sides of the Pipe Segment at Different Depths
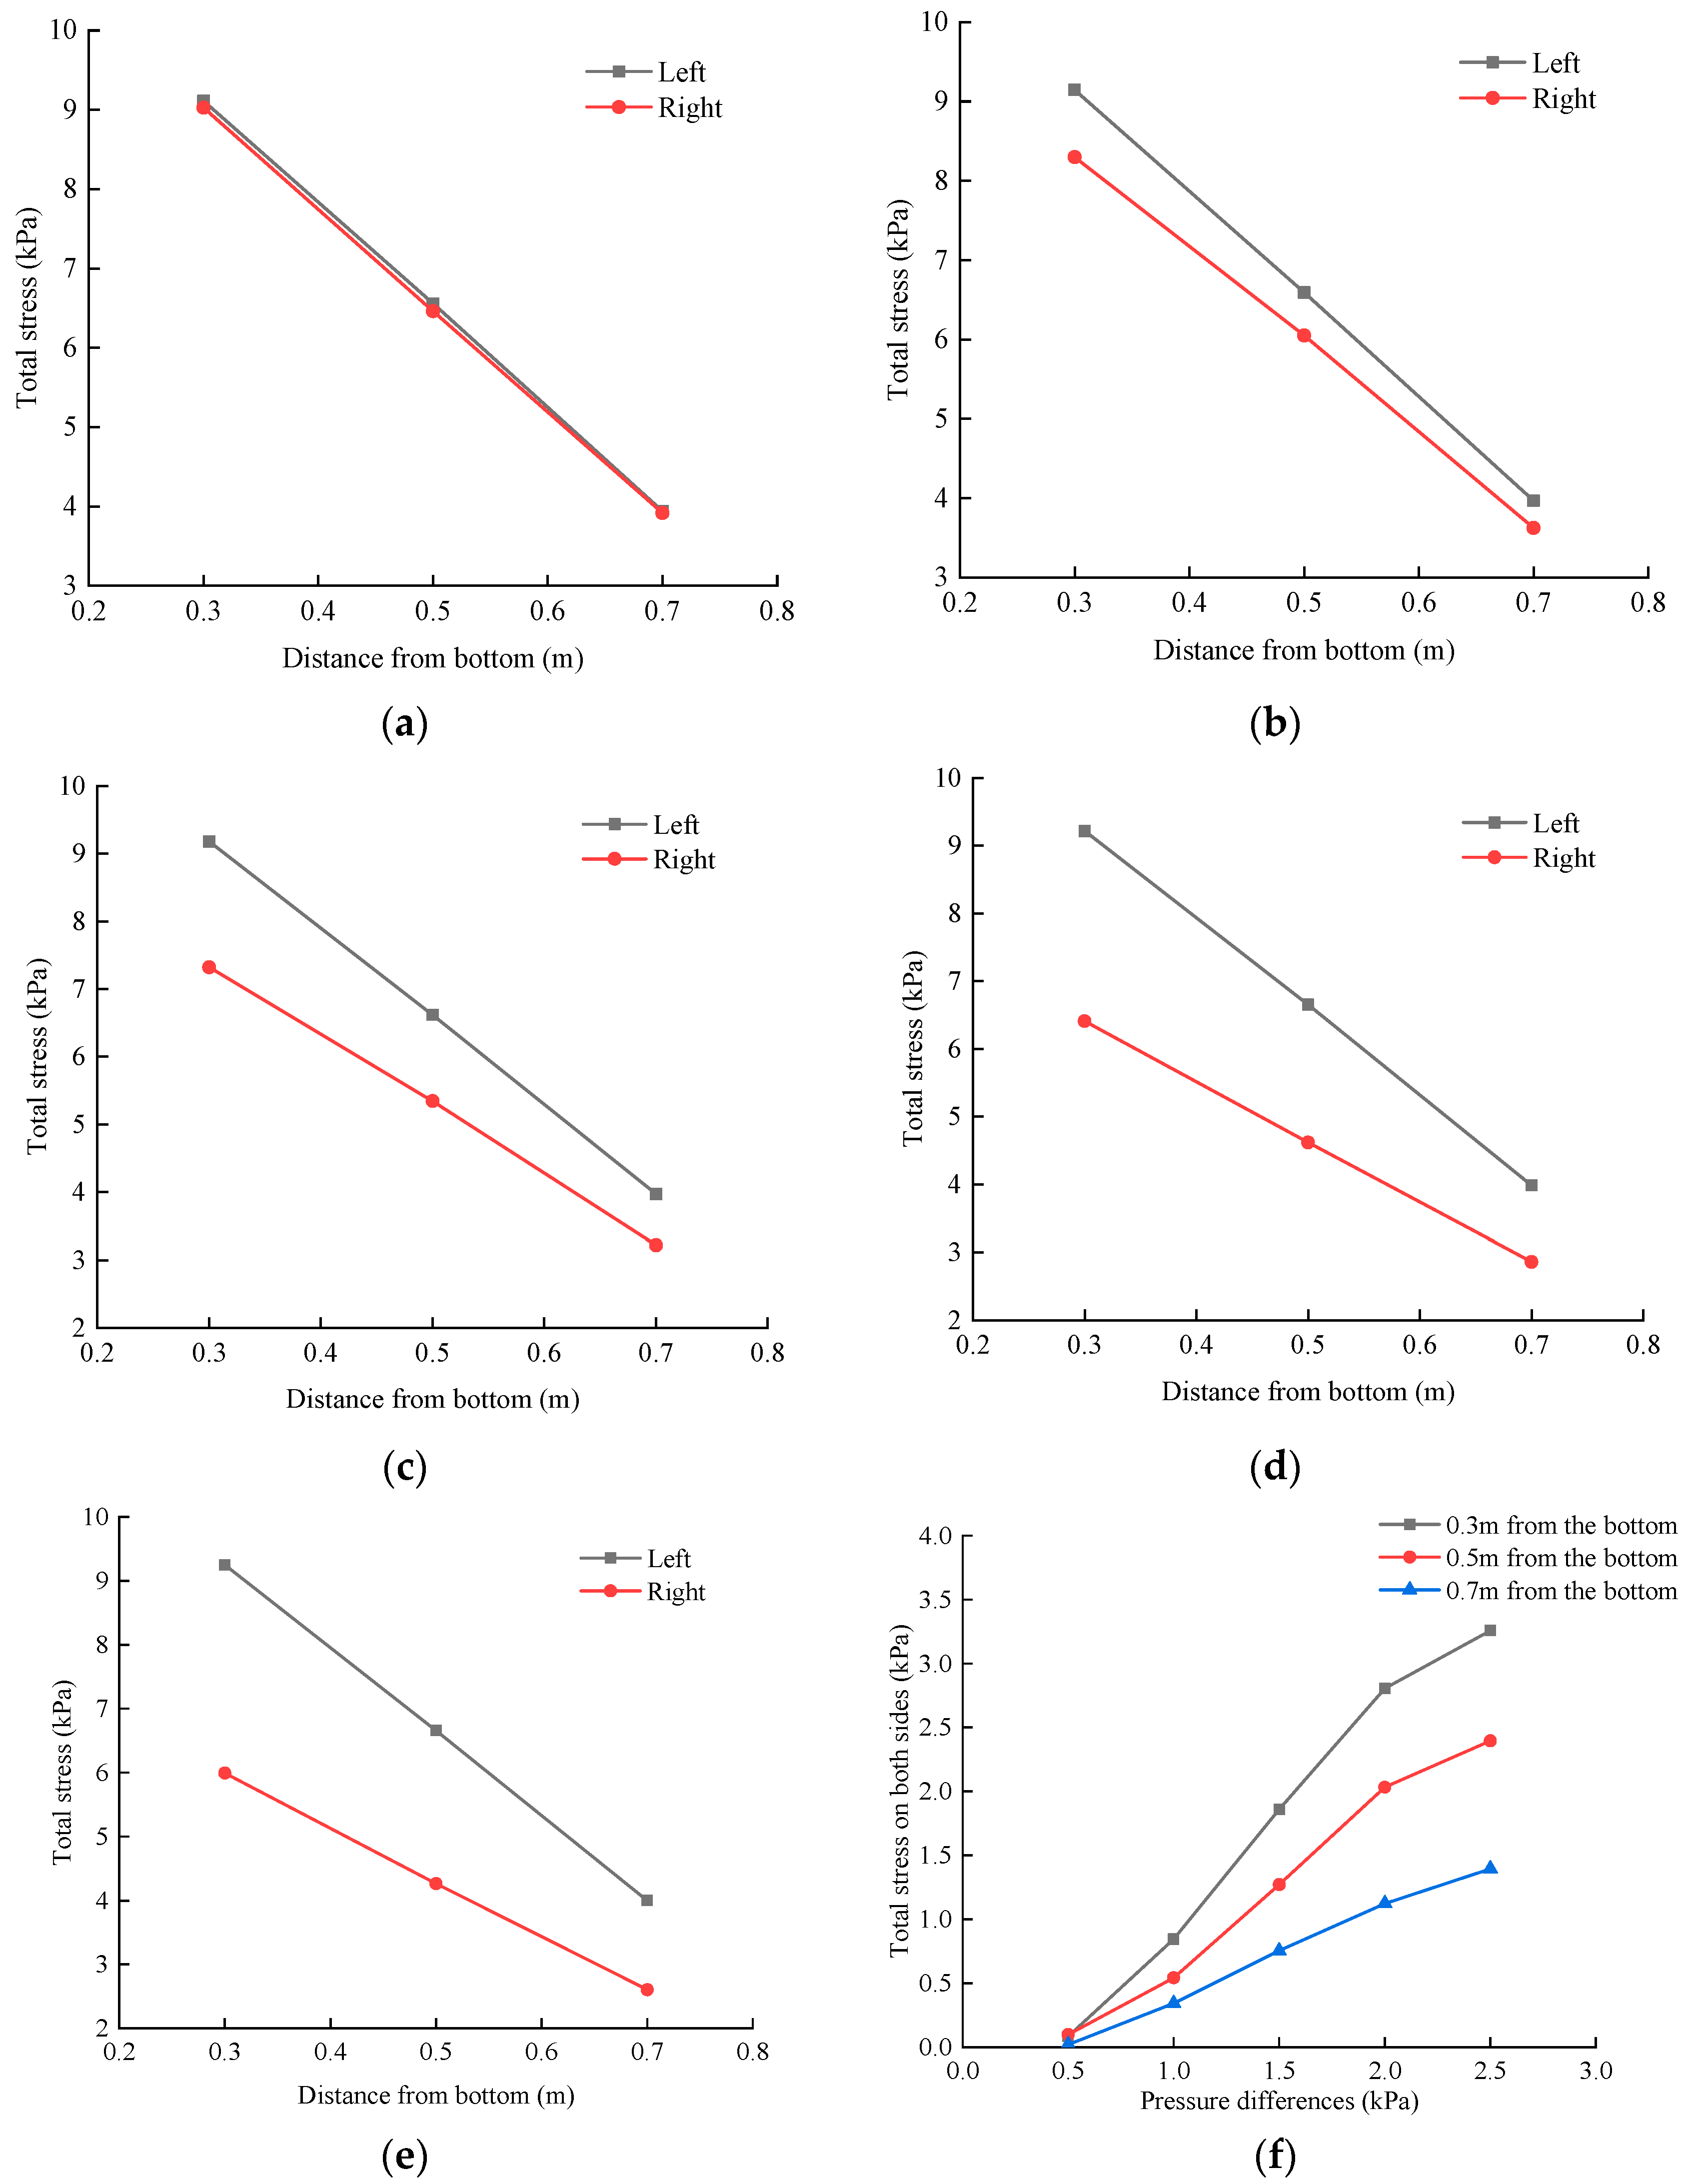
Figure 20a–f illustrates that the total stress on the left and right sides of the pipe segment is proportional to the depth. As the depth increases, the total stress around the pipe segment also increases in a linear manner. The comparison of the two curves reveals that the total stress difference between the left and right sides of the pipe segment at different depths is also different. Furthermore, the total stress difference between the left and right sides of the pipe segment at the deepest depth is also larger. The unsymmetrical pressure effect of the pipe segment is also more pronounced, with a corresponding increase in deformation. The total stress on the left side of the pipe segment is larger than that on the right side. An increase in differential pressure results in a corresponding increase in the total stress difference between the two sides of the pipe segment. The lower part of the pipe segment is particularly susceptible to the bias effect, which can lead to a greater degree of deformation. Consequently, by reducing the total stress difference between the two sides of the pipe segment through the utilization of the diversion function, the issue of unsymmetrical pressure on both the sides of the pipe segment can be alleviated.
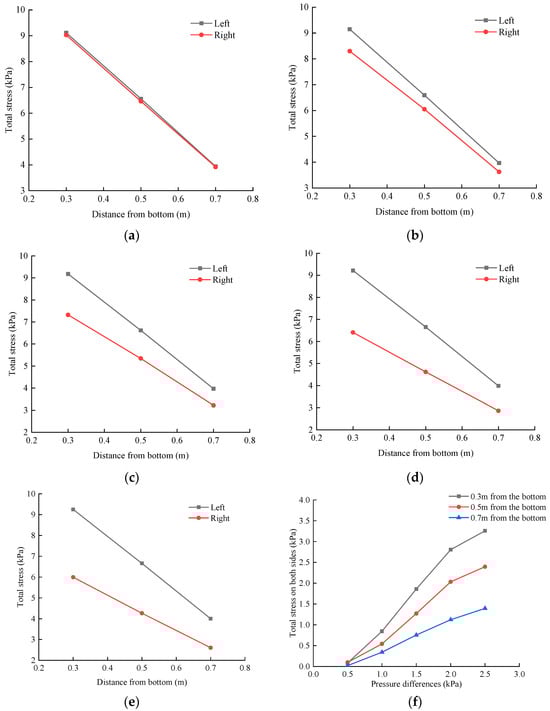
Figure 20.
Variation in total stress. (a) Pressure difference 0.5 kPa. (b) Pressure difference 1.0 kPa. (c) Pressure difference 1.5 kPa. (d) Pressure difference 2.0 kPa. (e) Pressure difference 2.5 kPa. (f) Changes in total stress difference on both sides of pipe segments at different depths.
5. Conclusions
This paper presents a model test box of the pipe segment with a diversion function, which enables the model test box of the pipe segment with the diversion function to effectively test the stress distribution of the pipe segment under the action of seepage unsymmetrical pressure, as well as the pore pressure and stress distribution around the pipe segment. Furthermore, the model test box allows for the verification of the reduce effect of the pipe segment on blocking the flow of groundwater. This provides the basic theory and key technical guidance for the fabrication and engineering application of a pipe segment with a diversion function.
- (1)
- The action of back-water and unsymmetrical pressure in the sand and water on the left and right sides of the pipe segment exerts pressure on the pipe segment, causing it to deform. This leads to the compression of the top and bottom of the pipe segment, with a tendency to bulge outward. Meanwhile, the lower left, lower right, and left and right sides of the pipe segment are stretched, with a tendency for concave inward deformation. The lower left and lower right sides of the pipe segment are subjected to a significantly higher pressure from sand and water than that on the upper part of the pipe segment. The greater the difference in pressure is, the more pronounced the asymmetric nature of the strain value of the pipe segment is.
- (2)
- The soil pressure difference between the two sides of the pipe segment increases with the increase in differential pressure. This results in a greater impact at greater depths, which, in turn, causes greater pipe segment unsymmetrical pressure, more serious pipe segment bending deformation, and an increased risk of leakage at the pipe segment nodes. Furthermore, this also leads to greater difficulties in operation and maintenance. The diversion function of the pipe segment channeling can effectively reduce the pressure difference between the two sides.
- (3)
- The greater the pressure difference is, the more pronounced the influence of unsymmetrical pressure under pore water pressure is, and the closer the pipe segment is to the bottom of the position, the greater the likelihood of deformation is. Consequently, the pressure difference also increases the total stress difference between the two sides of the pipe segment. The lower part of the pipe segment is more susceptible to the bias effect, which renders it more prone to deformation.
- (4)
- The pipe segment can facilitate the circulation of confined water on both the sides and reduce the unsymmetrical pressure between the two sides through the inflow function. This can effectively address the bias pressure problem on both the sides of the pipe segment, protect the spring system and the ecology of the groundwater, mitigate the influence of bias pressure on the pipe segment, and alleviate the difficulties in the operation and maintenance of the pipe segment.
- (5)
- The industrial production, on-site experimentation, and research of water diversion shield segments that can adapt to different geology conditions will be the study focus in the future.
Author Contributions
Y.S.: conceptualization; methodology; investigation; writing—original draft and visualization. S.X.: conceptualization; supervision; writing—review and editing. Z.T.: formal analysis; software; writing—original draft. B.Z.: Conceptualization; methodology. W.L.: supervision; writing-review and editing. All authors have read and agreed to the published version of the manuscript.
Funding
This project is supported by the National Natural Science Foundation of China (Grant No. 52204093), the Research Fund of Liaocheng University (No. 318051848), the Natural Science Foundation of Shandong Province (No. ZR2022ME165), and the Liaocheng University Graduate Education Quality Curriculum Construction Project (SDYKC2022169). The authors are grateful for this support.
Institutional Review Board Statement
Not applicable.
Informed Consent Statement
Not applicable.
Data Availability Statement
The raw data supporting the conclusions of this article will be made available by the authors on request.
Conflicts of Interest
Author Shuai Xing was employed by the company Shandong Tiangong Geotechnical Engineering Equipment Co., Ltd. The remaining authors declare that the research was conducted in the absence of any commercial or financial relationships that could be construed as a potential conflict of interest.
References
- Hua, F.C. Application of FLAC3D to seepage field of Qingdao metro. Rock Soil Mech. 2013, 34, 299–304. [Google Scholar]
- Gong, C.J.; Wang, Y.Y.; Peng, Y.C.; Ding, W.; Lei, M.; Da, Z.; Shi, C. Three-dimensional Coupled Hydromechanical Analysis of Localized Joint Leakage in Segmental Tunnel Linings. Tunn. Undergr. Space Technol. 2022, 130, 104726. [Google Scholar] [CrossRef]
- Qiu, H.S.; Qiu, R.H.; Luo, G.; Ayasrah, M.M.; Wang, Z. Study on the Mechanical Behavior of Fluid–Solid Coupling in Shallow Buried Tunnels Under Different Biased Terrain. Symmetry 2022, 14, 1339. [Google Scholar] [CrossRef]
- Rong, C.X.; Cheng, H. Stability Analysis of Rocks around Tunnel with Ground Water Permeation. Chin. J. Rock Mech. Eng. 2004, 23, 741–744. [Google Scholar]
- Wang, K.Z.; Li, Z.K. Study on 3d physical model test of seepage of deep-buried long and large diversion tunnel. Chin. J. Rock Mech. Eng. 2009, 28, 725–731. [Google Scholar]
- Zou, J.F.; Li, S.S.; Zhang, Y.; Yuan, Z. Solution and Analysis of Circular Tunnel for the Strain-Softening Rock Masses Considering the Axial in Situ Stress and Seepage Force. Chin. J. Theor. Appl. Mech. 2014, 46, 747–755. [Google Scholar]
- Zhang, B.Q.; Wang, Q.Y.; Lu, X.Y. Analytical Solution for non-Darcian Seepage Field of a Shallow Circular Tunnel in Soft Soil. Rock Soil Mech. 2018, 39, 4377–4384. [Google Scholar]
- Zhu, C.W.; Ying, H.W.; Gong, X.N. Analytical Solutions for Seepage Fields of Underwater Tunnels with Arbitrary Burial Depth. Chin. J. Geotech. Eng. 2017, 39, 1984–1991. [Google Scholar]
- Zhu, C.W.; Ying, H.W.; Gong, X.N.; Shen, H.W.; Wang, X. Analytical Solutions to Seepage Field of Underwater Twin Parallel Tunnels. Chin. J. Geotech. Eng. 2019, 41, 355–360. [Google Scholar]
- Guo, Y.F.; Wang, H.N.; Jiang, M.J. Analytical Solutions of Seepage Field for Underwater Shallow-Buried Parallel Twin Tunnels. Chin. J. Geotech. Eng. 2021, 43, 1088–1096. [Google Scholar]
- Chen, F.B.; Yang, Z.; Huang, D.Y. Tunnel Stability Analysis of Influence Factors under the Action of Seepage Field of Rich Water. J. Transp. Sci. Eng. 2013, 29, 34–39. [Google Scholar]
- Wang, Z.L.; Ahen, L.F.; Wu, Z. Influence of Local Water Leakage of Shield Tunnels on the Pore Water Pressure of Soil Masses. Mod. Tunn. Technol. 2017, 54, 89–95. [Google Scholar]
- Wang, Q.S.; Feng, K.; Li, D.B.; He, C.; Peng, Z.; Guo, H. Ground Pore Water Pressure Disturbed by Slurry Balanced Shield Tunneling. Tunn. Constr. 2019, 39, 266–273. [Google Scholar]
- Yu, L.; Lyu, C.; Wang, M.; Xu, T. Three-dimensional Upper Bound Limit Analysis of a Deep Soil-tunnel Subjected to Pore Pressure Based on the Nonlinear Mohr-Coulomb Criterion. Comput. Geotech. 2019, 112, 293–301. [Google Scholar] [CrossRef]
- Lu, K.D. Study on Distribution Characteristics of Pore Water Pressure in The Cross-River of Shield Tunnel. Build. Tructure 2020, 50, 759–763. [Google Scholar]
- Liu, Y.; Zhao, C.P.; Lai, X.L. Research on Groundwater Inflow and Distribution of Pore Water Pressure of Shallow Tunnel in Water-Rich Region. J. Shenyang Univ. (Nat. Sci.) 2013, 29, 23–29. [Google Scholar]
- Zhang, D.M.; Liu, Y.; Huang, H.W. Leakage-induced Settlement of Ground and Shield Tunnel in Soft Clay. J. Tongji Univ. (Nat. Sci.) 2013, 41, 1185–1190. [Google Scholar]
- Li, X.Y.; Liu, G.B.; Liu, M.; Feng, Q.G. Analytical Study on Dissipation of Excess Pore Water Pressure around Tunnels with Semi-Permeable Boundary Conditions. Chin. J. Geotech. Eng. 2014, 36, 75–82. [Google Scholar]
- Xu, T.; Adam, B.; Wout, B. Analytical Solutions for Excess Pore Water Pressures Generated by TBM Tunnelling in a Semi-confined Aquifer. Tunn. Undergr. Space Technol. Inc. Trenchless Technol. Res. 2021, 118, 104162. [Google Scholar] [CrossRef]
- Huang, F.; Yang, X.L. Upper Bound Limit Analysis of Collapse Shape for Circular Tunnel Subjected to Pore Pressure Based on the Hoek–Brown Failure Criterion. Tunn. Undergr. Space Technol. Inc. Trenchless Technol. Res. 2011, 26, 614–618. [Google Scholar] [CrossRef]
- Zhang, D.M.; Ran, L.Z.; Yan, J.Y. Effect of Grouting on Tunnel Leakage-Induced Pore Pressure Change in Saturated Soft Soils. Rock Soil Mech. 2017, 38, 3427–3435+3444. [Google Scholar]
- Tang, Y.Q.; Cui, Z.D.; Zhang, X. Dynamic Response and Pore Pressure Model of the Saturated Soft Clay around the Tunnel Under Vibration Loading of Shanghai Subway. Eng. Geol. 2008, 98, 126–132. [Google Scholar] [CrossRef]
- Lina MG, C.; Siavash, G.; Jean, S. Effect of Anisotropy and Hydro-mechanical Couplings on Pore Pressure Evolution During Tunnel Excavation in Low-permeability Ground. Int. J. Rock Mech. Min. Sci. 2017, 97, 1–14. [Google Scholar]
- Huang, H.W.; Liu, Y.; Zhang, D.M. Influence of Long-Term Seepage of Shield Tunnel on Inner Force of Segments and Ground Surface Settlement. China Railw. Sci. 2012, 33, 36–43. [Google Scholar]
- Liu, Y.; Jiang, M.M. Long-term influence of leakage at shield tunnel joint on its deformation and inner force. Yangtze River 2017, 48, 96–102. [Google Scholar]
- Ye, Z.; Fu, A.R.; Liu, H.B. Effect of seepage erosion of tunnel crown on ground settlement and structural deformation in shield tunnelling. J. Hohai Univ. (Nat. Sci.) 2021, 49, 279–287. [Google Scholar]
- Liang, Z.Y.; Chen, H.; Liang, Z. Research on Mechanical Characteristics of Underwater Shield Tunnel Segment. Munic. Eng. Technol. 2020, 38, 146–148. [Google Scholar]
- Lin, R.A.; Liu, B.Y. Mechanical Characteristic Investigation of Shield Tunnel Segment in Water-rich Mucky Stratum. China J. Highw. Transp. 2018, 1, 112–118. [Google Scholar]
- Li, X.; Zhang, Y.S.; Geng, A.P.; Geng, F.J.; Wu, J.Q. Measurement and Analysis of Structure Behavior of Cross-river Shield Tunnel with Large Diameter. Chin. J. Undergr. Space Eng. 2022, 18, 297–304. [Google Scholar]
- Zhang, D.W.; Liu, Z.X.; Shen, G.G.; E, J. Measurement of earth pressure of Shallow Buried Tunnel with Super Large Diameter and Applicability Evaluation of Calculation Method. Rock Soil Mech. 2019, 40, 91–98. [Google Scholar]
- Li, X.; Zhou, S.H.; Gong, Q.M.; Chen, C.J. Evaluation of earth pressure around a Deeply Buried Metro Shield Tunnel with a Large Cross-Section under High Water Pressure Conditions. Rock Soil Mech. 2015, 36, 1415–1420+1427. [Google Scholar]
- Zhou, S.H.; Liu, C.; Li, X.; Jin, H. Reverse Calculation and Analysis of Measured Internal Force of Deeply Buried Shield Tunnels with Large Cross-section Under High Water Pressure Conditions. J. Tongji Univ. (Nat. Sci.) 2017, 45, 970–977. [Google Scholar]
- Du, C.W.; Wang, M.S.; Tan, Z.S. Analytic Solution for Seepage Field of Subsea Tunnel and Its Application. Chin. J. Geotech. Eng. 2011, 30, 3567–3573. [Google Scholar]
- Xie, J.C.; Huang, X.; Jin, G.L.; Zhang, Z.X. Seepage Characteristics and Mechanical Response of Shield Tunnels under Localized Leakage and Exosmosis. Rock Soil Mech. 2023, 44, 1179–1189. [Google Scholar]


Disclaimer/Publisher’s Note: The statements, opinions and data contained in all publications are solely those of the individual author(s) and contributor(s) and not of MDPI and/or the editor(s). MDPI and/or the editor(s) disclaim responsibility for any injury to people or property resulting from any ideas, methods, instructions or products referred to in the content. |
© 2024 by the authors. Licensee MDPI, Basel, Switzerland. This article is an open access article distributed under the terms and conditions of the Creative Commons Attribution (CC BY) license (https://creativecommons.org/licenses/by/4.0/).