

Temperature Behavior in Headlights: A Comparative Analysis between Battery Electric Vehicles and Internal Combustion Engine Vehicles


Abstract
1. Introduction
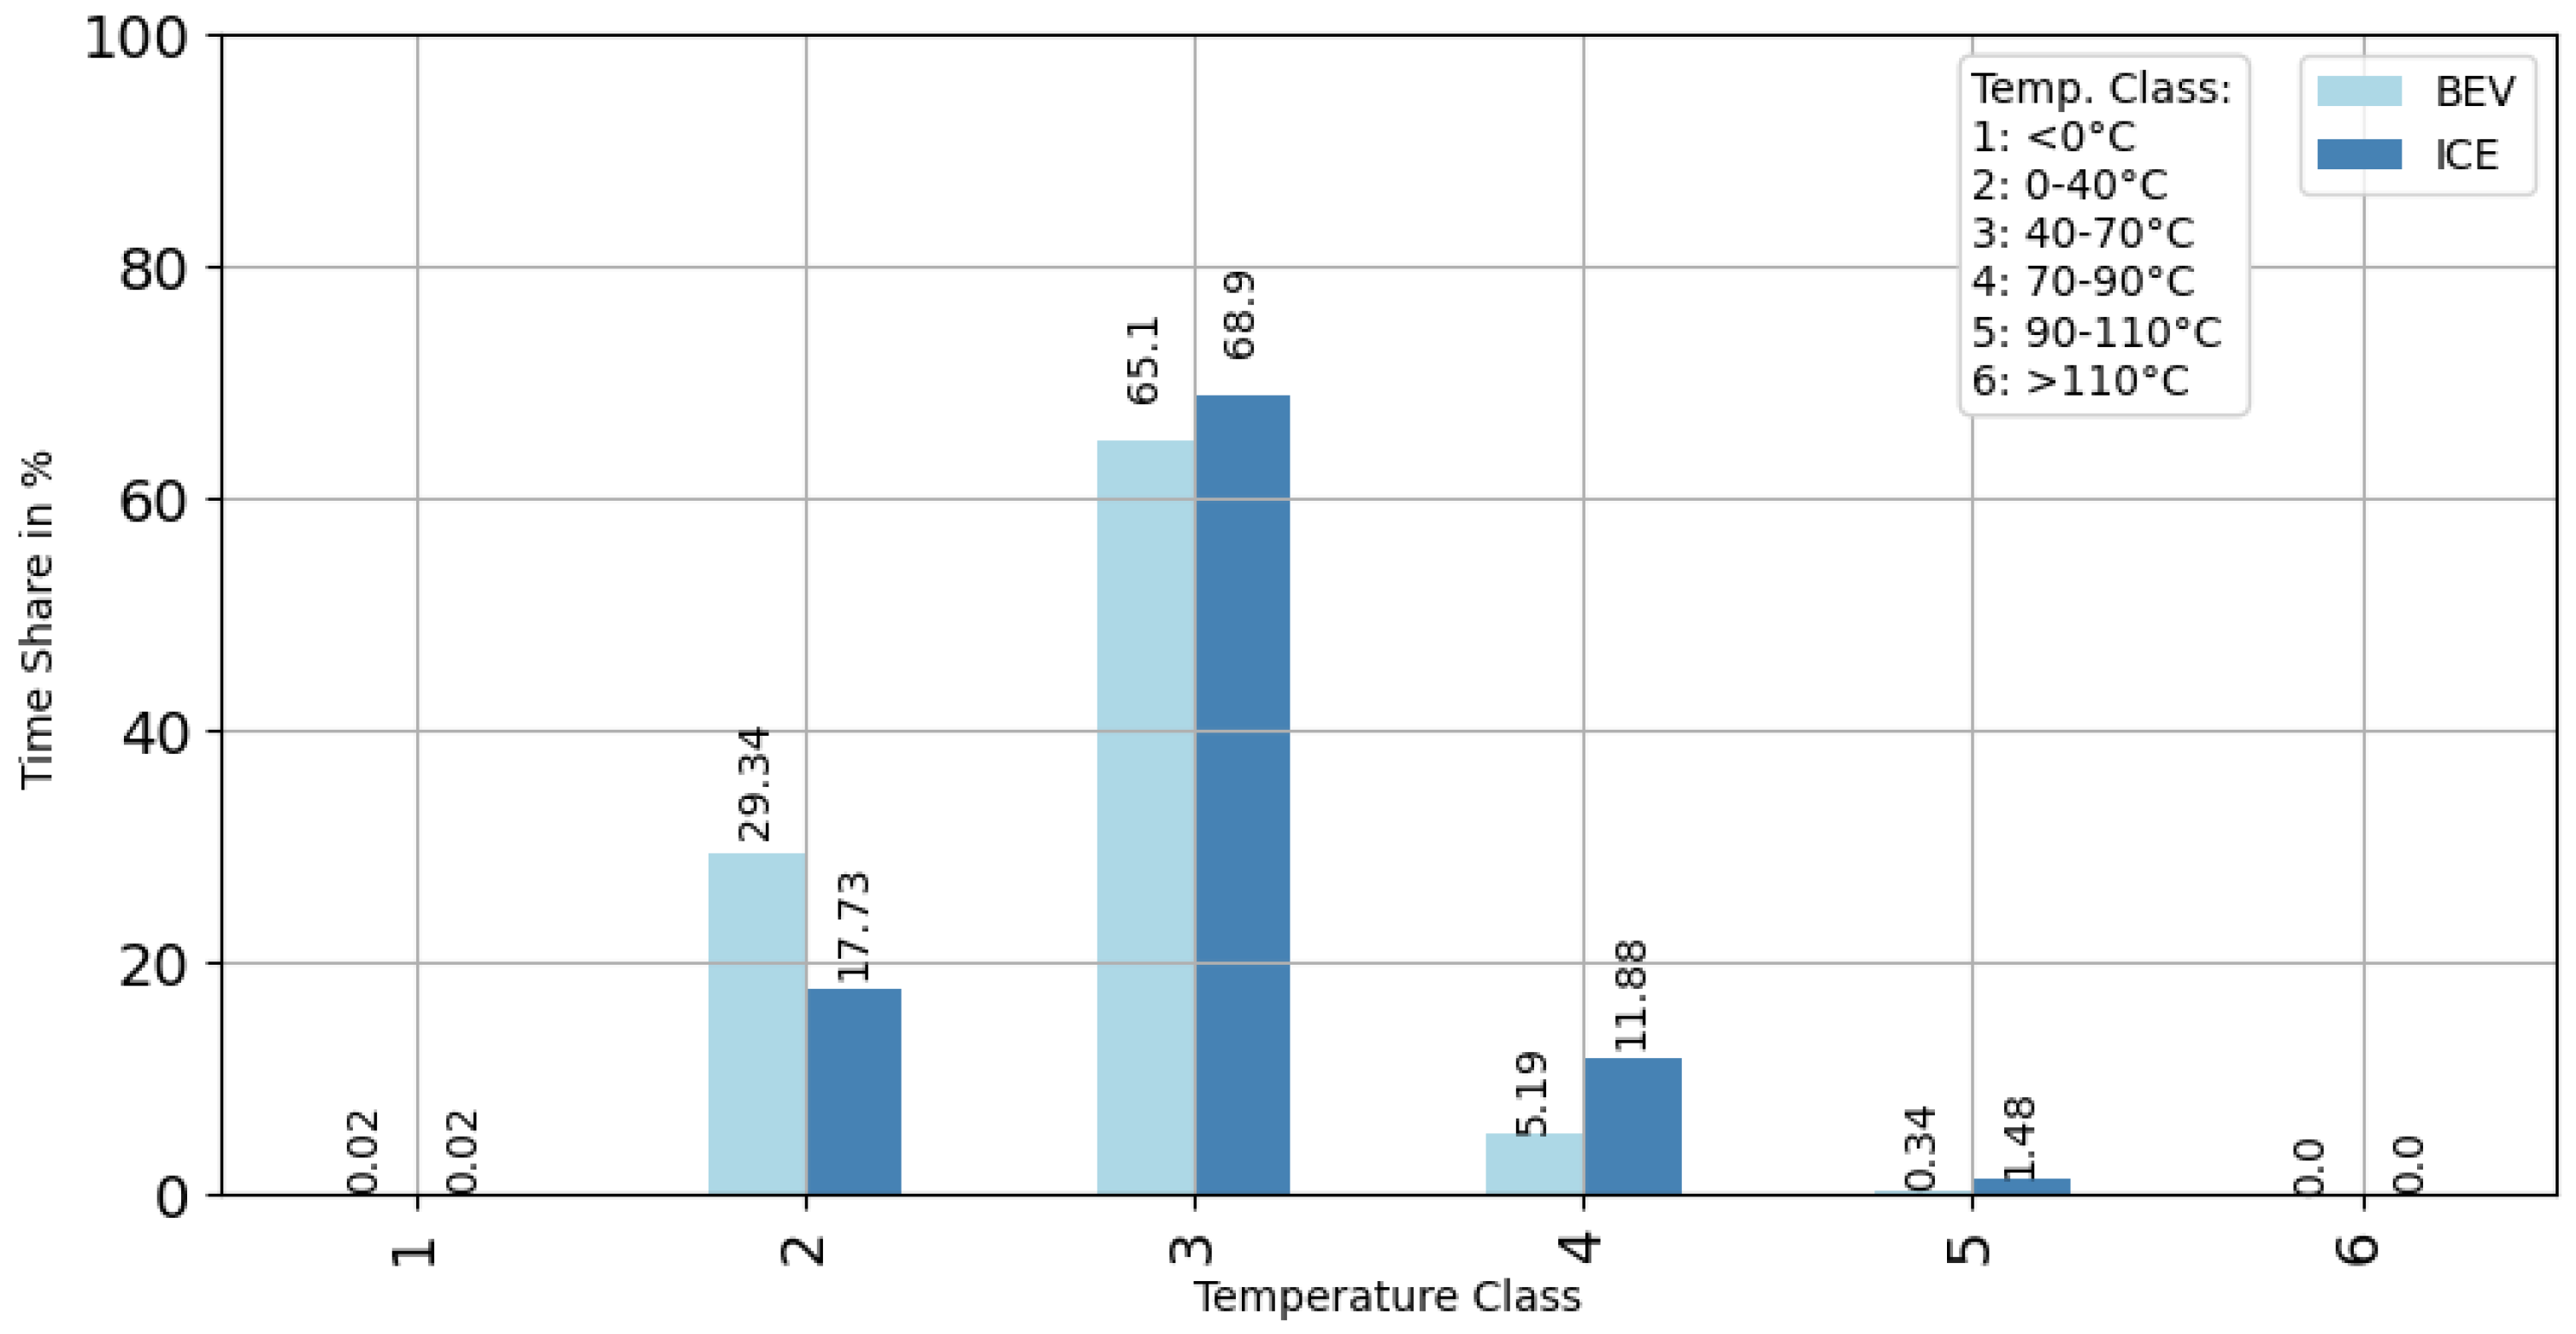
- Is there an influence on the temporal proportion (TP) within different temperature classes (TCs) between the different engine types of battery electric vehicles (BEVs) and internal combustion engine (ICE) vehicles?
- Is there an influence on the overall temporal proportion (TP) of different temperature classes (TCs) when considering the different engine types of BEVs and ICE vehicles separately?
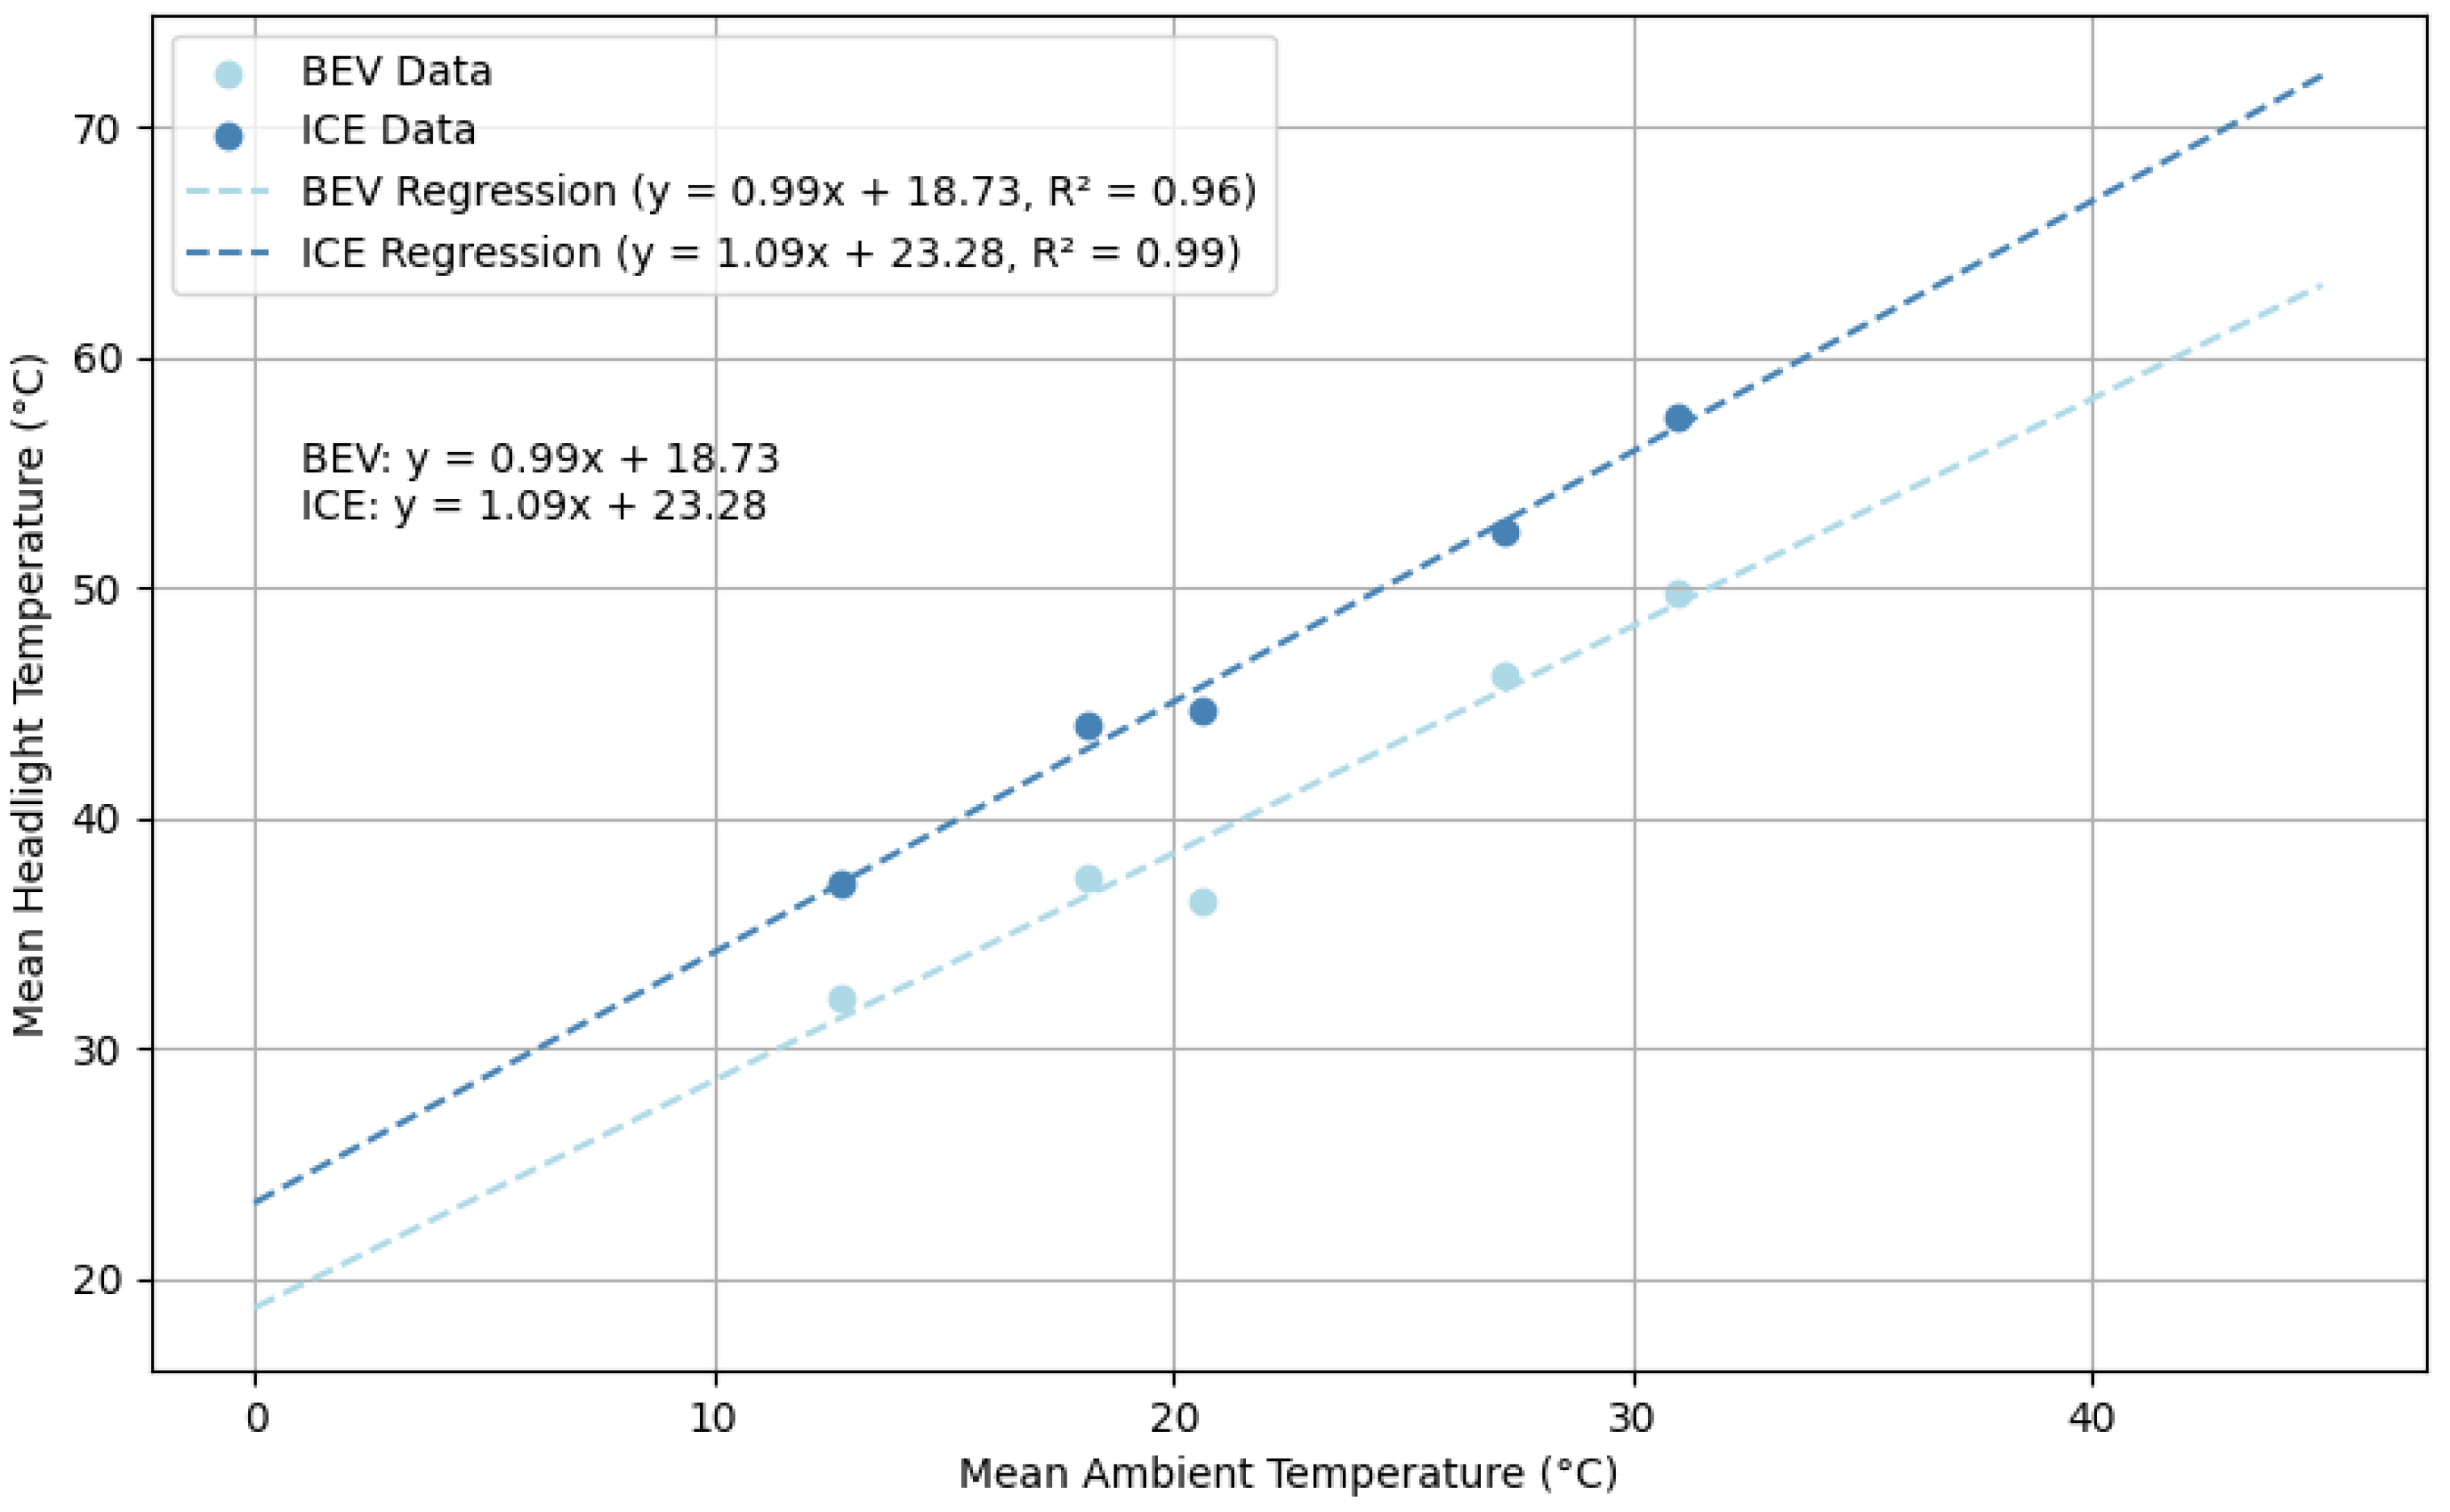
- Is there an influence on the temporal proportion (TP) within different temperature classes (TCs) across varying ambient vehicle temperatures (ATs)?
2. Materials and Methods
2.1. Data Collection
2.2. Methods
3. Results
3.1. Descriptive Results
3.2. Statistical Results
3.3. Regression Results
4. Discussion
- Whether the temporal proportion (TP) within different temperature classes (TCs) is affected by the type of engine, comparing battery electric vehicles (BEVs) with internal combustion engine (ICE) vehicles.
- Whether the temporal proportion (TP) across different temperature classes (TCs) is influenced when BEVs and ICE vehicles are considered separately.
- Whether ambient vehicle temperatures (ATs) affect the temporal proportion (TP) within different temperature classes (TCs).
5. Conclusions
Author Contributions
Funding
Institutional Review Board Statement
Informed Consent Statement
Data Availability Statement
Conflicts of Interest
References
- Elektromobilität in Deutschland. Available online: https://de.statista.com/themen/608/elektromobilitaet/#topicOverview (accessed on 29 March 2024).
- BMW Group Setzt BEV-Wachstumskurs Fort: Meilenstein von 1 Million Vollelektrischen Fahrzeugen Erreicht. Available online: https://www.press.bmwgroup.com/deutschland/article/detail/T0441021DE/bmw-group-setzt-bev-wachstumskurs-fort:-meilenstein-von-1-million-vollelektrischen-fahrzeugen-erreicht?language=de (accessed on 29 April 2024).
- Die Elektromobilität Weltweit auf dem Vormarsch. Available online: https://www.vda.de/de/themen/elektromobilitaet/marktentwicklung-europa-international (accessed on 29 April 2024).
- Thermomanagement für Elektrofahrzeuge. Available online: https://www.mein-autolexikon.de/thermomanagement-fuer-elektrofahrzeuge.html (accessed on 24 March 2024).
- Olabi, A.G.; Moghrabi, H.M.; Kadhim Adhari, O.H.; Sayed, E.T.; Yousef, B.A.A.; Salameh, T.; Kamil, M.; Abdelkareem, M.A. Battery Thermal Management Systems: Recent Progress and Challenges. Int. J. Thermofluids 2022, 15, 100171. [Google Scholar] [CrossRef]
- Sahin, G.; Sinan, G.; Cetkin, E. A review on battery thermal management strategies in lithium-ion and post-lithium batteries for electric vehicles. J. Therm. Eng. 2023, 9, 1071–1092. [Google Scholar] [CrossRef]
- Tang, Z.; Fan, J.; Chen, W.; Li, Y.; Mohamed, G.; Li, R. Optimal thermal design of LED automotive headlamp with the response surface method. In Proceedings of the 2019 16th China International Forum on Solid State Lighting & 2019 International Forum on Wide Bandgap Semiconductors China (SSLChina: IFWS), Shenzhen, China, 25–27 November 2019; pp. 214–219. [Google Scholar] [CrossRef]
- Kamat, S.; Shinde, S.; Sali, N.V. Thermal Analysis of Automotive Headlamp. Int. Res. J. Eng. Technol. (IRJET) 2018, 5. [Google Scholar]
- Jung, C.; Zahner, T. Reliability Management of a Light-Emitting Diode for Automotive Applications. In Solid State Lighting Reliability Part 2, 2nd ed.; Springer International Publishing: Cham, Switzerland, 2018; Volume 2, pp. 549–572. [Google Scholar]
- Almehio, Y.; Chawa, M.; Taleb, R.; El Idrissi, H.; Merlin, C. AI Based Headlamp Energy Management Solution for reduced power consumption and optimized services. In Proceedings of the 15th International Symposium of Automotive Lighting: ISAL 2023, Darmstadt, Germany, 25–27 September 2023. [Google Scholar]
- Hartmann, P.; Walzek, M.; Gutmensch, M.; Miedler, S.; Riesenhuber, M. Headlamps as a sustainable system product. In Proceedings of the 14th International Symposium of Automotive Lighting: ISAL 2021, Darmstadt, Germany, 4–6 April 2022. [Google Scholar]
- Unece United Nations Economic Commission for Europe (ECE). R112; Unece United Nations Economic Commission for Europe (ECE): Geneva, Switzerland, 2014. [Google Scholar]
- Society of Automotive Engineers, INC. (SAE). SAE J 575; Society of Automotive Engineers, INC. (SAE): Warrendale, PA, USA, 2022. [Google Scholar]
- Chang, C.-H.; Teng, T.-P.; Teng, T.-C. Influence of Ambient Temperature on Optical Characteristics and Power Consumption of LED Lamp for Automotive Headlamp. Appl. Sci. 2022, 12, 11443. [Google Scholar] [CrossRef]
- Gulbransen, E.A. The Application of the Arrhenius Law to Reactions in Solids. J. Electrochem. Soc. 1953, 100, 411–414. [Google Scholar]
- Peelman, N.; Ragaert, P.; Ragaert, K.; De Meulenaer, B.; Devlieghere, F.; Cardon, L. Heat resistance of new biobased polymeric materials, focusing on starch, cellulose, PLA, and PHA. J. Appl. Polym. Sci. 2015, 132. [Google Scholar] [CrossRef]
- LV-124; Elektrische und elektronische Komponenten im Kraftfahrzeug bis 3,5 t—Anforderungen und Prüfungen. Verband der Automobilindustrie e.V.: Eisenach, Germany, 2015.
- AEC-Q101-Rev-D; Failure Mechanism Based Stress Test Qualification for Discrete Semiconductors in Automotive Applications. Automotive Electronics Council: New York, NY, USA, 2013.
- IEC 60810:2014; Lamps for Road Vehicles—Performance Requirements, in Chapter 8 “Requirements and Test Conditions for LED Packages”, Ed. 4.0. IEC Standardisation Body: London, UK, 2014.
- DIN EN 60068-2-2 VDE 0468-2-2:2008-05; Deutsches Institut für Normung e.V. (DIN): Umgebungseinflüsse—Teil 2-2: Prüfungen—Prüfung B: Trockenhitze. Beuth Verlag: Berlin, Germany, 2008.
- DIN EN 60068-2-14; Deutsches Institut für Normung e.V. (DIN): Umgebungseinflüsse—Teil 2-14: Prüfungen—Prüfung N: Temperaturwechsel. Beuth Verlag: Berlin, Germany, 2009.
- Manderscheid, M.; Hamm, M.; Klaussner, M. Battery Electric Vehicles (BEV) versus Internal Combustion Engine Vehicles (ICEV): First Real Time Investigations on Temperature Load Differences in Headlamp Environment. In Proceedings of the 14th International Symposium of Automotive Lighting: ISAL 2023, Darmstadt, Germany, 25–27 September 2023. [Google Scholar]
- Meteostat. “Meteostat Python Library”, Meteostat (2024). Available online: https://github.com/meteostat/meteostat-python (accessed on 11 May 2022).
- Montgomery, D.C. Design and Analysis of Experiments. In Design and Analysis of Experiments, 2nd ed.; Montgomery, D.C., Ed.; John Wiley & Sons: Hoboken, NJ, USA, 2017; Chapter 13; pp. 345–378. [Google Scholar]


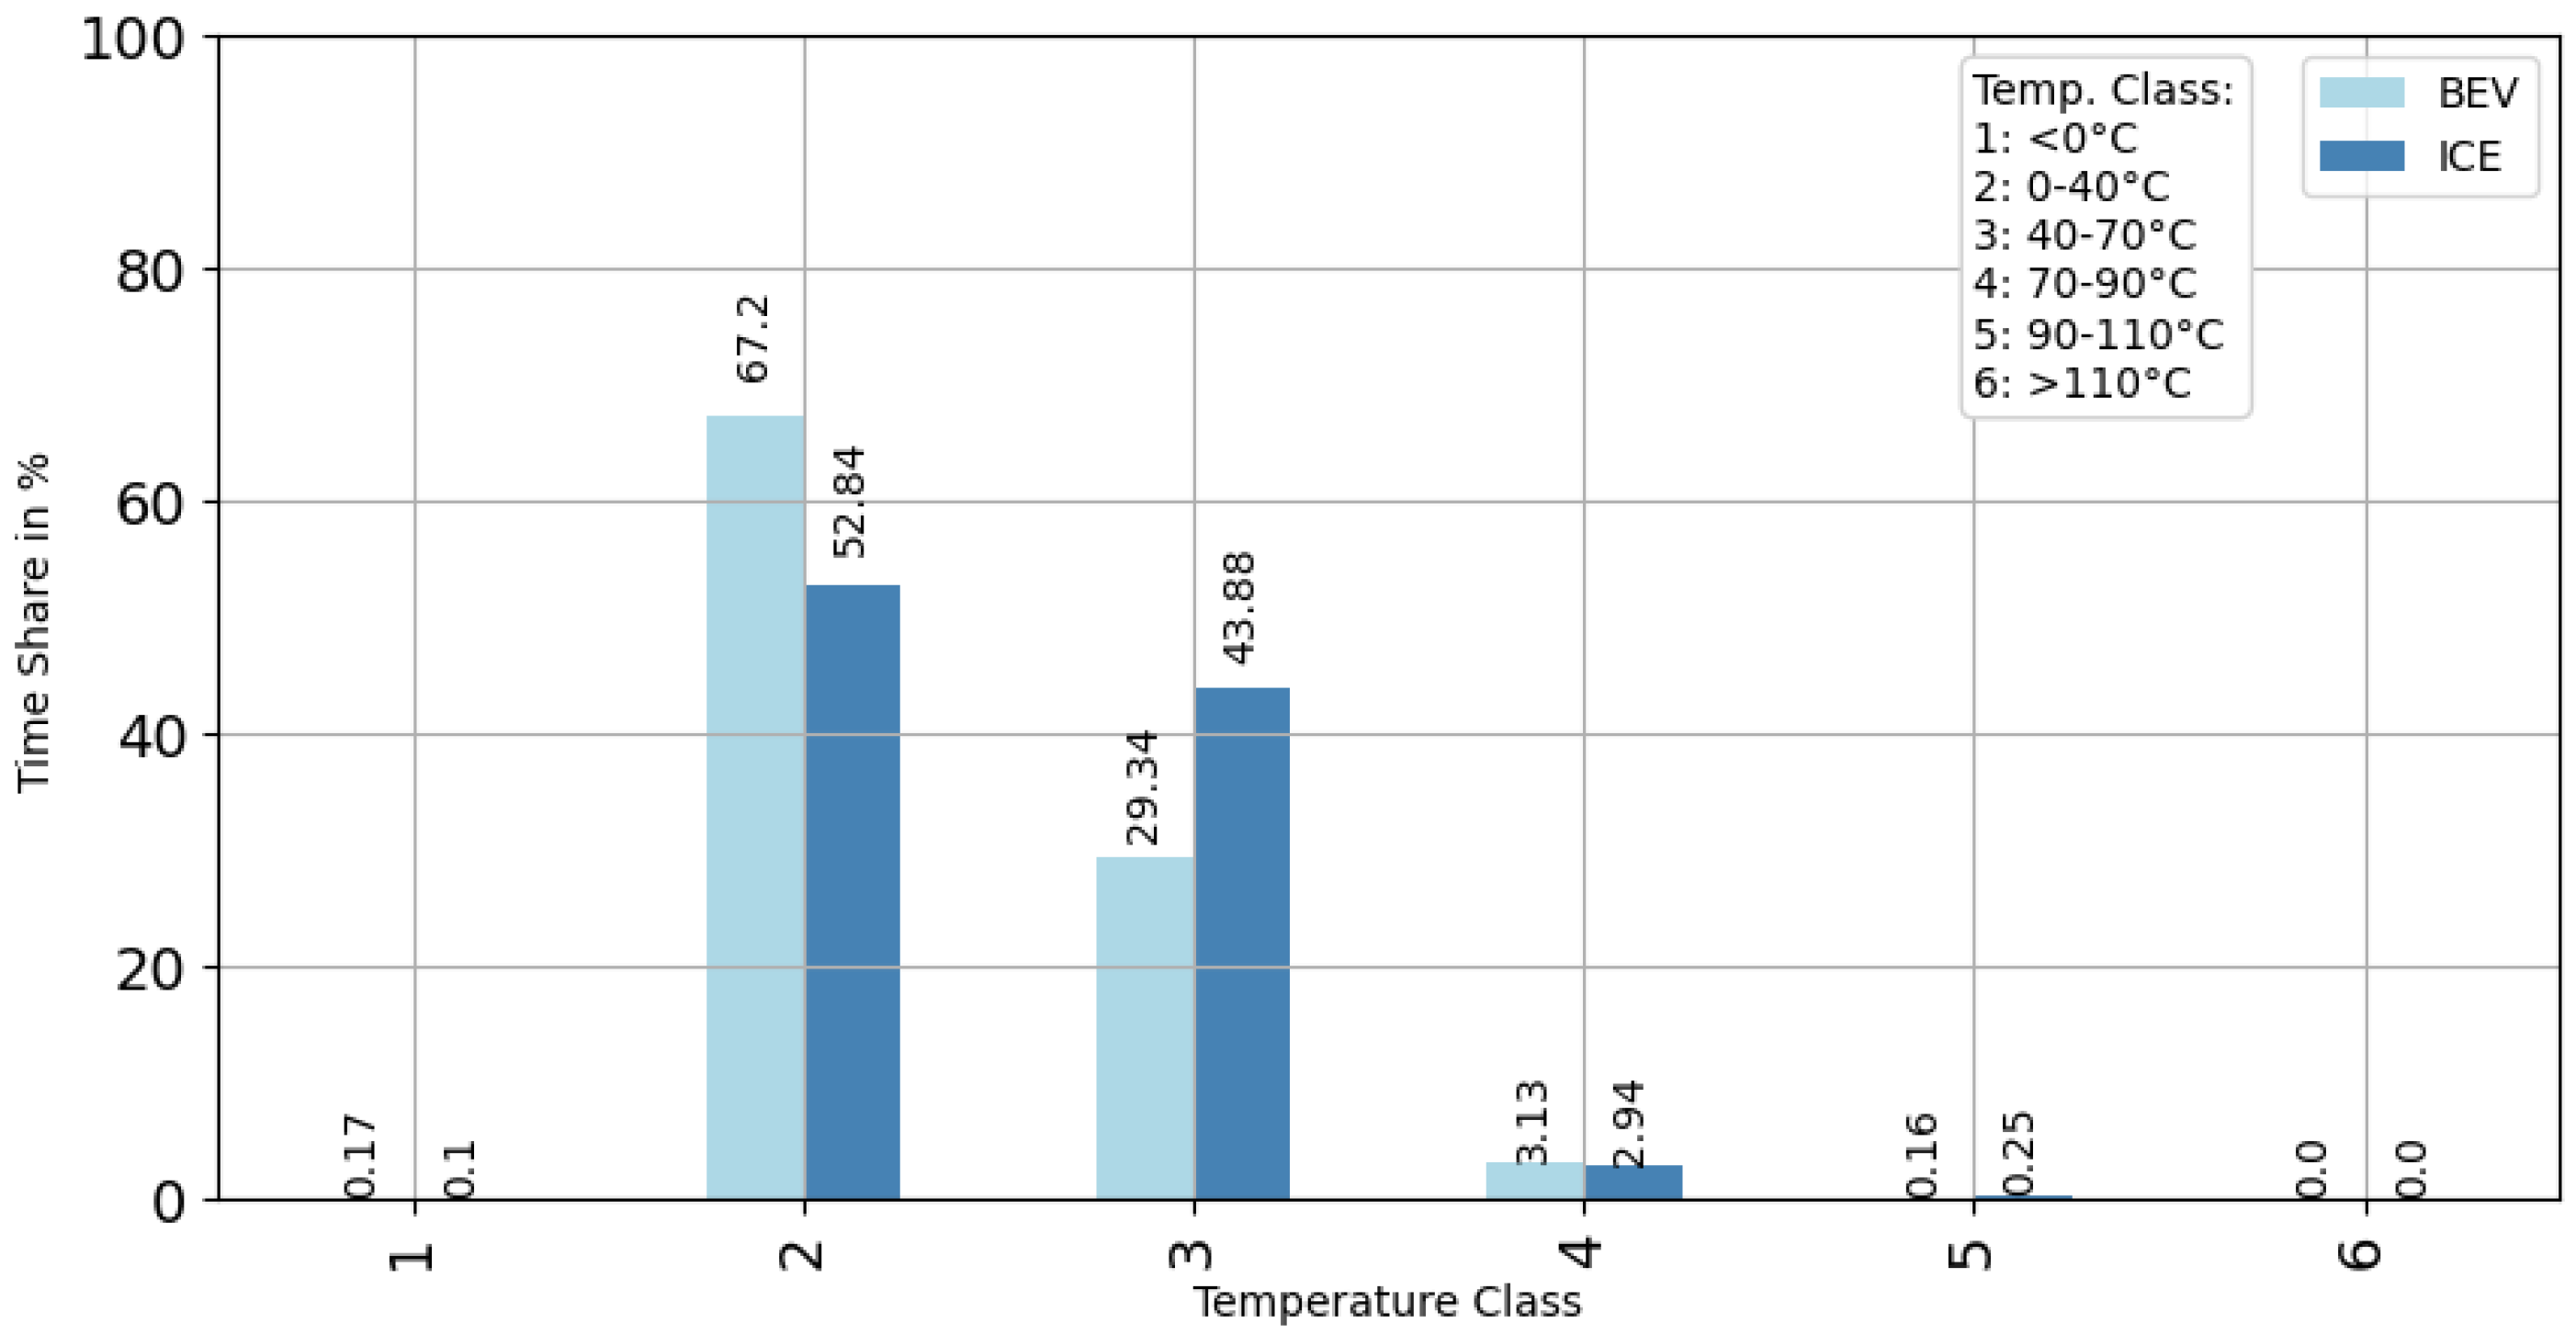
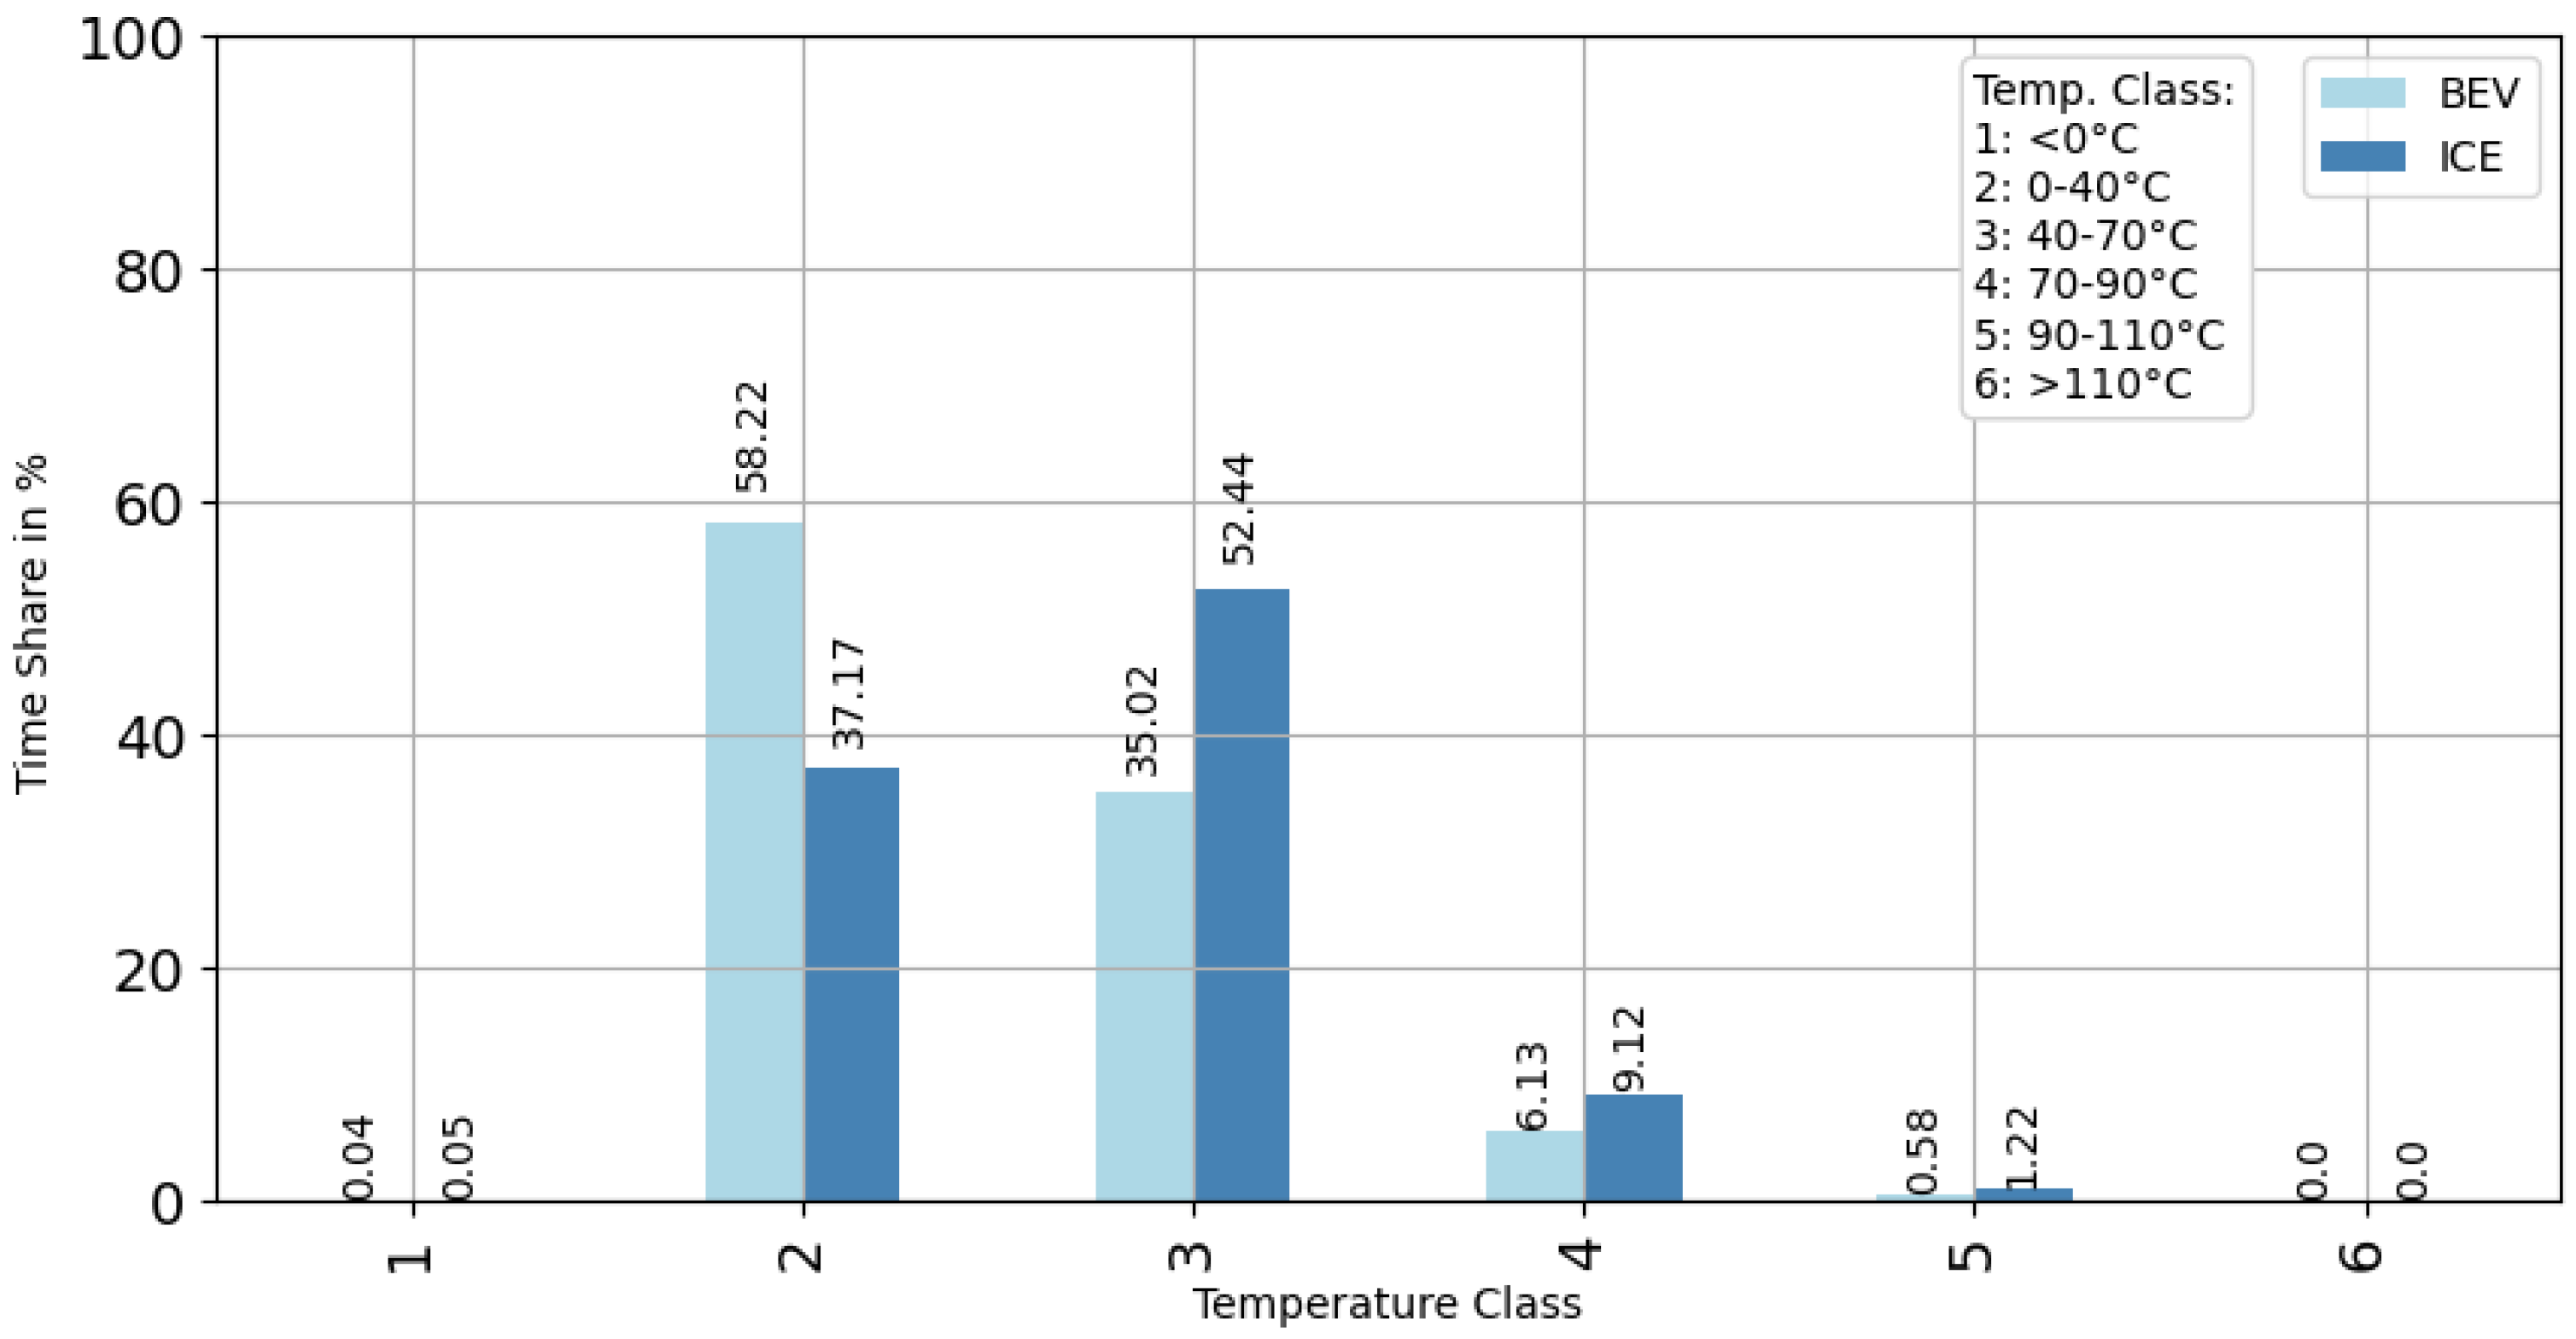
| Temperature Class (Headlight) | Temperature Range in °C |
|---|---|
| 1 | >0 |
| 2 | 0–40 |
| 3 | 40–70 |
| 4 | 70–90 |
| 5 | 90–110 |
| 6 | >110 |
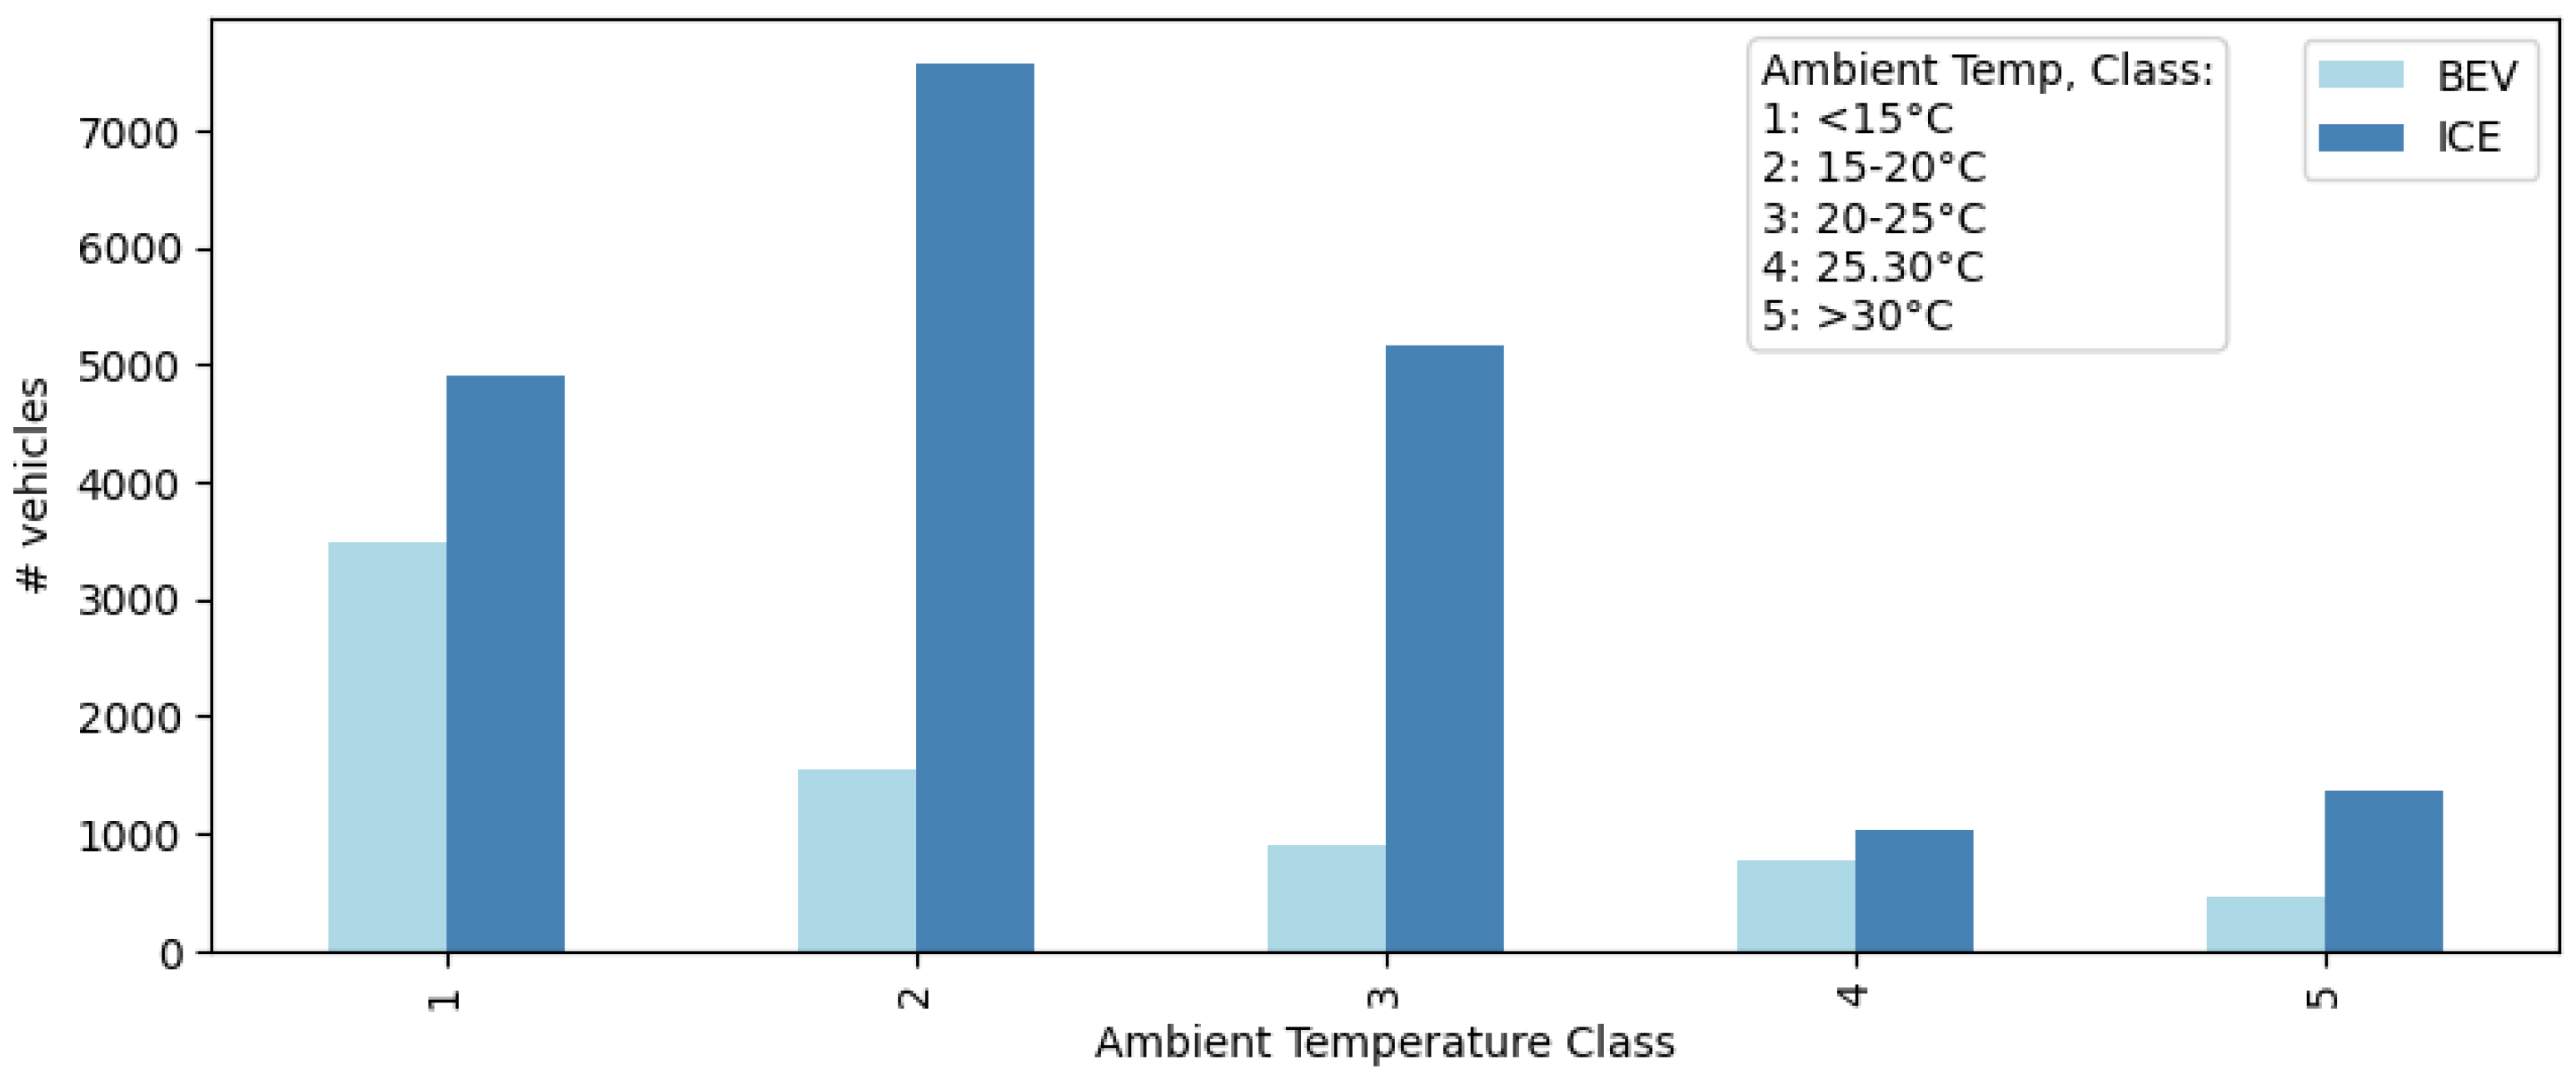
| Ambient Temperature Class | Temperature Range in °C |
|---|---|
| 1 | <15 |
| 2 | 15–20 |
| 3 | 20–25 |
| 4 | 25–30 |
| 5 | >30 |
| Source of Variation | Sum of Squares | Degrees of Freedom (df) | F-Value | p-Value |
|---|---|---|---|---|
| Engine type (C(Engine type)) | 5.293 × 10⁻²² | 1 | 4.575 × 10⁻²⁴ | 1 |
| Temperature class (C(TC)) | 7.323 × 10⁷ | 5 | 1.266 × 10⁵ | <0.001 |
| Ambient temperature class (C(Ambient_Temp_Klasse)) | 3.136 × 10⁻²² | 4 | 6.778 × 10⁻²⁵ | 1 |
| Interaction: Engine type * Temperature class | 2.321 × 10⁶ | 5 | 4.017 × 10³ | <0.001 |
| Interaction: Engine type * Ambient temperature class | 1.936 × 10⁻²² | 4 | 4.182 × 10⁻²⁵ | 1 |
| Interaction: Temperature class * Ambient temperature class | 3.269 × 10⁶ | 20 | 1.412 × 10³ | <0.001 |
| Three-way interaction: Engine type * Temperature class * Ambient temperature class | 2.881 × 10⁵ | 20 | 1.245 × 10² | <0.001 |
Disclaimer/Publisher’s Note: The statements, opinions and data contained in all publications are solely those of the individual author(s) and contributor(s) and not of MDPI and/or the editor(s). MDPI and/or the editor(s) disclaim responsibility for any injury to people or property resulting from any ideas, methods, instructions or products referred to in the content. |
© 2024 by the authors. Licensee MDPI, Basel, Switzerland. This article is an open access article distributed under the terms and conditions of the Creative Commons Attribution (CC BY) license (https://creativecommons.org/licenses/by/4.0/).
Share and Cite
Schlürscheid, T.; Khanh, T.Q.; Buck, A.; Weber, S. Temperature Behavior in Headlights: A Comparative Analysis between Battery Electric Vehicles and Internal Combustion Engine Vehicles. Appl. Sci. 2024, 14, 6654. https://doi.org/10.3390/app14156654
Schlürscheid T, Khanh TQ, Buck A, Weber S. Temperature Behavior in Headlights: A Comparative Analysis between Battery Electric Vehicles and Internal Combustion Engine Vehicles. Applied Sciences. 2024; 14(15):6654. https://doi.org/10.3390/app14156654
Chicago/Turabian StyleSchlürscheid, Tabea, Tran Quoc Khanh, Alexander Buck, and Stefan Weber. 2024. "Temperature Behavior in Headlights: A Comparative Analysis between Battery Electric Vehicles and Internal Combustion Engine Vehicles" Applied Sciences 14, no. 15: 6654. https://doi.org/10.3390/app14156654
APA StyleSchlürscheid, T., Khanh, T. Q., Buck, A., & Weber, S. (2024). Temperature Behavior in Headlights: A Comparative Analysis between Battery Electric Vehicles and Internal Combustion Engine Vehicles. Applied Sciences, 14(15), 6654. https://doi.org/10.3390/app14156654