Abstract
In the hot press process of high-performance bamboo-based fiber composites, there is a highly nonlinear relationship between the production parameters of hot press and the quality parameters of the finished boards. Consequently, it is challenging to accurately predict the quality of the boards based on the given production parameters, and it is equally difficult to preset the production parameters to achieve the desired board quality. The current approach relies on manual experience, which may result in subpar board quality and material waste. To address these issues, this paper proposes a bi-directional prediction model based on cHGWO-SCA-SVR, using the collaboration-based hybrid GWO-SCA optimizer to optimize the relevant parameters of the SVR, and then accurately predicting the production parameters and the quality of the finished boards in both directions. Finally the cHGWO-SCA-SVR prediction model achieves an average of 0.9591 for the forward prediction model and lower MAE and MSE values compared to other models; for the reverse prediction model, it attains an average of 0.9553 and lower MAE and MSE values compared to other models. The results demonstrate the superiority of the cHGWO-SCA-SVR prediction model in comparison with other existing models, proving its significance in guiding the production of high-performance bamboo-based fiber composites by hot compression.
1. Introduction
Bamboo is a versatile and sustainable plant with many advantages such as fast growth, high strength, high rigidity and resistance to wear and tear [1]. With the scarcity of forest resources, as well as people’s awareness of environmental protection, technologies that utilize bamboo as a substitute for wood, plastic, and cloth have become hot topics for scholars to investigate [2,3,4,5].
Recombinant bamboo, a new type of bamboo product, is created through a series of processing techniques similar to wood restructuring technology, using bamboo and its processing residues as raw materials [6]. High-performance bamboo-based fiber composite material is a new type of high-performance fiber composite material evolved in the process of recombinant bamboo manufacturing. The fibrous bamboo veneer is the basic manufacturing unit, the phenolic resin acts as the adhesive, and through the cold pressing and heat-curing process or hot pressing process, the new high-performance fiber composite material is manufactured. This new material offers many advantages like controllable specifications and performance, etc. Making it widely used in many fields such as furniture, construction and so on.
The hot pressing process of high-performance bamboo-based fiber composites refers to the molding process in which the glue-impregnated fibrous bamboo veneer is laid in the mold according to the requirements, and the fibrous veneer is pressed into a certain thickness, density and mechanical properties of the board under a certain pressure, temperature and time. In the hot compression molding process of bamboo-based fiber composites, the main process parameters include the density, moisture content (MC), separation degree (SD), glue spread of fibrous veneer (GS), the hot pressing process of pressure holding time (PHT) and ending temperature (ET). The quality of the finished board indexes include the thickness swelling rate upon water absorption (TSR), width swelling rate upon water absorption (WSR), modulus of rupture (MOR), horizontal shear strength (HSS), and modulus of elasticity (MOE). At present, in the hot compression molding process of high-performance bamboo-based fiber composites, each process parameter is determined only by artificial experience, and the mechanical parameters of the final boards have the characteristics of uncertainty, and sometimes, in order to ensure that the molded boards achieve the specified mechanical properties, it is necessary to increase the amount of fibrous veneer, which results in a waste of materials. In the hot compression molding process of high-performance bamboo-based fiber composites, the above problems will be solved if the molding quality of the plate can be predicted according to the production parameters or the production parameters can be set according to the molding quality of the plate to be achieved. However, there is a strong nonlinear relationship between the production parameters and the quality of the high-performance bamboo-based fiber composites hot pressing plate, which is difficult to be expressed directly by mathematical formulas, so the application of intelligent optimization algorithms is of great importance at this time.
The application of intelligent optimization algorithms in the field of regression prediction has been commonplace and has become a hot research topic among scholars. Huang et al. [7], used different meta-heuristic algorithms to optimize the support vector machine (GWO-SVR, FA-SVR, PSO-SVR) and constructed three prediction models for the compressive strength of rice husk ash concrete, and compared them; the results showed that the FA-SVR model has the best prediction effect, and can be used for the prediction of compressive strength of rice husk ash concrete. Li et al. [8], used five optimization algorithms (GS, GWO, PSO, GA, SSA) to optimize two types of support vector machines (e-SVR, v-SVR) to construct a prediction model for the average size of blasting mean fragments, and evaluated the comprehensive performance of each model. The comparison results showed that the prediction model of GWO-v-SVR had the highest accuracy. At the same time, scholars conducted sensitivity analysis on 19 influencing factors; the results of the sensitivity analysis showed that UCS (Uniaxial compressive strength) was the most important factor influencing the average size of blasting mean fragments in blasting operations. Li et al. [9], improved the Gray Wolf algorithm, optimized the formula of the parameter of the Sigmoid function according to the change characteristics of the Sigmoid function, proposed an iterative strategy for the position of the gray wolf considering the dynamic inertia weights, and an iterative strategy for the position of the wolf pack considering the hierarchical structure of the gray wolf packs, and verified the effectiveness of the improved Gray Wolf algorithm. The validation results show that the improved Gray Wolf algorithm converges faster, and the temperature prediction model of coal spontaneous combustion is established based on the optimization of the support vector machine (IGWO-SVR) by the improved Gray Wolf algorithm, which has better accuracy and stability compared with the standard SVR and PSO-SVR prediction models.
Currently, there is no research on the prediction model of the production parameters and board quality of the high-performance bamboo-based composite hot press molding process. In this study, we optimize the SVR based on the collaboration-based hybrid GWO-SCA optimizer, and build a bi-directional prediction model of hot press molding process parameters and board quality of bamboo-based composite materials (cHGWO-SCA-SVR), and compare it with other prediction models (GWO-SVR, PSO-SVR, SVR) to verify the superiority of cHGWO-SCA-SVR compared with other prediction models, validating the significance of the cHGWO-SCA-SVR prediction model in actual production.
2. Theoretical Foundations
2.1. Support Vector Regression
Support Vector Machine (SVM) is a machine learning algorithm based on statistical learning theory proposed by Vapnik’s research team [10], which is mainly applied to pattern recognition and solving highly nonlinear regression problems. Support Vector Regression (SVR) is a method for solving regression problems based on SVM by introducing an insensitive loss function .
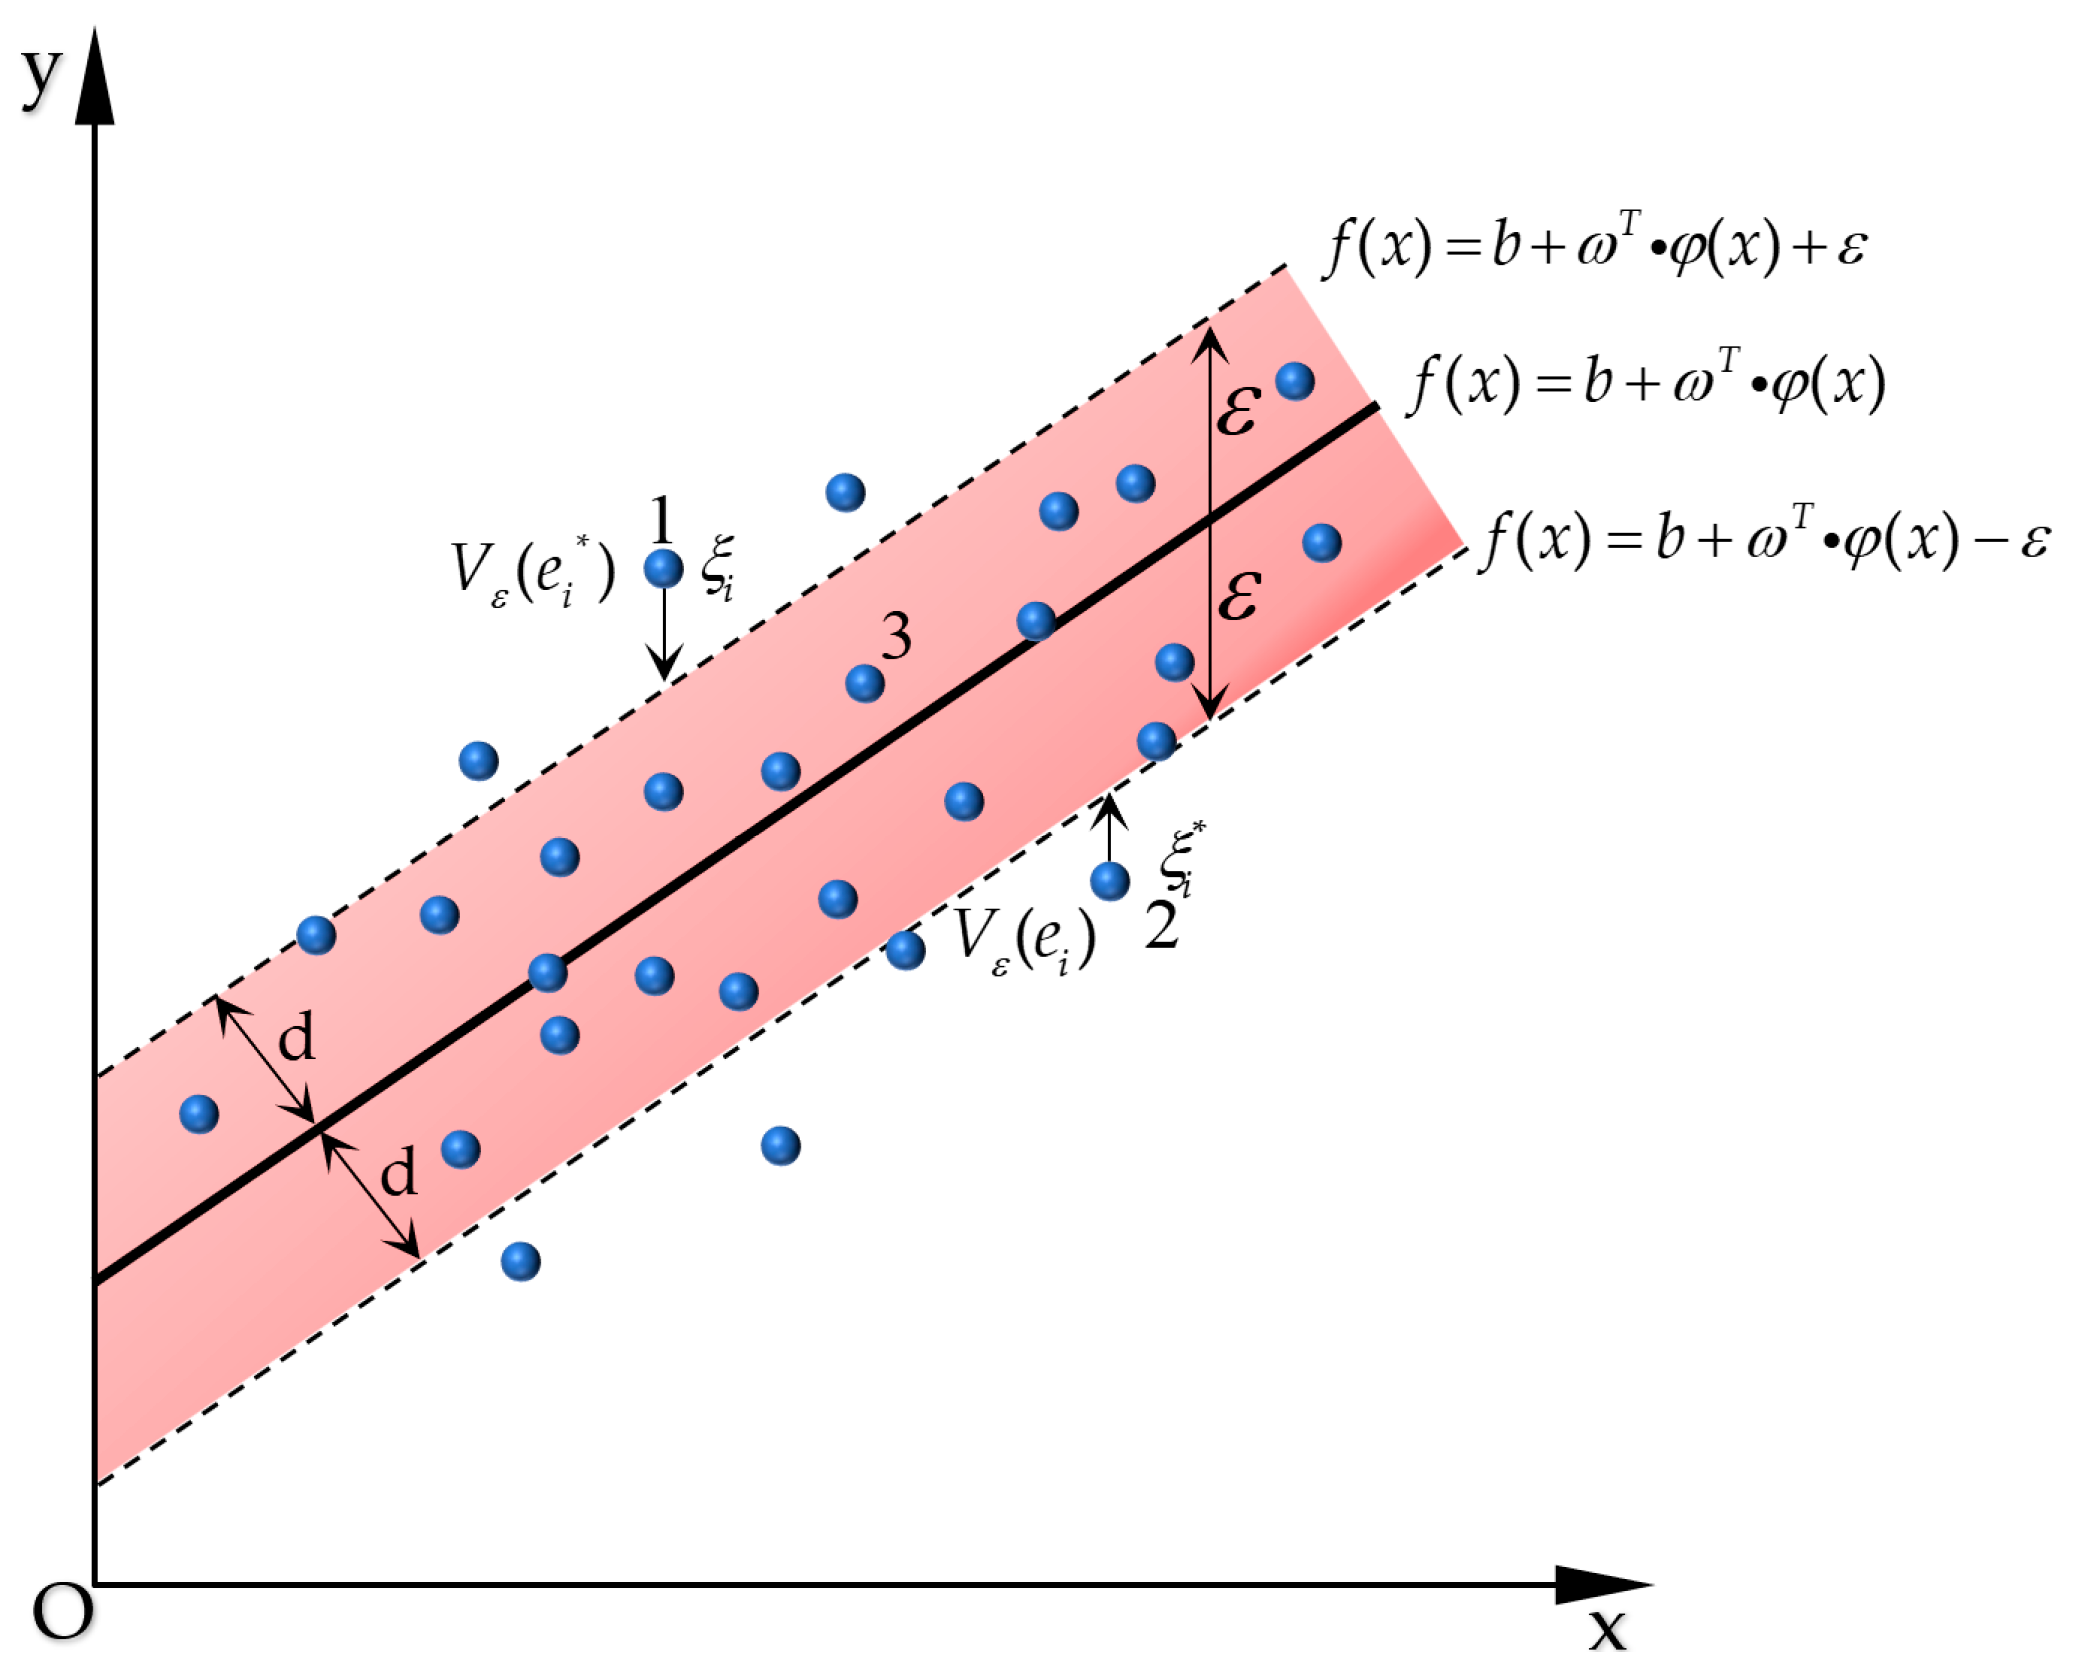
SVR maps low-dimensional data that is not amenable to regression into a high-dimensional space to obtain data that is amenable to regression and determines the hyperplane which minimizes the distance from the samples. The SVR method creates a “spacing band” where samples inside the spacing band are not counted as loss and samples outside are counted as loss and optimizes the model parameters by minimizing the “spacing band” and the total loss. The principle of SVR is shown in Figure 1.
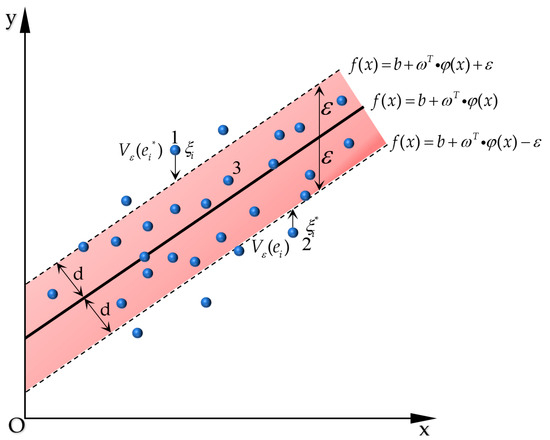
Figure 1.
Support vector regression schematic.
Given a data set , where is the input data, is the output data, and n is the number of samples. The feature vector obtained after going through the nonlinear mapping is . The regression function of the samples in the high dimensional space can be expressed as follows:
where is the value of the prediction function, is the weight, and is the bias value.
Introducing the slack variable , problem of Formula (1) can be transformed into the following:
where is the regular term, and c is the penalty factor.
Introducing the Lagrangian function to transform the problem into its dual form for ease of solution, and the solution to Formula (1) can be obtained as follows:
where is the kernel function, and is a Lagrange multiplier.
There are generally four types of kernel functions for SVR: linear kernel function, polynomial kernel function, gaussian kernel function and sigmoid kernel function. The Sigmoid kernel function, also known as the Radial Basis Function (RBF), has been chosen in this paper for its wide applicability and high prediction accuracy.
where σ is the band width of the Sigmoid kernel function, and g is a parameter that affects the predictive performance of SVR regression.
2.2. A Collaboration-Based Hybrid GWO-SCA Optimizer
2.2.1. GWO
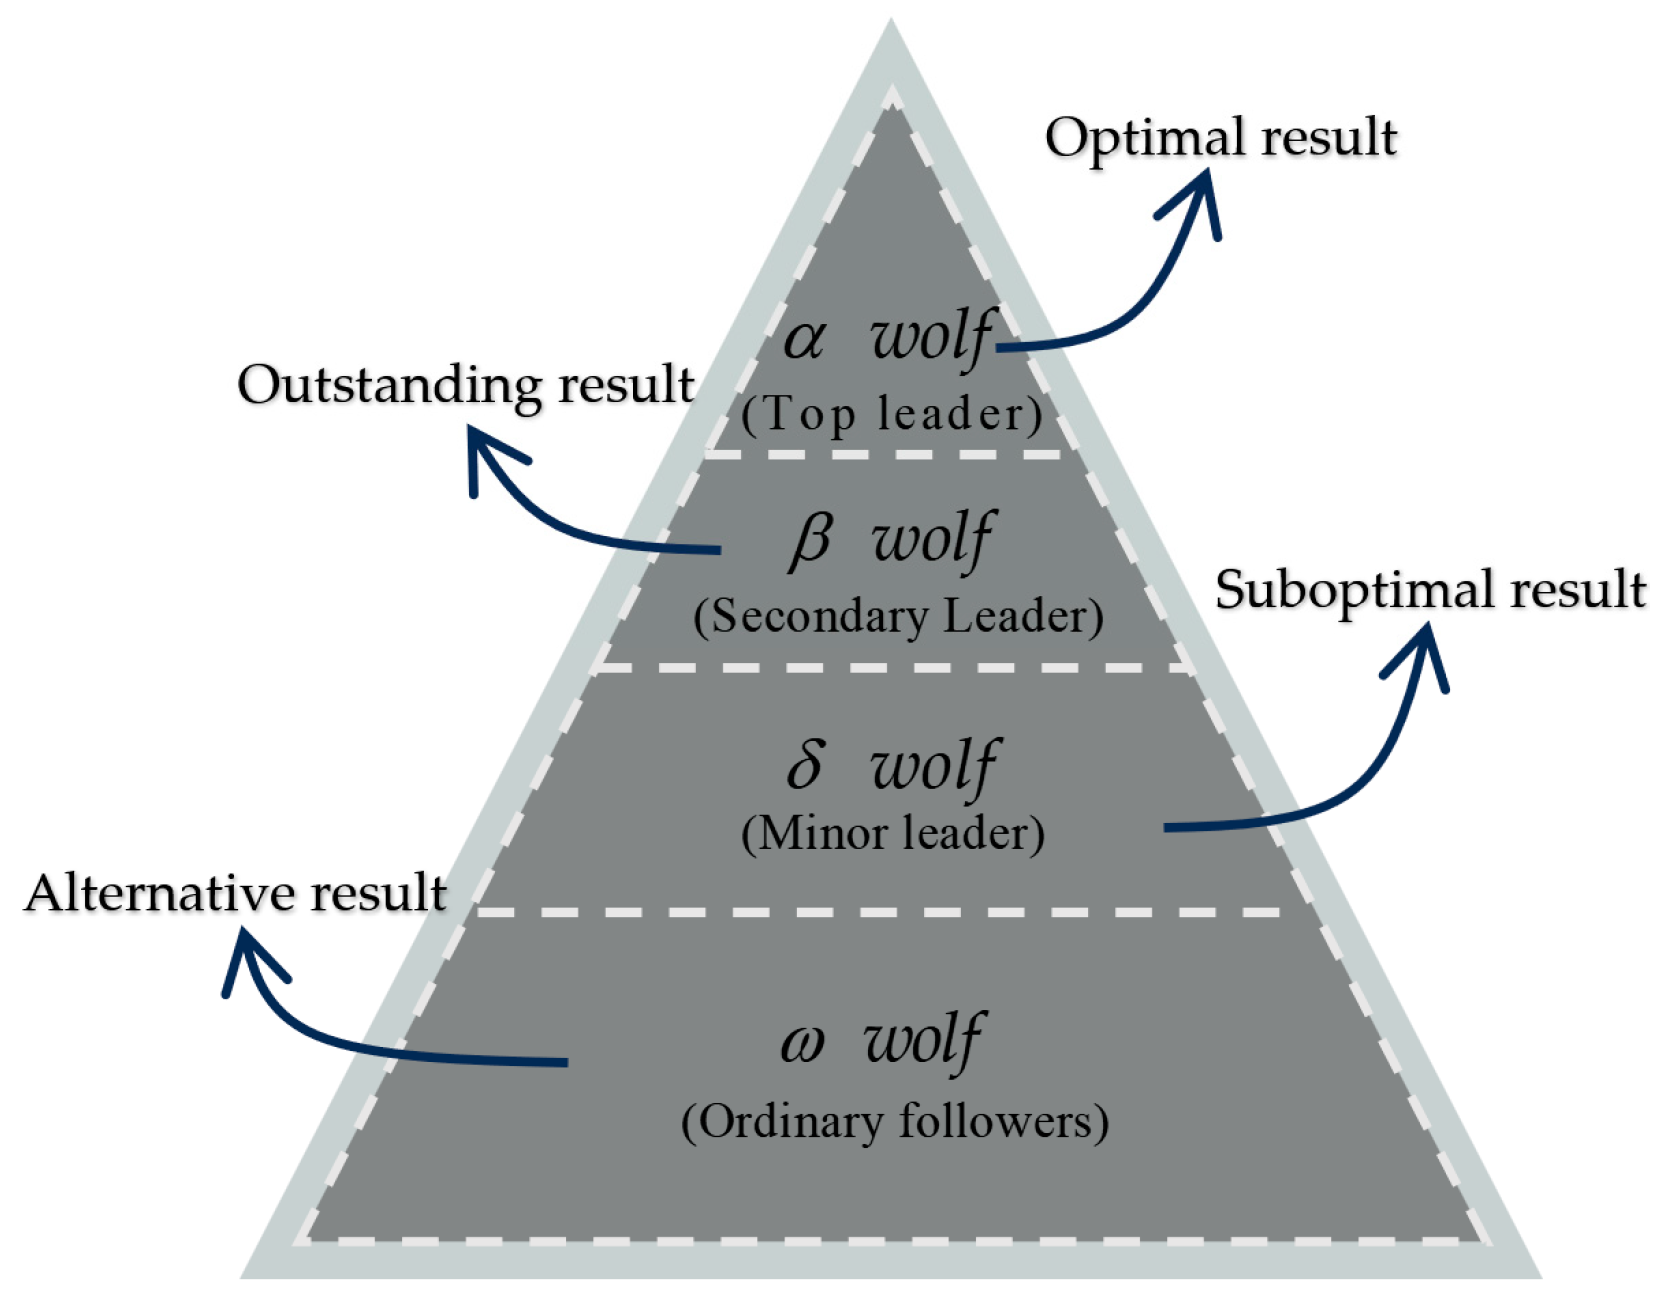
The grey wolf optimization algorithm was proposed by Mirjalil et al., scholars from Griffith University, in Australia [11]. It belongs to the population intelligence optimization algorithm. The algorithm is inspired by the prey hunting activities of gray wolves. The gray wolf population has a strict hierarchy, with the wolf as the leader of the pack, leading the pack’s hunting direction and the pack’s encirclement. The wolf serves as the second ranking wolf in the pack and has command over the pack after the alpha wolf. wolf is the lowest ranking wolf in the pack. The other wolves in the pack are collectively referred to as wolves, and wolves can only follow the commands of higher ranked wolves. The hierarchy of gray wolves is shown in Figure 2:
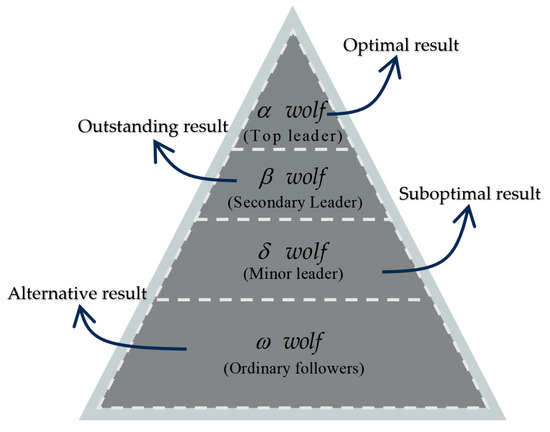
Figure 2.
Gray wolf population hierarchy.
Individual gray wolves will calculate the distance to their prey as they encircle it, constantly adjusting the position of each individual gray wolf closer to the prey. The distance formula is shown in the following equation:
where implicates the distance vector between the grey wolf and prey, is coefficient vector, and are the positions of the prey and the searching individual gray wolf after iteration times, respectively.
Grey wolves update their next position based on the distance from their prey:
where is the control parameter, is the maximum number of iterations, controls the search range of the grey wolf population and is a convergence factor, and is a random vector.
During the hunting process, the positions of wolf, wolf and wolf with high adaptability are used as the direction of action to guide the wolves to the position of the optimal solution, and the positions of the three gray wolves with the highest adaptability are constantly saved in the process of updating the positions every time, so that they can continue to guide the direction of the wolves and determine the orientation of the prey, and gradually approach the prey to guide the wolves to the location of the prey to complete the optimal solution of the optimization process. The process is shown in Figure 3.
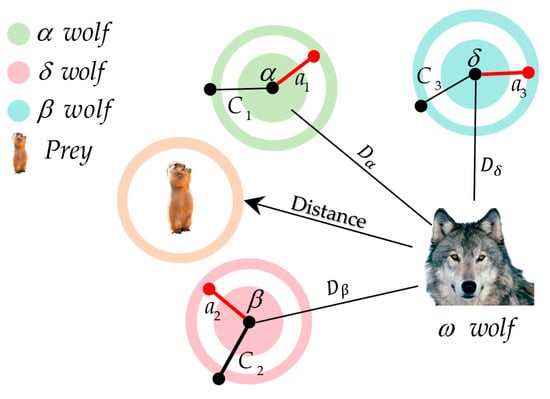
Figure 3.
Schematic diagram of wolf pack position update.
The process of updating the location of wolves is as follows:
where , , are the distances between , respectively, and the searching individual . are the next positions of the searching individual after being guided by , respectively. are the positions of the individual from the prey after t iterations, respectively. is the current position of the searching individual. are wolf’s control parameter, are wolf’s control parameter, and are wolf’s control parameter.
2.2.2. SCA
SCA is a meta-heuristic algorithm designed by Mirjalili [12] based on the mathematical properties of sine and cosine trigonometric functions, which develops a set of stochastic solutions during the search process, and has the advantage of being highly exploratory compared to other algorithms that have only a single solution, and is unique in that it uses sinusoidal and cosinusoidal wave control to explore and utilize the solution space. The process is as follows:
where is the location of the current optimal solution, is the position of the j-th solution on the i-th dimension in the t-th iteration, and are the random number in the iterative formula, , , .
where a is a constant, a = 2.
2.2.3. cHGWOSCA
When using the Grey Wolf Optimization Algorithm to solve problems, it overly relies on the Head Wolf. When wolf falls into a local optimal solution, it cannot provide effective guidance for wolf. In response to this problem, Yuanchen Duan and other scholars have developed the cHGWOSCA optimizer [13], which improves the linear search process by improving it in a sinusoidal form.
where is the number of iterations, and is the maximum number of iterations.
After optimizing the GWO algorithm based on SCA, wolf, wolf, and wolf, explore the solution space through sine and cosine fluctuations. Facilitate the exploration of GWO. Improvements are also made to the position update mechanism:
where is the personal best history of , and is a random number in the interval . In this mechanism, wolf, wolf, and wolf are federated with to find the global optimal solution space by means of a search in the SCA algorithm.
On this foundation, this algorithm also integrates methods such as a weight allocation strategy to enhance the search effect of wolf packs.
2.2.4. cHGWOSCA-SVR
For the SVR regression prediction model with radial basis kernel function, the penalty factor c and the kernel function parameter g are the main factors affecting the prediction accuracy [14], and in this paper, the cHGWOSCA optimizer is chosen for the first time to optimize the parameters of the SVR algorithm in order to improve the prediction accuracy of SV the R regression prediction model.
The main process of this prediction algorithm is as follows:
- (1)
- Input dataset, cleaning and normalization of dataset.
- (2)
- Set the parameters of the cHGWOSCA-SVR model. Including wolf pack population size, maximum number of iterations, kernel function and other parameters of SVR algorithm.
- (3)
- Initialize settings for the prediction model.
- (4)
- Using the cHGWOSCA algorithm to obtain the optimal fitness value for the gray wolf position.
- (5)
- Using regression prediction analysis to determine the optimal SVR parameter penalty factor and kernel function parameters, and perform regression prediction on the SVR model.
3. Experiment Design and Methodology
The density, moisture content (MC), separation degree (SD), glue spread of fibrous veneer (GS), the hot pressing process of pressure holding time (PHT), and ending temperature (ET) are the main influencing factors affecting the quality of hot pressing of high-performance bamboo-based fiber composites. To establish a bi-directional prediction model for the hot pressing production parameters and quality of high-performance bamboo-based fiber composites, a group of reliable experimental data on the production parameters and corresponding board-forming quality is necessary. According to the actual production demand, this paper selects the thickness swelling rate upon water absorption (TSR), width swelling rate upon water absorption (WSR), modulus of rupture (MOR), horizontal shear strength (HSS), and modulus of elasticity (MOE) as the quality evaluation indexes corresponding to the production parameters.
3.1. Orthogonal Experimental Design
Orthogonal experiment is an experimental method designed by Dr. Genichi Taguchi [15]. Orthogonal experimental design is the main method for partial factorial experiments and is mainly used for arranging multifactorial experiments. The points with “uniform” and “neat” characteristics are selected from the full-scale test for the test arrangement. Therefore, it is highly efficient and widely used.
Determination of the range of factor levels for the hot compression molding process of high-performance bamboo-based fiber composites:
- (1)
- Density. Density is an essential influence factor on bamboo-based fiber composites, and in this investigation, three density levels of 900 kg/m3, 1050 kg/m3, and 1200 kg/m3 were selected to investigate the effect of different density conditions on the heat transfer properties of hot pressing.
- (2)
- Moisture content. Three moisture content levels of 5%, 10% and 15% were selected for analysis, and the moisture content was adjusted using the water spray method and a drying oven.
- (3)
- Glue spread of fibrous veneer. The amount of adhesive sizing amount was set at 12%, 14%, and 16% based on actual processing experience.
- (4)
- Hot pressing temperature. The adhesive used in this study is phenolic resin, and its curing temperature is 140 °C. Therefore, the set temperature parameters are 135 °C, 140 °C and 145 °C.
- (5)
- Pressure holding time. According to the actual manufacturing experience, the pressure holding time is set to 8 min, 10 min, and 12 min.
- (6)
- Ending temperature. According to the practice of production experience, the temperature of the end time is set at 55 °C, 60 °C and 65 °C.
Based on the above-mentioned parameter selection, the orthogonal experimental table for this experiment is shown in Table 1:

Table 1.
Orthogonal test table for high performance bamboo-based fiber composites.
3.2. Experimental Implementation
3.2.1. Laboratory Materials
- (1)
- Fibrous bamboo veneer: sourced from Bamboo Fiber New Material Technology Co., Ltd. in Anhui, China, with dimensions of 2100 mm × 150 mm × 7.5 mm, air-dry density of about 510 kg/m3, and an average value of moisture content of 9.9%.
- (2)
- Phenolic resin adhesive: purchased from Taier Adhesive (Guangdong) Co., Ltd., China, with a solid content of 52.5%, viscosity of 188 cp and pH value of 10.22.
3.2.2. Equipment
- (1)
- The hot press used in this experiment is BL-6170, produced by Baolun Precision Testing Instrument Co., Ltd. in Dongguan, China.
- (2)
- The temperature monitor used is a TA612C multi-channel temperature monitor, manufactured by Suzhou Trans Electronic Co., Ltd. in China, with a measurement range of 25 °C to 250 °C, an accuracy of ±0.2 °C, and a recording interval of 5 s.
- (3)
- The hot air constant temperature drying oven is produced by Taist Instrument Co., Ltd. in Tianjin, China. The model is DHG-9055A desktop air drying oven, with a temperature control range of RT + 10~300 °C and a constant temperature fluctuation of ±1 °C.
- (4)
- Other equipment: a moisture meter, model VM-220D, and an electronic scale, model VMBS, both manufactured by WKT Instruments Co., Ltd. in Jiangsu, China.
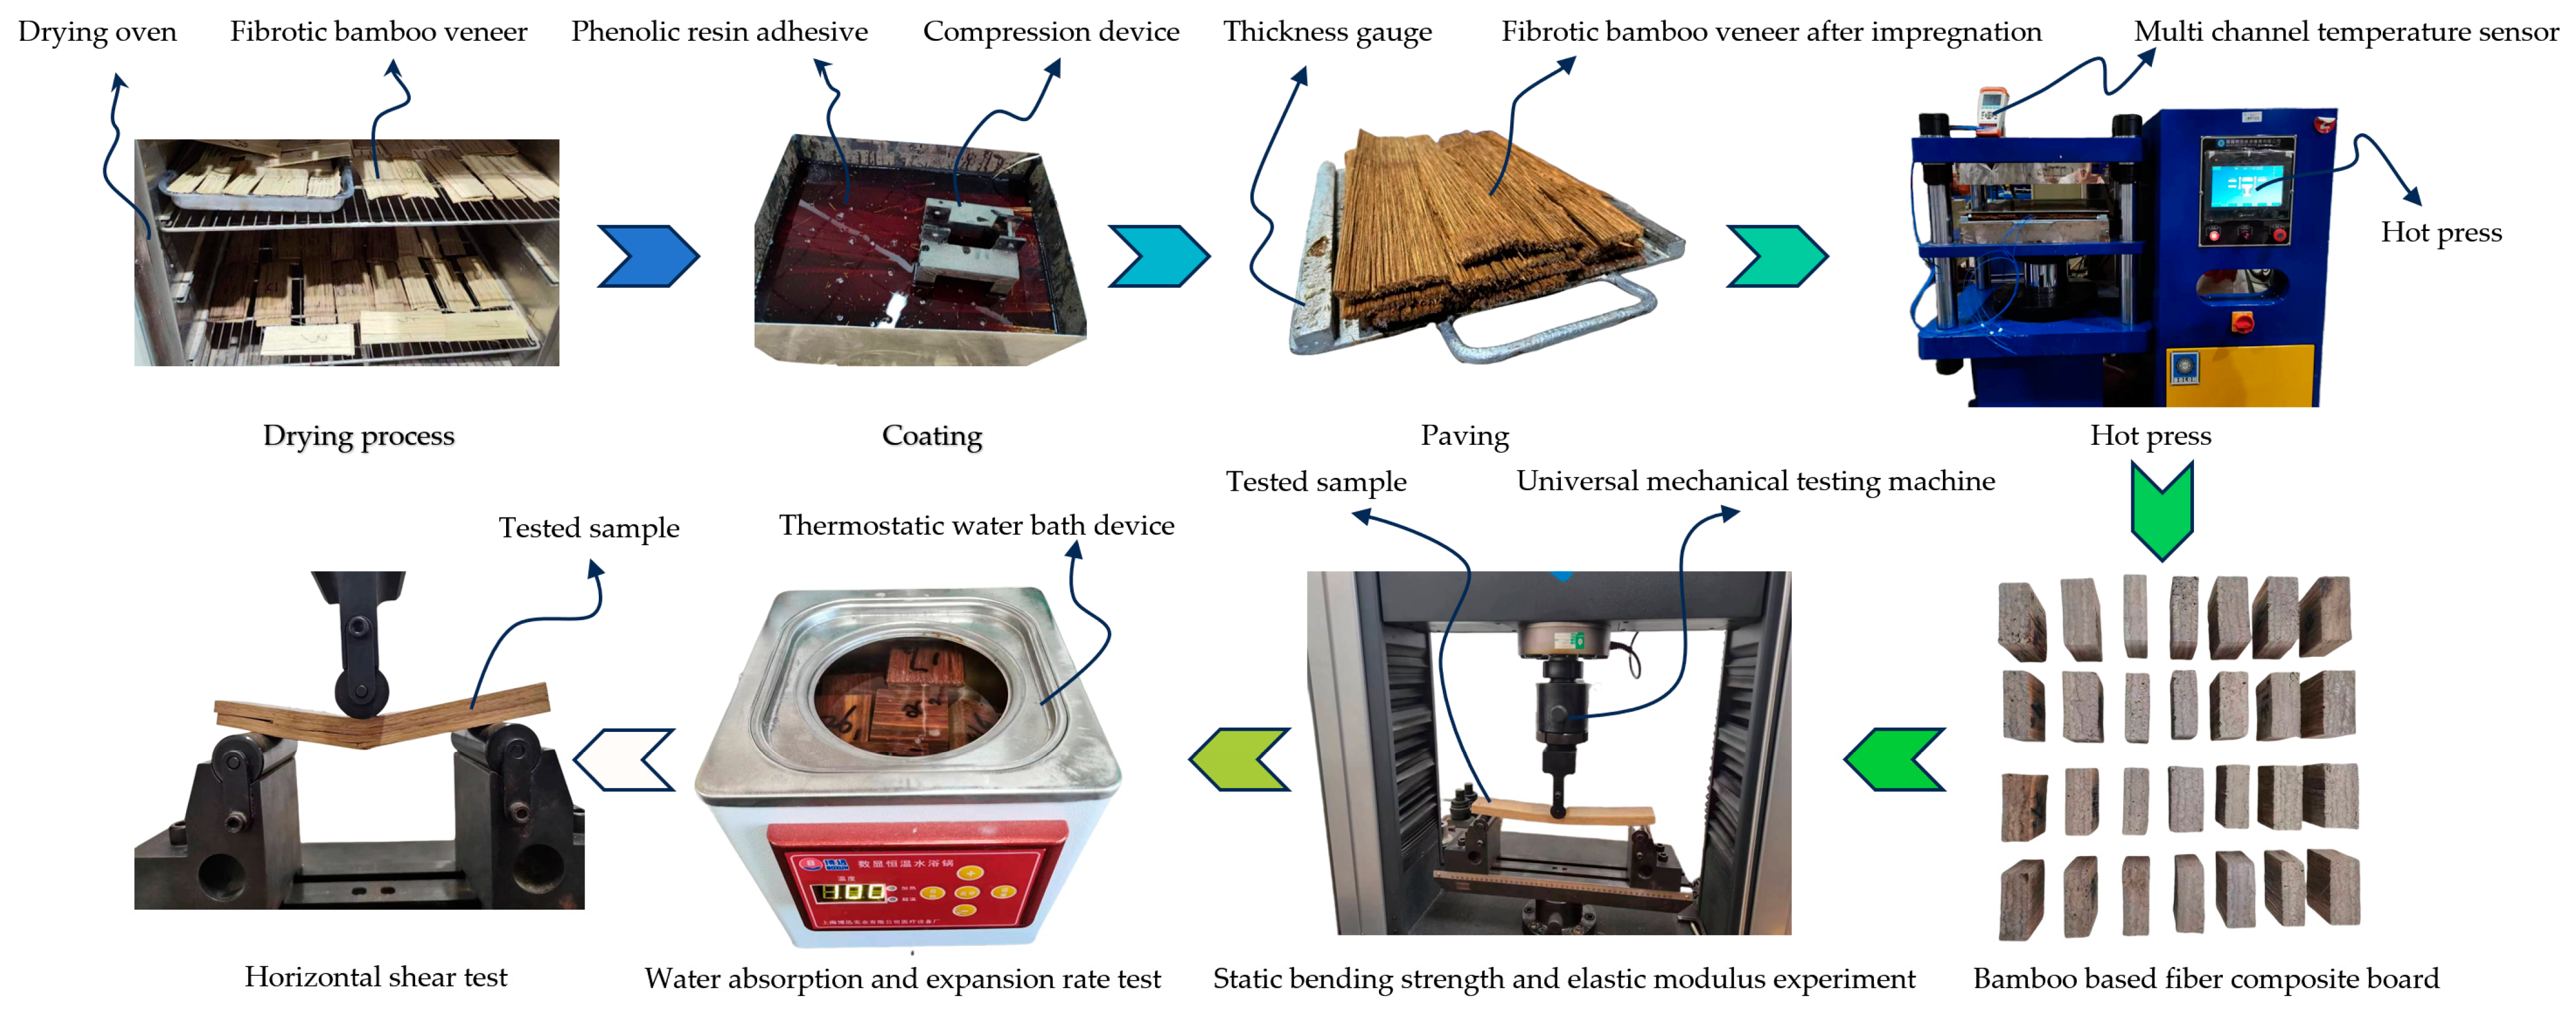
Firstly, the fibrous bamboo veneer will be put into the drying oven, so that it can reach the specified moisture content (usually 7%); after drying, the fibrous bamboo veneer needs to be impregnated with glue, and in the process of impregnation, we should guarantee that the glue completely submerges the fibrous bamboo veneer. to prevent the glue from uneven distribution in the fibrous bamboo veneer, and after the glue impregnation, the fibrous bamboo veneer needs to be naturally air dried for 3 days. The method of water spraying needs to be used to ensure the dried fibrous bamboo veneer meet the specified moisture content requirements. Qualified fibrous bamboo veneer boards in accordance with the same grain direction should be evenly spread in the mold. Let the molds into the hot press with the water cooling system at a certain hot pressing temperature, hot pressing pressure, hot pressing duration, ending temperature and other conditions to obtain the finished sheet. Finally, a series of performance tests are carried out on the finished boards to obtain the required experimental data. The experimental procedure is shown in Figure 4.
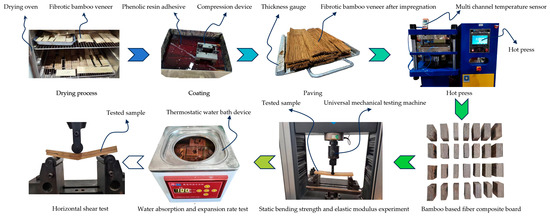
Figure 4.
Hot pressing and performance testing process of high-performance bamboo-based composite fiber materials.
3.3. Experiment Outcomes
According to the experimental steps in Figure 4, the high-performance bamboo-based fiber composites were processed using hot press molding in compliance with GB standards, and the experiments related to water absorption and mechanical properties were conducted on the plates obtained by hot pressing, and the results are shown in Table 2.
Table 2.
Experimental results of hot compression molding of high-performance bamboo-based fiber composites.
3.4. Solution of Bi-Directional Prediction Model
Based on the cHGWOSCA-SVR algorithm, a bi-directional prediction model for hot pressing production parameters and quality of high-performance bamboo-based fiber composites is divided into a forward prediction model and a reverse prediction model. Forward prediction refers to predicting the quality parameters of high-performance bamboo-based fiber composites by using the production parameters as input data. Reverse prediction refers to predicting the production parameters in the hot pressing process using the proposed sheet quality as input data.
3.4.1. Data Handling
Data Expansion. Due to the cost of hot pressing time of high-performance bamboo-based fiber composites, only 27 groups of experiments are set up when orthogonal tests are considered in this paper. Obviously, for machine learning algorithms, such a data amount is far from enough; therefore, the 27 groups of data obtained from the experiments are expanded to 300 groups by using the Gaussian distribution, and whether or not the prediction model obtained from the expanded data is feasible can be verified by the experiments in the future.
Normalization process [16]. When establishing the prediction model, in order to prevent the prediction results from large deviation due to the inconsistency of the order of magnitude of each parameter, this paper adopts the maximum-minimum value normalization method to normalize the data.
where is the normalized value, is the actual value, and are the maximum and minimum values of the input data respectively.
3.4.2. Model Evaluation Indicators
For the purpose of verifying the accuracy of the cHGWOSCA-SVR prediction model and its superiority over other metaheuristic algorithms, mean absolute error (MAE), mean square error (MSE), coefficient of determination (R2), and algorithm running time (t) were used as evaluation indicators for each model.
4. Result and Discussion
In order to verify the superiority of the prediction model of cHGWOSCA-SVR, the bi-directional prediction models built by other meta-heuristic algorithms will be compared simultaneously in the later paper, including: the GWO-SVR, the PSO-SVR, and the SVR.
4.1. Comparison of Forward Prediction Results
Using the production parameters as input data and the quality indicators of the finished board as output data, each prediction model was run 20 times, and the average value was taken. The evaluation indicators for the forward prediction of each model are shown in Table 3:
Table 3.
Comparison of forward prediction results among algorithms.
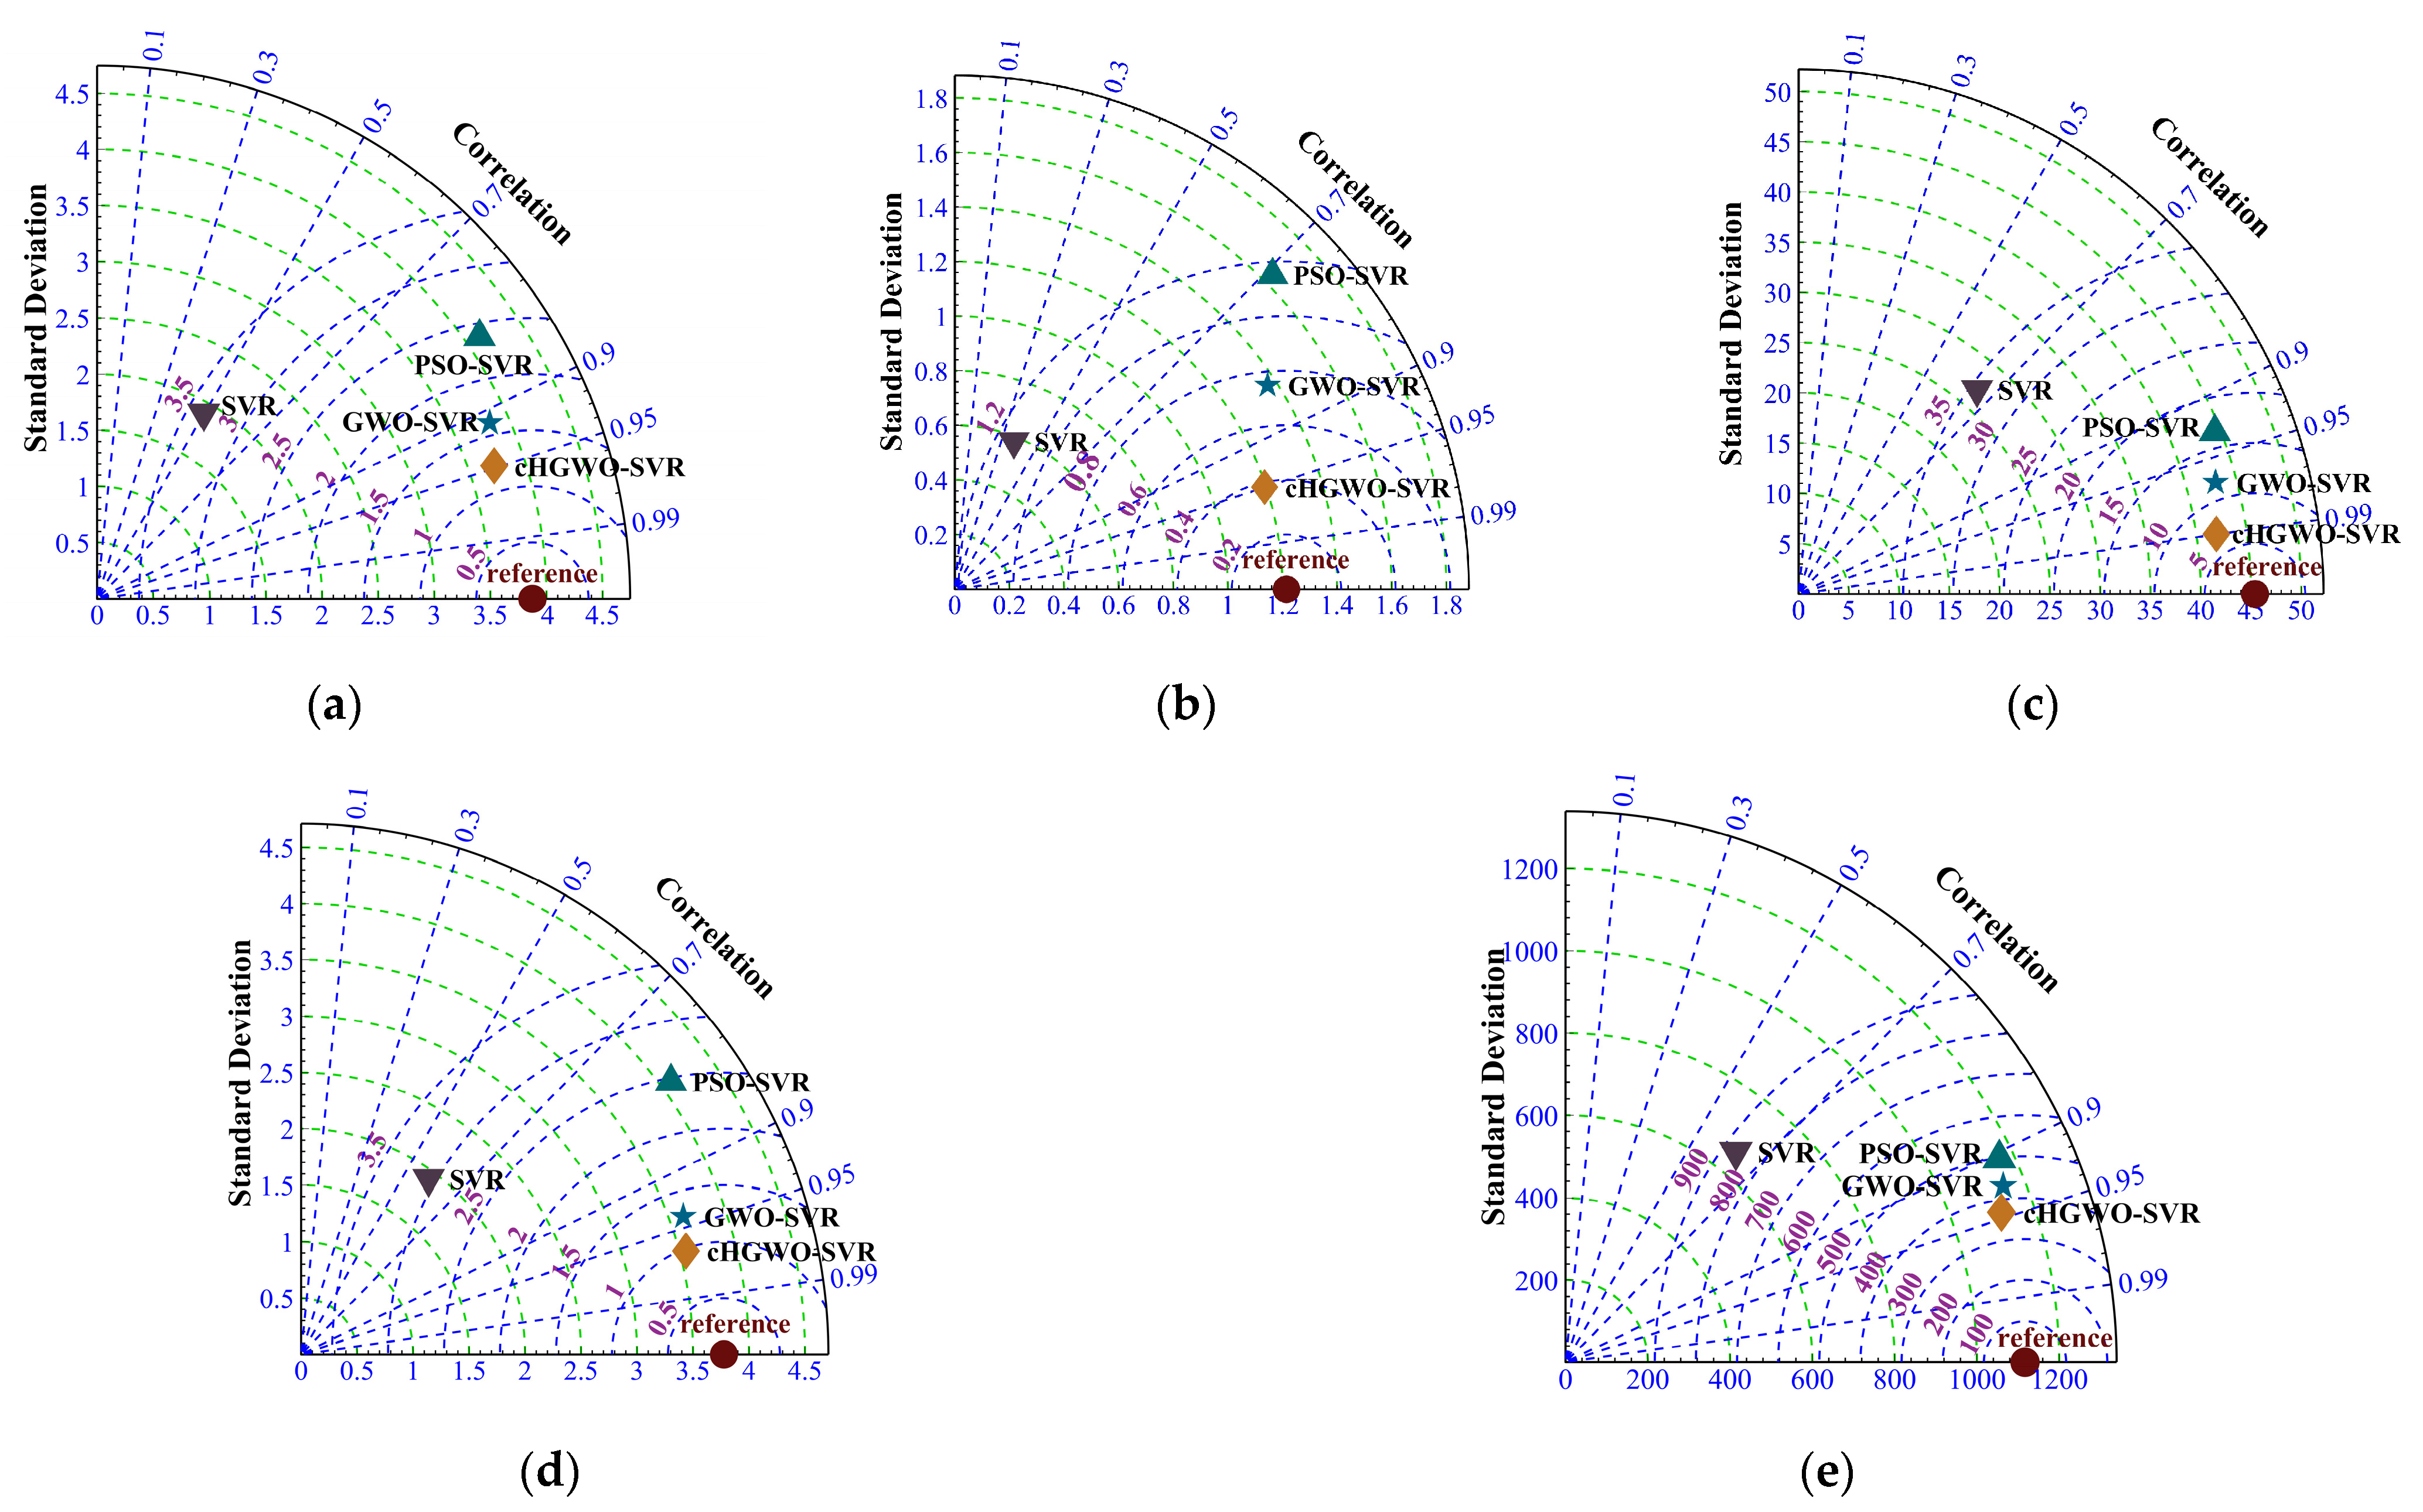
Taylor diagrams are commonly used to compare the predictive performance between different predictive models. The comparison of the forward prediction performance of each model is shown in Figure 5.
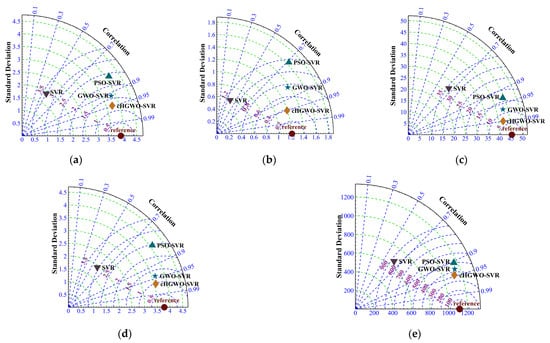
Figure 5.
Performance comparison of forward prediction algorithms; (a) thickness swelling rate upon water absorption, (b) width swelling rate upon water absorption, (c) modulus of rupture, (d) horizontal shear strength, and (e) modulus of elasticity.
From the evaluation indexes of the forward prediction model, it can be seen that the average value of the cHGWOSCA-SVR forward prediction model is 0.9591 which is closer to 1, the MAE and MSE values are lower compared to other models and the average running time of the algorithm is 85.929 s. Compared with other prediction models, the cHGWOSCA-SVR forward prediction model has higher prediction accuracy and minimizes the error value of the algorithm.
4.2. Comparison of Reverse Prediction Results
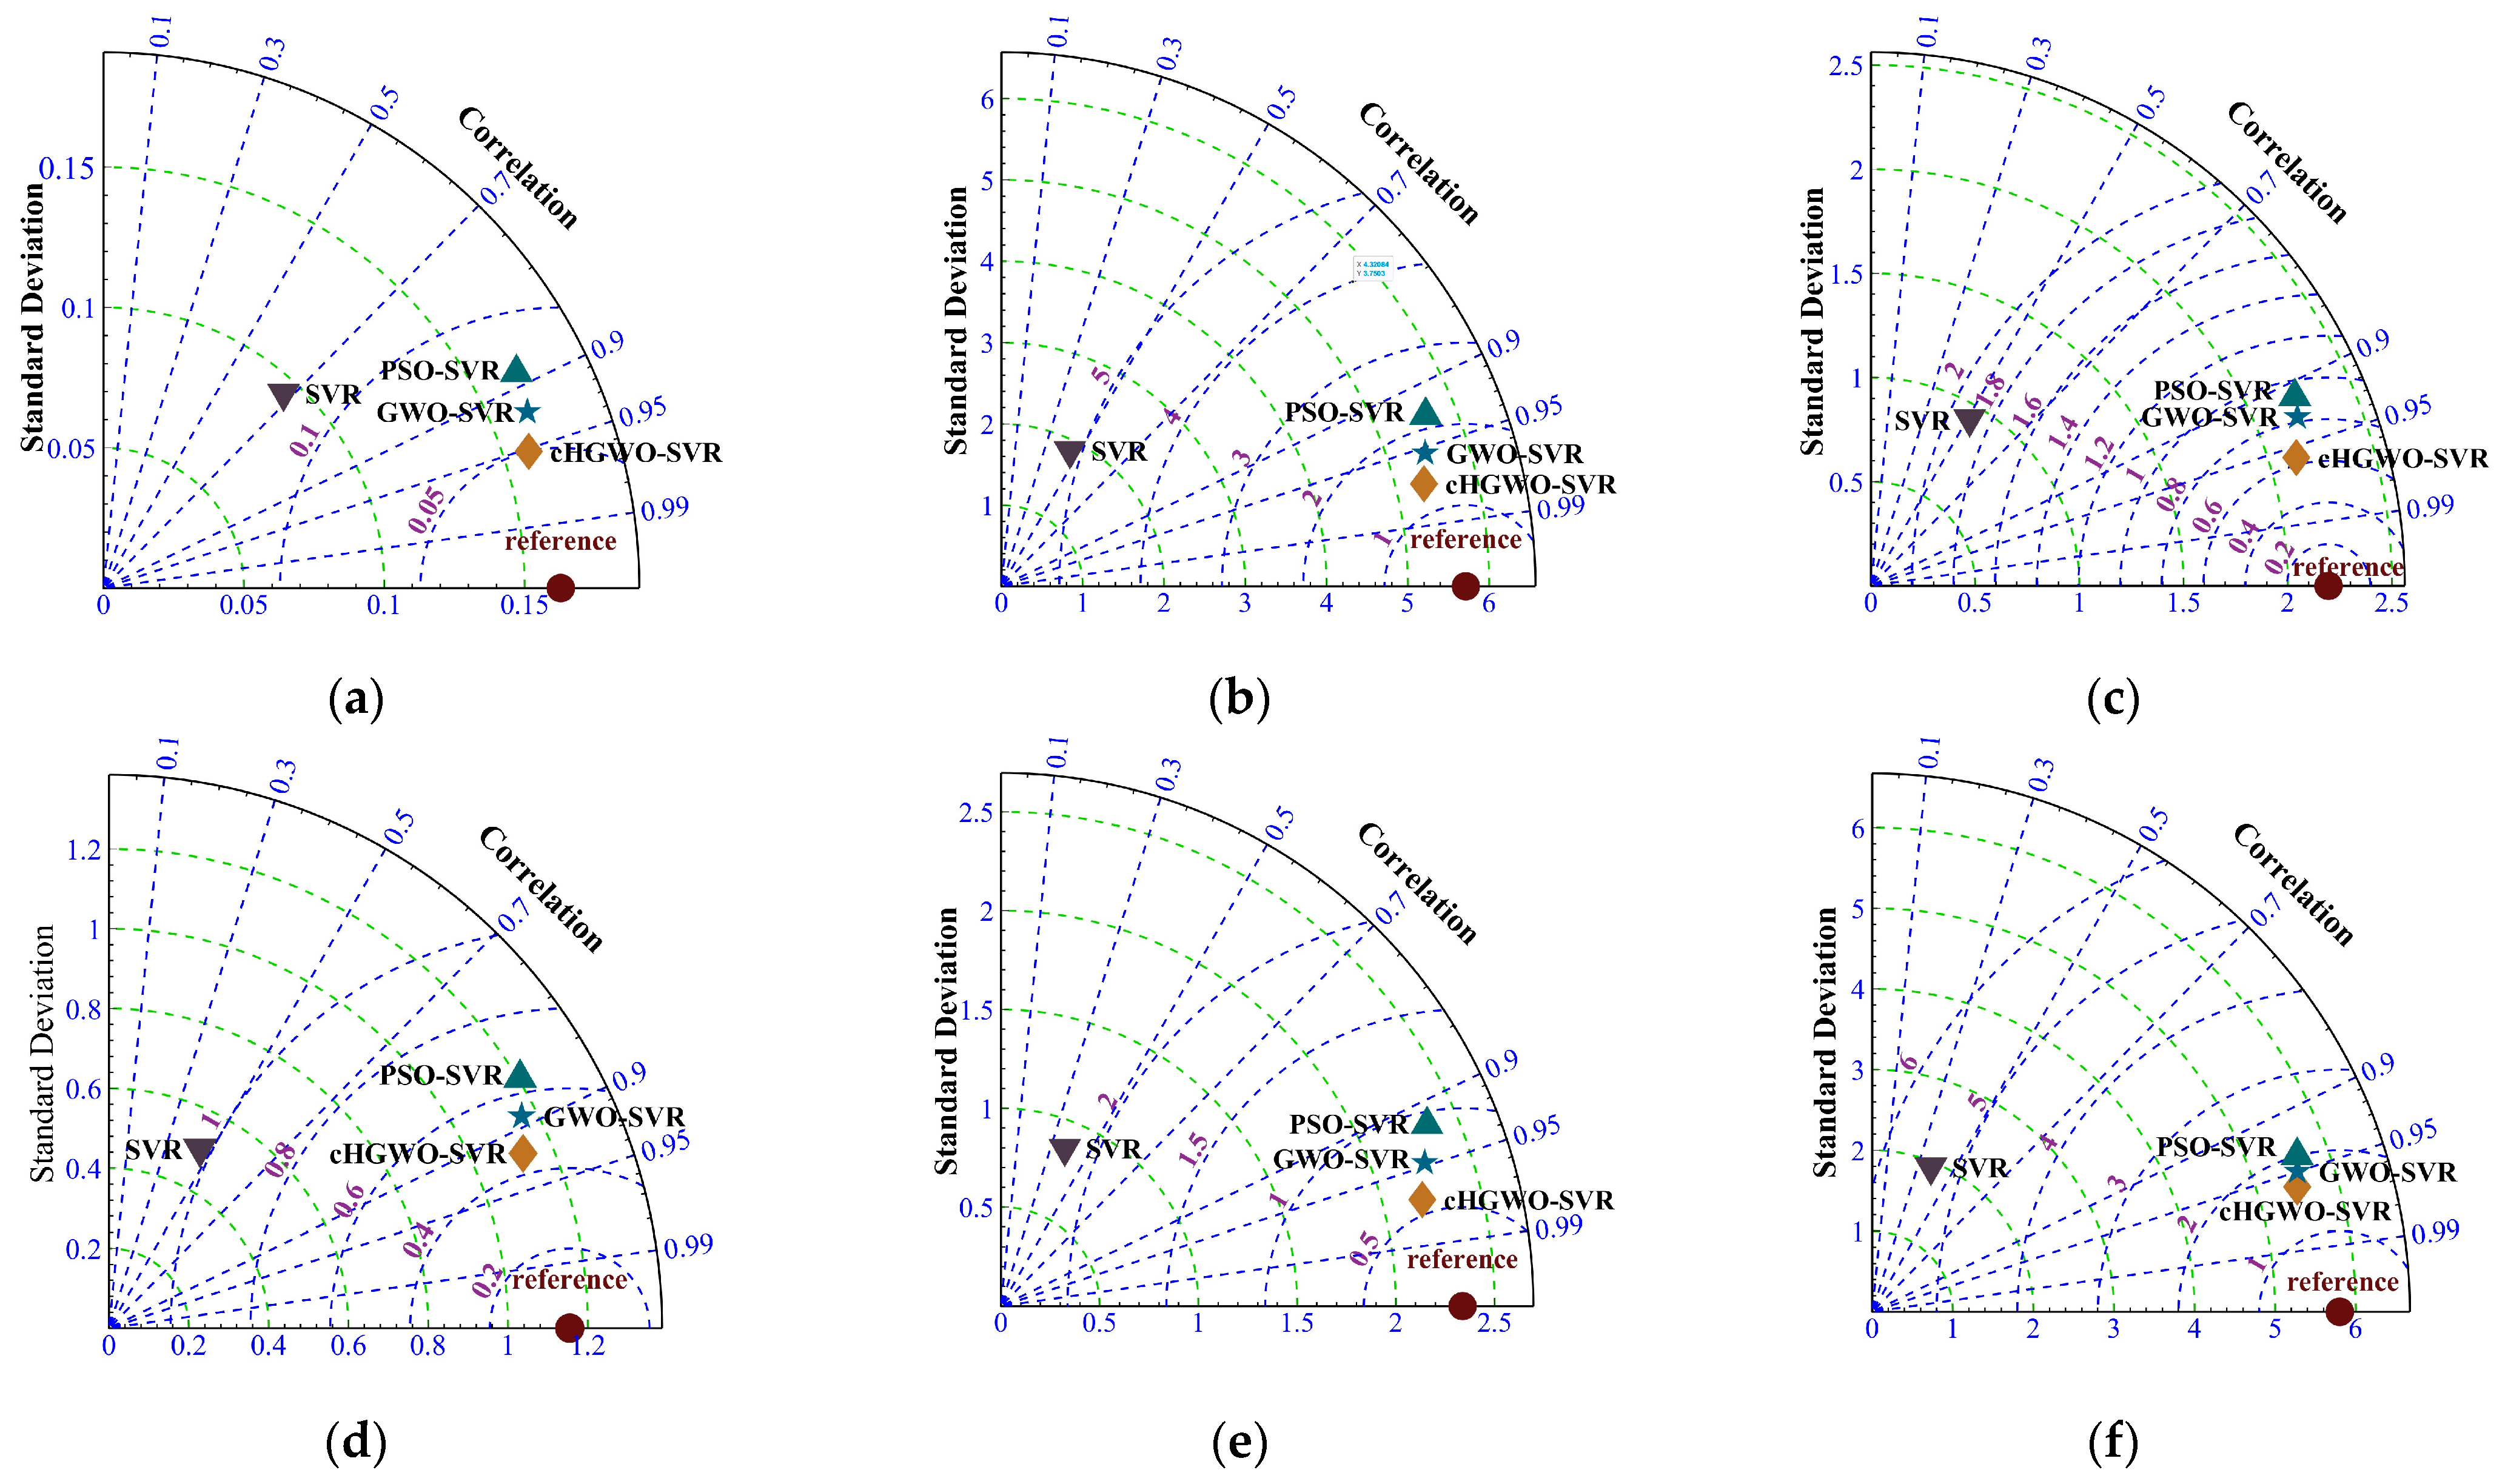
Using the quality indicators of the intended finished board as input data and the production parameters as output data, each prediction model was run 20 times, and the average value was taken. The evaluation indicators for the reverse prediction of each model are shown in Table 4 and the reverse prediction performance of each model is shown in Figure 6:
Table 4.
Comparison of reverse prediction results among algorithms.
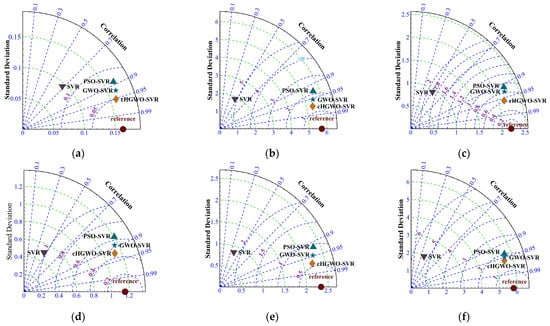
Figure 6.
Performance comparison of reverse prediction algorithms; (a) density, (b) moisture content, (c) separation degree, (d) glue spread of fibrous veneer, (e) the hot pressing process of pressure holding time, and (f) ending temperature.
From the evaluation indexes of the forward prediction model, it can be seen that the average value of the cHGWOSCA-SVR forward prediction model is 0.9553 which is closer to 1, the MAE and MSE values are lower compared to other models and the average running time of the algorithm is 85.929 s. Compared with other prediction models, the cHGWOSCA-SVR forward prediction model has higher prediction accuracy and minimizes the error value of the algorithm.
In summary, the cHGWOSCA-SVR bi-directional prediction model used in this study has good prediction ability in both the forward and reverse prediction and has higher accuracy and a lower prediction error than the traditional SVR prediction model. Meanwhile, we can also see that although the SVR algorithm has a strong nonlinear fitting ability, when facing highly nonlinear problems, especially when the number of samples is not large enough, the SVR model cannot achieve high prediction accuracy. Intelligent algorithms, especially combined intelligent algorithms, can be used to optimize the parameters of the traditional SVR regression prediction algorithms, which is obviously a more effective way. Gao et al. [17], have also used the improved SVR prediction algorithm (IPSO-SVR) to establish a bi-directional prediction model of production parameters and quality and energy consumption of fibers in the fiberboard production process, and have achieved a higher prediction accuracy relative to the traditional SVR prediction model.
5. Conclusions
In the hot press molding process of high-performance bamboo-based fiber composites, there is a highly nonlinear relationship between the selection of production parameters and the quality parameters of the final plate. In this research, a bidirectional prediction model based on the cHGWOSCA optimizer is proposed to establish the nonlinear relationship between the production parameters and the quality parameters of high-performance bamboo-based fiber composites hot pressing. The investigation shows that in both forward and reverse prediction, the cHGWOSCA-SVR prediction model has larger values of , smaller error values of , and more efficient algorithmic operation than the existing prediction models: GWO-SVR, PSO-SVR, and SVR, which fully proves the superiority of the cHGWOSCA-SVR prediction model and the prediction model having the significance of guiding the actual production in the field of hot pressing process for bamboo-based fiber composites.
Deficiencies and prospect: Limited by the experimental conditions, the experimental raw data used in this study are only 27 groups, although the data expansion is used for subsequent research to meet the demand of machine learning algorithms with the large amount of data, and the prediction results of the bi-directional prediction model also confirm the reasonableness of the data expansion. Nevertheless, more raw data will undoubtedly improve the prediction accuracy of the bi-directional prediction model. In addition, based on existing combination algorithm prediction models, seeking better, more efficient, and more accurate combination algorithm prediction models, and even developing new prediction algorithm models, will also be the follow-up research content of relevant scholars in the field of hot pressing processing of bamboo-based fiber composite materials.
Author Contributions
Conceptualization, Y.D. and J.Z.; formal analysis, Y.D. and C.Y.; investigation, Y.D., F.M., S.T. and Q.X.; methodology, J.Z. and W.Y.; project administration, W.Y.; resources, J.Z. and W.Y.; software, Y.D. and F.M.; supervision, J.Z.; validation, Q.X.; visualization, F.M. and S.T.; writing—original draft, Y.D. and F.M. All authors have read and agreed to the published version of the manuscript.
Funding
This research was funded by Major Special R&D Program of Guangdong Province (No. 2020B020216001).
Institutional Review Board Statement
Not applicable.
Informed Consent Statement
Not applicable.
Data Availability Statement
The original data are already included in the article. For further requirements, please contact the corresponding author.
Conflicts of Interest
The authors declare no conflicts of interest.
References
- Wang, X.; Su, N.; Chen, X.; Fei, B.; Ma, X.; Liu, H.; Miao, H.; Fang, C. Impact of temperature on mechanical properties and dimensional stability in a novel gradient pressure bamboo flattening technique. Constr. Build. Mater. 2024, 427, 136258. [Google Scholar] [CrossRef]
- Zhao, X.; Ye, H.; Chen, F.; Wang, G. Bamboo as a substitute for plastic: Research on the application performance and influencing mechanism of bamboo buttons. J. Clean. Prod. 2024, 446, 141297. [Google Scholar] [CrossRef]
- Chonsakorn, S.; Chombhuphan, R.; Rattanaporn, K.; Srivorradatphisan, S.; Ruangnarong, C.; Khojitmate, S. A novel non-woven fabric from bamboo fiber in medical lifestyle products. Heliyon 2024, 10, e29893. [Google Scholar] [CrossRef] [PubMed]
- Ghelmandi Netto, L.; Agostinho, F.; Almeida, C.M.V.B.; Liu, G.; Giannetti, B.F. Environmental performance of bamboo-based office paper production: A comparative study with eucalyptus. Ind. Crops Prod. 2024, 211, 118234. [Google Scholar] [CrossRef]
- Luan, Y.; Huang, B.; Chen, L.; Wang, X.; Ma, Y.; Yin, M.; Song, Y.; Liu, H.; Ma, X.; Zhang, X.; et al. High-performance, low-cost, chemical-free, and reusable bamboo drinking straw: An all-natural substitute for plastic straws. Ind. Crops Prod. 2023, 200, 116829. [Google Scholar] [CrossRef]
- Fu, Y.; Fang, H.; Dai, F. Study on the properties of the recombinant bamboo by finite element method. Compos. Part B Eng. 2017, 115, 151–159. [Google Scholar] [CrossRef]
- Huang, Y.; Lei, Y.; Luo, X.; Fu, C. Prediction of compressive strength of rice husk ash concrete: A comparison of different metaheuristic algorithms for optimizing support vector regression. Case Stud. Constr. Mater. 2023, 18, e02201. [Google Scholar] [CrossRef]
- Li, E.; Yang, F.; Ren, M.; Zhang, X.; Zhou, J.; Khandelwal, M. Prediction of blasting mean fragment size using support vector regression combined with five optimization algorithms. J. Rock Mech. Geotech. Eng. 2021, 13, 1380–1397. [Google Scholar] [CrossRef]
- Li, S.; Xu, K.; Xue, G.; Liu, J.; Xu, Z. Prediction of coal spontaneous combustion temperature based on improved grey wolf optimizer algorithm and support vector regression. Fuel 2022, 324, 124670. [Google Scholar] [CrossRef]
- Vapnik, V.; Chapelle, O. Bounds on Error Expectation for Support Vector Machines. Neural Comput. 2000, 12, 2013–2036. [Google Scholar] [CrossRef] [PubMed]
- Mirjalili, S.; Mirjalili, S.M.; Lewis, A. Grey Wolf Optimizer. Adv. Eng. Softw. 2014, 69, 46–61. [Google Scholar] [CrossRef]
- Mirjalili, S. SCA: A Sine Cosine Algorithm for solving optimization problems. Knowl.-Based Syst. 2016, 96, 120–133. [Google Scholar] [CrossRef]
- Duan, Y.; Yu, X. A collaboration-based hybrid GWO-SCA optimizer for engineering optimization problems. Expert Syst. Appl. 2023, 213, 119017. [Google Scholar] [CrossRef]
- García–Nieto, P.J.; García–Gonzalo, E.; Arbat, G.; Duran–Ros, M.; Pujol, T.; Puig–Bargués, J. Hybrid DE optimised kernel SVR–relied techniques to forecast the outlet turbidity and outlet dissolved oxygen in distinct filtration media and micro-irrigation filters. Biosyst. Eng. 2024, 243, 42–56. [Google Scholar] [CrossRef]
- Zengin, İ.; Erdoğan, B.; Benim, A.C. CFD and Taguchi based optimization of air driven single stage partial admission axial turbine blade profiles. Energy 2024, 290, 130333. [Google Scholar] [CrossRef]
- Liang, J.; Du, X.; Fang, H.; Li, B.; Wang, N.; Di, D.; Xue, B.; Zhai, K.; Wang, S. Intelligent prediction model of a polymer fracture grouting effect based on a genetic algorithm-optimized back propagation neural network. Tunn. Undergr. Space Technol. 2024, 148, 105781. [Google Scholar] [CrossRef]
- Gao, Y.B.; Hua, J.; Chen, G.W.; Cai, L.P.; Jia, N.; Zhu, L.K. Bi-directional Prediction of Wood Fiber Production Using the Combination of Improved Particle Swarm Optimization and Support Vector Machine. Bioresources 2019, 14, 7229–7246. [Google Scholar] [CrossRef]

Disclaimer/Publisher’s Note: The statements, opinions and data contained in all publications are solely those of the individual author(s) and contributor(s) and not of MDPI and/or the editor(s). MDPI and/or the editor(s) disclaim responsibility for any injury to people or property resulting from any ideas, methods, instructions or products referred to in the content. |
© 2024 by the authors. Licensee MDPI, Basel, Switzerland. This article is an open access article distributed under the terms and conditions of the Creative Commons Attribution (CC BY) license (https://creativecommons.org/licenses/by/4.0/).