Article

Stability of Paracetamol Amorphized by Co-Melting with Various Cellulose Derivatives

Department of Analytical Chemistry, Faculty of Pharmacy, Medical University of Gdansk, Gen. J. Hallera 107, 80-416 Gdansk, Poland
*
Authors to whom correspondence should be addressed.
Appl. Sci. 2024, 14(15), 6709; https://doi.org/10.3390/app14156709
Submission received: 28 June 2024 / Revised: 19 July 2024 / Accepted: 29 July 2024 / Published: 1 August 2024
(This article belongs to the Section Chemical and Molecular Sciences)

Abstract

:
Co-melting paracetamol with different cellulose derivatives leads to full or partial amorphization of active substance. The aim of this study was to determine whether the amorphization of paracetamol after co-melting with cellulose derivatives is stable and whether it depends on the type of cellulose derivative added and the ratio of components. Mixtures of paracetamol with cellulose derivatives containing different proportions of components were prepared. Using differential scanning calorimetry (DSC), the samples were melted and the amorphization of paracetamol was confirmed. After 2 and 4 months, the samples were reanalyzed to determine the amorphization stability during storage and the difference in the effect of different polymers on the amorphization stability. The physical mixtures were additionally tested using Fourier transform infrared (FTIR) and Raman spectroscopic methods to confirm that no solid-phase interactions were noticed. Samples were also analyzed using ultrahigh-performance liquid chromatography (UHPLC) to assess the effect of co-melting and storage on the chemical stability of paracetamol. The results show that paracetamol amorphizes after co-melting with cellulose derivatives. The crystallization of paracetamol after co-melting depends on the polymer used and the proportions of the components. No interactions between the components and the chemical stability of paracetamol in the tested samples were confirmed.

1. Introduction

The most physically and chemically stable polymorphic form of active pharmaceutical ingredient (API) is usually used to produce pharmaceutical products [1,2]. However, many APIs exhibit better bioavailability if we use a different (less common) polymorphic or amorphous form [3,4,5,6]. Bioavailability corresponds to the percentage of API that will be absorbed into the blood [7,8,9,10]. The most used parameter to assess bioavailability is the area under curve (AUC) of API concentration in plasma as a function of time. The maximum API concentration in plasma (Cmax) and the time after which this concentration is reached (Tmax) are also often used as pharmacokinetic parameters.
Bioavailability enhancement is associated with an obvious benefit for patients, as the therapeutic effect can thus be obtained with lower doses of API, leading to a reduction in side effects of pharmacotherapy [11,12]. The benefit also extends to the pharmaceutical industry, as the ability to reduce the effective dose of a drug reduces the cost of manufacturing a pharmaceutical product, where the API is usually the most expensive ingredient. Reducing the dose is also advantageous for the environment. The result is a reduction in the total amount of API and its metabolites excreted by patients. Pollution of municipal waste with API residues and metabolites is now a significant problem. The search for opportunities to reduce these pollutants is therefore very important for the environment.
For many APIs, in addition to the crystalline form, an amorphous form is also known [13,14]. Usually obtaining this form is not difficult. The main problem in this context is keeping the API in amorphous form and stopping crystallization. In pharmaceutical products, shelf life should be planned in this context, usually for 5–6 years. The usefulness of the amorphous form of API in the final pharmaceutical product depends on the possibility of stopping crystallization.
The manufacturing of a pharmaceutical product besides one or more APIs requires the addition of excipients [15,16]. These agents do not induce an effect on the organism, but only allow the creation of the necessary form, physically and microbiologically stable, providing appropriate technological properties and comfortable dosing. To achieve this, in solid formulations, substances of natural origin (e.g., lactose and mannitol, starch) are used, but also modified natural products, especially various starch derivatives (e.g., modified starch, hydroxyethyl starch) and cellulose derivatives (e.g., microcrystalline cellulose, ethyl cellulose, methyl cellulose, hydroxypropyl cellulose, ethyl cellulose, hydroxypropyl methyl cellulose).
The literature provides information on the possibility of API amorphization under the influence of substances used as excipients [17,18]. Sometimes the reduction in crystallinity was already possible after the formation of the physical mixture. Often, achieving full amorphization requires the co-melting of the components into a solid dispersion. Especially well-known in this application is the use of hydroxypropyl methyl cellulose (hypromellose, HPMC) [16].
Paracetamol (acetaminophen, N-acetyl-p-aminophenol) is a phenacetin derivative [19]. It is one of the most widely used substances with analgesic and antipyretic effects. Three polymorphic forms of paracetamol are known, plus an amorphous form. For the manufacture of pharmaceutical products, the most stable form I is used. This form melts at approximately 170 °C and exists like monoclinic crystals [20,21,22]. Also relatively stable during storage is form II (orthorhombic), which melts at 157 °C. This form crystallizes into form I during storage. Form III (metastable) melts at approximately 143 °C and converts to form II during storage or heating [21,22]. Our previous research and those of other researchers indicate that paracetamol can be reduced in crystallinity when homogenized with polymeric excipients, like cellulose derivatives (especially hypromellose) [23,24]. Currently, many types of HPMC are used, which differ in the degree of substitution with hydroxypropyl and hydroxymethyl groups and the average chain length in the molecule. Most often they have the function of fillers in the solid forms of the drug. Complete amorphization of paracetamol can be achieved by co-melting paracetamol with HPMC. Amorphization is possible even when the polymer addition is less than 30% of the mixture.
Previous studies have proven that there is no statistically significant difference in the effect of HPMCs of different chain lengths on the amorphization of paracetamol [24]. Thus, a study was undertaken to determine whether the amorphization of paracetamol under the influence of different cellulose derivatives: HPMC with different average molecular weights and methyl cellulose would be stable. Moreover, the purpose of this study is to determine whether co-melting paracetamol with various cellulose derivatives in different proportions of components will result in full amorphization of paracetamol. Additionally, it was checked whether recrystallization of the active ingredient would occur when the samples were stored at room temperature. We also decided to determine whether the stability of the amorphous form and possible recrystallization time depend on the polymer used in the mixture. These assays were based on using thermal (differential scanning calorimetry (DSC)) and spectroscopic methods, including Fourier transform infrared (FTIR) and Raman spectroscopy. It should be also noted that to achieve the amorphization of paracetamol by co-melting, the increased temperature was used. This factor can induce potential changes in the active substance and cause its decomposition. Ultrahigh-performance liquid chromatography (UHPLC) was used to determine whether the decomposition of paracetamol occurs during heating-induced amorphization.

2. Materials and Methods

2.1. Materials

Paracetamol (acetaminophen, 4-hydroxyacetanilide, 4-acetamonophenol; purity ≥ 99%, Lot: SLBH0185V); three types of hydroxypropyl methylcellulose (HPMC, hypromellose) with different molecular weights (different chain length) and varying degrees of substitution with methoxy-(MO) and hydroxypropyl-(HPO) groups: HPMC 86 (average molecular mass 86,000, 29% MO and 7% HPO, Lot: MKBG1179V), HPMC 90 (average molecular mass 90,000, 21% MO and 5% HPO, Lot: MKCD1065), HPMC 120,000 (average molecular mass 120,000, 21% MO and 5% HPO, Lot: MKBT7835V); and methylcellulose (MC, Methocel® A15LV, 27.5–31.5% methoxyl groups, Lot: BCBW5261). All reference substances were obtained in solid form from Sigma-Aldrich (St. Louis, MI, USA) and were used as received.
Binary physical mixtures containing 25%, 50% and 75% paracetamol with each polymer were prepared by 20 min homogenization in mortar with a celluloid card. This homogenization method avoided the potential phase transformations that can occur during pestle grinding.

2.2. Methods

2.2.1. Differential Scanning Calorimetry

Differential scanning calorimetry (DSC) studies were performed using a Mettler Toledo heat-flux DSC 822e instrument (Schwerzenbach, Switzerland). Samples of paracetamol and mixtures in the range of 3.90–4.10 mg were weighed in 40 µL aluminum crucibles with a pin, closed with a lid with two holes. The measurement was carried out in an atmosphere of nitrogen (99.998% purity, Air Products, Warsaw, Poland) flowing at a rate of 70 mL/min. The instrument was controlled by STARe software version 15.0 and cooled with liquid nitrogen. The instrument was calibrated using In and Zn reference materials (both 99.998% purity).
Three series of samples of each mixture were prepared. In the 1st heating, paracetamol and mixtures were heated between 25–175 °C at a rate of 10 °C/min and held at 175 °C for 2 min. Samples were then cooled at a rate of 40 °C/min to 10 °C, held at 10 °C for 2 min, reheated to 175 °C at a rate of 10 °C/min (2nd heating), held at 175 °C for 2 min and again cooled at a rate of 40 °C/min to 25.
The samples were then stored at room temperature in the crucibles in which they were previously analyzed and reanalyzed after 2 (second series) and 4 months (third series). Re-analysis included heating in the range 25–175 °C at a rate of 10 °C/min, held at 175 °C for 2 min and controlled cooling to 25 at a rate of 40 °C/min.

2.2.2. Spectroscopic Analysis

Samples for Fourier transform infrared (FTIR) spectroscopic studies were prepared by triturating 1 mg of the sample with 100 mg of KBr suitable for spectroscopic studies (Merck, Darmstadt, Germany) and then compressing the mixture into a pellet using a hydraulic press (Specac, Orpington, UK). Spectra were recorded in the range of 400–4000 cm−1 with a spectral resolution of 2 cm−1, obtaining a spectrum averaged over 16 scans. A Nicolet 380 FTIR spectrometer (Thermo Fisher Scientific, Madison, WI, USA) with OMNIC software, version 8.2 (Thermo Fisher Scientific, Madison, WI, USA) and a deuterated triglycine sulfate (DTGS) detector was used.
To record Raman spectra, a small amount of sample was placed in a powder sample holder. Spectra were recorded using a SmartRaman DXR spectrometer (Thermo Fisher Scientific, Madison, WI, USA) with a 780 nm DXR laser at 15 mW using a 25 µm aperture, Raleigh filter, charge-coupled detector (CCD), and OMNIC software. During the measurement, the sample was exposed to laser light for 1 s and the signal was recorded in the range of 400–3400 cm−1 with a resolution of 2 cm−1.

2.2.3. Chromatographic Analysis

A standard solution of paracetamol at a concentration of 10 mg/mL was prepared by dissolving 10 mg of the substance in 1 mL of methanol. A working solution at a concentration of 1 and 10 µg/mL, was prepared by diluting the stock solution in methanol. UHPLC super-grade reagents were used in this study: acetonitrile (Merck, Darmstadt, Germany), methanol and orthophosphoric acid (POCh, Gliwice, Poland), and Ultra-Toc/UV purified deionized water (Hydrolab, Straszyn, Poland). All the solutions were stored at −21 °C.
Amounts of 3.78–4.40 mg of physical mixtures of paracetamol with polymers were weighed and dissolved in 1 mL of methanol. The mixtures were vortexed for 1 min. Then, the mixtures were filtered through a syringe filter (PTFE 45 µm), 100 µL of the filtrate was taken and 900 µL of methanol was added. A volume of 100 µL of the solution was taken again and topped up with methanol to a volume of 1 mL.
Crucibles containing samples of paracetamol-polymer mixtures after DSC analyzes were placed in plastic test tubes and 1 mL of methanol was added. The samples were vortex mixed for 1 min. Then, filtered through a syringe filter (PTFE 45 µm), 100 µL of the filtrate was taken and 900 µL of methanol was added. Another 100 µL of the solution was taken and diluted with methanol to a volume of 1 mL.
A Nexera XR UHPLC liquid chromatograph (Shimadzu, Kyoto, Japan) equipped with an LC-30AD pump, CTO-20AC thermostat, CBM-20Alite control system, SIL-30AC autosampler, SPD-M30A UV-VIS detector with diode array, and SPD-M30A high-sensitivity measuring cell (85 mm) was used for chromatographic separation. Chromatographic separation was carried out on a Nucleosil 100-5 C18 column (125 × 4.0 mm, 5 µm, Knauer, Berlin, German) with precolumn, maintained at 30 °C. The mobile phase was a binary system consisting of water with 0.1% of orthophosphoric acid (pH 3.5) and 30% of acetonitrile, at a flow rate of 0.9 mL/min. The total run time of analysis was 5 min.

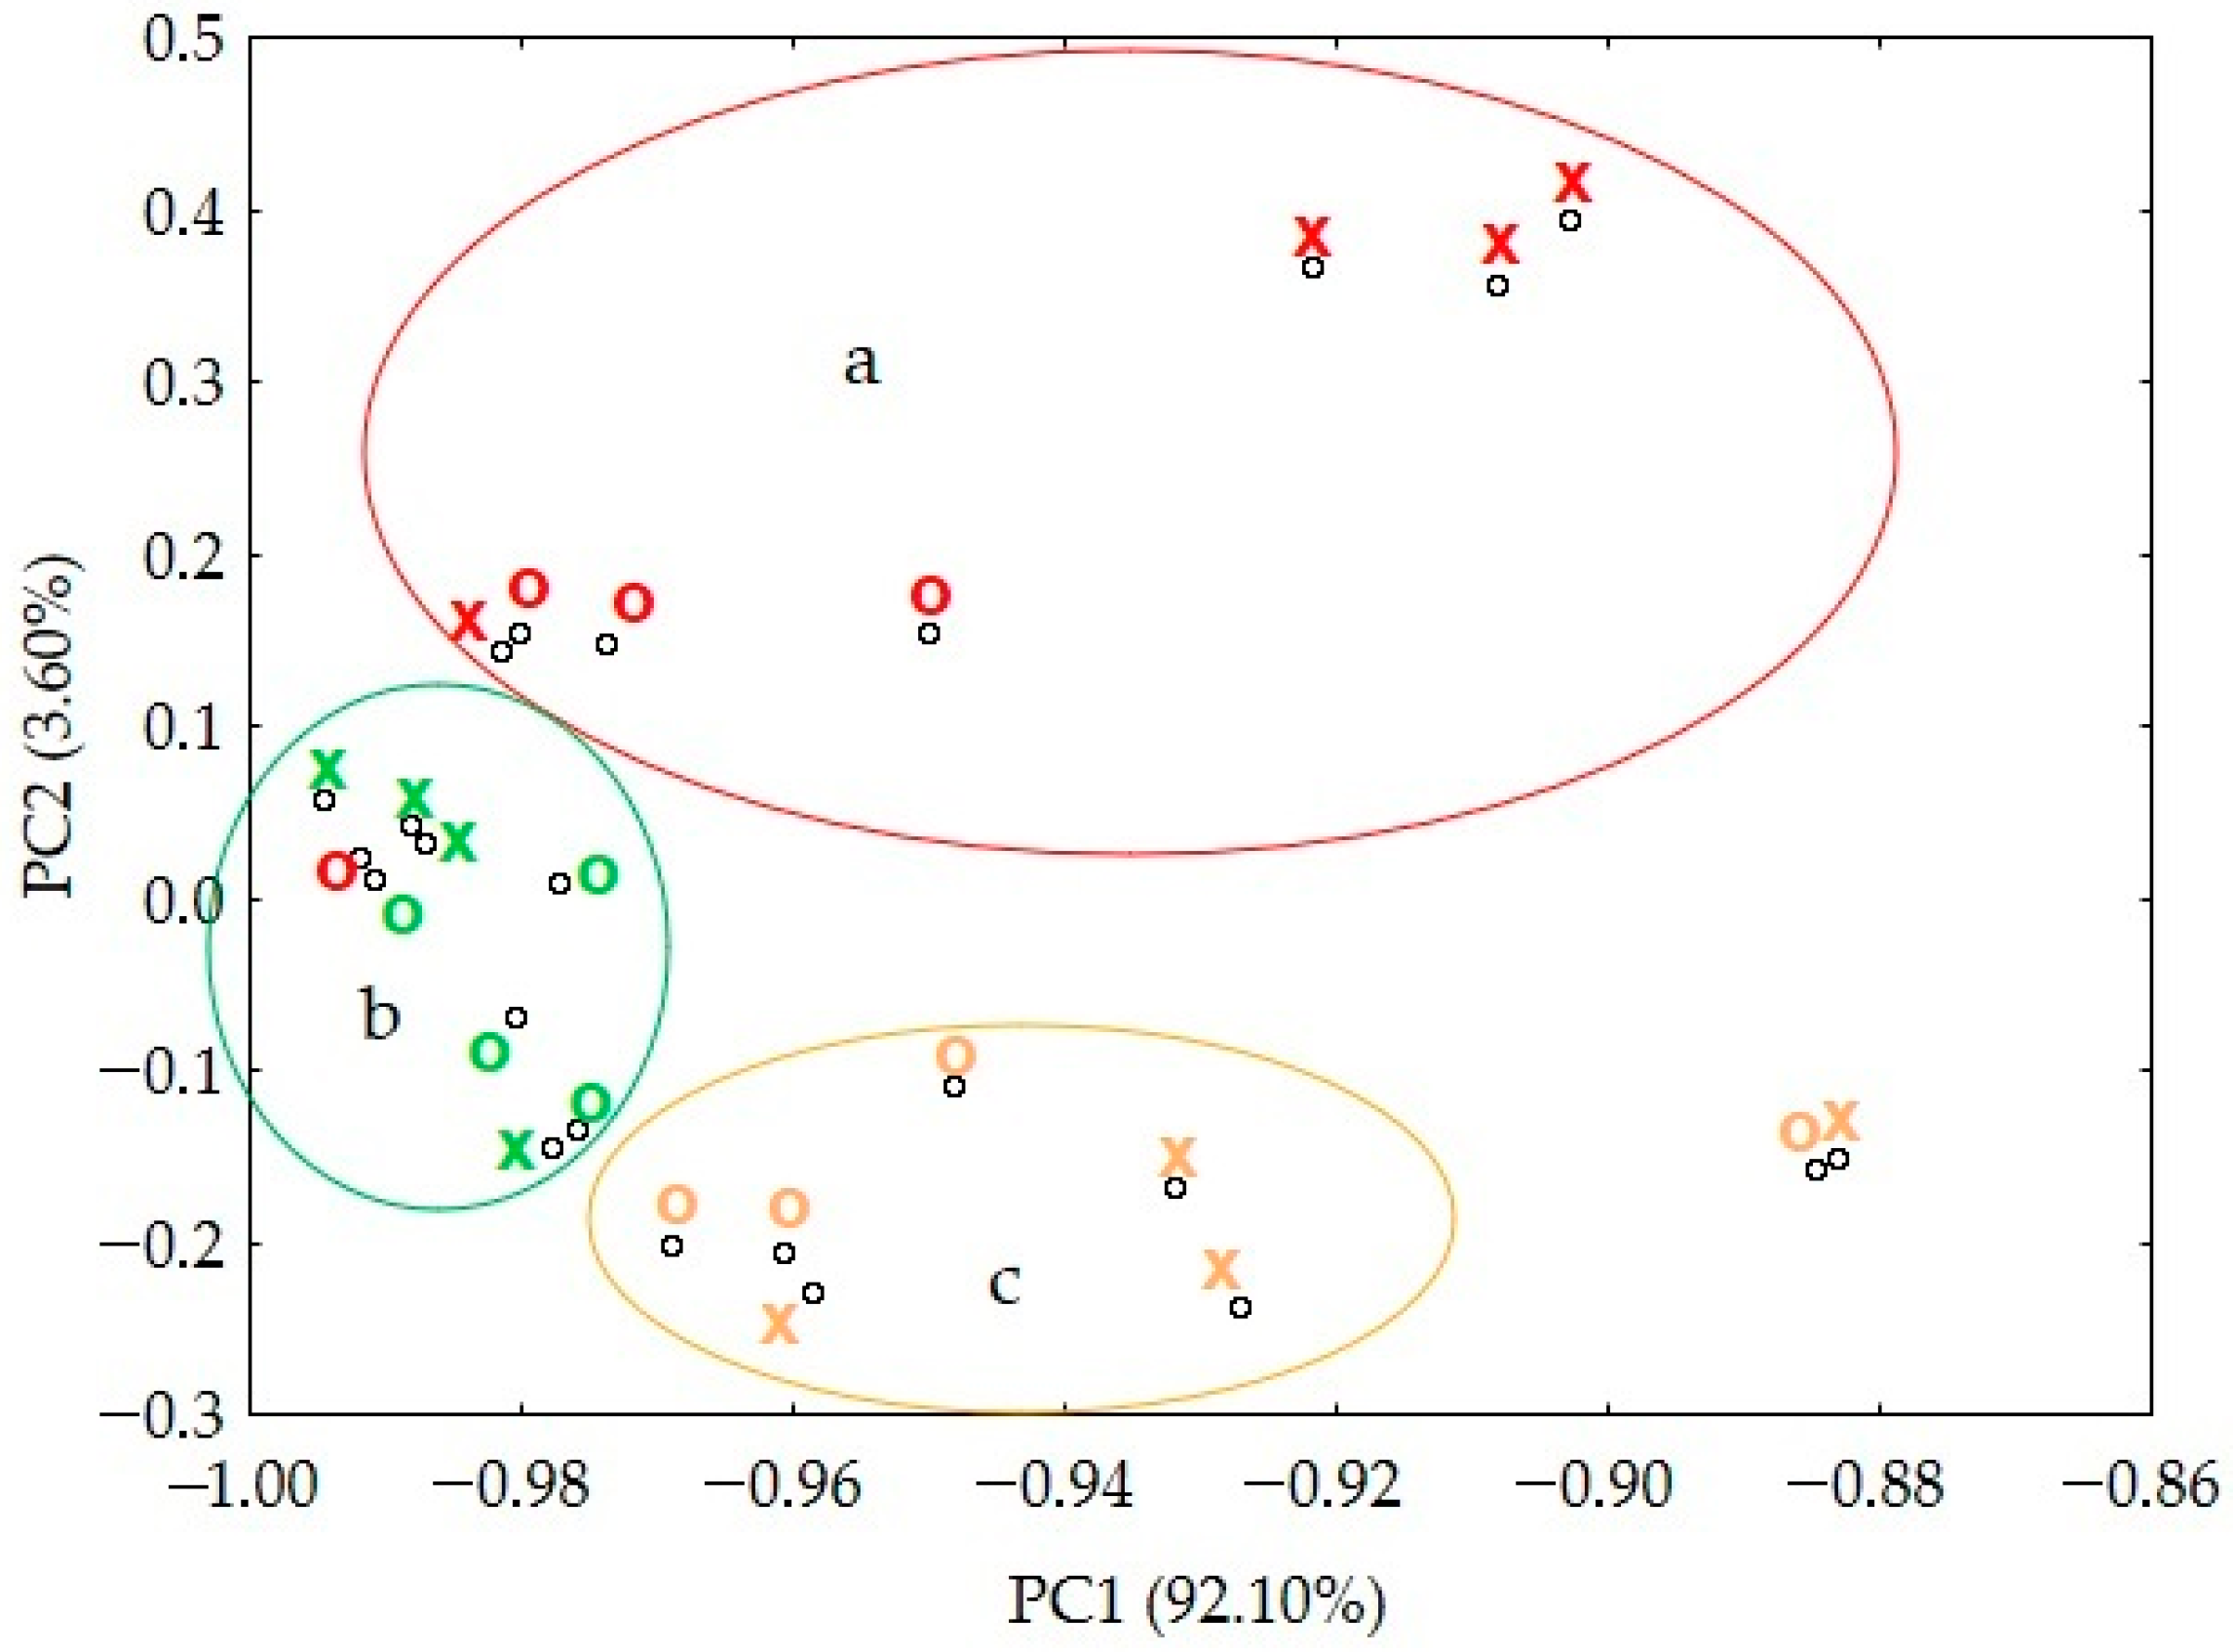
2.2.4. Chemometric Analysis

Principal component analysis (PCA) was used to interpret the results obtained by DSC at 2 and 4 months after co-melting the mixtures. The software used for the calculations was Statistica 13.3 (TIBCO Software Inc., Palo Alto, CA, USA). The database for the calculations was a matrix consisting of heatflow (W/g) measurement values. These values were collected every 0.17 °C within the range of the analysis. The results of PCA without rotation are illustrated by plotting the 2D results of the first two principal components (PC1 and PC2).

3. Results

3.1. DSC Analysic

3.1.1. Paracetamol Amorphization

Figure 1 shows the DSC curves of paracetamol and physical mixtures analyzed initially in the heating–cooling–heating cycle. In this figure, vertical lines mark the melting point of the first and second crystal forms of paracetamol. DSC measurement values, including melting enthalpy, peak onset (Ton) and peak maximum (Tp) for single paracetamol and paracetamol in mixtures are summarized in Table 1. The values are presented based on the results obtained in the first cycle (1st and 2nd heating; average of three measurements) and heating after 2 and 4 months.
The DSC 1st heating curve of paracetamol (Figure 1A, a) shows a sharp melting peak beginning at 170.1 °C. The DSC curves of all physical mixtures during 1st heating (Figure 1A, b–m) show the melting peak of form I shifted to lower temperatures (166.3–169.3 °C). This shift is usually greater the lower the paracetamol content in the mixture. If there are no interactions between the components of the mixture, the enthalpy of melting is proportional to the amount of the crystalline form of the substance. Based on the melting enthalpy of paracetamol during 1st heating, the amount of crystal form I of paracetamol in the mixture was calculated. These values are listed in Table 1.
No crystallization peak was observed in the DSC cooling (Figure 1B) curves of paracetamol and mixtures. The DSC curve of 2nd heating of paracetamol (Figure 1C, a) shows a small signal at approximately 23 °C, characteristic of a glass transition. An exothermic crystallization peak starting at approximately 76 °C was then observed and subsequently, an endothermic, sharp melting peak at approximately 158 °C.
In the DSC curves of mixtures with 2nd heating (Figure 1C, b–m), the signal of glass transition was difficult to interpret reliably. For this reason, in order to prevent an error in determining the temperature of glass transition in the mixtures, the determination of these values was not undertaken. In the DSC curves of mixtures containing 75% paracetamol with various HPMCs (Figure 1C, b,e,h), signals above 130 °C were observed. Then, endothermic crystallization, a broad peak and subsequently a melting point of approximately 154 °C was observed. The DSC curve of the 2nd heating of the mixture containing 75% paracetamol and MC (Figure 1C, k) showed an endothermic peak below 170 °C.
In the case of mixtures containing 50% and 25% paracetamol (Figure 1C, c,d,f,g,i,j,l,m) no peaks during re-heating were observed.

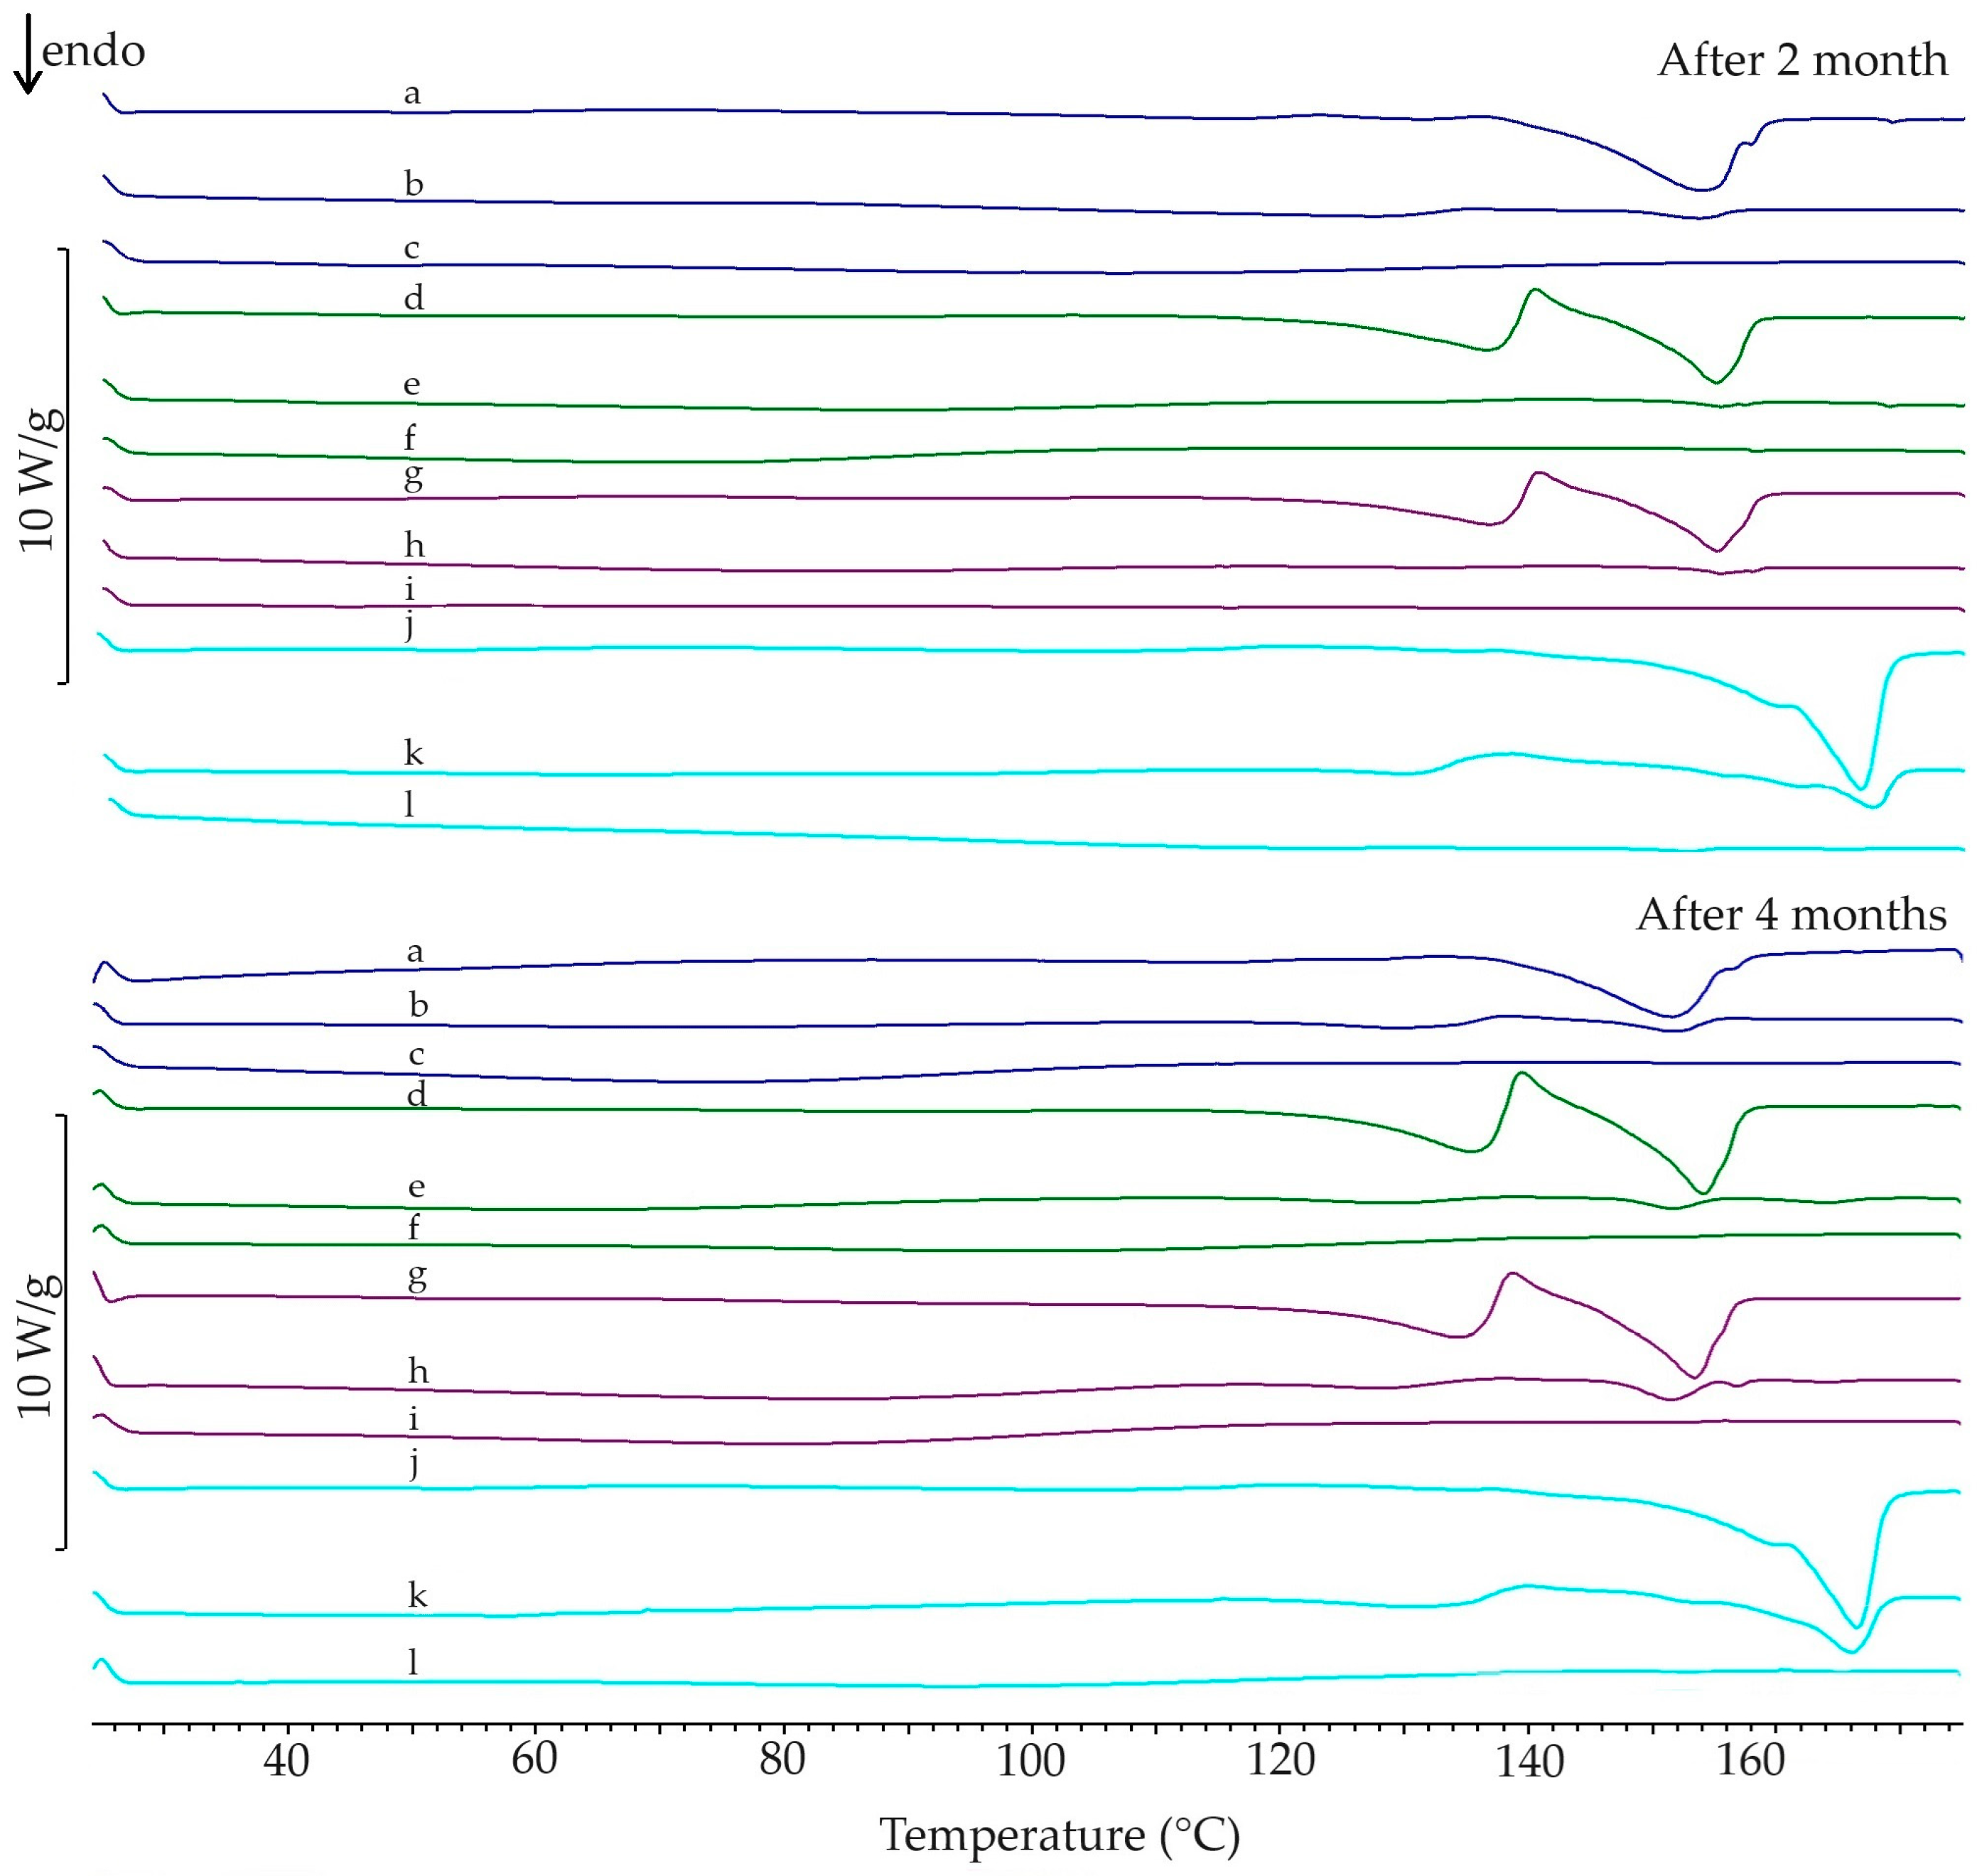
3.1.2. Stability of Amorphous Form

The second series of samples analyzed immediately after preparing the mixtures was re-analyzed after 2 months, and the third series after 4 months. The DSC curves obtained during these analyzes are shown in Figure 2. On the curve of the mixture containing 75% paracetamol with HPMC 86 analyzed after 2 and 4 months (Figure 2, a) shows a strongly broadened melting peak starting above 140 °C (Table 1). The signal of formation of metastable form III observed immediately after the first co-melting was practically invisible after 2 and 4 months. The melting enthalpy of form II after 2 and 4 months is higher than immediately after co-melting the mixture. In the case of a mixture containing 50% paracetamol with HPMC 86 (Figure 2, b), a small, strongly broadened and increasing over time peak was observed. However, a crystallization peak was not observed in the mixture containing 25% paracetamol (Figure 2, c).
The signals observed in the DSC curves of paracetamol mixtures with HPMC 90 and HPMC 120 tested after 2 and 4 months (Figure 2, d,e,g,h) are very similar. The strong endothermic peak for mixtures at approximately 130 °C and then exothermic crystallization peak were observed. In mixtures containing 75% paracetamol, these signals were strong (Figure 2, d,g), and in mixtures with 50% they were small (Figure 2, e,h) but clearly marked. In the case of mixtures containing 25% paracetamol in a mixture with HPMC 90 (Figure 2, f) and HPMC 120 (Figure 2, i), no DSC peaks indicating crystallization and melting were observed.
The shape of the DSC curves of paracetamol and MC mixtures obtained after 2 and 4 months (Figure 2, j–l) is similar. The curves of mixtures containing 75% (Figure 2, j) show an intense, broadened peak above 158 °C. For 50% mixtures (Figure 2, k), this peak is preceded by broad signals. An endothermic melting peak at approximately 160 °C of very low intensity, but interpretable, was also observed for mixtures containing 25% paracetamol (Figure 2, k).
Figure 3 shows a two-dimensional scatter plot of PC1 and PC2 factors, calculated for the results of DSC tests performed 2 and 4 months after co-melting mixtures of paracetamol with polymeric cellulose derivatives.
The PCA results created three clusters, with the main concentrating variable as the paracetamol content in mixture. The “a” and “b” cluster highlighted in red and green, respectively, concentrate the results obtained for mixtures containing 25 and 50% of paracetamol, while the orange “c” cluster corresponds to mixtures containing 75% of paracetamol. Clearly separated from the others each of the tested mixtures confirms that their compositions were different. These mixtures undergoing some modification after 2 and 4 months, but these differences were not significant because most mixtures were included to the same cluster, except of three ones which were located outside of specific cluster.

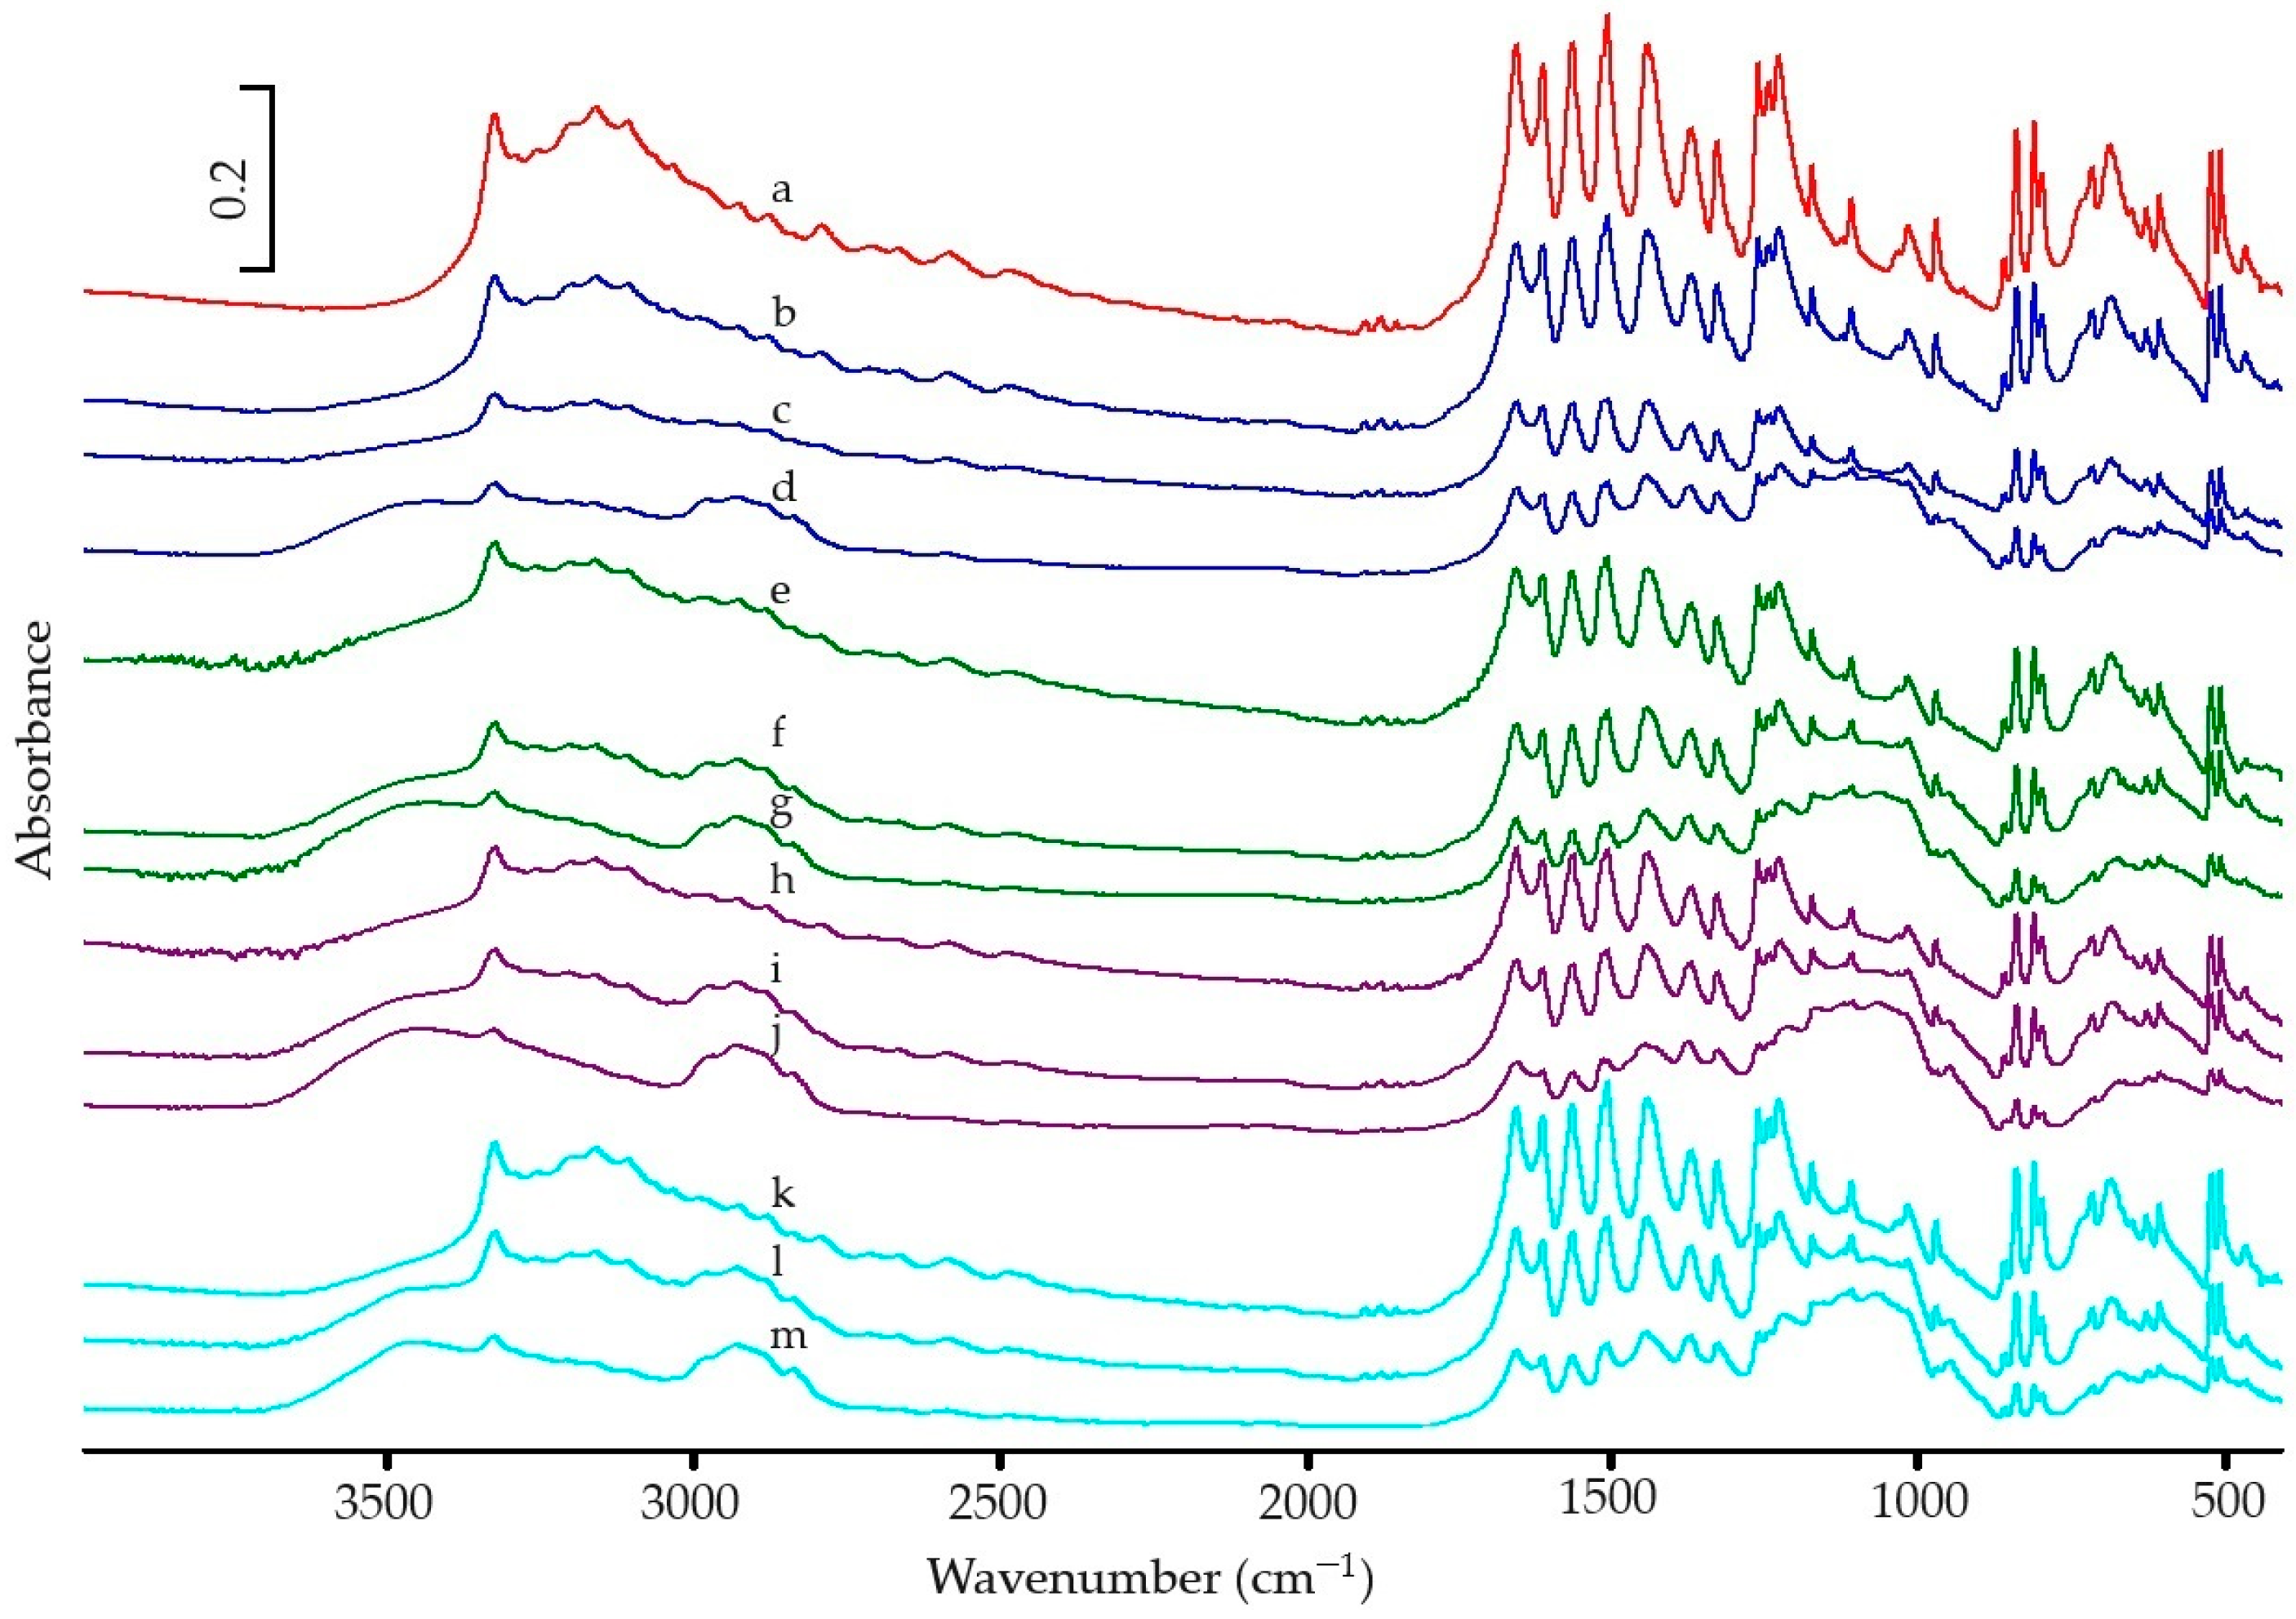
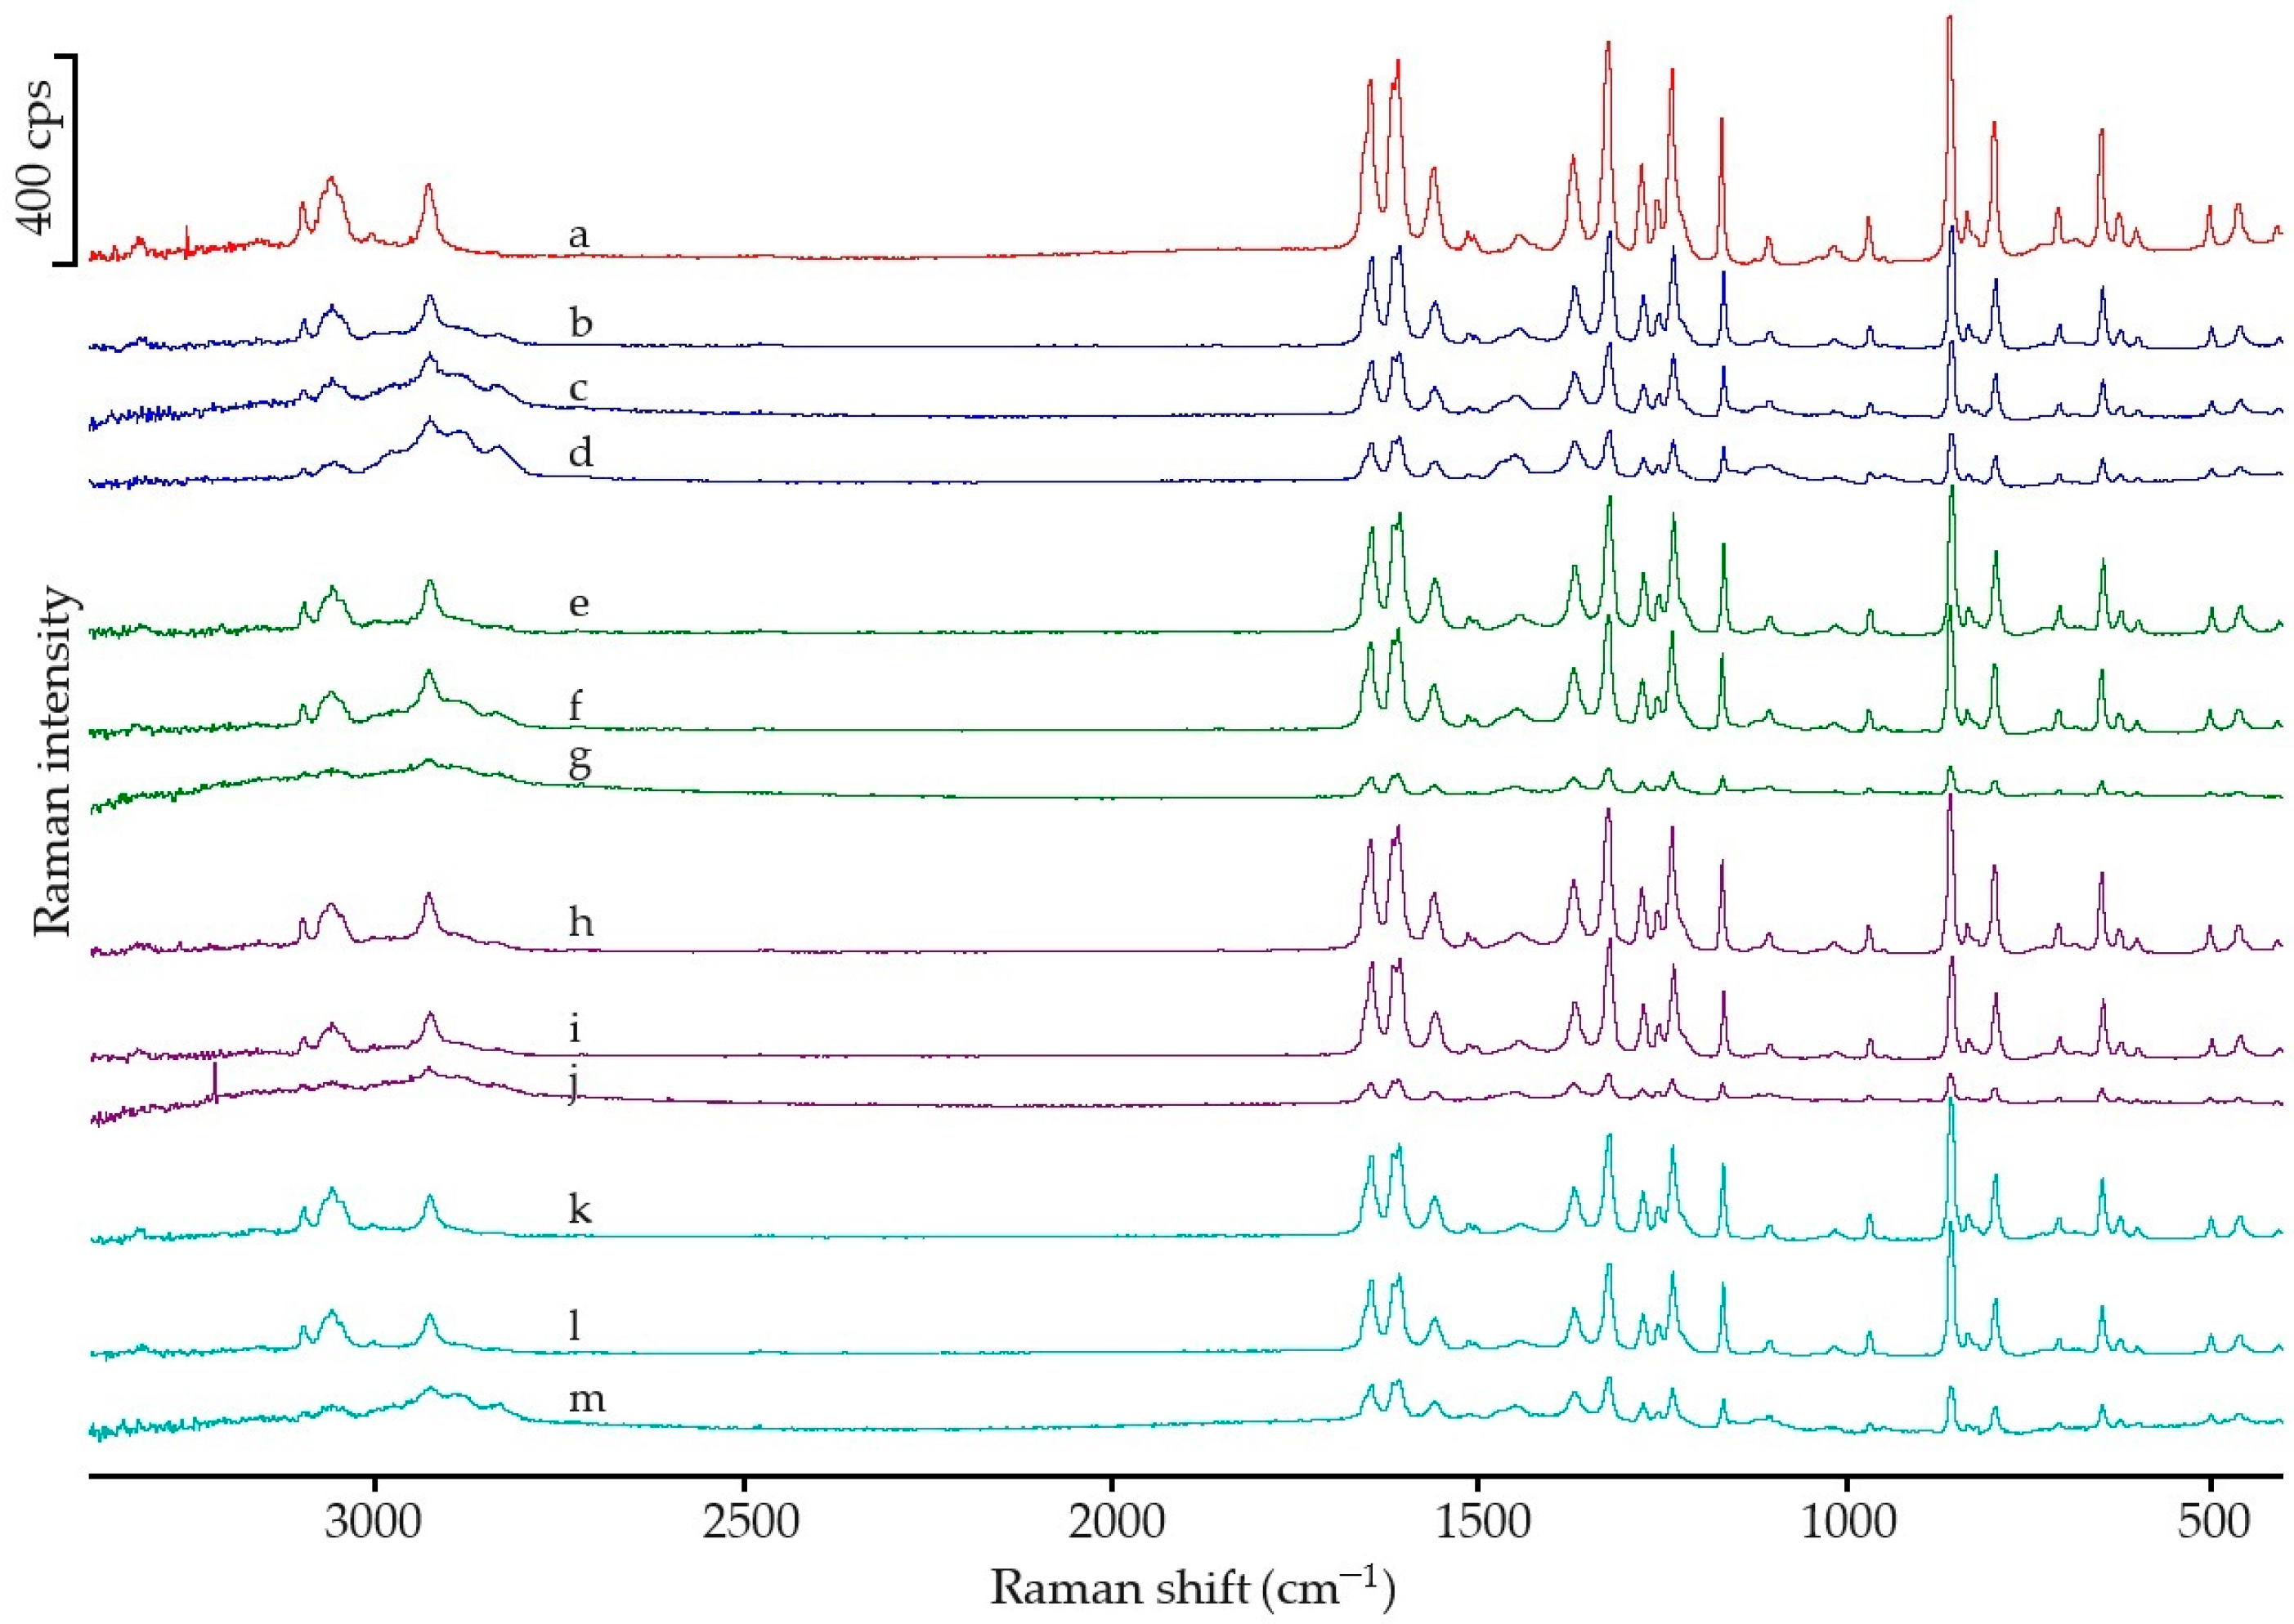
3.2. Spectroscopic Analysic

The FTIR spectra of paracetamol and the mixtures studied are shown in Figure 4, while the Raman spectra are shown in Figure 5, respectively. In the FTIR and Raman spectra of the mixtures, all the peaks characteristic of paracetamol are represented. The intensity of these peaks decreases with decreasing amounts of paracetamol in the mixture. No loss of characteristic peaks or new peaks were observed. Table 2 compares the literature wavenumbers and Raman shifts [25,26,27] with the values obtained during the measurement. In addition, the normalized intensities of these peaks are included. The absorption peak in FTIR spectrum at 837 cm−1, whose intensity, according to the literature, does not depend on the polymorphic form of paracetamol, was used as an internal standard [25]. For Raman spectra, normalization was performed with relation to the intensity of peak at 832 cm−1.

3.3. Stability of Paracetamol after Melting

Chromatograms of standard paracetamol and its mixtures containing 50% of the active ingredient with polymers analyzed 4 months after co-melting are shown in Figure 6. The retention time of paracetamol was 1.6 min (Figure 6, a). On the chromatograms of all physical mixtures and samples analyzed after 2 or 4 months of co-melting, only the peak at the retention time consistent with standard paracetamol was observed. However, no additional peaks were observed.

4. Discussion

The melting point of paracetamol obtained in DSC studies confirms that the substance used in the research was the I crystalline form [28]. For all physical mixtures, enthalpy of melting indicates a partial reduction in paracetamol crystallinity as a result of homogenization in the solid phase with polymers, which is consistent with the literature data and the results of previous studies [24,29].
The lack of a crystallization peak during rapid cooling shows that paracetamol does not crystallize during rapid cooling, neither single substance nor in a mixture. Additionally, a fold on the 2nd heating of paracetamol DSC curve at approximately 23 °C, characteristic of a glass transition shows full paracetamol amorphization after melting and rapid cooling. An exothermic crystallization peak starting at approximately 76 °C corresponds to recrystallization II which melts at 158 °C. This information is consistent with the literature data [23,24,30].
Signals above 130 °C in the DSC curves of mixtures containing 75% paracetamol with various HPMCs indicate the formation of metastable form III. Subsequently, paracetamol re-crystallizes to form II, as indicated by the melting point of approximately 154 °C (slightly lower than form II of paracetamol without the addition of polymers). In the case of the mixture with HPMC 86, these signals were the highest in intensity. The DSC curve of 2nd heating of a mixture containing 75% paracetamol and MC indicates the formation of a small amount of form I paracetamol, which confirms the melting peak at a temperature slightly below 170 °C [29,30].
The lack of recrystallization and melting peak in the DSC curves of mixtures containing 50% and 25% paracetamol shows that no metastable form III or form II was formed in these mixtures immediately after melting. At the same time, this means that paracetamol has completely amorphized after co-melting in these mixtures.
Analysis of co-melting samples after 2 and 4 months makes it possible to check whether paracetamol crystallization occurs when the mixtures are stored at room temperature. The purpose of the analyses is to determine whether the amorphization of paracetamol after fusion with polymers is stable and whether it depends on the type of polymer in the mixture and the proportion of components.
Broadened melting peak starting above 140 °C on DSC curves of the mixture containing 75% paracetamol with HPMC 86 analyzed after 2 and 4 months correspond to form II. The signal of formation of metastable form III observed for this mixture immediately after co-melting was in this curve practically invisible. Thus, the formation of the II form of paracetamol occurs not only during heating, but also during storage of the mixture. The melting enthalpy of form II after 2 and 4 months is also higher than immediately after co-melting the mixture.
For a mixture containing 50% paracetamol with HPMC 86, a small, strongly broadened DSC peak increasing over time indicates a small amount of form II. However, crystallization was not noticeable in the mixture containing 25% paracetamol. The results indicate progressive crystallization of paracetamol after co-melting paracetamol with HPMC 86 if the content of the active ingredient in the mixture was min. 50%.
A strong endothermic peak at approximately 130 °C in the DSC curves of mixtures containing 75% and 50% paracetamol with HPMC 90 and HPMC 120 tested after 2 and 4 months indicates the formation of metastable form III, which then crystallizes to form II. However, the fact that the crystallization of form II preceded the formation of form III indicates that form II was not formed earlier, during storage of the co-melting mixtures. In mixtures with 25% paracetamol with HPMC 90 and HPMC 120, there was no crystallization or formation of a metastable form.
The broadened peak above 158 °C in the DSC curve of all mixtures of paracetamol with MC corresponds to form I. Since this peak was small and preceded by a broad signal in the DSC curve of the mixture containing 50% paracetamol, it is possible that part of form I in this mixture was formed only during reheating. The results indicate that paracetamol in a mixture with MC, despite previous significant amorphization after co-melting, crystallizes to form I during storage.
In the FTIR and Raman spectra, the values of wavenumbers and Raman shifts are in agreement with the literature data [25,26,27]. These signals properly correspond to the bonds in the paracetamol molecule. The appearance of all peaks in the FTIR and Raman spectra of physical mixtures of paracetamol with all polymers and different ratios of components indicates that there is no solid-phase interaction between the components of the mixtures. Choosing the appropriate excipients, the correct amounts, and the method of preparing the final pharmaceutical product can make a difference in the context of drug polymorphism, including also polymorphism of paracetamol [31,32]. Our study indicated that co-melting of this active substance with the examined cellulose derivatives, in which the proportion of paracetamol is 25%, indicates a complete and permanent loss of the crystal-line form during storage. Since the amorphous form shows the best bioavailability, obtaining a stable amorphous form allows improving bioavailability parameters [31,33]. This fact can be considered as an important during the development of new drug formulation (higher therapeutic efficiency with less side effects for the patients, the profit for the pharmaceutical industry and less negative influence on natural environment). The results of this study indicate that it makes sense to undertake further studies to compare the bioavailability of paracetamol after administration of co-melted mixtures.

5. Conclusions

The results confirmed a partial reduction in the crystallinity of paracetamol in the physical mixture regardless of the type of polymer added. Rapid cooling of co-melting mixtures did not cause crystallization of paracetamol. During reheating of mixtures containing 75% paracetamol with different types of HPMC, a metastable form was formed, which then recrystallized to form II. This occurrence was strongest in mixtures with HPMC 86. In contrast, a small amount of form I was observed in mixtures containing 75% paracetamol with MC. In the remaining mixtures, co-melting allowed the formation of an amorphous form, which did not show crystallization when heated.
During storage of co-melted mixtures at room temperature, partial crystallization of paracetamol to form II occurred in mixtures containing 75% and 50% paracetamol with HPMC 86, while partial crystallization of paracetamol to form I occurred in mixtures with MC. For mixtures containing 25% paracetamol with all HPMC types, no crystallization was observed during storage.
The possibility of recrystallization of paracetamol after prior co-melting-induced amorphization depends on the added polymer and ingredients ratios.
The compatibility of components in the solid phase and the stability of paracetamol after co-melting with all analyzed polymers were confirmed.

Author Contributions

Conceptualization, E.L. and E.D.; methodology, E.L. and E.D.; formal analysis, E.L. and E.D.; investigation, J.K., E.L. and E.D.; data curation, E.L. and E.D.; writing—original draft preparation, E.L. and E.D.; writing—review and editing, E.L., E.D. and A.P.; visualization, E.L. and E.D.; supervision, E.L. and A.P.; project administration, E.L. and E.D.; funding acquisition, A.P. and E.D. All authors have read and agreed to the published version of the manuscript.

Funding

This research received no external funding.

Institutional Review Board Statement

Not applicable.

Informed Consent Statement

Not applicable.

Data Availability Statement

Data is contained within the article.

Conflicts of Interest

The authors declare no conflicts of interest.

References

  1. Censi, R.; Di Martino, P. Polymorph Impact on the Bioavailability and Stability of Poorly Soluble Drugs. Molecules 2015, 20, 18759–18776. [Google Scholar] [CrossRef] [PubMed]
  2. Singhal, D.; Curatolo, W. Drug polymorphism and dosage form design: A practical perspective. Adv. Drug Deliv. Rev. 2004, 56, 335–347. [Google Scholar] [CrossRef]
  3. Dong, W.; Su, X.; Xu, M.; Hu, M.; Sun, Y.; Zhang, P. Preparation, characterization, and in vitro/vivo evaluation of polymer-assisting formulation of atorvastatin calcium based on solid dispersion technique. Asian J. Pharm. Sci. 2018, 13, 546–554. [Google Scholar] [CrossRef] [PubMed]
  4. Alshehri, S.M.; Shakeel, F.; Ibrahim, M.A.; Elzayat, E.M.; Altamimi, M.; Mohsin, K.; Almeanazel, O.T.; Alkholief, M.; Alshetaili, A.; Alsulays, B.; et al. Dissolution and bioavailability improvement of bioactive apigenin using solid dispersions prepared by different techniques. Saudi Pharm. J. 2019, 27, 264–273. [Google Scholar] [CrossRef] [PubMed]
  5. Yan, Y.D.; Sung, J.H.; Kim, K.K.; Kim, D.W.; Kim, J.O.; Lee, B.J.; Yong, C.S.; Choi, H.G. Novel valsartan-loaded solid dispersion with enhanced bioavailability and no crystalline changes. Int. J. Pharm. 2012, 422, 202–210. [Google Scholar] [CrossRef]
  6. Rashid, R.; Kim, D.W.; Din, F.; Mustapha, O.; Yousaf, A.M.; Park, J.H.; Kim, J.O.; Yong, C.S.; Choi, H.G. Effect of hydroxypropylcellulose and Tween 80 on physicochemical properties and bioavailability of ezetimibe-loaded solid dispersion. Carbohydr. Polym. 2015, 130, 26–31. [Google Scholar] [CrossRef] [PubMed]
  7. Available online: https://www.ema.europa.eu/en/glossary/bioavailability (accessed on 17 June 2024).
  8. Atkinson, A.J. Chapter 4—Drug Absorption and Bioavailability. In Principles of Clinical Pharmacology, 3rd ed.; Atkinson, A.J., Huang, S.-M., Lertora, J.J.L., Markey, S.P., Eds.; Academic Press: Cambridge, MA, USA, 2012; pp. 41–53. [Google Scholar] [CrossRef]
  9. Chow, S. Bioavailability and bioequivalence in drug development. WIREs Comput. Stat. 2014, 6, 304–312. [Google Scholar] [CrossRef] [PubMed]
  10. Han, Y.R.; Lee, P.I.; Pang, K.S. Finding Tmax and Cmax for Multicompartmental Models. Drug Metab. Dispos. 2018, 46, 1796–1804. [Google Scholar] [CrossRef]
  11. Bhalani, D.V.; Nutan, B.; Kumar, A.; Singh Chandel, A.K. Bioavailability Enhancement Techniques for Poorly Aqueous Soluble Drugs and Therapeutics. Biomedicines 2022, 10, 2055. [Google Scholar] [CrossRef] [PubMed]
  12. Kanaujia, P.; Poovizhi, P.; Ng, W.K.; Tan, R.B.H. Amorphous formulations for dissolution and bioavailability enhancement of poorly soluble APIs. Powder Technol. 2015, 285, 2–15. [Google Scholar] [CrossRef]
  13. Sun, Y.; Zhu, L.; Wu, T.; Cai, T.; Gunn, E.M.; Yu, L. Stability of amorphous pharmaceutical solids: Crystal growth mechanisms and effect of polymer additives. AAPS J. 2012, 14, 380–388. [Google Scholar] [CrossRef] [PubMed]
  14. Shi, Q.; Li, F.; Yeh, S.; Wang, Y.; Xin, J. Physical stability of amorphous pharmaceutical solids: Nucleation, crystal growth, phase separation and effects of the polymers. Int. J. Pharm. 2020, 590, 19925. [Google Scholar] [CrossRef] [PubMed]
  15. Kerlin, R.L.; Li, X. Chapter 24—Pathology in Non-Clinical Drug Safety Assessment. In Haschek and Rousseaux’s Handbook of Toxicologic Pathology, 3rd ed.; Haschek, W.M., Rousseaux, C.G., Wallig, M.A., Eds.; Academic Press: Cambridge, MA, USA, 2013; pp. 725–750. [Google Scholar] [CrossRef]
  16. van der Merwe, J.; Steenekamp, J.; Steyn, D.; Hamman, J. The Role of Functional Excipients in Solid Oral Dosage Forms to Overcome Poor Drug Dissolution and Bioavailability. Pharmaceutics 2020, 12, 393. [Google Scholar] [CrossRef]
  17. Veith, H.; Wiechert, F.; Luebbert, C.; Sadowski, G. Combining crystalline and polymeric excipients in API solid dispersions—Opportunity or risk? Eur. J. Pharm. Biopharm. 2021, 158, 323–335. [Google Scholar] [CrossRef] [PubMed]
  18. Wei, Y.; Dattachowdhury, B.; Vangara, K.; Patel, N.; Alexander, K.; Boddu, S. Excipients That Facilitate Amorphous Drug Stabilization. In Excipient Applications in Formulation Design and Drug Delivery; Narang, A., Boddu, S., Eds.; Springer: Berlin/Heidelberg, Germany, 2015; pp. 463–495. [Google Scholar] [CrossRef]
  19. Ayoub, S.S. Paracetamol (acetaminophen): A familiar drug with an unexplained mechanism of action. Temperature 2021, 8, 351–371. [Google Scholar] [CrossRef] [PubMed]
  20. Rassat, M.; Ouandji, I.; Guiblin, N.; Espeau, P. Obtaining two polymorphic forms of paracetamol within the phase diagram with PEG 1500. Eur. J. Pharm. Biopharm. 2024, 195, 114173. [Google Scholar] [CrossRef] [PubMed]
  21. Shtukenberg, A.G.; Tan, M.; Vogt-Maranto, L.; Chan, E.J.; Xu, W.; Yang, J.; Tuckerman, M.E.; Hu, C.T.; Kahr, B. Melt Crystallization for Paracetamol Polymorphism. Cryst. Growth Des. 2019, 19, 4070–4080. [Google Scholar] [CrossRef]
  22. Yeh, K.L.; Lee, H.L.; Lee, T. Crystallization of Form II Paracetamol with the Assistance of Carboxylic Acids toward Batch and Continuous Processes. Pharmaceutics 2022, 14, 1099. [Google Scholar] [CrossRef]
  23. Leyk, E.; Wesolowski, M. Interactions Between Paracetamol and Hypromellose in the Solid State. Front. Pharmacol. 2019, 10, 14. [Google Scholar] [CrossRef] [PubMed]
  24. Leyk, E.; Wesolowski, M. The effect of cellulose derivatives on paracetamol crystallinity reduction. J. Therm. Anal. Calorim. 2022, 147, 10037–10048. [Google Scholar] [CrossRef]
  25. Burgina, E.B.; Baltakhinov, V.P.; Boldyreva, E.V.; Shakhtschneider, T.P. IR Spectra of Paracetamol and Phenacetin. 1. Theoretical and Experimental Studies. J. Struct. Chem. 2004, 45, 64–73. [Google Scholar] [CrossRef]
  26. Zapata, F.; López-Fernández, A.; Ortega-Ojeda, F.; Quintanilla, G.; García-Ruiz, C.; Montalvo, G. Introducing ATR-FTIR Spectroscopy through Analysis of Acetaminophen Drugs: Practical Lessons for Interdisciplinary and Progressive Learning for Undergraduate Students. J. Chem. Educ. 2021, 98, 2675–2686. [Google Scholar] [CrossRef]
  27. Elbagerma, M.A.; Edwards, H.G.M.; Munshi, T.; Scowen, I.J. Identification of a new cocrystal of citric acid and paracetamol of pharmaceutical relevance. CrystEngComm 2011, 13, 1877–1884. [Google Scholar] [CrossRef]
  28. Sibik, J.; Sargent, M.J.; Franklin, M.; Zeitler, J.A. Crystallization and phase changes in paracetamol from the amorphous solid to the liquid phase. Mol. Pharm. 2014, 11, 1326–1334. [Google Scholar] [CrossRef]
  29. Cruz, P.C.; Rocha, F.A.; Ferreira, A.M. Application of selective crystallization methods to isolate the metastable polymorphs of paracetamol: A review. Org. Process Res. Dev. 2019, 23, 2592–2607. [Google Scholar] [CrossRef]
  30. Giordano, F.; Rossi, A.; Bettini, R.; Savioli, A.; Gazzaniga, A.; Nováket, C. Thermal Behavior of Paracetamol-Polymeric Excipients Mixtures. J. Therm. Anal. Calorim. 2002, 68, 575–590. [Google Scholar] [CrossRef]
  31. Ritters, L.; Tian, Y.; Reichl, S. Spray-Dried Paracetamol/Polyvinylpyrrolidone Amorphous Solid Dispersions: Part I-Stability of Powders and Tablets. Pharmaceutics 2021, 13, 1938. [Google Scholar] [CrossRef]
  32. Balamurugan, S.D.; Venkatesan, A.; Radhakrishnan, A.; Kuppusamy, G.; Singh, S.K. Preliminary Investigation for Preparing Amorphous Paracetamol. Res. J. Pharm. Technol. 2021, 14, 1487–1492. [Google Scholar] [CrossRef]
  33. Pandi, P.; Bulusu, R.; Kommineni, N.; Khan, W.; Singh, M. Amorphous solid dispersions: An update for preparation, characterization, mechanism on bioavailability, stability, regulatory considerations and marketed products. Int. J. Pharm. 2020, 586, 119560. [Google Scholar] [CrossRef] [PubMed]
Figure 1. DSC 1st heating (A), cooling (B) and 2nd heating (C) curves of paracetamol (a), and its mixtures containing 75%, 50% and 25% of paracetamol (respectively) with HPMC 86 (b–d), HPMC 90 (e–g), HPMC 120 (h–j) and MC (k–m).
Applsci 14 06709 g001
Figure 2. DSC curves of paracetamol mixtures containing 75%, 50% and 25% of paracetamol (respectively) with HPMC 86 (a–c), HPMC 90 (d–f), HPMC 120 (g–i) and MC (j–l) obtained after 2 and 4 months.
Applsci 14 06709 g002
Figure 3. Diagram of PC1 vs. PC2 results calculated from DSC results 2 (o) and 4 (x) months after co melting mixtures containing (c) 75% (orange tags), (b) 50% (green tags) and (a) 25% (red tags) paracetamol with cellulose derivatives.
Applsci 14 06709 g003
Figure 4. FTIR spectra paracetamol (a) and mixtures containing 75%, 50% and 25% of paracetamol (respectively) with HPMC 86 (b–d), HPMC 90 (e–g), HPMC 120 (h–j) and MC (k–m).
Applsci 14 06709 g004
Figure 5. Raman spectra paracetamol (a) and mixtures containing 75%, 50% and 25% of paracetamol (respectively) with HPMC 86 (b–d), HPMC 90 (e–g), HPMC 120 (h–j) and MC (k–m).
Applsci 14 06709 g005
Figure 6. UHPLC chromatograms of paracetamol (a) and mixtures after 4 months of co-melting, containing 50% of paracetamol with HPMC 86 (b), HPMC 90 (c), HPMC 120 (d) and MC (e).
Applsci 14 06709 g006
Table 1. DSC measurement values: peak onset (Ton) and peak maximum (Tp) for single paracetamol (PAR) and in mixtures with HPMC 86, HPMC 90, HPMC 120 and MC.
PARMixture
with HPMC 86
Mixture
with HPMC 90
Mixture
with HPMC 120
Mixture
with MC
PAR Content in Mixture75%50%25%75%50%25%75%50%25%75%50%25%
1st heatingEnthalpy
of melting (J/g)
221.8142.872.829.7135.457.326.5131.264.138.7141.881.334.5
Calculated amount
of I form (%)
64.432.813.461.025.812.059.128.917.463.936.715.6
Ton (°C)170.1169.3168.0168.1168.1166.9168.1167.8167.8167.6168.8166.9166.3
Tp (°C)171.3171.3172.2171.7171.2170.8171.2171.5171.3171.2171.9171.1171.5
2nd heatingEnthalpy
of melting (J/g)
202.736.8--5.0--5.0--70.7--
Ton (°C)158.0153.3--153.2--153.9--163.9--
Tp (°C)159.9156.7--157.4--157.8--168.9--
after 2 monthsEnthalpy
of melting (J/g)
46.86.4-49.23.0-43.84.0-95.227.31.5
Ton (°C)142.3140.1-149.6152.2-149.4152.7-158.4162.6158.9
Tp (°C)153.5153.7-154.9155.4-155.1155.6-162.8167.6152.5
after 4 monthsEnthalpy
of melting (J/g)
54.57.2-47.93.8-43.66.5-101.136.00.9
Ton (°C)140.9145.8-148.0147.9-146.7147.9-158.8160.4160.6
Tp (°C)151.8151.9-154.3152.0-153.6151.7-166.2166.2165.5
Table 2. Paracetamol characteristic FTIR and Raman peaks.
FTIRRaman Spectroscopy
References [25,26]Measured Values for
PAR
References [25,27]Measured Values for
PAR
Wave Number (cm−1)Molecular VibrationPeak
(cm−1)
Normalized Peak IntensityRaman Shift (cm−1)Molecular VibrationPeak
(cm−1)
Normalized Peak Intensity
3327OH st33251.0603110as CH st31021.210
3161PhH st31601.0843058s CH3 st30621.826
2926CH3 st29290.6492937s CH3 st29301.619
1653C=O st, CNH def16541.3141649C=O st16464.076
1610Ph st16111.2471611NH def16094.525
1565CNH def, Ph st15631.3241559NH st, C=O st15602.017
1506CNH def, Ph st15061.4251371CH3 def
(umbrellas)
13702.314
1442CH3 def, Ph st14401.3111324CH b″13224.956
1371CH3 def, Ph st13691.0071278OH with CO12762.130
1327CH3 def13270.9601237CN st12354.290
1260PhH def, CN st12591.2441169CH of Ph b′11673.288
1227PhH def, CC st12251.278856CH of Ph st8565.698
1172PhH def, COH def11710.880839CH b″8321.000
1107PhH def, CH3 def11070.749796Ph st7953.061
1015PhH def, COH def10140.656649Ph b′6492.932
968PhH def, CN st9680.672501Ph b″5021.131
856PhH b″8570.532463Ph b″4631.193
837PhH b″8371.000
810Ph def, amide def8081.033
795Ph def, amide def7960.849
715CNH b″, PhH b″7130.866
668CNH b″, PhH b″6840.943
624Ph b″, amide b″6250.719
604Ph b″, amide b″6030.766
520Ph-amide c5180.930
504Ph-amide c5030.930
Vibrations: st—stretching; def—deformation; b′—bending in plane; b″—bending out of plane; s—symmetric; as—asymmetric; c—change in the dihedral angle between planes; Ph—aromatic ring.
Disclaimer/Publisher’s Note: The statements, opinions and data contained in all publications are solely those of the individual author(s) and contributor(s) and not of MDPI and/or the editor(s). MDPI and/or the editor(s) disclaim responsibility for any injury to people or property resulting from any ideas, methods, instructions or products referred to in the content.

