Article

Simulation-Based Prediction of the Cold Start Behavior of Gerotor Pumps for Precise Design of Electric Oil Pumps

1
SHW Automotive GmbH, 88427 Bad Schussenried, Germany
2
Department of Mechanical Engineering, Ravensburg-Weingarten University (RWU), 88250 Weingarten, Germany
3
Siemens Digital Industries Software, 19 Boulevard Jules Carteret, 69007 Lyon, France
4
Design Theory and Similarity Mechanics Group, Institute of Aircraft Design, University of Stuttgart, 70569 Stuttgart, Germany
*
Author to whom correspondence should be addressed.
Appl. Sci. 2024, 14(15), 6723; https://doi.org/10.3390/app14156723
Submission received: 3 July 2024 / Revised: 19 July 2024 / Accepted: 25 July 2024 / Published: 1 August 2024

Abstract

:
The development of electric gerotor pumps is a complex multiphysical optimization problem. To develop optimal systems, accurate simulation models are required to increase digital reliability. An important challenge is the accurate prediction of the pump behavior for extreme temperatures in automotive applications from 40 °C to 110 °C, where the viscosity of the fluid changes significantly. Therefore, simulation-based methods (numerical methods for calculating viscous friction) were developed and validated by measurements, including climatic chamber tests. The results show a strong correlation between simulated and measured performance characteristics, especially in terms of volumetric flow rate ( < 5 % ), pump torque and efficiency ( < 7 % ) at different temperature and viscosity conditions over a wide speed range (1000–5000 rpm) and different system pressures (0.5–5 bar). A novel method for simulating the cold start behavior of pumps (journal bearing approach for outer gear in pump housing) was introduced and validated by measurements. The methods presented significantly reduce the need for physical testing and accelerate the development process, as the pump behavior at each operating point can be accurately predicted before a hardware prototype is built. This improves the understanding of gerotor pump characteristics and provides insights to further improve the model-based development of electric oil pumps for the automotive industry.

1. Introduction

In 2023, around one out of five newly registered vehicles worldwide was a battery electric vehicle. Thereof, most electric vehicles were sold in China (60%), Europe (25%) and the USA (10%) [1]. In order to meet the demands of the drivetrain concepts of battery electric vehicles, the products of the supplier industry and the associated design requirements have changed drastically. In terms of the lubricating oil systems, a classic lubricating oil pump formerly driven by a combustion engine [2] is now being transformed into an electric oil pump that supplies fluid for powertrain cooling and lubrication applications [3].
There are various lubrication and cooling concepts that can be used for the cooling of the drivetrains of BEVs and hybrids. In industry, applications that focus on a combination of direct and indirect cooling are the most common. The oil is used either for the direct cooling of the windings by spray cooling or by overflowing the windings and for indirect stator cooling by cooling the motor housing [4]. Furthermore, the oil in the circuit also lubricates the gearbox, which is required for the transmission of the drive speed and torque [5]. Suppliers to the automotive industry typically offer so-called electric gerotor pumps for lubrication and cooling applications. Figure 1 shows a gerotor pump with an integrated electric motor and pump controller [6]. Compared to positive displacement pumps, centrifugal pumps in single-stage design are not able to achieve the required pressure ranges with the desired efficiency due to the space and acoustic (speed-limited) requirements in automotive engineering [7]. Gerotor pumps are generally preferred due to their simple design compared to vane pumps and their compact dimensions compared to external gear pumps [8,9]. Furthermore, gerotor pumps feature low noise emissions through a precise and silent operation of the trochoidal gearing [10].
Gerotor pumps are positive displacement pumps and belong to the group of internal gear pumps. They consist of an outer gear whose center of rotation is positioned eccentrically to the inner rotor and has one tooth more [8]. There are already several approaches trying to develop electric oil pumps with increased efficiency specifically for use in electric powertrains. For example, investigations [11] show how the efficiency of the pump can be increased at a certain operating point by optimizing friction in the housing.
Such investigations require the capability to simulate the pump both volumetrically and hydromechanically. In simulating pumps, both lumped parameter or 1D approaches as well as 3D CFD simulation methods are in use [12]. For example, ref. [13] analyzes the influence of cavitation on erosion with a CFD simulation, ref. [14] uses CFD simulation for noise mitigation prediction in gerotor pumps, whereas [15,16] show a combined 2D/3D environment that can accelerate the design of gerotor pumps by using simulation methods in a web-based digital twin. In the 1D and lumped parameter approaches, it is examined how micro movements in the gerotor can be investigated using a journal bearing approach (outer gear to housing) [17,18] and how a pump simulation considering fluid–structure interaction effects could be used to investigate the influence of material deformation at high pump pressures [9]. Additionally, ref. [19,20] show how a gear set design and simulation can be performed for different operating conditions, even if [2] notes that 1D simulations are often used for instantaneous flow rate calculations and more research has to be done on the holistic optimization of inlet and outlet geometries. It should be mentioned that approaches for the automated optimization of gear set profiles using CFD simulations with dynamic mesh technology have already been shown by [21]. Other works [22,23] have further shown that it is possible to simulate the pump efficiency and the corresponding torque at an operating point, if the geometric conditions of the pump are well known. However, the approach of [22] already indicates that there may be a deviation at lower temperatures. For this reason, it is the goal of the present work to
  • Develop a systematic method that allows a holistic and fast simulation of the pump at every operating point with temperatures ranging from 40 °C to + 110 °C with oils typical for the application and corresponding viscosities.
  • Study the behavior of a gerotor pump at low temperatures ( 40 °C to + 30 °C).
  • Validate the method with intensive testing in a climate chamber.

2. Methods in Context of Product Development

As shown in [24], it is important in the development process to use simulation tools to validate the design requirements already in the early stages of the development process, so that complex systems can be developed with minimal residual risk of fundamental design errors. The requirements for each subsystem are always derived from the overall system and these in return influence other subsystems and associated components. In this context, the digital consistency of data and models, together with the digital continuity of processes and the digital interoperability of tools [25] is crucial for the success of a model-based systems engineering and product development approach. According to [25], this required digital consistency, continuity and interoperability can be achieved with graph-based design languages and realized by using the commercial software package Design Cockpit 43® [26] (Version: 4.0.37, IILS Ingenieurgesellschaft für intelligente Lösungen und Systeme mbH, Trochtelfingen, Germany). For this reason, the electric oil pump system is decomposed into its subsystems and the overall system requirements are consistently decomposed to obtain the subsystem requirements according to the state-of-the-art method in this section.
The detailed analysis shown demonstrates that an optimal multi-physical and multi-criteria pump design requires a holistic approach where each potential operating point can be validated through simulation before the first hardware prototype is built. Customers typically define an overall pump efficiency and maximum electrical power consumption as a requirement for multiple operating points. The most important working points are the most commonly appearing ones or those with the harshest conditions. There are two key operating points for a pump—the cold start with extremely low temperatures (high viscosity of the fluid) at low pump speeds, and the “hot cycle” operating point with high speeds and volume flow requirements at high temperatures, resulting in the low viscosity of the fluid. The pressure requirements for the pump can all be described as moderate and are generally in the range of <5 bar. Without verifying that all operating points have been reached within the customer’s requirements, the product will not be released for further use. In particular, the cold start operating point requires extensive and time-consuming testing in a climatic chamber.
Figure 2 below shows how the overall pump power requirements and the associated overall multi-physical subsystem efficiency can be decomposed as specified by the customer for the associated subsystems. In Figure 2 Ppump refers to the total pump power, Pgerotor refers to the drive power of the gear set, and Plosses e-motor refers to the power loss of the electric motor. At the level of the gerotor subsystem, the drive power can be calculated from the hydraulic power (Ppressure) and the hydro-mechanical friction power (Pfriction). By calculating the power based on the torque (Mpressure and Mfriction) and the speed n, the need for an accurate torque prediction for the gerotor set for each operating point becomes visible. Otherwise, an incorrect torque requirement will be assumed as a boundary condition for the optimization of the electric motor, which would lead to a non-optimal motor design.
As shown in the study [27], the field of gerotor pumps has been the subject of intensive research in recent years. This has revealed that precise modeling and simulation is decisive for the continuous improvement of pump concepts such as gear profiles. Almost all modeling and simulation methods are used for the development of gerotor pumps. However, CFD and FEM simulations are mainly used to determine the flow rate, efficiency or the contact stresses of the gears. In addition to the 3D, highly geometry-dependent simulation methods, so-called 1D models or lumped parameter models can also be used to calculate pump characteristics [19,22].
For example, the commercial software package Simcenter Amesim [28] (Version: Simcenter Amesim 2210, Siemens Digital Industries Software, Plano, TX, USA) offers the possibility to model the pump completely parametrically in a very early development phase to virtually test possible concepts based on customer requirements. For further analyses in the scope of CFD, currently additional methods are being developed [29,30] that were not considered here but can be part of future investigations (see Section 6).

3. Models for Gerotor Pumps

As already mentioned in the previous section, more simple models are widely preferred for the simulation of gerotor pumps. For example, ref. [15] presents a lumped parameter approach for simulating pump characteristics that fit very well to the results of complex 3D CFD simulations. Furthermore, ref. [31], in their article, refer to a 1D approach for simulating the hydraulic pump behavior based on a simulation in the commercial software package Matlab [32] (Version: R2015a, The MathWorks, Inc., Natick, MA, USA). In Section 3.1, the state-of-the-art modeling of gerotor pumps is reviewed, and in Section 3.3, the novel method of the viscous friction heating effect during the cold start of electric gerotor pumps is presented.

3.1. State of the Art Gerotor Pump Models

The use of 1D or lumped parameter models for the development of gerotor pumps can be justified by two arguments. First, due to the simplicity and low computing resources required by 1D simulations, a large number of model parameters can be modified in a short time and with manageable resources to analyze their influence. Second, the ability to integrate comparatively detailed pump models into complex systems that can only be simulated with 1D simulations.
An example of such a complex multi-physical model is shown in the following. In Figure 3, an electric gerotor pump model is represented with the entire electric circuit, the electric motor and the pump gear set [28].
Based on the Figure 4, which illustrates the simplified user interface to change the simulation inputs, the working principle of the gerotor pump can be shortly explained. The gerotor pump is a specific type of internal gear pump and is characterized by the tooth contour consisting of circular arcs on the outer rotor, which is why it is also known as a generated rotor (gerotor) [33]. In the chambers formed between the teeth of the inner and outer gears, the fluid is transported from the suction side (colored in blue in Figure 4) to the pressure side (colored in red), while being pressurized by the volume reduction of the chambers. According to [34], the profile of a gerotor can be described by a small set of parameters, as well as the analytical description of the inlet and outlet geometries of the pump by the use of functions of the rotational angles.
In Simcenter Amesim, a lumped parameter approach to model multi-physical systems is used [28]. In the case of the gerotor pump component seen in Figure 3, it is considered as an assembly of variable control volumes representing the internal fluid volumes between the teeth of the inner and the outer gears, as schematically illustrated in Figure 4 and Figure 5. Mass conservation equations are numerically solved in each of these volumes (called chambers) to obtain the pressure dynamics inside them.
The chambers are connected to the pump inlet or outlet volumes through flow restrictions (orifices) of varying flow area (see Figure 5). The flow area depends on the rotational angle of the pump, the geometry of the gears and of the inlet and outlet ports. Figure 6 shows the evolution of one chamber volume over a complete rotation of the outer gear, as well as the flow areas corresponding to the inlet and outlet ports.
The flow rate q o r i f through the orifices connecting internal volumes to inlet and outlet ports is modelled using a well-known law as described in [35]:
q o r i f = C q A 2 | Δ P | ρ
where
  • C q 
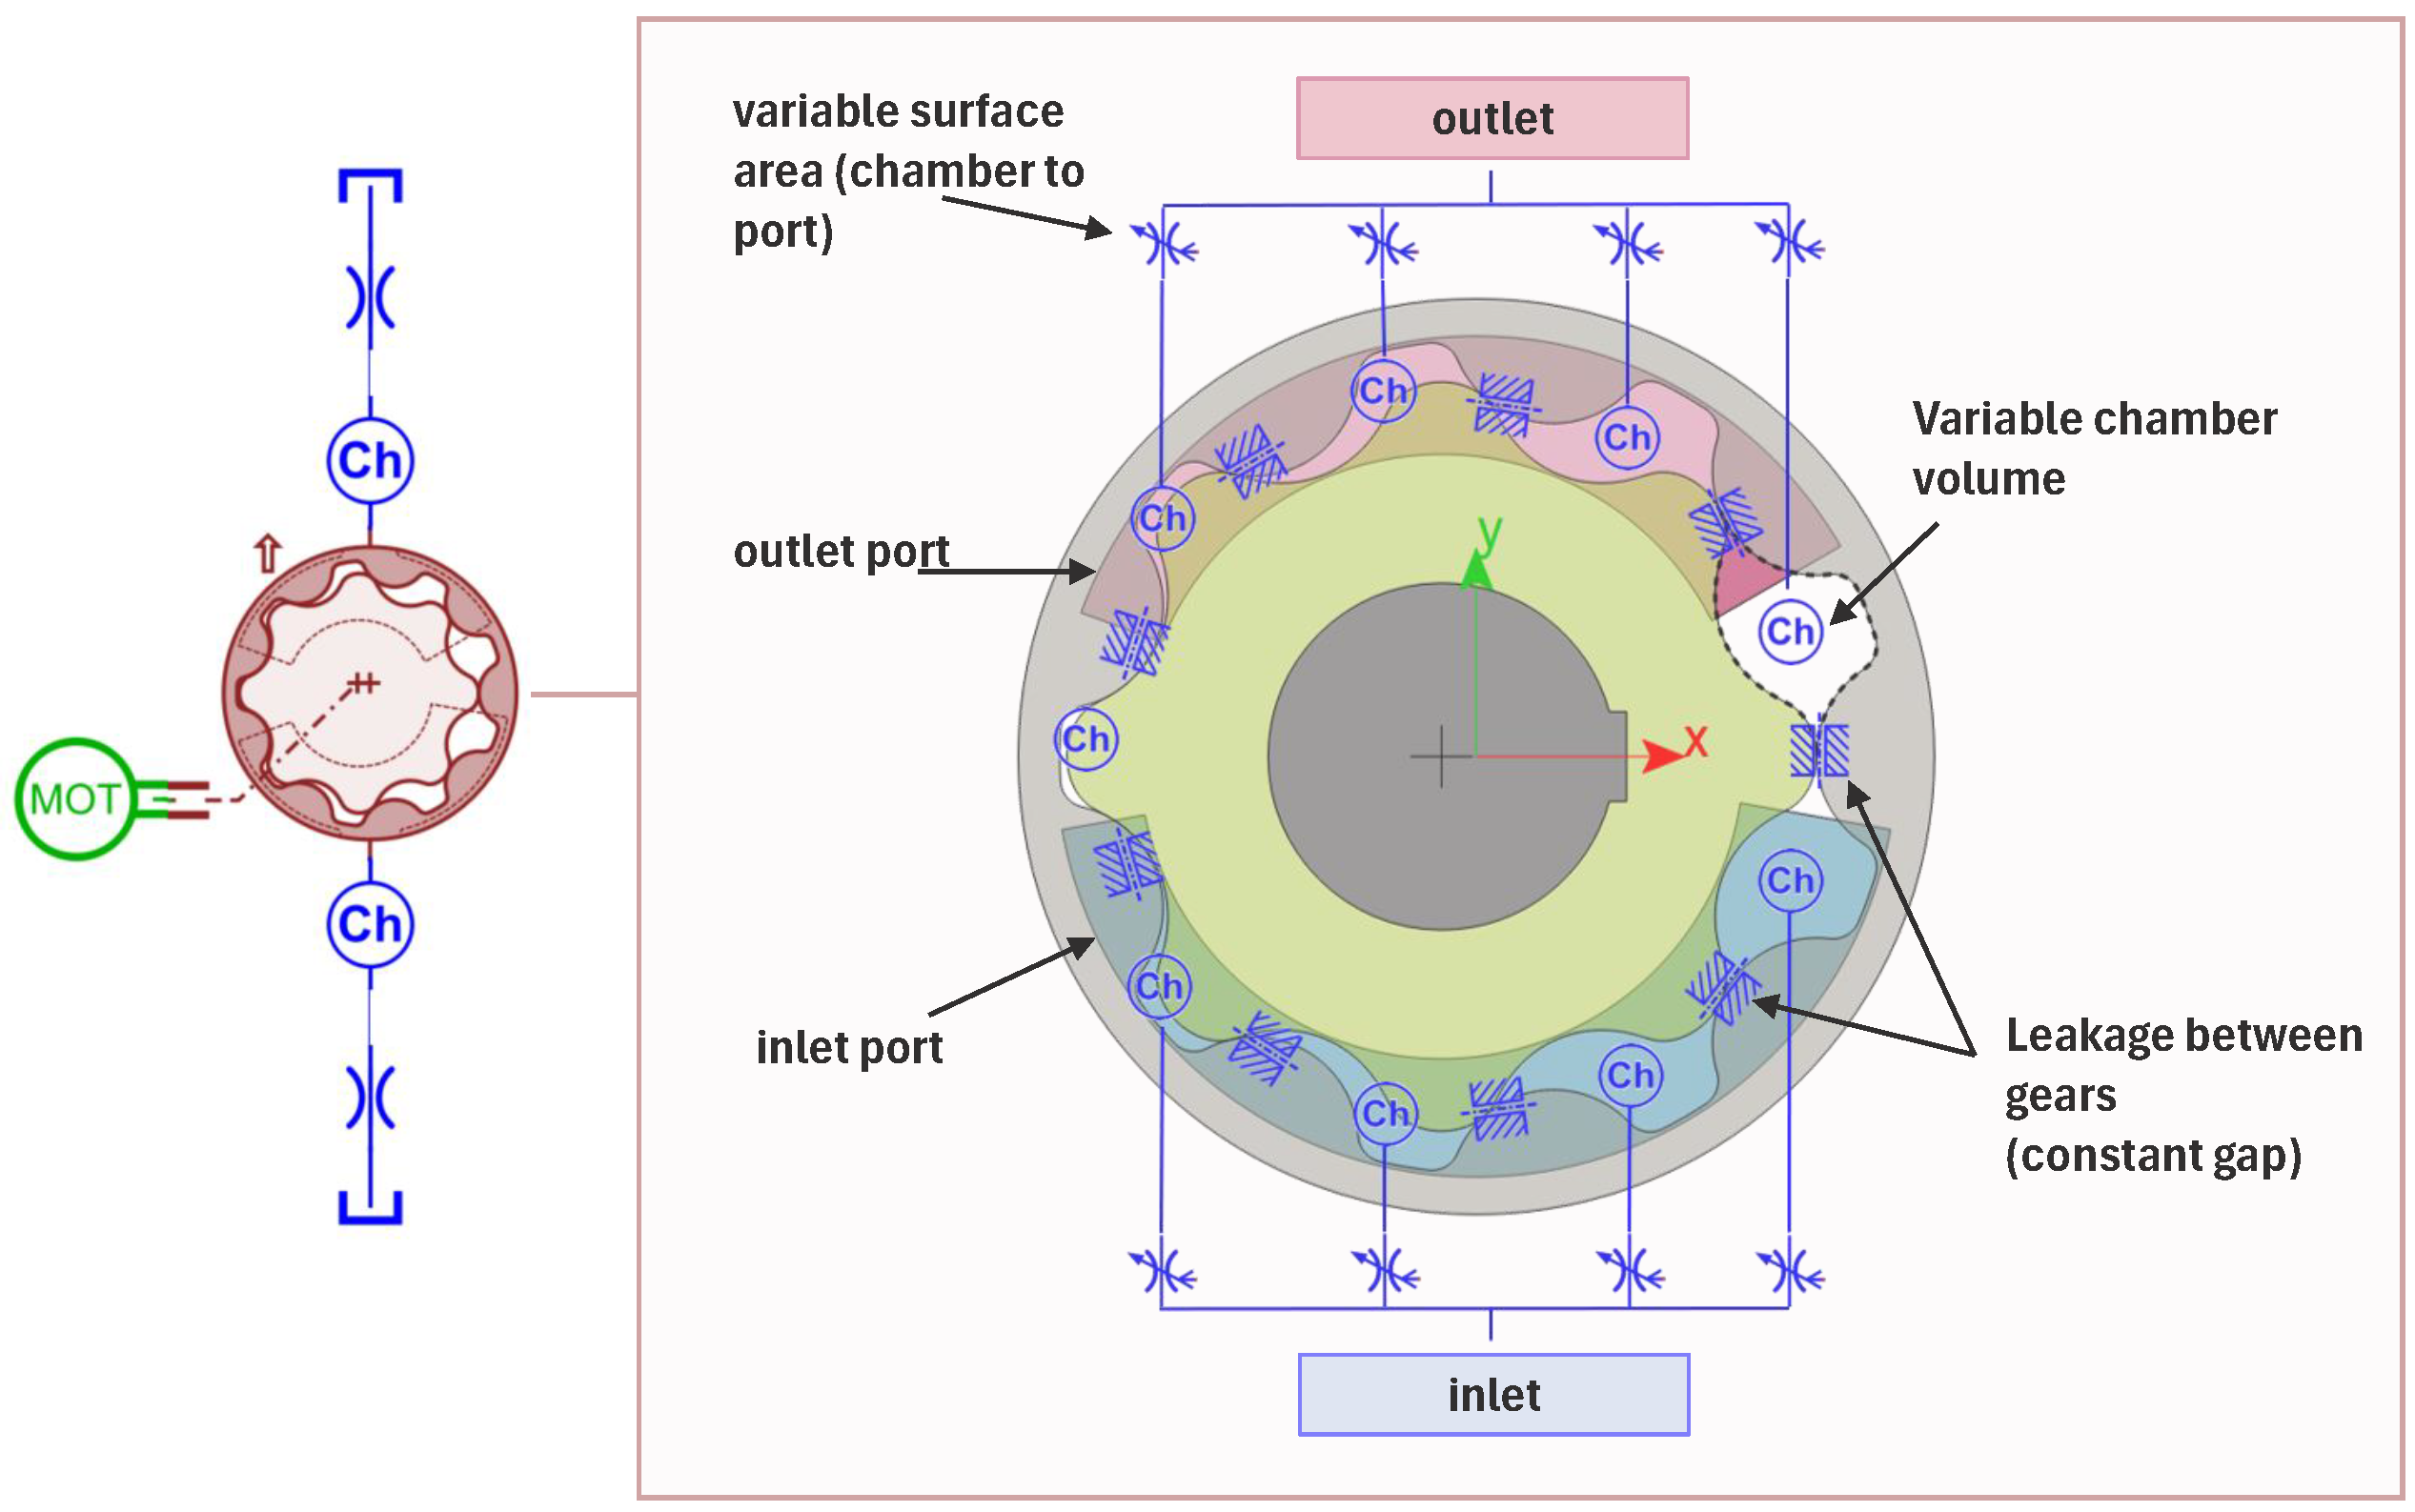
is the flow coefficient (function of the flow regime). This value can be estimated from CFD calculations or measurements. The value is here set to 0.7, based on the authors’ experience.
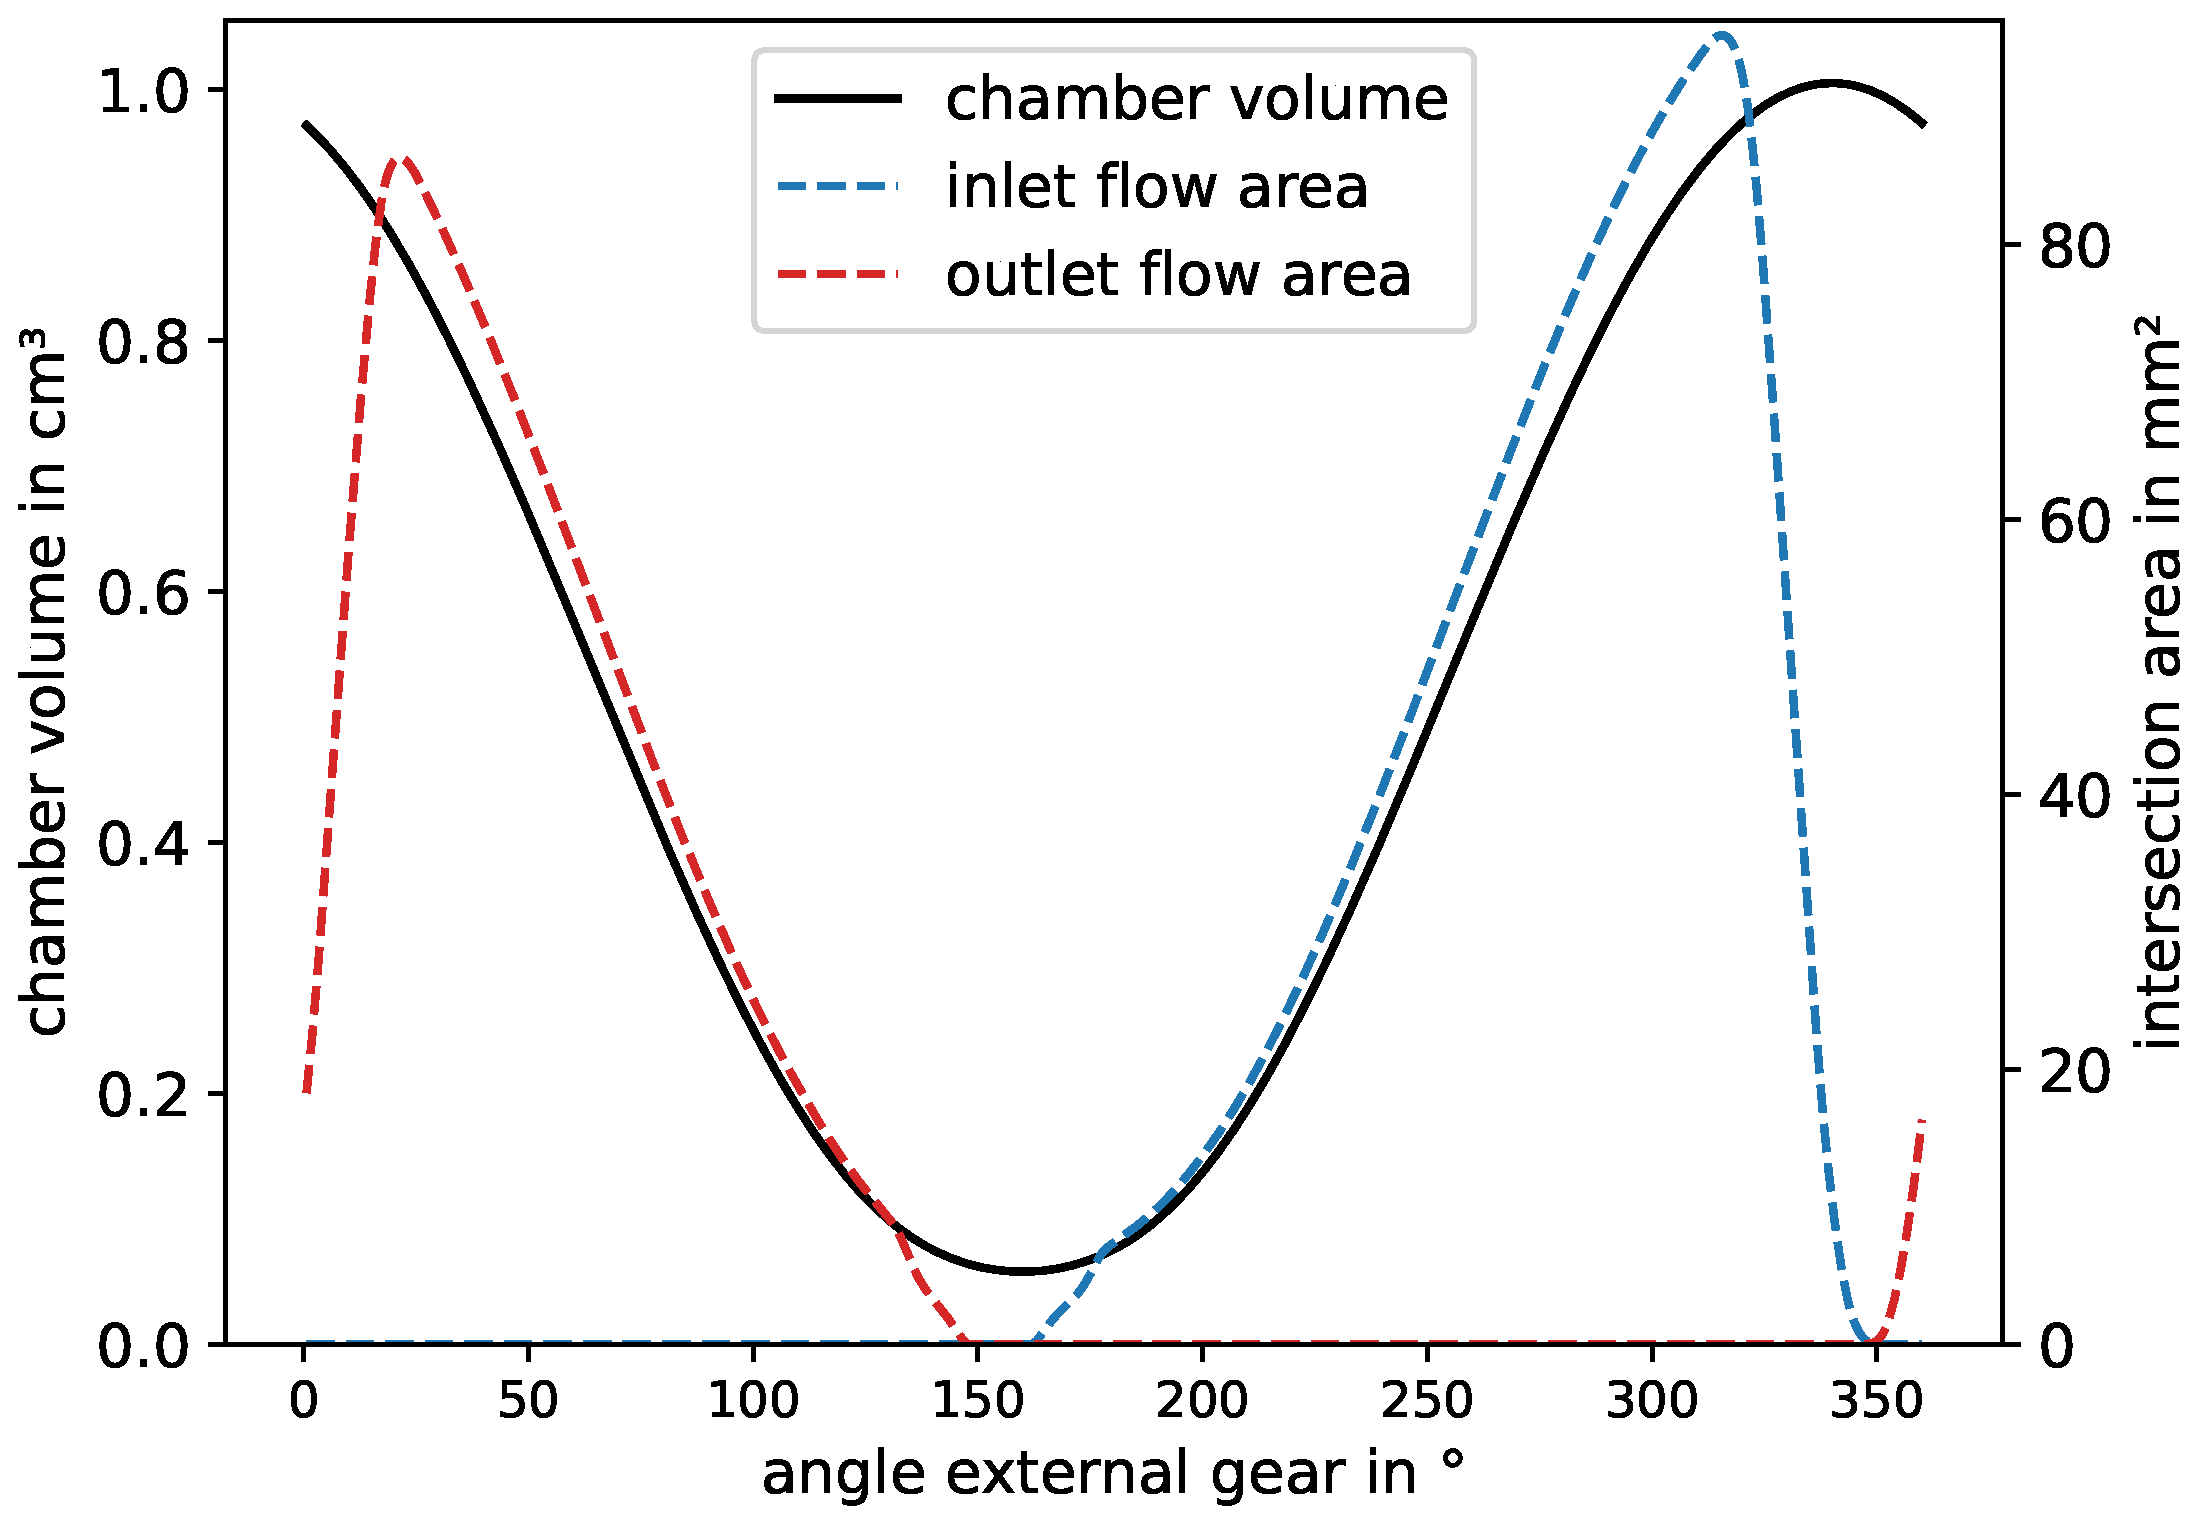
  • A is the flow area (function of chamber position and geometries of gears and ports).
  • Δ P is the pressure drop across the orifice.
  • ρ is the oil density.
Adjacent chambers are also connected together through laminar leakages occurring in the gap between the inner and outer gears’ teeth (see Figure 5).
Those leakages are modelled as a combination of Poiseuille and Couette laws in a rectangular channel, as described in [36]. The Poiseuille contribution is recalled in Equation (2):
q l e a k P = Δ P b δ 3 12 μ l
where
  • Δ P is the pressure drop across the leakage.
  • b is the gears’ thickness.
  • δ is the clearance between the inner and outer teeth.
  • μ is the oil absolute viscosity.
  • l is the gap length.
Note that here the gap between gears’ teeth is assumed to be known, and constant with the gears’ position. In addition, Equation (2) for the Poiseuille flow, as well as the equation for the Couette flow assume a laminar flow: it is possible to estimate some values of the Reynolds number R e = U D h / ν (U being the fluid relative velocity in the gap, D h the hydraulic diameter of the rectangular gap and ν the kinematic viscosity) to verify that this hypothesis is valid for the current study. Let us consider the following values for calculating the Reynolds number in the gap between the gears:
  • U 1 m/s (roughly estimated from the outer diameter of the outer gear given in Table A1 and a shaft speed of 3000 rpm).
  • D h = 0.2 mm (from gear width in Table A1 and a gap of 0.1 mm).
  • ν 5000 cSt (at −30 °C) and ν 10 cSt (at 100 °C), for standard lubricating oil.
One can then obtain a Reynolds number in the range [0.04; 20], which satisfies the laminar hypothesis.
Knowing the flow rates entering or exiting the different chambers will allow us to compute the overall pump flow rate and, as a consequence, the volumetric efficiency. To obtain the total efficiency of the gerotor unit, it is also necessary to evaluate the friction inside the pump, since it will impact the hydro-mechanical efficiency.
The friction characteristic of a gerotor pump can be compared with a conventional lubricated radial journal bearing, as shown in Section 3.3 and Section 4. Depending on the Gümbel–Hersey number (GHZ), which is calculated by the dynamic viscosity η , the angular velocity ω and the specific load ρ ¯ , the friction number is calculated and the three ranges of boundary lubrication, mixed lubrication and hydrodynamic lubrication can be defined [37]. The GHZ is represented in Equation (3) [38]. In the context of the method developed in this paper, only hydrodynamic lubrication is considered, although other friction states may occur at very low pump speeds, high pump pressures or unfavorable viscosity-to-load ratios.
G H Z = η ω ρ ¯
The chosen approach for modelling the viscous friction in the gerotor pump has similarities with the one described in [22]: the hydro-mechanical friction torque on the shaft M v f r i c is decomposed into four terms:
M vfric = M igs + M egs + M egh + M brg
with
  • M igs 
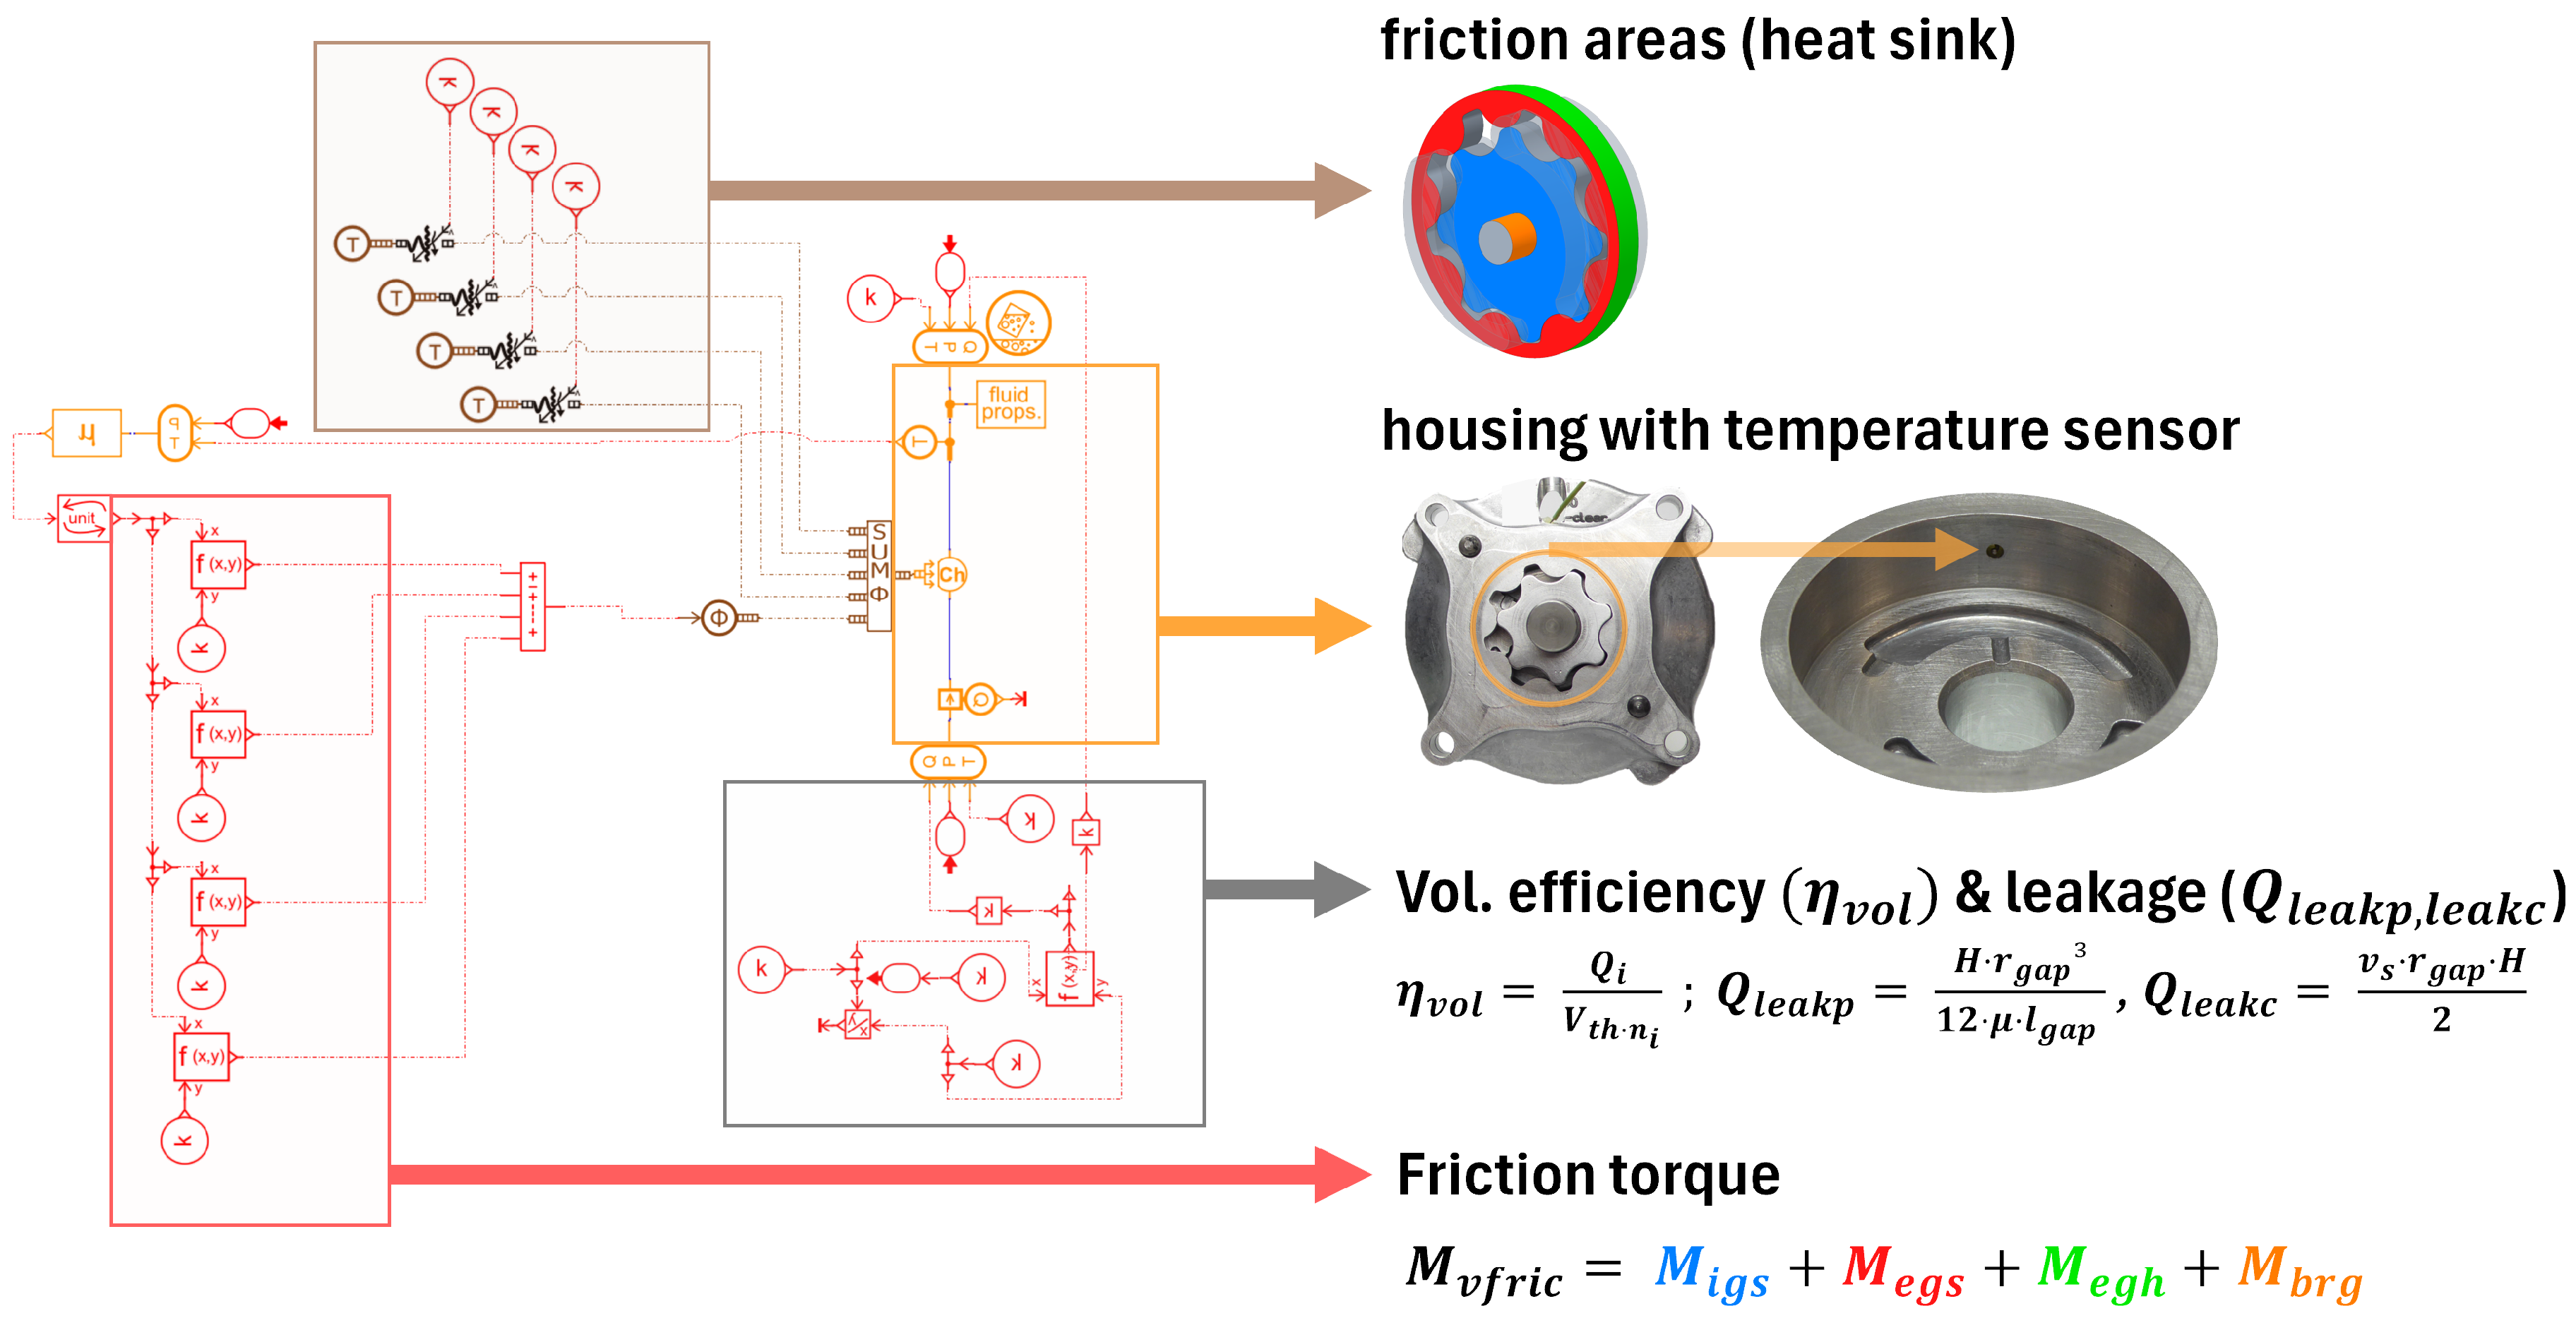
the viscous friction torque between the inner gear sides and the housing.
  • M egs the viscous friction torque between the outer gear sides and the housing.
  • M egh the viscous friction torque between the outer gear cylindrical surface and the housing.
  • M brg the viscous friction torque at the shaft bearing.
The last two torques are modelled as in [22], using Petroff’s equation [39]. The use of this equation is based on the fact that the flow distribution in the gap between the cylinders is linear in the radial direction, because of the small gap compared to the cylinders’ diameters and because the leakages at both cylinders’ ends are neglected. This assumption will be further used when discussing thermal aspects in the oil film in Section 3.3. One limitation that can be noted here is that possible eccentricities of the cylinders are not taken into consideration, even though they can affect the viscous friction.
Regarding the friction between gear sides and housing, a different method than the one presented in [22] is developed. The modelling approach described in [22] is an analytical one. Because of the complexity of the involved geometries (gears and ports), such an approach presents a limitation: the friction surface, where the oil film develops, cannot be evaluated precisely. The current study proposes a numerical approach to better consider the real friction surface, with the aim of developing a more predictive model.
Several assumptions are made on the oil flow between the rotating gear and the fixed housing in order to derive an expression for the shear stress in the oil film, and ultimately an expression for the viscous torque on each gear side:
  • The rotating speed of gears is fixed and the flow is stationary.
  • The flow is only tangential (no radial or axial velocity).
  • The tangential velocity only depends on radial and axial coordinates.
  • There is no pressure gradient; the flow is only driven by viscous forces induced by the rotation of gears.
From the Navier–Stokes equations (mass conservation, momentum conservation and boundary conditions of fluid adhering to walls) it is possible to derive an analytical expression for the shear stress τ and for the infinitesimal torque on the gear side:
τ = η ω r h
where η is the dynamic oil viscosity, r the radial coordinate and h the gap between the gears and the housing. The infinitesimal torque is then numerically integrated on the friction surfaces of gears’ sides. This approach allows us to consider the real geometry of the gears (teeth profile, inner gear hole, outer diameter of outer gear) and of the inlet and outlet ports.
However, the flow distribution in such a configuration can be quite complex and the mentioned simplifications should be further validated.

3.2. Validation of Gerotor Pump Template

In order to validate the gerotor pump template in Simcenter Amesim, various pumps were tested on the test bench at different operating points by measuring their volumetric and mechanical performance and comparing this data with the simulations. The following Figure 7 shows an excerpt from the validation runs. A gerotor pump was measured and simulated at temperatures ranging from 30 °C to 110 °C oil temperature, and system pressures of 5 bar and in a speed range of 1000–5000 rpm.
The top row of plots in Figure 7 shows both the measured and the calculated volumetric flow rates of the oil pump. The influence of the increasing temperature and therefore decreasing viscosity of the fluid, as well as the varying pump gap sizes on the maximum achievable volumetric flow rate of the gerotor pump with the same boundary conditions can be clearly seen.
The bottom row of plots in Figure 7 shows the overall efficiency ( η t ) of the pump. The overall efficiency can be calculated from the ratio of hydraulic to mechanical power. The corresponding correlation is shown in Equation (6).
There q v s refers to the leakage flow, Δ p to the operating pressure difference, n to the pump speed, T s to the torque losses and P m to the drive power [40].
η t = q v s Δ p + 2 π n T s P m
In contrast to the very accurate flow rate prediction and the precise prediction of the overall efficiency of the pump at higher oil temperatures, a significant deviation at 30 °C is noticeable. At low speeds, the efficiency prediction still matches accurately, but as the speed increases, the simulated efficiency deviates increasingly from the real measured overall pump efficiency. A more detailed analysis showed that the loss torques ( T s ) from Equation (6) from the simulation were too high. The speed-dependent deviation can be seen in detail in Figure 8.
Due to the accurate correlation between the measured data and the simulation data in terms of flow rate and overall efficiency of the pump, it is possible to formulate the hypothesis that an unknown physical phenomenon occurs at low temperatures, which has not been sufficiently considered or not considered at all. Consequently, Section 3.3 deals exclusively with the phenomenon at lower temperatures down to 40 °C and a novel approach of modeling the viscous friction heating.

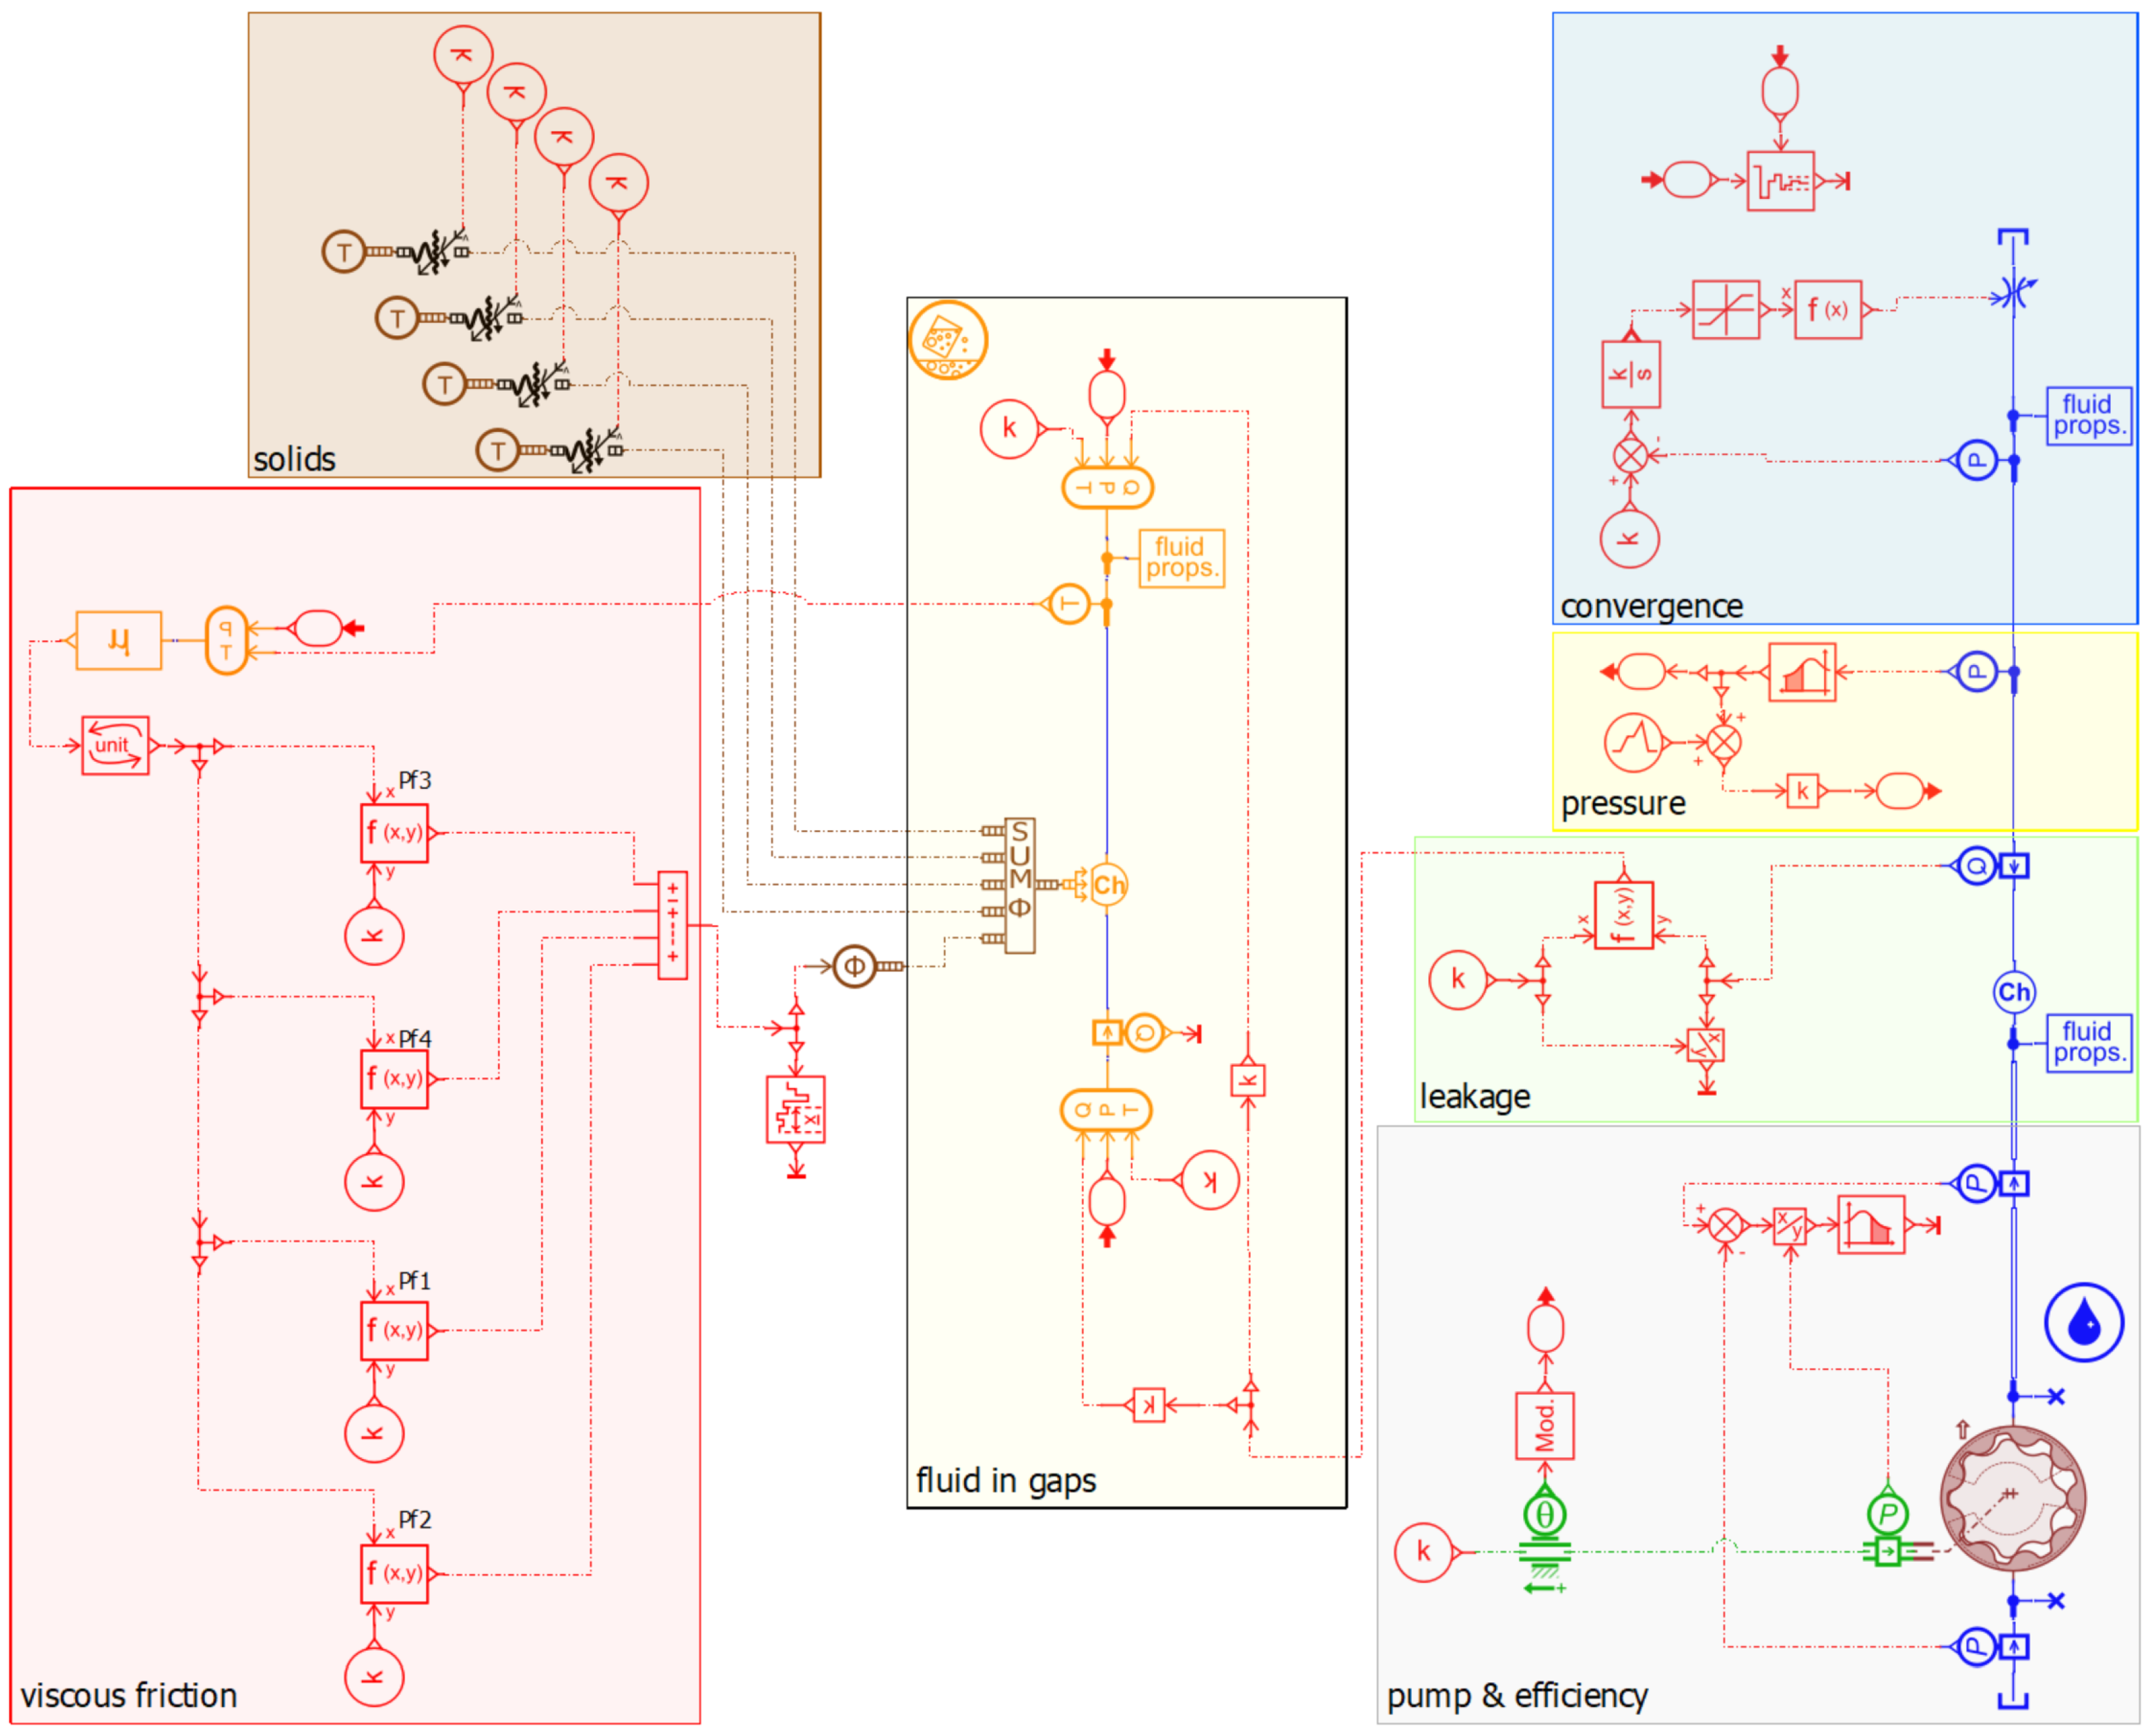
3.3. Modeling the Viscous Friction Heating

According to [38], the frictional power generated in the journal bearing is a power loss and is almost completely converted into heat. As already shown by [11], the radial friction surface on the outer gear is the dominant friction power source in regards to the power loss of the pump. Therefore, its influence and the prevailing conditions are focused. In order to investigate both statements and the influence of bearing friction on the temperature of the pump and the resulting friction power, a gerotor pump was modified so that a temperature sensor could be installed in the gap between the housing and the outer gear. The specifications of the gerotor pump are shown in Appendix A. Afterwards, the pump was tested in a climate test cell at various operating points between 40 °C and + 20 °C. The gear set and the modified pump housing with a mounted temperature sensor can be seen in Figure 9.
Examples of the measurements are shown in Figure 10, showing how the temperature in the gaps changes significantly in a short time (<60 s) and how strongly they influence the torque on the pump shaft.
Measurements are shown for a starting temperature of 36 °C (blue curves) and 25 °C (orange curves). The almost steady end temperature, approximately 25 °C with an increase of +11 K, or approximately 19 °C with an increase of + 6 K, also has a significant impact on the required pump torque. At 40 °C for example, the torque reduces from initially 6 Nm (after hydrodynamic lubrication is established) to 2 Nm once the steady-state temperature is reached.
For the further modeling, it is important to focus on the prevailing flow conditions. If the rotating annular gap is regarded as a “sliced” channel with a stationary and a moving wall, the simplified result is Figure 11. The heat generated from the frictional power is partially transferred to the heat sinks (the fixed wall of the housing and the moving wall of the outer rotor). The prevailing flow with a fixed outer cylinder and a rotating inner cylinder is also referred to as Taylor–Couette–Poiseuille flow, where a Taylor–Couette flow exists with an axial Poiseuille flow [41]. The temperature and thereby the kinematic viscosity of the oil varies significantly ν 5000 cSt (at 30 °C) and ν 10 cSt (at 100 °C), which is why the flow indicators also vary. As already shown in Section 3.1, the Reynolds number varies in a range of [0.04; 20] and the Taylor number according to the geometric boundary conditions of the pump from Appendix A due to the gap ratio (inner diameter/outer diameter > 0.99) indicates that no more Taylor vortices occur. Therefore, a laminar Couette–Poiseuille flow can be assumed.
If the flow conditions are studied by dimensional analysis, four dimensionless products can be determined using a dimensional matrix (see Appendix B Table A2) shown in Equations (7)–(10). The dimensional matrix is constructed from the dimension exponents of the following dimensional variables: density ρ , dynamic viscosity η , thermal conductivity λ , thermal diffusivity α , velocity of the fluid u and the geometric variables of the gap height h and the gap length L. The resulting four dimensionless products are
π 1 = R e = ρ u h η
π 2 = P r = c p η λ
π 3 = L h
π 4 = N u = α h λ
The dimensionless Nusselt number can be used to describe the heat exchange between a flowing fluid and a fixed solid [42]. The Nusselt number can be determined as a function of the Reynolds and Prandtl numbers. The general formula is given in Equation (11) and shows the Nusselt dependency on the location x * , the Reynolds number R e and the Prandtl number P r .
N u = f ( x * , R e , P r )
There are various approaches in the literature for the special case of circular gaps. For example, the Dittus–Boelter equation can be used as a possible approach for determining a correlation [42]. However, since this case involves a shear flow and the expected Reynolds number is very low, other correlations for rotating annular ducts should be considered as well [41]. For this purpose, ref. [43] provides an overview of common correlations for different mediums, different Reynolds number ranges and different geometric ratios.
To find a suitable correlation for the prevailing conditions, the following abstract thermal model was created. In the first step, the model is considered as a stand-alone model without a detailed pump model that focuses exclusively on the physical phenomenon of heat transfer due to the temperature differences caused by viscous friction at different operating points. The model shown in Figure 12 describes the heat and friction effects in the gerotor pump. The model contains several color-coded areas in which components are arranged that describe the respective sub-problems of the physical phenomenon. One of the main model components is the housing with a temperature sensor, which is shown in the orange box. The temperature sensor in the model is the same as the temperature sensor in the modified pump housing. The chamber represents the volume of all fluid in the pump’s gaps. In addition, there are the friction surfaces, which represent heat sinks with a constant temperature boundary condition (brown box). This can be implemented as the heat capacity (thermal mass) of the housing and gear set which is much higher compared to one of the fluid in the gaps of the pump. In addition to the volume of fluid in the gaps, a simplified pump model is also modeled in the grey box. In this case, an operating point is represented by the expected system pressure and the volumetric efficiency of the pump. Based on the resulting leakage flow and the prevailing system pressure, an additional volumetric flow rate is calculated, which flows through the hydraulic chamber of the pump gap. The friction power responsible for the viscous friction heating is calculated from the friction torque equations already introduced (Equation (4)).
With this model and the known geometric boundary conditions, in the next step the model was fitted to the measurements from the series of tests in the climate chamber. Various Nusselt numbers were tested in the components between the solids (temperature sources in the brown box) and the fluid chamber using a parameter study, until the same temperature was reached at the virtual temperature sensor as in the experimental measurements in reality. Additionally to the determined Nusselt number for each operating point, the linked Reynolds and Prandtl numbers in the components were evaluated. The evaluation of the Nusselt number in comparison to the prevailing Reynolds and Prandtl numbers can be seen in Figure 13. For a general applicability of the method and to be able to use the method for the prediction of cold start behavior in the future, various correlation terms were tested and optimized for the application using a curve parameter fit. A common Ansatz of correlation can be seen in Equation (12).
N u = a R e b P r c
The parameters a , b , c were determined using the curve fit algorithm scipy.optimize.curv_fit for the coefficients shown in Equation (13). The test and training data from the tested operating points are also shown to be exemplary in Figure 13.
N u = 0.0015 R e 0.59 P r 0.81
To further verify the determined correlation, a portfolio analysis was performed on the test and training data using a symbolic regression method as presented in [44,45]. This involved testing 100,000 possible correlations and evaluating their performance relative to the complexity of the equation in a Pareto front. The correlation shown in Equation (13) was identified with a complexity rank of 8 (defined in [44,45]) while achieving a precise prediction accuracy. Exemplary examples from portfolio analysis and the Pareto front are shown in Appendix C Figure A1 and Table A3. The selected optimization fit, the fit from the symbolic regression and an approach in which the function was logarithmized and then fitted with a linear regression all show a similar prediction accuracy (see Appendix D Figure A2). Since the symbolic regression did not lead to more precise models, Equation (11) is used in combination with the known approach of logarithmization and determination of the parameters using the least squares method due to the determinism of the resulting coefficients (see Appendix D).
The deviation of the correlation shown in Equation (13) from the more common correlation like the Dittus–Boelter Equation [42] can be explained by specific operating conditions in the gap of the pump. Particularly relevant factors are the very low oil temperatures in the journal bearing, the low gap height, the low Reynolds numbers and the high Prandtl numbers. Very low oil temperatures lead to a higher viscosity of the oil, which reduces the turbulent flows and increases the shear forces. This influences the heat transfer properties and leads to an adapted Nusselt number correlation. The low height of the gap increases the effect of viscous forces, resulting in a more laminar flow, whereas the Ditus–Boelter correlation, for example, is based on higher Reynolds numbers and turbulent flow conditions. In more laminar regions, the influence of the Reynolds number on the Nusselt number is lower, which probably explains the lower exponents. High Prandtl numbers indicate a lower heat conduction in the fluid in relation to a very high viscosity, which can also explain the changed exponent.

4. Results

Applying the determined correlation, the model component was adapted so that the calculation from the fluid to the solid side could be simulated at various operating points. As shown in Figure 14, a very high accuracy can be achieved in the prediction of the temperature in the gap between the outer gear and the housing. The precise temperature prediction at both negative and positive temperatures (from 40 °C to + 20 °C) is also crucial for the selected objective of this study. Figure 14 shows the measurement (blue bars) and the simulation from the viscous friction heating model (orange bars). The 5% error bars symbolize the variance of the measurement in relation to the absolute value at the operating point. Possible effects for the variance are discussed in Section 5.
Following the successful temperature prediction, the next step was to integrate the viscous friction model into the overall pump simulation. For this purpose, the previously simplified models of the pressure and leakage simulation were replaced by input variables from the pump model. The more complex model with the highlighted sub-models is shown in Figure 15 below. On the left side of Figure 15 is the previously explained model for the viscous friction heating. On the right-hand side, arranged from bottom to top, the gray box contains the vector component of the pump and the overall efficiency calculation, the green box contains the leakage flow calculation, the yellow box above contains the pressure calculation and the blue box shows the convergence criteria calculation.
Figure 16 shows the measured torque (blue curve) and the two simulated torque values for the pump shaft of the models with and without viscous friction heating at 20 °C, 1500 rpm pump speed and 6 bar system pressure. The calculated torque of the model without viscous friction heating (dotted red line) is very close to the initial torque after hydrodynamic lubrication has been established (approx. after 2 s). The model with viscous friction heating (dotted green line), on the other hand, is very close to the mean value of the measured steady-state torque after approx. 30 s. This shows that with the developed method not only the gap temperatures (Figure 14) can be predicted very accurately, but also that the resulting viscosity change leads to a very accurate simulation of the pump shaft torque by using the integrated model approach of Figure 15.

5. Discussion

The main limitation of the presented method is momentarily its limited generalizability to other pump topologies due to the use of a single pump during the method development. The results obtained until now are based entirely on one specific pump type, which limits the generalization to other pump models more so than to gerotor pumps. Future research should therefore expand the method by considering other pump topologies and associated experimental measurements to ensure an even more generic representation method.
Another decisive point is the sensitivity of the simulation results to the geometric conditions in the gaps of the pump. An exact prediction requires extremely precise knowledge of the geometric properties of the pump, as otherwise the accuracy of the prediction can be significantly affected.
The measurements in the climate chamber represent an additional challenge and limitation, as they are costly, complex and each individual measurement requires long cooling times. This limits the number of measurements that can be performed and may also lead to disturbance variables. In particular, the inhomogeneous cooling of the housing can lead to varying effects on the cooling of the fluid in the gaps, which could affect the reproducibility of the results.
Furthermore, the eccentric alignment of the pumps’ gear set is another important factor. If the outer rotor aligns on one side of the housing, local heat hotspots may occur. Depending on the position of the hotspots, these can affect the measurement at the temperature sensor and consequently falsify the measurement results or limit their reproducibility. Future investigations should therefore examine in detail how this rotor position affects the system thermally and whether its influence on the friction power could be neglected if averaged over the entire bearing.
The approach shown in this study combines and extends the existing research approaches of [22], which calculate the viscous friction analytically, or [20], which describe the modelling of the gerotor but focus only on the volumetric flow rate and the volumetric efficiency calculation. Also worth mentioning are [23], which, in addition to our approach, also analyzes the position of the gear set in the housing, or [21], which also covers the optimization of gear tooth shapes for improved acoustics. However, none of the research approaches identified in this paper consider the effect of viscous friction heating in combination with the novel numerical viscous friction calculation integrated in a multi-physics simulation environment, which has the potential to offer significant benefits in the design of electric oil pumps in the future.

6. Conclusions

The presented research provides a method for developing gerotor pumps with the highest possible digital reliability towards the pump design requirements defined by the customer. Furthermore, the simulation environment created with graph-based design languages enables a more reliable and fully digitally integrated prediction of pump performance, reducing the need for extensive physical testing and accelerating the development process by an order of magnitude (days instead of weeks).
The selected research objectives of this paper were successfully achieved as follows:
  • By identifying and understanding previously observed deviations in the pump performance predictions at low temperatures and high viscosities, the present study provides a basis for an accurate simulation and prediction of the pump behavior at various conditions ranging from 40 °C to + 110 °C by the developed novel approach for calculating the viscous friction.
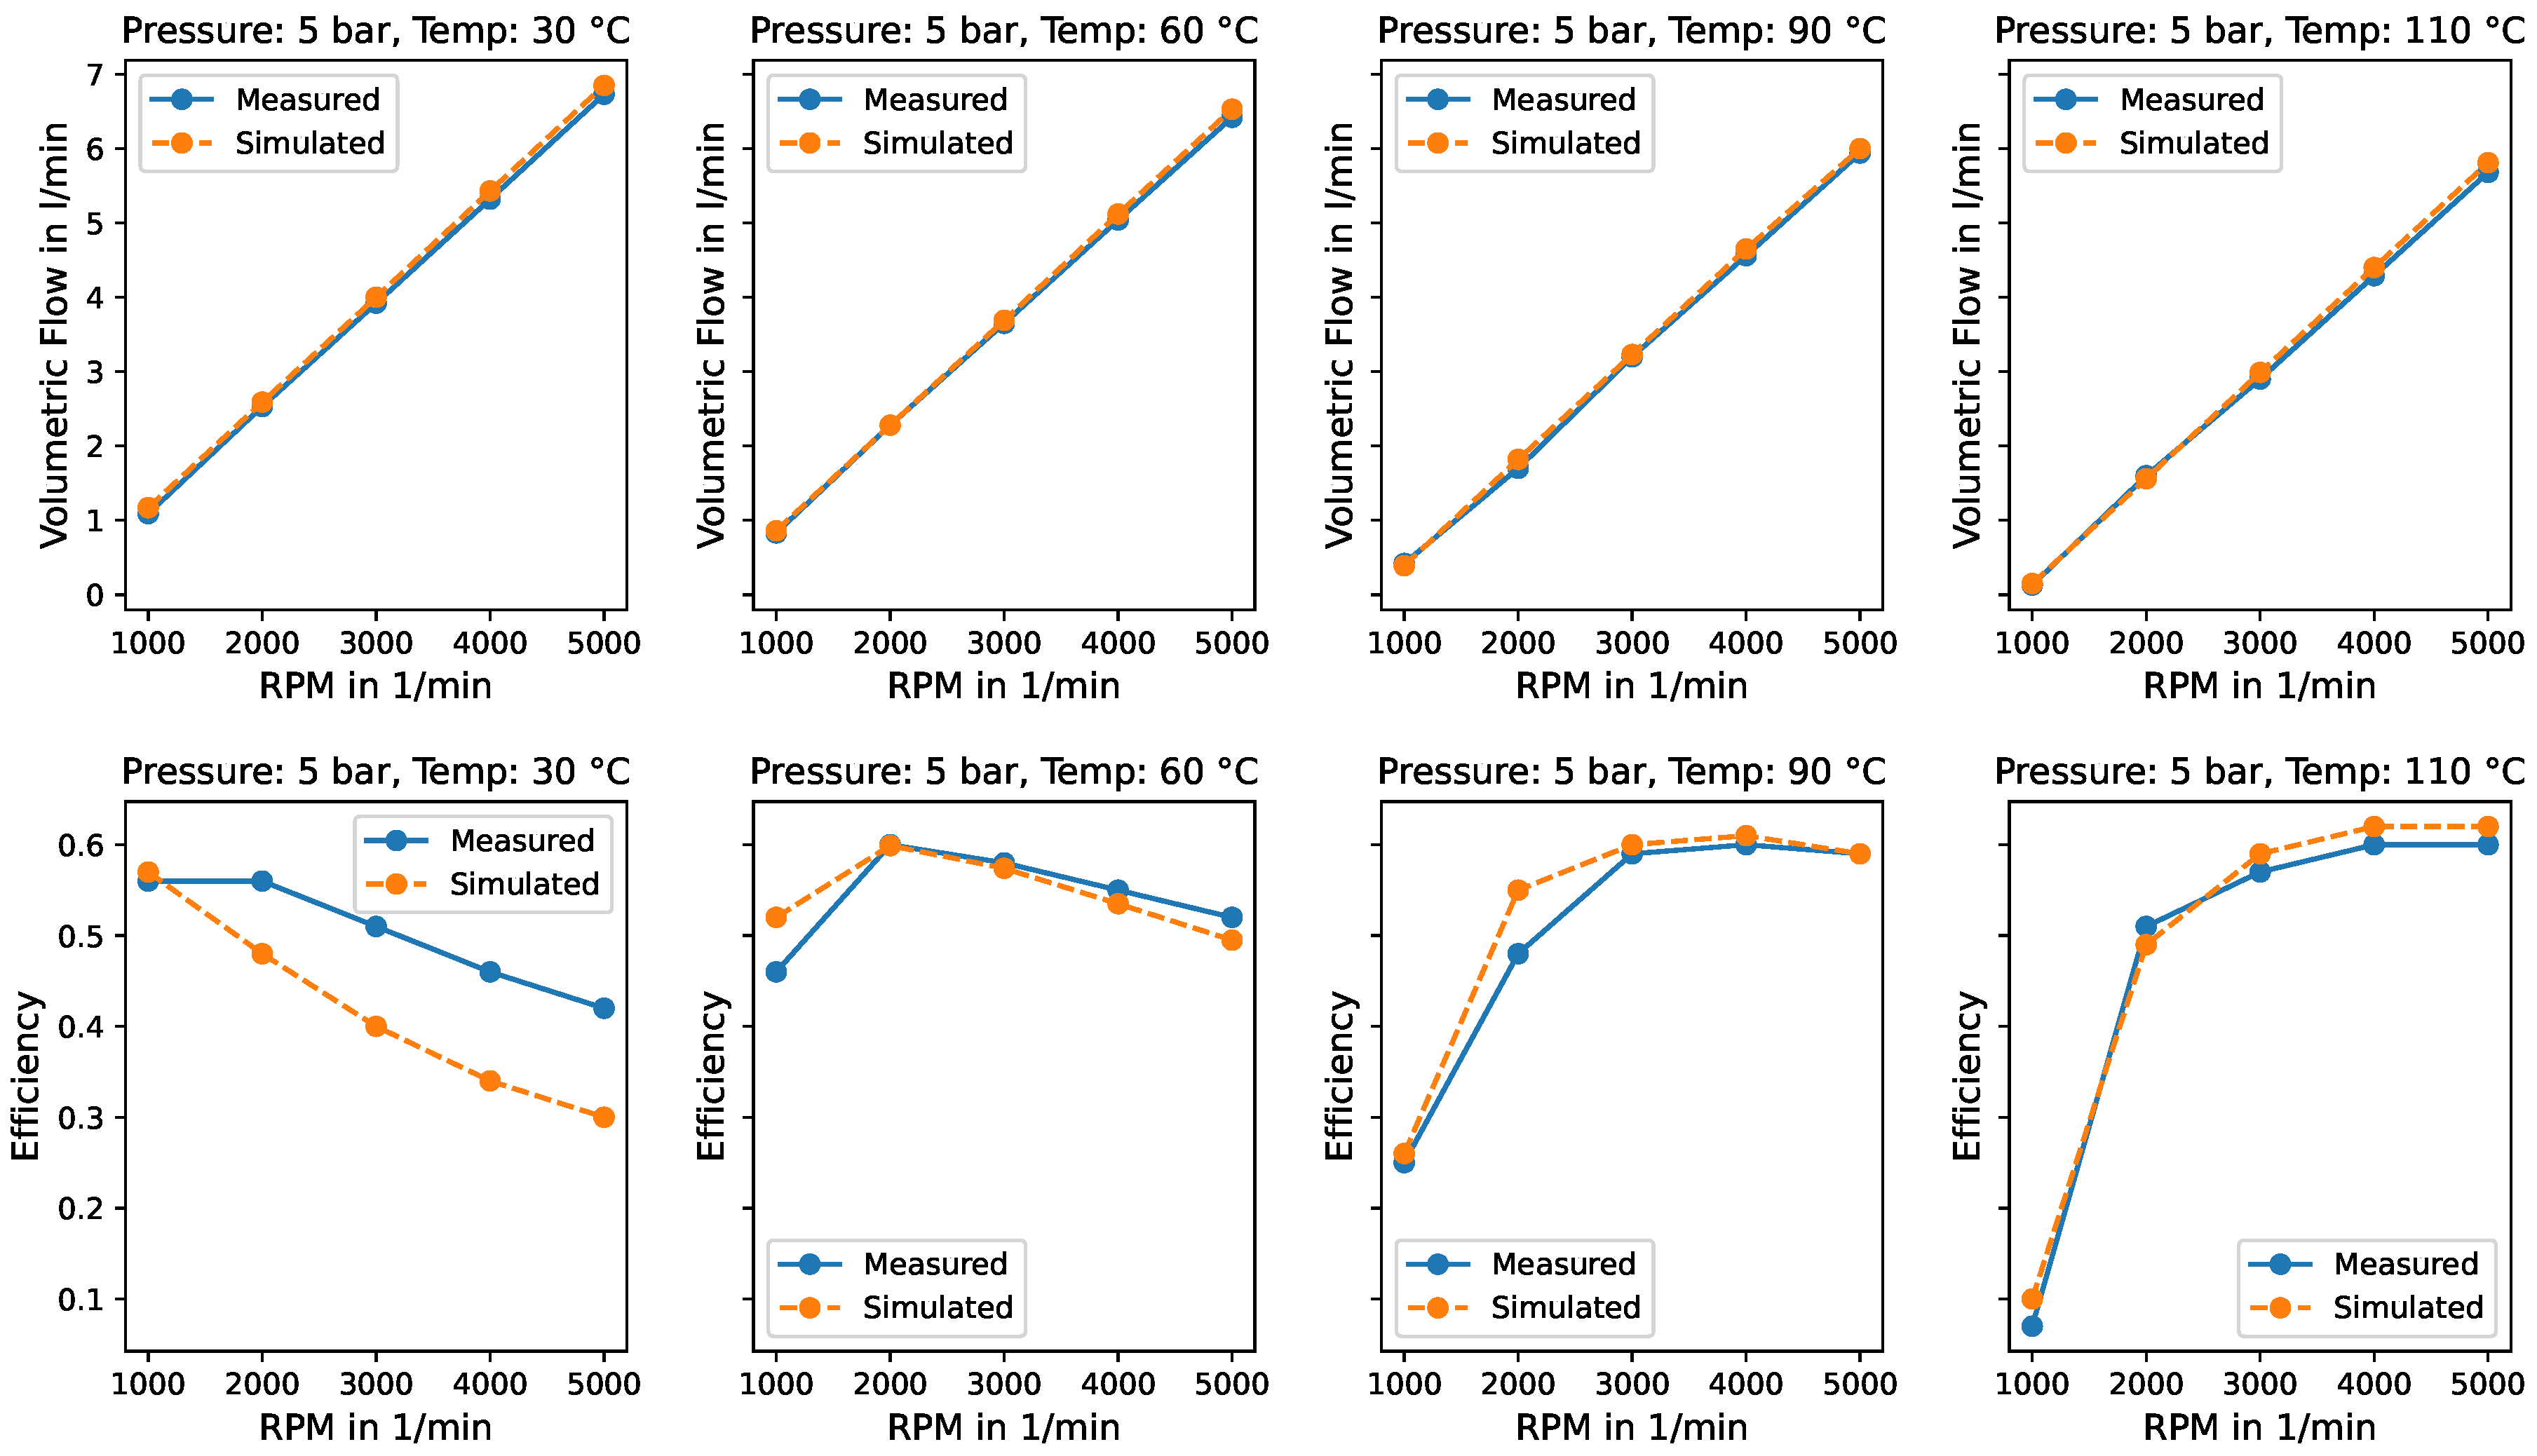
  • The development of such a powerful and experimentally validated simulation environment represents a significant step forward and provides high accuracy and confidence when compared to laboratory measurements, especially in terms of volumetric flow rate (<5%), pump torque and efficiency (<7%) at different temperature and viscosity conditions over a wide speed range (1000–5000 rpm) and different system pressures (0.5–5 bar).
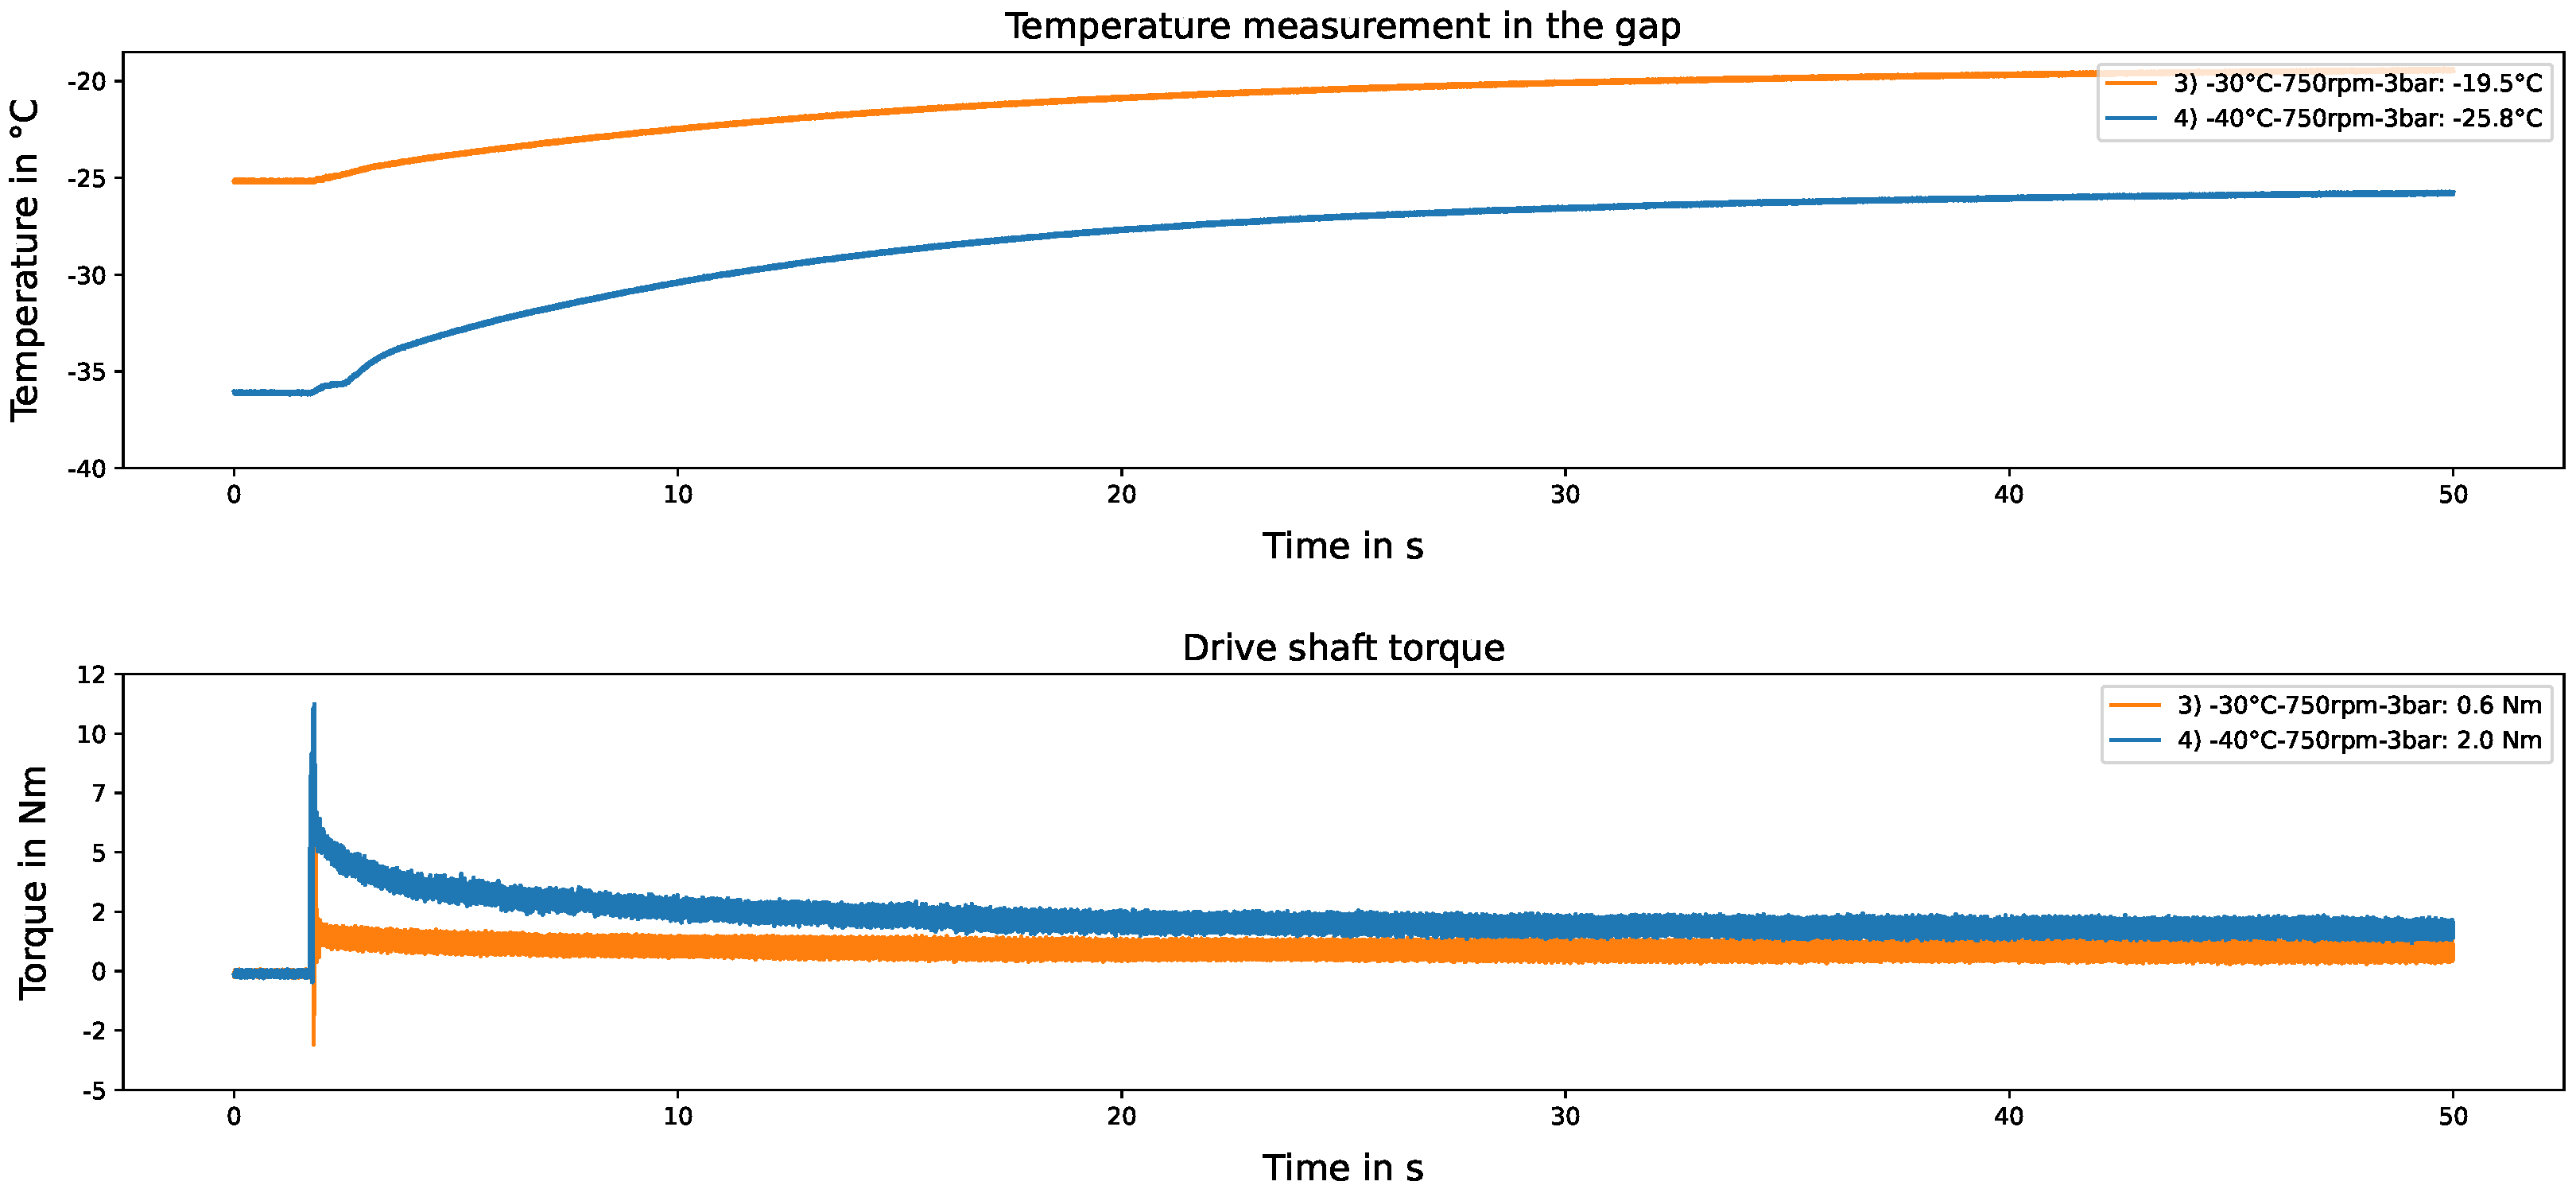
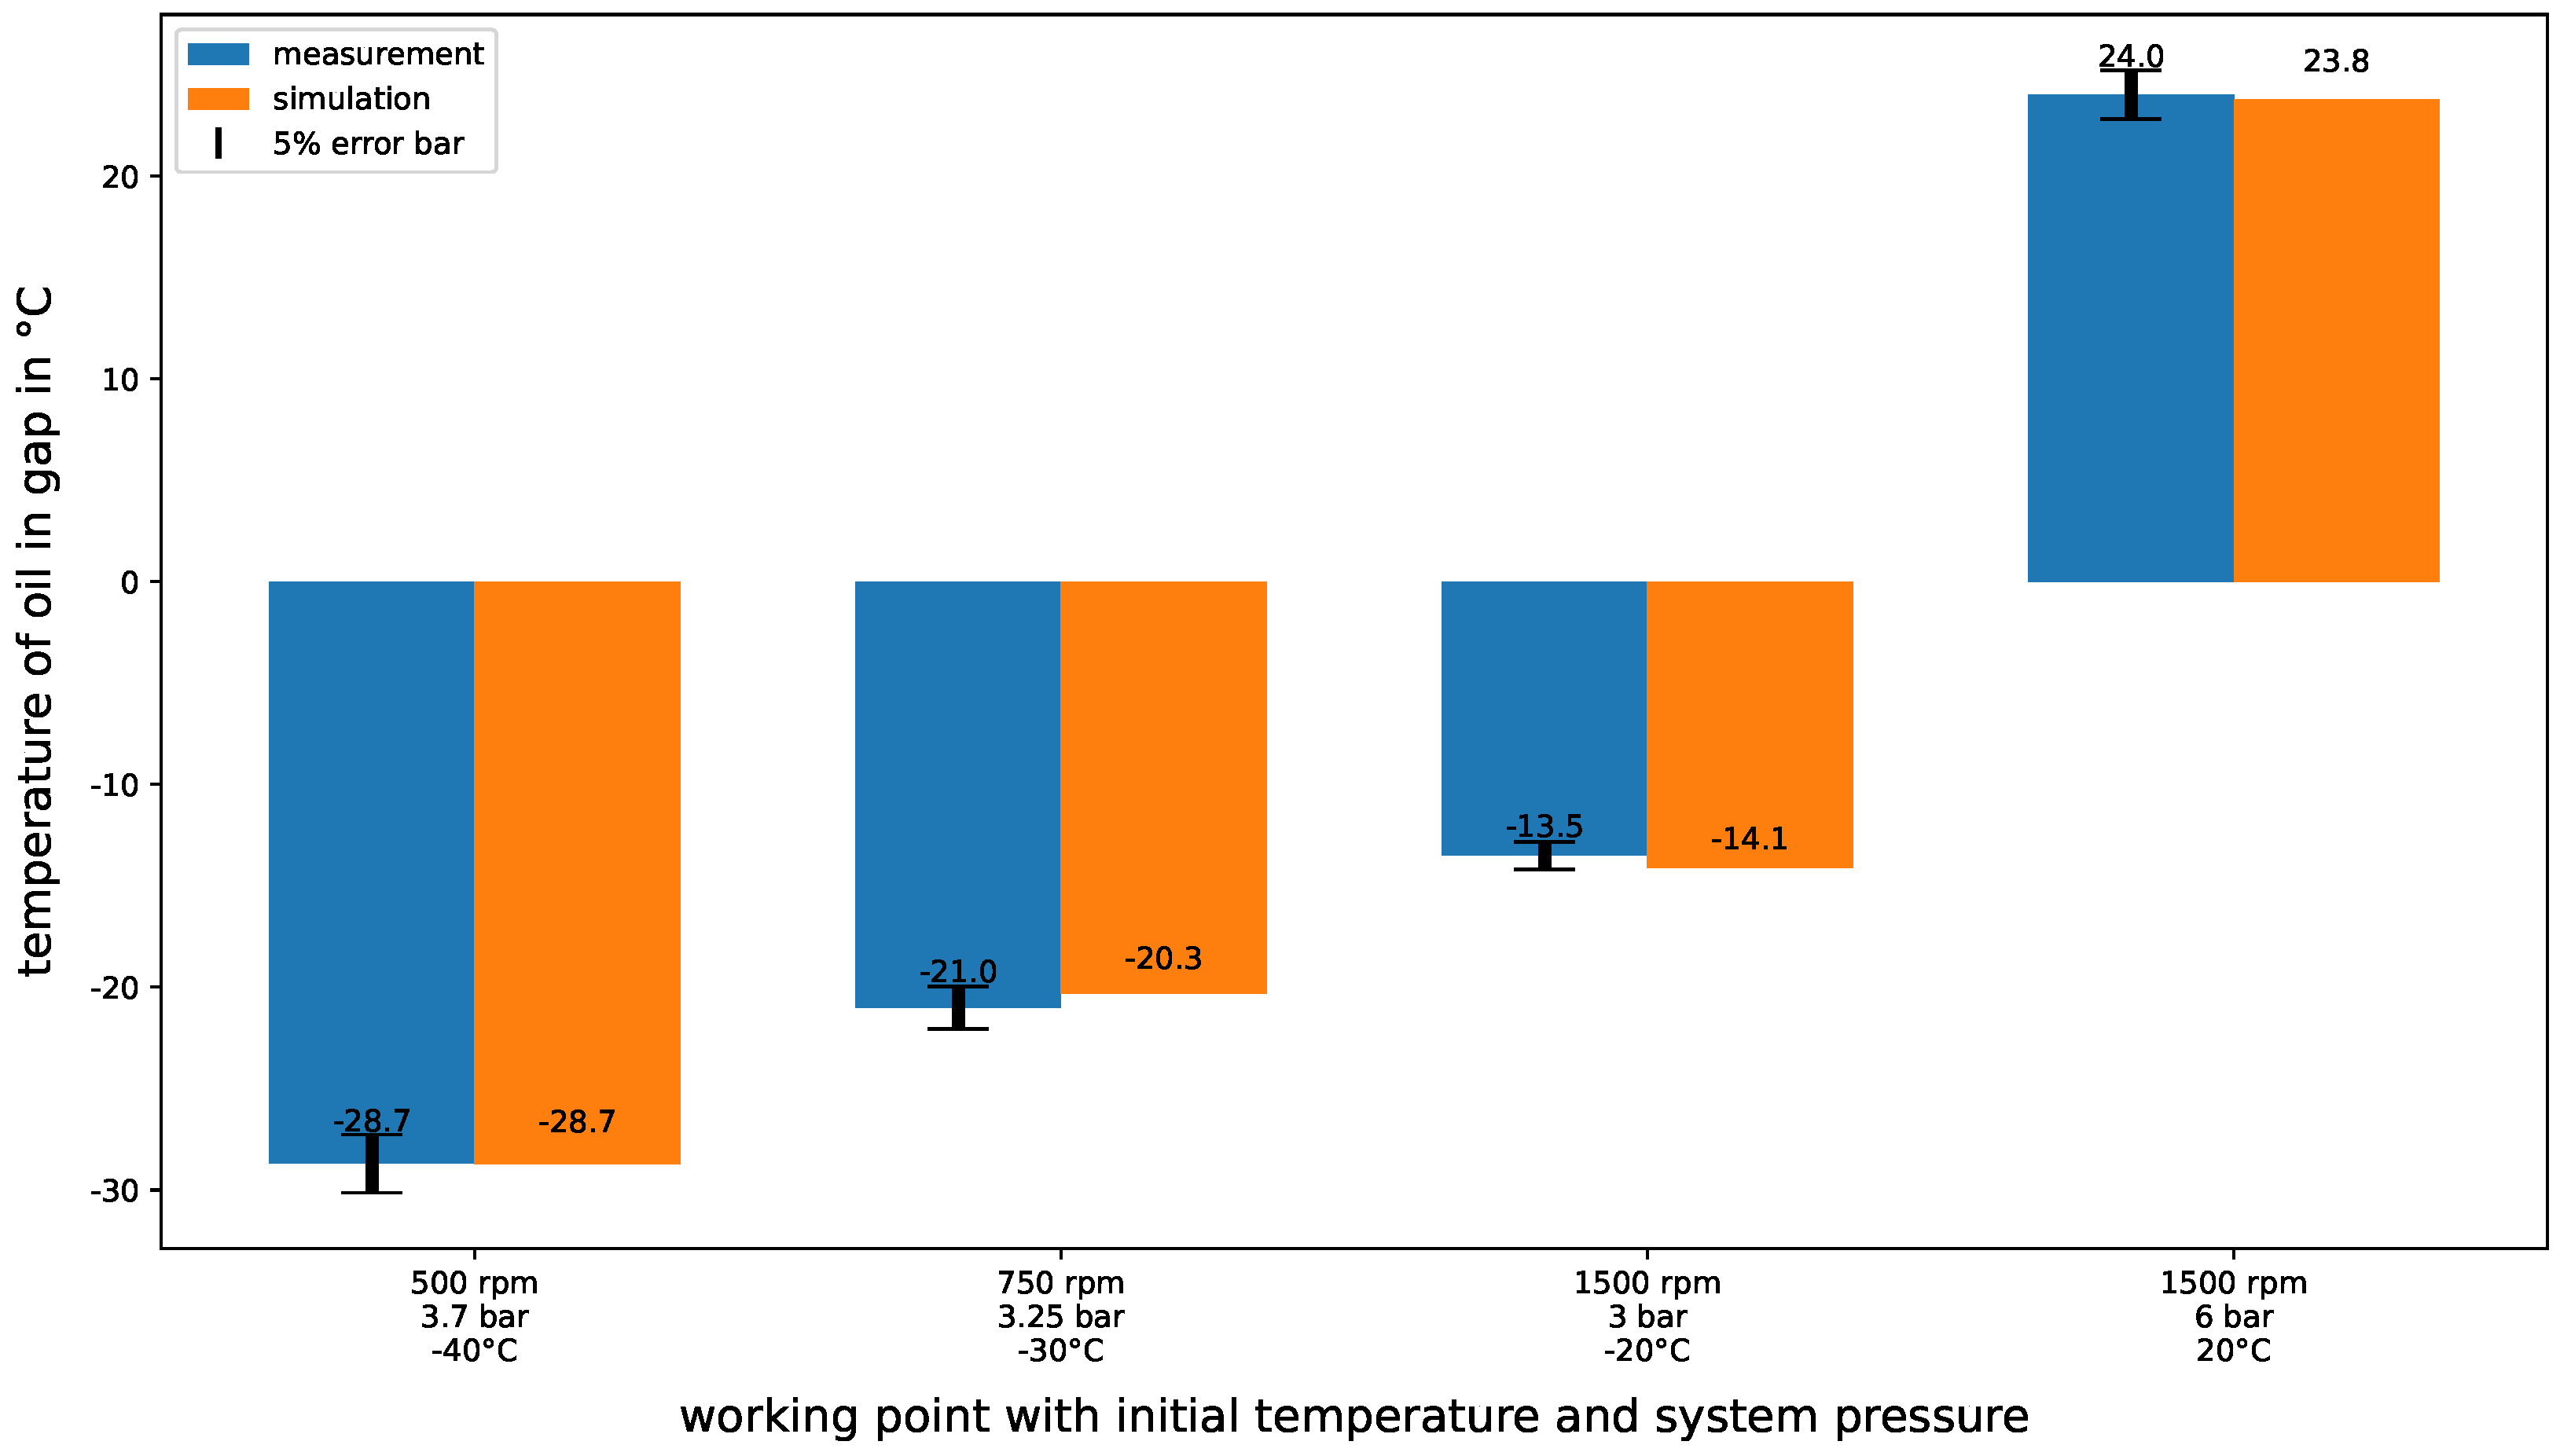
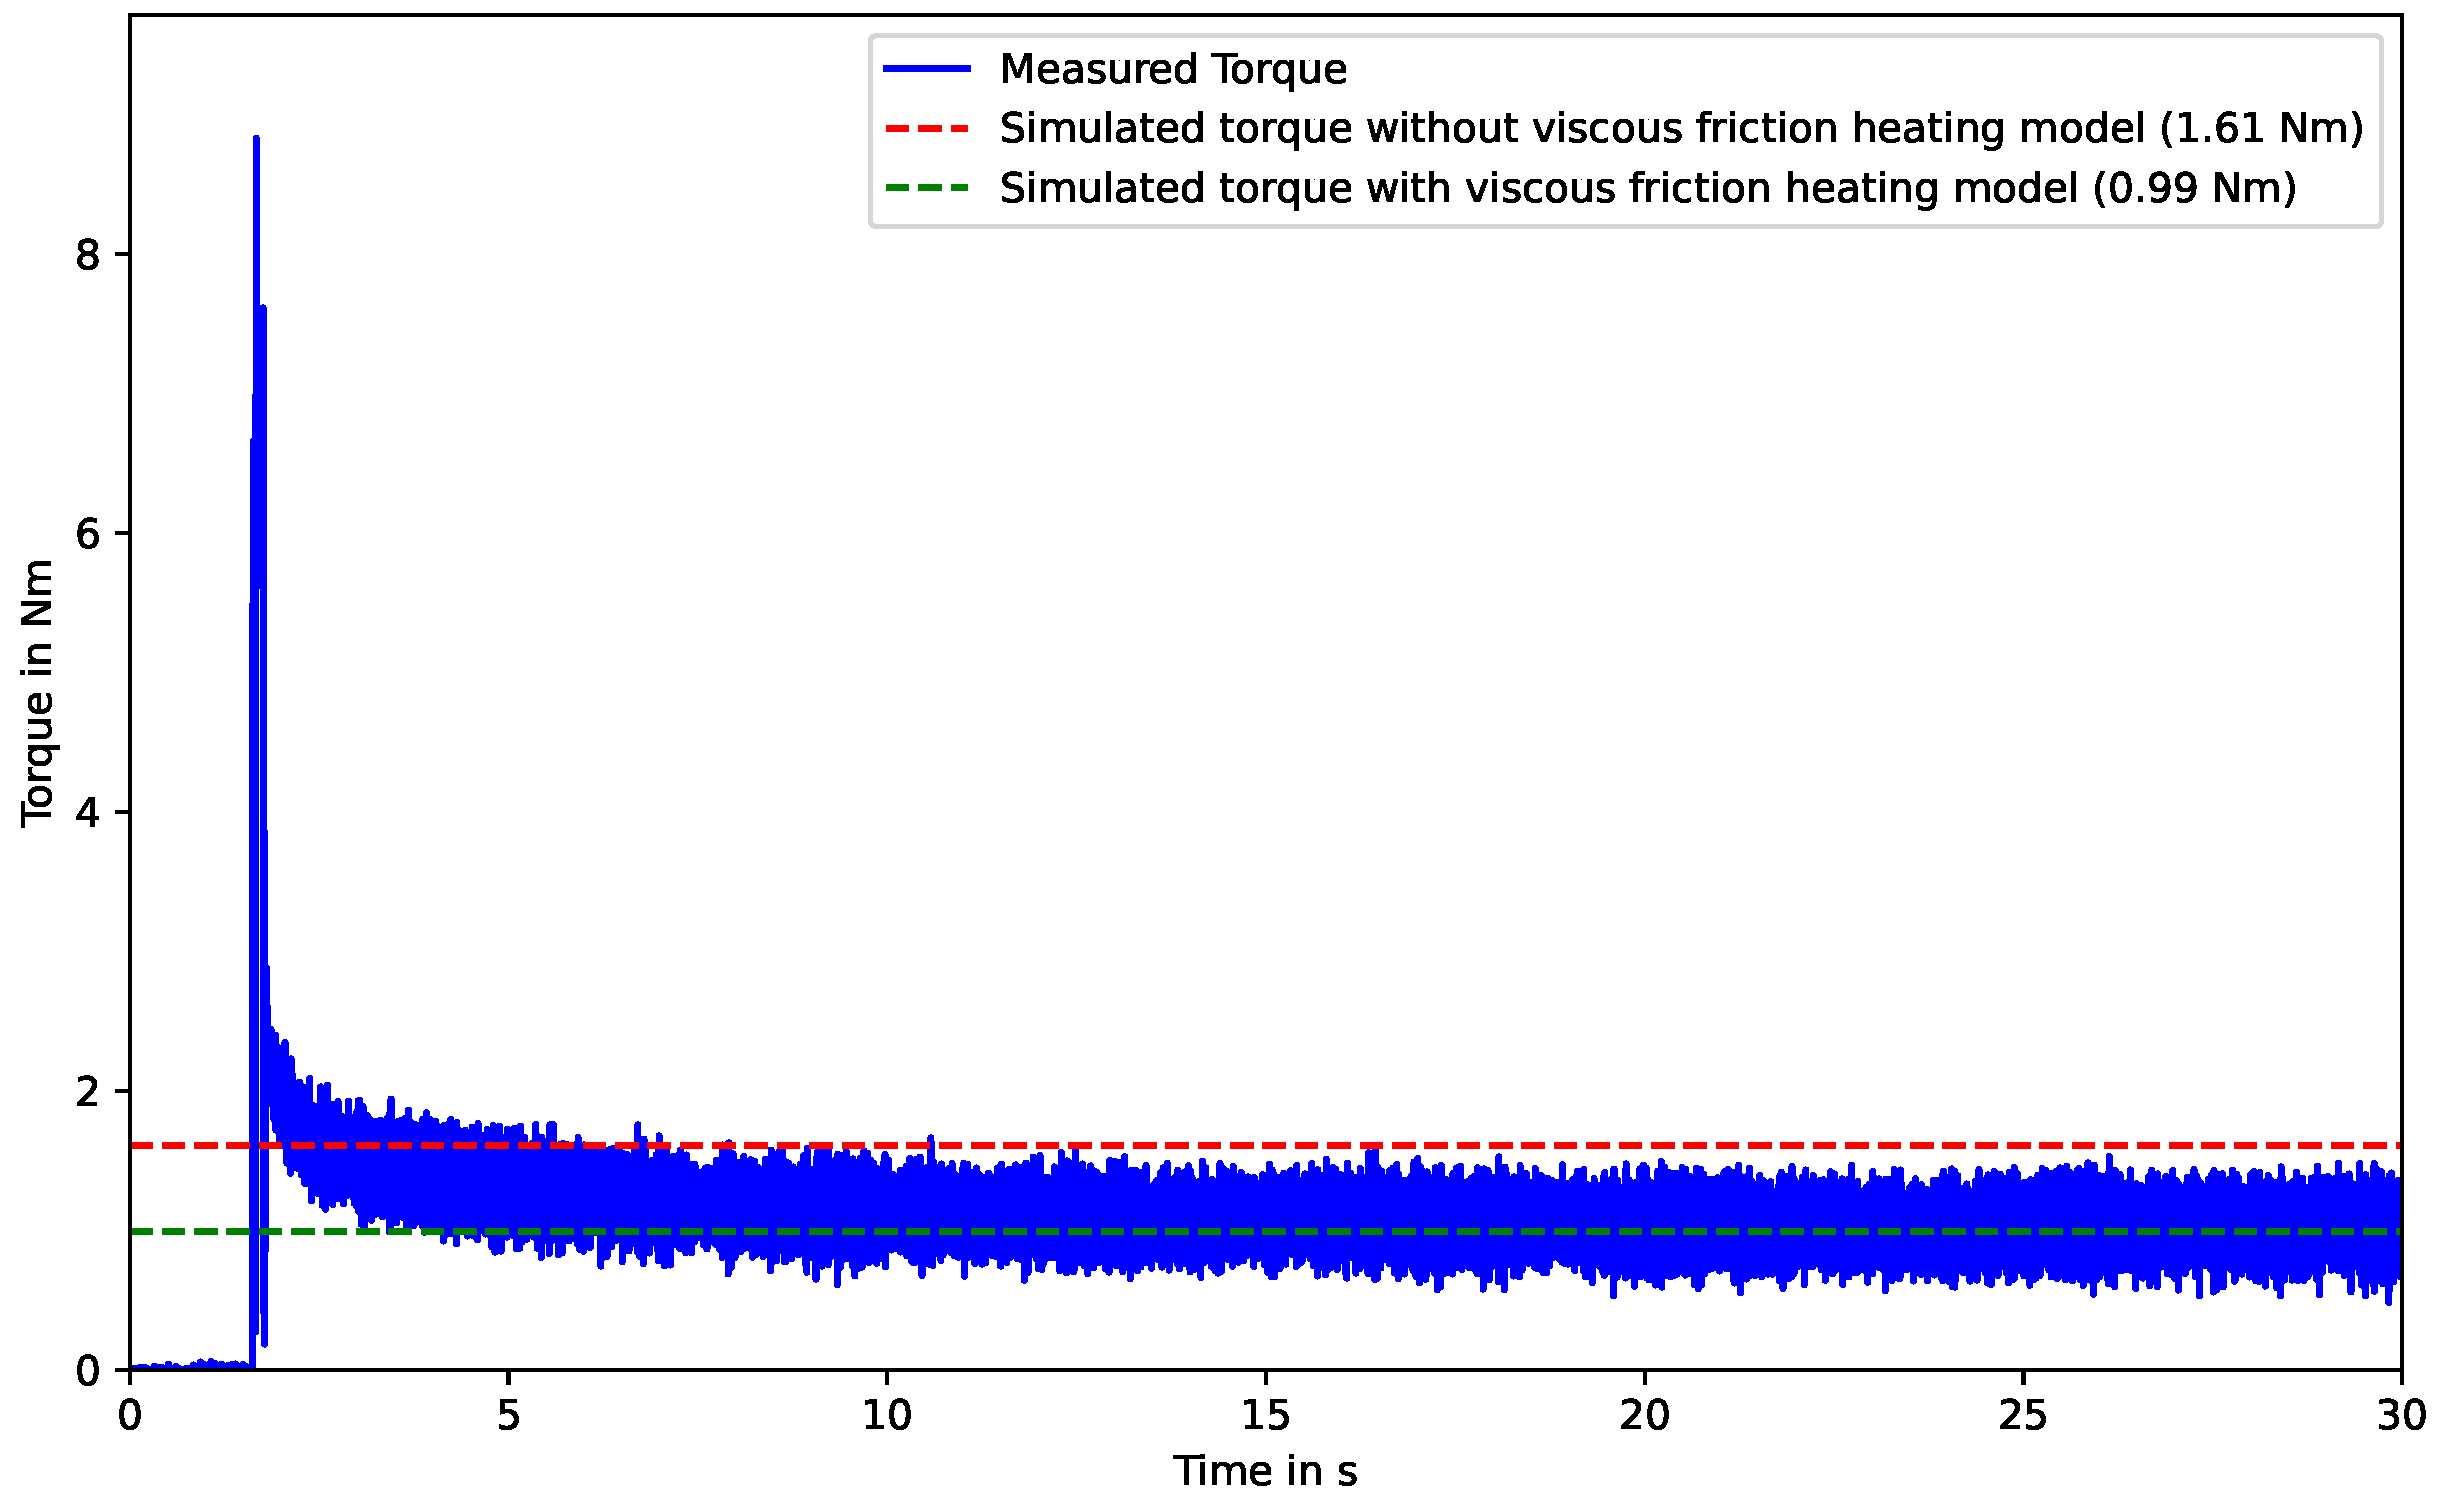
  • In addition, the study presented a novel method for simulating the cold start behavior of the pump at the steady state operating point. This simulation-based method was developed and validated by measurements in a climate chamber, demonstrating its practical applicability and potential for real-world applications. In particular, the accuracy of the prediction of the temperature in the gap between the outer gear and the pump housing (<5%) and the accurate prediction of the steady-state torque (see Figure 16) should be highlighted. However, the need to further generalize the method to apply it to a wider range of pumps and conditions in future research is clearly stated and discussed.
Overall, the results presented in this study represent a significant advance in the digital reliability and simulation-based performance prediction of gerotor pumps in terms of a digital requirements-driven and model-based product development. The recognition of deviations at high viscosities, the creation of an accurate simulation environment and the novel cold start simulation method, all contributed to a deeper understanding of the pump behavior and a more efficient development process. Integrating these tools into a holistic design framework using graph-based design languages could further improve their practical application and utility, enable automated knowledge reuse and further enrich the data-driven knowledge part of a company’s digital DNA in form of an executable graph-based design language. Further generalization and validation of these methods and possible integration of other CFD methods will be crucial to ensure their wider adoption and effectiveness in various applications. The present study marks, therefore, an important step forward towards future research and development in digital gerotor pump design automation for the design of more efficient and reliable fluid cooling and lubrication systems for the automotive industry.

Author Contributions

Conceptualization, S.S., R.S., M.T., S.R., N.L. and B.A.; methodology, S.S., N.L. and B.A.; software, S.S., N.L. and B.A; validation, S.S.; formal analysis, S.S.; Investigation, S.S.; writing—original draft preparation, S.S. and B.A.; writing—review and editing, R.S., M.T., S.R., N.L.; visualization, S.S. All authors have read and agreed to the published version of the manuscript.

Funding

This research received no external funding.

Institutional Review Board Statement

Not applicable.

Informed Consent Statement

Not applicable.

Data Availability Statement

The data presented in this study are available on request from the corresponding author.

Acknowledgments

We would like to thank Marcel Anselment, Institute for Aircraft Design at the University of Stuttgart, Germany, for the support provided with the portfolio analysis in Appendix B and the team at the SHW Automotive GmbH for their support during the test bench measurements.

Conflicts of Interest

Author Sven Schumacher was employed by the company SHW Automotive GmbH. Authors Nicolas Laviolette and Benoît Algret are employed by the company Siemens Digital industries Software. The remaining authors declare that the research was conducted in the absence of any commercial or financial relationships that could be construed as a potential conflict of interest.

Abbreviations

The following abbreviations are used in this manuscript:
BEVBattery electric vehicle
CFDComputational fluid dynamics
FEMFinite element method
GHZGümbel–Hersey number
digital DNAin analogy to the notion of DNA in biology, a digital and machine-executable design representation, which, due its knowledge content and generation power, is the decisive part of the future assets in an engineering company

Appendix A

Table A1. Specifications of the tested oil pump.
SpecificationValue
number of teeth inner gear7
number of teeth outer gear8
outer diameter of external gear31 mm
shaft diameter10 mm
gear width8 mm
radial gap between gears0.06 mm
radial gap outer gear and pump housing0.1 mm
axial gap gears and pump housing0.04 mm
theoretical flow rate1.4 l 1000 rpm min

Appendix B

Table A2. Dimensional matrix for determining phenomenon-specific dimensionless parameters.
α v c p ρ η λ Lh
[ L ] 012−3−1111
[ M ] 10011100
[ T ] −3−1−20−1−300
[ Θ ] −10−100−100

Appendix C

With the support of Marcel Anselment, the novel AI plug-in of the Design Cockpit 43® software (Version: 4.0.37) was used to explore the function space and determine the best possible function models before fitting optimal parameters using nonlinear regression.
Figure A1. Pareto front of the portfolio analysis showing model error versus complexity. (The functional model y = c 1 R e c 2 P r c 3 marked in red in Table A3 is marked here in red as well.)
Applsci 14 06723 g0a1
Table A3. Portfolio analysis based on a symbolic regression to determine possible correlations of the Nusselt number shown with 4 examples for each complexity level 1–9 with the chosen correlation highlighted (in red box).
LevelError in %Model c 1 c 2 c 3
192.748 y = R e ---
292.418 y = sin ( R e ) ---
293.466 y = tan ( R e ) ---
2100.000 y = cos ( R e ) ---
336.928 y = c 1 + R e 0.1395--
350.476 y = R e c 1 0.4809--
391.458 y = c 1 R e 0.75--
395.767 y = R e 2 ---
425.356 y = c 1 cos ( R e ) 0.1832--
426.645 y = c 1 + cos ( R e ) −0.8129--
427.711 y = e c 1 + R e −1.76--
427.713 y = c 1 e R e 0.1714--
524.033 y = c 1 R e c 2 0.2320.0579-
525.390 y = c 1 ( c 2 + R e ) −0.0485−3.80-
525.390 y = c 1 + c 2 R e 0.1843−0.0485--
525.770 y = c 1 + R e P r 0.1823--
613.418 y = c 1 R e c 2 P r 0.00039880.6909-
613.466 y = c 2 R e c 1 P r 0.69010.0003987-
616.386 y = c 1 R e P r ln ( R e ) −3.536 × 10⁻⁴--
617.738 y = c 1 + c 2 R e P r 0.1206−4.578 × 10⁻⁴-
713.184 y = c 1 P r tan ( R e c 2 ) 0.00038310.6823-
713.332 y = c 1 P r tan ( R e ) c 2 0.00039470.6881-
713.344 y = c 1 R e R e c 2 P r 3.977 × 10⁻⁴−0.3081-
813.203 y = c 1 R e c 2 P r c 3 0.0004570.67870.9785
813.206 y = c 1 R e c 2 P r tan ( R e ) −3.915 × 10⁻⁴−0.3122-
813.290 y = c 1 R e c 2 P r tan ( R e ) −3.922 × 10⁻⁴−0.3133-
813.343 y = c 1 R e c 2 + R e P r 5.477 × 10−40.7469-
912.803 y = c 1 P r ( c 3 + R e + R e c 2 ) 2.170 × 10−40.5571−0.0091
912.923 y = c 1 P r c 3 tan ( R e ) c 2 0.00052020.66730.9591

Appendix D

Figure A2. Test and training data split for the simulated and curve-fitted Nusselt number based on the Reynolds and Prandtl numbers for the correlations of Equation (12), the symbolic regression fit (SR-Fit) and the fit from the logarithmized fit (Log-Fit).
Applsci 14 06723 g0a2

References

  1. Trends in Electric Cars–Global EV Outlook 2024–Analysis. Available online: https://www.iea.org/reports/global-ev-outlook-2024/trends-in-electric-cars (accessed on 10 June 2024).
  2. Gannesh, V.; Sivakumar, R.; Sakthivel, G. Fixed Displacement Gerotor Oil Pump (FDOP): A Survey. Int. J. Ambient Energy 2022, 43, 2328–2338. [Google Scholar] [CrossRef]
  3. Fauda, A.; Marchetti, L.; Cola Lng, F.; Arena Lng, L. Innovative Electric Oil Pumps for Different Automotive Applications. In Proceedings of the Conference on Sustainable Mobility, Catania, Italy, 4–7 October 2020. [Google Scholar] [CrossRef]
  4. Ha, T.; Kang, Y.; Kim, N.S.; Park, S.H.; Lee, S.H.; Kim, D.K.; Ryou, H.S. Cooling Effect of Oil Cooling Method on Electric Vehicle Motors with Hairpin Winding. J. Mech. Sci. Technol. 2021, 35, 407–415. [Google Scholar] [CrossRef]
  5. Wrobel, R. A Technology Overview of Thermal Management of Integrated Motor Drives—Electrical Machines. Therm. Sci. Eng. Prog. 2022, 29, 101222. [Google Scholar] [CrossRef]
  6. SHW AG. Variable Motorölpumpe. Available online: https://www.shw.de/de/produkte/pkw/ (accessed on 12 June 2023).
  7. Grabow, G. Optimalbereiche von Fluidenergiemaschinen-Pumpen und Verdichter. Forsch. Ingenieurwesen 2002, 67, 100–106. [Google Scholar] [CrossRef]
  8. Ivanović, L.; Matejić, M. Improving Gerotor Pump Performance Trough Design, Modeling and Simulation. Int. J. Fluid Power 2021, 21, 327–346. [Google Scholar] [CrossRef]
  9. Pellegri, M.; Manne, V.H.B.; Vacca, A. A Simulation Model of Gerotor Pumps Considering Fluid–Structure Interaction Effects: Formulation and Validation. Mech. Syst. Signal Process. 2020, 140, 106720. [Google Scholar] [CrossRef]
  10. Ivanović, L.; Devedžić, G.; Ćuković, S.; Mirić, N. Modeling of the Meshing of Trochoidal Profiles With Clearances. J. Mech. Des. 2012, 134, 041003. [Google Scholar] [CrossRef]
  11. Yoshida, N.; Kagawa, H. Development of a Low-Torque Electric Oil Pump for Cooling of BEV Motors. Jtekt Eng. J. Engl. Ed. 2022, 1018E, 90–95. [Google Scholar]
  12. Rundo, M. Models for Flow Rate Simulation in Gear Pumps: A Review. Energies 2017, 10, 1261. [Google Scholar] [CrossRef]
  13. Vasudevan, D.B.; Turaga, V.K. CFD Analysis of Cavitation in Flow through a Gerotor Pump and the Prediction of Erosion Zone Due to Cavitation. In Proceedings of the AeroCON 2024, Bangalore, India, 6–7 June 2024. [Google Scholar] [CrossRef]
  14. Taghizadeh, S.; Ng, K.C.; Horen, J.; Dhar, S. A 3D Computational Fluid Dynamics and Acoustics Simulation Approach for Noise Mitigation Prediction in Gerotor Pumps. In Proceedings of the WCX SAE World Congress Experience, Detroit, MI, USA, 18–20 April 2024. [Google Scholar] [CrossRef]
  15. Pareja-Corcho, J.; Pedrera-Busselo, A.; Ciarrusta, J.; Moreno, A.; Posada, J.; Ruiz-Salguero, O. Accelerating the Design of Gerotor Pumps Using Interactive Tools and Fast Simulation. Int. J. Interact. Des. Manuf. (IJIDeM) 2024, 1–14. [Google Scholar] [CrossRef]
  16. Pareja-Corcho, J.C.; Pedrera-Busselo, A.; Ciarrusta, J.; Moreno, A.; Ruiz-Salguero, O.; Posada, J. On Web Digital Twins: An Use Case for a Gerotor Pump. In Proceedings of the 28th International ACM Conference on 3D Web Technology, San Sebastian, Spain, 9–11 October 2023; pp. 1–8. [Google Scholar] [CrossRef]
  17. Totaro, G.; Zardin, B.; Borghi, M.; Scolari, F. Modelling of a Gerotor Pump Including the Evaluation of the Micro-Movements of the External Gear. J. Phys. Conf. Ser. 2023, 2648, 012049. [Google Scholar] [CrossRef]
  18. Pellegri, M.; Vacca, A.; Frosina, E.; Buono, D.; Senatore, A. Numerical Analysis and Experimental Validation of Gerotor Pumps: A Comparison between a Lumped Parameter and a Computational Fluid Dynamics-Based Approach. Proc. Inst. Mech. Eng. Part C J. Mech. Eng. Sci. 2017, 231, 4413–4430. [Google Scholar] [CrossRef]
  19. Hussain, T.; Udaya Kumar, M.; Sarangi, N.; Sivaramakrishna, M. A Study on Effect of Operating Conditions on Gerotor Pump Performance. Def. Sci. J. 2022, 72, 146–150. [Google Scholar] [CrossRef]
  20. Ivanović, L. Design, Modeling and Simulation of Gearing for Improving Gerotor Pump Performance. In Advances in Hydraulic and Pneumatic Drives and Control 2020; Stryczek, J., Warzyńska, U., Eds.; Springer International Publishing: Cham, Switzerland, 2021; pp. 15–27. [Google Scholar] [CrossRef]
  21. Shin, C.; Lee, S.; Kim, C. Optimal Ovoid Lobe Shape by an Automatic Calculation Program and CFD Using Dynamic Mesh Technique. Int. J. Adv. Manuf. Technol. 2024, 132, 5367–5383. [Google Scholar] [CrossRef]
  22. Harrison, J.; Aihara, R.; Eisele, F. Modeling Gerotor Oil Pumps in 1D to Predict Performance with Known Operating Clearances. SAE Int. J. Engines 2016, 9, 1839–1846. [Google Scholar] [CrossRef]
  23. Yanada, H.; Uchino, T.; Takeno, T.; Kojima, R.; Yokoyama, H. Rotor Behavior and Friction Torque Characteristics of a Gerotor Pump Used for Automatic Transmissions. J. Dyn. Syst. Meas. Control 2021, 143, 121001. [Google Scholar] [CrossRef]
  24. Schumacher, S.; Schmid, S.; Wieser, P.; Stetter, R.; Till, M. Design, Simulation and Optimization of an Electrical Drive-Train. Vehicles 2021, 3, 390–405. [Google Scholar] [CrossRef]
  25. Hahn, N.; Rudolph, S. Digitale Durchgängigkeit, Konsistenz und Interoperabilität im Produktlebenszyklus mit graphenbasierten Entwurfssprachen. In Proceedings of the Automation 2023, Baden-Baden, Germany, 27–28 June 2023; Volume 2419, pp. 443–458. [Google Scholar]
  26. Design Cockpit 43. IILS Ingenieurgesellschaft für Intelligente Lösungen und Systeme mbH: Trochtelfingen, Germany. Available online: https://www.iils.de/ (accessed on 20 June 2024).
  27. Gamez-Montero, P.J.; Codina, E.; Castilla, R. A Review of Gerotor Technology in Hydraulic Machines. Energies 2019, 12, 2423. [Google Scholar] [CrossRef]
  28. Simcenter Amesim. Siemens Digital Industries Software: Plano, TX, USA. Available online: https://plm.sw.siemens.com/en-US/simcenter/systems-simulation/amesim/ (accessed on 20 June 2024).
  29. Li, L.; Xu, P.; Xu, W.; Lu, B.; Wang, C.; Tan, D. Multi-field coupling vibration patterns of the multiphase sink vortex and distortion recognition method. Mech. Syst. Signal Process. 2024, 219, 111624. [Google Scholar] [CrossRef]
  30. Tan, Y.; Ni, Y.; Xu, W.; Xie, Y.; Li, L.; Tan, D. Key technologies and development trends of the soft abrasive flow finishing method. J. Zhejiang Univ.-Sci. A 2023, 24, 1043–1064. [Google Scholar] [CrossRef]
  31. Klopsch, V.; Germann, T.; Seitz, H. Numerical Simulation of Low-Pulsation Gerotor Pumps for Use in the Pharmaceutical Industry and in Biomedicine. Curr. Dir. Biomed. Eng. 2015, 1, 433–436. [Google Scholar] [CrossRef]
  32. Matlab. The MathWorks, Inc.: Natick, MA, USA. Available online: https://www.mathworks.com/products/matlab.html?s_tid=hp_products_matlab (accessed on 20 June 2024).
  33. van Basshuysen, R.; Schäfer, F.; Ingenieurgesellschaft Auto und Verkehr (Eds.) Handbuch Verbrennungsmotor: Grundlagen, Komponenten, Systeme, Perspektiven, 8th überarbeitete auflage ed.; ATZ/MTZ-Fachbuch; Springer Vieweg: Wiesbaden, Germany, 2017. [Google Scholar] [CrossRef]
  34. Fabiani, M.; Mancò, S.; Nervegna, N.; Rundo, M.; Armenio, G.; Pachetti, C.; Trichilo, R. Modelling and Simulation of Gerotor Gearing in Lubricating Oil Pumps. In Proceedings of the International Congress & Exposition, Detroit, MI, USA, 1–4 March 1999. [Google Scholar] [CrossRef]
  35. McCloy, D.; Martin, H. Control of Fluid Power: Analysis and Design; Ellis Horwood Series in Engineering Science; E. Horwood: Bel Air, CA, USA, 1980. [Google Scholar]
  36. Mancò, S.; Nervegna, N.; Rundo, M.; Armenio, G.; Pachetti, C.; Trichilo, R. Gerotor Lubricating Oil Pump for IC Engines. In Proceedings of the International Fall Fuels and Lubricants Meeting and Exposition, San Francisco, CA, USA, 19–22 October 1998; SAE International: Warrendale, PA, USA, 1998. [Google Scholar] [CrossRef]
  37. Matthies, H.J.; Renius, K.T. Einführung in die Ölhydraulik: Für Studium und Praxis: 110 Kurzaufgaben mit Lösungshinweisen, 9th vollständig überarbeitete und erweiterte Auflage ed.; Springer Vieweg: Wiesbaden, Germany, 2021. [Google Scholar]
  38. Bender, B.; Göhlich, D. (Eds.) Dubbel Taschenbuch für den Maschinenbau 2: Anwendungen, 26th überarbeitete Auflage ed.; Springer Vieweg: Berlin/Heidelberg, Germany, 2020. [Google Scholar]
  39. Ligier, J.L. Lubrification Des Paliers Moteurs; Publications de l’Institut Français Du Pétrole, Editions Technip: Paris, France, 1997. [Google Scholar]
  40. Findeisen, D.; Helduser, S. Ölhydraulik: Handbuch der hydraulischen Antriebe und Steuerungen; Springer: Berlin/Heidelberg, Germany, 2015. [Google Scholar] [CrossRef]
  41. Piton, M.; Huchet, F.; Cazacliu, B.; Le Corre, O. Heat Transport in Rotating Annular Duct: A Short Review. Energies 2022, 15, 8633. [Google Scholar] [CrossRef]
  42. Incropera, F.P.; DeWitt, D.P.; Bergman, T.L.; Lavine, A.S. (Eds.) Principles of Heat and Mass Transfer, 7th ed.; International Student Version; Wiley: Hoboken, NJ, USA, 2013. [Google Scholar]
  43. Dirker, J.; Meyer, J.P. Convective Heat Transfer Coefficients in Concentric Annuli. Heat Transf. Eng. 2005, 26, 38–44. [Google Scholar] [CrossRef]
  44. Anselment, M.; Neumaier, M.; Rudolph, S. Von Daten zu physikalischen Modellen mit Methoden der Künstlichen Intelligenz. In Proceedings of the DLRK Stuttgart, Stuttgart, Germany, 19–21 September 2023. [Google Scholar]
  45. Anselment, M.; Neumaier, M.; Rudolph, S. Symbolic Regression: Systematically Spanning and Searching the Space of Dimensionally Homogeneous Symbolic Models Using a Tree Search. Ceas Aeronaut. J. 2024. under review. [Google Scholar]
Figure 1. © by 2023 SHW AG. Gerotor pump for battery electric vehicles [6].
Applsci 14 06723 g001
Figure 2. Requirements-based development of electric gerotor pump with decomposed requirements.
Applsci 14 06723 g002
Figure 3. Simcenter Amesim model of an electric oil pump [28].
Applsci 14 06723 g003
Figure 4. Interface App for a parameter-based design of a gerotor pump in Simcenter Amesim.
Applsci 14 06723 g004
Figure 5. Vectorial components structure in Simcenter Amesim with adjustable number of chambers.
Applsci 14 06723 g005
Figure 6. Hydraulic chamber volume with corresponding intersection areas to inlet and outlet port.
Applsci 14 06723 g006
Figure 7. Validation of the friction template at different operating points for volumetric flow and overall efficiency prediction.
Applsci 14 06723 g007
Figure 8. Deviation between measurement and simulation at 30 °C in the efficiency prediction.
Applsci 14 06723 g008
Figure 9. Gerotor pump with additional temperature sensor in gap between outer gear and pump housing.
Applsci 14 06723 g009
Figure 10. Cold start behavior of the gerotor pump with temperature in the gap and corresponding shaft torque.
Applsci 14 06723 g010
Figure 11. Flow conditions for dimensional analysis in gap between outer gear and pump housing.
Applsci 14 06723 g011
Figure 12. Simcenter Amesim model to simulate the cold start behavior of the gerotor pump.
Applsci 14 06723 g012
Figure 13. Test and training data split for the simulated and curve fitted Nusselt number (see Equation (12)) based on the Reynolds and Prandtl numbers.
Applsci 14 06723 g013
Figure 14. Simulated vs. measured oil temperatures in gap between outer gear and pump housing.
Applsci 14 06723 g014
Figure 15. Pump simulation with integrated viscous friction heating model.
Applsci 14 06723 g015
Figure 16. Simulated vs. measured torque with and without viscous heating model at 20 °C.
Applsci 14 06723 g016
Disclaimer/Publisher’s Note: The statements, opinions and data contained in all publications are solely those of the individual author(s) and contributor(s) and not of MDPI and/or the editor(s). MDPI and/or the editor(s) disclaim responsibility for any injury to people or property resulting from any ideas, methods, instructions or products referred to in the content.

