Abstract
Real-time gas sensing based on wavelength modulation spectroscopy (WMS) has been widely adopted for several gas sensing applications. It is attractive for its accurate, non-invasive, and fast determination of critical gas parameters such as concentration, temperature, and pressure. To implement real-time gas sensing, data acquisition and processing must be implemented to accurately extract harmonics of interest from transmitted laser signals. In this work, we present an FPGA-based data acquisition architecture with embedded processing capable of achieving both real-time and accurate gas detection. By leveraging real-time processing on-chip, we minimised the data transfer bandwidth requirement, hence enabling better resolution of data transferred for high-level processing. The proposed architecture has a significantly lower bandwidth requirement compared to both the conventional offline processing architecture and the standard I-Q architecture. Specifically, it is capable of reducing data transfer overhead by 25% compared to the standard I-Q method, and it only requires a fraction of the bandwidth needed by the offline processing architecture. The feasibility of the proposed architecture is demonstrated on a commercial off-the-shelf SoC board, where measurement results show that the proposed architecture has better accuracy compared to the standard I-Q demodulation architecture for the same signal bandwidth. The proposed DAQ system has potential for more accurate and fast real-time gas sensing.
1. Introduction
Real-time gas sensing has applications in several domains including environmental monitoring (e.g., green-house gas detection) [1,2], industrial process monitoring (e.g., species concentration and temperature distribution measurement) [3,4,5,6,7], and medical diagnostics (e.g., breath analysis) [7,8]. Measurement of critical gas-phase parameters in industrial settings using spectroscopy benefits from several advantages such as fast response, high sensitivity, and calibration-free measurements. Tuneable diode laser absorption spectroscopy (TDLAS) is widely adopted in the implementation of these measurement systems. Specifically, TDLAS offers high sensitivity and specificity for detecting trace gases by tuning laser wavelengths to the absorption lines of target gases. In practice, implementation of TDLAS for gas sensing can be accomplished using either direct absorption spectroscopy (DAS) or wavelength modulation spectroscopy (WMS). Although the implementation of WMS systems is more complex and resource intensive compared to DAS, it is nevertheless adopted in practical applications in industrial environments because it has potential for higher sensitivity and better noise rejection capabilities [9,10,11].
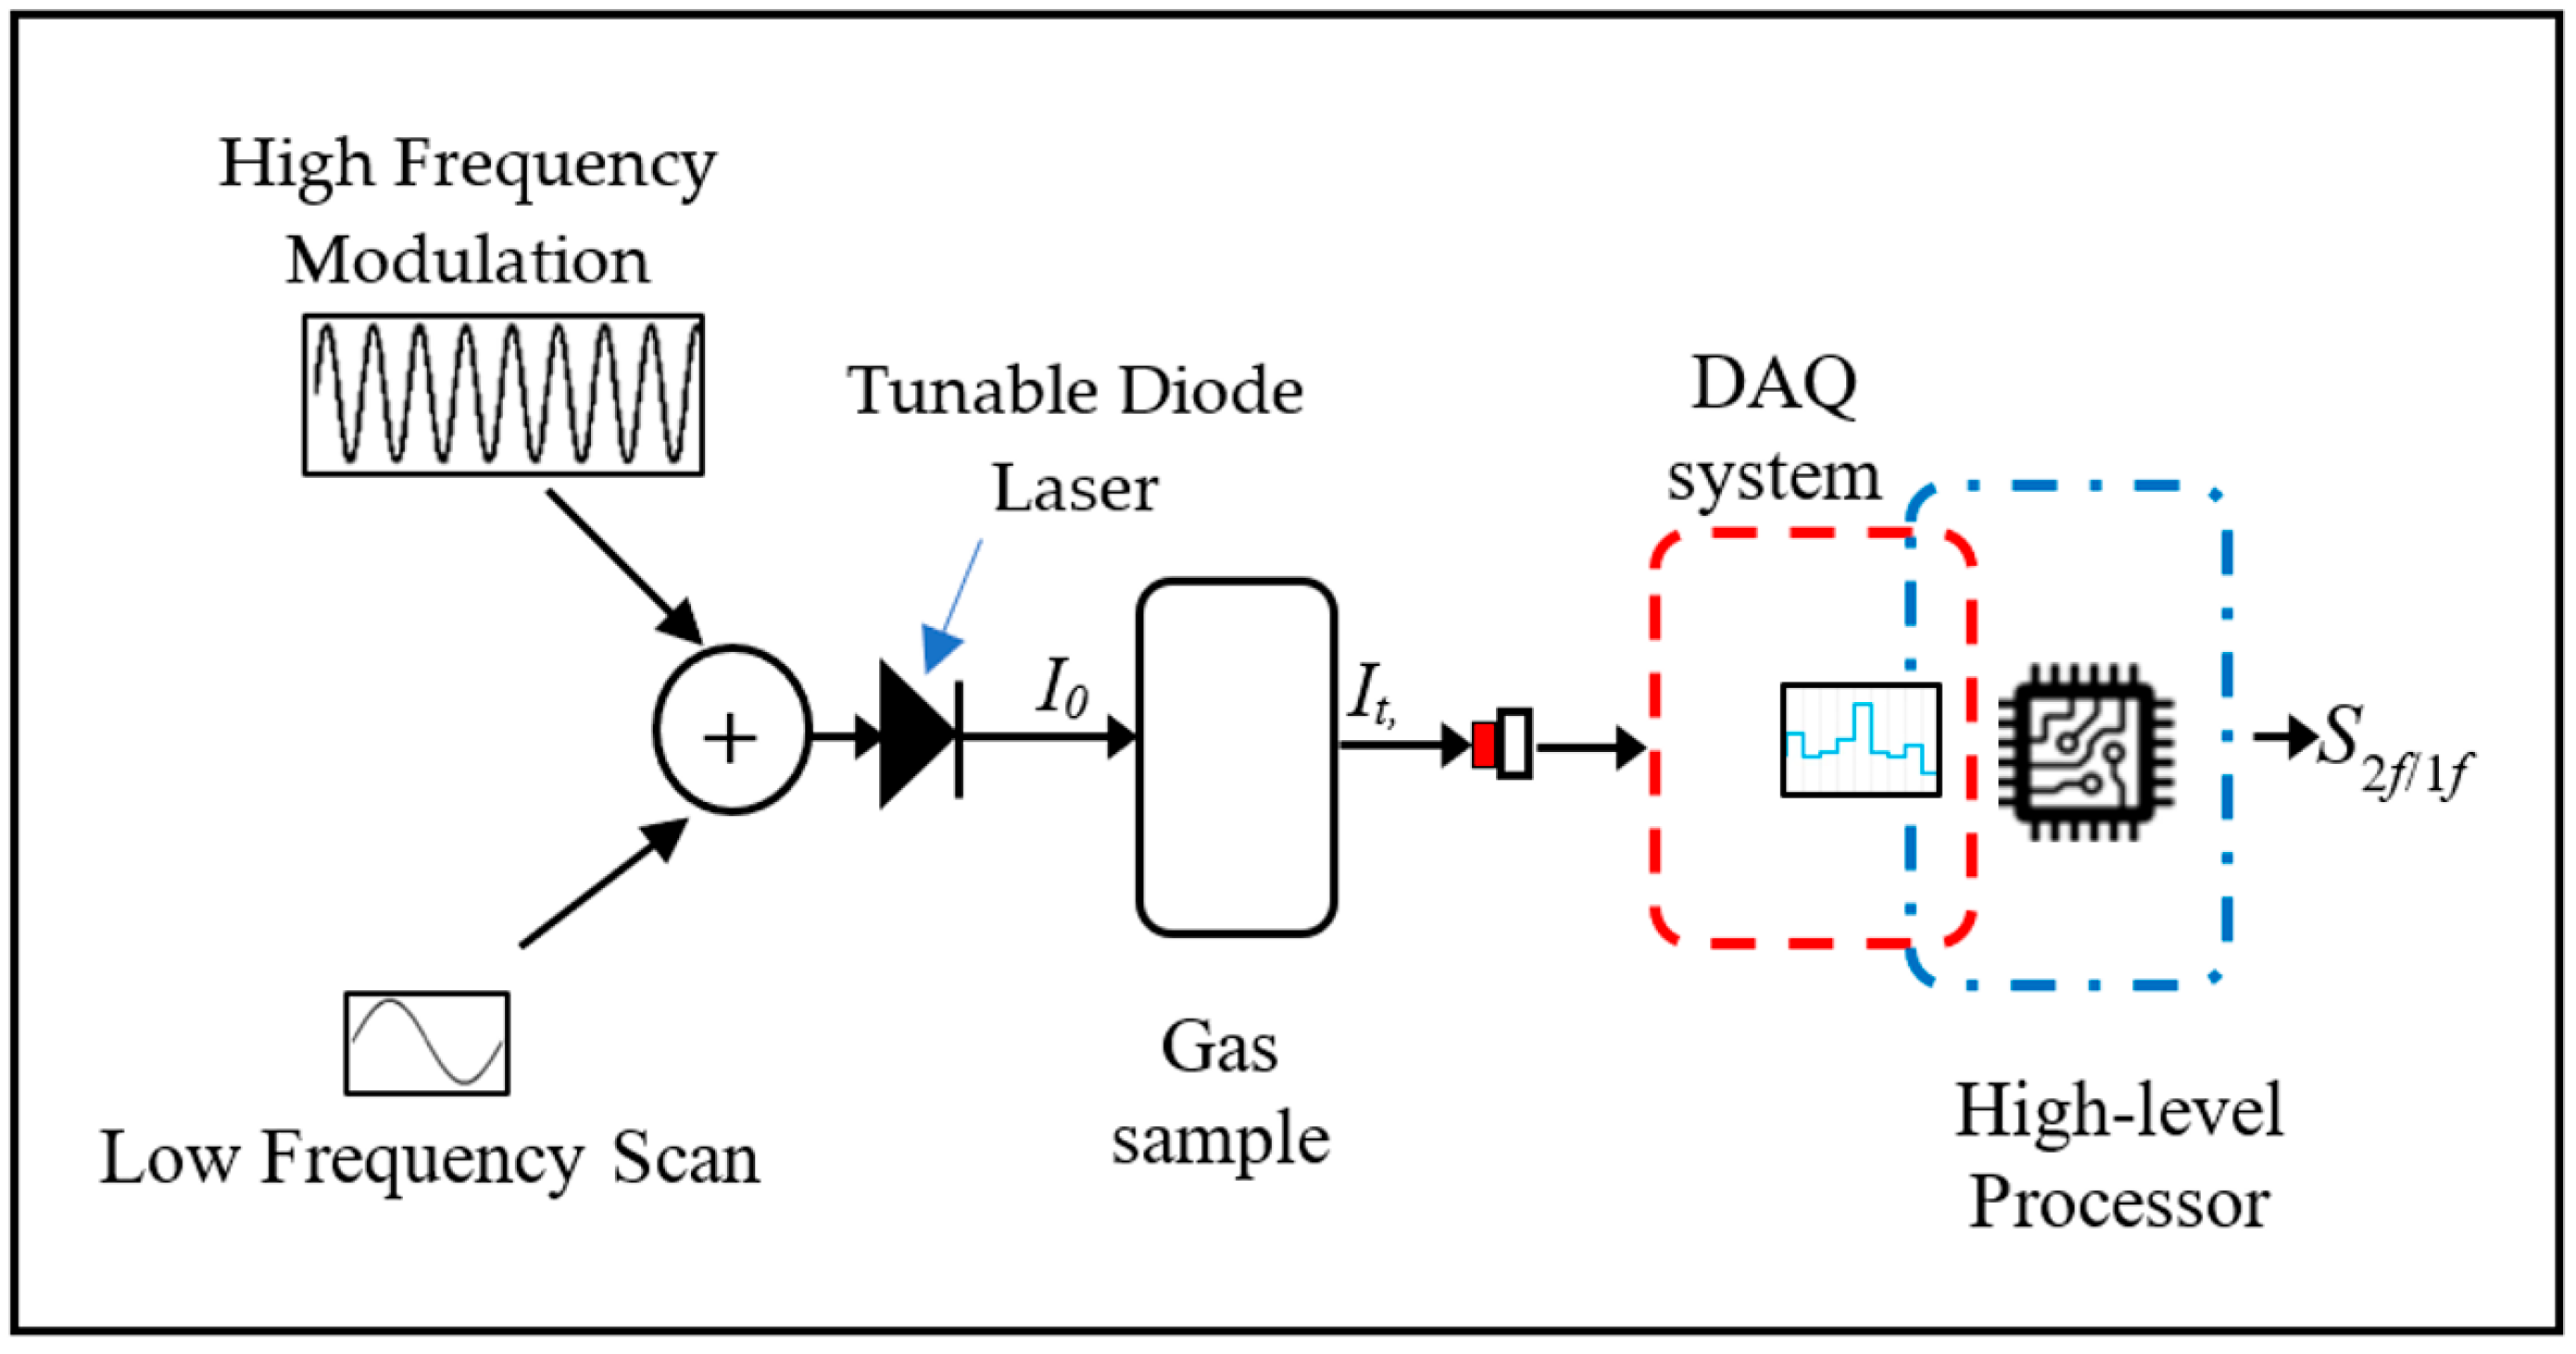
A block diagram of a typical WMS implementation is shown in Figure 1. The output of a tuneable diode laser is simultaneously modulated with a high-frequency sinusoid (the modulation frequency is characteristically a few hundred kHz) and scanned at a low frequency (usually in order of tens of Hz) across target absorption profile [12]. The modulated laser light is directed through the gas sample. As the wavelength oscillates, it periodically matches the absorption line of the target gas, causing variations in the light intensity reaching the detector. A photodetector is used to measure the intensity of the transmitted light, capturing the modulated absorption signal. The output from the photodetector is digitised and demodulated at the modulation frequency and its harmonics, such as the second harmonic, using a lock-in mechanism. Demodulation isolates the absorption signal from the background noise and other signal components. The demodulated signal at the second harmonic frequency (2f) is particularly useful: it provides a higher signal-to-noise ratio and is less affected by baseline drifts and other noise sources compared to other even-numbered harmonics [13]. To further remove the need for calibration, the 2f signal is often normalised with the first harmonic signal to obtain the 2f/1f signal [14]. In addition, the amplitude of the (2f/1f) harmonic signal is proportional to the concentration of the target gas. Hence, both the first and second harmonic components of the transmitted signal are typically extracted by the demodulation process.

Figure 1.
Overview of the WMS system for gas sensing.
The signal digitisation, harmonic extraction, and post-process are realised by the data acquisition (DAQ) system and a high-level processor. As shown in Figure 1, the DAQ and the high-level processor have overlapping roles in the signal acquisition and processing pipeline, often with various degrees of compromise between real-time sensing on one hand and accuracy and sensitivity on the other. For real-time gas sensing system, high temporal resolution is required to obtain high-quality time-resolved gas parameters (e.g., temperature and concentration information). In addition, to preserve signal integrity, data transfer between the DAQ and high-level processor must be without any data loss. To assure this, the amount of data transferred must be minimised. To this end, maintaining a high temporal resolution while achieving high accuracy for real-time gas sensing systems remains an open challenge.
In this paper, we propose an FPGA-based data acquisition (DAQ) system with embedded processing that harnesses the processing capabilities of an embedded FPGA to further process the acquired data beyond simple acquisition and demodulation. Specifically, we extended the standard I-Q approach beyond digitisation and demodulation of the transmitted signal to include further on-chip post-processing. The on-chip processing not only reduces the burden on the data transfer link between the DAQ and the high-level processor, but it also has the potential for better accuracy compared to the standard I-Q method as the effect of bit truncation is minimised.
The remainder of this paper is organised as follows: Section 2 gives an overview of related work and highlights the contribution of this paper. Section 3 covers the fundamentals of WMS, on-chip harmonic recovery through demodulation and techniques of gas parameter retrieval from the recovered harmonics, as well as the implementation of our proposed FPGA-based data acquisition (DAQ) system with embedded processing. In Section 4, experiments are discussed, and results are presented and explained. Finally, a conclusion is presented in Section 5.
2. Review of Related Works
In most state-of-the-art gas sensing systems using WMS, there are two approaches. In one, the raw transmitted signal is digitised and then sent to the high-level processor, with nearly all processing (i.e., the harmonics extraction as well as the computations of 2f/1f) done on the high-level processor offline [15,16]. While this approach generally achieves high accuracy of the detected gas parameters, it places a huge burden on the data transfer link between the sampling circuits and the high-level processor. This often leads to lowering the scan rates, hence reducing the temporal resolution. In addition, the offline processing of this approach could limit its real-time requirements.
In [15], the use of tuneable diode laser wavelength modulation spectroscopy (TDLS-WM) to measure CO2 concentration and temperature in the exhaust plume of an aero engine is outlined. The 2f/1f tuneable diode laser wavelength modulation spectroscopy technique was used to perform single-path measurements of measure CO2 concentration and temperature. The measurement results demonstrated high accuracy and confirmed the capability of the 2f/1f technique to provide reliable, in situ measurements of CO2 concentration and temperature in harsh environments. However, in the work, transmitted signals are digitised in real time, while the harmonic extraction is carried out offline.
In the same vein, ref. [16] presents a method for detecting six different gases (methane (CH4), ethane (C2H6), acetylene (C2H2), ethylene (C2H4), carbon monoxide (CO), and carbon dioxide (CO2)) simultaneously using a system based on wavelength modulation spectroscopy (WMS). Data processing is handled by a Raspberry Pi using Python, and detection signals are demodulated using digital quadrature lock-in amplifiers. Harmonic extractions are carried out offline. The key advantage of offline processing is that the harmonic extraction process can leverage the full bits resolution on a high-level processor, leading to very high accuracies. However, large amounts of raw data are required to be transferred in real-time with significant bandwidth requirements.
In the second approach, the DAQ not only digitises the transmitted signal, but it also extracts the harmonic information. Specifically, partially processed samples, whereby the demodulated in-phase (I) and quadrature (Q) components for both the first and second harmonics, are transferred to the high-level processor [6,12,17]. In this standard I-Q approach, the on-chip processing significantly reduces the load on the data transfer network and improves the real-time potential of WMS systems. However, four-components (i.e., two in-phase and two quadrature components) are generated for a set of transmitted signal samples. Transmitting these components to the processor in a bandwidth-constrained environment is often challenging. As a result, bit truncation is used to cope with the bandwidth requirements of most practical DAQ systems.
The work in [17] presented a quasi-parallel DAQ for WMS. The method used involves multiplexing multibeam signals over high-frequency modulation within a wavelength scan to minimise the hardware requirements of the data acquisition system. Demodulation of the WMS signal is realised on-chip in real time, extracting the first and second harmonic I-and-Q components before sending these to the high-level processor. Similarly, ref. [6,12] accomplished on-chip demodulation, resulting in four components. In state-of-the-art I-Q demodulation techniques, four harmonic components are transferred in real-time to the high-level processor. Although this technique has the potential to minimise the amount of data transferred compared to the raw data transfer technique, the demodulation process leads to an increase in the number of bits of harmonic components resulting from raw samples. As these components are simultaneously generated for raw data samples, buffering or bit truncation is often used to ensure data can be transferred to the high-level processor, with no data loss. On-chip buffering requires expensive on-chip memory while bit truncation leads to a degradation in accuracy. Table 1 contrasts the features of the common DAQ techniques with that of the proposed technique.

Table 1.
Summary of features of common DAQ techniques for WMS from the literature.
In this work, we address the limitation of the standard I-Q demodulation technique by further on-chip processing to minimise the amount of overall data transfer to the high-level processor. The specific contribution of this paper are as follows:
- (i).
- Development of improved on-chip post-processing beyond the standard four components I-Q harmonic extraction technique to achieve three harmonic components.
- (ii).
- Leveraging on-chip processing for better accuracy in WMS applications.
- (iii).
- A reduction in the burden on the data transfer link between the DAQ and the high-level processor compared to the standard four components I-Q method by up to 25%.
3. Materials and Methods
3.1. Basics of Wavelength Modulation Spectroscopy
The fundamental basis of WMS has been covered by refs. [9,14]. We cover the most important equations here to support our proposed system. Generally, absorption spectroscopy involves passing light through a sample and measuring the absorbed light at specific wavelengths to identify and quantify substances within the sample. In WMS, the wavelength of the light source is modulated (i.e., varied in a controlled manner) around the absorption line of the target gas. The wavelength of the light, modulated around a central frequency, , with a modulation frequency, , and modulation amplitude, , may be expressed as
The output of the diode laser, , which is incident on the gas sample, may be expressed as
where and are, respectively, the scan and modulation components of the incident light intensity. The transmitted intensity of light, , after passing through a gas sample of length , is given by the Beer–Lambert law:
where is the incident light intensity and is absorption coefficient, which describes how light is absorbed by the gas at a specific wavelength, .
Assuming that the gas properties are uniform along the laser path, the absorbance coefficient can be obtained as
where is the line shape function, is the pressure (in atm), and is the molar fraction of the target gas species. The term is the temperature-dependent line strength of the selected absorption line, where T is the temperature. For a single wavelength, , only one of, , and can be determined. The simultaneous determination of more of one of these properties of the gas requires multiple laser signals to be multiplexed. In this work, we assume that both and are constant, and consequently only a single wavelength is used. In addition, data from the HITRAN2016 database are used in this work.
The transmitted signal, , is typically detected by a photodetector and digitised using an analogue to digital converter (ADC) with sufficient sampling rate. The modulated absorption signal contains components at the modulation frequency, , and its harmonics , etc. The digitised signal can be decomposed into its harmonic components using a lock-in amplifier or Fourier analysis. The modulated transmitted signal, , can be expressed in terms of the frequency components as
Demodulation using a lock-in involves multiplication by a reference signal at the harmonics of interest, and then low-pass filtering the resulting signal. For example, the second harmonic component can be isolated as
where is the integration period. To avoid phase-sensitivity, both the in-phase () and quadrature () components are obtained. For digitised signals, the harmonics may be obtained as
where denotes the filtered harmonic component, with specifying the phase ( or ); is the number of samples corresponding to desired integration period, and is the harmonic.
3.2. Real-Time Digitisation and Harmonics Extraction with Embedded Processing
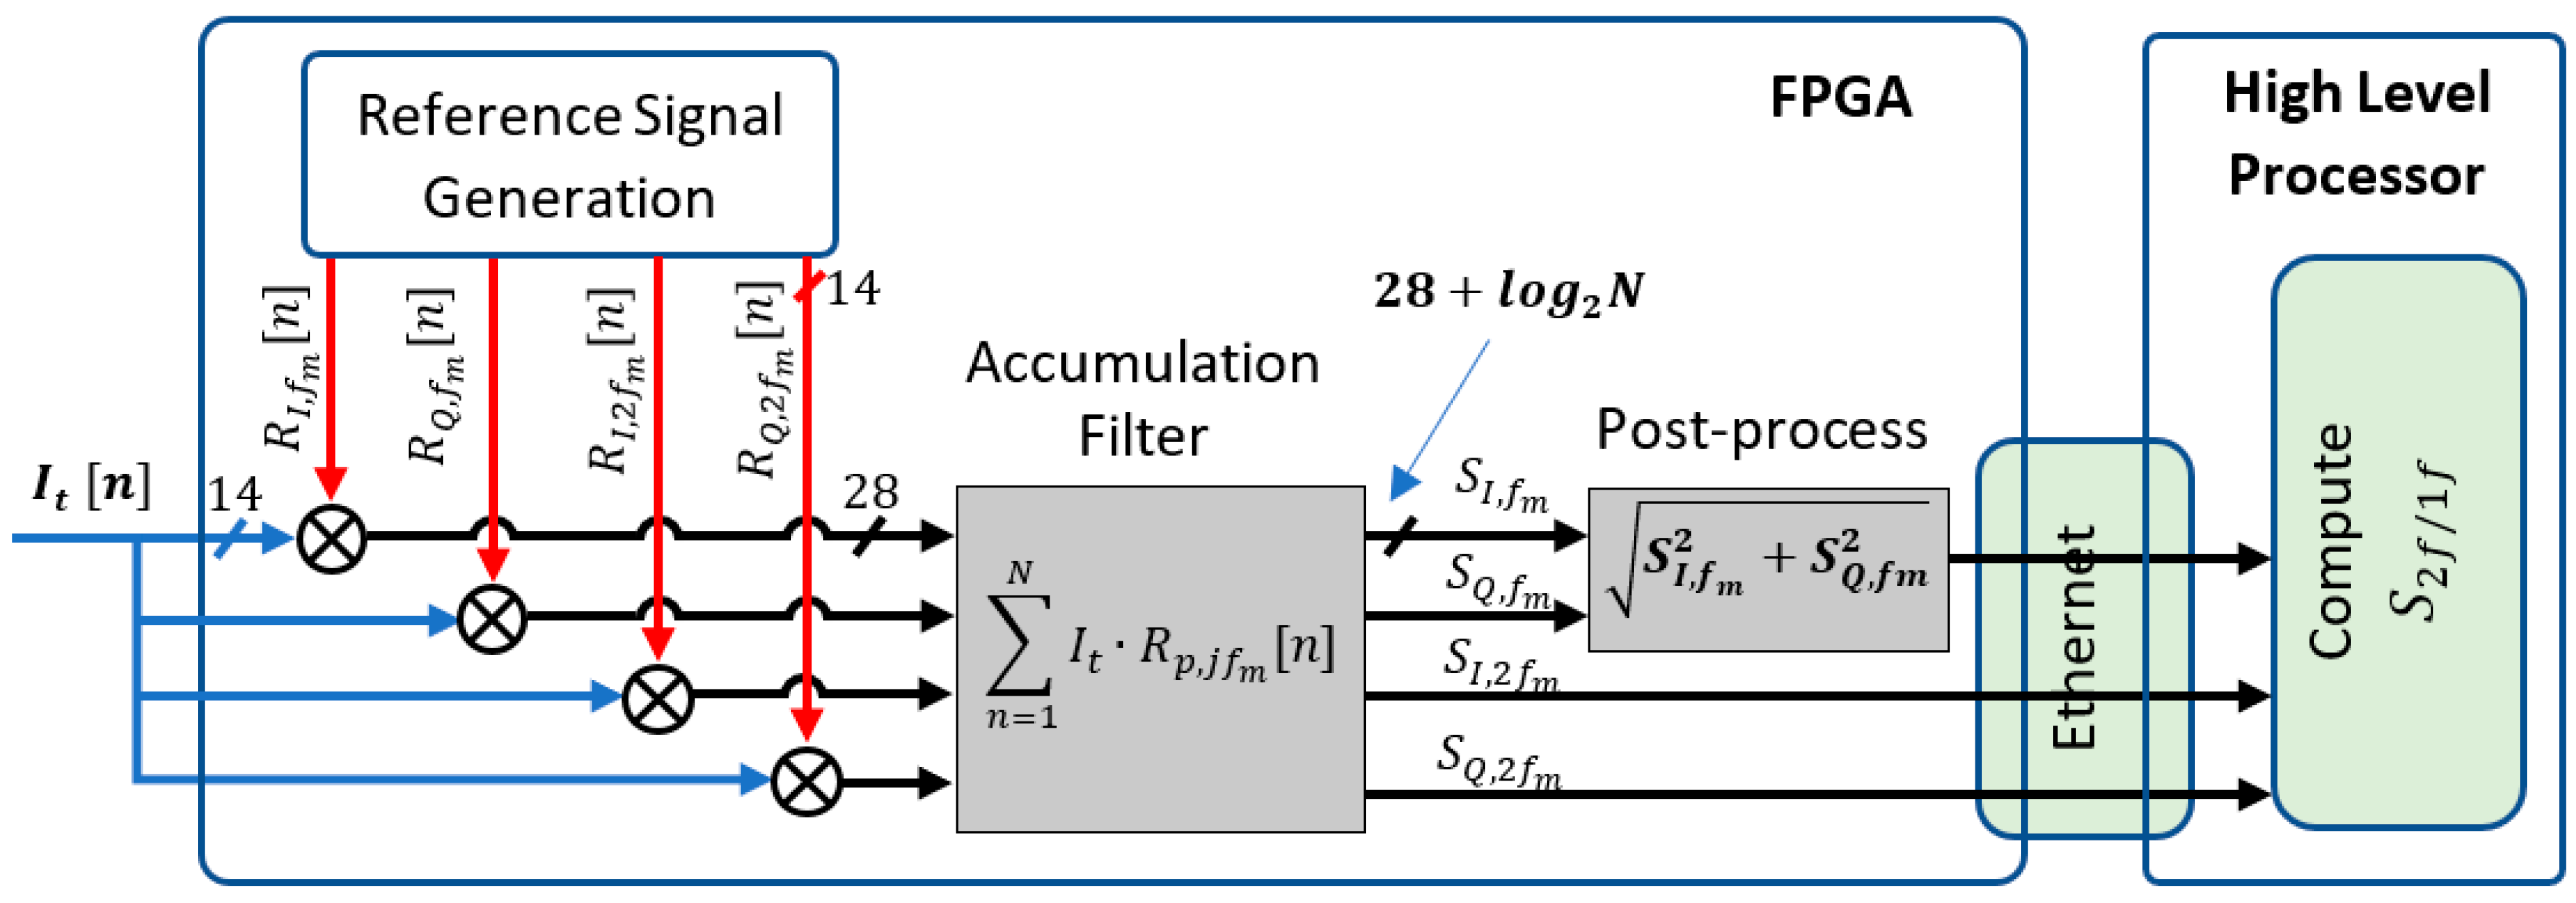
We present a novel harmonic extraction technique, aimed at higher accuracy and better temporal resolution, by leveraging more on-chip processing to minimise data transfer burden between the DAQ and the high-level processor. Figure 2 shows the architecture for the proposed harmonic extraction process.
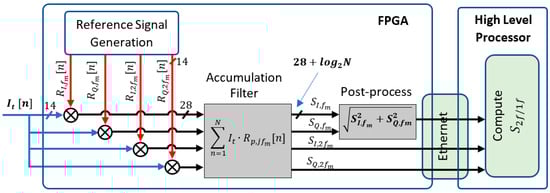
Figure 2.
Block diagram of real-time lock-in.
As shown, both in-phase and quadrature sinusoidal signals corresponding to both the first and second harmonics (i.e., and ) are digitally generated on-chip using AMD’s Direct Digital Synthesiser (DDS) IP, also known as Numerically Controlled Oscillator (NCO) [18]. The output frequency, , of the DDS IP is designed to be configurable, outputting multiple output modulation frequencies as desired. The governing relation for the output frequency of the DDS IP is
where is the input clock to the IP, is the phase increment, and is the modulus. was set as , and was chosen as 1000. By setting the values of to , the frequency of the first harmonics reference sinusoids, i.e., and was obtained as 125 kHz, while was set as 2 to obtain the frequency of the second harmonic reference sinusoids, i.e., and as 250 kHz.
After performing a sample-by-sample multiplication for each of the components, a low-pass filter (realised using an accumulation filter as shown) is used to remove high-frequency components to obtain the first and second harmonic in-phase and quadrature components: , and .
It must be noted that to achieve complete filtering using an accumulation filter (AF), the filter taps must align to the modulation cycles. Specifically, the integer, , in Equation (7) must be a multiple of [12], where is the ADC sampling rate. For a sampling rate, and a modulation frequency, , the number of samples accumulated, , must be times , where is the integer umber of modulation cycles. For this implementation, we chose a case of , i.e., .
To further reduce the amount of data transferred to the high-level processor, and to actualise a phase-insensitive demodulation, the first harmonics components are combined using
where is the first harmonic background amplitude. Three components: , and are then transmitted in real-time using TCP/IP protocol over Ethernet to a high-level processor. Note that for full-bit resolution, the number of bits of these components is . For , the number of bits to be transferred is 36 bits. It is worth nothing that for practical systems, the lower bits are truncated due to constraints such as bandwidth and embedded processor architecture [17,19]. However, bit truncation decreases the accuracy of the gas sensing system. We demonstrate in the result section that by increasing the on-chip processing, a better gas sensing accuracy is achieved. For our implementation, the computation of (and ) are performed using the full bits of the first harmonic components and . Hence, the accuracy of (and ) is enhanced. In addition, by minimising the number of components to be transferred to the high-level processor, less bit truncation is required compared to the standard I-Q method for a fixed system bandwidth.
For calibration-free WMS using first and second harmonics, background measurements are performed, whereby the non-absorbing transmitted signal, , obtained without the absorbing species present, but using same hardware to minimise measurement variations, is similarly demodulated to obtain the background in-phase and quadrature components: and .
Finally, the background-subtracted, -normalised signal, , is calculated on the high-level processor using
As detailed in [20], the peak value of the bears a strong correlation to the critical parameters of the gas sample. Hence, in this work, we extracted the peak value to determine the gas concentration as described in [14,20].
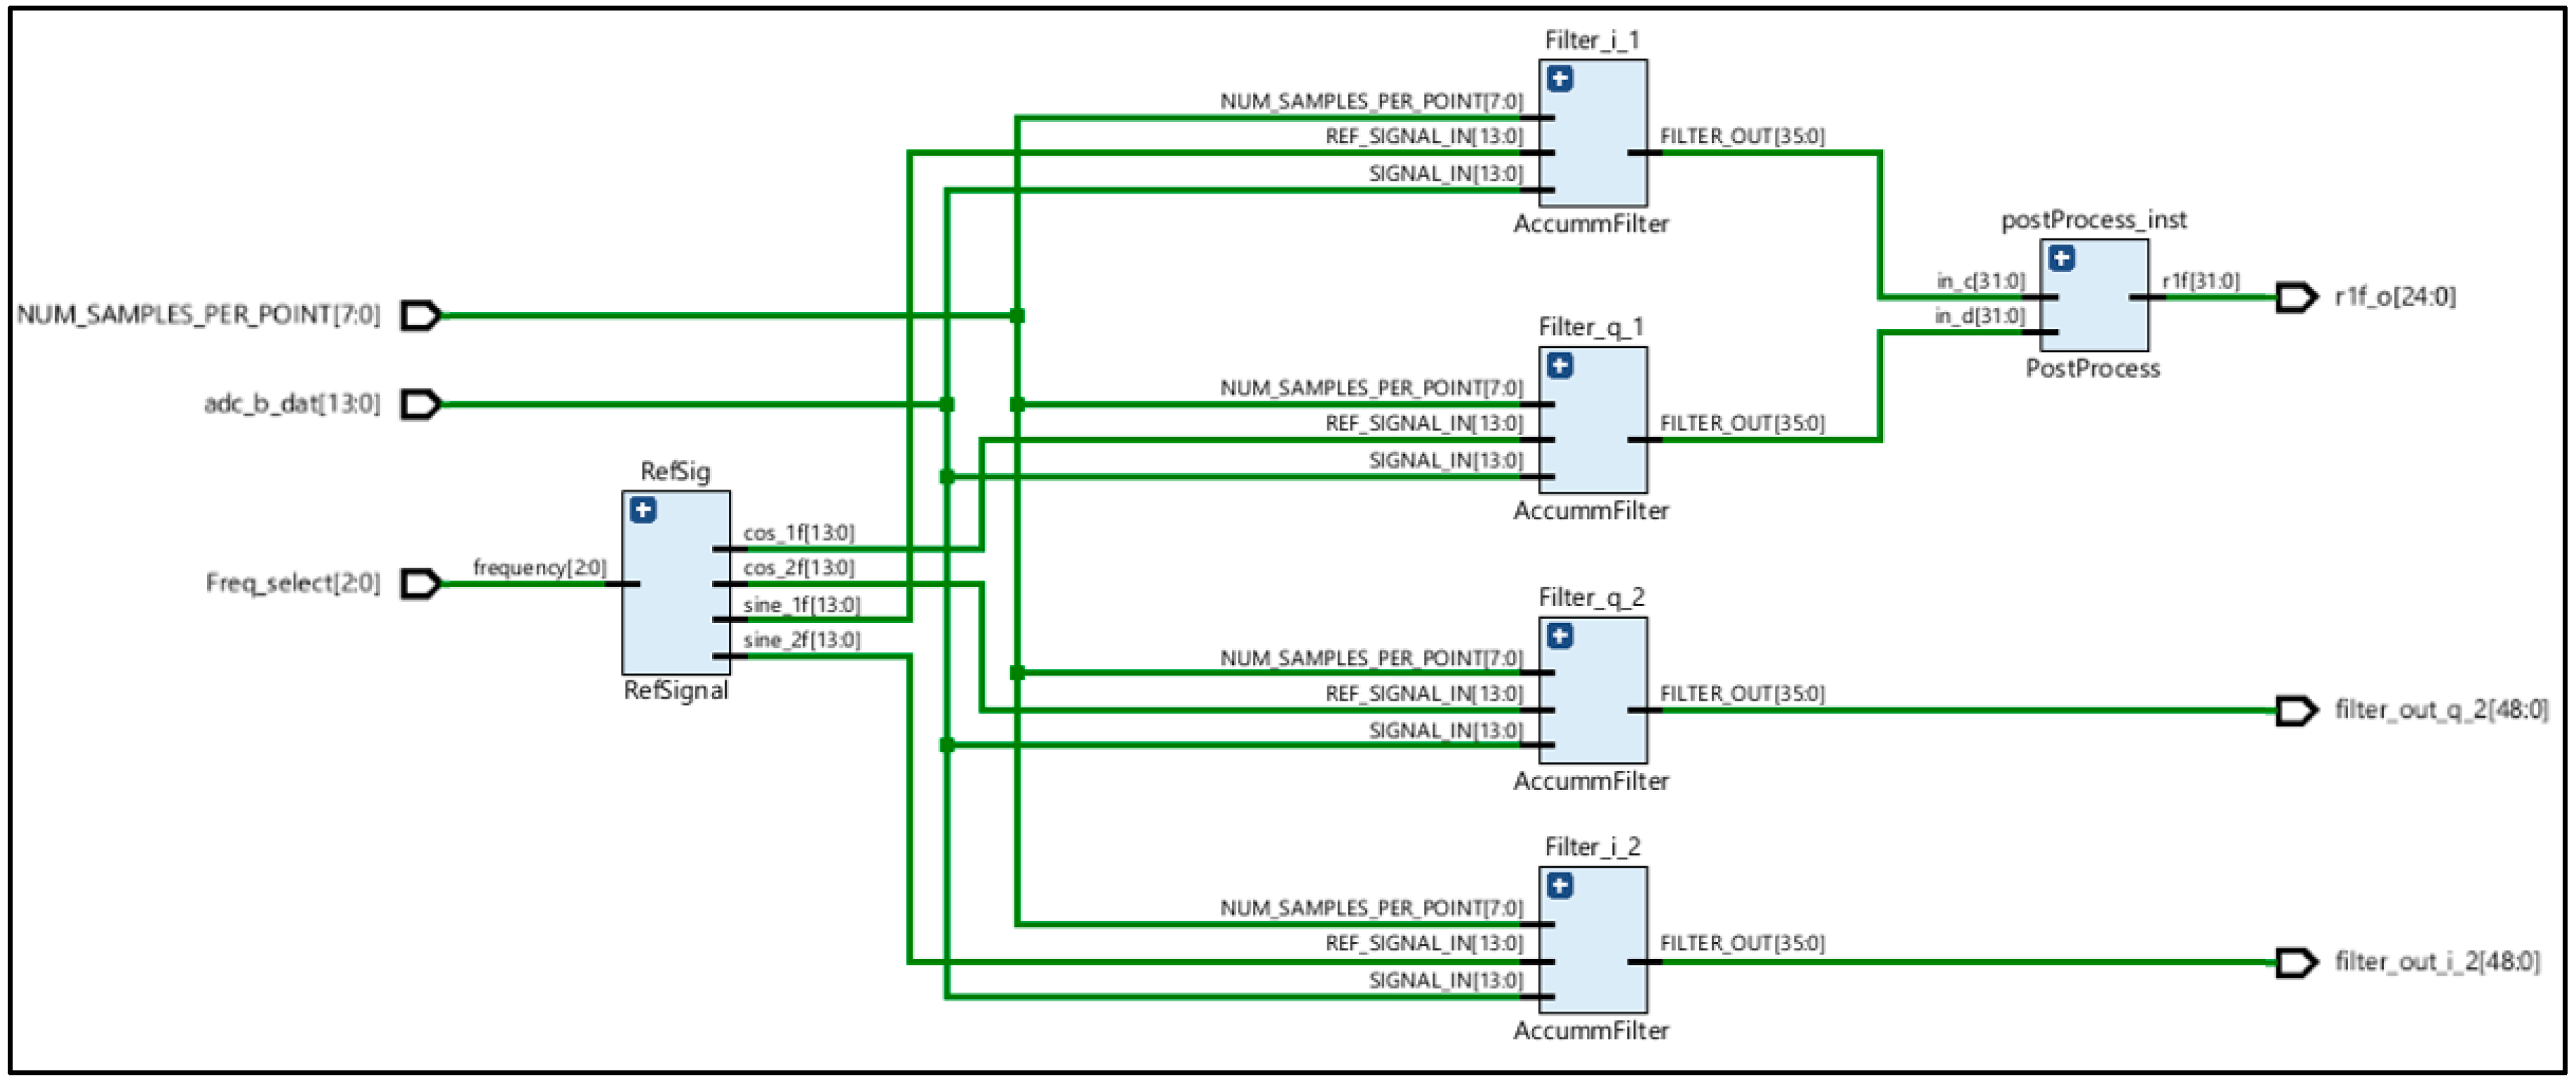
The architecture shown in Figure 2 and described above was implemented on the embedded FPGA (xc7z010clg400-1) within the Redpitaya Soc [21]. The Redpitaya is an open source, commercial off-the-shelf platform consisting of a fast -MSPs ADC tightly coupled with the AMD’s ZYNQ FPGA. An Ethernet port is also accessible for real-time data transfer from the SoC board to a PC. The firmware was coded with the Verilog Hardware Descriptive Language using the VIVADO (version 2022.2) development environment. Figure 3 shows the RTL of the implementation of the real-time demodulation process.
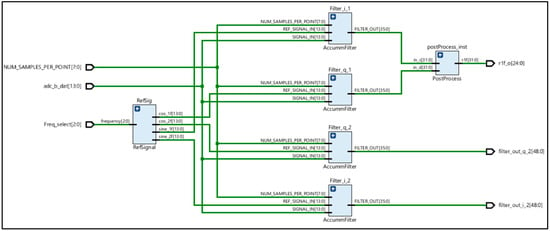
Figure 3.
RTL schematic of implemented real-time demodulation.
The demodulation architecture was integrated into the Redpitaya native firmware. The resource overhead of the lock-in process is shown in Table 2. These are discussed in Section 4.
Table 2.
Resource overhead of real-time demodulation firmware.
4. Experiments
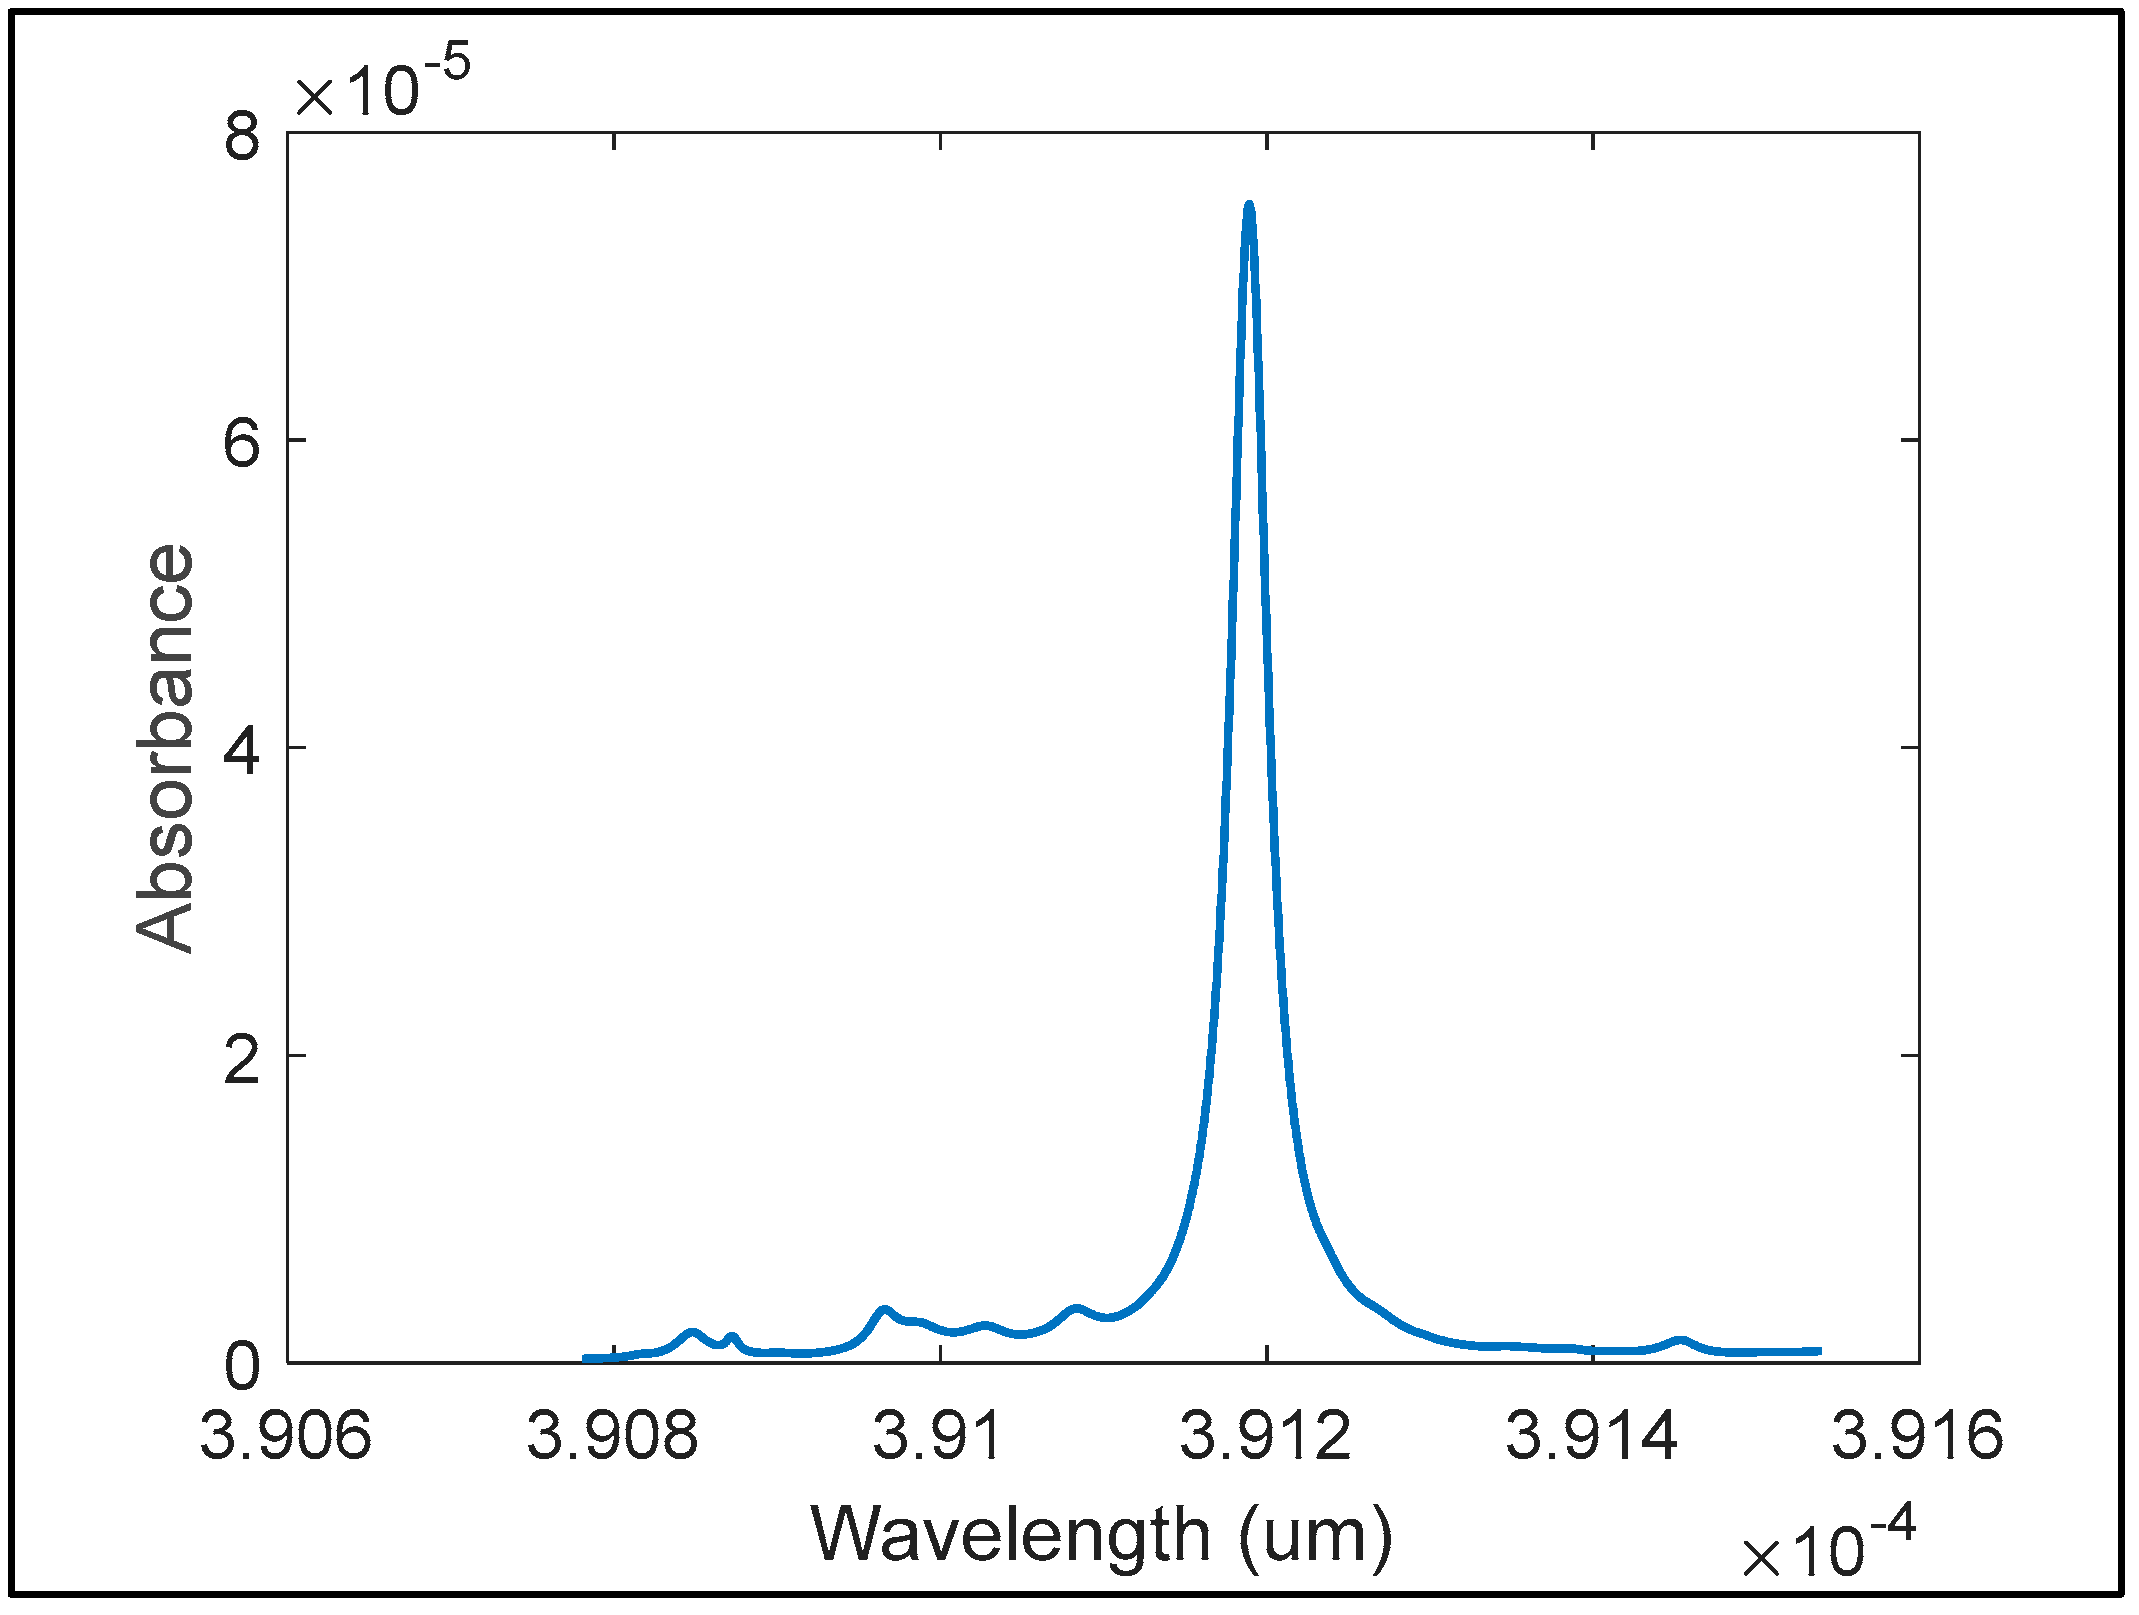
In order to validate and characterise the DAQ with embedded processing, we set up a WMS system and carried out measurements on it. For the WMS system, we used verified gas absorption data from the HITRAN database [22]. Water vapour (i.e., steam) at 1391 nm absorption line was used. The gas phase chamber is assumed to contain a mixture of water vapour and air, with the experiment aimed at accurately determining the concentration (i.e., the mole fraction) of the water vapour, assuming a constant temperature and pressure of 298 K and 1 atm, respectively, in the enclosure. The spectral absorption profile at these parameters is shown in Figure 4. The laser scan rate was set to 125 Hz, and the modulation frequency, , was 125 kHz. For WMS, to maximise the second harmonic signal, the modulation amplitude should be approximately 2.2 times the half width at half maximum (HWHM) of the absorption feature [23]. For our experiment, the modulation amplitude chosen was set as 0.006 cm−1, consistent with previous work [17]. The path length of the modulated laser output was set as 30 cm. Using the absorption data from HITRAN, transmitted signals were generated for six known relative concentrations of water vapour. An absorption-free signal is also generated at same conditions, with no water vapour present.

Figure 4.
Spectral absorption profile of water around 1391.
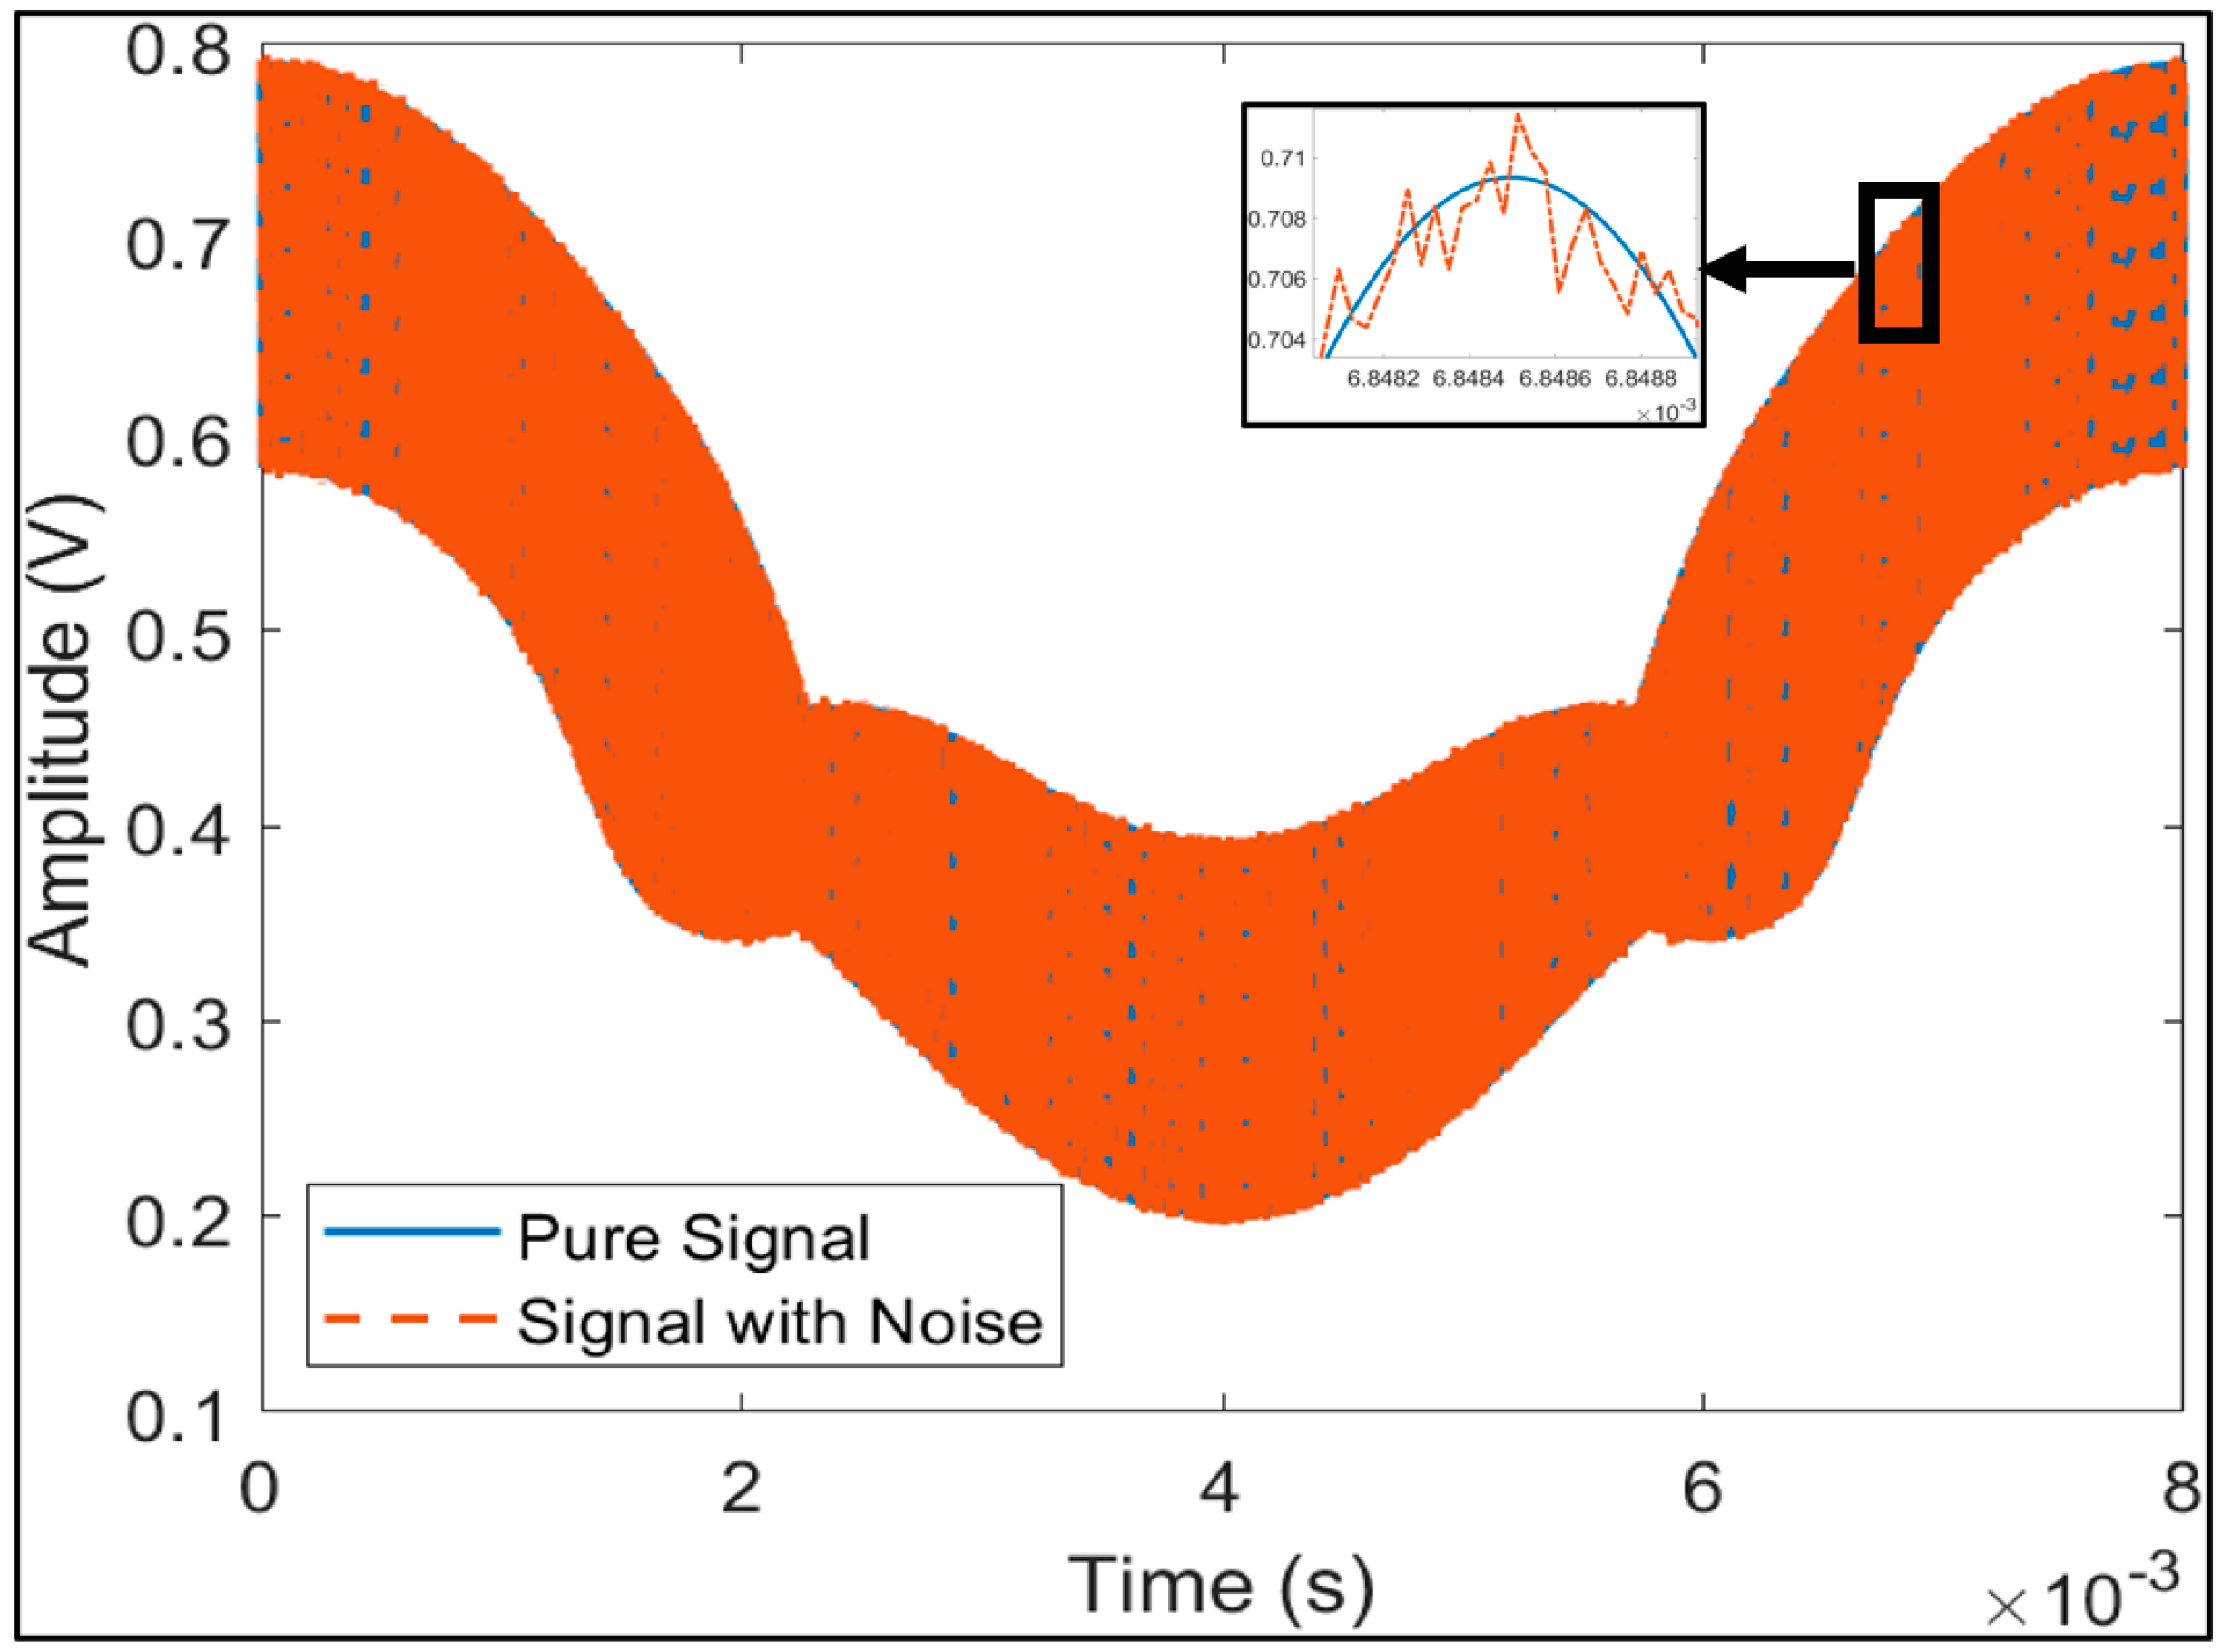
To account for noise from the photo detector (i.e., thermal noise) and signal amplification circuits, additive white Gaussian noise (AWGN) was added to the signals. The SNR of 56 dB was used based on estimate from previous work [17], in which an in-depth analysis of the noise components in a typical DAQ system for WMS is presented. We refer readers interested in the full analysis of the various noise sources to [17]. Noise from signal digitalisation circuits was excluded from the generated transmitted signal, as this will be incurred in our DAQ. Figure 5 show the signal generated.
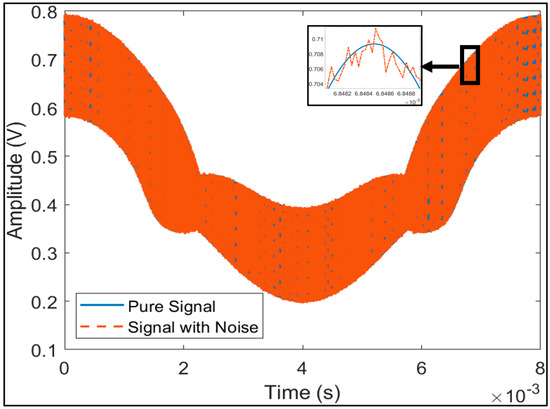
Figure 5.
Transmitted signal with 56 dB additive white Gaussian noise.
The signals (with and without absorption) were digitised and loaded into an arbitrary waveform generator, the output of which is directly connected to our DAQ system. The DAQ system digitises the signals and extracts the harmonics of interest (i.e., , and ), and as explained in Section 3.2, these were then transmitted in real time to a high-level processor, where post-processing was implemented to extract and gas concentration for each data frame. Figure 6 shows the hardware set up for the experiments.
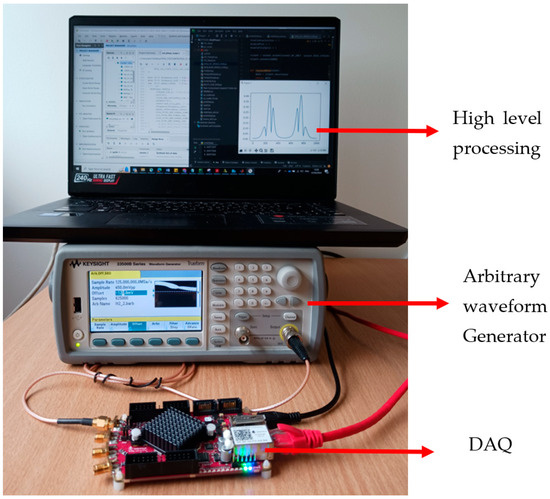
Figure 6.
DAQ set-up for WMS. The AWG contains signals generated from realistic absorption data from the HITRAN database. The generated signals are digitised, processed to extract harmonics of interest, and transmitted to a high-level processor.
5. Results and Discussion
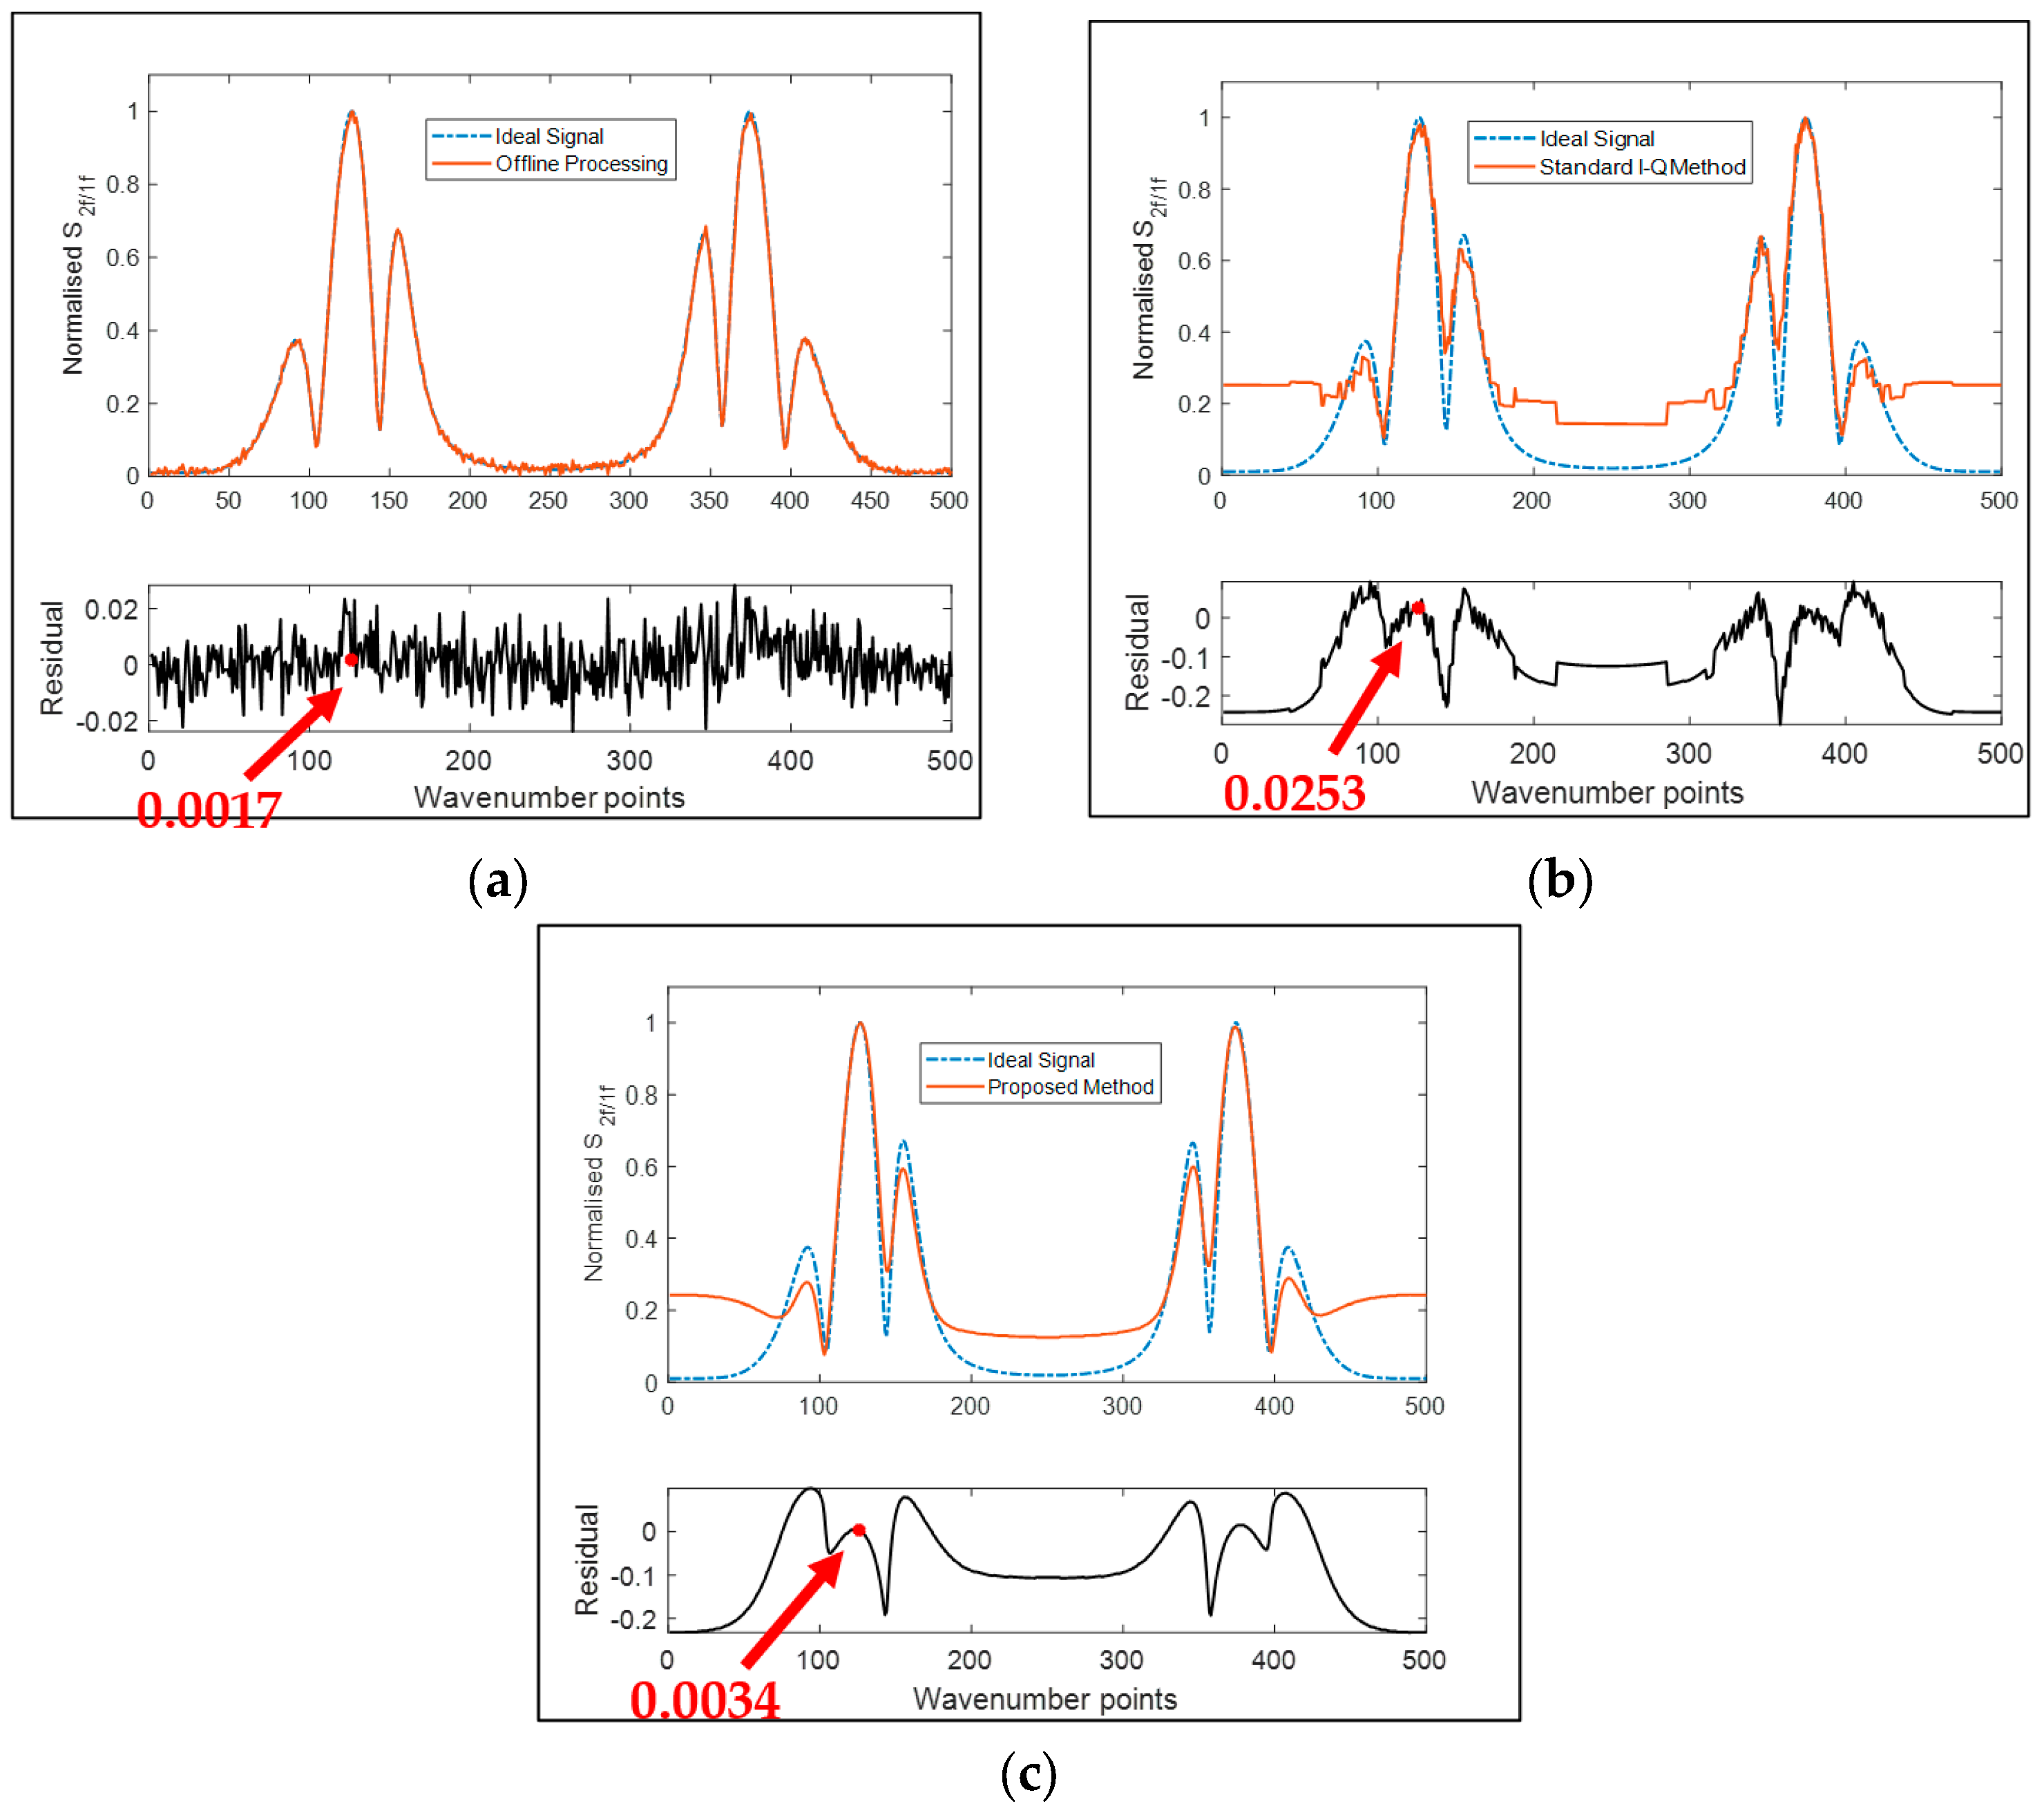
To examine the accuracy of the developed DAQ system, the was measured for a transmitted signal with a known water vapour mole fraction of 3%. The SNR of the transmitted signal was 56 dB [17]. The measured spectrum was compared with that obtained by digitising and demodulating the transmitted signal using MATLAB (i.e., ideal signal, with no noise and full bit resolution). For the same transmitted signal, the spectrum was also obtained for the two state-of-the-art approaches identified in Section 1: (a) using an offline raw data processing approach, and (b) using the standard I-Q demodulation method. Figure 7 shows a comparison of the results of the average of 20 measurements. In the offline processing approach, the DAQ samples the raw transmitted samples, and demodulation is completely done on the high-level processor, while in the standard I-Q method, four pre-processed components are sent to the high-level processing. For each of these methods, the spectrum was also compared with the ideal spectrum. As discussed earlier, the peak of the signal is proportional to the gas concentration. Hence, we first evaluated the performance of each of the signals around the peak of the spectrum.
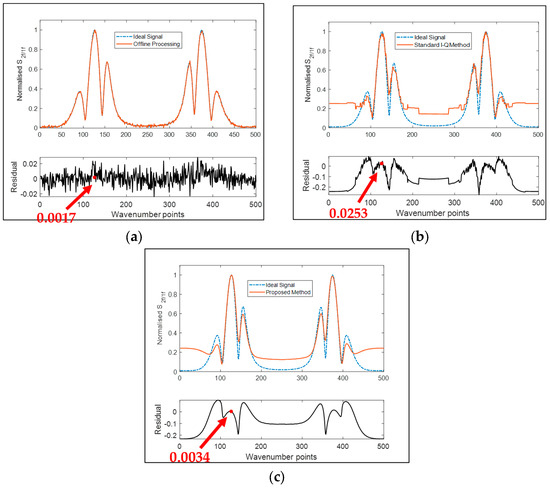
Figure 7.
Comparison of accuracy of the proposed DAQ system with conventional techniques. In (a), raw transmitted samples were demodulated offline on a high-level processor. In (b,c), the standard I-Q demodulated technique and the proposed DAQ system operated in real time for a fixed bandwidth.
As shown in the figure, the offline processing technique achieved the most accurate result around the peak point, with an error of 0.17%, while the standard I-Q method had an error of 2.53%. Our proposed technique had an error of 0.34%, which demonstrated the superior performance of the proposed technique over the standard I-Q method. The superior accuracy of the proposed technique is enabled by the additional on-chip processing, which minimises the amount of data to be transferred to the high-level processor.
It is worth noting that although the offline technique had a superior noise performance (Figure 7a), it had a very high bandwidth requirement. We quantified the bandwidth requirement for the three DAQ sensing architectures with the parameters above, i.e., sampling rate of 15.625 MSps, modulation frequency of 125 kHz, and a laser scan rate of 125 Hz. The required bandwidth is shown in Table 3. As is shown, for the real-time operation, the offline processing architecture had a bandwidth of 250 mega bits per second (Mbps), with the proposed technique requiring only 3 Mbps, only 1.2% of the bandwidth of the raw sample technique, an improvement of 98.8%. Furthermore, compared to the standard I-Q technique, an improvement of 25% in bandwidth is achieved. Therefore, for bandwidth constrained applications, the proposed technique will be a better choice.
Table 3.
Bandwidth requirement of DAQ architectures.
However, it is worth noting that for multiple species detection using frequency multiplexing (e.g., in [16]), the bandwidth requirements for both the standard I-Q and the proposed architecture doubles for each additional frequency. In this case, further analysis is needed to ascertain the bandwidth and accuracy improvements. Nevertheless, for single species detection using WMS or for multiple detection using time division multiplexing, the bandwidth and accuracy discussion above holds.
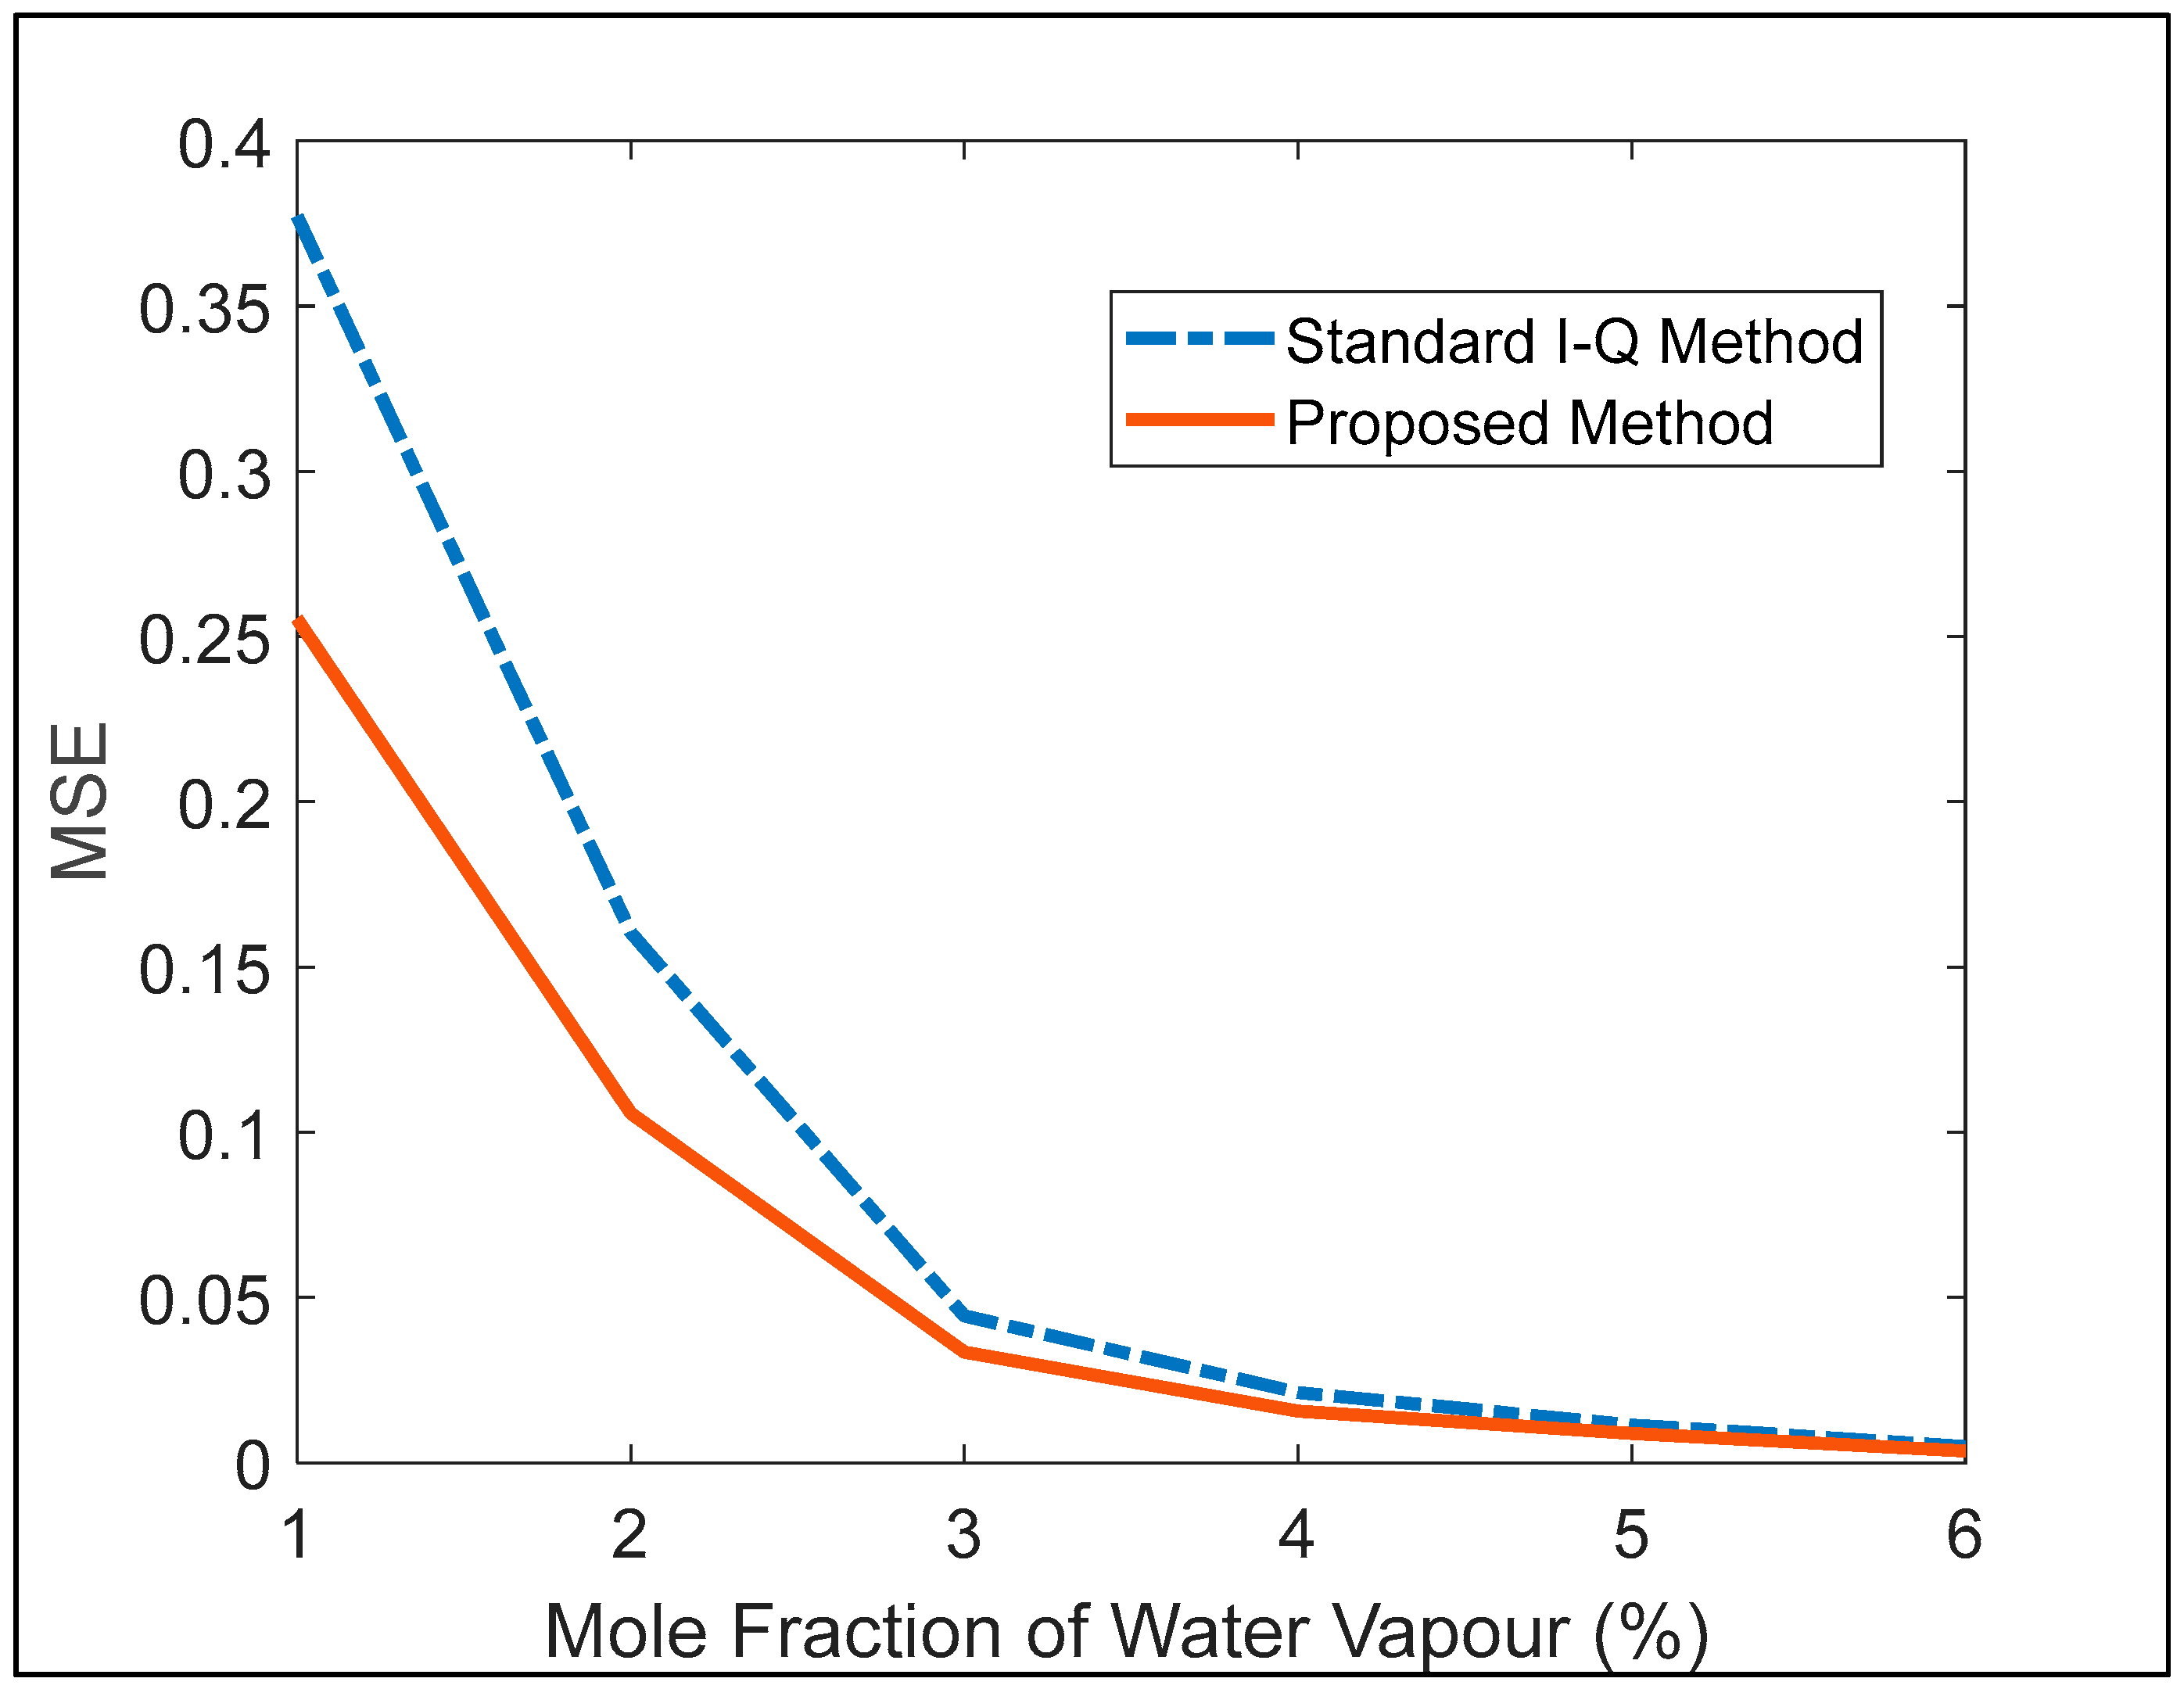
To further examine the accuracy of the proposed technique in the detection of trace gas levels, we measured the gas concentration using the developed DAQ system. Figure 8 shows the mean square error (MSE) of the retrieved concentration for various known mole fractions of water molecules (1% to 6%). As shown, the proposed system has a lower MSE, especially at lower gas concentration levels.
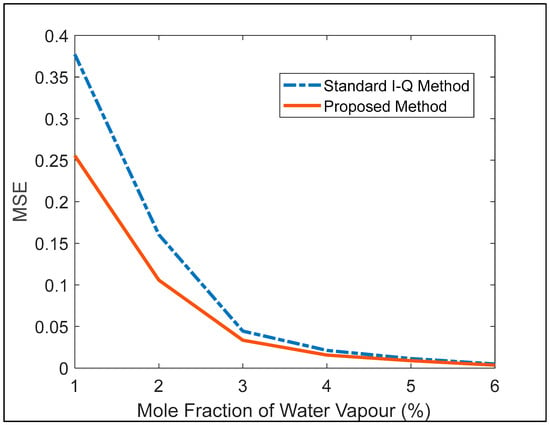
Figure 8.
Comparison of mean squared errors. The proposed DAQ method maintains a lower error value compared to the standard I-Q method.
6. Conclusions
In this paper, we present an FPGA-based DAQ architecture with embedded processing. The proposed architecture leverages real-time processing on-chip to extend the standard I-Q DAQ by minimising the amount of data sent to a high-level processor. To demonstrate feasibility, we implemented the proposed architecture on a commercial-of-the-shelf SoC board. Measurement results show that the proposed system has better accuracy compared to the standard I-Q architecture for the same signal bandwidth, especially in the detection of trace gas samples with low concentrations. In addition, it has a significantly lower bandwidth requirement compared to both the offline processing architecture and the standard I-Q architecture. Specifically, it is capable of reducing data transfer overhead by 25% compared to the standard I-Q method, and only requires a fraction of the bandwidth needed by the offline processing architecture. The proposed DAQ system has potential for more accurate and fast real-time gas sensing.
Author Contributions
Conceptualisation, G.E. and R.M.G.; methodology, R.M.G.; software, and validation, G.E.; resources, R.M.G.; data curation, G.E.; writing—original draft preparation, G.E. and R.M.G.; writing—review and editing, R.M.G. All authors have read and agreed to the published version of the manuscript.
Funding
This research received no external funding.
Institutional Review Board Statement
Not applicable.
Informed Consent Statement
Not applicable.
Data Availability Statement
No additional data are available. Gas absorption data from the HITRAN database, which are publicly available at https://hitran.org/ [Accessed on 28 May 2024] and https://www.spectraplot.com/absorption [Accessed on 28 May 2024], were used.
Acknowledgments
The authors wish to acknowledge the support of the SMART Technology Center of GCU and Hadi Larijani for the equipment support provided. Also, Chang Liu’s advice and suggestions are appreciated.
Conflicts of Interest
The authors declare no conflicts of interest.
References
- Dong, L.; Tittel, F.K.; Li, C.; Sanchez, N.P.; Wu, H.; Zheng, C.; Yu, Y.; Sampaolo, A.; Griffin, R.J. Compact TDLAS based sensor design using interband cascade lasers for mid-IR trace gas sensing. Opt. Express 2016, 24, A528. [Google Scholar] [CrossRef] [PubMed]
- Siozos, P.; Psyllakis, G.; Samartzis, P.C.; Velegrakis, M. Autonomous Differential Absorption Laser Device for Remote Sensing of Atmospheric Greenhouse Gases. Remote Sens. 2022, 14, 460. [Google Scholar] [CrossRef]
- Tsekenis, S.A.; Wilson, D.; Lengden, M.; Hyvönen, J.; Leinonen, J.; Shah, A.; Andersson, Ö.; McCann, H. Towards in-cylinder chemical species tomography on large-bore IC engines with pre-chamber. Flow Meas. Instrum. 2017, 53, 116–125. [Google Scholar] [CrossRef]
- Bao, Y.; Zhang, R.; Enemali, G.; Cao, Z.; Zhou, B.; McCann, H.; Liu, C. Relative Entropy Regularized TDLAS Tomography for Robust Temperature Imaging. IEEE Trans. Instrum. Meas. 2021, 70, 1–9. [Google Scholar] [CrossRef]
- Xu, L.; Liu, C.; Jing, W.; Cao, Z.; Xue, X.; Lin, Y. Tunable diode laser absorption spectroscopy-based tomography system for on-line monitoring of two-dimensional distributions of temperature and H2O mole fraction. Rev. Sci. Instrum. 2016, 87, 013101. [Google Scholar] [CrossRef] [PubMed]
- Fisher, E.M.D.; Benoy, T.; Humphries, G.; Wilson, D.; Lengden, M.; Johnstone, W.; McCann, H.; Tsekenis, S.-A.; Yang, Y.; Chighine, A.; et al. A Custom, High-Channel Count Data Acquisition System for Chemical Species Tomography of Aero-Jet Engine Exhaust Plumes. IEEE Trans. Instrum. Meas. 2020, 69, 549–558. [Google Scholar] [CrossRef]
- Zhang, R.; Xia, J.; Ahmed, I.; Gough, A.; Armstrong, I.; Upadhyay, A.; Fu, Y.; Enemali, G.; Lengden, M.; Johnstone, W.; et al. A fast sensor for non-intrusive measurement of concentration and temperature in turbine exhaust. Sens. Actuators B Chem. 2023, 396, 134500. [Google Scholar] [CrossRef]
- Henderson, B.; Khodabakhsh, A.; Metsälä, M.; Ventrillard, I.; Schmidt, F.M.; Romanini, D.; Ritchie, G.A.D.; Te Lintel Hekkert, S.; Briot, R.; Risby, T.; et al. Laser spectroscopy for breath analysis: Towards clinical implementation. Appl. Phys. B 2018, 124, 161. [Google Scholar] [CrossRef] [PubMed]
- Sun, K.; Chao, X.; Sur, R.; Goldenstein, C.S.; Jeffries, J.B.; Hanson, R.K. Analysis of calibration-free wavelength-scanned wavelength modulation spectroscopy for practical gas sensing using tunable diode lasers. Meas. Sci. Technol. 2013, 24, 125203. [Google Scholar] [CrossRef]
- Goldenstein, C.S.; Strand, C.L.; Schultz, I.A.; Sun, K.; Jeffries, J.B.; Hanson, R.K. Fitting of calibration-free scanned-wavelength-modulation spectroscopy spectra for determination of gas properties and absorption lineshapes. Appl. Opt. 2014, 53, 356. [Google Scholar] [CrossRef] [PubMed]
- Upadhyay, A.; Wilson, D.; Lengden, M.; Chakraborty, A.L.; Stewart, G.; Johnstone, W. Calibration-Free WMS Using a cw-DFB-QCL, a VCSEL, and an Edge-Emitting DFB Laser With In-Situ Real-Time Laser Parameter Characterization. IEEE Photonics J. 2017, 9, 1–17. [Google Scholar] [CrossRef]
- Chighine, A.; Fisher, E.; Wilson, D.; Lengden, M.; Johnstone, W.; McCann, H. An FPGA-based lock-in detection system to enable Chemical Species Tomography using TDLAS. In Proceedings of the 2015 IEEE International Conference on Imaging Systems and Techniques (IST), Macau, China, 16–18 September 2015; pp. 1–5. [Google Scholar]
- Jiang, C.; Liu, Y.; Yu, B.; Yin, S.; Chen, P. TDLAS-WMS second harmonic detection based on spectral analysis. Rev. Sci. Instrum. 2018, 89, 083106. [Google Scholar] [CrossRef] [PubMed]
- Rieker, G.B.; Jeffries, J.B.; Hanson, R.K. Calibration-free wavelength-modulation spectroscopy for measurements of gas temperature and concentration in harsh environments. Appl. Opt. 2009, 48, 5546. [Google Scholar] [CrossRef] [PubMed]
- Benoy, T.; Wilson, D.; Lengden, M.; Armstrong, I.; Stewart, G.; Johnstone, W. Measurement of CO2 Concentration and Temperature in an Aero Engine Exhaust Plume Using Wavelength Modulation Spectroscopy. IEEE Sens. J. 2017, 17, 6409–6417. [Google Scholar] [CrossRef]
- Zou, M.; Sun, L.; Wang, X. Multigas Sensing Based on Wavelength Modulation Spectroscopy Using Frequency Division Multiplexing Combined With Time Division Multiplexing. IEEE Sens. J. 2022, 22, 12930–12938. [Google Scholar] [CrossRef]
- Enemali, G.; Zhang, R.; McCann, H.; Liu, C. Cost-Effective Quasi-Parallel Sensing Instrumentation for Industrial Chemical Species Tomography. IEEE Trans. Ind. Electron. 2022, 69, 2107–2116. [Google Scholar] [CrossRef]
- AMD. DDS Compiler LogiCORE IP Product Guide (PG141). May 2024. Available online: https://docs.amd.com/r/en-US/pg141-dds-compiler/Introduction (accessed on 14 June 2024).
- Xia, J.; Enemali, G.; Zhang, R.; Fu, Y.; McCann, H.; Zhou, B.; Liu, C. FPGA-Accelerated Distributed Sensing System for Real-Time Industrial Laser Absorption Spectroscopy Tomography at Kilo-Hertz. IEEE Trans. Ind. Inform. 2024, 20, 2529–2539. [Google Scholar] [CrossRef]
- Xu, L.; Xue, R.; Li, Y.; Zhang, H.; Cao, Z. FPGA-Based Real-Time Implementation of Temperature Measurement via Tunable Diode Laser Absorption Spectroscopy. IEEE Sens. J. 2018, 18, 2751–2758. [Google Scholar] [CrossRef]
- Redpitaya. Stemlab-125-14. Available online: https://redpitaya.com/product-category/stemlab-125-14/ (accessed on 1 March 2024).
- Gordon, I.E.; Rothman, L.S.; Hill, C.; Kochanov, R.V.; Tan, Y.; Bernath, P.F.; Birk, M.; Boudon, V.; Campargue, A.; Zak, E.J.; et al. The HITRAN2016 molecular spectroscopic database. J. Quant. Spectrosc. Radiat. Transf. 2017, 203, 3–69. [Google Scholar] [CrossRef]
- Arndt, R. Analytical line shapes for Lorentzian signals broadened by modulation. J. Appl. Phys. 1965, 36, 2522–2524. [Google Scholar] [CrossRef]

Disclaimer/Publisher’s Note: The statements, opinions and data contained in all publications are solely those of the individual author(s) and contributor(s) and not of MDPI and/or the editor(s). MDPI and/or the editor(s) disclaim responsibility for any injury to people or property resulting from any ideas, methods, instructions or products referred to in the content. |
© 2024 by the authors. Licensee MDPI, Basel, Switzerland. This article is an open access article distributed under the terms and conditions of the Creative Commons Attribution (CC BY) license (https://creativecommons.org/licenses/by/4.0/).