Article

New Display Technologies: The Most Desired Usage Properties and Their Perception during Product Interaction

by
Maria-Jesus Agost
* and
Vicente Bayarri-Porcar
*
Department of Mechanical Engineering and Construction, Universitat Jaume I, 12071 Castelló, Spain
*
Authors to whom correspondence should be addressed.
Appl. Sci. 2024, 14(15), 6739; https://doi.org/10.3390/app14156739
Submission received: 28 June 2024 / Revised: 25 July 2024 / Accepted: 30 July 2024 / Published: 1 August 2024

Abstract

:
Display technologies influence user experience, not only through the perception of product features but also due to their own usage properties. In this work, 12 functional, usable, pleasuring, and media usage properties were analysed for five display technologies: image rendering, 360° rotation, and augmented, immersive, and non-immersive virtual reality. The perception of their importance and their assessment for the chosen technologies were studied by taking two different household products. Two variables for studying decision and expectations were also considered. The results showed that 360° rotation was well-valued in various properties, mainly related to functionality and usability, while the immersive virtual technology stood out in media properties and also in the most important feature: realism. It was also seen that the results could depend on the displayed product. These results provide a deeper insight for user experience optimisation because they complement the information to choose the most appropriate display technology based on the properties to be prioritised.

1. Introduction

Society is increasingly addressing relations towards digital contexts. Activities like shopping, learning, having fun, meeting, etc., are frequently carried out in virtual environments. This entails the continued development of new display technologies that allow users to interact with other people, objects, or environments. The first ones featured, for example, software platforms to make connections through video-chat or other tools and resources to manage learning or fun experiences. New technologies for displaying objects are increasingly being used in utilities like electronic commerce, for assessing product design in early stages, and in other contexts like entertainment. This is the case of certain technologies like 360° realistic 3D image systems (360° rotation) or augmented or virtual reality devices.
The use of these new technologies involves having to constantly study improvements in how to display product information. The presentation method by means of realistic 3D images in 360° rotation allows a product to be viewed from any angle because the user can rotate it in any direction. In an interactive way, augmented reality (AR) technology enables superimposing a virtual layer composed of elements, such as images or texts, on real environments [1]. Virtual reality (VR) allows the user to be immersed in a totally virtual environment. VR systems can be classified into two categories: immersive and non-immersive systems [2]. Non-immersive VR (ni_VR) encompasses a virtual representation of an environment displayed on a monitor [3]. In immersive virtual reality (i_VR), the virtual representation is displayed as a realistic experience by head-mounted displays [4] and provides the user with the sensation of being inside the environment.
Employing different interaction technologies and tools influences user perceptions because, as it is well-known, the channel (the interaction environment) is one of the fundamental elements of the communication process [5]. Research has been conducted to analyse the influence of the type and level of interaction on users’ product perceptions [6,7]. Likewise, several studies have been carried out to analyse the influence of specific display technologies on the perceptions of product features, comparing product perceptions generated through the use of one or more technologies or with images or the real product [8,9,10,11,12]. Some studies have focused on more specific aspects, such as including interactions with the product through haptics [13] or comparing different tools for assessment in early design stages [14,15]. Agost et al. [16] compare the perceptions of 10 product features for five display technologies and also to those generated in the interaction with the real product, by emphasising the importance of selecting the appropriate technology according to product type and the features to be assessed.
However, the use of new display technologies is not only conditioned by the generation of perceptions of product features, but also those generated of the usage properties of technologies, such as a technology’s ability to offer a realistic representation, to visualise an object from different angles, if it is easy to use, or if it is easily accessible. As Kim and Rhiu [17] stated, usability evaluation tools can provide deeper insights into the user experience by helping to identify areas for improvement and ways to make right decisions.
Therefore, in addition to analysing how display technology influences the perception of product design features, we also propose to examine how the technology’s usage properties might influence user perceptions and experiences. The research conducted in this context relates primarily to specific technologies [17,18] or to the overall multimedia environment [19,20]. This study aims to examine and compare perceptions about varied usage properties generated by different display technologies. The main purpose is to enhance the available information for selecting the best technology to optimize user experience. To do this, we used two products with distinct characteristics, to assess the potential impact of the displayed product on the perception of usage properties.
In order to conduct this analysis, it is important to define the usage properties that are of interest. This can be achieved by reviewing conceptual models and previous research [21,22,23,24]. When considering the various usage properties of display technologies, the focus should not only be on functionality and usability, but also on emotional or pleasurable aspects [25], as well as characteristics related to media [23], because the importance that users attach to usage properties may be influenced by the type of property.
Therefore, the following research questions are raised:
RQ1. 
Do perceptions depend on the usage properties of the display technology? Do they depend on the product displayed?
RQ2. 
Does the type of usage property influence the importance given to it?
RQ3. 
Does display technology influence decision making and compliance with users’ expectations?
A comparative analysis was conducted about the perceived importance and assessment of twelve usage properties by considering five different product display technologies: 2D, 360°, AR, ni_VR, and i_VR. The assessed usage properties were selected from previous works to cover a variety of functional, usable, emotional, and media characteristics. Two additional variables were taken as indicators of decision and preference.
Some preliminary partial results of the study are published in [26] but are presented in more breadth and depth in the present manuscript. This study also supplements a previous work [16], which analysed the influence of display technologies on the perception of product features so that an overview of the product presentation effect of display technologies on user interaction could be obtained. This information is interesting in many fields, such as online showcases and sales webs, tools for early assessments of product design and development, among others. Section 2 presents previous related work. Section 3 describes the materials and methods followed to carry out the study. Section 4 presents the results, which are discussed in Section 5. Finally, Section 6 indicates the main conclusions drawn from the work.

2. Related Work

2.1. User Experience: Perceptions in Interaction with New Display Technologies

Extended reality (XR) technology, including AR and VR, has been applied in different domains, as it presents promising opportunities for transforming commerce, management, and business education [27], among other areas. Thus, augmented reality, which displays virtual images of a product in a real environment, has applications in diverse fields such as manufacturing, learning, medicine, or marketing [1,23,28,29]. In VR technology, the entire environment with which the user interacts is virtual. VR systems are also applied in domains such as education, industry, health, or retail, among others [30,31,32,33,34,35].
This growth of the development of new display devices and systems has caused the need to analyse their influence on the subjective perceptions generated in the user [36], since the user’s responses and decisions depend on these perceptions [37,38]. Studies have emerged comparing some of these new display technologies with classic display methods, such as the comparison between AR technologies and traditional web-based product presentations [8] or between non-immersive VR and static photos [9]. In other cases, several display technologies are compared between them, sometimes including haptics [12,13,15] or with the real interaction of the product [10,11,39]. Sometimes, studies are focused on product assessment in the early stages of the product development process [10,40].
The results of these studies allow us to conclude that the perception of certain product features depends on the display technology used. For example, Galán et al. [13] stated that the attractiveness and size of the product (a chair) was perceived to be higher in real interaction than through VR. However, these studies usually compare few technologies or are applied to a single product. The work by Agost et al. [16] compared the perceptions achieved in 10 design features, related to physical, detailed, functional, and aesthetic aspects, in five display technologies (image rendering, 360° rotation display, augmented reality, and non-immersive and immersive VR), for two different products, finding that 360° rotation provided the best perception for what are considered the most important features, while aesthetic features were better achieved by immersive VR.
But the overall user experience goes further and will be conditioned by the usage properties offered by display technologies, so its analysis involves expanding the understanding necessary to optimize the way products are presented. There are numerous studies that analyse user preferences and perceptions generated in the interaction with technologies, such as the study by Van Damme et al. [41], in which three interaction methods in virtual reality were compared (haptic feedback, traditional controls, and hand tracking) and their influence on user experience was evaluated, concluding that users felt an aversion to non-haptic hand tracking in simpler tasks and preferred controllers in more complex ones. Also for applications of AR technology, some studies compared user experience depending on the type of interaction, such as the study by Gan et al. [42] in which it was seen that humanoid intelligent virtual agents with or without emotional expressions provided greater credibility, attractiveness, and novelty than a voice assistant, so their incorporation in AR applications could be beneficial. Gatullo et al. [43] is another example. They developed a desktop-simulated testing environment to experiment on information presentation with AR remotely. Users rated the pragmatic qualities of efficiency, perspicuity, and dependability as good, while attractiveness and stimulation were rated as excellent.
Kim and Rhiu [17] carried out a literature review of previous studies to evaluate the perceived usability of VR systems by employing measurements, such as Comfort, Complexity, Easy to use, Enjoy, Functionality, Realistic, Satisfaction, or Willing to use, from which they proposed and validated the Virtual Reality System Usability Questionnaire. Picardi et al. [18] emphasized the need for user-centred evaluations, establishing and proposing a structured framework to evaluate AR systems and developing methods to address usability, user experience, and interaction in AR technologies. Al-kfairy et al. [19] explored the user experience in the metaverse, an evolving field that uses new technologies, including AR and VR. These authors conducted a comprehensive literature review and an in-depth analysis to investigate user perceptions within the metaverse, focusing on usability, social influence, and interoperability, The results showed trends and highlighted areas for future research. In Al-Adaileh et al. [20], the perceptions generated on the Metaverse Marketplace were studied, enriching the vision of technologies in virtual environments so that they are secure, engaging, and user-friendly.
Therefore, although user perceptions in interaction with new technologies have been studied, many of these studies are focused on a single type of technology, or perceptions are analysed in global new virtual spaces. There is a lack of studies that consider a wide range of usage properties. Usability and user experience in AR and VR interfaces for uses such as purchasing products online are not sufficiently explored [44].

2.2. Usage Properties in Display Technologies

Some conceptual models propose factors related to the adoption of either a given technology or a behavioural intention [21], and the Technology Adoption Model (TAM) is probably one of the best known and most widely used [22]. This model is based on two factors to determine the user adoption of a technology or a system: usefulness and perceived ease of use. Saprikis et al. [21] pointed out that, in addition to these two factors, some authors have considered other concepts to study the intention to adopt a technology, such as functional benefits [45] or other more subjective ones, where enjoyment stands out [46,47,48]. Additionally, the Unified Theory of Acceptance and Use of Technology (UTAUT) considers other constructs, such as performance expectancy, effort expectancy, social influence, and facilitating conditions [49,50].
Furthermore, Javornik [23] stated that current interactive technologies share media characteristics, defined as “communication variables that are connected to the aspects of communication that represent an exchange and transmission of messages with various entities” [51,52]. Javornik [23] offered a literature review and proposed a framework that includes the main media characteristics of interactive technologies. Of these media characteristics, Interactivity can be defined as “the choices provided to users and the ability to go back and forth with the interface” [53]. Other relevant media characteristics are Mobility, defined as “Portability and wearability that allow a mobile use” [54,55] or Virtuality, as “the media’s capacity of showing virtual elements or virtual worlds, as experienced by the user through immersion or telepresence in the environment created by computer graphics or visual elements” [56,57].
Verhagen et al. [24] highlighted Tangibility as another potential key factor in online product evaluations. They proposed and tested a model by relating product tangibility to three product presentation formats: static pictures, 360 spin rotation, and a virtual mirror. Participants were assigned one of these displays and inspected five pairs of sunglasses. Product tangibility was mostly achieved by virtual mirrors, followed by 360 rotation, and finally by pictures.

3. Materials and Methods

An experiment was designed to analyse the differences between display technologies in the perception of a selection of their usage properties, referred to functionality, usability, pleasure, and media aspects. Five different display technologies (image rendering, 360° rotation display, augmented reality, and immersive and non-immersive reality) were selected to show well-known household products in an online sales context: a sideboard and a gooseneck lamp. Seventy-seven participants interacted with a selection of these technologies to view products and subsequently assessed each technology’s ability to deliver usage properties.

3.1. Selection of Subjects

The participants were students in the third year of the Degree in Engineering in Industrial Design and Product Development. Although 96 students were initially invited to participate, 77 participants (36 females, 41 males), aged between 18 and 29 years, finally took part and provided valid data.
They were selected to participate in a set of studies related to the perceptions generated when using product display technologies. Due to their academic background in product design, it was expected that they would pay more attention to interaction details and the accurate display of the product design. Additionally, they were expected to have experience with using new technologies. Participants signed an informed consent document, which had been approved by the University Deontological Committee, as well as the experiment itself.

3.2. Selection of Display Technologies and Their Usage Properties

Five display technologies were considered, image rendering (2D), 360 rotation display (360°), augmented reality (AR), non-immersive virtual reality (ni_VR) and immersive virtual reality (i_VR), to include a wide range of the main technologies currently used to display products.
For the usage properties to be selected, the intention was for them to be representative of a variety of characteristics and not be focused only on functionality and usability, to collect different aspects of a global product experience. Therefore, in addition to the usefulness and ease of use, other functional and also more subjective benefits should be considered [21]. On the one hand, the three levels of the hierarchy of users’ needs proposed by Jordan [25] were considered to collect characteristics from the literature [17,21,22,45] related to the functionality, usability, and enjoyment (pleasure) of the technology. At the basic functionality level, Realism and Usefulness were considered. The possibility of observing the product from different perspectives (referred to as Angle) was added as a distinguishing feature between the traditional 2D display method and new technologies. The properties Easiness, Comfort, and Trust in product display were selected at the usability level. Finally, at the pleasure level, properties related to emotional benefits were considered, such as Satisfactory experience and Fun.
Furthermore, three media characteristics of interactive technologies were adapted from the review by Javornik [23]: Interactivity, Immersivity, and Availability (from the original Virtuality and Mobility, respectively). Tangibility was also added as a factor in product evaluation [24]. The complete list of usage properties and their description in the study are shown in Table 1.
As global indicators, two variables related to the affective and emotional aspect were added: Decision, to assess whether the display technology influences the final decision; Expectations, to rate if the display technology meets the user’s expectations.

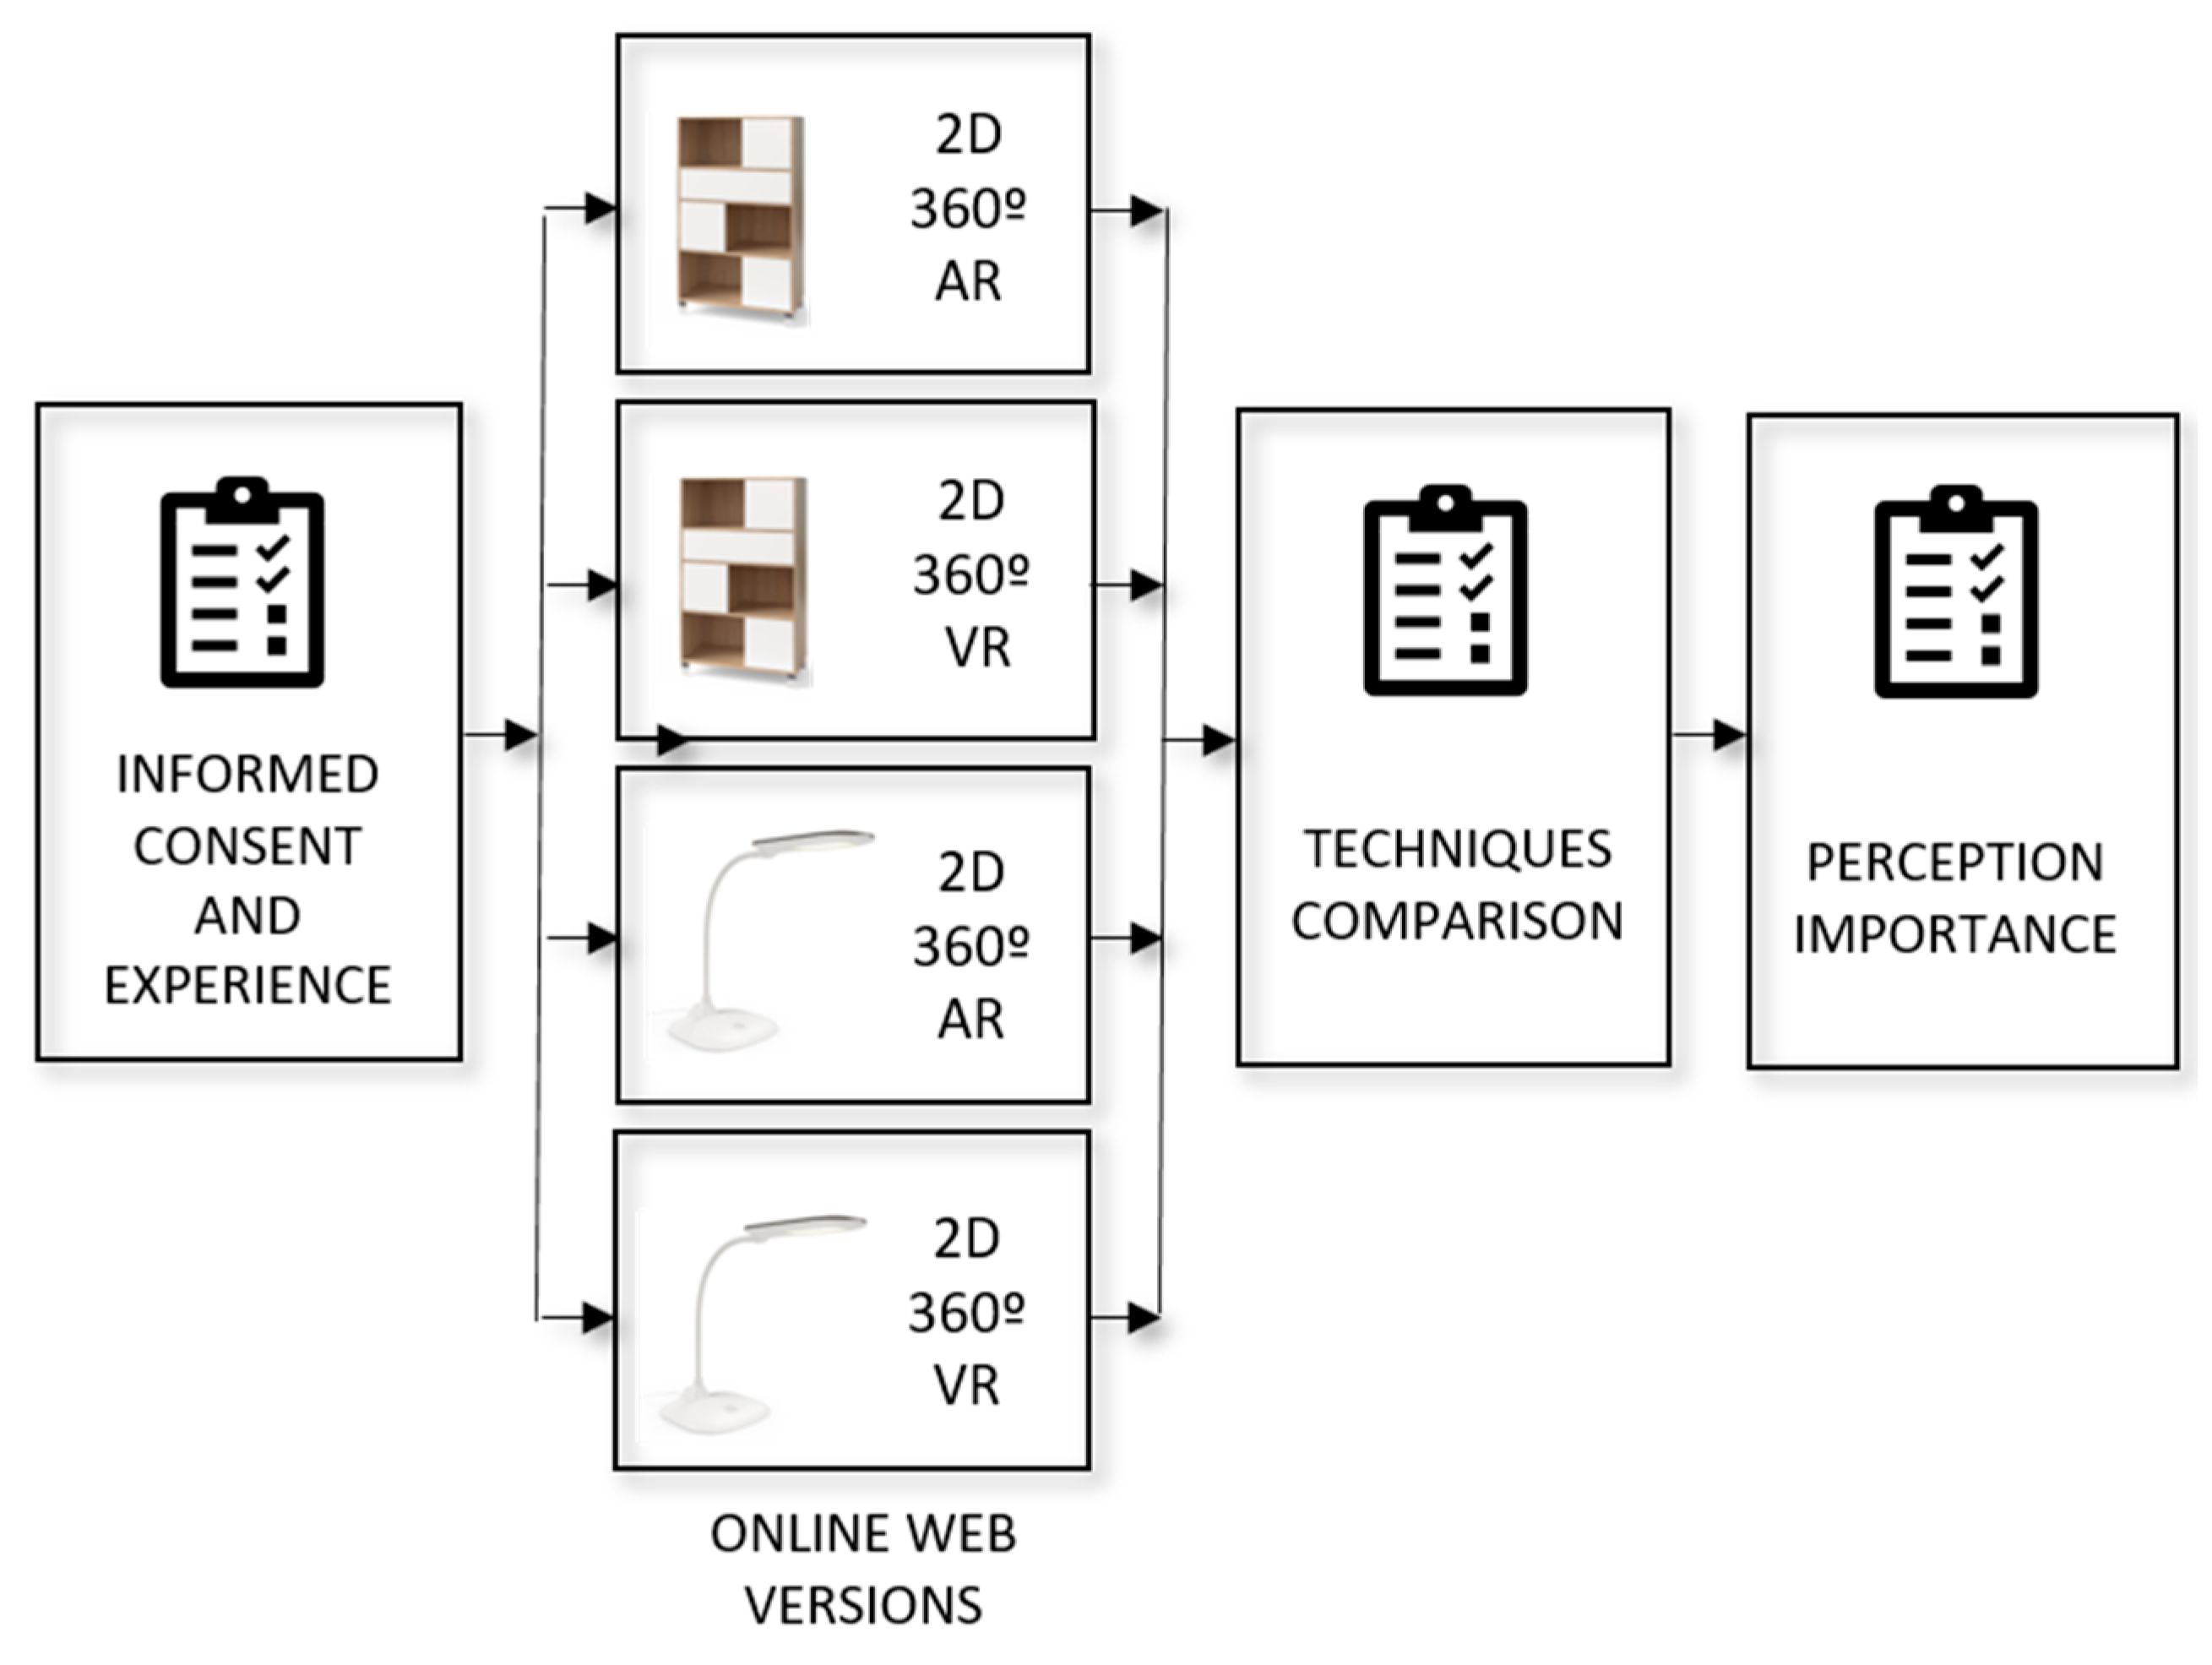
3.3. Selection of Products and Website Development

A website was developed as a platform on which participants had access to use the different technologies to display a product. Four different website versions were generated based on the shown product and the used technologies.
Two well-known common home appliances with varied characteristics (shape, size, materials, etc.) were selected: a sideboard (as a piece of furniture) and a gooseneck lamp (as a household accessory). Selection followed the following criteria: (1) products had to be widely known and used by all the participants; (2) they had to be products with very different characteristics (dimensions, shapes, materials, etc.); (3) products had to be able to be shown by the technologies used in the study.
Two of the versions showed the sideboard, and the rest displayed the gooseneck lamp. To avoid participants’ fatigue, the used technologies were either 2D, 360° and AR or 2D, 360°, ni_VR and i_VR.
The 2D product’s information was shown on a carousel of rendered images from different perspectives (Figure 1): isolated, integrated into an environment, showing some details, and depicting detailed measures. A product description was also available next to the image carousel.
The 360° rotation interaction was allowed by displaying the product with a three-dimensional model on an app (Sketchfab) (Figure 2). Allowed actions included rotation from any angle, zoom, and, with the sideboard, also opening drawers and doors. Instructions about how to perform these actions were included.
This app was also used to obtain virtual product representation, which could be shown on a smartphone screen over a real location to display the product in the environment for which it was intended. Additionally, product orientation realistically changed in accordance with users’ movements (Figure 3).
The VR representation considered two different displays: on the one hand, for ni_VR, an app (VR Media Player) had to be downloaded on a smartphone so that a virtual representation of the product located in a virtual room could be displayed. Users could modify the orientation of the environment by sliding their fingers across the screen. For i_VR, participants used a head-mounted display, which they were previously provided with to hold their smartphone (Figure 4). This system allowed them to view a complete scene in an immersive way.

3.4. Procedure

Participants accessed the initial form (informed consent and characterisation) by a QR link. Next, they answered questions about their user experience with the display technologies on a 5-point scale: 0 Never; 1 Once or twice; 2 Sometimes; 3 Often; 4 Very often.
Then, each participant was randomly assigned to a version of the simulated website so that distribution remained balanced (Figure 5). While the participants who were assigned VR as a visualisation technology previously received the head-mounted display (glasses), those who were assigned an AR technology were given a backpack as an alternative gift.
Participants received instructions about how to interact with the product by using all the available display technologies. However, as in a real situation, the order of these interactions with technologies was not controlled. To optimise experiences with their smartphone, they were recommended to use it horizontally. The students were asked to report any issues with the display technologies to the researcher in charge. Communication between the students and the researcher was frequent and effective, as she also served as their teacher.
After using the assigned technologies, participants were asked to assess their perception of each usage property (detailed with the “Description” of Table 1) on a comparative basis for each assigned technology by completing a questionnaire with a 5-point scale (“1 Very bad”; “2 Bad”; “3 Neutral”; “4 Good”; “5 Very good”). The variables Decision and Expectations were also rated on each technology on a scale from 1 (Very bad) to 5 (Very good).
Next, they were asked about the importance they attached to usage properties also on a 5-point scale from “1 Not important at all” to “5 Very important”.

3.5. Analysis of the Results

Statistical analyses were performed with the IBM SPSS v23 statistical software (IBM Corp., Armonk, NY, USA). First of all, descriptive statistics were analysed, and conclusions were obtained about not only the perception of the importance of usage properties but also about their assessment of each technology.
As the data from questionnaires could not be considered to follow normal distribution (based on the Kolmogorov–Smirnov test), the following analyses were applied to check if significant differences could be detected:
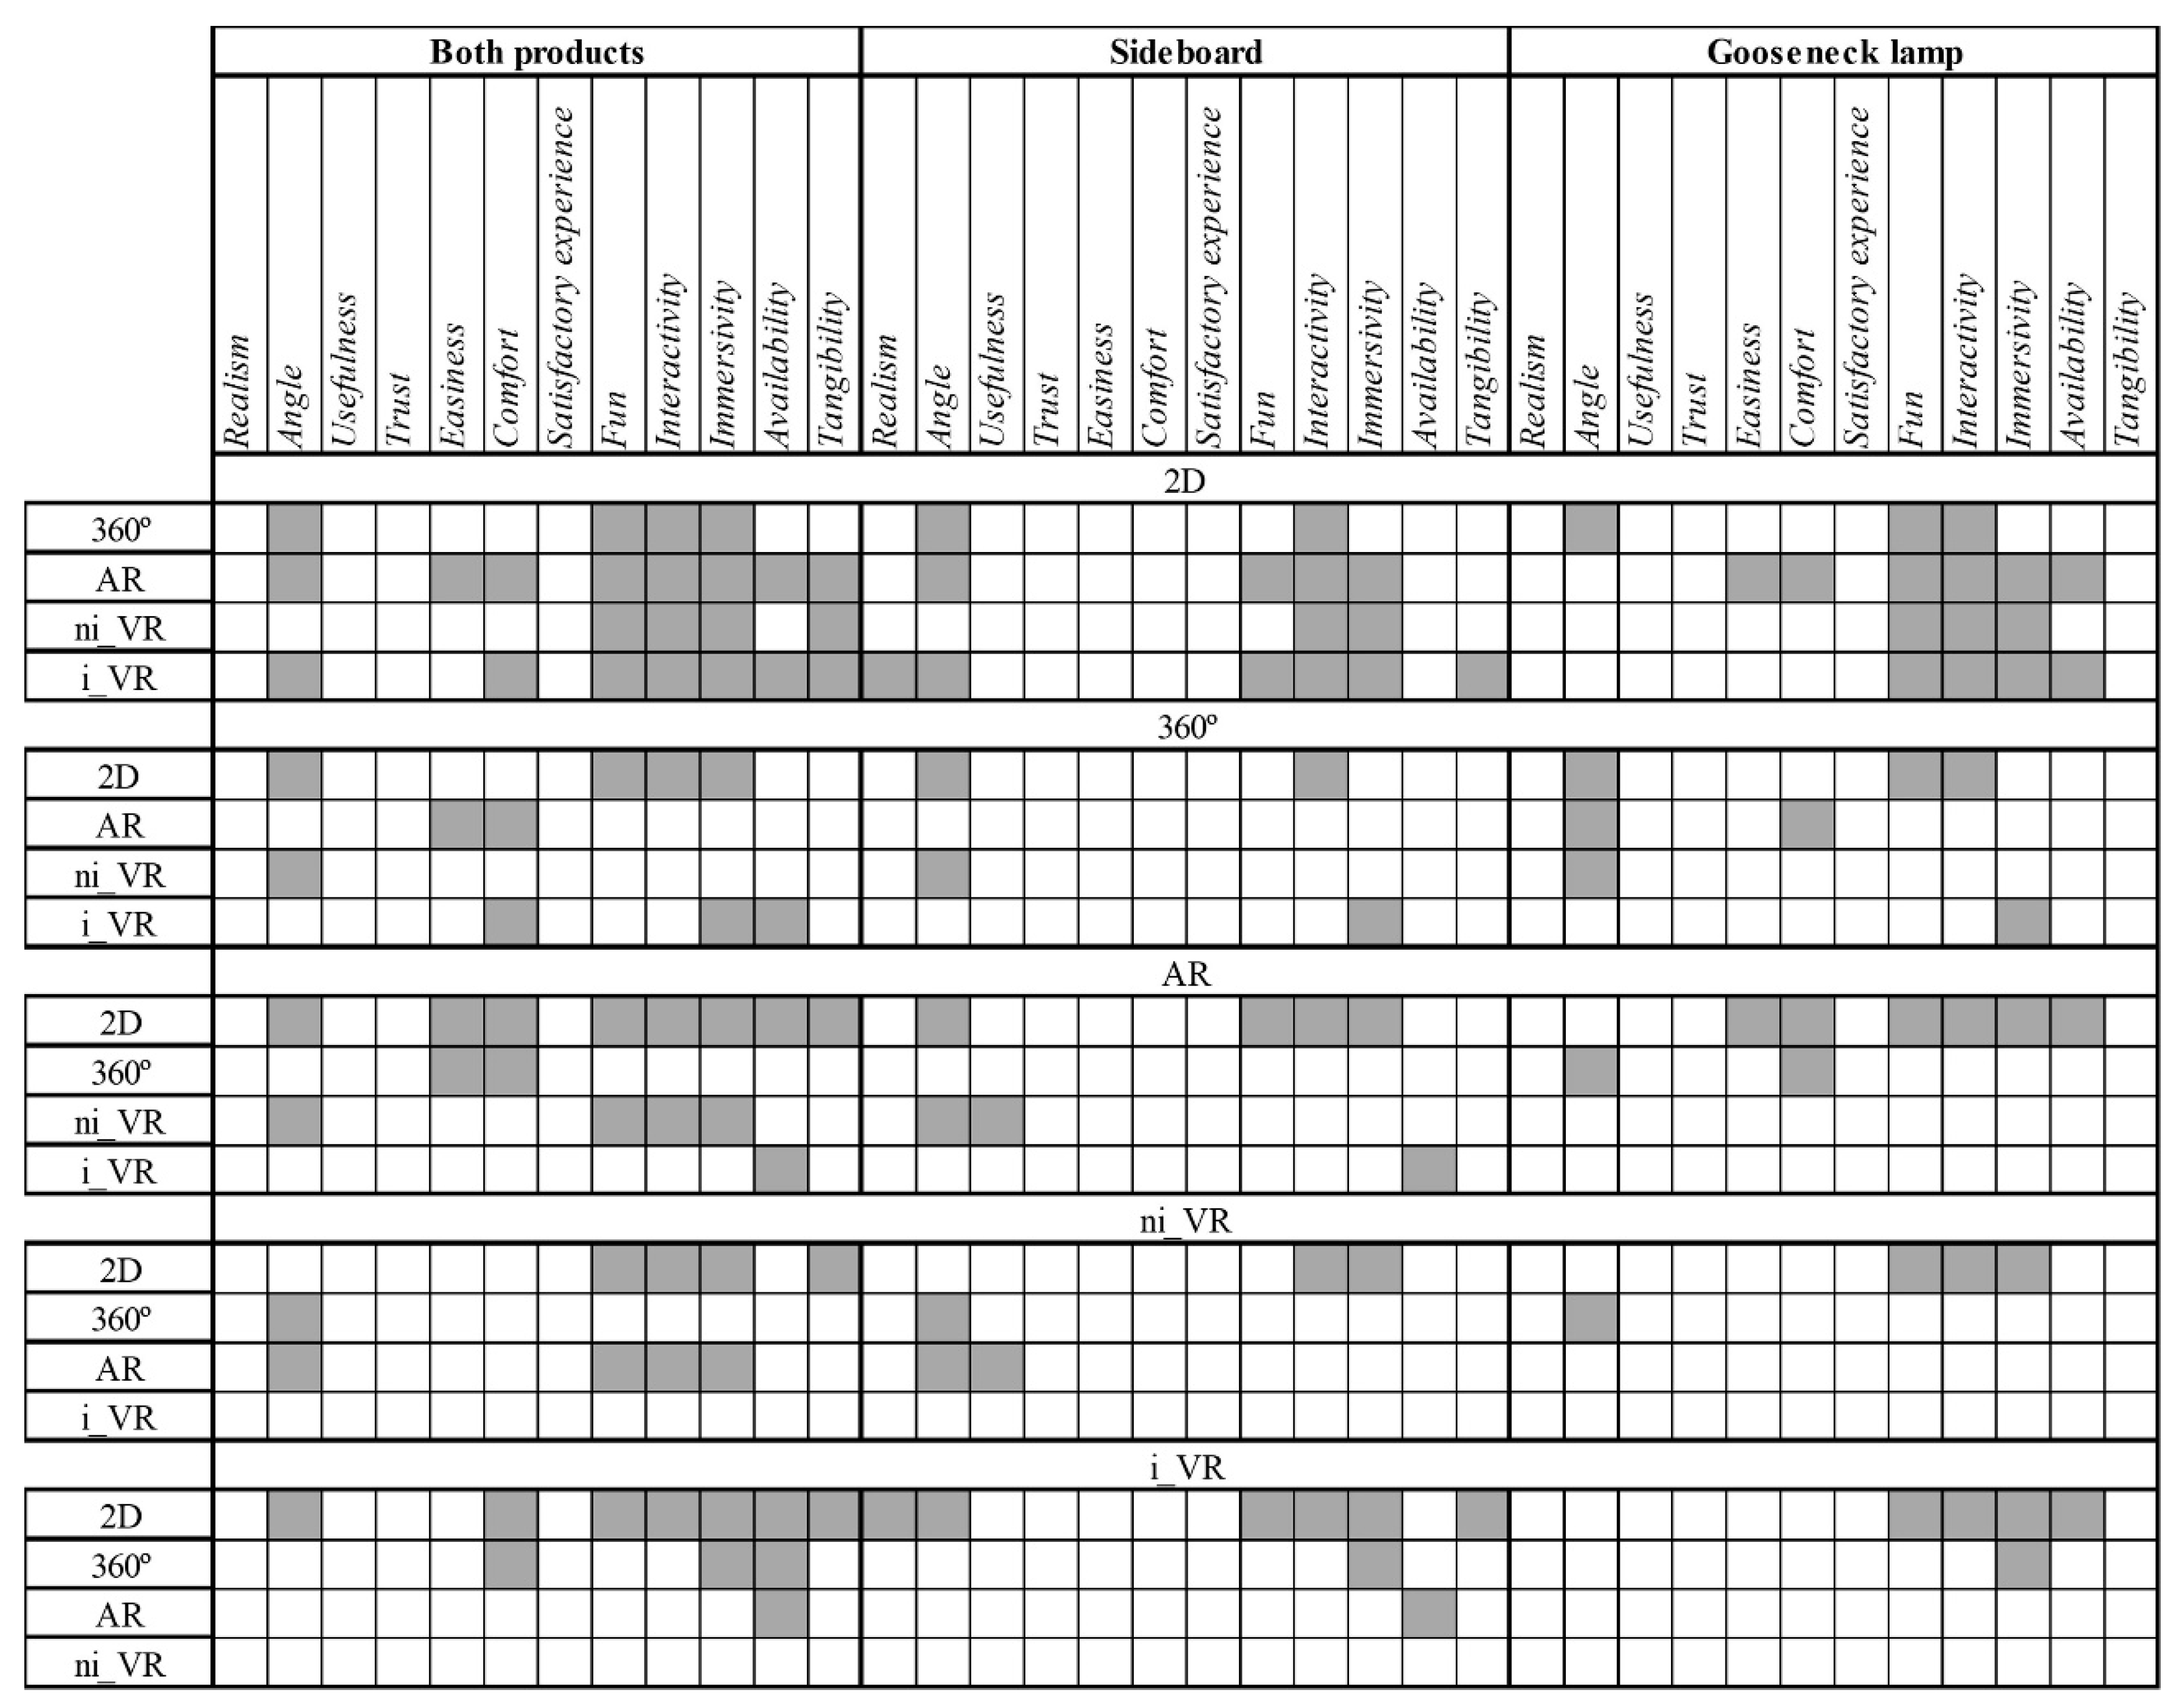
  • Non-parametric Friedman tests (repeated measures) by taking, as dependent variables, the ratings of perceptions for each usage property and the display technology. Technologies 2D, 360°, and AR were compared by half the sample, and 2D, 360°, ni_VR, and i_VR by the other half (as participants used either AR or VR, but not both). In each group, pairwise comparisons were performed by adjusting significance values using the Bonferroni correction for multiple tests. An a priori power analysis was performed by the Wilcoxon signed-rank test for matched pairs by taking the following as input parameters: power of 80%, error probability α of 0.05, effect size of 0.5 based on a mean difference of 0.5 and SD of difference = 1. The analysis showed a total sample size of 35 participants set for two tails.
  • Independent-sample Mann–Whitney U tests were applied to verify possible differences between the usage properties between AR and ni_VR and also between AR and i_VR.
  • Independent-sample Mann–Whitney U tests were also applied to check possible differences in usage properties’ ratings depending on product type. The properties’ ratings for each technology were taken as dependent variables and product type as the independent variable.

4. Results

After ruling out the records of five participants who could not use the AR or VR technologies due to technical problems with their mobile phones, 77 individuals (36 females, 41 males, aged between 18 and 29 years) participated in the study. Thirty-nine of the 77 participants used the 2D, 360°, and AR technologies, while the other 38 were assigned to the 2D, 360°, and VR technologies. In each group, 19 participants viewed a sideboard and the rest, a gooseneck lamp.
About previous experience with technologies, 84.4% of the participants stated having used 360° rotation, with a 26% frequency of “Often” or “Very often”. For the AR technology, previous experience was recognised by 57.1%, but only 3.9% mentioned that they used it often. With ni_VR, 76.6% stated that they had used it previously, and 15.6% often or very often. Finally, only 32.5% of them indicated having previously used i_VR, with a maximum frequency of “Sometimes”.

Importance and Perception of Technologies’ Usage Properties

Descriptive statistics (mean and standard deviation) of the importance attached to usage properties are shown in the first columns of Table 2. The next columns indicate the mean and standard deviation for the rating given to each technology for these usage properties. The highest mean value in each row is shown in bold and in a green cell, while the lowest one appears in italics and in a red cell. The last row reveals the mean values achieved by each technology for the perception of all its properties.
This information is also shown graphically in Figure 6, where the importance attached to each property is indicated on the X axis, and the ratings for each technology appear on the Y axis. Properties are designated by their initials, which have a grey background if significant differences are detected between technologies.
Firstly, four general importance levels are distinguished. At the first level (importance > 4.5), Realism is located. Therefore, the property considered to be the most important one is that technologies offer a realistic representation with sufficient quality and resolution according to the expression used on the form (see Table 1).
At a second level (importance between 4 and 4.30), properties seem to generally refer to comfortable, reliable, and satisfactory use. In more detail, the properties related to functionality and reliability (Trust, Angle, Usefulness) have importance levels between 4.20 and 4.30 (closer to Realism, both for score and concept), while the properties related to a comfortable and satisfactory usage concept (Comfort, Easiness, Satisfactory experience) have lower ratings, between 4 and 4.20 points.
The properties on the third level of importance (between 3.5 and 4) are considered the media characteristics of interactive technologies: Tangibility and Availability as the most important ones (3.85–3.9), and Immersivity and Interactivity with importance levels of 3.6–3.65 points. Fun is at the last level of importance, with a score close to 3, that is, at a medium level, among the five options offered on the scale.
Regarding the ratings of each technology’s properties, the best globally rated technology is 360°, and the worst one is 2D. However, as all the average ratings are between 3.42 and almost 4, there is only a slight overall difference.
For the specific usage properties, the lowest ratings correspond mainly to the media properties for 2D (Interactivity, Immersivity, Tangibility) and also to Angle and Fun. For all these properties, 2D technology fails because the rating is below the average score of 3 points. However, 2D has the highest ratings for Easiness, Availability, and Comfort.
The highest rating is obtained for 360° for Angle, followed closely by i_VR for Immersivity and Interactivity. In general, 360° obtains the highest rating for four of the properties, and it does not obtain the minimum score for any of them. Specifically, if we pay attention to the seven properties valued as the most important ones (importance > 4 points), 360° is the best valued for the properties with the second, third, fourth, and seventh highest levels of importance (respectively, Trust, Angle, Usefulness, and Satisfactory Experience) and the second highest rated for the properties with the first, fifth, and sixth levels of importance (Realism with 0.07 points of the highest rating, Comfort with 0.13 points, and Easiness with 0.24 points of the highest rating). Figure 7 summarises the significant differences found between technologies both globally and per product. Two-dimensional is the technology with the most significant differences from the rest.
More detailed information about these results, depending on the analysis carried out, can be found in Tables S1–S7 (see the Supplementary Material). Tables S1–S6 detail the p-values corresponding to the Friedman test for related samples (Tables S1–S3 for the participants who used AR; Tables S4–S6 for the participants who used VR). Table S7 shows the results from the Mann–Whitney U (independent samples) between the AR and (i_ and ni_) VR technologies. When p-values are less than 0.05, the cell has a grey background, and the technology with the highest value is depicted in bold.
Of the seven properties with the highest importance score (all with a score over 4), for Realism, Trust, Usefulness and Satisfaction experience, no significant differences were detected between technologies. If products were considered separately, significant differences appeared for the sideboard for Realism (bigger for i_VR than for 2D) and Usefulness (bigger for AR than for ni_VR).
With Angle, significant differences appeared between 2D (lower value) and 360°, AR and i_VR, and also between ni_VR (lower value) and 360° and AR. For Comfort, 2D and 360° were significantly better rated than AR and i_VR. For Ease of use, 2D and 360° were easier than AR.
From the eighth importance property, more significant differences between technologies were found, especially for Immersivity, Interactivity, and Fun. For these properties, 2D stood out for its low score compared to the other technologies and ni_VR for having a lower score than AR. For Availability, however, 2D obtained a significantly higher score than AR and i_VR, among other significant differences.
It should be noted that the smaller sample size available when distinguishing by product could have prevented finding more significant differences, especially between AR and ni_VR or i_VR, because only half the participants used these technologies.
The significant differences between products in ratings (Mann–Whitney U tests) were mainly for AR and, specifically, for properties Realism (U = 118, p = 0.044), Easiness (U = 85.5, p = 0.003), Usefulness (U = 105, p = 0.016), and Comfort (U = 98, p = 0.009) and also for 2D with Interactivity (U = 545.5, p = 0.036). They are marked with a red ellipse in Figure 8.
Figure 9 helps to visualise the influence of product type based on technology and property. As previously mentioned, the biggest difference between products occurred for AR, with the sideboard obtaining a higher rating for all the properties except for Fun. There were also some differences in the property ratings in other technologies, such as i_VR, while 360° was the technology with the greatest similarity in product ratings. Both products generally showed similar trends in each property assessment.
The affective indicators about influence on purchase decisions (Decision) and preferences (Expectations) had maximum values (around a score of 4) for 360°. For the rest, ratings fell within a range between 3 and 4 (Figure 10). No significant differences were detected in the assessment of these indicators between technologies.

5. Discussion

In this work, a wide range of usage properties of display technologies was analysed, and the level of assessment and importance of the functionality, usability, pleasure, and media properties were obtained for the 2D, 360°, AR, ni_VR, and i_VR technologies. The described results have provided a comprehensive overview of the most suitable display technologies based on the properties that we wish to prioritise.
Some preliminary results have been previously shown [26]. However, the publication focused on other objectives, and only four variables were considered for four display technologies. In the present work, a much more extensive study was carried out by considering fourteen variables (twelve usage properties and two global indicators) and properties’ importance for five different display technologies.
First of all, regarding participants’ preferences, the desire to obtain a realistic representation of the displayed object stood out, followed by other properties related to functionality and reliability. The next properties were related to usability and pleasure, while those related to media characteristics obtained scores below 4. Lastly, Fun was located in the least important position. Thus, it would seem that users prioritise the achievement of properties related to the most basic levels of Jordan’s pyramid [25] when perceiving an object’s features. These results address the research question RQ2.
When looking at the technologies that can achieve these properties, it was found that 360° obtained the best overall score, with the first or second score for the seven most important properties (the importance of all of them was over 4 points). Therefore, it is distinguished as a multipurpose display technology because it seems to please users with its varied properties, which are related mainly to functionality and usability. In any case, for these seven most valued properties in terms of importance, significant differences were detected only for Angle, Easiness, and Comfort.
Regarding media properties, i_VR stood out for having the best score for Interactivity, Immersivity, and Tangibility and also for Fun and its use. These properties were rated with less than 4 points in importance, for which many significant differences have generally been detected, with 2D being the worst rated for properties like Interactivity, Immersivity, or Tangibility but the best one for Availability. Although i_VR stood out in media properties, it also obtained the best score for the property considered the most important: Realism. Globally, 2D was the display system with the most significant differences from the other technologies. The differences found in the perceptions of the usage properties depending on the display technology answer the first part of the research question RQ1.
When looking at the factors considered by the TAM [22], Usefulness and Easiness both obtained their highest ratings for 360° and 2D, while the new XR technologies had lower ratings. The ratings obtained for Tangibility (in increasing order, 2D, 360°, AR, ni_VR, and i_VR) agree with the results reported in Verhagen et al. [24], where tangibility was assessed for three display types. The lowest rating was for pictures, followed by 360 spin rotation, and the highest rating was for virtual mirrors. Generally, the results were also related to those of Agost et al. [16] because it showed that the 360° technology was also the most versatile and best valued by overall product perception, and also for general and detailed physical features and functional aspects (Dimensions and Shape, Materials, Finishes, Details, Quality). i_VR stood out especially in the perception of the aesthetic and affective dimension (Appeal). Therefore, it can be concluded that 360° and i_VR are the technologies with the most notable results, while perceptions with 360° rotation are related to functionality, and they do so for i_VR with more emotional aspects.
However, it should be highlighted that more significant differences were detected between display technologies for their usage properties than in terms of perceiving a product’s features [16]. This should be corroborated in future work because it could mean that users’ choice of one display system or another may depend more on the way the display itself is used than on the product to be displayed.
Furthermore, the obtained results could depend on the product type, as it was considered in the second part of the research question RQ1. This means that although more significant differences were detected in the usage properties between technologies globally than for product type, given the larger sample size, significant differences were detected in Realism and Usefulness for the sideboard and not for both products globally. Therefore, further study should be conducted to analyse the influence of the displayed product type on the assessment of technology properties.
The differences found in the perception of properties depending on the specific product were detected especially for the AR technology. The presentation of the gooseneck lamp by the AR technology was perceived as being less realistic, useful, easy, and comfortable than the sideboard. This could be because the sideboard is a large product that must be placed on the ground, while the gooseneck lamp is much smaller and is usually located on a higher surface, such as a table, and close to other elements, such as pencils or a laptop, which could make it difficult to adjust the image by the AR technology. In any case, although the gooseneck lamp location for its correct display may be more complicated, the relation with the other image elements can make size adjustment more accurate.
Thus, Agost et al. [16] pointed out that the users who had viewed the sideboard by AR after viewing the real product detected a higher proportion (>80%) of differences in the dimensions between the product perceived with the display technologies and the real one than the users who had displayed the gooseneck lamp. Slightly less than 60% detected significant differences between the dimensions perceived by technologies and the real product. By way of conclusion, the adequacy of a technology’s usage properties may also depend on the shown product’s features.
No significant differences were observed between technologies in the assessments of affective indicators Decision and Expectations, which could be related to the lower importance that users attach to more subjective properties because they preferred functionality. Consequently, the answer to the research question RQ3 could not be obtained.
One of the main contributions of this work is the presentation of a comparative study of an unusual breadth: five different display technologies were compared across 12 usage properties belonging to 4 different types. This comparison considered not only the assessment but also the level of importance given by the participants to each of them. Two additional variables were taken into account regarding decision and expectations.
Additionally, the results obtained confirm that the study of perceptions achieved through display technologies should consider both those generated from the design characteristics of the displayed product and those arising from the usage properties of the technologies. In fact, the characteristics and breadth of this study allow its results to complement those obtained by Agost et al. [16]. As seen in both studies, 360° rotation stands out as a versatile and multipurpose technology, while i_VR is particularly suitable in some applications, such as in the perception of Appeal or in properties related to media characteristics and Fun. Thus, this work provides insights into the selection of the most appropriate display technology, expanding the aspects to consider.

6. Conclusions

The influence of the product display technology on user perceptions is a common topic in the literature. Yet beyond the perception of a displayed product’s features, the convenience of using certain technologies or others may also depend on the usage properties of technologies themselves. In this work, a comparative analysis of the perception of usage properties in different product display technologies was conducted to provide insights for the purpose of user experience optimisation.
The scope of this study is highlighted: 12 usage properties classified into four types (functionality, usability, pleasure, and media) were considered, for which the perception of their importance and their assessment in five display product technologies (image rendering, 360° rotation display, augmented reality, and non-immersive and immersive virtual reality) were studied. Two common and well-known objects but with very different design features were chosen, which made distinguishing their influence on the perceptions of usage properties possible.
The usage properties considered to be the most important ones were mostly the functional and reliable ones and were related to a realistic, useful, and comfortable representation. It is highlighted that of the seven most valued properties in terms of importance, significant differences were detected only in three of them. With lesser attached importance came the media and fun properties, for which more significant differences were detected.
The 360° rotation technology obtained notable results for various usage properties, especially for the functionality and usability ones. Immersive virtual reality had good results for media properties and also for Realism. Therefore, the general recommendation is similar to that of Agost et al. [16], who recommended 360° rotation when looking for general, and not specific, use, while immersive virtual reality seemed better for subjective experiences, but recommendations were based on the perception of product features.
It should be noted that the number of significant differences found between technologies based on usage properties is bigger than those identified in Agost et al. [16] for the same technologies, based on product features’ perceptions. This may provide an idea of the importance of considering the perception of usage properties, and not only that of product features, when selecting a display technology to obtain an optimal result.
Although fewer significant differences were expected to be identified per product, due to the smaller sample size, differences were occasionally detected between technologies in some properties for the sideboard and were not globally manifested for both products. Additionally, the augmented reality technology stood out for the number of significant differences identified on the usage properties’ ratings, depending on product type. These results suggest that further work into the analysis of the influence of usage properties depending on the displayed product type is recommended.
No differences were detected between technologies for their influence on either the final decision or user expectations. In any case, the development of technologies may vary some results because these technologies are constantly evolving, and their usage properties continually improve.
This study has some limitations. Participants did not use all the technologies considered, but the sample was divided between AR and VR users, so in some analyses, it was not possible to use the data for the entire sample. Considering two different products also causes a limitation in this study. This could have had an influence when finding significant differences. Finally, it should be considered that new display technologies constantly improve their properties, so these results should be verified in the future.

Supplementary Materials

The following supporting information can be downloaded at: https://www.mdpi.com/article/10.3390/app14156739/s1, Table S1: Both products. Significant differences between technologies, in the assessment of their properties and affective indicators; Table S2: Sideboard. Significant differences between technologies, in the assessment of their properties and affective indicators; Table S3: Gooseneck lamp. Significant differences between technologies, in the assessment of their properties and affective indicators; Table S4: Both products. Significant differences between technologies, in the assessment of their properties and affective indicators; Table S5: Sideboard. Significant differences between technologies, in the assessment of their properties and affective indicators; Table S6: Gooseneck lamp. Significant differences between technologies, in the assessment of their properties and affective indicators; Table S7: Significant differences between technologies, in the assessment of their properties and affective indicators.

Author Contributions

Conceptualization, methodology, investigation, writing and original draft preparation, funding acquisition, M.-J.A.; Visualization, writing—review and editing, V.B.-P. All authors have read and agreed to the published version of the manuscript.

Funding

This research was funded by the Universitat Jaume I, grant number 18I372.

Institutional Review Board Statement

This study was approved by the Deontological Committee of the Universitat Jaume I (reference number CD/32/2019). Authenticity confirmation on http://www.uji.es/documents entering the security verification code: 0D067F3542D1C766B6D2. Date of approval 6 June 2019.

Informed Consent Statement

Informed consent was obtained from all subjects involved in the study.

Data Availability Statement

The raw data supporting the conclusions of this article will be made available by the authors on request.

Conflicts of Interest

The authors declare no conflicts of interest.

References

  1. Kim, K.; Billinghurst, M.; Bruder, G.; Duh, H.B.L.; Welch, G.F. Revisiting Trends in Augmented Reality Research: A Review of the 2nd Decade of ISMAR (2008–2017). IEEE Trans. Vis. Comput. Graph. 2018, 24, 2947–2962. [Google Scholar] [CrossRef] [PubMed]
  2. Kim, W.B.; Choo, H.J. How Virtual Reality Shopping Experience Enhances Consumer Creativity: The Mediating Role of Perceptual Curiosity. J. Bus. Res. 2023, 154, 113378. [Google Scholar] [CrossRef]
  3. Zhu, T. The Impact of Non-Immersive Virtual Reality Technologies on Consumers’ Behaviors in Real Estate: A Website’s Perspective. In Proceedings of the 2022 IEEE International Symposium on Mixed and Augmented Reality Adjunct, ISMAR-Adjunct, Singapore, 17–21 October 2022; IEEE: Piscataway, NJ, USA, 2022; pp. 13–20. [Google Scholar]
  4. Park, M.; Im, H.; Kim, D.Y. Feasibility and User Experience of Virtual Reality Fashion Stores. Fash. Text. 2018, 5, 32. [Google Scholar] [CrossRef]
  5. Crilly, N.; Moultrie, J.; Clarkson, P.J. Seeing Things: Consumer Response to the Visual Domain in Product Design. Des. Stud. 2004, 25, 547–577. [Google Scholar] [CrossRef]
  6. Kuo, J.Y.; Chen, C.H.; Roberts, J.R.; Chang, D. Evaluation of the User Emotional Experience on Bicycle Saddle Designs via a Multi-Sensory Approach. Int. J. Ind. Ergon. 2020, 80, 103039. [Google Scholar] [CrossRef]
  7. Vergara, M.; Mondragón, S.; Sancho-Bru, J.L.; Company, P.; Agost, M.J. Perception of Products by Progressive Multisensory Integration. A Study on Hammers. Appl. Ergon. 2011, 42, 652–664. [Google Scholar] [CrossRef] [PubMed]
  8. Yim, M.Y.C.; Park, S.Y. “I Am Not Satisfied with My Body, so I like Augmented Reality (AR)”: Consumer Responses to AR-Based Product Presentations. J. Bus. Res. 2019, 100, 581–589. [Google Scholar] [CrossRef]
  9. Pleyers, G.; Poncin, I. Non-Immersive Virtual Reality Technologies in Real Estate: How Customer Experience Drives Attitudes toward Properties and the Service Provider. J. Retail. Consum. Serv. 2020, 57, 102175. [Google Scholar] [CrossRef]
  10. Berni, A.; Borgianni, Y. Applications of Virtual Reality in Engineering and Product Design: Why, What, How, When and Where. Electronics 2020, 9, 1064. [Google Scholar] [CrossRef]
  11. Palacios-Ibáñez, A.; Felip-Miralles, F.; Galán, J.; García-García, C.; Contero, M. Consumer Subjective Impressions in Virtual Reality Environments: The Role of the Visualization Technique in Product Evaluation. Electronics 2023, 12, 3051. [Google Scholar] [CrossRef]
  12. Felip, F.; Galán, J.; Contero, M.; García-García, C. Touch Matters: The Impact of Physical Contact on Haptic Product Perception in Virtual Reality. Appl. Sci. 2023, 13, 2649. [Google Scholar] [CrossRef]
  13. Galán, J.; Felip, F.; Garciá-Garciá, C.; Contero, M. The Influence of Haptics When Assessing Household Products Presented in Different Means: A Comparative Study in Real Setting, Flat Display, and Virtual Reality Environments with and without Passive Haptics. J. Comput. Des. Eng. 2021, 8, 330–342. [Google Scholar] [CrossRef]
  14. Zhou, X.; Rau, P.L.P. Determining Fidelity of Mixed Prototypes: Effect of Media and Physical Interaction. Appl. Ergon. 2019, 80, 111–118. [Google Scholar] [CrossRef] [PubMed]
  15. Palacios-Ibáñez, A.; Alonso-García, M.; Contero, M.; Camba, J.D. The Influence of Hand Tracking and Haptic Feedback for Virtual Prototype Evaluation in the Product Design Process. J. Mech. Des. 2023, 145, 041403. [Google Scholar] [CrossRef]
  16. Agost, M.-J.; Vergara, M.; Bayarri-Porcar, V. Perceiving Design Features in New Interaction Environments: Comparing Rendered Images, 360° Rotation, AR, Immersive and Non-Immersive VR, and Real Product Interaction. Appl. Sci. 2024, 14, 4470. [Google Scholar] [CrossRef]
  17. Kim, Y.M.; Rhiu, I. Development of a Virtual Reality System Usability Questionnaire (VRSUQ). Appl. Ergon. 2024, 119, 104319. [Google Scholar] [CrossRef] [PubMed]
  18. Picardi, A.; Caruso, G. User-Centered Evaluation Framework to Support the Interaction Design for Augmented Reality Applications. Multimodal Technol. Interact. 2024, 8, 41. [Google Scholar] [CrossRef]
  19. Al-kfairy, M.; Alomari, A.; Al-Bashayreh, M.; Alfandi, O.; Tubishat, M. Unveiling the Metaverse: A Survey of User Perceptions and the Impact of Usability, Social Influence and Interoperability. Heliyon 2024, 10, e31413. [Google Scholar] [CrossRef] [PubMed]
  20. Al-Adaileh, A.; Al-Kfairy, M.; Tubishat, M.; Alfandi, O. A Sentiment Analysis Approach for Understanding Users’ Perception of Metaverse Marketplace. Intell. Syst. Appl. 2024, 22, 200362. [Google Scholar] [CrossRef]
  21. Saprikis, V.; Avlogiaris, G.; Katarachia, A. Determinants of the Intention to Adopt Mobile Augmented Reality Apps in Shopping Malls among University Students. J. Theor. Appl. Electron. Commer. Res. 2021, 16, 491–512. [Google Scholar] [CrossRef]
  22. Davis, F.D. Technology Acceptance Model: TAM. In Information Seeking Behavior and Technology Adoption: Theories and Trends; Al-Suqri, M.N., Al-Aufi, A.S., Eds.; IGI Global: Hershey, PA, USA, 1989; pp. 205–219. [Google Scholar]
  23. Javornik, A. Augmented Reality: Research Agenda for Studying the Impact of Its Media Characteristics on Consumer Behaviour. J. Retail. Consum. Serv. 2016, 30, 252–261. [Google Scholar] [CrossRef]
  24. Verhagen, T.; Vonkeman, C.; Van Dolen, W. Making Online Products More Tangible: The Effect of Product Presentation Formats on Product Evaluations. Cyberpsychol. Behav. Soc. Netw. 2016, 19, 460–464. [Google Scholar] [CrossRef] [PubMed]
  25. Jordan, P.W. Designing Pleasurable Products; CRC Press: Boca Raton, FL, USA, 2000; ISBN 9780429219962. [Google Scholar]
  26. Agost, M.J.; Vergara, M.; Bayarri, V. The Use of New Presentation Technologies in Electronic Sales Environments and Their Influence on Product Perception. In Human Interface and the Management of Information. Information Presentation and Visualization, Proceedings of the International Conference on Human-Computer Interaction, Virtual, 24–29 July 2021; Lecture Notes in Computer Science (LNCS); Springer Science and Business Media Deutschland GmbH: Berlin/Heidelberg, Germany, 2021; Volume 12765, pp. 3–15. [Google Scholar]
  27. Zhang, S.; Li, W. Applying EXtended Reality(XR) Technology in Commerce, Management, and Business Applications: A Survey. In Proceedings of the 2024 4th International Conference on Computer, Control and Robotics (ICCCR), Shnaghai, China, 19–21 April 2024; pp. 108–113. [Google Scholar] [CrossRef]
  28. Scholz, J.; Duffy, K. We ARe at Home: How Augmented Reality Reshapes Mobile Marketing and Consumer-Brand Relationships. J. Retail. Consum. Serv. 2018, 44, 11–23. [Google Scholar] [CrossRef]
  29. Liao, Y.-C.; Wang, T.-H.; Koong Lin, H.-C.; Lin, K.-Y. Innovative Technologies and Learning, Proceedings of the Augmented Reality Applied to Smartphones and Wearable Devices—Virtual Furniture Simulation System, Portoroz, Slovenia, 27–30 August 2018; Springer: Berlin/Heidelberg, Germany, 2018. [Google Scholar]
  30. Figueiredo, M.; Mafalda, R.; Kamensky, A. Virtual Reality as an Educational Tool for Elementary School. In Interdisciplinary Conference on Innovation, Desgin, Entrepreneurship, And Sustainable Systems; Springer: Cham, Switzerland, 2021; Volume 198, pp. 261–267. [Google Scholar]
  31. Segura, Á.; Barandiaran, J.; Moreno, A.; Barandiaran, I.; Flórez, J. Improved Virtual Reality Perception with Calibrated Stereo and Variable Focus for Industrial Use. Int. J. Interact. Des. Manuf. 2018, 12, 95–103. [Google Scholar] [CrossRef]
  32. Dubin, A.K.; Julian, D.; Tanaka, A.; Mattingly, P.; Smith, R. A Model for Predicting the GEARS Score from Virtual Reality Surgical Simulator Metrics. Surg. Endosc. 2018, 32, 3576–3581. [Google Scholar] [CrossRef]
  33. Formosa, N.J.; Morrison, B.W.; Hill, G.; Stone, D. Testing the Efficacy of a Virtual Reality-Based Simulation in Enhancing Users’ Knowledge, Attitudes, and Empathy Relating to Psychosis. Aust. J. Psychol. 2018, 70, 57–65. [Google Scholar] [CrossRef]
  34. Xi, N.; Hamari, J. Shopping in Virtual Reality: A Literature Review and Future Agenda. J. Bus. Res. 2021, 134, 37–58. [Google Scholar] [CrossRef]
  35. Carmigniani, J.; Furht, B.; Anisetti, M.; Ceravolo, P.; Damiani, E.; Ivkovic, M. Augmented Reality Technologies, Systems and Applications. Multimed. Tools Appl. 2011, 51, 341–377. [Google Scholar] [CrossRef]
  36. Yoo, J.; Kim, M. The Effects of Online Product Presentation on Consumer Responses: A Mental Imagery Perspective. J. Bus. Res. 2014, 67, 2464–2472. [Google Scholar] [CrossRef]
  37. Agost, M.J.; Vergara, M. Relationship between Meanings, Emotions, Product Preferences and Personal Values. Application to Ceramic Tile Floorings. Appl. Ergon. 2014, 45, 1076–1086. [Google Scholar] [CrossRef]
  38. Desmet, P.; Hekkert, P. Framework of Product Experience. Int. J. Des. 2007, 1, 57–66. [Google Scholar]
  39. Arbeláez, J.C.; Osorio-Gómez, G. Crowdsourcing Augmented Reality Environment (CARE) for Aesthetic Evaluation of Products in Conceptual Stage. Comput. Ind. 2018, 99, 241–252. [Google Scholar] [CrossRef]
  40. Palacios-Ibáñez, A.; Navarro-Martínez, R.; Blasco-Esteban, J.; Contero, M.; Camba, J.D. On the Application of Extended Reality Technologies for the Evaluation of Product Characteristics during the Initial Stages of the Product Development Process. Comput. Ind. 2023, 144, 103780. [Google Scholar] [CrossRef]
  41. Van Damme, S.; Tack, J.; Van Wallendael, G.; De Turck, F.; Vega, M.T. Are We Ready for Haptic Interactivity in VR? In An Experimental Comparison of Different Interaction Methods in Virtual Reality Training. In Proceedings of the 2023 15th International Conference on Quality of Multimedia Experience, QoMEX 2023, Ghent, Belgium, 20–22 June 2023; Institute of Electrical and Electronics Engineers Inc.: Piscataway, NJ, USA, 2023; pp. 294–299. [Google Scholar]
  42. Gan, Q.; Liu, Z.; Liu, T.; Zhao, Y.; Chai, Y. Design and User Experience Analysis of AR Intelligent Virtual Agents on Smartphones. Cogn. Syst. Res. 2023, 78, 33–47. [Google Scholar] [CrossRef]
  43. Gattullo, M.; Laviola, E.; Evangelista, A.; Fiorentino, M.; Uva, A.E. Towards the Evaluation of Augmented Reality in the Metaverse: Information Presentation Modes. Appl. Sci. 2022, 12, 12600. [Google Scholar] [CrossRef]
  44. Afrin, S.; Zaman, S.R.; Sadekeen, D.; Islam, Z.; Tabassum, N.; Islam, M.N. How Usability and User Experience Vary among the Basic M-Commerce, AR and VR Based User Interfaces of Mobile Application for Online Shopping. In Advances in Design and Digital Communication II, Proceedings of the 5th International Conference on Design and Digital Communication, Digicom 2021, Barcelos, Portugal, 4–6 November 2021; Springer Series in Design and Innovation; Springer: Cham, Switzerland, 2022; Volume 19, pp. 44–53. ISBN 978-3-030-89735-2. [Google Scholar]
  45. Rauschnabel, P.A.; Ro, Y.K. Augmented Reality Smart Glasses: An Investigation of Technology Acceptance Drivers. Int. J. Technol. Mark. 2016, 11, 123–148. [Google Scholar] [CrossRef]
  46. Rese, A.; Schreiber, S.; Baier, D. Technology Acceptance Modeling of Augmented Reality at the Point of Sale: Can Surveys Be Replaced by an Analysis of Online Reviews? J. Retail. Consum. Serv. 2014, 21, 869–876. [Google Scholar] [CrossRef]
  47. Haugstvedt, A.C.; Krogstie, J. Mobile Augmented Reality for Cultural Heritage: A Technology Acceptance Study. In Proceedings of the ISMAR 2012—11th IEEE International Symposium on Mixed and Augmented Reality 2012, Atlanta, GA, USA, 5–8 November 2012; Science and Technology Papers. pp. 247–255. [Google Scholar]
  48. Balog, A.; Pribeanu, C. The Role of Perceived Enjoyment in the Students’ Acceptance of an Augmented Reality Teaching Platform: A Structural Equation Modelling Approach. Stud. Inform. Control 2010, 19, 319–330. [Google Scholar] [CrossRef]
  49. Venkatesh, V.; Morris, M.G.; Davis, G.B.; Davis, F.D. User Acceptance of Information Technology: Toward a Unified View. MIS Q. Manag. Inf. Syst. 2003, 27, 425–478. [Google Scholar] [CrossRef]
  50. Ahmad, M.I. Unified Theory of Acceptance and Use of Technology (UTAUT). A Decade of Validation and Development. LinkedIn Pulse 2015, 179–211. [Google Scholar]
  51. Stewart, D.W.; Pavlou, P.A. The Effects of Media on Marketing Communications. In Media Effects: Advances in Theory and Research; Taylor and Francis: London, UK, 2009; pp. 362–401. ISBN 9781135591106. [Google Scholar]
  52. Littlejohn, S.W.; Foss, K.A. Theories of Human Communication: Tenth Edition; Waveland Press, Inc.: Long Grove, IL, USA, 2010; Volume 4, ISBN 1478609397. [Google Scholar]
  53. Sundar, S.S. Media Effects 2.0: Social and Psychological Effects. In The SAGE Handbook of Media Processes and Effects; Nabi, R.L., Oliver, M.B., Eds.; SAGE Publications Inc.: Thousand Oaks, CA, USA, 2009; pp. 545–560. [Google Scholar]
  54. Shankar, V.; Balasubramanian, S. Mobile Marketing: A Synthesis and Prognosis. J. Interact. Mark. 2009, 23, 118–129. [Google Scholar] [CrossRef]
  55. Varadarajan, R.; Srinivasan, R.; Vadakkepatt, G.G.; Yadav, M.S.; Pavlou, P.A.; Krishnamurthy, S.; Krause, T. Interactive Technologies and Retailing Strategy: A Review, Conceptual Framework and Future Research Directions. J. Interact. Mark. 2010, 24, 96–110. [Google Scholar] [CrossRef]
  56. Radhakrishnan, K.; Thacker, A.K.; Maloo, J.C.; Gerryo, S.E.; Mousa, M.E. Descriptive Epidemiology of Some Rare Neurological Diseases in Benghazi, Libya. Neuroepidemiology 1988, 7, 159–164. [Google Scholar] [CrossRef] [PubMed]
  57. Steuer, J. Defining Virtual Reality: Dimensions Determining Telepresence. J. Commun. 1992, 42, 73–93. [Google Scholar] [CrossRef]
Figure 1. Rendered images displayed on a carousel along with a written description (translated from Spanish) on the simulated sale website. Left: the sideboard; right: the gooseneck lamp.
Applsci 14 06739 g001
Figure 2. Sketchfab display for the sideboard and the gooseneck lamp.
Applsci 14 06739 g002
Figure 3. Virtual representations to download and visualise for non-immersive (on a mobile phone/tablet screen) or immersive (using support glasses) virtual reality.
Applsci 14 06739 g003
Figure 4. Glasses for i_RV used by the participants.
Applsci 14 06739 g004
Figure 5. Experiment flow chart.
Applsci 14 06739 g005
Figure 6. Mean ratings for the assessment of each property with each technology against mean importance. The importance level of each property is represented on the X axis. For each property, technologies’ ratings appear on the Y axis. The initials of the properties with a grey background indicate significant differences detected between technologies according to the Friedman test for related samples (2D, 360°, and AR or 2D, 360°, ni_VR, and i_VR), or to the Whitney–Mann U test for independent samples (AR and ni_VR or i_VR). F: Fun; IT: Interactivity; IM: Immersivity; AV: Availability; TA: Tangibility; SE: Satisfactory experience; E: Easiness; C: Comfort; U: Usefulness; AN: Angle; TR: Trust; R: Realism.
Applsci 14 06739 g006
Figure 7. Significant differences between technologies for each property. Grey shading indicates the pairs of technologies for which significant differences were found (p < 0.05).
Applsci 14 06739 g007
Figure 8. Mean ratings for each property and technology per product type. Significant differences between products are marked with a red ellipse.
Applsci 14 06739 g008
Figure 9. Mean ratings for each property assessment globally, by product and by technology.
Applsci 14 06739 g009
Figure 10. Ratings for the global affective indicators Decision and Expectations by technology.
Applsci 14 06739 g010
Table 1. Usage properties considered to study their perception depending on the used display technology.
TypeUsage
Property
Description
FunctionalityRealismIt provides a realistic representation: it has sufficient quality and resolution
AngleIt allows the product to be viewed from any angle
UsefulnessIt is useful
UsabilityTrustIt provides trust and security; it offers sufficient information to evaluate the product and to decide without risks
EasinessIt is easy to use
ComfortIt provides comfort
PleasureSatisfactory experienceIt provides a satisfactory shopping experience
FunIt provides fun
MediaInteractivityIt provides interactivity: interaction with the presentation is allowed
ImmersivityIt provides immersivity: you feel you are inside the represented environment
AvailabilityIt provides accessibility at home and can be used when shopping
TangibilityIt allows product features to be perceptible to senses
Table 2. Perception of technologies’ usage properties. Rates for their importance and for the level achieved with each technology. The highest mean value in each row is shown in bold and in a green cell, while the lowest one appears in italics and in a red cell.
Ratings
Importance2D360°ARni_VRi_VR
MSDMSDMSDMSDMSDMSD
Realism4.620.613.771.053.960.913.691.423.920.754.031.40
Angle4.270.862.751.034.570.683.791.343.241.203.581.59
Usefulness4.220.824.100.984.260.683.921.383.790.913.821.29
Trust4.290.773.770.934.000.863.641.393.610.893.711.37
Easiness4.100.784.211.023.970.733.151.203.370.973.321.38
Comfort4.120.874.220.874.090.733.151.313.630.883.111.37
Satisfactory experience4.090.873.810.974.030.793.721.363.820.833.761.34
Fun3.060.932.690.833.780.753.951.473.680.844.181.25
Availability3.860.884.340.824.060.803.311.263.761.132.791.44
Interactivity3.620.812.250.994.210.824.211.384.000.934.391.29
Immersivity3.650.942.231.013.290.994.151.413.870.944.471.20
Tangibility3.880.822.881.113.441.073.461.473.740.863.921.28
MEAN 3.42 3.97 3.68 3.70 3.76
Disclaimer/Publisher’s Note: The statements, opinions and data contained in all publications are solely those of the individual author(s) and contributor(s) and not of MDPI and/or the editor(s). MDPI and/or the editor(s) disclaim responsibility for any injury to people or property resulting from any ideas, methods, instructions or products referred to in the content.

