Article

Thermodynamic Analysis and Performance Evaluation of Microjet Engines in Gas Turbine Education

by
Razvan Marius Catana
1,
Grigore Cican
1,2 and
Gabriel-Petre Badea
1,2,*
1
Romanian Research and Development Institute for Gas Turbines COMOTI, 220D Iuliu Maniu Avenue, 061126 Bucharest, Romania
2
Faculty of Aerospace Engineering, National University of Science and Technology Politehnica Bucharest, 1-7 Polizu Street, 1, 011061 Bucharest, Romania
*
Author to whom correspondence should be addressed.
Appl. Sci. 2024, 14(15), 6754; https://doi.org/10.3390/app14156754
Submission received: 14 June 2024 / Revised: 19 July 2024 / Accepted: 29 July 2024 / Published: 2 August 2024
(This article belongs to the Section Aerospace Science and Engineering)

Abstract

:
This paper presents a detailed study on the main parameters and performance evaluation of microjet engines, at take-off regime and at various engine working regimes, based on thermodynamic analysis of a particular engine data library, from different engine manufacturers such as JetCat and AMT Netherlands. The studied engines have the same spool design but different thrust classes ranging from 97 to 1569 N. The particular data library includes engine specifications from catalogs or data sheets as well as our own experimental data from the JetCat P80 microjet engine, obtained using the ET 796 Jet Turbine Module, a complete testing facility for gas turbine education purposes. Various ratios and differences between certain engine main parameters and performances are studied in order to calculate values through which the analyses can be performed. Even if the engines have different thrust classes, the study examines if there are close values of the ratios and differences of parameters, that can be defined as reference parameters through which the engine performance can be compared and evaluated.

1. Introduction

A micro gas turbine is a reduced-scale heat engine that operates with similar cycles and components to those found in large gas turbines, with a power range of 25 kW to 300 kW [1]. Compared to jet engines, the primary components of a micro gas turbine engine typically include a centrifugal or mixed-flow compressor, a combustion chamber, a single-stage axial-flow or radial-flow turbine, and a jet nozzle. Presently, micro turbojet engines are the most accessible and practical type of micro gas turbine. This is due to their simple design, low manufacturing and maintenance costs, and ease of operation [2].
Micro turbojet engines have a wide array of engineering applications, including both military and civil aviation, as well as power generation. These micro engines are particularly suited to such applications because of their high power-to-weight ratio, multi-fuel capability, and design simplicity [3]. In the military sector, a significant application of microjet engines is as propulsive power sources for Unmanned Aerial Vehicles (UAVs), owing to their higher energy density (Whr/kg) [3,4]. In the civilian sector, they are suitable for portable power units, radio-controlled (RC) aircraft models, and distributed power generation in combined heat and power applications [4].
Due to the technical advantages mentioned above, micro gas turbines are not only utilized for UAVs and power generation but also have significant applications in the field of gas turbine education. These engines can be installed in small laboratories without the need for complex or expensive infrastructure [2]. Consequently, they can easily become components of propulsion laboratories or small turbine engine test facilities for gas turbine education. Typically, gas turbine labs help students enhance their theoretical knowledge of gas turbines through practical experience. By conducting engine run tests, students can compare theoretical data with experimental data or with other calculated data derived from measurements. Through these experimental tests, a technical reference is established to understand the fundamentals of gas turbine theory and to validate the reasoning behind assumptions and approximations made in analytical performance evaluations [5,6].
Currently, aerospace institutes and research entities such as the German Aerospace Center (DLR) [7,8,9,10] are developing small propulsion laboratories or mobile test facilities as research infrastructure. These facilities are used to study new potential propulsion programs with the aim of improving gas turbine performance [3]. Additionally, aerospace universities are involved in various academic research projects in the field of gas turbines using micro propulsion laboratories [11,12]. The objective of these projects is to optimize performance parameters such as specific fuel consumption, noise and emissions, overall pressure ratio, gas temperature in front of the turbine, turbine and compressor efficiencies, engine thrust, and power [3,11].
Small microturbine engines are very useful for conducting experiments for both educational and research purposes because they do not require the extensive testing infrastructure needed for larger turbine engines. Using microturbine engines for educational purposes is a highly practical option for experiments serving subjects such as turbine processes, thermodynamics, acoustics, chemical pollution, and alternative fuels. Several studies present the use of small turbine engines that, in addition to their educational applications, have been used in the production of scientific papers on experimental and numerical simulation [13]. For example, the study [14] examines the transient processes that occur with various fuels and under different atmospheric conditions. Additionally, the study [15] presents methods for increasing thrust and reducing noise using an ejector for a micro engine, while another study [16,17,18] explores performance and gas emissions using alternative fuels. All these studies are conducted on various types of microturbine engines, and from the literature review on the study of microturbine engines, it was found that the experiments conducted do not provide a detailed analysis of the parameters and performance of these microturbine engines.
This paper presents a comparative study of the parameters and performance variations of micro jet engines, conducted through a detailed thermodynamic analysis and performance evaluation based on various parameter ratios and differences determined by specific calculations. The data utilized in this study are sourced from micro jet engines with varying thrusts and different manufacturers, including JetCat (Ballrechten-Dottingen, Germany) and AMT Netherlands (Geldrop, The Netherlands). The results are presented in both raw and percentage values, shown in tables and displayed in bar variation charts. This approach provides a comprehensive understanding of how the studied parameters vary for each engine and from one model to another within the JetCat and AMT micro jet ranges, as well as from idle to maximum regimes in the case of the JetCat P80.
Moreover, this paper examines a series of parameters not addressed in traditional gas turbine theory articles or other related works. No other papers or even books present the current specific coefficients, nor do they analyze such a substantial volume of data. These coefficients represent new ratios and differences between various parameters and engine performance. The findings will provide a significant contribution to calculations involving new developments or predictive analysis.

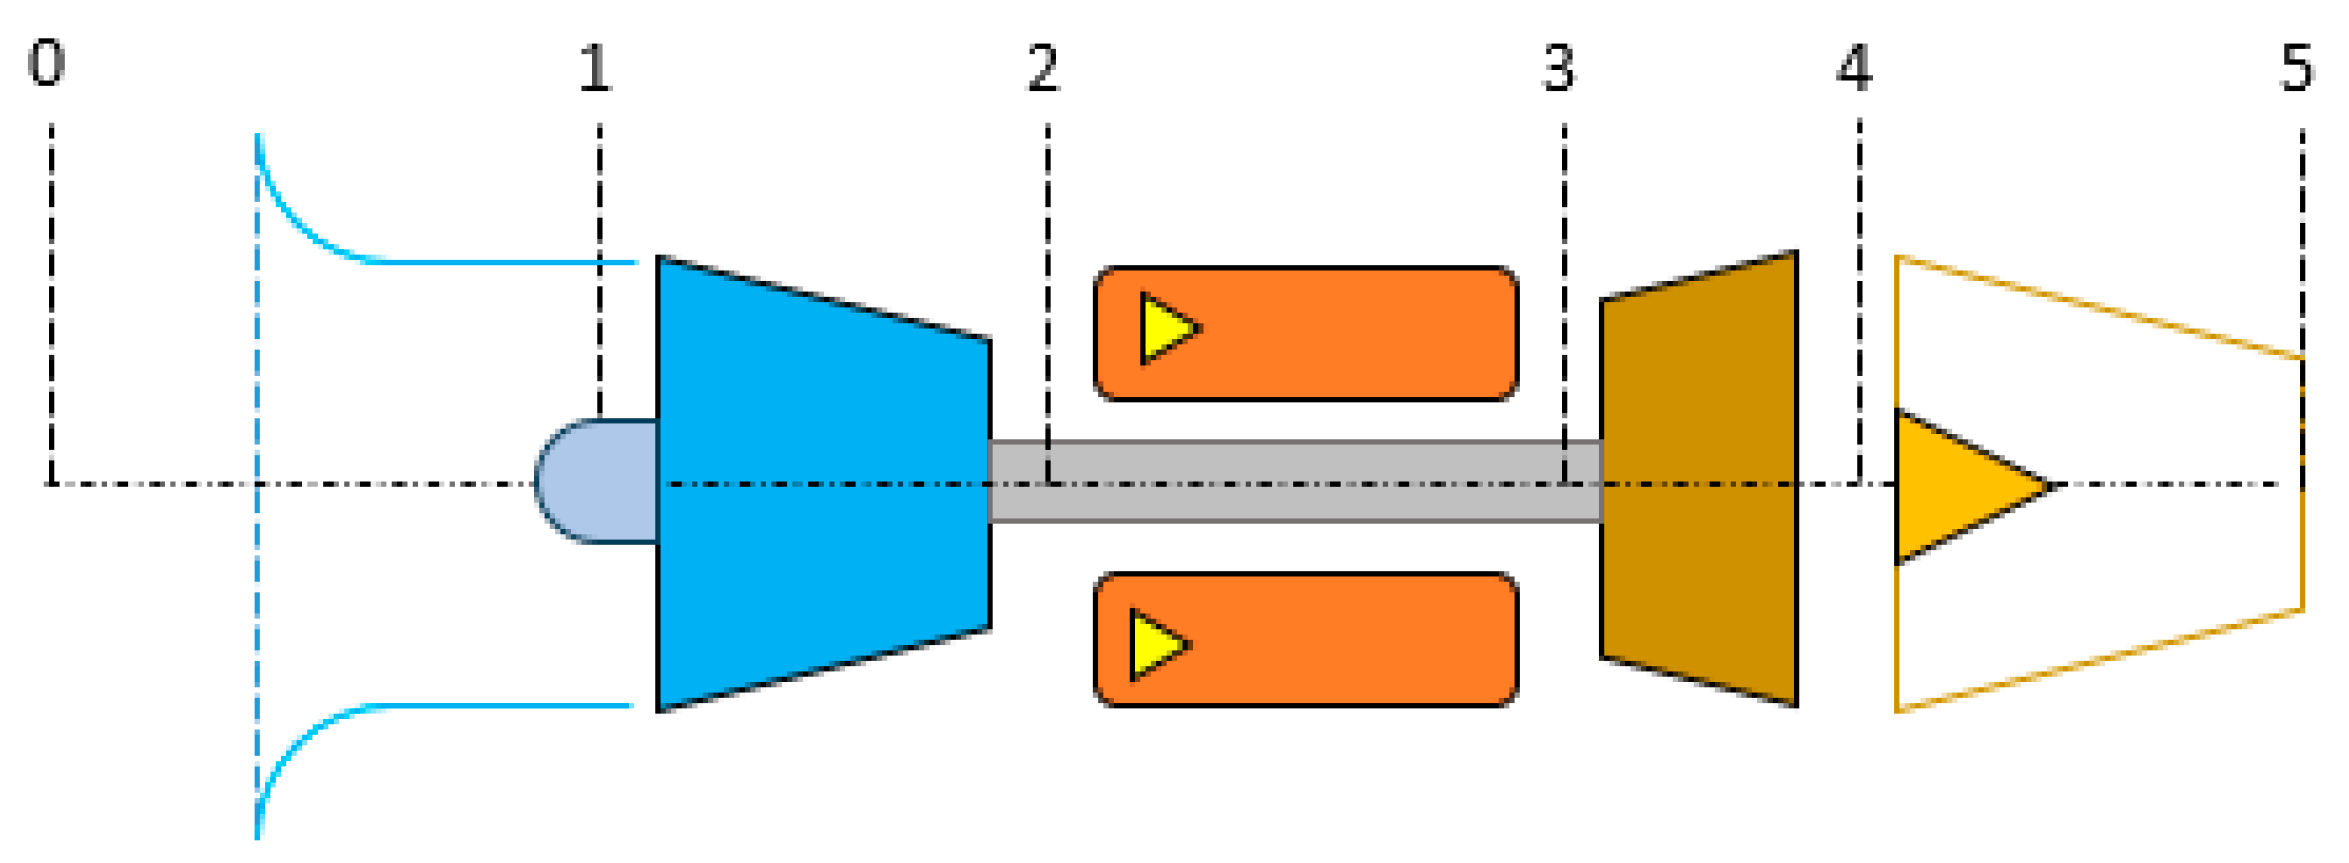
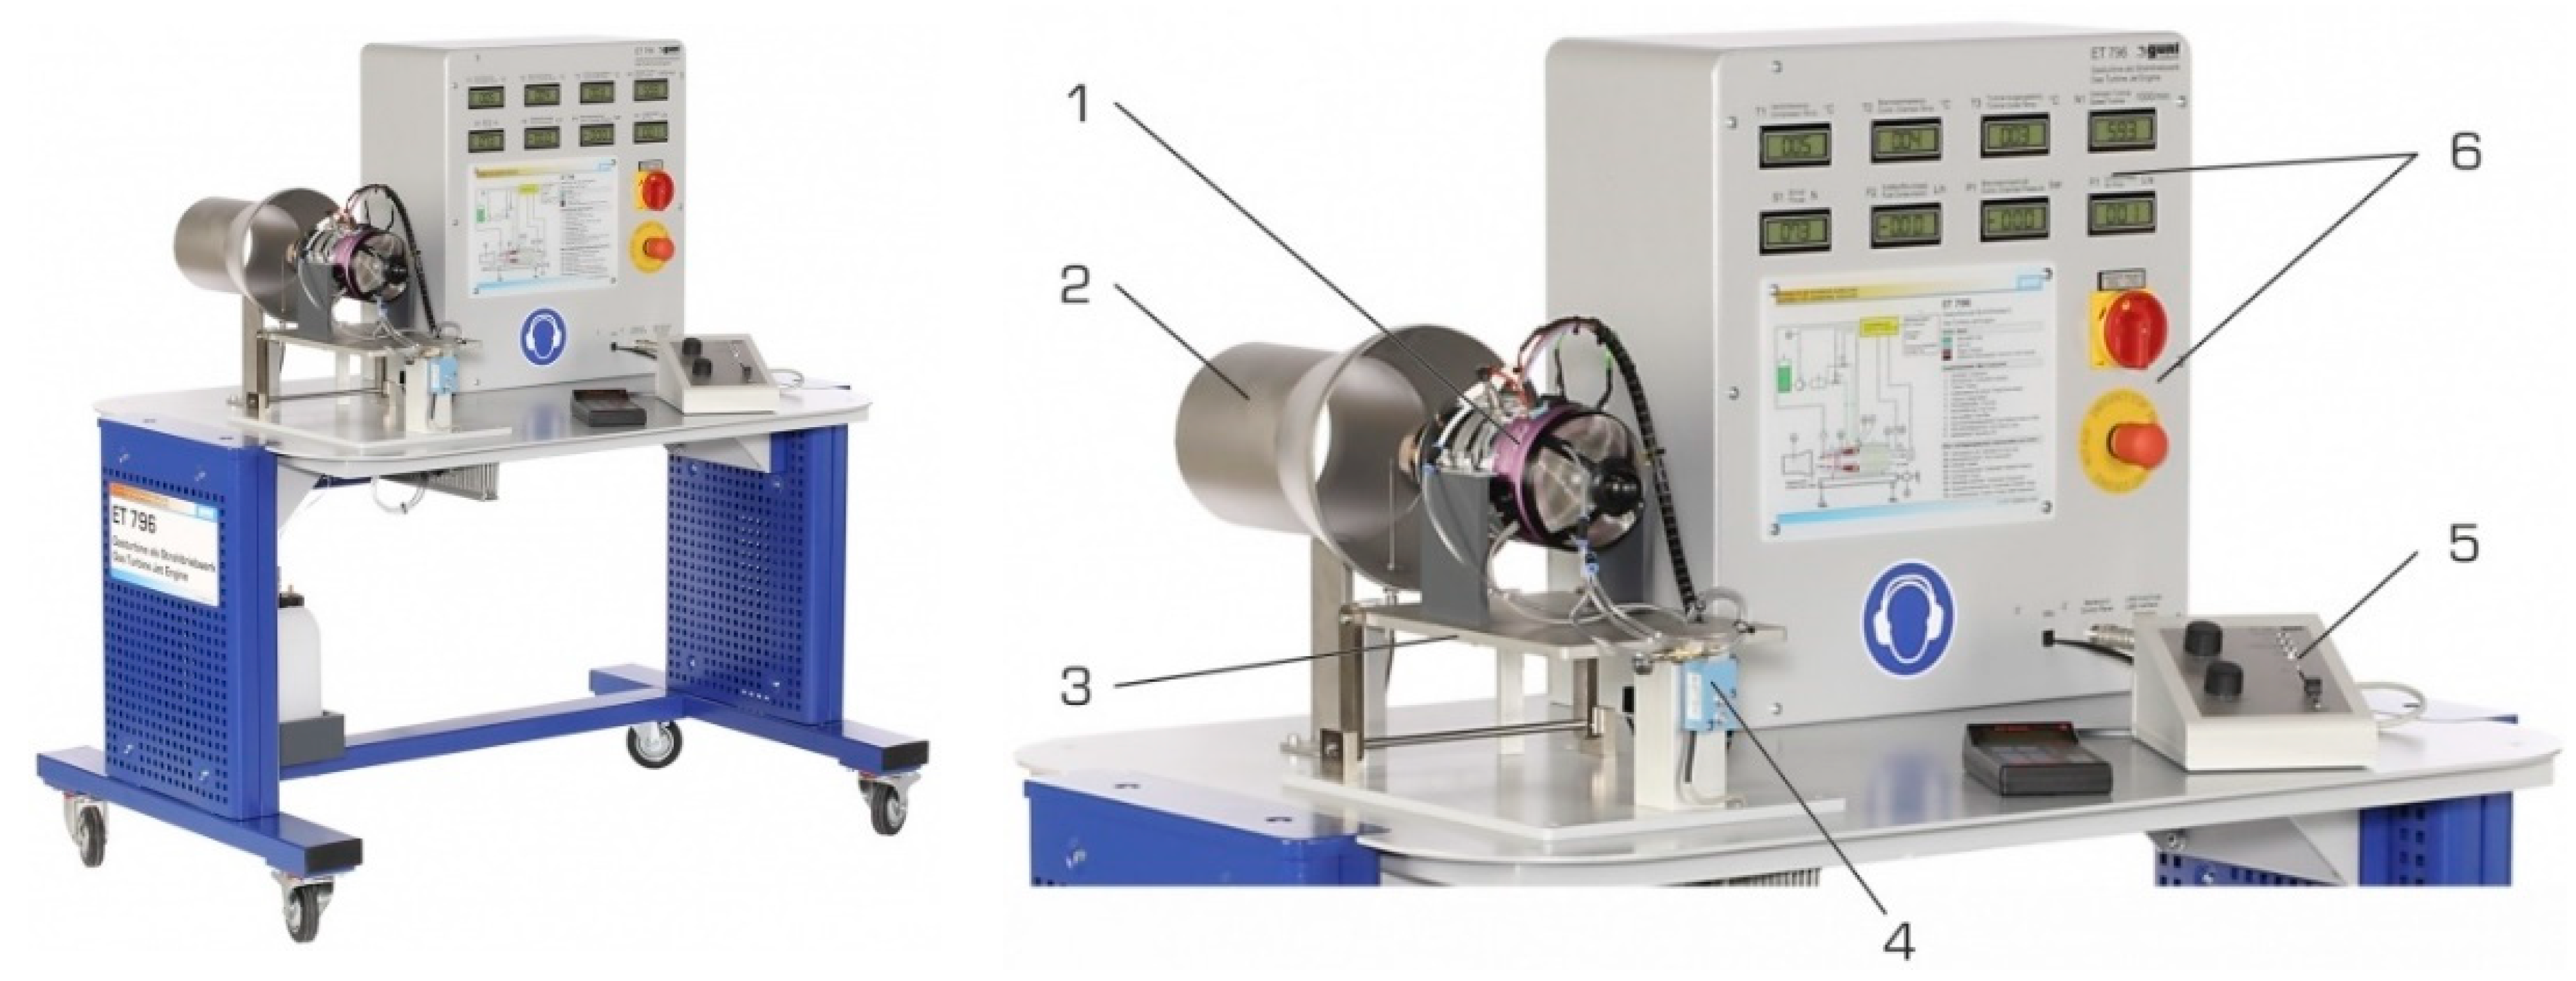
2. The Basis of Study

In the performance evaluation and analysis of micro jet engines, the initial step typically involves creating an engine data library. This library compiles data from various engine manufacturers, different engine models, and different thrust classes, making it accessible and useful for performance calculation models. These models can then be used to calculate various parameters or performance metrics. Given that the engine data are experimental results from different engine models tested with various laboratory test benches equipped with dedicated instrumentation lines and specific measuring points for pressure and temperature at particular engine cross-sections [10,19], the data must be standardized to a common reference.
The second step involves organizing the engine data library using common parameters, thereby establishing a general model of the engine’s main stations. Typically, the engine’s main stations are defined by the cross-sections of the inlets and outlets of the primary components, such as the compressor, combustion chamber, turbine, and jet nozzle. Figure 1 illustrates the general model of the micro jet engine stations for the engines studied.
In this context, station 1 refers to the compressor inlet, station 2 to the compressor outlet, station 3 to the turbine inlet, station 4 to the turbine outlet and also the jet nozzle inlet, and station 5 to the jet nozzle outlet.
Figure 1. Microjet engine main stations.
Applsci 14 06754 g001
The third step is to establish an analysis methodology, as the performance evaluation is based on a series of ratios and differences of certain parameters or engine component performance, determined through an analytical calculation model. This calculation model is based on the real Brayton cycle, depicted in Figure 2, which is the reference cycle describing the thermodynamic operation of gas turbine engines. The thermodynamic cycle is characterized by a total expansion process, meaning the jet nozzle outlet static pressure is equal to atmospheric pressure p5 = p0 = 1.01325 bar.
By following these steps, a systematic and standardized approach to performance evaluation can be achieved, ensuring consistency and reliability in the analysis of different micro jet engines.
Figure 2. Microjet engine real cycle diagram.
Applsci 14 06754 g002

3. The Particular Engine Data Library

The current data library is categorized into two segments: engine data at take-off regime for various engine models from JetCat and AMT Netherlands micro jet manufacturers [20,21] and engine data at various working regimes from the JetCat P80 model. It is noted that this data library contains data exclusively from JetCat and AMT manufacturers, as these engine models provide free access to a broader range of engine main parameters. Other popular micro jet manufacturers such as JetCentral (Ciudad de México, México), PBS Velka Bites (Velká Bíteš, Czech Republic), and Hybl Turbines (Prague, Czech Republic) [22,23,24] restrict the disclosure of comprehensive engine specifications, particularly key parameters such as air mass flow or overall total pressure ratio. Most producers typically provide only dimensional data, thrust, specific fuel consumption, exhaust gas temperature (EGT), engine speed, and fuel type. However, this limited information is insufficient to determine other critical engine parameters or performance metrics. There are numerous research papers on micro jet performance evaluation, but few present actual values of engine main parameters and performances across different working regimes. Most of these papers feature variation curves based on engine speed [25,26,27] or specific charts showing relationships between various engine parameters. One method of creating a data library involves extracting parameter values from these charts, provided the charts are clear and easy to read. However, in many cases, the charts are difficult to extract values from unless the values are explicitly shown on the curves [28]. Next, the data library is organized according to common parameters and performances in line with the general model of engine main stations. Table 1 presents the engine data at take-off regime for a series of micro jet engine models from the JetCat manufacturer [29].
In Table 2, the engine data at take-off regime are presented for several micro jet engine models from the AMT Netherlands manufacturer [30]. This table, along with Table 1, which includes data from JetCat, provides a comprehensive overview of the performance metrics and parameters for these engines at a critical operational regime. This structured data compilation allows for a thorough comparative analysis between different models and manufacturers, contributing to a deeper understanding of the performance characteristics of micro jet engines. The data from these tables will be essential for the subsequent thermodynamic analysis and performance evaluations discussed in this study.
The experimental data of the Jet-Cat P80 micro turbojet were obtained through a series of tests using the ET 796 Jet Turbine Module [10], a small mobile test bench. This test facility, depicted in Figure 3, is a specialized gas turbine laboratory equipped with a fuel system, starting system, measuring instruments, a digital acquisition module, and a user interface for engine control. The measuring system allows for the measurement of pressures and temperatures at key engine stations, as well as the engine thrust. Therefore, the measured parameters provide sufficient data to calculate both overall engine performance and the performance of individual engine components.
This setup ensures a comprehensive and detailed analysis of the Jet-Cat P80, facilitating a better understanding of its operational characteristics and performance metrics. The data gathered from these tests are critical for validating the theoretical models and assumptions made in the performance evaluation study.
In Figure 3 are presented the main components of the ET 796 module with 1—Jet engine, 2—Mixing pipe, 3—Turbine platform, 4—Force sensor for thrust measurement, 5—Gas turbine controller and 6—Displays and safety buttons.
Figure 3. ET 796 Jet Turbine Module.
Applsci 14 06754 g003
In Table 3, the experimental data ranging from idle to maximum regime for the JetCat P80 micro turbojet are presented. These data were obtained from engine run tests conducted using the ET 796 Jet Turbine Module.

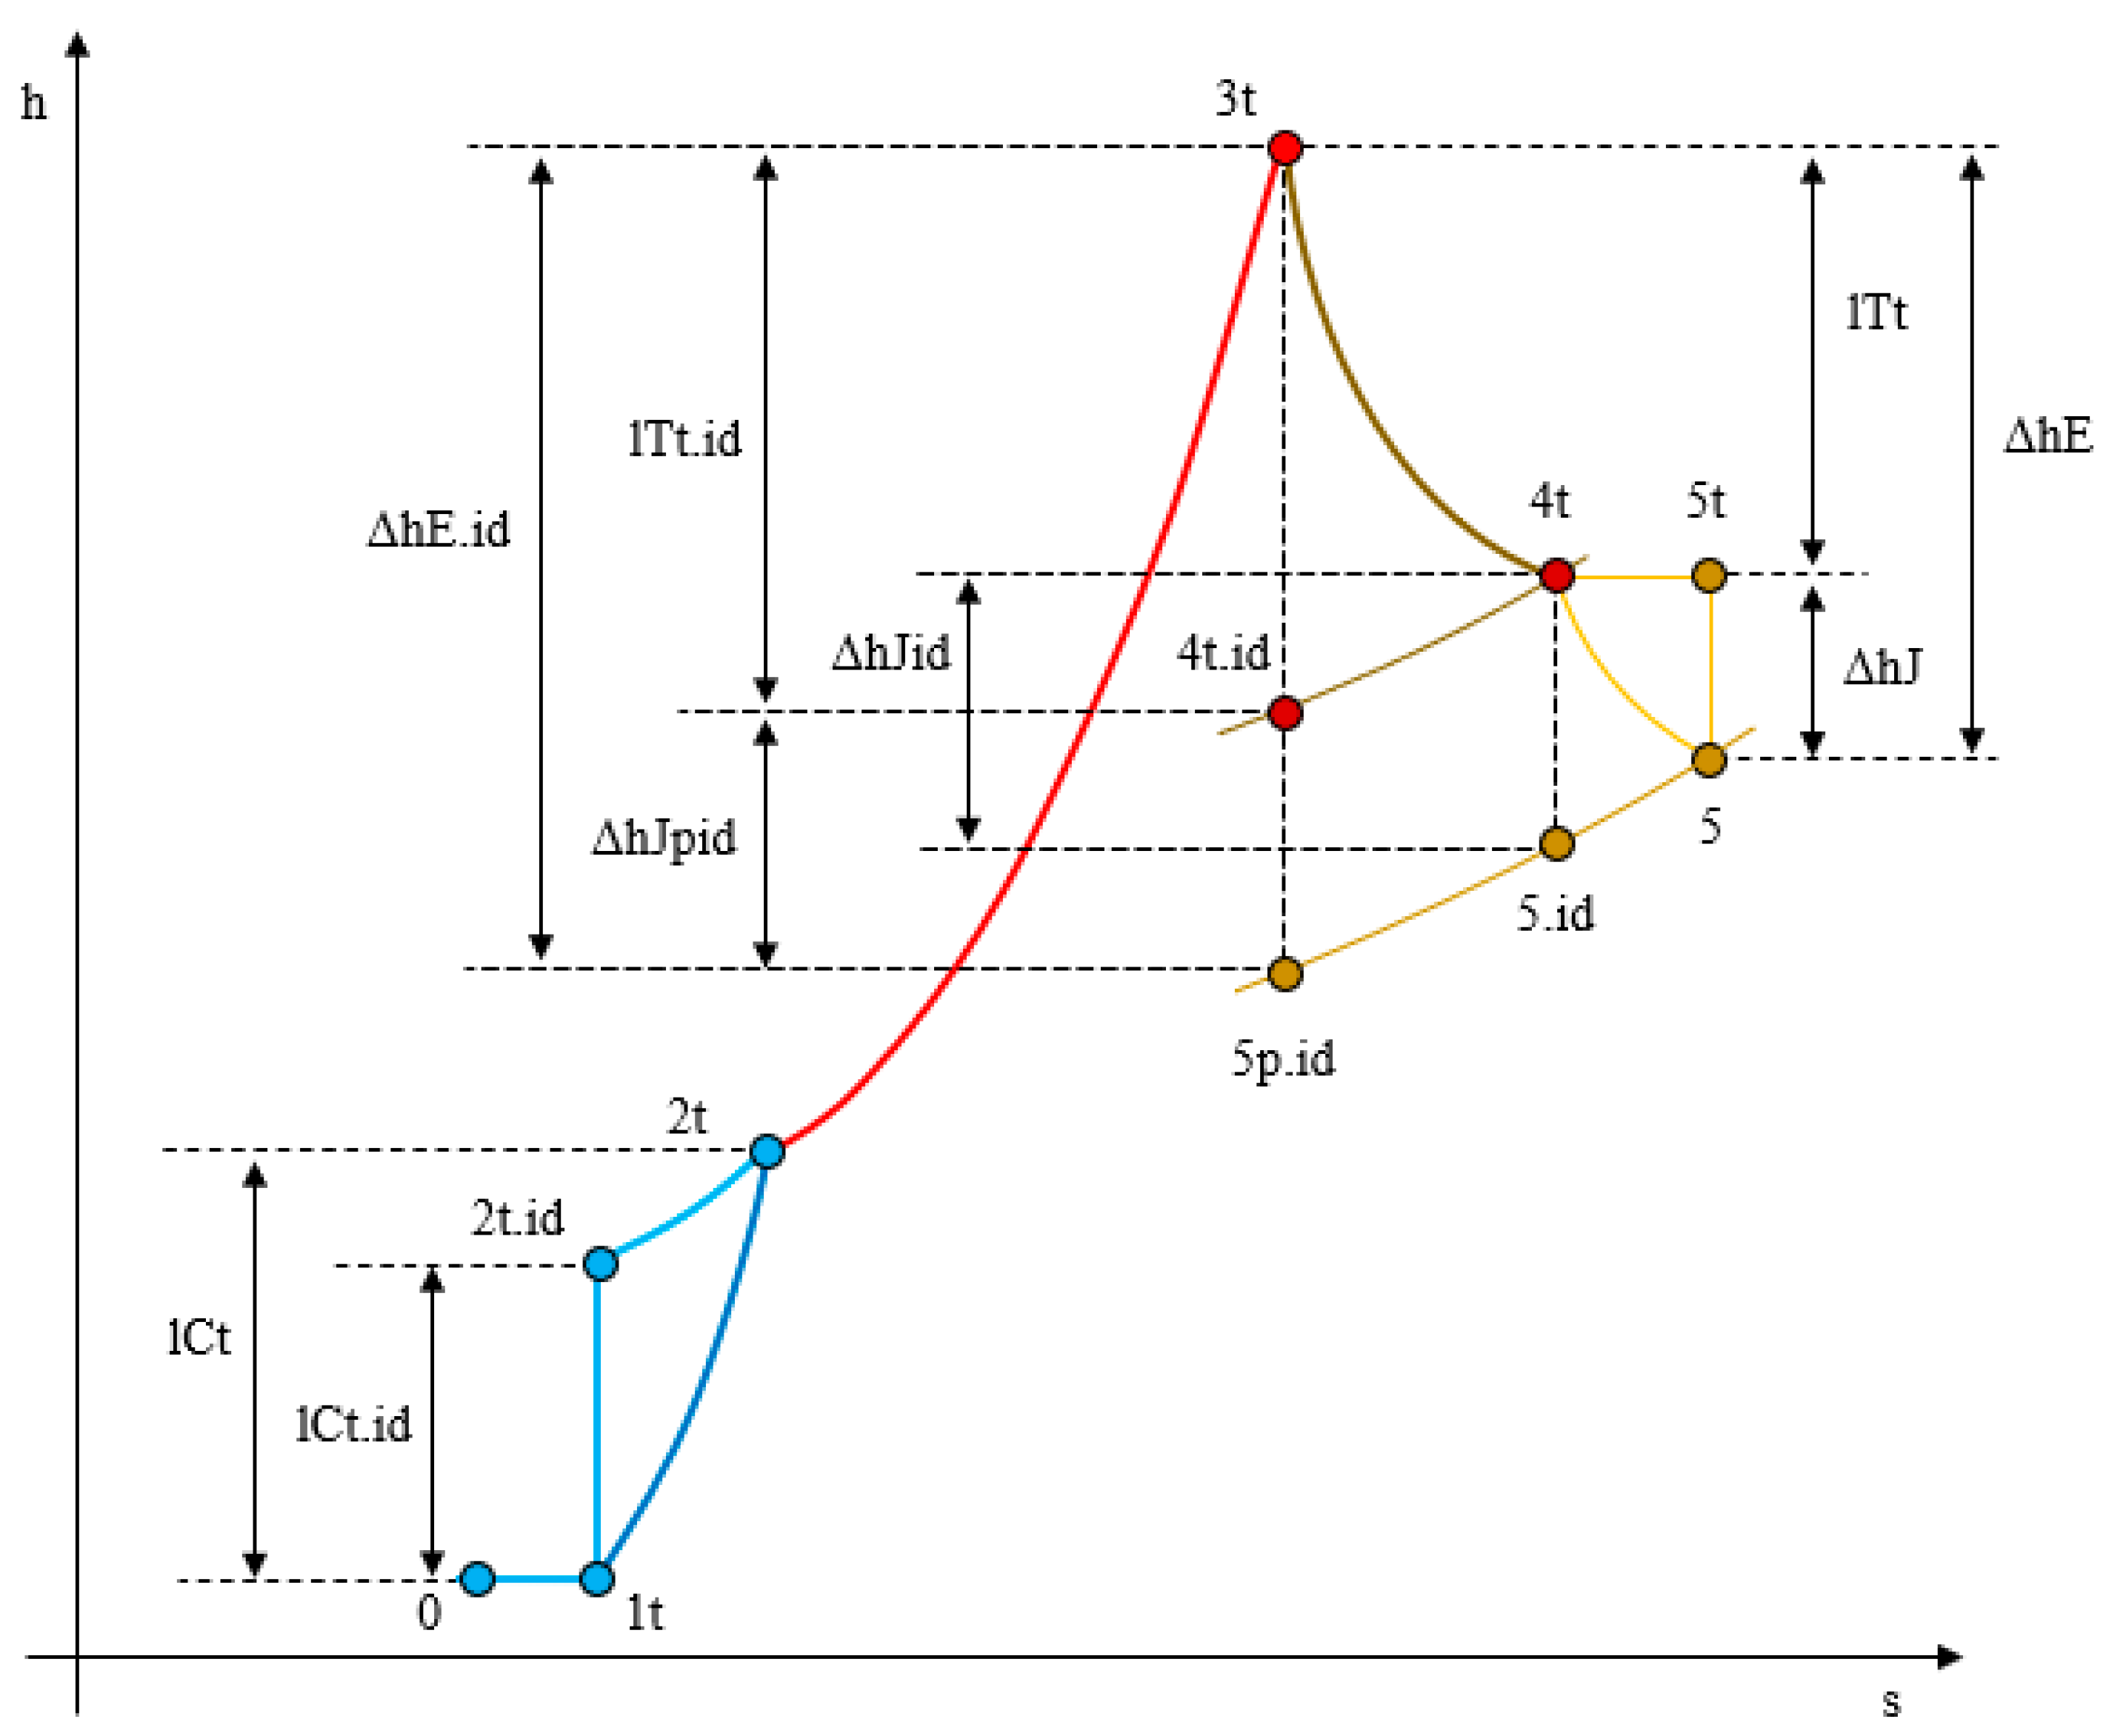
4. Calculation Model
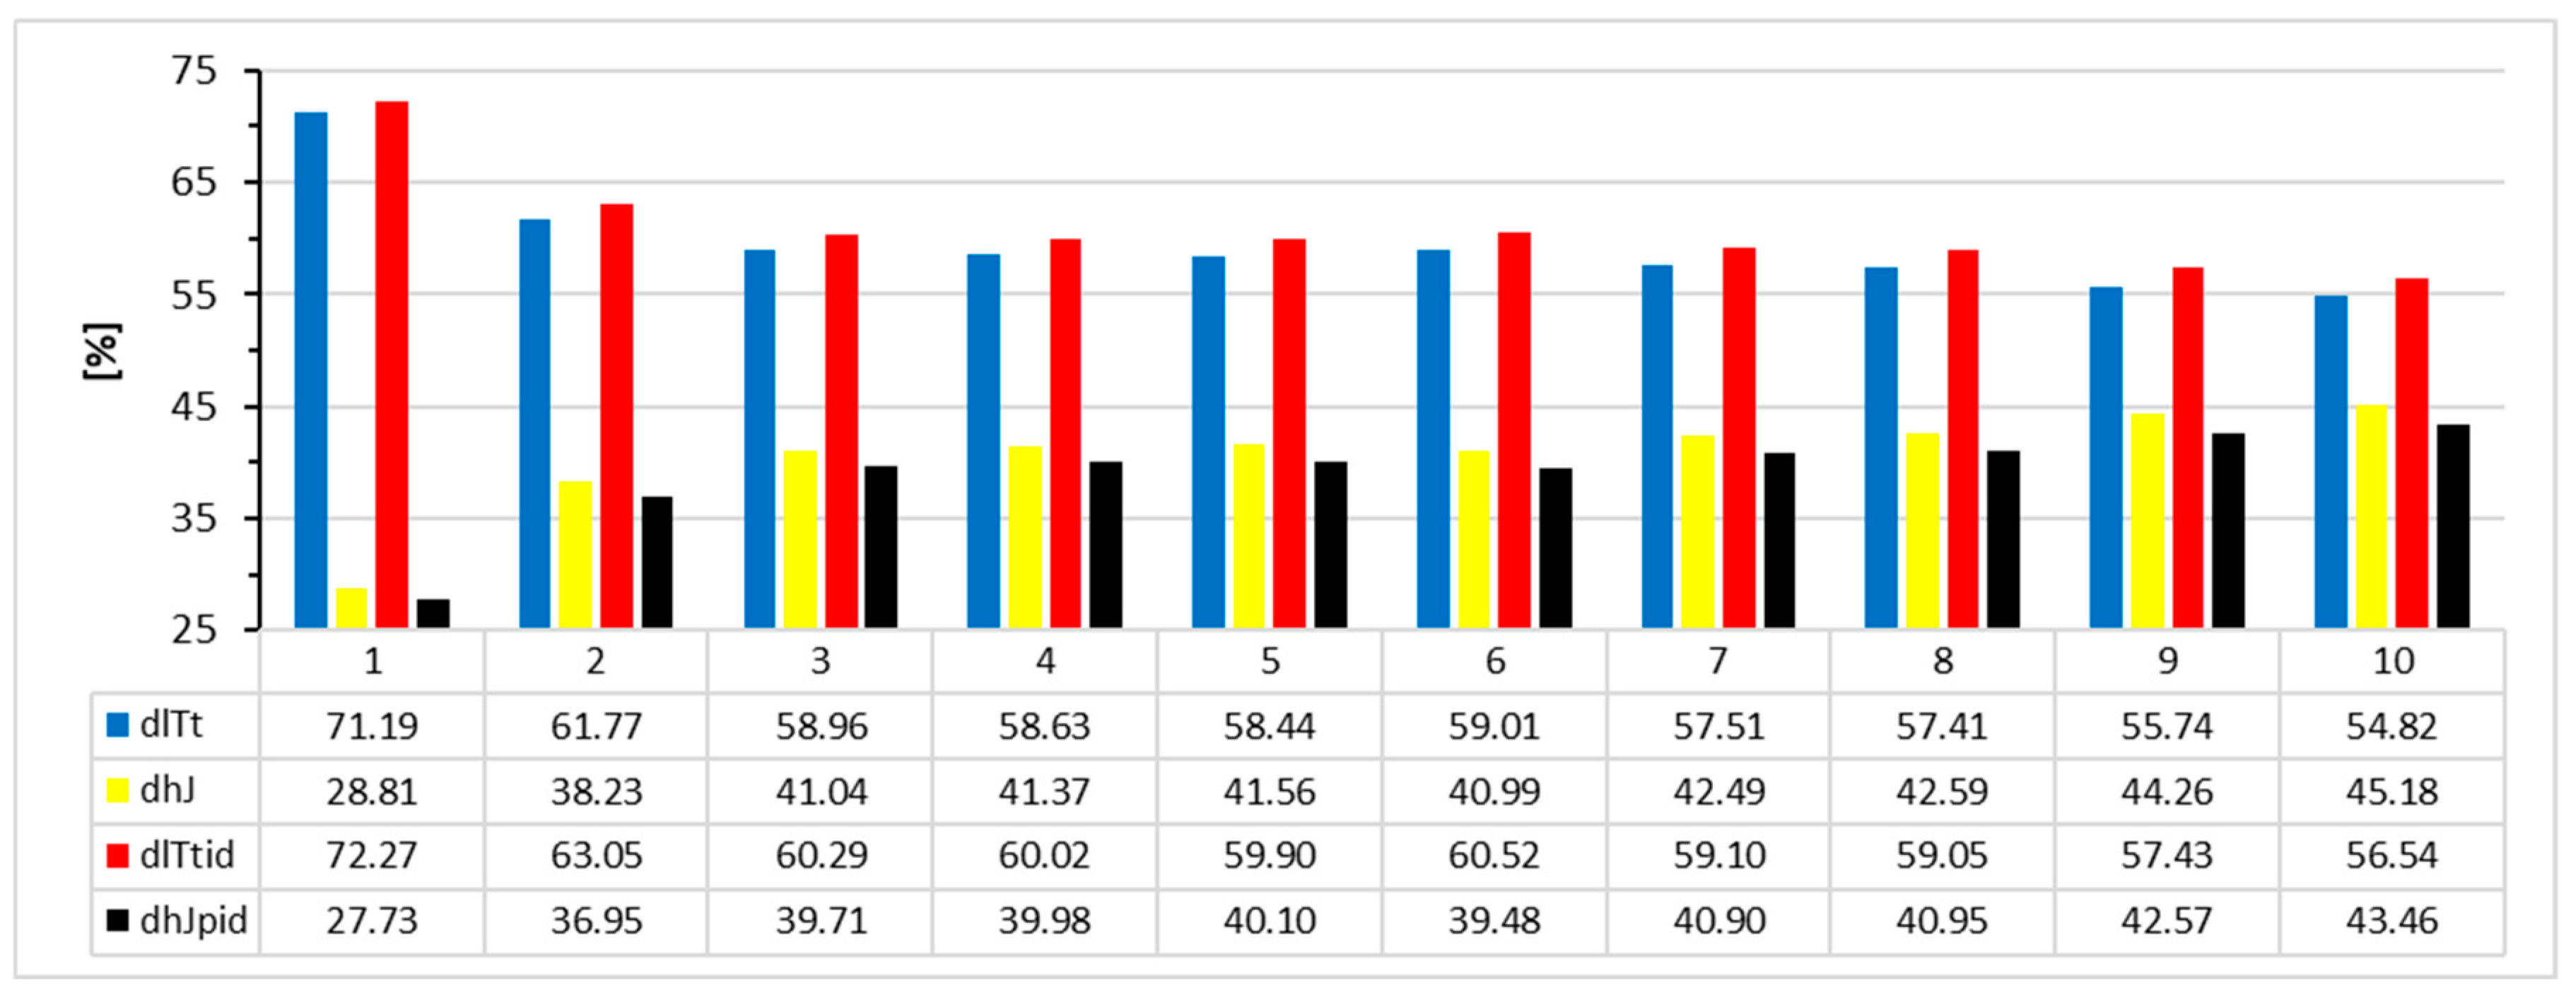
The calculation model is founded on a series of mathematical relationships between the engine’s thermodynamic parameters. It computes various ratios and differences between key engine parameters and performance metrics to obtain actual values necessary for the analysis. To facilitate the calculation process, constant values of heat capacity at constant pressure for air and gases can be used. However, at this small scale, using a fixed value may affect the precision of the calculations. Therefore, the current model employs polynomials for the enthalpy and entropy of air and gases, which are functions of the working temperature [31,32]. This approach significantly reduces the calculation error, providing more accurate and realistic results.
In the case of air and gases (for ideal combustion), enthalpy and entropy are thus defined:
h a T a , s a T a p 0 = f T a h g . i d T g , s g . i d T g p 0 = f T g
where the polynomial function takes the form:
f T = a 1 . a , g + a 2 . a , g T + a 3 . a , g T 2 + a 4 . a , g T 3 + a 5 . a , g T 4 + a 6 . g T 5
The air/gases enthalpy and entropy polynomial coefficients are presented in a previous research paper [31,32].
In case of gases (for real combustion), the enthalpy and entropy have the next forms:
h g T g = x i d i g . i d T g + x a . e x h a T g
s g T g p 0 = x i d s g . i d T g p 0 + x a . e x s a T g p 0
where the mass participation x i d , x a . e x depending on air excess α e x and air–fuel ratio m i n L
x s t = 1 + m i n L 1 + α e x · m i n L ; x s t = α e x 1 m i n L 1 + α e x · m i n L
The most commonly used fuel for micro jet engines is Jet-A1 kerosene. Since all micro jet engine models lack a proper oil system and rely on fuel for lubrication, the fuel must be pre-mixed with 3–5% oil. For AMT engines, Aeroshell 500 turbine oil is used for the mixture, while JetCat engines use their own JetCat turbine oil [33].
As a result, the mixture of fuel and oil will have a different lower heating value (LHV) than the pure fuel. The LHV of Jet-A1 kerosene is 42,900 kJ/kg, but according to the ET 796 instruction manual [34], the LHV of the fuel–oil mix is 42,580 kJ/kg. Additionally, the air–fuel ratio for the mixture is 14.2, compared to the standard value of 14.57. This difference in LHV and air–fuel ratio needs to be considered in performance calculations to ensure accurate results.
Globally, the calculation model is based on a series of equations [35,36,37,38], as follows:
Intake and combustor chamber total pressure loss, compressor overall pressure ratio, and turbine total expansion degree:
σ d a . t = p 1 . t p 0 ; σ c a . t = p 3 . t p 2 . t ; π C . t = p 2 . t p 1 . t ; δ T . t = p 3 . t p 4 . t
Compressor inlet, outlet total specific enthalpy, and total specific actual work:
h 1 . t = i a T 1 . t ; h 2 . t = i a T 2 . t ; l C . t = h 2 . t h 1 . t
Turbine inlet, outlet total specific enthalpy, and total specific actual work:
h 3 . t = i g T 3 . t ; h 4 . t = i g T 4 . t ; l T . t = h 3 . t h 4 . t
Compressor and turbine total adiabatic efficiency:
η C . t = l C . t . i d l C . t ; η T . t = l T . t l T . t . i d
Compressor inlet, outlet total specific entropy:
s 1 . t = s a T 1 . t p 0 R a ln p 1 . t p 0 ; s 2 . t = s a T 2 . t p 0 R a ln p 2 . t p 0
Turbine inlet, outlet total specific entropy:
s 3 . t = s g T 3 . t p 0 R g ln p 3 . t p 0 ; s 4 . t = s g T 4 . t p 0 R g ln p 4 . t p 0
Compressor, turbine, and jet nozzle isentropic relations:
s 2 . t . i d = s 1 . t ; s 3 . t = s 4 . t . i d ; s 3 . t = s 5 p . i d ; s 4 . t = s 5 . i d
Fuel flow coefficient, air excess, and gases flow:
f f c = F f M a f ; α e x = 1 f f c · m i n L ; G f = M a f + F f
Inlet turbine total specific enthalpy and specific fuel consumption:
h 3 . t = h 2 . t + f f c · L H V f · η c a 1 + f f c ; S F C = 3600 · F f T R
Compressor and turbine power:
P C = M a f · l C . t ; P T = G f · l T . t ; P c = P T · η m ; l T . t = l C . t 1 + f f c · η m
Jet nozzle thrust and outlet static pressure for a total expansion process:
T R = G f · C 5 ; p 5 = p 5 . i d = p 5 p . i d = p 0
Jet nozzle power, fuel energy, and thermal efficiency:
P J = G f · C 5 2 2 ; P f = F f L H V f ; η t e = P J P f
Jet nozzle outlet specific enthalpies and velocity coefficient:
h 5 = h 4 . t C 5 2 2 ; h 5 i d = h 4 . t C 5 i d 2 2 ; φ J = C 5 C 5 i d
Total specific ideal and actual enthalpy differences and power of expansion process:
Δ h E . i d = h 3 . t h 5 p . i d ; Δ h E = h 3 . t h 5 ; P E = G f Δ h E
Jet nozzle ideal and actual total specific enthalpy expansion
Δ h J . p . i d = h 4 . t . p . i d h 5 p . i d ; Δ h J . i d = h 4 . t h 5 . i d ; Δ h J = h 4 . t h 5
Jet nozzle outlet heat capacity at constant pressure, adiabatic coefficient, and Mach number.
C p T 5 = h g T 5 T 5 ; k g T 5 = C p T 5 C p T 5 R g ; θ M 5 = T 5 . t T 5 = 1 + k g T 5 1 2 · M 5 2
Turbine and jet nozzle actual temperatures differences:
Δ T T . t = T 3 . t T 4 . t ; Δ T J = T 4 . t T 5 ; Δ T E = T 3 . t T 5
Turbine and jet nozzle actual temperatures differences:
Δ T T . t . i d = T 3 . t T 4 . t . i d ; Δ T J . p . i d = T 4 . t . i d T 5 . p . i d
Δ T J . i d = T 4 . t T 5 . i d ; Δ T E . i d = T 3 . t T 5 . p . i d
Combustor chamber, turbine, and jet nozzle actual temperatures ratio of expansion process:
d T C H . t = T 2 . t T 3 . t ; d T T . t = T 4 . t T 3 . t ; d T J = T 5 T 4 . t ; d T E = T 5 T 3 . t
Turbine and jet nozzle ideal temperatures ratio of expansion process:
d T T . t = T 4 . t . i d T 3 . t ; d T J . p . i d = T 5 . p . i d T 4 . t . i d ; d T J . i d = T 5 . i d T 4 . t ; d T E . i d = T 5 . p . i d T 3 . t
Total specific ideal and actual ratio enthalpies of expansion process
d l T . t = l T . t Δ h E ; d h J = Δ h J Δ h E ; d l T . t . i d = l T . t . i d Δ h E . i d ; d h J . i d = Δ h J . p . i d Δ h E . i d
Generally, depending on the known data and the required calculated data, specific calculation models are developed using the relevant equations. According to our data library, the known data for JetCat and AMT engines differ from the data for the JetCat P80 engine, resulting in different calculation models, though using the same equations in a different sequence. For JetCat and AMT micro jets, the particular calculation model is described by the calculated parameters in the following order:
T R , S F C F f ; M a f , F f f f c , α e x , G f ; T R , G f C 5
s 1 . t , s 2 . t . i d T 2 . t . i d , h 2 . t . i d l C . t . i d ; η C . t , l C . t . i d l C . t , h 2 . t
f f c , L H V f , h 2 . t h 3 . t ; f f c , l C . t l T . t , h 4 . t ; η T . t , l T . t l T . t . i d
h 3 . t , l T . t . i d h 4 . t . i d , T 4 . t . i d ; s 3 . t , s 4 . t . i d p 4 . t . i d , p 4 . t
s 4 . t , s 5 . i d T 5 . i d ; h 4 . t , T 5 . i d C 5 . i d , φ J ; h 4 . t , C 5 h 5 ,   T 5
s 3 . t , s 5 p . i d T 5 p . i d , i 5 p . i d , Δ h E . i d , Δ h E Δ h J . i d , Δ h J . i d P J , η t e
Additionally, the calculation model requires other parameters or coefficients, which are defined by standard values. The additional parameters and coefficients used in the calculation model, along with their values, are shown in Table 4. The values of the η T . t and φJ are shown in Table 10.
In case of η c a   , different values are used. For AMT Pegasus, the used value is 0.85; for JetCat P100-RX, P130-RX, P160-RXi-B, P180-NX, P200-RX, and P220-RX, the used value is 0.88; for JetCat P200, P300-PRO, P400-PRO, P500-PRO GL, and P550 PRO, the used value is 0.90, the same as for AMT models Olympus (Tokyo, Japan), Titan (Bangalore, India), and Nike (Beaverton, OR, USA); for JetCat P80-SE and AMT Lyns, the used value is 0.94; and for JetCat P1000-PRO, the used value is 0.96. The values lower than 0.94 were taken following the study of several papers [3,39,40].
In case of the JetCat P80 micro jet, the particular calculation model is described by the calculated parameters in the indicated order:
p 3 . t , σ c a t p 2 . t , π C . t ; s 1 . t , s 2 . t . i d T 2 . t . i d , h 2 . t . i d l C . t . i d
η C . t , l C . t . i d l C . t , h 2 . t ; α e x = f T 3 . t , π C . t α e x
h 3 . t , L H V f , h 2 . t f f c l T . t , h 4 . t ; η T . t , l T . t l T . t . i d h 4 . t . i d , T 4 . t . i d
s 3 . t , s 4 . t . i d p 4 . t . i d , p 4 . t ; s 4 . t , s 5 . i d T 5 . i d , i 5 . i d ; i 4 . t , i 5 . i d C 5 . i d
C 5 . i d , φ J C 5 ; T R , C 5 G f ; G f , f f c M a f , F f
s 3 . t , s 5 p . i d T 5 p . i d , i 5 p . i d , Δ h E . i d , Δ h E Δ h J . i d , Δ h J . i d P J , η t e
The additional parameters and coefficients used in the calculation model and their values are shown in Table 5.
The calculations were performed using Mathcad 14 version software, where the root function was utilized to calculate temperatures from the enthalpy and entropy polynomials.

5. Results

In the case of JetCat and AMT micro jets, the data results are obtained following the application of the first calculation model. These results are organized into tables, grouped into specific series, and present the actual values of certain key engine parameters, coefficients, and performance metrics for each micro jet engine. Given the large volume of data obtained from the calculations, it is impractical to present all the results. Therefore, only selected data are shown in the tables. This approach avoids duplication of results and provides relevant data from which other specific engine parameters can be easily determined. For the JetCat P80 micro jet, the data results are obtained following the application of the second calculation model. These results also present actual values for each working regime, covering the same parameters, ratios, differences, and performance metrics established for the JetCat and AMT jet models. This consistency allows for a comprehensive comparison and analysis of the performance across different engine models and operating conditions.
From a data sorting perspective, three sets of data results are obtained: one for JetCat models, one for AMT models, and one for the JetCat P80 model.
The first and second series are similar; however, the third series has some differences in the types of parameters due to the calculation models starting from different known data. This variation in starting data leads to differences in the calculated parameters and the results presented. The first series of data results is defined by the power of the turbine P T , jet nozzle P J , expansion process P E , turbine total specific ideal and actual work l T . t , l T . t . i d , total specific ideal and actual enthalpy of jet nozzle Δ h J . p . i d , Δ h J . i d , Δ h J , and expansion process Δ h E . i d , Δ h E . In Table 6 and Table 7, the first series of data results are presented for the JetCat and AMT models at take-off regime, sorted by thrust. Additionally, data for the JetCat P80 model are presented at various working regimes.
The second series of data results are defined by the inlet and outlet temperatures of the combustor chamber T 2 . t , T 3 . t , fuel flow and air excess F f , α e x , total ideal/actual temperature differences on turbine Δ T T . t , Δ T T . t . i d and on jet nozzle Δ T J . p . i d , Δ T J . i d , Δ T J , and expansion process Δ T E . i d , Δ T E . Table 8 and Table 9 present the second series of data results at take-off regime, for JetCat and AMT models, sorted by thrust, and at each working regime for JetCat P80 model.
The third series of data results are defined by the compressor and turbine total adiabatic efficiency η C . t , η T . t , compressor outlet total pressure p 2 . t and specific actual enthalpy h 2 . t , turbine total expansion degree δ T . t and outlet pressure p 4 . t , gases mass flow G f , jet nozzle outlet gas velocity C 5 , Mach number M 5 , velocity coefficient φ J , and thermal efficiency η t e .
Table 10 and Table 11 present the third series of data results at take-off regime, for JetCat and AMT models, sorted by thrust, and at each working regime for JetCat P80 model.
To expand the volume of presented data without duplication and provide a clearer comparison of values, the following charts from Figure 4, Figure 5, Figure 6, Figure 7, Figure 8, Figure 9, Figure 10, Figure 11, Figure 12, Figure 13, Figure 14 and Figure 15 depict specific data results derived from the tables presented in Table 6, Table 7, Table 8, Table 9, Table 10 and Table 11. These charts offer a visual representation of key performance metrics and parameters, making it easier to compare and analyze the data across different engine models and operating conditions.
As shown in Figure 4, for d l T . t and d l T . t . i d , a random variation from an engine to another is observed between 46.5% to 66.6% in the case of d l T . t and between 47.5% to 70.8% in case of d l T . t . i d . For d h J and d h J . i d , a random variation between 33.4% to 53.4% is also observed in the case of d h J and between 29.2% to 52.3% in the case of d h J . i d .
Figure 4. Total specific ideal/actual ratio enthalpies for JetCat and AMT models.
Applsci 14 06754 g004
As shown in Figure 5, for d l T . t and d l T . t . i d , a decreasing variation from the idle regime to the maximum is observed, with some random values between 71.2% to 54.8% in the case of d l T . t , and between 72.3% to 56.5% in the case of d l T . t . i d . For d h J and d h J . i d , an increasing variation is observed with some random values between 28.8% to 45.2% in the case of d h J and between 27.7% to 43.5% in the case of d h J . i d .
Figure 5. Total specific ideal/actual ratio enthalpies for JetCat P80 micro jet model.
Applsci 14 06754 g005
As shown in Figure 6, for d T C H . t , a random variation from an engine to another is observed, between 36.4% and 40.9%. For d T T . t , d T J and d T E a random variation between 85.7% to 91.7% is also observed in the case of d T T . t , between 85.9% to 92.5% in the case of d T J , and between 76.4% to 84.5% in the case of d T E .
Figure 6. Actual temperatures ratio for JetCat and AMT micro jets models.
Applsci 14 06754 g006
As shown in Figure 7, for d T C H . t , an increasing variation from the idle regime to the maximum is observed, but with some random values between 34.3% and 40.7%. For d T T . t , d T J , and d T E a continuous decreasing variation is observed between 98.7% to 91.3% in the case of d T T . t , between 99.5% to 92.4% in the case of d T J , and between 98.2% to 84.2% in the case of d T E .
Figure 7. Actual temperatures ratio for JetCat P80 micro jet model.
Applsci 14 06754 g007
As shown in Figure 8, for d T T . t . i d , a random variation from an engine to another is observed, between 81.1% and 89.9%. For d T J . p . i d , d T J . i d , and d T E . i d , a random variation is also observed between 83.8% to 91.6% in the case of d T J . p . i d and d T J . i d and between 72.7% to 82.3% in the case of d T E . i d .
Figure 8. Ideal temperatures ratio for JetCat and AMT micro jet models.
Applsci 14 06754 g008
As shown in Figure 9, for d T T . t . i d   d T J . p . i d , d T J . i d , and d T E . i d , a continuous decreasing variation from the idle to the maximum regime is observed between 98.5% to 89.6 in the case of d T T . t . i d , between 99.4% to 90.9 in the case of d T J . p . i d and d T J . i d , and between 97.9% to 81.5 in the case of d T E . i d .
Figure 9. Ideal temperatures ratio for JetCat P80 micro jet model.
Applsci 14 06754 g009
All the percentage differences between the actual and ideal values for the previously presented data are shown in Table 12 and Table 13. Considering that the previous results are percentage data, percentage parameters are also used to make a direct comparison of the main engine parameters and performances for JetCat and AMT micro jets at take-off regime and for the JetCat P80 micro jet at various working regimes. For JetCat and AMT micro jets, the percentage data are calculated by comparing the data of each engine model to the Lynx engine (AMT Netherlands), which is the most powerful engine in the dataset. For the JetCat P80, the percentage data are calculated by comparing the data of each working regime to the maximum regime [41,42]. This approach ensures a consistent basis for comparison, highlighting the relative performance of each engine model and operating condition.
The following mathematical relations define the percentage parameters:
d p r m e n g = p r m p r m L y n x 100 %
d p r m P 80 = p r m p r m m a x 100 %
Figure 10 and Figure 11 present the percentage variation of power of turbine P T , jet nozzle P J , and expansion process P E , sorted by thrust, for JetCat and AMT models and the JetCat P80 model.
Figure 10. Percentage variation of powers for JetCat and AMT models.
Applsci 14 06754 g010
Figure 11 shows, for P T   P J and P E , a continuous increasing variation from the idle to maximum regime, starting from 2.7% in the case of P T , from 1.31% in the case of P J , and from 2.1 in case of P E .
Figure 11. Percentage variation of powers for JetCat P80 model.
Applsci 14 06754 g011
Figure 12 and Figure 13 present the percentage variation of air mass flow M a f , fuel flow F f , and turbine inlet temperature T 3 . t , sorted by thrust, for JetCat and AMT models and the JetCat P80 model.
Figure 12. Percentage variation of main parameters for JetCat and AMT models.
Applsci 14 06754 g012
Figure 13. Percentage variation of main parameters for JetCat P80 model.
Applsci 14 06754 g013
Figure 14 and Figure 15 present the percentage variation of jet nozzle outlet gas velocity C 5 , velocity coefficient φ J , and thermal efficiency η t e , sorted by thrust, for JetCat and AMT models and the turbine total expansion degree δ T . t for the JetCat P80 model instead of the velocity coefficient.
Figure 14. Percentage variation of jet nozzle parameters and performance for JetCat and AMT models.
Applsci 14 06754 g014
Figure 15. Percentage variation of jet nozzle parameters and performance for JetCat P80 model.
Applsci 14 06754 g015
Figure 10, Figure 12 and Figure 14 show in percentage values the comparison of main parameters and performances between the engines in order to obtain the actual thrust. These graphs show, on a scale of thrust from 97 to 1569 [N], by actual values, how many of the main parameters and performances are reported at maximum values of the Lyns engine.
In the case of the JetCat P80 engine, as seen in Figure 11, Figure 13 and Figure 15, it is observed that the engine’s main parameters and performances, when reported to the maximum regime, exhibit an increasing variation but start from different percentage values. This indicates that the parameters do not vary uniformly.
For lower thrust engines with lower thermal efficiency, it is observed that the percentage of power distribution between the turbine and jet nozzle is 67% to 33%. For higher thrust engines, this distribution shifts to 47.5% to 52.5%. This shift in power distribution reflects how different thrust levels and thermal efficiencies affect the balance of power between the turbine and the jet nozzle, providing insights into the performance characteristics of engines across different thrust ranges.

6. Discussion

Following the calculation, a significant amount of data is generated, sufficient for a thorough thermodynamic analysis at take-off regime for JetCat and AMT engine models, and at various working regimes for the JetCat P80. This study examines the differences between the actual and ideal percentage values of the main parameters, coefficients, and performance metrics for each micro jet engine to observe the limits of variation. Special attention is given to the energy distribution during the expansion process between the turbine and jet nozzle. This study aims to understand how this energy distribution varies from the smallest to the largest engine and from the minimum to maximum regime.
The comparison method is based on percentage differences. Therefore, a series of percentage differences of new coefficients are defined in relation to the turbine and jet nozzle total specific work, as well as enthalpy and temperature ratios. These differences are calculated to identify small variations, based on which the coefficients can be declared as constant. The following mathematical relations define these percentage differences of the new coefficients [41,42]:
Δ d l T . t = d l T . t d l T . t . i d
Δ d h J = d h J d h J . p . i d
d T T . t = d T T . t d T T . t . i d
d T E = d T E d T E . i d
d T J . i d = d T J . i d d T J . p . i d
d T J = d T J d T J . i d
From the Table 12, for a difference engine thrust of 1472, it is observed that the maximum differences for Δ d l T . t and Δ d h J is the same 3.0%, in case of d T T . t and d T T . t is 3.0% and 3.3% and in case of d T J . i d and d T J is 0.08% and 1.46%. This means that the engines have almost similar thermodynamic working process with small variations.
From the Table 13 it is observed that the maximum differences for Δ d l T . t and Δ d h J is the same at 0.70%; in the case of d T T . t and d T E , they are 1.4% and 2.2%; and in case of d T J . i d and d T J , they are 0.03% and 1.0%. The reported parameters have close variation from one regime to another, which means that they can be used as almost constant parameters, useful in model calculations.
From these values, it is observed that the engines exhibit almost similar thermodynamic working processes with minor variations. The current coefficients demonstrate close variation from one regime to another, indicating that they can be used as nearly constant coefficients in calculations for specific models where sufficient parameters are not known. One of the most valid coefficients, which has been demonstrated to be taken as constant, is d T J . i d , as the percentage values are lower than 0.1% across regimes from idle to takeoff.

7. Conclusions

The objective of this paper is to provide reliable performance evaluation and analysis data for a series of micro jet models, based on a specific data library and analytical calculation models. This information is valuable for gas turbine engine education and micro jet experimental applications.
The main idea of this study is to observe the extent of percentage differences between the actual and ideal values of the engine’s main parameters, coefficients, and performances. If the percentage differences are very close, they can be considered constant. In such cases, they can be applied to actual values in practical calculation models when there are insufficient data available to make a complete engine performance calculation. The results are presented in various formats, including actual values, graphical representations, and percentage difference values. This multi-faceted presentation provides a better understanding of how the engine’s main parameters, coefficients, and performances vary from one engine to another for JetCat and AMT Netherlands models, and from idle to maximum regimes for the JetCat P80.
In conclusion, this paper equips students and other users with a more comprehensive understanding of the thermodynamic processes and working principles of micro jet engines. By defining these new constants and demonstrating their reliability across different operating regimes, users can incorporate them into various model calculations. This method allows for more practical and accurate computational approaches, enhancing predictive analysis and design optimization in micro jet engine technology. Ultimately, these findings significantly contribute to the advancement of engineering education and research, offering robust parameters for more efficient and effective problem-solving.

Author Contributions

Conceptualization, R.M.C., G.C. and G.-P.B.; Formal analysis, G.-P.B.; Investigation, R.M.C.; Methodology, G.C. and G.-P.B.; Software, R.M.C.; Supervision, R.M.C.; Validation, G.C.; Writing—original draft, R.M.C., G.C. and G.-P.B.; Writing—review and editing, R.M.C., G.C. and G.-P.B. All authors have read and agreed to the published version of the manuscript.

Funding

This work was carried out under the “Nucleu” Program of the National Research, Development, and Innovation Plan 2022–2027, supported by the Ministry of Research, Innovation, and Digitization (MCID), project no. PN23.12.01.01.

Institutional Review Board Statement

Not applicable.

Informed Consent Statement

Not applicable.

Data Availability Statement

The original contributions presented in the study are included in the article, further inquiries can be directed to the corresponding author.

Conflicts of Interest

The authors declare no conflicts of interest.

Nomenclature

T R   [ N ] Engine thrust
S F C   [ k g / N / h ] Specific fuel consumption
N E   [ r p m ] Engine shaft speed
F f   [ k g / s ] Fuel flow
f f c   [ ] Fuel flow coefficient
α e x   [ ] Air excess
M a f   [ k g / s ] Mass air flow
G f   [ k g / s ] Gases flow
π C t   [ ] Overall total pressure ratio
π T t   [ ] Turbine total pressure ratio
η C t   [ ] Compressor total adiabatic efficiency
η T t   [ ] Turbine total adiabatic efficiency
η c a   [ ] Combustion efficiency
η m   [ ] Mechanical efficiency
σ d a . t   [ ] Intake total pressure loss
σ c a . t   [ ] Combustor chamber total pressure loss
T t   [ K ] Total temperature
P t   [ b a r   a ] Total pressure
h a T   [ k J / k g ] Air enthalpy polynomial function
s a T   [ k J / k g ] Air entropy polynomial function
h g . i d T   [ k J / k g ] Ideal gases enthalpy polynomial function
s g . i d T   [ k J / k g ] Ideal gases entropy polynomial function
x g . i d   [ ] Ideal gases mass participations
x a . e x   [ ] Air excess mass participations
a i . g   [ ] Gases enthalpy and entropy polynomial coefficients
l C t . i d   [ k J / k g ] Compressor total specific ideal work
l C t   [ k J / k g ] Compressor total specific actual work
l T t . i d   [ k J / k g ] Turbine total specific ideal work
l T t   [ k J / k g ] Turbine total specific actual work
l T t . i d   [ k J / k g ] Turbine total specific ideal work
h i t T   [ k J / k g ] Total specific enthalpy of station “i
s i t T   [ k J / k g · K ] Total specific ideal f entropy of station “i
P J N   [ k W ] Jet nozzle power
P J N   [ k W ] Fuel power
L H V f   [ k J / k g ] Fuel lower heating value
η T e   [ ] Thermal efficiency
C 5   [ m / s ] Jet nozzle outlet actual velocity
C 5 . i d   [ m / s ] Jet nozzle outlet ideal velocity
C p   [ J / k g · K ] Heat capacity at constant pressure
k g   [ ] Gases adiabatic coefficient
M 5   [ ] Jet nozzle outlet Mach number
d p r m e n g   % 
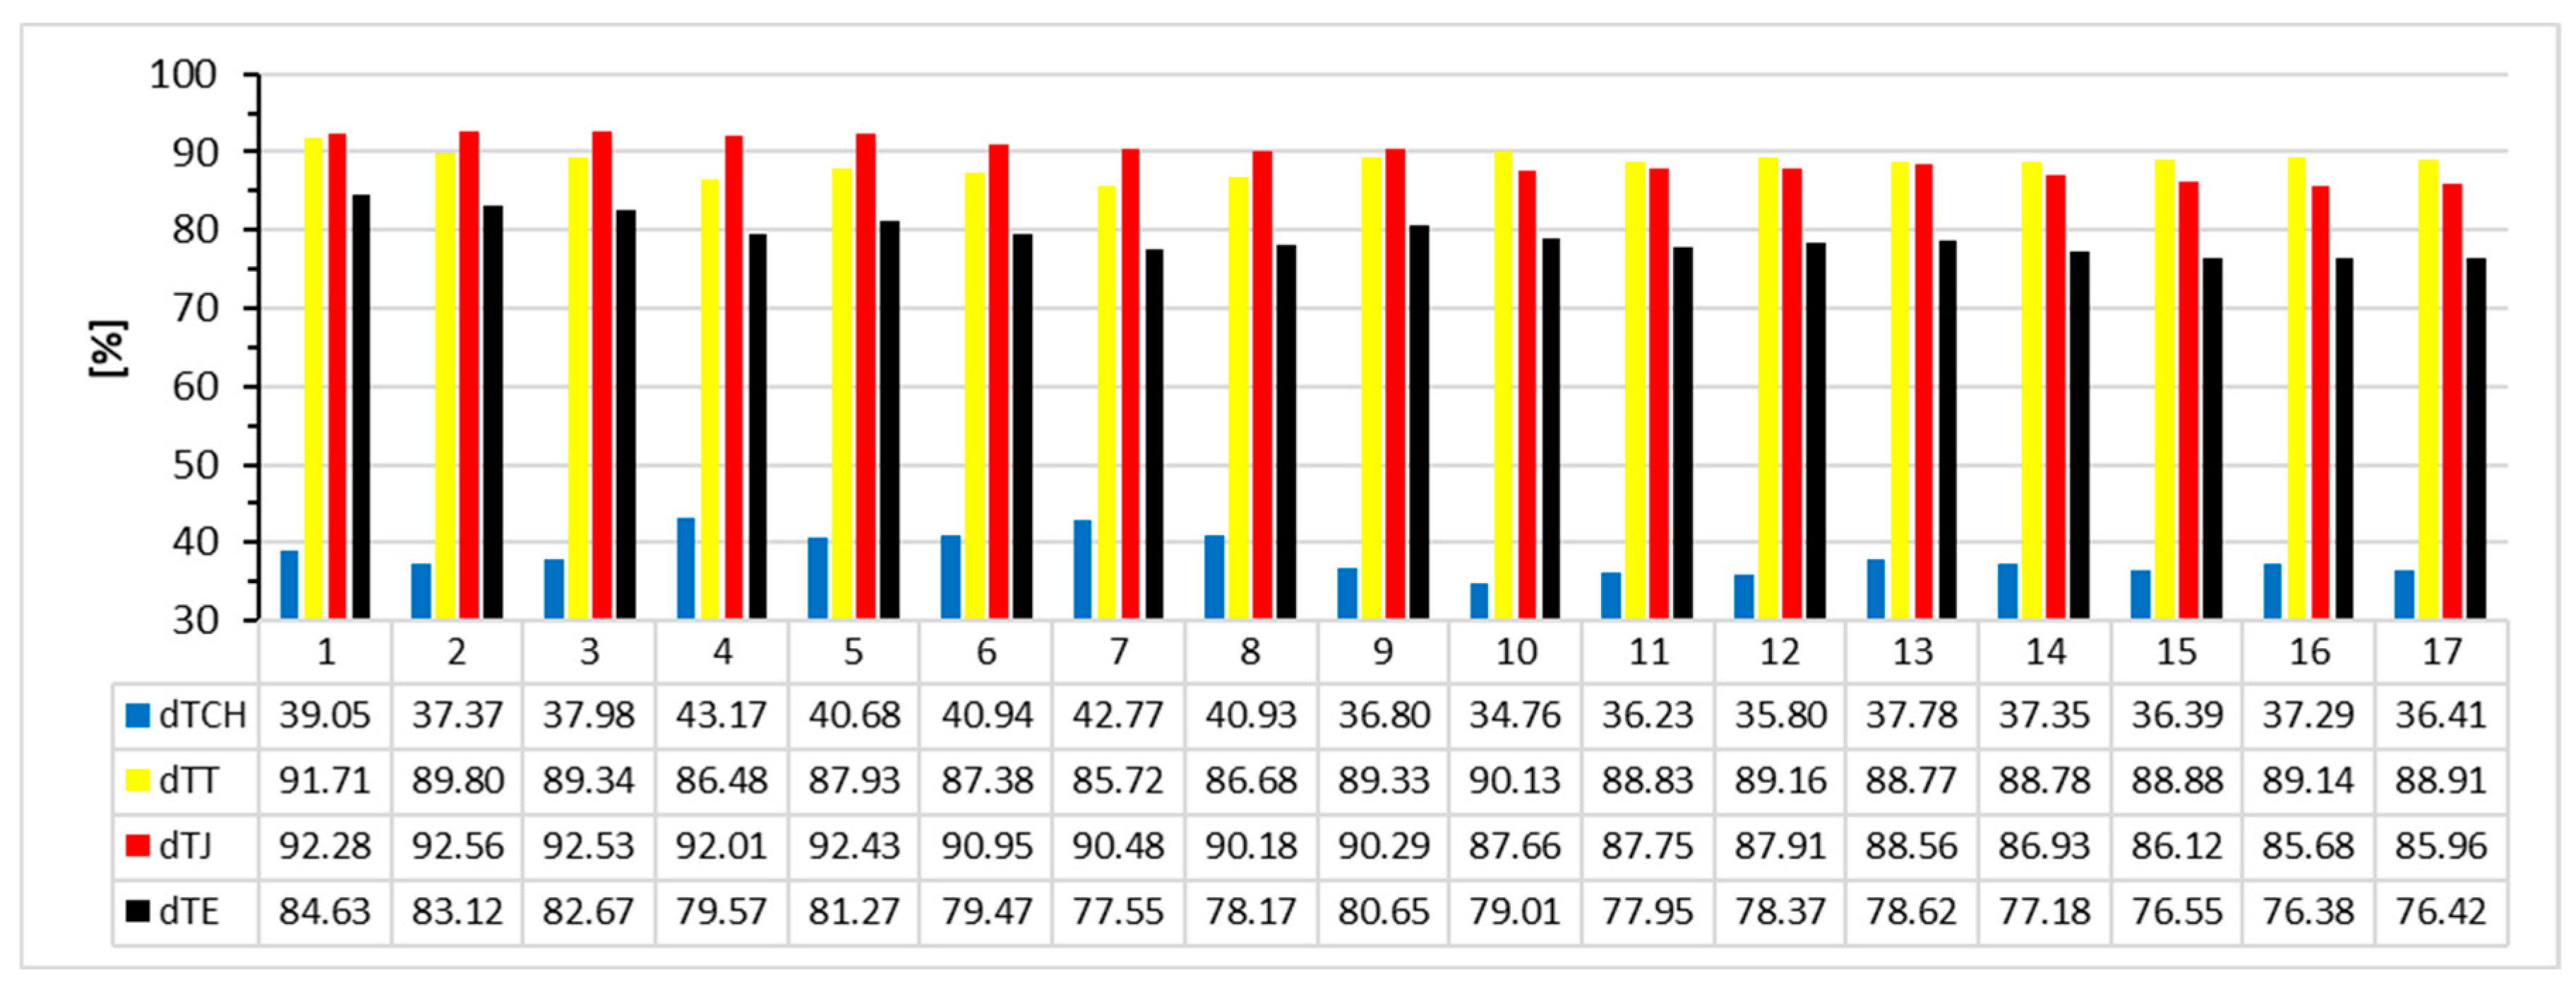
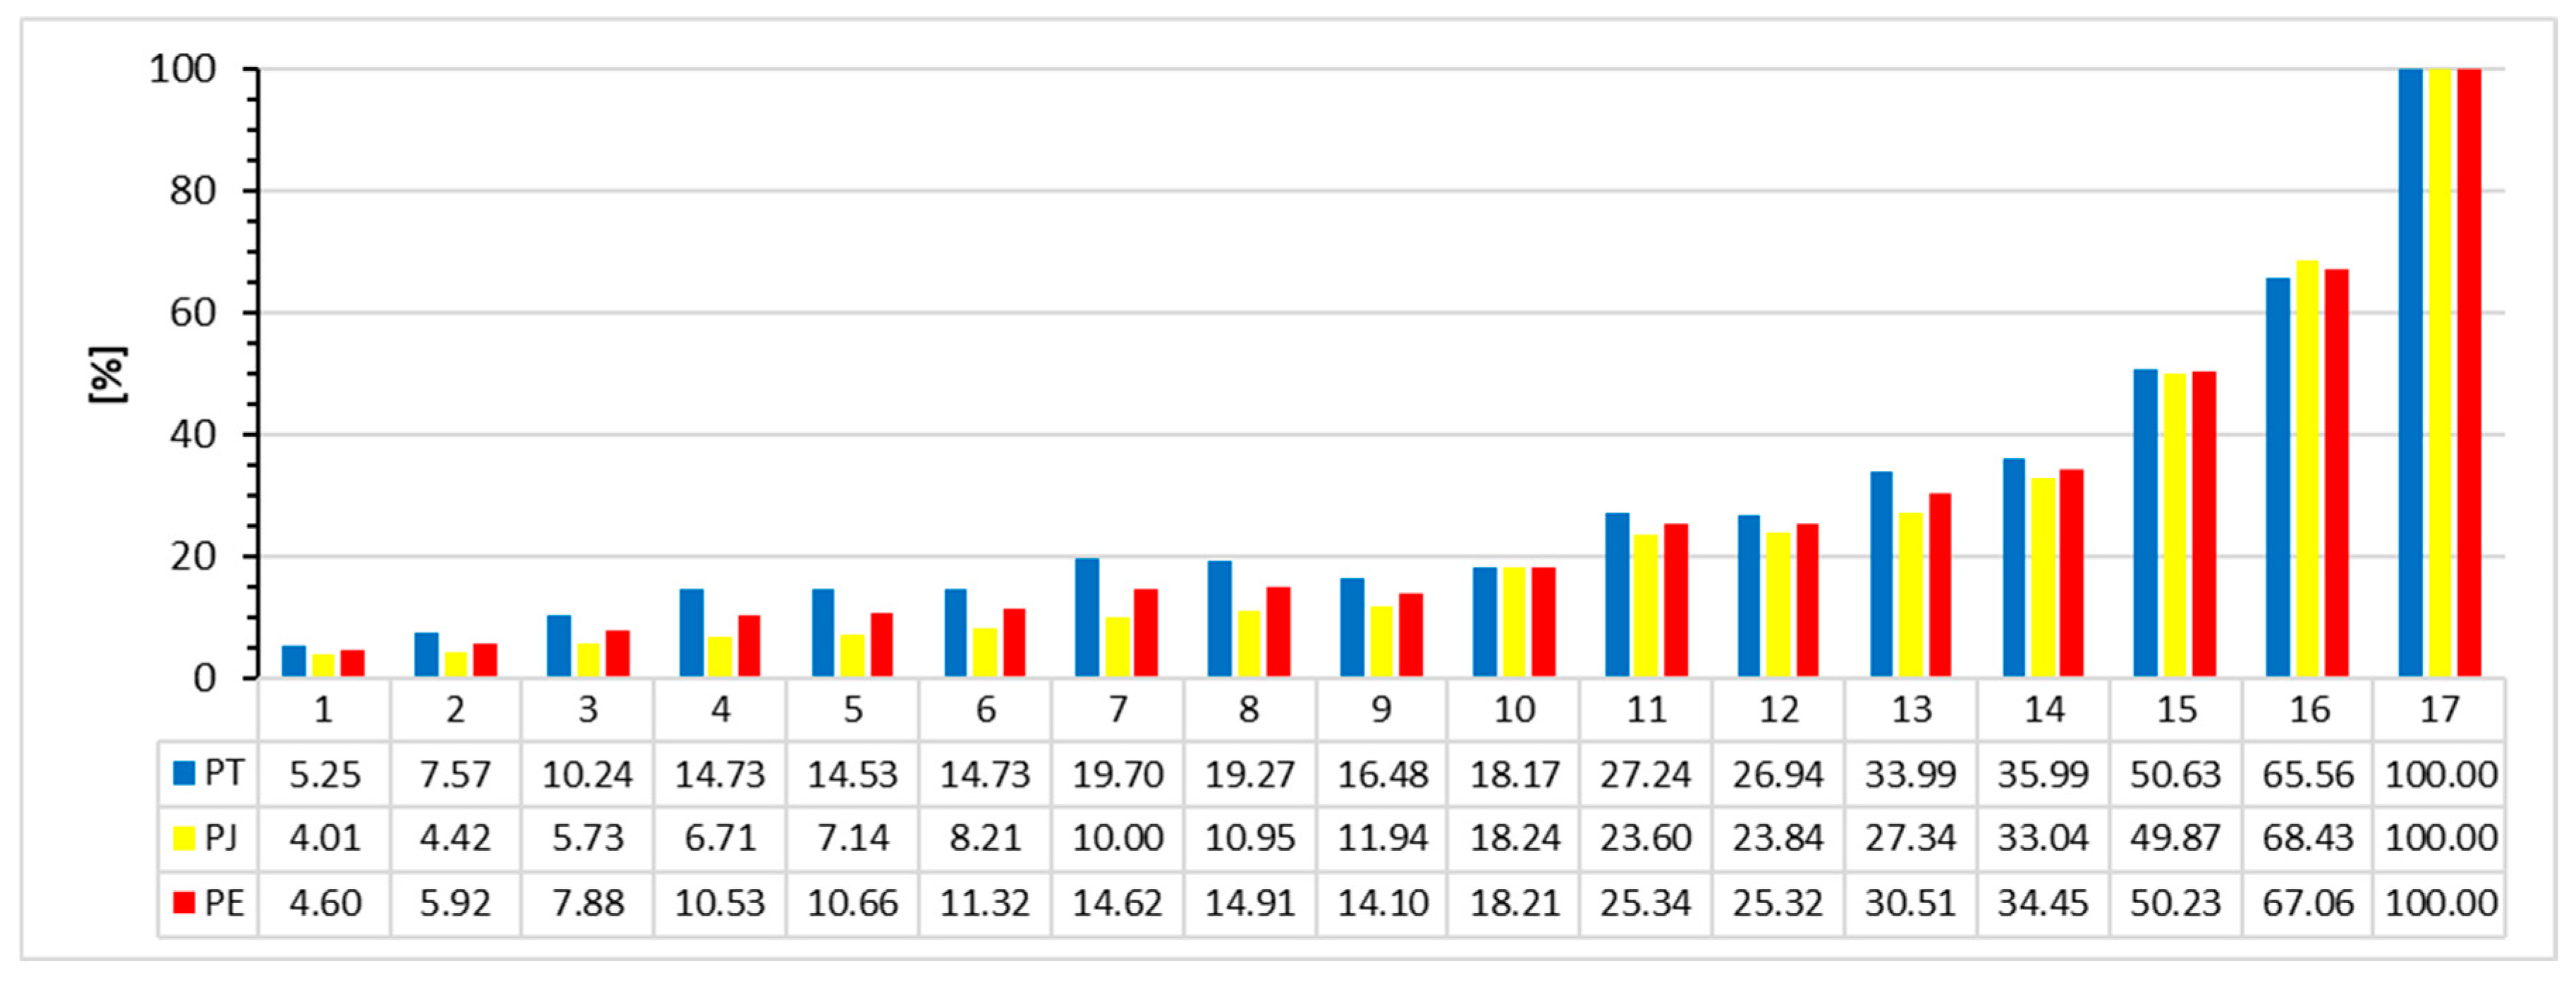
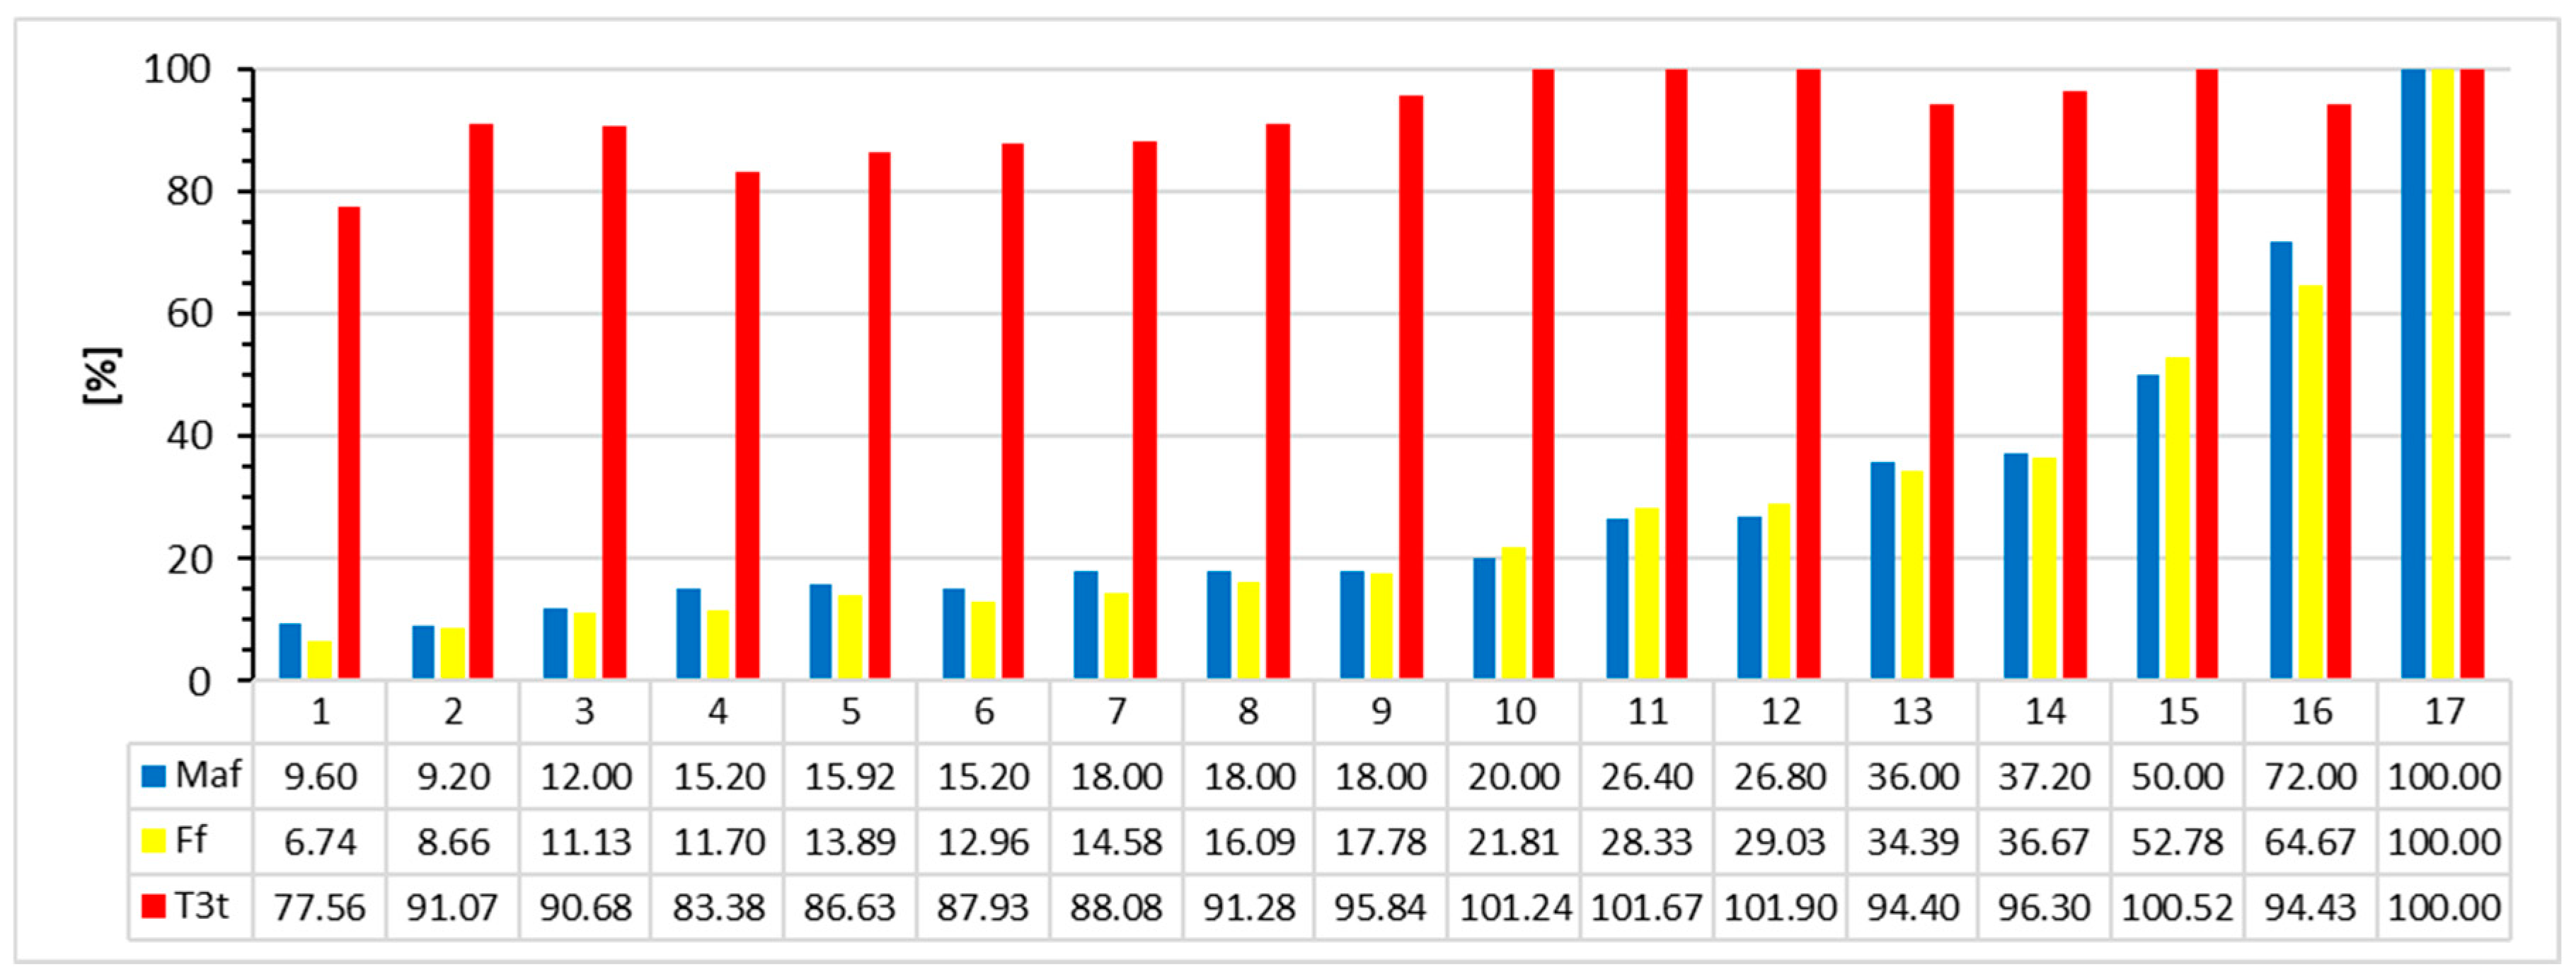
Percentage parameters for JetCat and AMT micro jets
d p r m P 80   % 
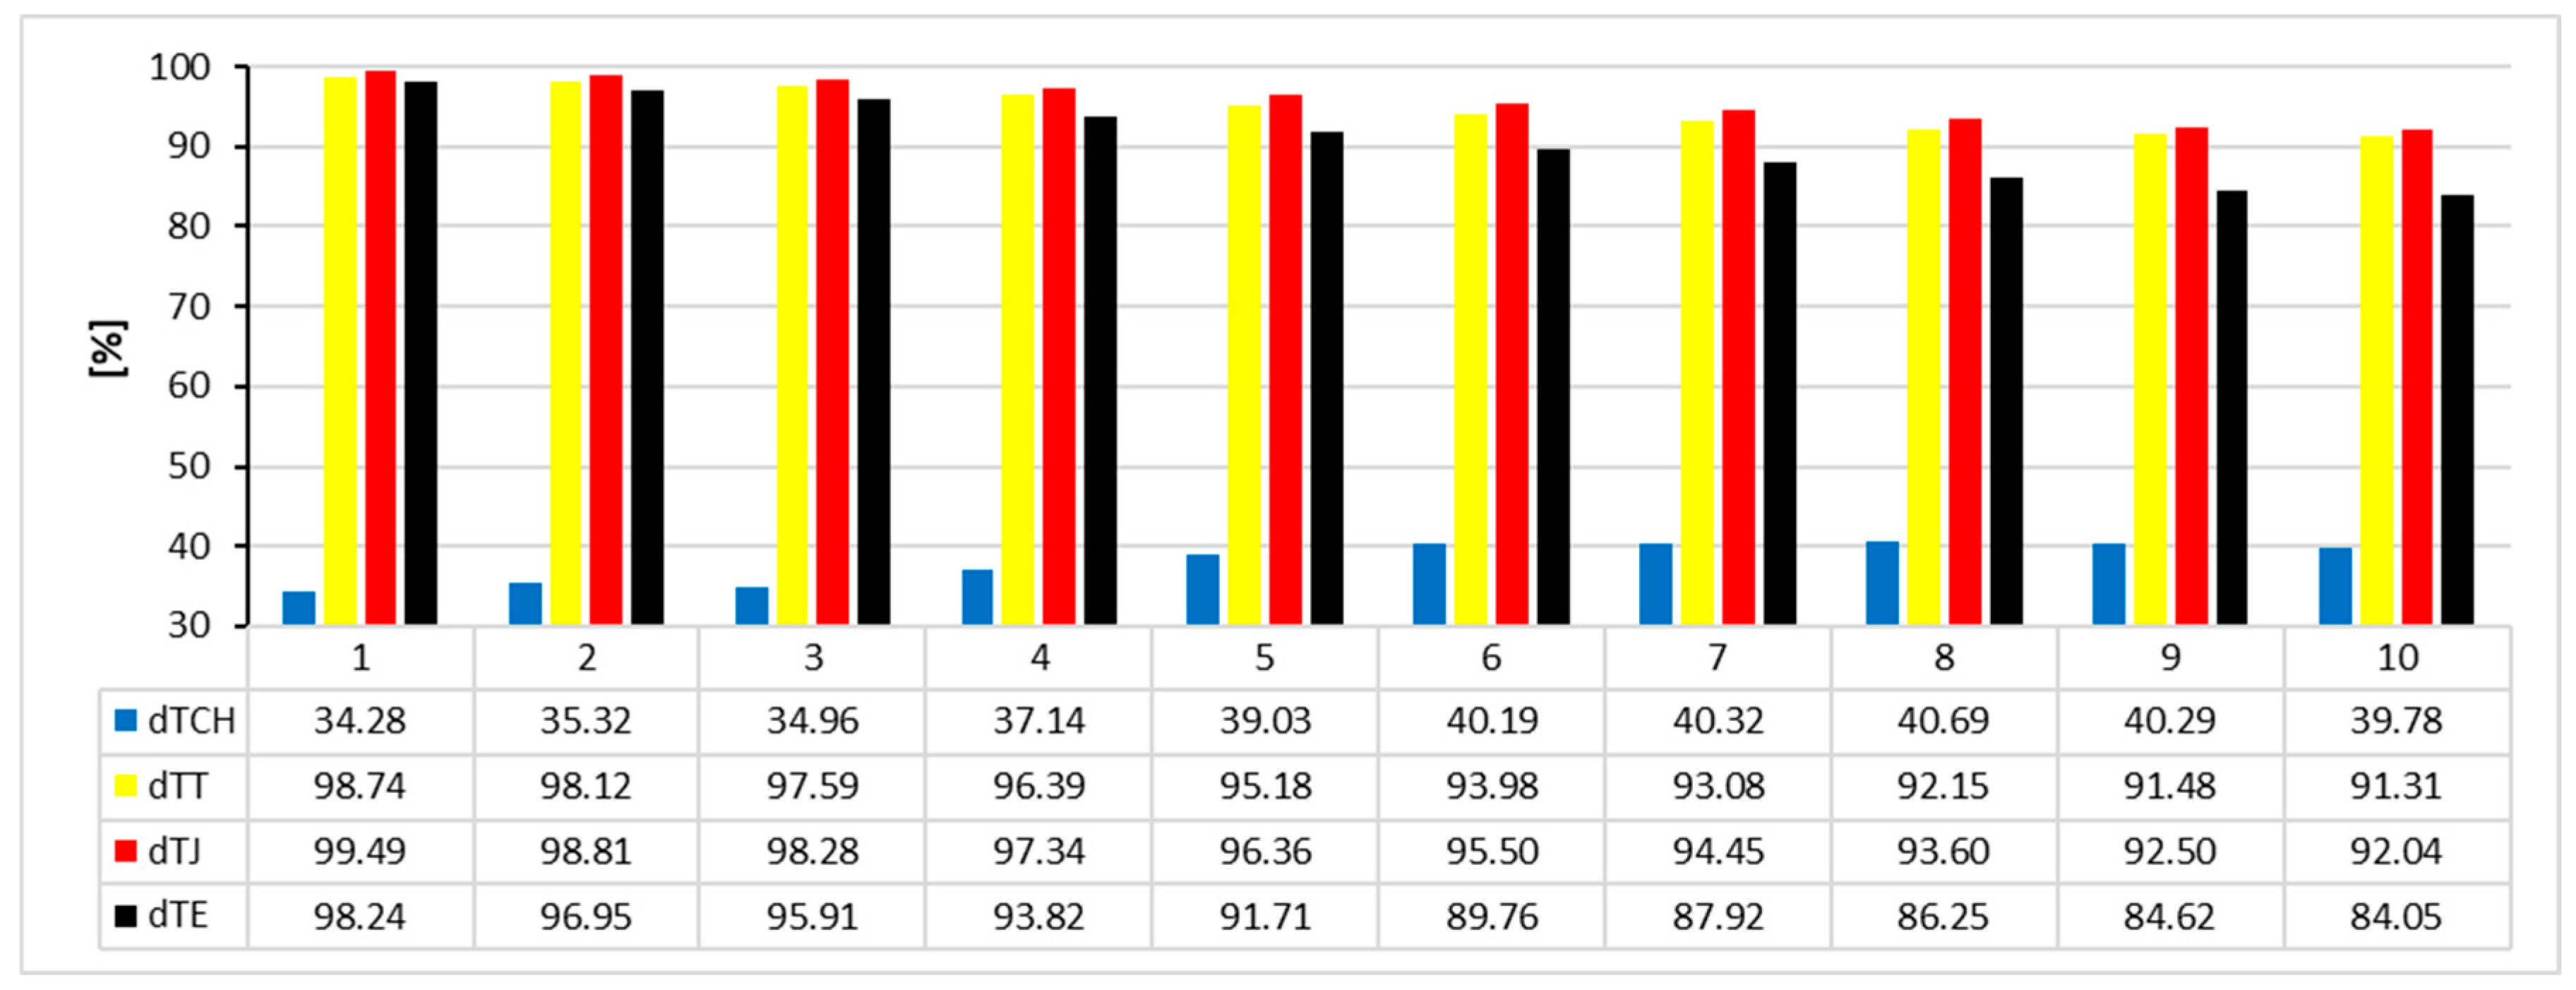
Percentage parameters for JetCat P80 model

References

  1. Ren, L.; Zhu, R.; Liao, L.; Zhou, Y. Analysis on the development of micro gas turbine generation technology. J. Phys. Conf. Ser. 2021, 1983, 012006. [Google Scholar] [CrossRef]
  2. Elzahaby, A.M.; Khalil, M.K.; Khalil, H.E. Theoretical and Experimental Analysis of a Micro Turbojet Engine’s Performance. Int. J. Sci. Eng. Res. 2016, 7, 404–410. [Google Scholar]
  3. Oppong, F. Micro Gas Turbine Performance Evaluation. Master’s Thesis, Department of Mechanical and Mechatronics Engineering, University of Stellenbosch, Stellenbosch, South Africa, December 2016. [Google Scholar]
  4. Van den Braembussche, R.A. Micro Gas Turbines—A Short Survey of Design Problems. In Micro Gas Turbines; Educational Notes RTO-EN-AVT-131, Paper 1; RTO: Neuilly-sur-Seine, France, 2002; pp. 1–18. [Google Scholar]
  5. Leong, C.H.; Jacob, J.; Liou, W.W. Development of a Turbojet Engine Lab for Propulsion Education. In Proceedings of the 40th AIAA/ASME/SAE/ASME Joint Propulsion Conference and Exhibit, AIAA Paper 2004-4085, Fort Lauderdale, FL, USA, 11–14 July 2004. [Google Scholar]
  6. Liou, W.; Leong, C.H. Gas Turbine Engine Testing Education at Western Michigan University. Collection of Technical Papers. In Proceedings of the 45th AIAA Aerospace Sciences Meeting, Reno, NV, USA, 8 January 2007; Volume 13, pp. 8716–8724. [Google Scholar]
  7. Available online: https://www.dlr.de/en/at/about-us/departments (accessed on 25 March 2024).
  8. Available online: https://www.testdevices.com/blog/the-testing-capabilities-of-subscale-jet-engine-rigs-part-1/ (accessed on 25 March 2024).
  9. Available online: https://www.turbinetechnologies.com/educational-lab-products/turbojet-engine-lab (accessed on 25 March 2024).
  10. Available online: https://www.gunt.de/en/products/thermal-engineering/thermal-fluid-energy-machines/gas-turbines/gas-turbine-jet-engine/061.79600/et796/glct-1:pa-148:ca-107:pr-261 (accessed on 25 March 2024).
  11. Sajesh, M.; Jyothi Sankar, P.R.; Vishnu Prakash, K.; Nikhil Das, K. Performance Analysis of a Micro Turbojet Engine. Trans. Eng. Sci. 2014, 2, 27–37. [Google Scholar]
  12. Juste, G.L.; Montañés, J.L.; Velazquez, A. Micro-Jet Test Facility for Aerospace Propulsión Engineering Education. Int. J. Eng. Educ. 2009, 25, 11–16. [Google Scholar]
  13. Wu, X.; Hu, X.; Xiang, X.; Lin, S.; You, J.; Tian, F. An analysis approach for micro gas turbine engine’s performance by experiment and numerical simulation. Case Stud. Therm. Eng. 2023, 49, 103305. [Google Scholar] [CrossRef]
  14. Cican, G. Experimental Transient Process Analysis of Micro-Turbojet Aviation Engines: Comparing the Effects of Diesel and Kerosene Fuels at Different Ambient Temperatures. Energies 2024, 17, 1366. [Google Scholar] [CrossRef]
  15. Cican, G.; Frigioescu, T.-F.; Crunteanu, D.-E.; Cristea, L. Micro Turbojet Engine Nozzle Ejector Impact on the Acoustic Emission, Thrust Force and Fuel Consumption Analysis. Aerospace 2023, 10, 162. [Google Scholar] [CrossRef]
  16. Andoga, R.; Főző, L.; Schrötter, M.; Szabo, S. The Use of Ethanol as an Alternative Fuel for Small Turbojet Engines. Sustainability 2021, 13, 2541. [Google Scholar] [CrossRef]
  17. Przysowa, R.; Gawron, B.; Białecki, T.; Łęgowik, A.; Merkisz, J.; Jasiński, R. Performance and Emissions of a Microturbine and Turbofan Powered by Alternative Fuels. Aerospace 2021, 8, 25. [Google Scholar] [CrossRef]
  18. Kulczycki, A.; Przysowa, R.; Białecki, T.; Gawron, B.; Jasiński, R.; Merkisz, J.; Pielecha, I. Empirical Modeling of Synthetic Fuel Combustion in a Small Turbofan. Energies 2024, 17, 2622. [Google Scholar] [CrossRef]
  19. Grzeszczyk, R.; Merkisz, J.; Górecki, M.; van de Goor, B.; Kamińska, E. The Laboratory Test Bench for a Small Turbojet Engine, PTNSS–2011–SC–125. Available online: https://yadda.icm.edu.pl/baztech/element/bwmeta1.element.baztech-article-LOD6-0030-0041/c/grzeszczyk_merkisz_gorecki_goor_kaminska_the_laboratory_ss_3_2011.pdf (accessed on 25 March 2024).
  20. Available online: https://www.jetcat.de/en/products/ (accessed on 25 March 2024).
  21. Available online: https://www.jetmodelproducts.com/amt.htm (accessed on 25 March 2024).
  22. Available online: https://jetcentral.com.mx/turbines/ (accessed on 25 March 2024).
  23. Available online: https://www.pbs.cz/en/Aerospace/Aircraft-Engines (accessed on 25 March 2024).
  24. Available online: https://www.hyblturbines.cz/h16bl/ (accessed on 25 March 2024).
  25. Chauhan, S.; Wessley, G.J.J. Thermodynamic Performance Analysis of a Micro Turbojet Engine for UAV and Drone Propulsion. Int. J. Recent Technol. Eng. 2019, 7, 1–6. [Google Scholar]
  26. Talib, A.R.A.; Gires, E.; Ahmad, M.T. Performance Evaluation of a Small-Scale Turbojet Engine Running on Palm Oil Biodiesel Blends, Hindawi Publishing Corporation. J. Fuels 2014, 2014, 946485. [Google Scholar] [CrossRef]
  27. Cican, G.; Toma, A.; Puscasu, C.; Catana, R.M. Jet CAT P80 Thermal Analyses and Performance Assessment Using Different Fuels Types. J. Therm. Sci. 2018, 27, 389–393. [Google Scholar] [CrossRef]
  28. Available online: https://www.amtjets.com/pdf/lynx_manual_rev.20190919.pdf (accessed on 25 March 2024).
  29. Available online: https://www.jetcat.de/jetcat/Kataloge/JetCat%20Lieferprogramm%202018.pdf (accessed on 25 March 2024).
  30. Available online: http://www.amtjets.com/specs.php (accessed on 25 March 2024).
  31. Catană, R.M.; Dediu, G.; Tărăbîc, C.M.; Șerbescu, H.M. Performance Calculations of Gas Turbine Engine Components Based on Particular Instrumentation Methods. Appl. Sci. 2021, 11, 4492. [Google Scholar] [CrossRef]
  32. Catana, R.M.; Badea, G.P. Experimental Analysis on the Operating Line of Two Gas Turbine Engines by Testing with Different Exhaust Nozzle Geometries. Energies 2023, 16, 5627. [Google Scholar] [CrossRef]
  33. Available online: https://www.jetcat.de/en/products/produkte/jetcat/kategorien/Zubehoer/Kraftstoffzusaetze (accessed on 25 March 2024).
  34. Available online: http://plone.ufpb.br/labrads/contents/documentos/until-2013-11-21-et796e-gas-turbine-as-jet-duplex.pdf (accessed on 25 March 2024).
  35. Bathie, W.W. Fundamentals of Gas Turbines; Iowa State University of Science and Technology: Ames, IA, USA, 1984. [Google Scholar]
  36. Japikse, D.; Baines, N.C. Introduction to Turbomachinery; Concepts ETI, Inc.: Norwich, VT, USA; Oxford University Press: Oxford, UK, 1994. [Google Scholar]
  37. Stanciu, D.; Marinescu, M. Technical Thermodynamics; Politehnica University of Bucharest: Bucharest, Romania; Printech Publishing House: Columbus, OH, USA, 2002; ISSN 973-652-577-5. [Google Scholar]
  38. Catana, R.M. Studies and Experimental Research in the Evaluation of Gas Turbine Engines Operating Regimes by Testing on the Test Bench after a Supplementary Instrumentation and Processing of the Measured Data. Ph.D. Thesis, Politehnica University of Bucharest, Bucharest, Romania, 2019. [Google Scholar]
  39. Bakalis, D.P.; Stamatis, A.G. Data analysis and performance model calibration of a small turbojet engine. Proc. Inst. Mech. Eng. Part G J. Aerosp. Eng. 2011, 226, 1523–1533. [Google Scholar] [CrossRef]
  40. Tuccillo, R.; Cameretti, M.C. Combustion and Combustors for MGT Applications. In Micro Gas Turbines; Educational Notes RTO-EN-AVT-131, Paper 5; RTO: Neuilly-sur-Seine, France, 2005; pp. 1–56. [Google Scholar]
  41. Catana, R.M.; Dediu, G. Analytical Calculation Model of the TV3-117 Turboshaft Working Regimes Based on Experimental Data. Appl. Sci. 2023, 13, 10720. [Google Scholar] [CrossRef]
  42. Catană, R.M.; Dediu, G.; Tărăbîc, C.M. Studies and Experimental Research in the Evaluation of TV2-117A Turboshaft Engine Working Regimes. Appl. Sci. 2022, 12, 3703. [Google Scholar] [CrossRef]
Table 1. Engine data at take-off regime for JetCat models [29].
Engine
Model
NETRπCtMafSFC
rpmN-kg/skg/(N∙h)
P80-SE125,000972.30.2400.1500
P100-RX154,0001002.90.2300.1870
P130-RX127,0001303.00.3000.1850
P160-RXi-B122,0001583.50.3800.1600
P180-NX126,0001753.50.3800.1600
P200-RX112,0002104.00.4500.1500
P220-RXi117,0002203.90.4500.1580
P300-PRO106,0003003.550.5000.1570
P400-PRO98,0003973.800.6700.1579
P500-PRO GL80,0004923.600.9000.1510
P550-PRO GL83,0005503.800.9300.1440
P1000-PRO61,50011003.801.8000.1270
Table 2. Engine data at take-off regime AMT models [30].
Engine
Model
NETRπCtMafSFC
rpmN-kg/skg/(N∙h)
Pegasus HP117,0001673.00.3980.1796
Olympus HP108,5002303.30.4500.1670
Titan96,0003923.80.6600.1561
Nike61,5007844.01.2500.1454
Lynx46,00015694.02.5000.1377
Table 3. Experimental data of JetCat P80 micro jet model.
NETRT3tT2tp3t
rpmN°C°Cbar a
34,9514.6608.821.11.100
47,1609.3592.230.01.168
55,32013.4618.336.51.228
68,29522.0595.848.61.357
79,36932.0581.460.41.502
88,78742.8586.172.21.658
97,78655.1610.286.01.825
105,42367.8630.199.01.997
112,70682.8666.3108.42.189
115,67588.9690.3114.42.266
Table 4. JetCat and AMT micro jets additional parameters and coefficients for calculation model.
σdatσcatηcaηTtφJRa
[J/kg∙K]
Rg
[J/kg∙K]
0.980.960.85/0.88/0.90/
0.94/0.96
see
Table 10
see
Table 10
287.15288.25
Table 5. Jet-Cat P80 micro jet additional parameters and coefficients for calculation model.
σdatσcatηcaηTtφJRa
[J/kg∙K]
Rg
[J/kg∙K]
0.9950.960.950.840.94287.15288.26
Table 6. The first series of data results, at take-off regime, for JetCat and AMT micro jet models.
Engine
Model
PTPJPEh3tlTtΔhJΔhElTt.idΔhJ.p.idΔhE.idΔhJ.id
kWkWkWkWkWkWkWkWkWkWkW
P80-SE22.91219.27742.1901039.29693.88778.993172.880114.49783.605198.10264.734
P100-RX33.07621.25954.3351248.755140.63190.389231.020190.042105.248295.29060.303
P130-RX44.74227.55372.2951242.569145.89089.843235.733197.149105.608302.75759.068
P160-RXi-B64.35332.25196.6051127.453166.27883.332249.610221.70491.371313.07541.155
Pegasus HP63.45534.31897.7731179.208156.16484.458240.622208.21996.288304.50748.994
P180-NX64.35339.488103.8411198.369165.954101.830267.784218.360112.414330.77465.557
P200-RX86.06348.065134.1281199.415187.603104.774292.377246.846115.783362.62963.217
P220-RXi84.16552.648136.8131250.528183.103114.539297.642240.926129.283370.20978.269
Olympus HP71.98657.417129.4021323.616156.264124.639280.903202.940142.946345.886101.657
P300-PRO79.38287.705167.0871411.256154.715170.938325.653193.394192.821386.215159.647
Titan118.998113.489232.4871417.321175.773167.635343.408225.350181.238406.588138.442
P400-PRO117.664114.639232.3021421.344171.168166.768337.936219.446188.112407.558146.629
P500-PRO GL148.484131.466279.9501300.337161.284142.800304.084204.158158.878363.036121.665
P550-PRO GL157.199158.876316.0761330.654165.125166.887332.012198.946185.605384.551156.829
Nike221.134239.788460.9211398.775172.536187.091359.627210.410205.232415.642173.269
P1000-PRO286.36329.019615.3791298.871155.732178.931334.663179.002197.771376.773178.260
Lynx436.807480.813917.6201388.505170.628187.817358.445205.576207.728413.304178.337
Table 7. The first series values of calculated data for JetCat P80 engine.
NE
rpm
PTPJPEh3tlTtΔhJΔhElTt.idΔhJ.p.idΔhE.idΔhJ.id
kWkWkWkWkWkWkWkWkWkWkW
34,9510.5710.2310.802916.00912.4765.04917.52514.8535.69920.5525.714
47,1601.1360.7031.839905.68818.47511.43229.90721.99412.89034.88412.938
55,3201.7761.2363.012935.89124.45617.02641.48229.11419.17748.29119.268
68,2953.4932.4655.958909.51735.58025.10860.68842.35728.20970.56628.416
79,3695.7814.1119.892892.66246.42033.01279.43255.26236.99492.25637.361
88,7878.7646.08914.853897.85558.25940.47598.73469.35645.236114.59245.806
97,78611.9138.80120.714925.54469.06851.025120.09382.22456.912139.13657.747
105,42315.79311.71427.507948.48080.49359.705140.19895.82466.447162.27167.570
112,70619.87215.7835.652990.70391.47672.638164.114108.90080.710189.61082.207
115,67521.47217.69439.1661018.96996.14379.226175.369114.45687.994202.45089.663
Table 8. The second series of data results, at take-off regime, for JetCat and AMT micro jet models.
Engine
Model
T2tα.exFfT3tΔTTΔTJΔTEΔTT.idΔTJ.p.idΔTE.idΔTJ.id
°C-g/min°C°C°C°C°C°C°C°C
P80-SE108.94.182242.5705.281.169.3150.499.173.6172.774.9
P100-RX156.13.118311.7875.5117.276.7193.9159.090.0249.093.2
P130-RX161.33.163400.8870.8121.976.3198.2165.390.6255.993.9
P160-RXi-B180.93.811421.3778.6142.272.7214.9190.480.6271.084.4
Pegasus HP171.33.363500.0819.5131.972.7204.6176.683.7260.387.1
P180-NX180.93.44466.7836.0140.087.7227.7184.997.8282.7101.7
P200-RX202.13.622525.0838.0158.790.7249.4209.8101.4311.2106.2
P220-RXi198.13.282579.3878.3153.498.0251.4202.6111.9314.5116.7
Olympus HP171.82.971640.0935.8129.0104.9233.9168.1121.2289.3125.0
P300-PRO170.72.691785.01003.9126.0142.0268.0157.8161.3319.1165.0
Titan191.52.7341020.01009.3143.2139.6282.8184.2152.1336.3156.8
P400-PRO187.02.7091045.01012.3139.4138.6278.0179.2157.7336.9162.4
P500-PRO GL176.73.0721238.0917.6133.7120.9254.6169.7135.6305.3139.6
P550-PRO GL180.62.9771320.0941.6136.3140.9277.2164.6157.7322.3161.2
Nike188.32.7801900.0994.9141.0156.4297.4172.3172.8345.1176.8
P1000-PRO171.03.2672328.0918.0129.3152.1281.4148.9169.0317.9171.7
Lynx186.12.9343600.0988.3139.9157.5297.4168.9175.3344.2179.2
Table 9. The second series values of calculated data for JetCat P80 engine.
NE
rpm
T2tα.exFfT3tΔTtTΔTJΔTEΔTtT.idΔTJ.p.idΔTE.idΔTJ.id
°C-g/min°C°C°C°C°C°C°C°C
34,95126.55.22142.155601.011.04.415.413.15.018.15.0
47,16032.55.36655.144592.216.310.126.419.411.430.811.5
55,32038.55.15467.739618.321.515.036.525.616.942.516.9
68,29549.65.49086.097595.831.422.353.737.425.262.625.3
79,36960.45.767104.084581.441.229.670.849.133.282.333.5
88,78772.25.837124.259586.151.736.388.061.740.6102.341.1
97,78683.05.660146.851610.261.145.6106.772.851.0123.851.6
105,42394.45.545170.455630.170.953.3124.284.559.6144.160.4
112,706105.45.256198.901666.380.064.5144.595.471.9167.373.0
115,675110.15.057212.371690.383.770.0153.799.778.1177.879.3
Table 10. The third series of data results, at take-off regime, for JetCat and AMT micro jet models.
Engine
Model
ηCtηTti2tp2tδTp4tGfC5ϕJM5η.te
--kWbar a-bar akg/sm/s---
P80-SE0.820.82382.7632.28391.53351.42970.2440397.50.9620.66311.20
P100-RX0.720.74430.6192.87971.85411.49100.2352425.20.9080.6589.61
P130-RX0.720.74435.8962.9791.90651.50000.3067423.90.9020.6599.69
P160-RXi-B0.740.75455.9063.47542.23781.49090.3870408.20.9290.67710.79
Pegasus HP0.720.75446.0893.17762.05471.48460.4063411.00.9140.6619.67
P180-NX0.740.76455.9063.47542.10901.58200.3878451.30.9290.72811.92
P200-RX0.740.76477.5873.97192.34641.62500.4588457.80.9250.74712.90
P220-RXi0.740.76473.4113.87262.22021.67450.4597478.60.9170.76312.81
Olympus HP0.740.77446.6173.27691.87201.68040.4607499.30.9170.76312.64
P300-PRO0.800.80445.4253.52511.75271.93080.5131584.70.9280.87715.74
Titan0.750.78466.7463.77331.93171.87520.6770579.00.9440.87315.68
P400-PRO0.770.78462.113.77331.89311.91350.6874577.50.9250.86715.46
P500-PRO GL0.780.79451.5813.57471.89941.80680.9206534.40.9320.83414.96
P550-PRO GL0.800.83455.593.77331.84151.96710.9520577.70.9360.90016.96
Nike0.800.82463.3873.97191.85712.05321.2817611.70.9410.93517.78
P1000-PRO0.850.87445.7473.77331.74522.07571.8388598.20.9420.94619.92
Lynx0.810.83461.2253.97191.83542.07752.5600612.90.9380.94018.82
Table 11. The third series values of calculated data for JetCat P80 engine.
NE
rpm
MafGfπCti2tηCtδTtp4tC5M5η.teηCt∙ηTt
kg/skg/s-kW--bar am/s--
34,9510.0450.04581.1368299.7900.8601.06121.0368100.50.1650.770.722
47,1600.0610.06151.2070305.8130.8591.09321.0686151.20.2511.800.722
55,3200.0710.07261.2690311.8390.8271.12171.095184.50.3042.570.694
68,2950.0970.09821.4023322.9920.8181.18861.1419224.10.3784.030.687
79,3690.1230.12451.5521333.8510.8271.25991.1924257.00.4435.570.695
88,7870.1480.15041.7133345.7270.8191.33711.2401284.50.4946.900.688
97,7860.1700.17251.8859356.6070.8241.40051.3032319.50.5528.440.692
105,4230.1930.19622.0636368.1040.8181.47141.3574345.60.5969.680.687
112,7060.2140.21722.2620379.2100.8211.52751.4332381.20.65011.180.690
115,6750.2200.22332.3415383.9600.8181.54431.4675398.10.67211.740.687
Table 12. Percentage differences for JetCat and AMT micro jet models.
Engine
Model
ΔdlTtΔdhJΔdTTΔdTEΔdTJ.idΔdTJ
%%%%%%
P80-SE0.17−0.171.502.910.031.65
P100-RX−0.570.573.425.540.072.64
P130-RX−1.141.143.775.790.072.58
P160-RXi-B−2.572.574.646.050.082.06
Pegasus HP−1.061.064.236.180.082.58
P180-NX−2.432.434.095.700.082.26
P200-RX−3.163.164.726.090.112.11
P220-RXi−1.961.964.326.270.092.74
Olympus HP−2.302.303.455.310.092.43
P300-PRO−0.800.802.414.730.072.89
Titan−3.883.883.565.130.112.20
P400-PRO−0.790.792.925.530.083.30
P500-PRO GL−0.070.072.685.180.083.14
P550-PRO GL0.25−0.252.204.700.063.12
Nike−2.892.893.004.780.082.43
P1000-PRO−1.681.681.933.270.071.78
Lynx−2.082.082.424.020.082.15
Table 13. Percentage differences for JetCat P80 model.
NEΔdlTtΔdhJΔdTTΔdTEΔdTJ.idΔdTJ
rpm%%%%%%
34,951−1.151.150.230.300.000.07
47,160−1.301.300.350.51−0.010.18
55,320−1.341.340.460.670.000.23
68,295−1.401.400.691.010.000.36
79,369−1.471.470.911.350.020.48
88,787−1.521.521.141.650.010.59
97,786−1.591.591.321.94−0.010.75
105,423−1.641.641.492.190.020.85
112,706−1.691.691.622.430.021.01
115,675−1.711.711.652.500.031.07
Disclaimer/Publisher’s Note: The statements, opinions and data contained in all publications are solely those of the individual author(s) and contributor(s) and not of MDPI and/or the editor(s). MDPI and/or the editor(s) disclaim responsibility for any injury to people or property resulting from any ideas, methods, instructions or products referred to in the content.

