Abstract
Perceived exertion (RPE, RPEdur) and wellness scores (Hooper) are common methods to assess the training load and readiness in football. However, in professional football, there is a lack of data concerning the application of these tools in microcycles of different durations. Therefore, the purpose of this study was to explore the correlations between (a) RPE, RPEdur, and weekly external load (EXLD) and (b) Hooper and EXLD within microcycles of different durations. Independent of the microcycle’s length, RPE and RPEdur correlated with the EXLD. In MIC5, RPE and RPEdur correlated with the EXLD, except for accelerations > 3 m/s2 (ACh) and distance > 25.5 km/h (SPvh). In MIC6, RPE and RPEdur correlated with the EXLD, except Ach (with RPE). In MIC7 and MIC9, RPE and RPEdur correlated with the EXLD, except RPE with ACh. For Hooper variables, independent of the microcycle duration, SRN and FTG had more correlations in comparison to SLP; the same finding was observed in MIC7 and MIC9, but SRN and SLP in MIC5 and MIC6, respectively, had no correlations. Multiple regression analysis showed that for RPE, the main predictors are total distance (TD), metabolic power distance > 50 w/kg (PWvh), and ACh, which can explain 31% of the variance, but for RPEdur, 58% can be explained by DUR, TD, and PWvh. For SLP, the predictors FTG and SRN can explain a very small percentile of the variance (1%, 4%, and 6%, respectively). The main findings were the multiple correlations between RPE, RPEdur, Hooper, and microcycles of different durations; most of them were found for long durations. This tendency is similar to that described in the literature for microcycles of the same duration. (a) EXLD has a stronger correlation with RPEdur than with RPE, and (b) FTG and SRN are the best predictors of the EXLD during the upcoming training session. It is recommended that fitness coaches use these tools to assess and forecast the training load; thus, they will be able to prepare more effective sessions during microcycles of different durations.
1. Introduction
Training load in football can be evaluated easily and reliably by using the perceived exertion (RPE) method. The RPE score is collected within the first 30 min after the end of the training session, where the players should estimate how hard the training was on a scale between “1” and “10” [1]. However, to better represent the training load (volume and intensity), another method was developed: “RPE × training duration” (RPEdur) [2]. This method is correlated with heart rate training zones [1] and is a very reliable indicator of internal load in football [3].
The use of the “Hooper Questionnaire” [4] to monitor the wellness state can provide important information on players’ readiness to train or play. It can consist of various questions, but to be more reliable, it should not include too many [5]. The most commonly used parameters are (a) fatigue (FTG), (b) muscle soreness (SRN), (c) sleep quality (SLP), and (d) stress [4,6]. All these parameters are correlated with biochemical responses [6] and external load (EXLD) during training sessions; thus, they could possibly forecast the upcoming training load [7]. It is important to know that FTG, SRN, and SLP are not highly correlated with RPEdur [8].
To attain the desired results, the weekly training load must be adjusted. Therefore, to achieve high performance in official games, it is necessary to apply adequate load during the week in high-speed running distance (HSR) and RPEdur, but not at an exaggerated level, as this could lead to negative results [9,10,11]. In this context, other studies have suggested that football players should be trained at high intensity to be able to cope with the worst-case scenarios that they will face during games; thus, fitness coaches should prepare the training sessions accordingly [12,13,14,15], always keeping in mind that accumulated fatigue could affect the game result [11].
The duration of the microcycle varies because it is adjusted to the game calendar that is established by football federations [15,16]. This variety in duration influences the training load [14,15,17,18,19]. But there are similarities between a “normal week” (7 days) and microcycles of different durations in an intra-week periodization model. The highest load is always applied in the middle of the week and a lower load is applied closer to the games (MD+1, MD+2, MD−2, MD−1) [20,21,22]. To avoid the negative outcomes of accumulated load during short-duration microcycles, the primary objective is to recover from the previous game and focus only on improving tactical football skills, not on physical attributes [23]. Although this approach is the most common, many coaches and trainers put their own spin on it by applying different methodologies within this framework [24]. Future data should justify the training context that could be applied on each specific day to achieve better load fluctuation [25] but should also help elucidate which model of microcycle is the most suitable, because there are different protocols in the literature [11]. In contrast, in larger microcycles, there is sufficient time to recuperate from both the last game and the intra-week training load [26]. Out of microcycles consisting of three, four, and five training sessions, the latter has the highest load in terms of several parameters: distance (TD); medium-speed distance, at 14.4–19.8 km/h (SPm); high-speed distance, at > 19.8 km/h (HSR); accelerations (ACCs); and decelerations (DECs) [18]. In another study [15], the length of the microcycle had no effect on TD, high-intensity accelerations > 3 m/s2 (AChs), the number of speed actions (SPAs), and distance > 25.2 km/h (SPvh), but it did have an impact on high-intensity decelerations < −3 m/s2 (DChs) and high-metabolic-load distance > 25.5 w/kg (HMLD). Whereas for most high-speed or high-intensity parameters, it is not possible to accumulate a high load during the week (related to the game demands), conversely, for TD, ACCs, and DECs, the related game/load ratio can be high, but this is recommended for application only in long-duration microcycles [18,27]. This high accumulation of mechanical load (ACCs, DECs) is achieved through various training modules and small- and large-sided games (SSGs, LSGs) that coaches integrate in the middle of the training week [28].
The average Hooper score is correlated with FTG and SRN. These parameters have a high effect on EXLD during training sessions (TD, HSR, ACm, player load) and games (ACCs, DECs) [7,29,30,31]. Stress has a correlation with TD, HSR, and player load, but practitioners should be aware that external factors (e.g., family and social obligations) may affect the players’ responses to this parameter [32].
In young players, Haller et al. [5] did not find any correlation between FTG, SLP and TD, HMLD, ACCs, and DECs. A study on Australian football players using microcycles of different durations revealed that the players’ wellness responses were influenced by the length of the microcycle [33]. On the contrary, in another study, there were no correlations found for football players, and this was justified by the small amount of short microcycles’ that was included in the analysis [15]. Furthermore, they noticed that many other factors could possibly contribute (team level, training methodology, etc.) [15]. All these findings provide a new vision regarding the correlation between EXLD parameters and perceived wellness scores and suggest the application of these tools as part of a multidimensional athlete monitoring approach [7].
RPE and RPEdur are correlated with internal and EXLD variables [34,35,36], although many factors could possibly affect perceived exertion [37,38]. Specifically, there is a correlation between RPE and ACh, SPm, distance > 14.4 km/h (DIS > 4), distance 19.8–25.5 km/h (SPh), and when the EXLD is calculated with individualized thresholds, there is also a correlation with SPvh [37,39]. Similar findings have been found in young football players for TD, HSR, and ACm [36]. Similarly, RPEdur has correlations with TD, HMLD, HSR, DIS > 4, distance > 18 km/h, ACC, and training duration (DUR) [29,37,40,41]. The same is the case for young players with DUR, TD, HSR, and semiprofessional players with TD [42]. For both methods (RPE, RPEdur), using individualized thresholds (depending on the players’ abilities) to calculate EXLD variables results in higher correlations compared to the arbitrary threshold method [39]. Furthermore, higher correlations exist when using RPEdur than RPE, presumably because there is a devaluation of DIS > 4 with the second method [41].
There are no data available regarding the evaluation of internal load using the RPEdur in microcycles of different durations in professional football. Nonetheless, in rugby, there was lower RPEdur on the short microcycles in comparison to the medium and large ones [43]. Prior research examined the load accumulation in games, where the RPEdur was higher in a single game compared to two game microcycles [44], and this could be explained by the fact that, in congestive game weeks, the training sessions are focused on recovering from the games (low intensity—volume), resulting in lower perceived responses [17]. Regarding wellness responses, SRN and FTG had higher values in two-game microcycles, but for stress responses, they were higher in single-game microcycles [44].
In a study [45] that investigated the relationship between training load and variables related to wellness in U16 football players, correlations were observed between the load and the indicators of fatigue, stress, and the Hooper index. Also, in a study examining the relationship between load and wellness indicators [46], it was observed that these relationships varied depending on the competitive season. However, correlations were noted between RPE and training duration, sleep quality, and high-speed running distance, as well as stress with total distance and high-speed running distance. In a recent study [47] that explored the relationship between wellness and load during matches and training sessions in professional football players, it was found that the lowest wellness values were observed on MD+1 day, while the lowest internal and external load was observed on MD−1 day. Additionally, correlations were observed between fatigue and s-RPE, as well as between sleep quality, fatigue, and muscle soreness with both internal and external load variables. However, from the literature review, it is evident that there are no studies concerning professional football that examine the relationships of the aforementioned variables in microcycles of different lengths. As previously mentioned, while in a normal-sized 8-day microcycle, the days of recovery, acquisition, and tapering are well-adjusted, in smaller or larger microcycles, this period varies and impacts the wellness indicators.
Despite the significance and usability of perceived exertion methods, there is a lack of literature concerning the application of Hooper, RPE, and RPEdur in microcycles of different durations in professional football. This highlights the importance of investigating it further, since there are frequent differences in microcycle durations during the competitive season [16,48].
The authors hypothesize that there will be different correlations between EXLD, RPE, and RPEdur in the different microcycles, with more correlations for RPEdur. With respect to Hooper, they expected that SRN and FTG would have more correlations than SLP, according to the current research. Therefore, the aim of the study was to reveal the correlations between (a) RPE, RPEdur, and the weekly EXLD, and (b) the self-reported wellness score and EXLD, within microcycles of different durations in professional football.
2. Methods and Materials
2.1. Participants
The research was conducted during two consecutive seasons (2020–21 and 2021–22) of the Cypriot 1st professional division. All the subjects (n = 44) belonged to the same squad, and they had the following characteristics (mean ± SD): age: 25.7 ± 4.4; training age: 17.6 ± 4; BMI: 20.7 ± 2.2; weight: 74.6 ± 7.7 kg; fat: 7.3 ± 2.2%. Only data that meet the following criteria were used in the analysis: (a) official game at the end of the week, (b) players with foul training participation during the week (no illness or injuries), and (c) only players without missing data (EXLD, RPE, RPEdur, Hooper). All the tactical drills were based on the 4-3-3 formation. The players were grouped depending on their playing positions as follows: central defenders (n = 7), wide defenders (n = 9), midfielders (n = 13), wingers (n = 8), and strikers (n = 7) [27,49,50,51]. Goalkeepers responded daily to the questionnaires, but their data were excluded from the analysis because of the different physical requirements of their position.
2.2. Perceived Exertion and Wellness Data Collection
Every morning before the training session (at approximately 9.00 AM), the subjective wellness data (Hooper questionnaire) was collected by the practitioners. The questionnaire consisted of three questions: “sleep quality”, “muscle soreness”, and “fatigue”. The other commonly used variable of “stress” was removed from the analysis due to its lack of reliability. This is due to external factors (family, social relations, study, and job duties) that influenced the players’ responses [32]. The Likert rating scale ranging from “1” to “7” was used (for SLP: 1 = “very good”, 7 = “very bad”; for SRN and FTG: 1 = “not at all” and 7 = “extremely high”) [4]. After the end of the training session (within 30 min), the score of their perceived exertion (RPE) was collected using a 0-to-10 scale (0 = “very light”, 10 = “maximal − exhausting”), and then RPEdur was calculated by multiplying the RPE score with the duration of the training (RPEdur = “RPE score” × “training duration”) [6,35,52]. The football players answered the two questionnaires after connecting privately to a link sent to them by the team staff using their mobile phones.
2.3. External Load Data Collection
During all the training sessions, a global positioning system (18 Hz, GPEXE, Exelio SRL, Udine, Italy) was used to monitor the EXLD. The device was placed inside a pocket (between the scapulae) on a specific sports vest. [17]. This equipment is reliable for determining movement patterns [53,54,55]. To establish connection with the satellites, the GPS units were activated 15 min before the start of the training session [56]. Each device needed a minimum of 8 satellites and the players always wore the same device (to avoid inter-device variability from affecting the collected data) [57]. The analysis was performed using the variables listed below: training duration (DUR), acceleration actions of 2–3 m/s2 (ACm), high-acceleration actions > 3 m/s2 (ACh), deceleration actions of −2–−3 m/s2 (DCm), high-deceleration actions < −3 m/s2 (DCh), total distance (TD), distance in speed zone 14.4–19.7 km/h (SPm), distance in speed zone 19.8–25.2 km/h (SPh), distance in speed zone > 25.2 km/h (SPvh), number of actions > 19.8 km/h (SPA), maximal speed (MSP), metabolic power distance 15–25.5 w/kg (PWm), metabolic power distance 25.5–50 w/kg (PWh), metabolic power distance > 50 w/kg (PWvh), number of metabolic power actions > 25.5 w/kg (PWA) [19,58].
2.4. Microcycle Structure
The weekly data were analyzed as a summary (data from all the microcycles together) and divided by week duration as follows: 12-day microcycle (n = 9) (MIC9), 7-day microcycle (n = 13) (MIC7), 6-day microcycle (n = 10) (MIC6), and 5-day microcycle (n = 9) (MIC5). To describe the distance of each specific day from the upcoming game, the model «MD ±» has been used [19,50]. In MIC5, MIC6, and MIC7, the day after the game (MD+1) was a day off, and in MIC9, both MD+1 and MD+2 were days off. The detailed training context for each one of the microcycles is provided in another study by the same authors [19].
2.5. Statistical Analysis
Descriptive statistics were used to characterize the sample. The Shapiro–Wilk test was used to verify the normal distribution of every variable. The normal distribution was confirmed, which allowed us to use parametric statistical methods; where there was not a normal distribution, the Mann–Whitney U test for independent samples was applied. Pearson’s correlation coefficient was utilized to determine the relationships between wellness parameters, RPE, RPEdur, and EXLD variables. The classification of the correlation coefficient was established as follows: marginal (<0.1), low (>0.1–0.3), moderate (>0.3–0.5), high (>0.5–0.7), very high (>0.7–0.9), almost perfect (>0.9–1.0), perfect (1.0) [59]. Where there was correlation, a multiple regression analysis (forward stepwise) was conducted. The level of significance was set at p <0.05. SPSS version 28.0 was used for the analysis (SPSS, Inc., Chicago, IL, USA).
3. Results
3.1. Correlations
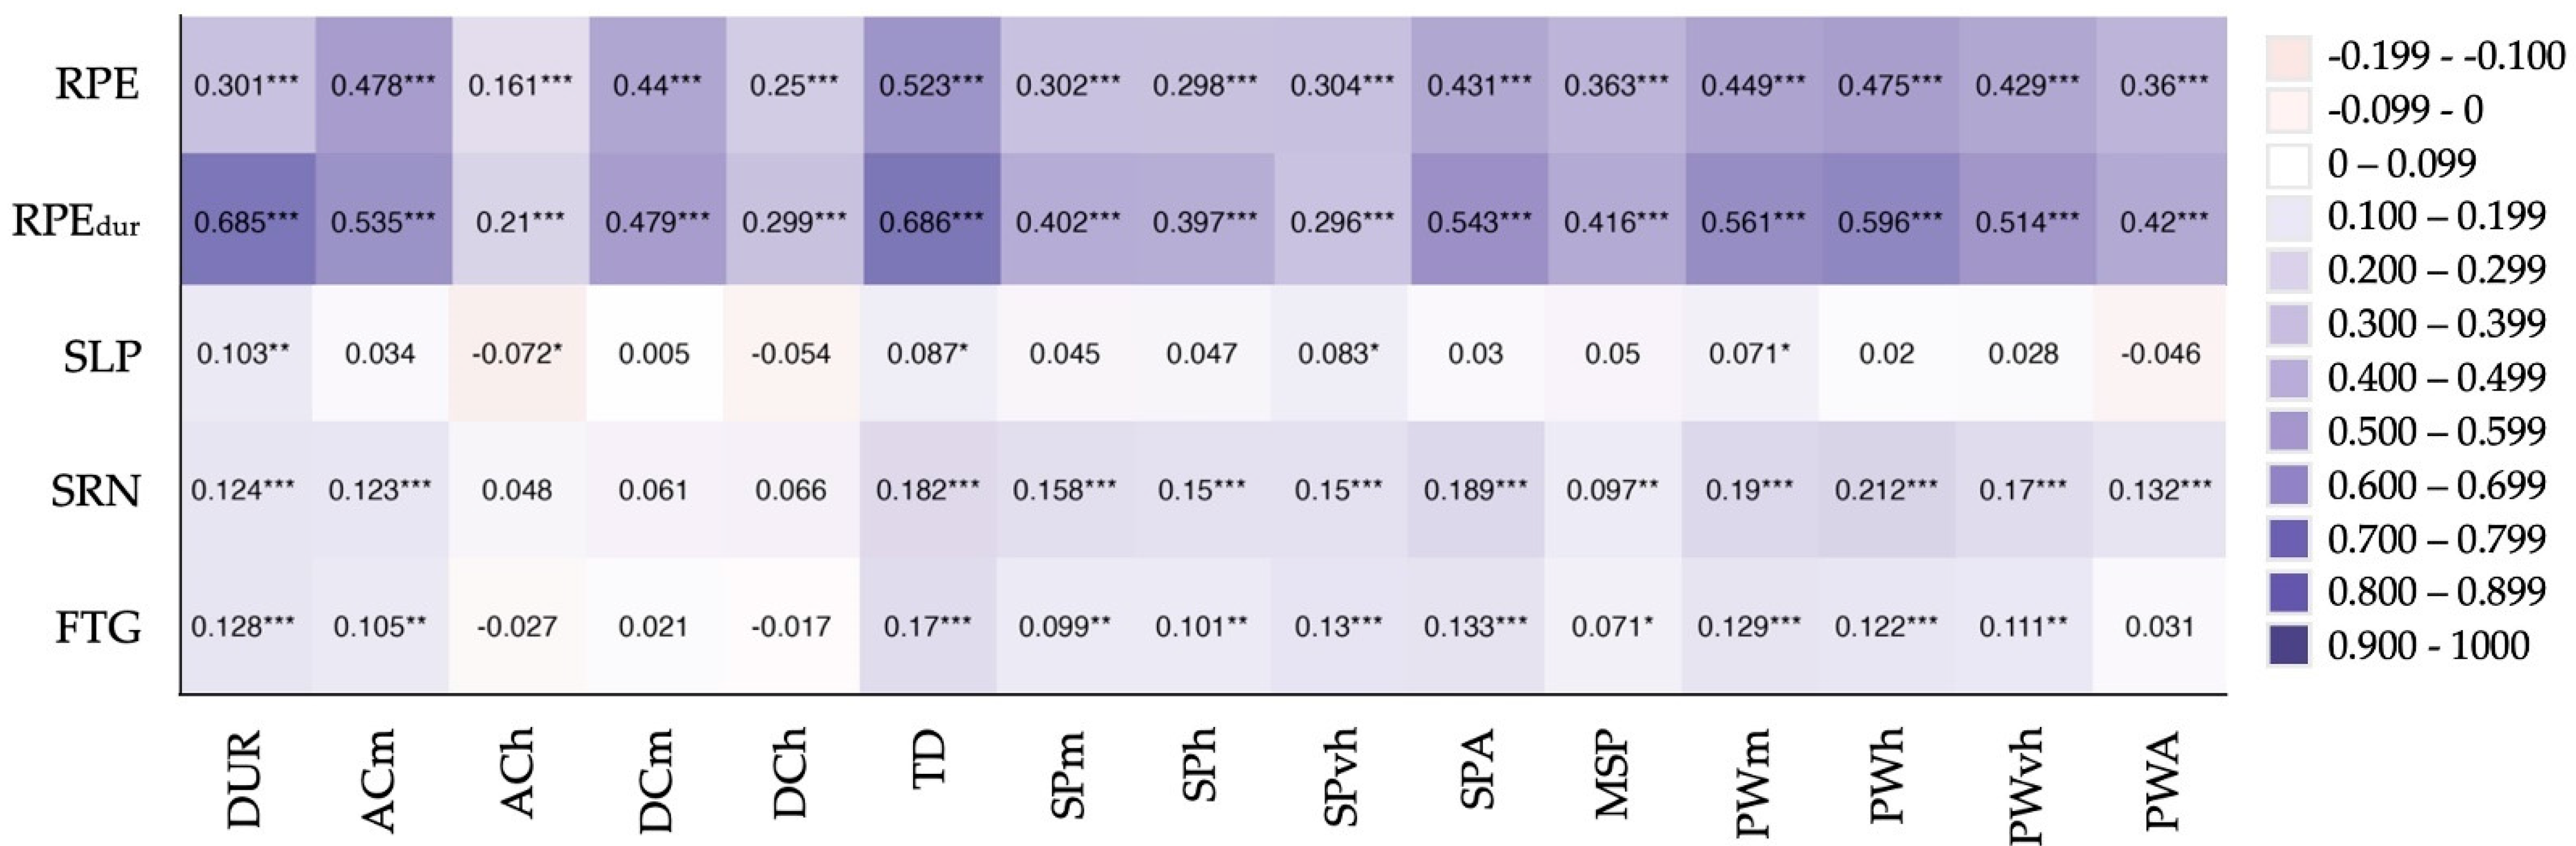
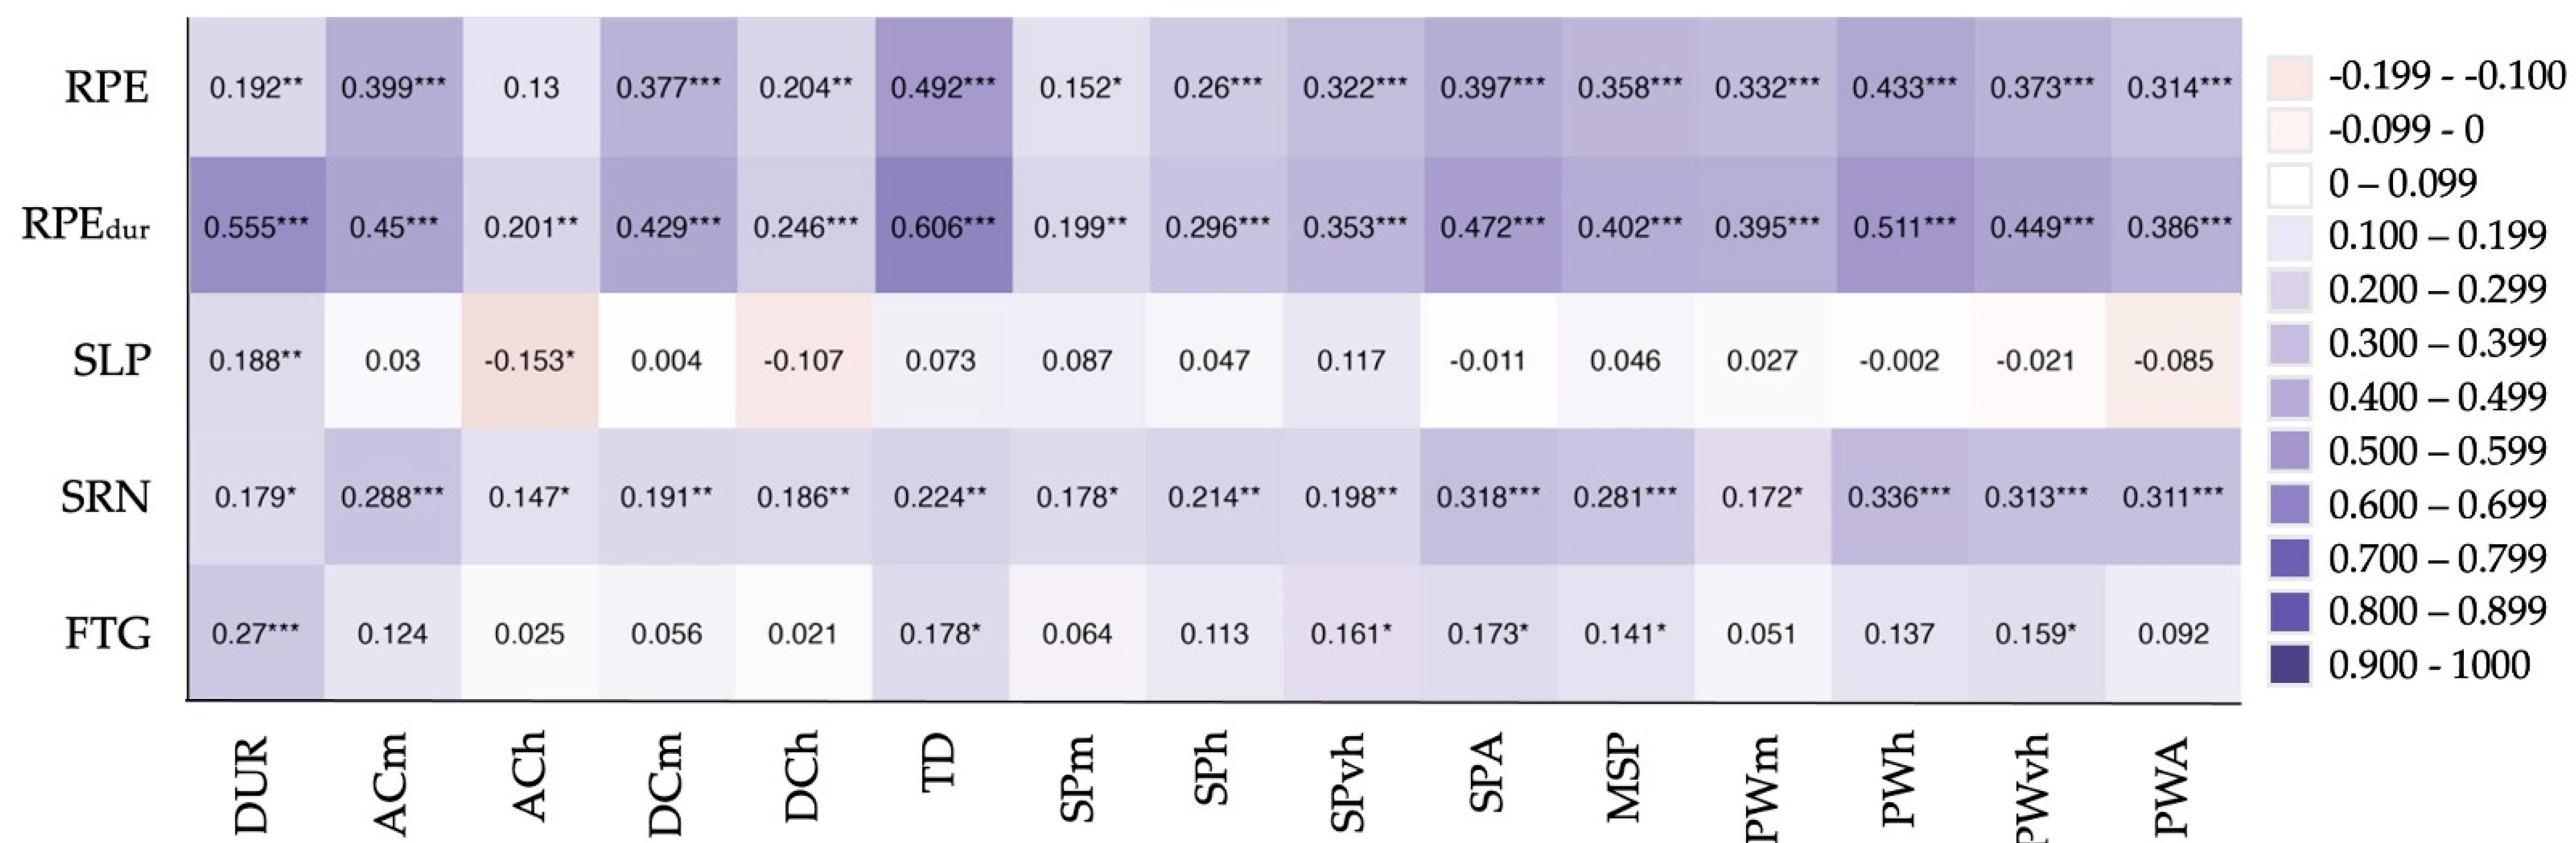
The significant correlations between RPE, wellness parameters, and external load parameters are presented in Figure 1. All the correlations between the above parameters are presented in Table S1 in the Supplementary Files. Independent of the microcycle’s duration, the results for RPE demonstrated high correlation with DIST (p < 0.001, r = 0.523), moderate correlation with DUR (p < 0.001, r = 0.301), ACC2 (p < 0.001, r = 0.478), ACC3 (p < 0.001, r = 0.161), DEC2 (p < 0.001, r = 0.440), DIS4 (p < 0.001, r = 0.302), DIS6 (p < 0.001, r = 0.304), SPEF (p < 0.001, r = 0.431), MAXS (p < 0.001, r = 0.363), MPW4 (p < 0.001, r = 0.449), MPW5 (p < 0.001, r = 0.475), MPW6 (p < 0.001, r = 0.429), and MPWEF (p < 0.001, r = 0.360).
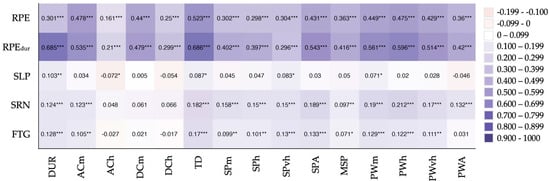
Figure 1.
Correlation between RPE, RPEdur, SLP, SORENES, FTG, and EXLD parameters at all the microcycles. RPE—rate of perceived exertion; RPEdur—RPE × training duration; SLP—sleep perceived responses; SRN—soreness perceived responses; FTG—fatigue perceived responses; DUR—training duration; ACm—accelerations 2–3 m/s2; ACh—accelerations > 3 m/s2; DCm—decelerations −2–−3 m/s2; DCh—accelerations < −3 m/s2; TD—total distance, SPm—distance 14.4–19.7 km/h; SPh—distance 19.7–25.2 km/h; SPvh—distance > 25.2 km/h; SPA—number of actions > 19.7 km/h; MSP—maximal speed; PWm—metabolic distance 15–25.5 w/kg; PWh—metabolic distance 25.5–50 w/kg; PWvh—metabolic distance > 50 w/kg; PWA—number of actions > 25.5 w/kg. * denotes significant correlation at level < 0.05; ** denotes significant correlation at level < 0.01; *** denotes significant correlation at level < 0.001.
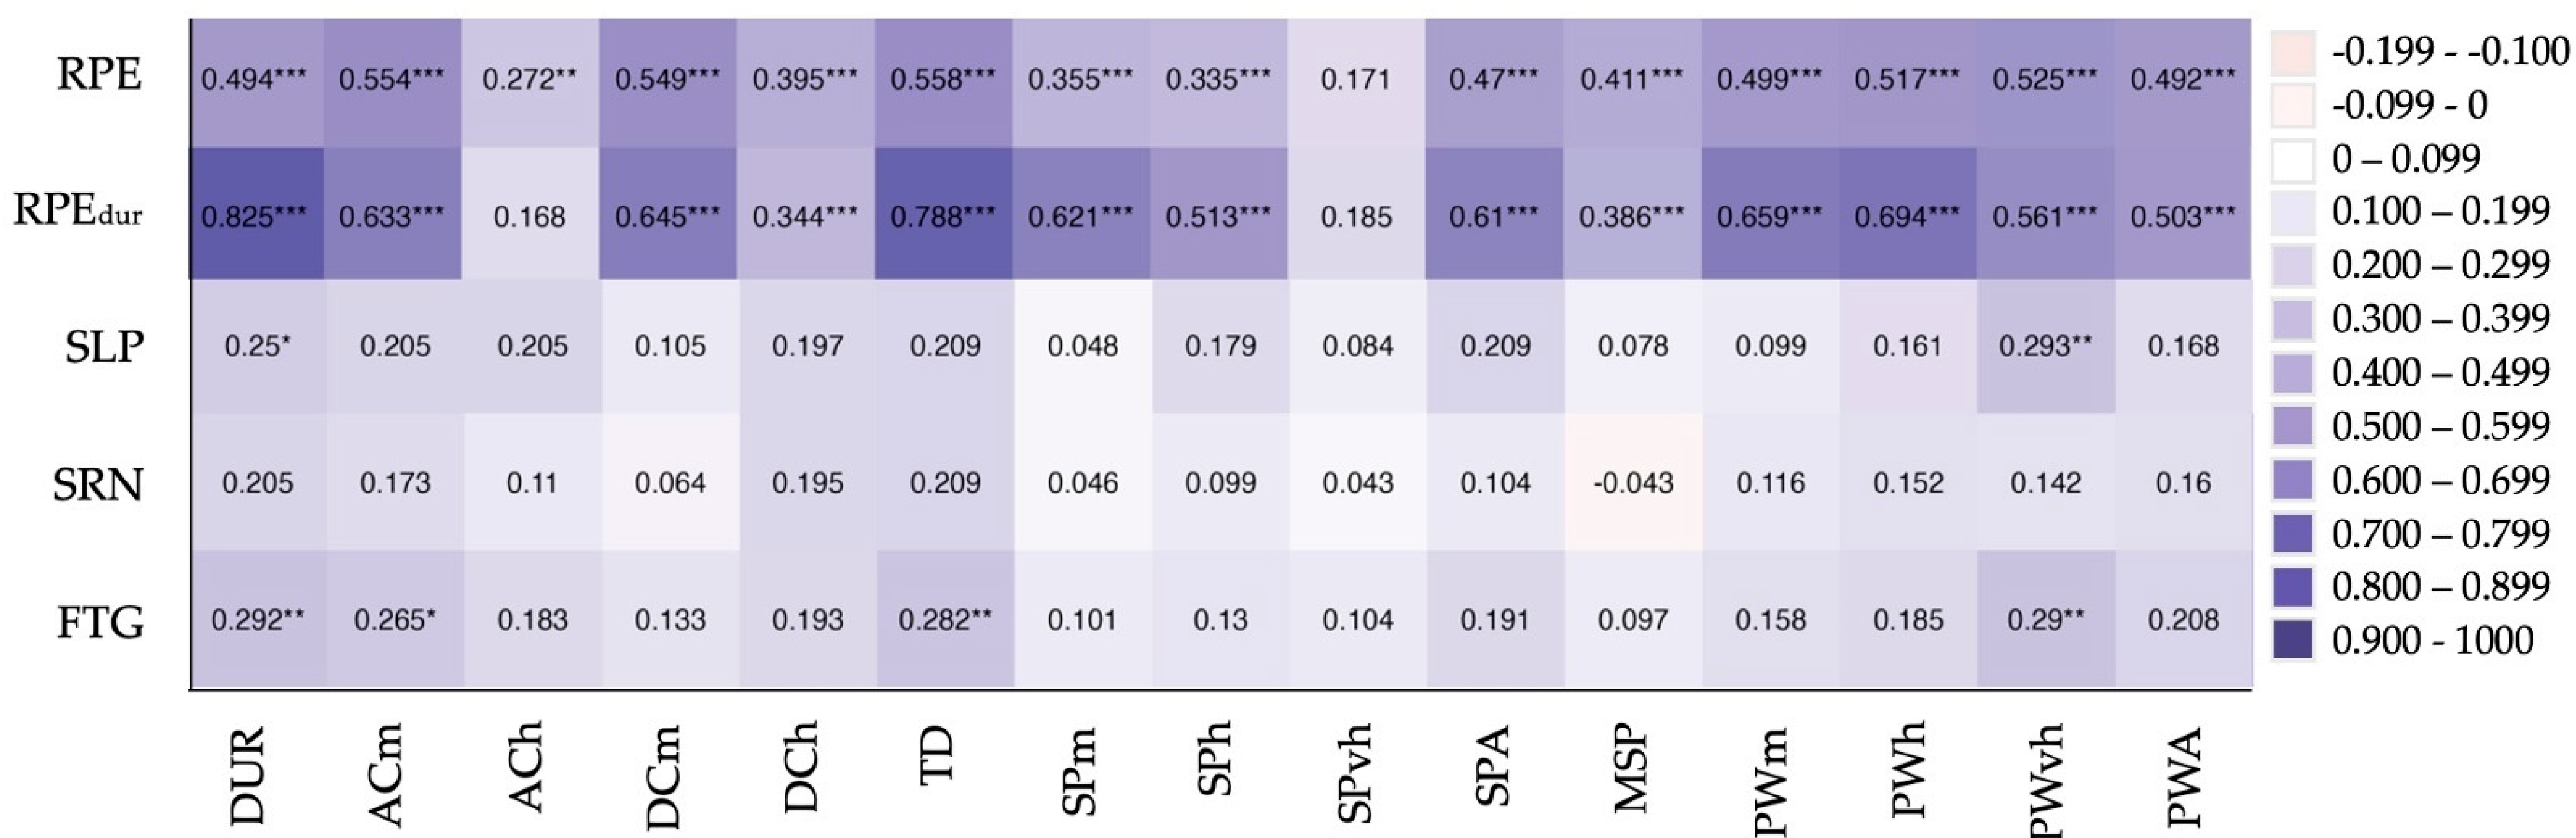
The wellness responses had low correlations with EXLD indicators. SLP correlated with DUR (p = 0.003, r = 0.103), ACC3 (p = 0.035, r = −0.072), DIST (p = 0.15, r = 0.083), DIS6 (p = 0.16, r = 0.083), and MPW4 (p = 0.039, r = 0.071). SRN with DUR (p < 0.001, r = 0.124), ACC2 (p < 0.001, r = 0.123), DIST (p < 0.001, r = 0.182), DIS4 (p < 0.001, r = 0.158), DIS5 (p < 0.001, r = 0.150), DIS6 (p < 0.001, r = 0.150), SPEF (p < 0.001, r = 0.189), MAXS (p = 0.005, r = 0.097), MPW4 (p < 0.001, r = 0.212), MPW5 (p < 0.001, r = 0.170), MPW6 (p < 0.001, r = 0.170), and MPWEF (p < 0.001, r = 0.132). FTG with DUR (p < 0.001, r = 0.128), ACC2 (p = 0.002, r = 0.105), DIST (p < 0.001, r = 0.170), DIS4 (p = 0.004, r = 0.099), DIS5 (p = 0.003, r = 0.101), DIS6 (p < 0.001, r = 0.13), SPEF (p < 0.001, r = 0.133), MAXS (p = 0.039, r = 0.071), MPW4 (p < 0.001, r = 0.129), MPW5 (p < 0.001, r = 0.122), and MPW6 (p = 0.001, r = 0.111). Figure 2 presents the significant correlations of RPE and wellness parameters with performance parameters for MIC5. Similarly, Figure 3 shows the correlations of RPE and wellness parameters with performance parameters for MIC6. Figure 4 presents the significant correlations of RPE and wellness parameters with performance parameters for MIC7, while Figure 5 shows the significant correlations of RPE and wellness parameters with performance parameters for MIC9. All the correlations of the above parameters are presented in Tables S2–S5 in the Supplementary Files.
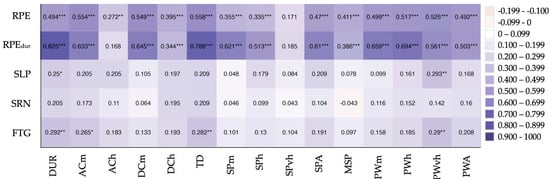
Figure 2.
Correlation between RPE, RPEdur, SLP, SORENES, FTG, and EXLD parameters at MIC5. RPE—rate of perceived exertion; RPEdur—RPE × training duration; SLP—sleep perceived responses; SRN—soreness perceived responses; FTG—fatigue perceived responses; DUR—training duration; ACm—accelerations 2–3 m/s2; ACh—accelerations >3 m/s2; DCm—decelerations −2–−3 m/s2; DCh—accelerations < −3 m/s2; TD—total distance, SPm—distance 14.4–19.7 km/h; SPh—distance 19.7–25.2 km/h; SPvh—distance > 25.2 km/h; SPA—number of actions > 19.7 km/h; MSP—maximal speed; PWm—metabolic distance 15–25.5 w/kg; PWh—metabolic distance 25.5–50 w/kg; PWvh—metabolic distance > 50 w/kg; PWA—number of actions > 25.5 w/kg. * denotes significant correlation at level < 0.05; ** denotes significant correlation at level < 0.01; *** denotes significant correlation at level < 0.001.

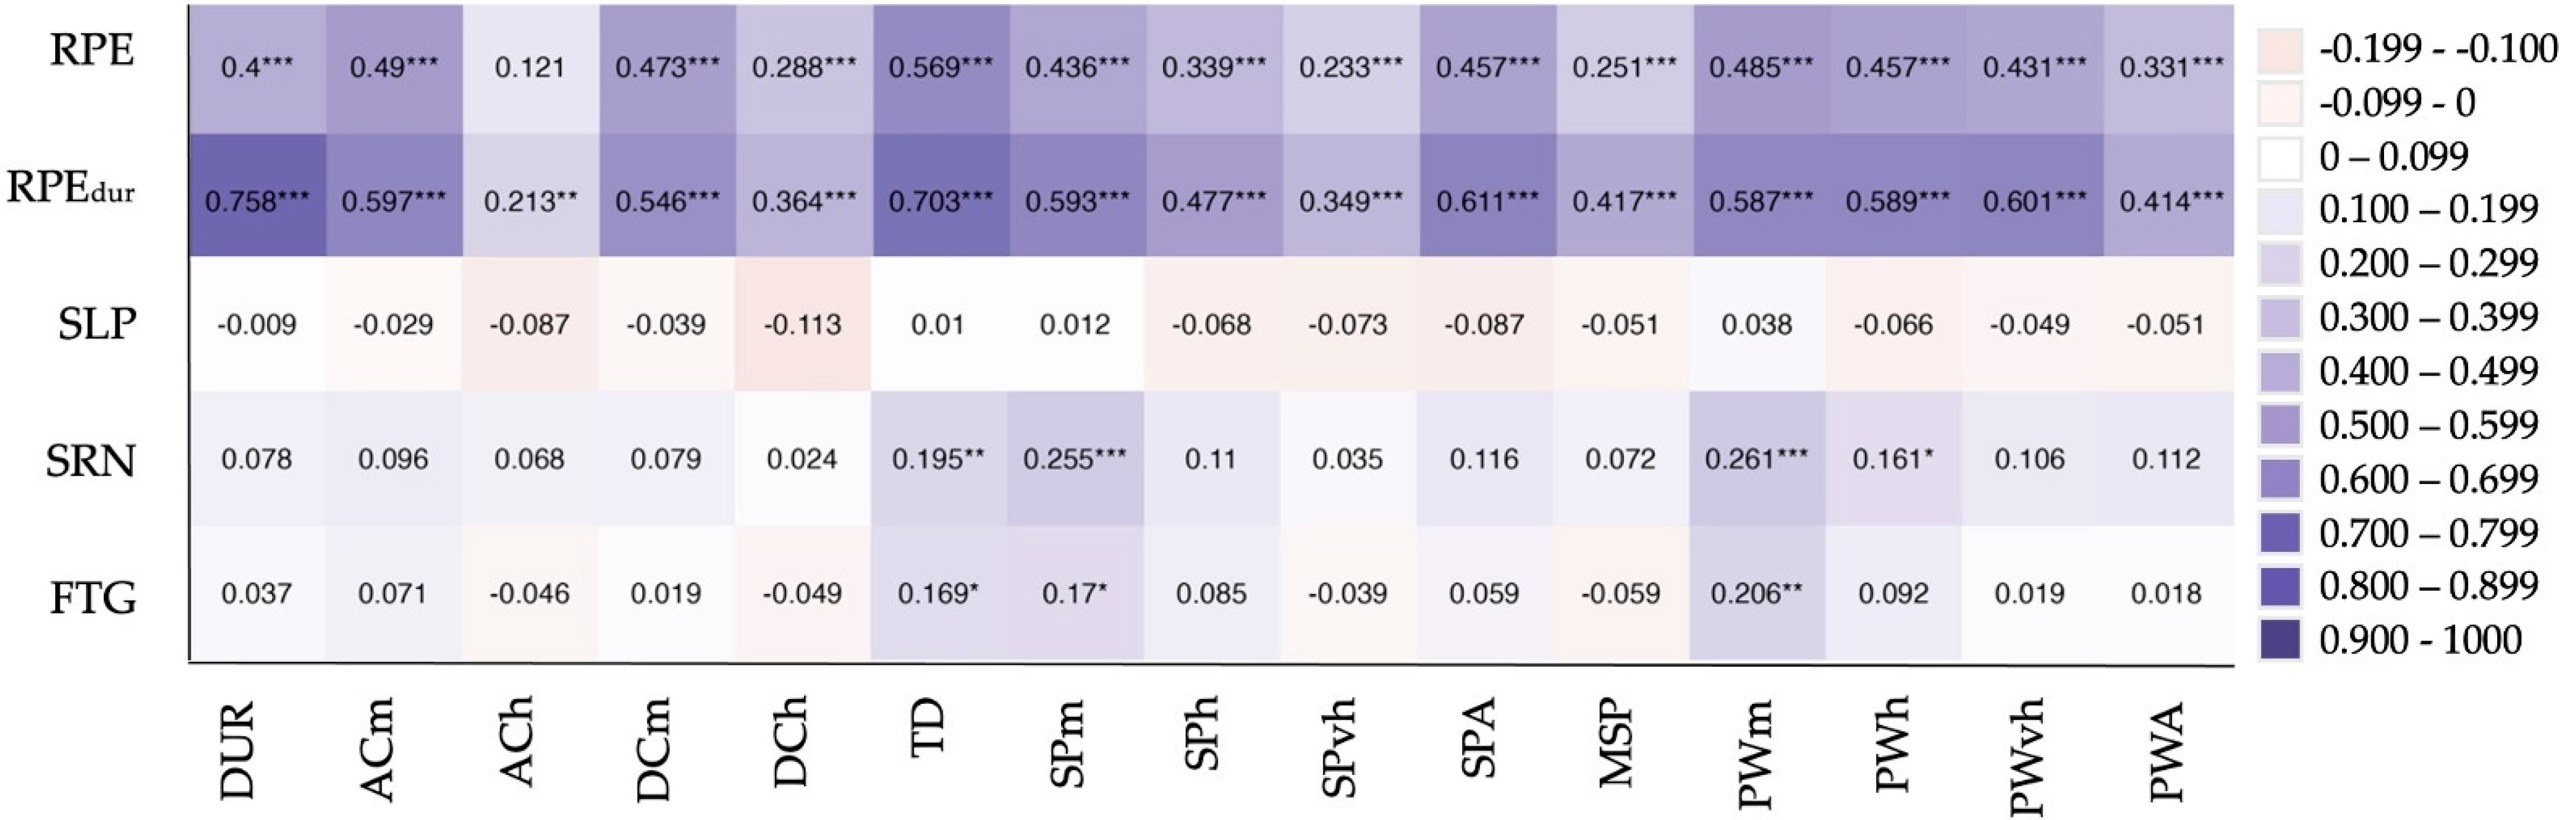
Figure 3.
Correlation between RPE, RPEdur, SLP, SORENES, FTG, and EXLD parameters at MIC6. RPE—rate of perceived exertion; RPEdur—RPE × training duration; SLP—sleep perceived responses; SRN—soreness perceived responses; FTG—fatigue perceived responses; DUR—training duration; ACm—accelerations 2–3 m/s2; ACh—accelerations > 3 m/s2; DCm—decelerations −2–−3 m/s2; DCh—accelerations < −3 m/s2; TD—total distance, SPm—distance 14.4–19.7 km/h; SPh–distance 19.7–25.2 km/h; SPvh–distance > 25.2 km/h; SPA—number of actions > 19.7 km/h; MSP—maximal speed; PWm—metabolic distance 15–25.5 w/kg; PWh—metabolic distance 25.5–50 w/kg; PWvh—metabolic distance > 50 w/kg; PWA—number of actions > 25.5 w/kg. * denotes significant correlation at level < 0.05; ** denotes significant correlation at level < 0.01; *** denotes significant correlation at level < 0.001.
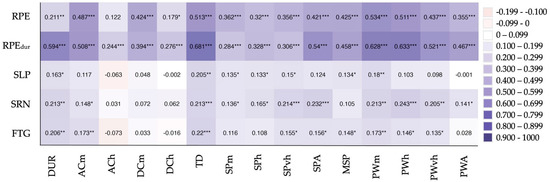
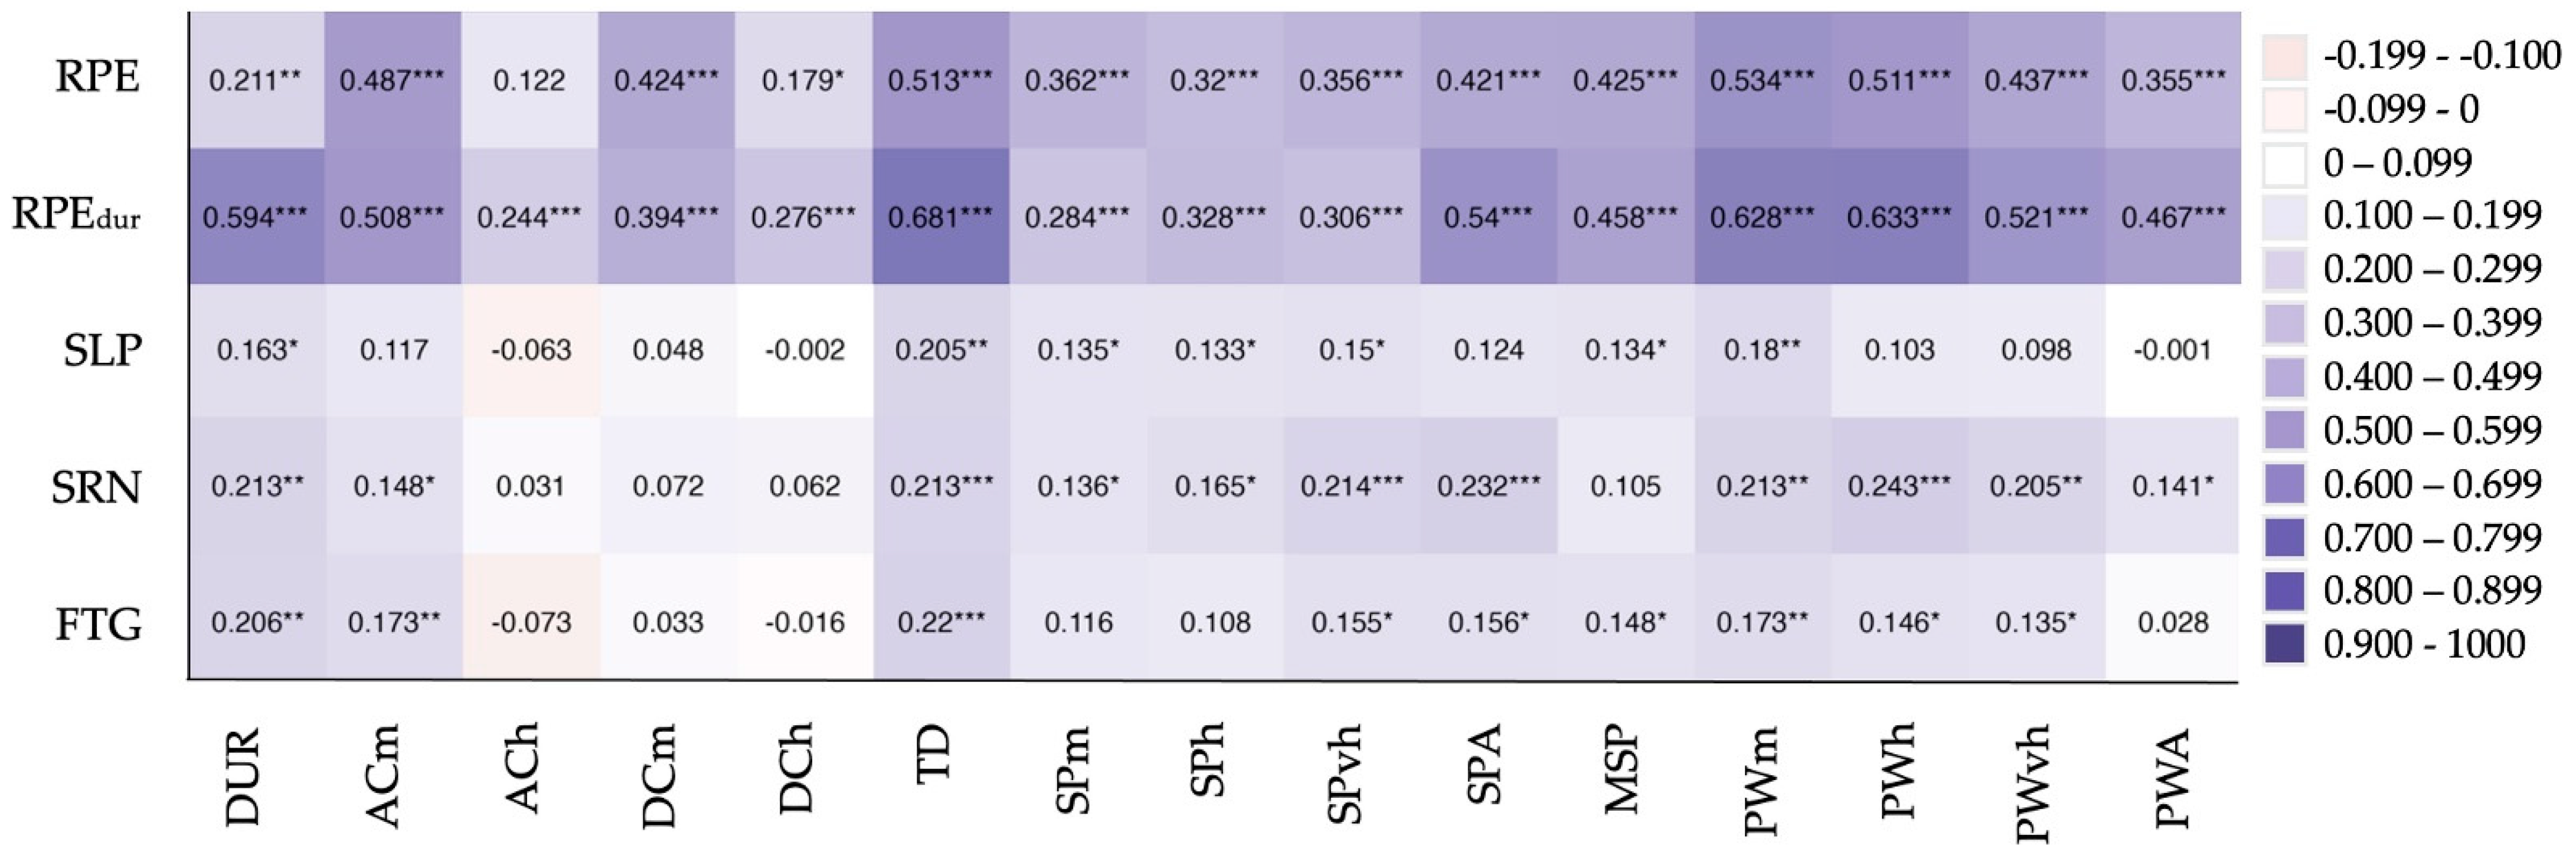
Figure 4.
Correlation between RPE, RPEdur, SLP, SORENES, FTG, and EXLD parameters at MIC7. RPE—rate of perceived exertion; RPEdur—RPE × training duration; SLP—sleep perceived responses; SRN—soreness perceived responses; FTG—fatigue perceived responses; DUR—training duration; ACm—accelerations 2–3 m/s2; ACh—accelerations > 3 m/s2; DCm—decelerations −2–−3 m/s2; DCh—accelerations < −3 m/s2; TD—total distance, SPm—distance 14.4–19.7 km/h; SPh—distance 19.7–25.2 km/h; SPvh—distance > 25.2 km/h; SPA—number of actions > 19.7 km/h; MSP—maximal speed; PWm—metabolic distance 15–25.5 w/kg; PWh—metabolic distance 25.5–50 w/kg; PWvh—metabolic distance > 50 w/kg; PWA—number of actions > 25.5 w/kg. * denotes significant correlation at level < 0.05; ** denotes significant correlation at level < 0.01; *** denotes significant correlation at level < 0.001.
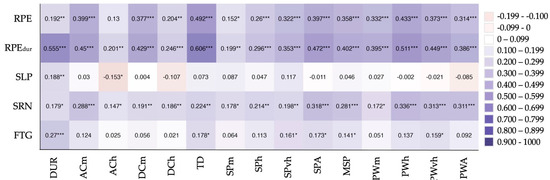
Figure 5.
Correlation between RPE, RPEdur, SLP, SORENES, FTG, and EXLD parameters at MIC9. RPE—rate of perceived exertion; RPEdur—RPE × training duration; SLP—sleep perceived responses; SRN—soreness perceived responses; FTG—fatigue perceived responses; DUR—training duration; ACm—accelerations 2–3 m/s2; ACh—accelerations > 3 m/s2; DCm—decelerations −2–−3 m/s2; DCh—accelerations < −3 m/s2; TD—total distance, SPm—distance 14.4–19.7 km/h; SPh–distance 19.7–25.2 km/h; SPvh–distance > 25.2 km/h; SPA—number of actions > 19.7 km/h; MSP—maximal speed; PWm—metabolic distance 15–25.5 w/kg; PWh—metabolic distance 25.5–50 w/kg; PWvh—metabolic distance > 50 w/kg; PWA—number of actions > 25.5 w/kg. * denotes significant correlation at level < 0.05; ** denotes significant correlation at level < 0.01; *** denotes significant correlation at level < 0.001.
3.2. The Regression Analysis for RPE
When multiple regression was calculated for RPE, the predictors explained 31% of the variance (f3,767 = 114.607, p = 0.001). The significant partial regressors were TD (β = 0.001, p = 0.001), PWvh (β = 0.008, p = 0.001), and ACh (β = 0.009, p = 0.001) (Table 1). The RPE regression model obtained was as follows: RPE = 2.37 + 0.001 × “TD” + 0.008 × “PWvh” − 0.038 × “ACh”.

Table 1.
Results of multiple regression analysis with all variables and using RPE as continuous.
For RPEdur, the predictors explained 58% of the variance (f3,766 = 363.097, p = 0.001). The significant partial regressors were DUR (β = 4.777, p = 0.001), TD (β = 0.036, p = 0.001), and PWvh (β = 0.305, p = 0.001) (Table 2). The RPEdur regression model obtained was as follows: RPEdur = 2.37 + 4.777 × “DUR” + 0.036 × “DIS” + 0.305 × “PWvh”.
Table 2.
Results of multiple regression analysis with all variables and using RPEdur as continuous.
For SLP, the predictors explained only 1% of the variance (f1,843 = 9.084, p = 0.001). The significant partial regressor was DUR (β = 0.01, p = 0.003) (Table 3). The SLP regression model obtained was as follows: SLP = 1.654 + 40.01 × “DUR”.
Table 3.
Results of multiple regression analysis with all variables and using SLP as continuous.
For FTG, the predictors explained 4% of the variance (f2,843 = 15.894, p = 0.001). The significant partial regressors were TD (β = 0.001, p = 0.000) and SPvh (β = 0.002, p = 0.11) (Table 4). The FTG regression model obtained was as follows: FTG = 1.648 + 0.001 × “DIS” + 0.002 × “SPvh”.
Table 4.
Results of multiple regression analysis with all variables and using FTG as continuous.
For SRN, the predictors explained 6% of the variance (f3,841 = 17.611, p = 0.005). The significant partial regressors were MP5 (β = 0.001, p = 0.005), ACC (β = −0.008, p = 0.009), and SPvh (β = 0.002, p = 0.027) (Table 5). The SRN regression model obtained was as follows: SRN = 1.762 + 0.001 × “MP5” − 0.008 × “ACm” + 0.002 × “SPvh”.
Table 5.
Results of multiple regression analysis with all variables and using SRN as continuous.
4. Discussion
The results of our investigation revealed a correlation between the EXLD parameters and both RPE and RPEdur. These results are in line with those from Radzimiński [55], where they found correlations between RPE and DIS, SPh, ACm, and DCm. Similarly, in another study, there was a correlation for DIS > 4 and ACh [37]. Of great interest are the results from Rago et al. [39], where the load was calculated in arbitrary and individualized units and they found that SPm was correlated with both above-mentioned methods, but when it was expressed in individualized units, it was correlated only with SPvh. In another study on adolescents’ football players, where the parameters were calculated in relation to the duration of the training (“per minute”), there were also correlations for TD, HSR, and ACm [36]. Similarly to our study, there are correlations between RPEdur and DUR, TD, DIS > 4, distance > 18 km/h, ACC, HMLD, and HSR [29,37,40,41]. These correlations were stronger by using the individualized thresholds [39]. In semi-professional players, there is a correlation for TD [42], and in young football players for DUR, TD, ACC, and HSR [36]. Concerning the different durations of the microcycles, according to our study, in MIC5, all the parameters were correlated with RPE and RPEdur (except SPvh and ACh), as well as in MIC6, MIC7, and MIC9 (except ACh with RPE). An important finding is that all the correlations are of great magnitude with RPEdur in comparison to the RPE method. There is a lack of research in the literature about the relationship between these two methods and the EXLD in microcyles of different durations in professional football. Therefore, in microcycles of the same duration, most of the EXLD parameters have correlations with these two methods, and our study agrees with this for the microcycles of different durations [36].
Accelerations are very important in football [60,61]; they have a correlation with RPEdur [36,37], and the same goes for MIC6, MIC7, and MIC9, but not MIC5. A lack of correlations between wellness indicators and Acc (accelerations) and Dec (decelerations) is also reported in a recent study [47] that investigated the relationship between wellness and load during matches and training sessions in professional football players. Due to the limited number of days, MIC5 places emphasis on the players’ recovery. The players use the first two days (MD+1 and MD+2) to recover from the previous match, while they use the last day for tapering. On MD-2, the load (e.g., accelerations) was limited, and this could possibly explain the lack of correlations with SPvh. [19].
Other studies found that there are stronger correlations between EXLD and RPEdur than with the RPE method and concluded that the first method is a more powerful indicator [36,37]. Our results justify that the same phenomenon occurs in the different-duration microcycles. Another recent study in semi-professional athletes [46] did not reveal any difference between the two methods (RPE, RPEdur) in terms of their correlation with the EXLD. More specifically, positive correlations were observed between RPE and high-speed running distance, training duration, and sleep quality. The regression analysis for RPE showed that it can explain 31% of the variance, but for RPEdur, it can explain 58%. This could be possibly explained by the fact that RPE underestimates the load provoked by running at moderate to high speed (>14.4 km/h) and high speed (>19.8 km/h), as between the high-intensity actions, there is an extensive recovery time (consisting of low-intensity actions) [41]. On the contrary, in another study, there were no differences between the abovementioned methods, but the magnitude of the relations was slightly elevated when the EXLD was adjusted by the individual fitness capacity of each player [39]. These results enhance the findings from other studies, which suggest that other factors could possibly affect the perceived exertion in intermittent team sports [37,38]. However, in professional or semi-professional football, the RPEdur is an indicator that is correlated with EXLD of the training sessions [40,41,42,62,63]. Furthermore, regardless of the age or level of the players, the TD traveled during the training has the same effect on their perceived exertion [36].
The results showed that there is a low-intensity correlation between wellness perceived responses of the following day and EXLD parameters, independently of the duration of the microcycle, with SRN and FTG carrying more correlations than SLP. In a recent study in professional football players [47] that examined the relationship between wellness indicators, it was observed that the variables sleep quality, fatigue, and muscle soreness showed strong correlations with the internal and external load factors on day MD+1. More specifically, these variables showed negative correlations with RPE, session duration, s-RPE, high-speed running distance, Acc, and Dec. In MIC7 and MIC9, there were correlations for all the wellness parameters, but in MIC5 and MIC6, there were no correlations for SRN and SLP, respectively. Moreover, the responses had correlations with the subsequent training on the same day [7]. In other studies, SLP had no correlations with TD, ACC, DEC, and HMLD [5]. For high-level youth players, SRN had correlations with ACC but not with TD, DEC, and HMLD [5]. Additionally, Nedelec et al. [31] found correlations between SRN and ACC, DEC during the games.
These differences between the various microcycles are ascribed to the fact that the responses can be influenced by the distance of the relative day to the upcoming game [33]. The motivation and the desire to participate in the competition are probably reflected in the players’ responses, resulting in a lower score (higher “readiness”) in the days closer to the game, thus an overall lower score on MIC5 and MIC6 [64].
The quantity and quality of sleep are affected after the application of high eccentric load to the muscles [33], and in addition, a high volume of TD and DUR contributes to an elevated need for rest (sleep) [65]. These factors are probably provoking the correlations in MIC5 between PWvh (which causes high neuromuscular load), DUR, and SLP (with TD marginally having no correlation). As previously mentioned in a recent study [47], no correlation was observed between the variable sleep quality during the microcycle (training sessions) and the internal (RPE, s-RPE) and external load factors (high-speed running distance, sprint distance, Acc, Dec). However, in the same study, strong negative correlations were reported on day MD+1 with the internal load indicators (RPE, s-RPE), as well as with high-speed running distance, Acc, and Dec. Interestingly, in MIC6, there was no correlation with SLP, although in the sort-duration microcycles, the target was to recover and prepare for the following game; presumably, in MIC5, the shortest range between the games does not allow the players to recover either physically or mentally.
The results of our study are in line with the literature, where FTG and SRN are the best predictors of the wellness questionnaire, since the highest values of EXLD can influence the responses of the following morning [7]. In large microcycles (MIC7 and MIC9), there were more correlations than in the short ones (MIC5 and MIC6). In these microcycles, there is adequate time to recover (the first two days), in the middle of the week, high volume and intensity can be applied, and the last two days can be used to reduce the load and prepare for the game (tapering). [19]. Consequently, this high load provokes higher wellness score responses and favors the occurrence of correlations. On the contrary, in the short microcycles, the responses are influenced by fatigue from the previous game, and the applied load is adjusted because the priority is to recover the players and prepare them for the following match. Accordingly, the correlations are limited. Further to the abovementioned, in MIC9, there was a high load in the middle of the week, but in between the highly demanding days, there was one recovery training. This fact potentially influenced the responses.
As cited above, the regression analysis revealed that RPE and RPEdur can explain the fluctuation of the EXLD parameters (31% and 58%, respectively). The factors interacting with RPE are TD, PWvh, and ACh, and likewise, with RPEdur, the interacting factors are DUR, TD, and PWvh. Other studies underline the importance of using more than one EXLD parameter to forecast more precisely the perceived exertion [36,37,66]. TD and DCm (per minute) can predict RPE, and likewise, player load, HSR, and ACm can predict REPdur [36]. There is a similarity between these results and the outcome of our study, taking into consideration the equivalence between these EXLD parameters (ACm, DCm, HSR, and player load with PWvh) [67,68]. Regarding SLP, FTG, and SRN, the regression analysis revealed very low predictions (1%, 4%, and 6%, respectively). To a degree, this relates to the results from Fields et al. [7], who stated that FTG and SRN are the factors that can predict to a greater extent the EXLD.
Some notable limitations exist in our study. (a) The sample size is limited and all the players were members of the same team, so the results should be interpreted with caution. (b) Internal load was evaluated solely by questionnaires; heart rate responses could probably provide a different perspective. (c) All the data were collected during the competitive season; hence, the different-duration microcycles were randomly placed in the calendar. Consequently, any effect of the accumulated fatigue from a short microcycle on the following one could not be evaluated.
5. Conclusions
Our hypothesis that RPE and RPEdur would have correlations with most of the EXLD parameters and that the magnitude would be stronger with the second method was confirmed. Moreover, this tendency remains in the different-duration microcycles. On the contrary, our hypothesis for Hooper was partially supported, as the findings revealed that the wellness score responses vary, depending on the length of the week. In MIC5, it appears that the less recovery between the games is being reflected in FTG responses. In MIC6, MIC7, and MIC9, the best predictors were SRN and FTG, but in MIC6, where the training load was reduced, the correlations were less. We suggest the use of the RPEdur method as a means to obtain a more comprehensive assessment of the EXLD (in the absence of heart rate monitoring) during microcycles of various durations. Concerning the Hooper questionnaire outcome, in short weeks, it should be expected to have an elevated score of FTG. At that point, the practitioners should assess these responses from a different perspective. On the other hand, in large microcycles, SRN and FTG can be applied to adjust the training load and protect the players from overloading. On the contrary, the practicality of SLP is questionable and could possibly be avoided, leading to a less complicated questionnaire that the players could use. Finally, it is recommended that fitness coaches and practitioners use a multidisciplinary approach, combining perceived wellness, exertion, and GPS monitoring tools. This can enhance weekly planning by manipulating better training load, fatigue, and recovery. All of these could lead to a decrease in the possibility of overload injuries and aid players in achieving peak performance.
Supplementary Materials
The following supporting information can be downloaded at: https://www.mdpi.com/article/10.3390/app14156767/s1.
Author Contributions
L.V., Y.M. and T.I.M. designed the study and provided critical feedback on the manuscript; L.V., M.K., P.T. and C.Z. collected and processed the data. L.V. analyzed the data. L.V., M.K. and Y.M. revised the first draft. L.V., P.T., T.I.M. and Y.M. conducted the statistical analysis. All authors have read and agreed to the published version of the manuscript.
Funding
This research received no external funding.
Institutional Review Board Statement
The study was conducted according to the guidelines of the Declaration of Helsinki, and approved by the Ethics Committee of the School of Physical Education and Sport Science at Thessaloniki (App. No. 99/2021, 1 December 2021).
Informed Consent Statement
Informed consent was obtained from all participants involved in the study.
Data Availability Statement
The data presented in this study are available on request from the corresponding author. The data are not publicly available due to research rules.
Acknowledgments
The authors thank the coach and players of the team who participated in the study.
Conflicts of Interest
The authors declare no conflicts of interest.
References
- Borg, G.; Hassmén, P.; Lagerström, M. Perceived exertion related to heart rate and blood lactate during arm and leg exercise. Eur. J. Appl. Physiol. Occup. Physiol. 1987, 56, 679–685. [Google Scholar] [CrossRef] [PubMed]
- Foster, C.A.R.L. Monitoring training in athletes with reference to overtraining syndrome. Med. Sci. Sports Exerc. 1998, 30, 1164–1168. [Google Scholar] [CrossRef] [PubMed]
- Impellizzeri, F.M.; Rampinini, E.; Coutts, A.J.; Sassi, A.L.D.O.; Marcora, S.M. Use of RPE-based training load in soccer. Med. Sci. Sports Exerc. 2004, 36, 1042–1047. [Google Scholar] [CrossRef]
- Hooper, S.L.; Mackinnon, L.T. Monitoring overtraining in athletes: Recommendations. Sports Med. 1995, 20, 321–327. [Google Scholar] [CrossRef] [PubMed]
- Haller, N.; Blumkaitis, J.C.; Strepp, T.; Schmuttermair, A.; Aglas, L.; Simon, P.; Stöggl, T. Comprehensive training load monitoring with biomarkers, performance testing, local positioning data, and questionnaires-first results from elite youth soccer. Front. Physiol. 2022, 13, 2078. [Google Scholar] [CrossRef]
- Impellizzeri, F.M.; Rampinini, E.; Marcora, S.M. Physiological assessment of aerobic training in soccer. J. Sports Sci. 2005, 23, 583–592. [Google Scholar] [CrossRef]
- Fields, J.B.; Lameira, D.M.; Short, J.L.; Merrigan, J.M.; Gallo, S.; White, J.B.; Jones, M.T. Relationship between external load and self-reported wellness measures across a men’s Collegiate soccer preseason. J. Strength Cond. Res. 2021, 35, 1182–1186. [Google Scholar] [CrossRef]
- Haddad, M.; Chaouachi, A.; Wong, D.P.; Castagna, C.; Hambli, M.; Hue, O.; Chamari, K. Influence of fatigue, stress, muscle soreness and sleep on perceived exertion during submaximal effort. Physiol. Behav. 2013, 119, 185–189. [Google Scholar] [CrossRef]
- Chmura, P.; Andrzejewski, M.; Konefał, M.; Mroczek, D.; Rokita, A.; Chmura, J. Analysis of motor activities of professional soccer players during the 2014 World Cup in Brazil. J. Hum. Kinet. 2017, 56, 187–195. [Google Scholar] [CrossRef]
- Dellal, A.; Chamari, K.; Wong, D.P.; Ahmaidi, S.; Keller, D.; Barros, R.; Carling, C. Comparison of physical and technical performance in European soccer match-play: FA Premier League and La Liga. Eur. J. Sport Sci. 2011, 11, 51–59. [Google Scholar] [CrossRef]
- Oliveira, R.; Brito, J.P.; Loureiro, N.; Padinha, V.; Ferreira, B.; Mendes, B. Does the distribution of the weekly training load account for the match results of elite professional soccer players? Physiol. Behav. 2020, 225, 113118. [Google Scholar] [CrossRef] [PubMed]
- Martín-García, A.; Casamichana, D.; Díaz, A.G.; Cos, F.; Gabbett, T.J. Positional differences in the most demanding passages of play in football competition. J. Sports Sci. Med. 2018, 17, 563. [Google Scholar] [PubMed]
- Oliva-Lozano, J.M.; Fortes, V.; Muyor, J.M. The first, second, and third most demanding passages of play in professional soccer: A longitudinal study. Biol. Sport 2020, 38, 165–174. [Google Scholar] [CrossRef] [PubMed]
- Oliva-Lozano, J.M.; Martín-Fuentes, I.; Fortes, V.; Muyor, J.M. Differences in worst-case scenarios calculated by fixed length and rolling average methods in professional soccer match-play. Biol. Sport 2021, 38, 325–331. [Google Scholar] [CrossRef] [PubMed]
- Oliva-Lozano, J.M.; Gómez-Carmona, C.D.; Rojas-Valverde, D.; Fortes, V.; Pino-Ortega, J. Effect of training day, match, and length of the microcycle on the worst-case scenarios in professional soccer players. Res. Sports Med. 2022, 30, 425–438. [Google Scholar] [CrossRef]
- Curtis, R.M.; Huggins, R.A.; Benjamin, C.L.; Sekiguchi, Y.; Adams, W.M.; Arent, S.M.; Jain, R.; Miller, S.J.; Walker, A.J.; Casa, D.J. Contextual factors influencing external and internal training loads in collegiate men’s soccer. J. Strength Cond. Res. 2020, 34, 374–381. [Google Scholar] [CrossRef] [PubMed]
- Anderson, L.; Orme, P.; Di Michele, R.; Close, G.L.; Morgans, R.; Drust, B.; Morton, J.P. Quantification of training load during one-, two-and three-game week schedules in professional soccer players from the English Premier League: Implications for carbohydrate periodisation. J. Sports Sci. 2016, 34, 1250–1259. [Google Scholar] [CrossRef] [PubMed]
- Clemente, F.M.; Rabbani, A.; Conte, D.; Castillo, D.; Afonso, J.; Truman Clark, C.C.; Knechtle, B. Training/match external load ratios in professional soccer players: A full-season study. Int. J. Environ. Res. Public Health 2019, 16, 3057. [Google Scholar] [CrossRef] [PubMed]
- Vardakis, L.; Michailidis, Y.; Topalidis, P.; Zelenitsas, C.; Mandroukas, A.; Gissis, I.; Christoulas, K.; Mavrommatis, G.; Metaxas, T. Application of a Structured Training Plan on Different-Length Microcycles in Soccer—Internal and External Load Analysis between Training Weeks and Games. Appl. Sci. 2023, 13, 6935. [Google Scholar] [CrossRef]
- Los Arcos, A.; Mendez-Villanueva, A.; Martínez-Santos, R. In-season training periodization of professional soccer players. Biol. Sport 2017, 34, 149–155. [Google Scholar] [CrossRef]
- Castillo, D.; Raya-González, J.; Weston, M.; Yanci, J. Distribution of external load during acquisition training sessions and match play of a professional soccer team. J. Strength Cond. Res. 2021, 35, 3453–3458. [Google Scholar] [CrossRef] [PubMed]
- Stevens, T.G.; de Ruiter, C.J.; Twisk, J.W.; Savelsbergh, G.J.; Beek, P.J. Quantification of in-season training load relative to match load in professional Dutch Eredivisie football players. Sci. Med. Footb. 2017, 1, 117–125. [Google Scholar] [CrossRef]
- Modric, T.; Versic, S.; Sekulic, D. Relations of the weekly external training load indicators and running performances in professional soccer matches. Sport Mont. 2021, 19, 31–37. [Google Scholar]
- Turner, A.N.; Stewart, P.F. Strength and conditioning for soccer players. Strength Cond. J. 2014, 36, 1–13. [Google Scholar] [CrossRef]
- Clemente, F.M.; Owen, A.; Serra-Olivares, J.; Nikolaidis, P.T.; Van Der Linden, C.M.; Mendes, B. Characterization of the weekly external load profile of professional soccer teams from Portugal and the Netherlands. J. Hum. Kinet. 2019, 66, 155–164. [Google Scholar] [CrossRef] [PubMed]
- Lago-Peñas, C.; Rey, E.; Lago-Ballesteros, J.; Casáis, L.; Domínguez, E. The influence of a congested calendar on physical performance in elite soccer. J. Strength Cond. Res. 2011, 25, 2111–2117. [Google Scholar] [CrossRef] [PubMed]
- Modric, T.; Versic, S.; Sekulic, D. Does aerobic performance define match running performance among professional soccer players? A position-specific analysis. Res. Sports Med. 2021, 29, 336–348. [Google Scholar] [CrossRef] [PubMed]
- Sarmento, H.; Clemente, F.M.; Harper, L.D.; Costa, I.T.D.; Owen, A.; Figueiredo, A.J. Small sided games in soccer—A systematic review. Int. J. Perform. Anal. Sport 2018, 18, 693–749. [Google Scholar] [CrossRef]
- Oliveira, R.; Brito, J.P.; Martins, A.; Mendes, B.; Marinho, D.A.; Ferraz, R.; Marques, M.C. In-season internal and external training load quantification of an elite European soccer team. PLoS ONE 2019, 14, e0209393. [Google Scholar] [CrossRef]
- Jaspers, A.; De Beéck, T.O.; Brink, M.S.; Frencken, W.G.; Staes, F.; Davis, J.J.; Helsen, W.F. Relationships between the external and internal training load in professional soccer: What can we learn from machine learning? Int. J. Sports Physiol. Perform. 2018, 13, 625–630. [Google Scholar] [CrossRef]
- Nedelec, M.; McCall, A.; Carling, C.; Legall, F.; Berthoin, S.; Dupont, G. The influence of soccer playing actions on the recovery kinetics after a soccer match. J. Strength Cond. Res. 2014, 28, 1517–1523. [Google Scholar] [CrossRef] [PubMed]
- Pritchard, M.; Wilson, G. Comparing sources of stress in college student athletes and non-athletes. Athl. Insight Online J. Sports Psychol. 2005, 5, 1–8. [Google Scholar]
- Gallo, T.F.; Cormack, S.J.; Gabbett, T.J.; Lorenzen, C.H. Self-reported wellness profiles of professional Australian football players during the competition phase of the season. J. Strength Cond. Res. 2017, 31, 495–502. [Google Scholar] [CrossRef] [PubMed]
- Bourdon, P.C.; Cardinale, M.; Murray, A.; Gastin, P.; Kellmann, M.; Varley, M.C.; Cable, N.T. Monitoring athlete training loads: Consensus statement. Int. J. Sports Physiol. Perform. 2017, 12, S2–S161. [Google Scholar] [CrossRef] [PubMed]
- Foster, C.; Florhaug, J.A.; Franklin, J.; Gottschall, L.; Hrovatin, L.A.; Parker, S.; Dodge, C. A new approach to monitoring exercise training. J. Strength Cond. Res. 2001, 15, 109–115. [Google Scholar] [PubMed]
- Marynowicz, J.; Kikut, K.; Lango, M.; Horna, D.; Andrzejewski, M. Relationship between the session-RPE and external measures of training load in youth soccer training. J. Strength Cond. Res. 2020, 34, 2800–2804. [Google Scholar] [CrossRef] [PubMed]
- Gaudino, P.; Iaia, F.M.; Strudwick, A.J.; Hawkins, R.D.; Alberti, G.; Atkinson, G.; Gregson, W. Factors influencing perception of effort (session rating of perceived exertion) during elite soccer training. Int. J. Sports Physiol. Perform. 2015, 10, 860–864. [Google Scholar] [CrossRef] [PubMed]
- Lovell, T.W.; Sirotic, A.C.; Impellizzeri, F.M.; Coutts, A.J. Factors affecting perception of effort (session rating of perceived exertion) during rugby league training. Int. J. Sports Physiol. Perform. 2013, 8, 62–69. [Google Scholar] [CrossRef]
- Rago, V.; Brito, J.; Figueiredo, P.; Krustrup, P.; Rebelo, A. Relationship between external load and perceptual responses to training in professional football: Effects of quantification method. Sport 2019, 7, 68. [Google Scholar] [CrossRef]
- Perreira, L.A.; Freitas, T.T.; Zanetti, V.; Loturco, I. Variations in Internal and External Training Load Measures and Neuromuscular Performance of Professional Soccer Players During a Preseason Training Period. J. Hum. Kinet. 2022, 81, 149–162. [Google Scholar] [CrossRef]
- Scott, B.R.; Lockie, R.G.; Knight, T.J.; Clark, A.C.; de Jonge, X.A.J. A comparison of methods to quantify the in-season training load of professional soccer players. Int. J. Sports Physiol. Perform. 2013, 8, 195–202. [Google Scholar] [CrossRef] [PubMed]
- Casamichana, D.; Castellano, J.; Calleja-Gonzalez, J.; San Román, J.; Castagna, C. Relationship between indicators of training load in soccer players. J. Strength Cond. Res. 2013, 27, 369–374. [Google Scholar] [CrossRef] [PubMed]
- Moreira, A.; Kempton, T.; Aoki, M.S.; Sirotic, A.C.; Coutts, A.J. The impact of 3 different-length between-matches microcycles on training loads in professional rugby league players. Int. J. Sports Physiol. Perform. 2015, 10, 767–773. [Google Scholar] [CrossRef] [PubMed]
- Clemente, F.M.; Mendes, B.; Nikolaidis, P.T.; Calvete, F.; Carriço, S.; Owen, A.L. Internal training load and its longitudinal relationship with seasonal player wellness in elite professional soccer. Physiol. Behav. 2017, 179, 262–267. [Google Scholar] [CrossRef] [PubMed]
- Nobari, H.; Alves, A.R.; Haghighi, H.; Clemente, F.M.; Carlos-Vivas, J.; Pérez-Gómez, J.; Ardigò, L.P. Association between Training Load and Well-Being Measures in Young Soccer Players during a Season. Int. J. Environ. Res. Public Health 2021, 18, 4451. [Google Scholar] [CrossRef] [PubMed]
- Nobari, H.; Gholizadeh, R.; Martins, A.D.; Badicu, G.; Oliveira, R. In-Season Quantification and Relationship of External and Internal Intensity, Sleep Quality, and Psychological or Physical Stressors of Semi-Professional Soccer Players. Biology 2022, 11, 467. [Google Scholar] [CrossRef] [PubMed]
- Oliveira, R.F.S.; Canário-Lemos, R.; Peixoto, R.; Vilaça-Alves, J.; Morgans, R.; Brito, J.P. The relationship between wellness and training and match load in professional male soccer players. PLoS ONE 2023, 18, e0289374. [Google Scholar] [CrossRef]
- Oliva-Lozano, J.M.; Muyor, J.M.; Fortes, V.; McLaren, S.J. Decomposing the variability of match physical performance in professional soccer: Implications for monitoring individuals. Eur. J. Sport Sci. 2021, 21, 1588–1596. [Google Scholar] [CrossRef] [PubMed]
- Slimani, M.; Znazen, H.; Miarka, B.; Bragazzi, N.L. Maximum oxygen uptake of male soccer players according to their competitive level, playing position and age group: Implication from a network meta-analysis. J. Hum. Kinet. 2019, 66, 233–245. [Google Scholar] [CrossRef]
- Malone, J.J.; Di Michele, R.; Morgans, R.; Burgess, D.; Morton, J.P.; Drust, B. Seasonal training-load quantification in elite English premier league soccer players. Int. J. Sports Physiol. Perform. 2015, 10, 489–497. [Google Scholar] [CrossRef]
- Vardakis, L.; Michailidis, Y.; Mandroukas, A.; Mavrommatis, G.; Christoulas, K.; Metaxas, T. Analysis of the running performance of elite soccer players depending on position in the 1-4-3-3 formation. Ger. J. Exerc. Sport Res. 2020, 50, 241–250. [Google Scholar] [CrossRef]
- Foster, C.; Hector, L.L.; Welsh, R.; Schrager, M.; Green, M.A.; Snyder, A.C. Effects of specific versus cross-training on running performance. Eur. J. Appl. Physiol. Occup. Physiol. 1995, 70, 367–372. [Google Scholar] [CrossRef]
- Chena, M.; Morcillo, J.A.; Rodríguez-Hernández, M.L.; Zapardiel, J.C.; Owen, A.; Lozano, D. The Effect of Weekly Training Load across a Competitive Microcycle on Contextual Variables in Professional Soccer. Int. J. Environ. Res. Public Health 2021, 18, 5091. [Google Scholar] [CrossRef]
- Hoppe, M.W.; Baumgart, C.; Polglaze, T.; Freiwald, J. Validity and reliability of GPS and LPS for measuring distances covered and sprint mechanical properties in team sports. PLoS ONE 2018, 13, e0192708. [Google Scholar] [CrossRef] [PubMed]
- Radzimiński, Ł. Weekly training load distribution and relationships between external and internal load indicators in professional soccer players. J. Phys. Educ. Sport 2021, 21, 1669–1675. [Google Scholar]
- Waldron, M.; Worsfold, P.; Twist, C.; Lamb, K. Concurrent validity and test–retest reliability of a global positioning system (GPS) and timing gates to assess sprint performance variables. J. Sports Sci. 2011, 29, 1613–1619. [Google Scholar] [CrossRef]
- Jennings, D.; Cormack, S.; Coutts, A.J.; Boyd, L.; Aughey, R.J. The validity and reliability of GPS units for measuring distance in team sport specific running patterns. Int. J. Sports Physiol. Perform. 2010, 5, 328–341. [Google Scholar] [CrossRef] [PubMed]
- Vardakis, L.; Koutsokosta, M.; Michailidis, Y.; Mandroukas, A.; Stafylidis, A.; Kanaras, V.; Bamplekis, C.; Fousekis, A.; Stamatelos, K.; Metaxas, I.; et al. Differences in Physical Indexes between Football Players of Different Playing Positions and Correlation to the Weekly Training Load. Appl. Sci. 2024, 14, 4469. [Google Scholar] [CrossRef]
- Hopkins, W.G.; Precision of measurement. A New View of Statistics. 2011. Available online: https://sportsci.org/resource/stats/precision.html (accessed on 1 January 2023).
- Gaudino, P.; Iaia, F.M.; Alberti, G.; Strudwick, A.J.; Atkinson, G.; Gregson, W. Monitoring training in elite soccer players: Systematic bias between running speed and metabolic power data. Int. J. Sports Med. 2013, 34, 963–968. [Google Scholar] [CrossRef]
- Gaudino, P.; Iaia, F.M.; Alberti, G.; Hawkins, R.D.; Strudwick, A.J.; Gregson, W. Systematic bias between running speed and metabolic power data in elite soccer players: Influence of drill type. Int. J. Sports Med. 2013, 35, 489–493. [Google Scholar] [CrossRef]
- McLaren, S.J.; Macpherson, T.W.; Coutts, A.J.; Hurst, C.; Spears, I.R.; Weston, M. The relationships between internal and external measures of training load and intensity in team sports: A meta-analysis. Sports Med. 2018, 48, 641–658. [Google Scholar] [CrossRef]
- Pustina, A.A.; Sato, K.; Liu, C.; Kavanaugh, A.A.; Sams, M.L.; Liu, J.; Stone, M.H. Establishing a duration standard for the calculation of session rating of perceived exertion in NCAA division I men’s soccer. J. Trainology 2017, 6, 26–30. [Google Scholar] [CrossRef] [PubMed]
- Gastin, P.B.; Meyer, D.; Robinson, D. Perceptions of wellness to monitor adaptive responses to training and competition in elite Australian football. J. Strength Cond. Res. 2013, 27, 2518–2526. [Google Scholar] [CrossRef] [PubMed]
- Thornton, H.R.; Duthie, G.M.; Pitchford, N.W.; Delaney, J.A.; Benton, D.T.; Dascombe, B.J. Effects of a 2-week high-intensity training camp on sleep activity of professional rugby league athletes. Int. J. Sports Physiol. Perform. 2018, 12, 928–933. [Google Scholar] [CrossRef] [PubMed]
- Geurkink, Y.; Vandewiele, G.; Lievens, M.; De Turck, F.; Ongenae, F.; Matthys, S.P.; Bourgois, J.G. Modeling the prediction of the session rating of perceived exertion in soccer: Unraveling the puzzle of predictive indicators. Int. J. Sports Physiol. Perform. 2019, 14, 841–846. [Google Scholar] [CrossRef] [PubMed]
- Dalen, T.; Ingebrigtsen, J.; Ettema, G.; Hjelde, G.H.; Wisloff, U. Player load, acceleration, and deceleration during forty-five competitive matches of elite soccer. J. Strength Cond. Res. 2016, 30, 351–359. [Google Scholar] [CrossRef]
- Osgnach, C.; Poser, S.; Bernardini, R.; Rinaldo, R.; Di Prampero, P.E. Energy cost and metabolic power in elite soccer: A new match analysis approach. Med. Sci. Sports Exerc. 2010, 42, 170–178. [Google Scholar] [CrossRef]
Disclaimer/Publisher’s Note: The statements, opinions and data contained in all publications are solely those of the individual author(s) and contributor(s) and not of MDPI and/or the editor(s). MDPI and/or the editor(s) disclaim responsibility for any injury to people or property resulting from any ideas, methods, instructions or products referred to in the content. |
© 2024 by the authors. Licensee MDPI, Basel, Switzerland. This article is an open access article distributed under the terms and conditions of the Creative Commons Attribution (CC BY) license (https://creativecommons.org/licenses/by/4.0/).