
Influence of the Geometric Properties, the Timber–Concrete Interface, and the Load Protocol on the Mechanical Properties of Timber–Concrete Composite Connections

Abstract
:1. Introduction
2. Experimental Program
2.1. Mechanical and Geometric Properties
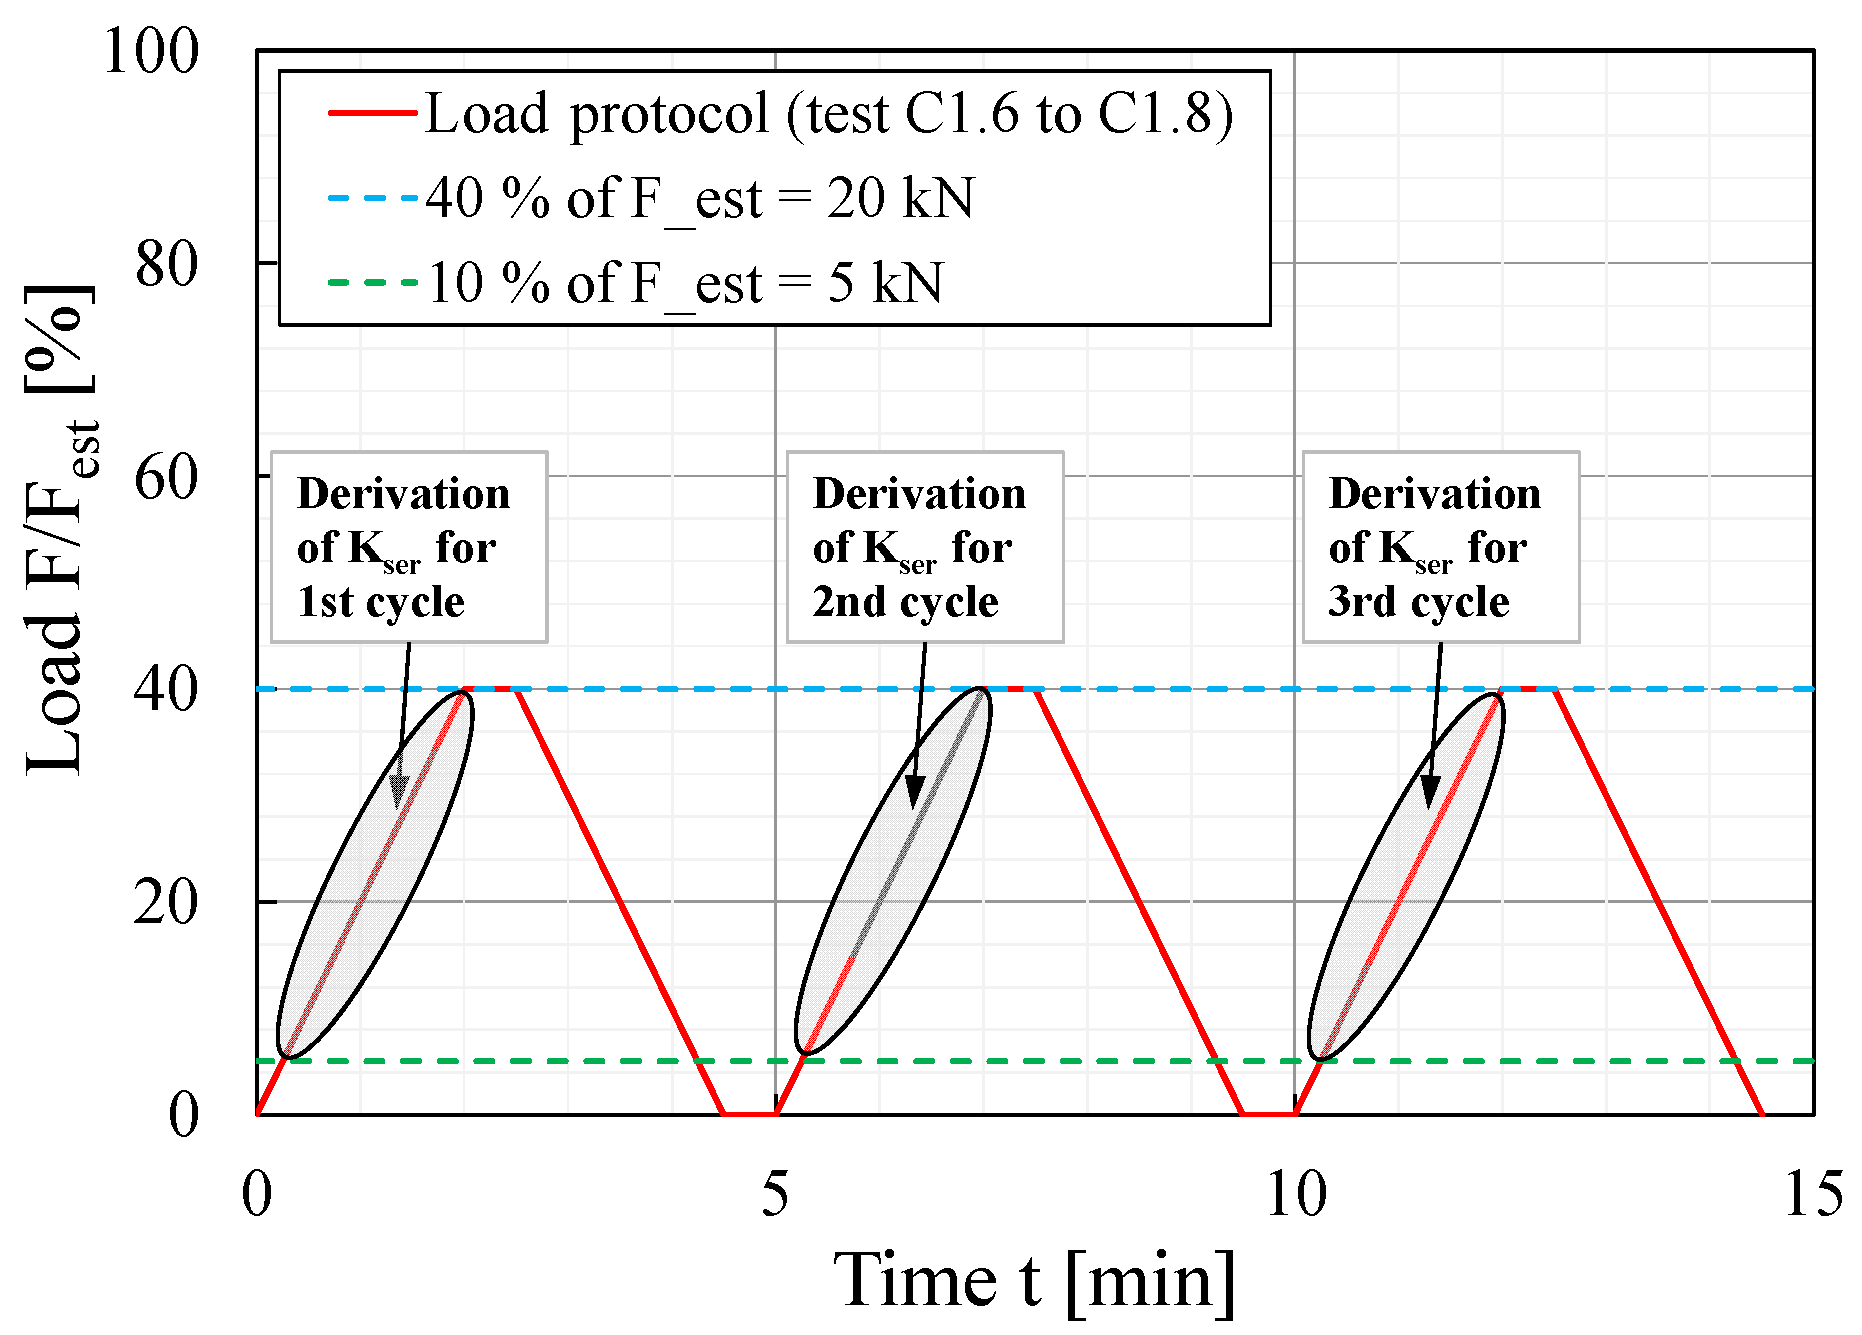
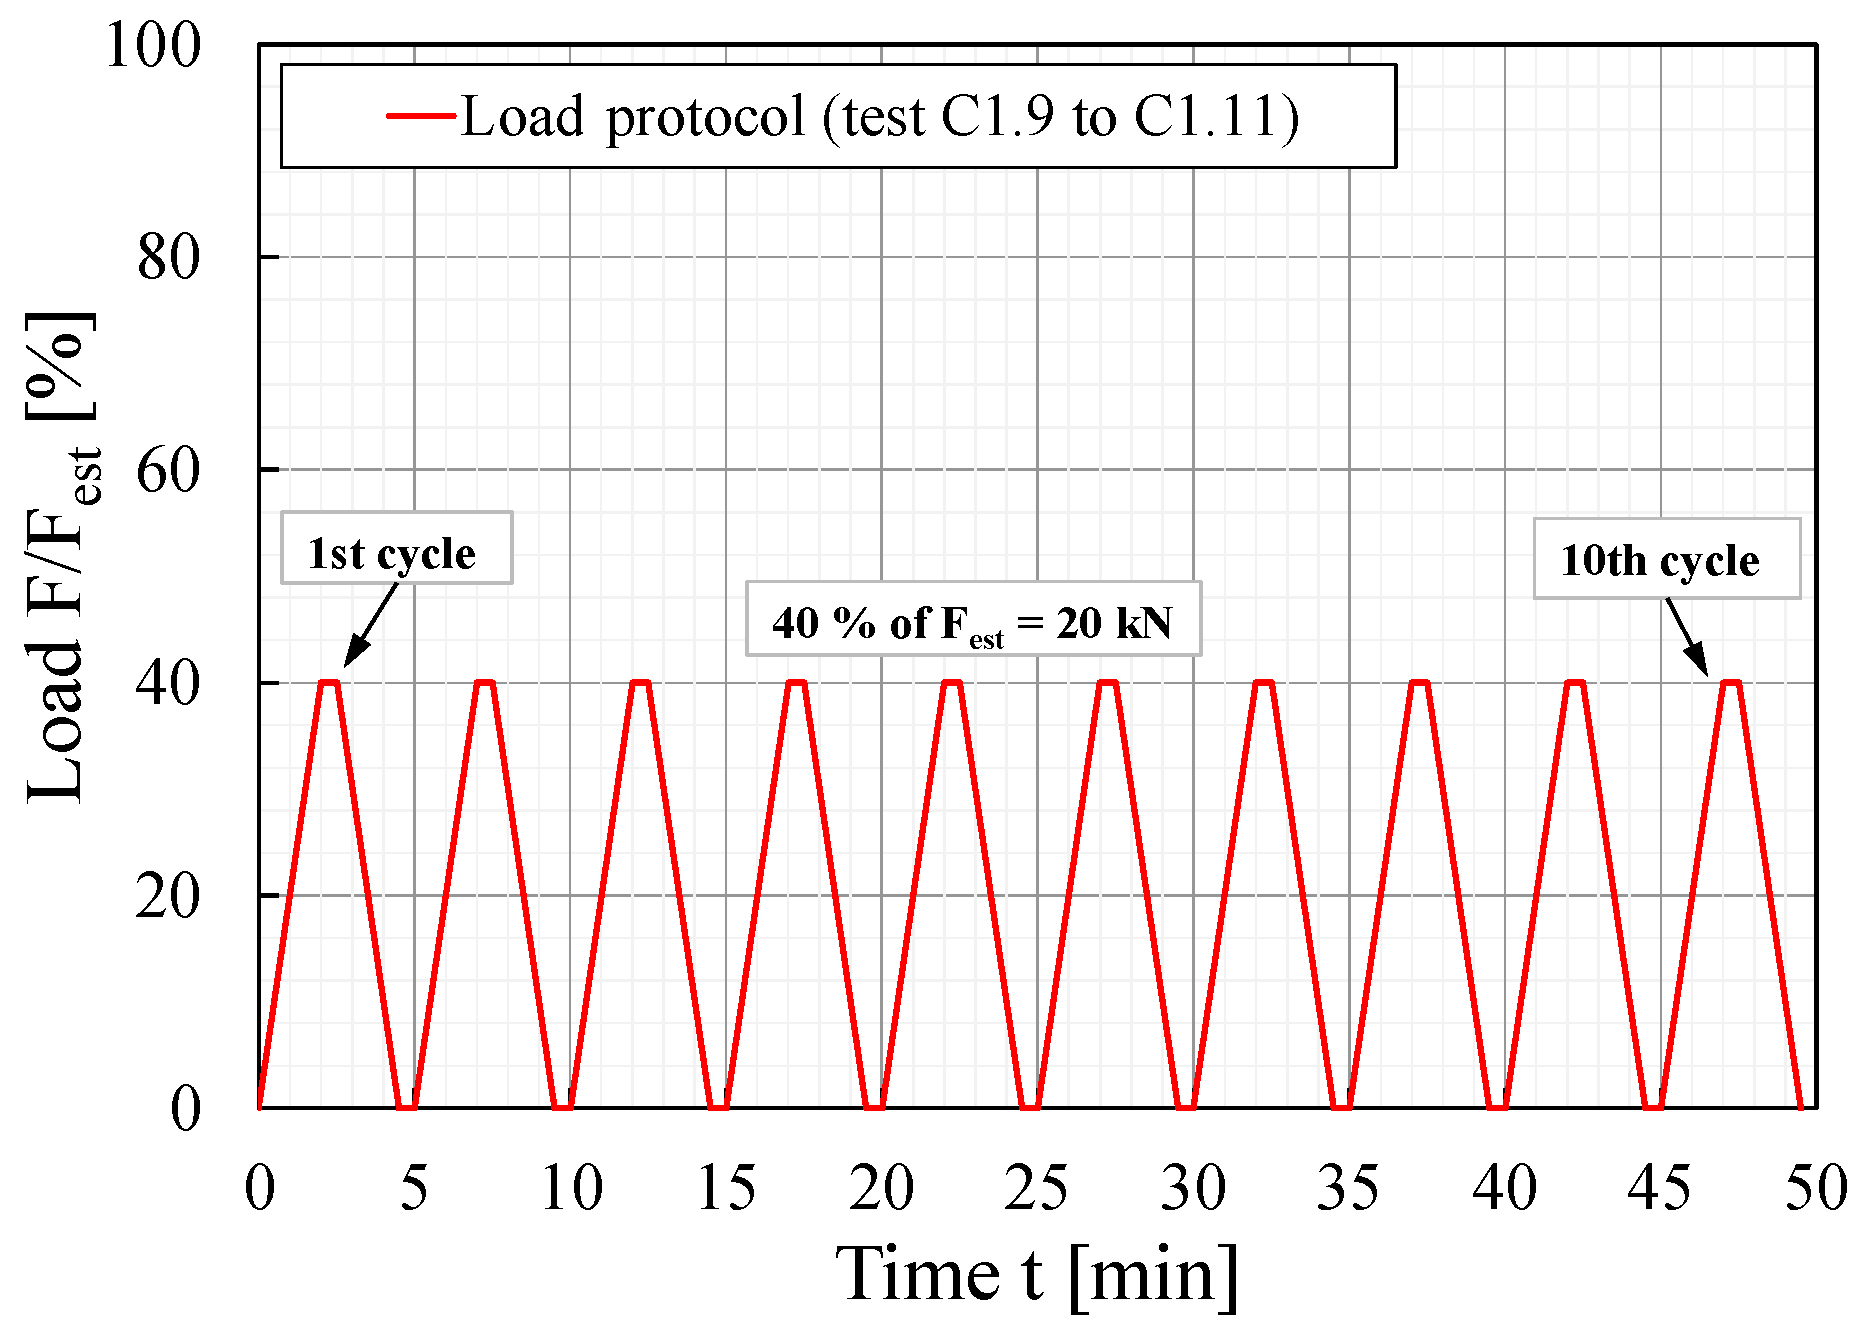
2.2. Type of Contact Surface and Load Procedure
3. Test Results
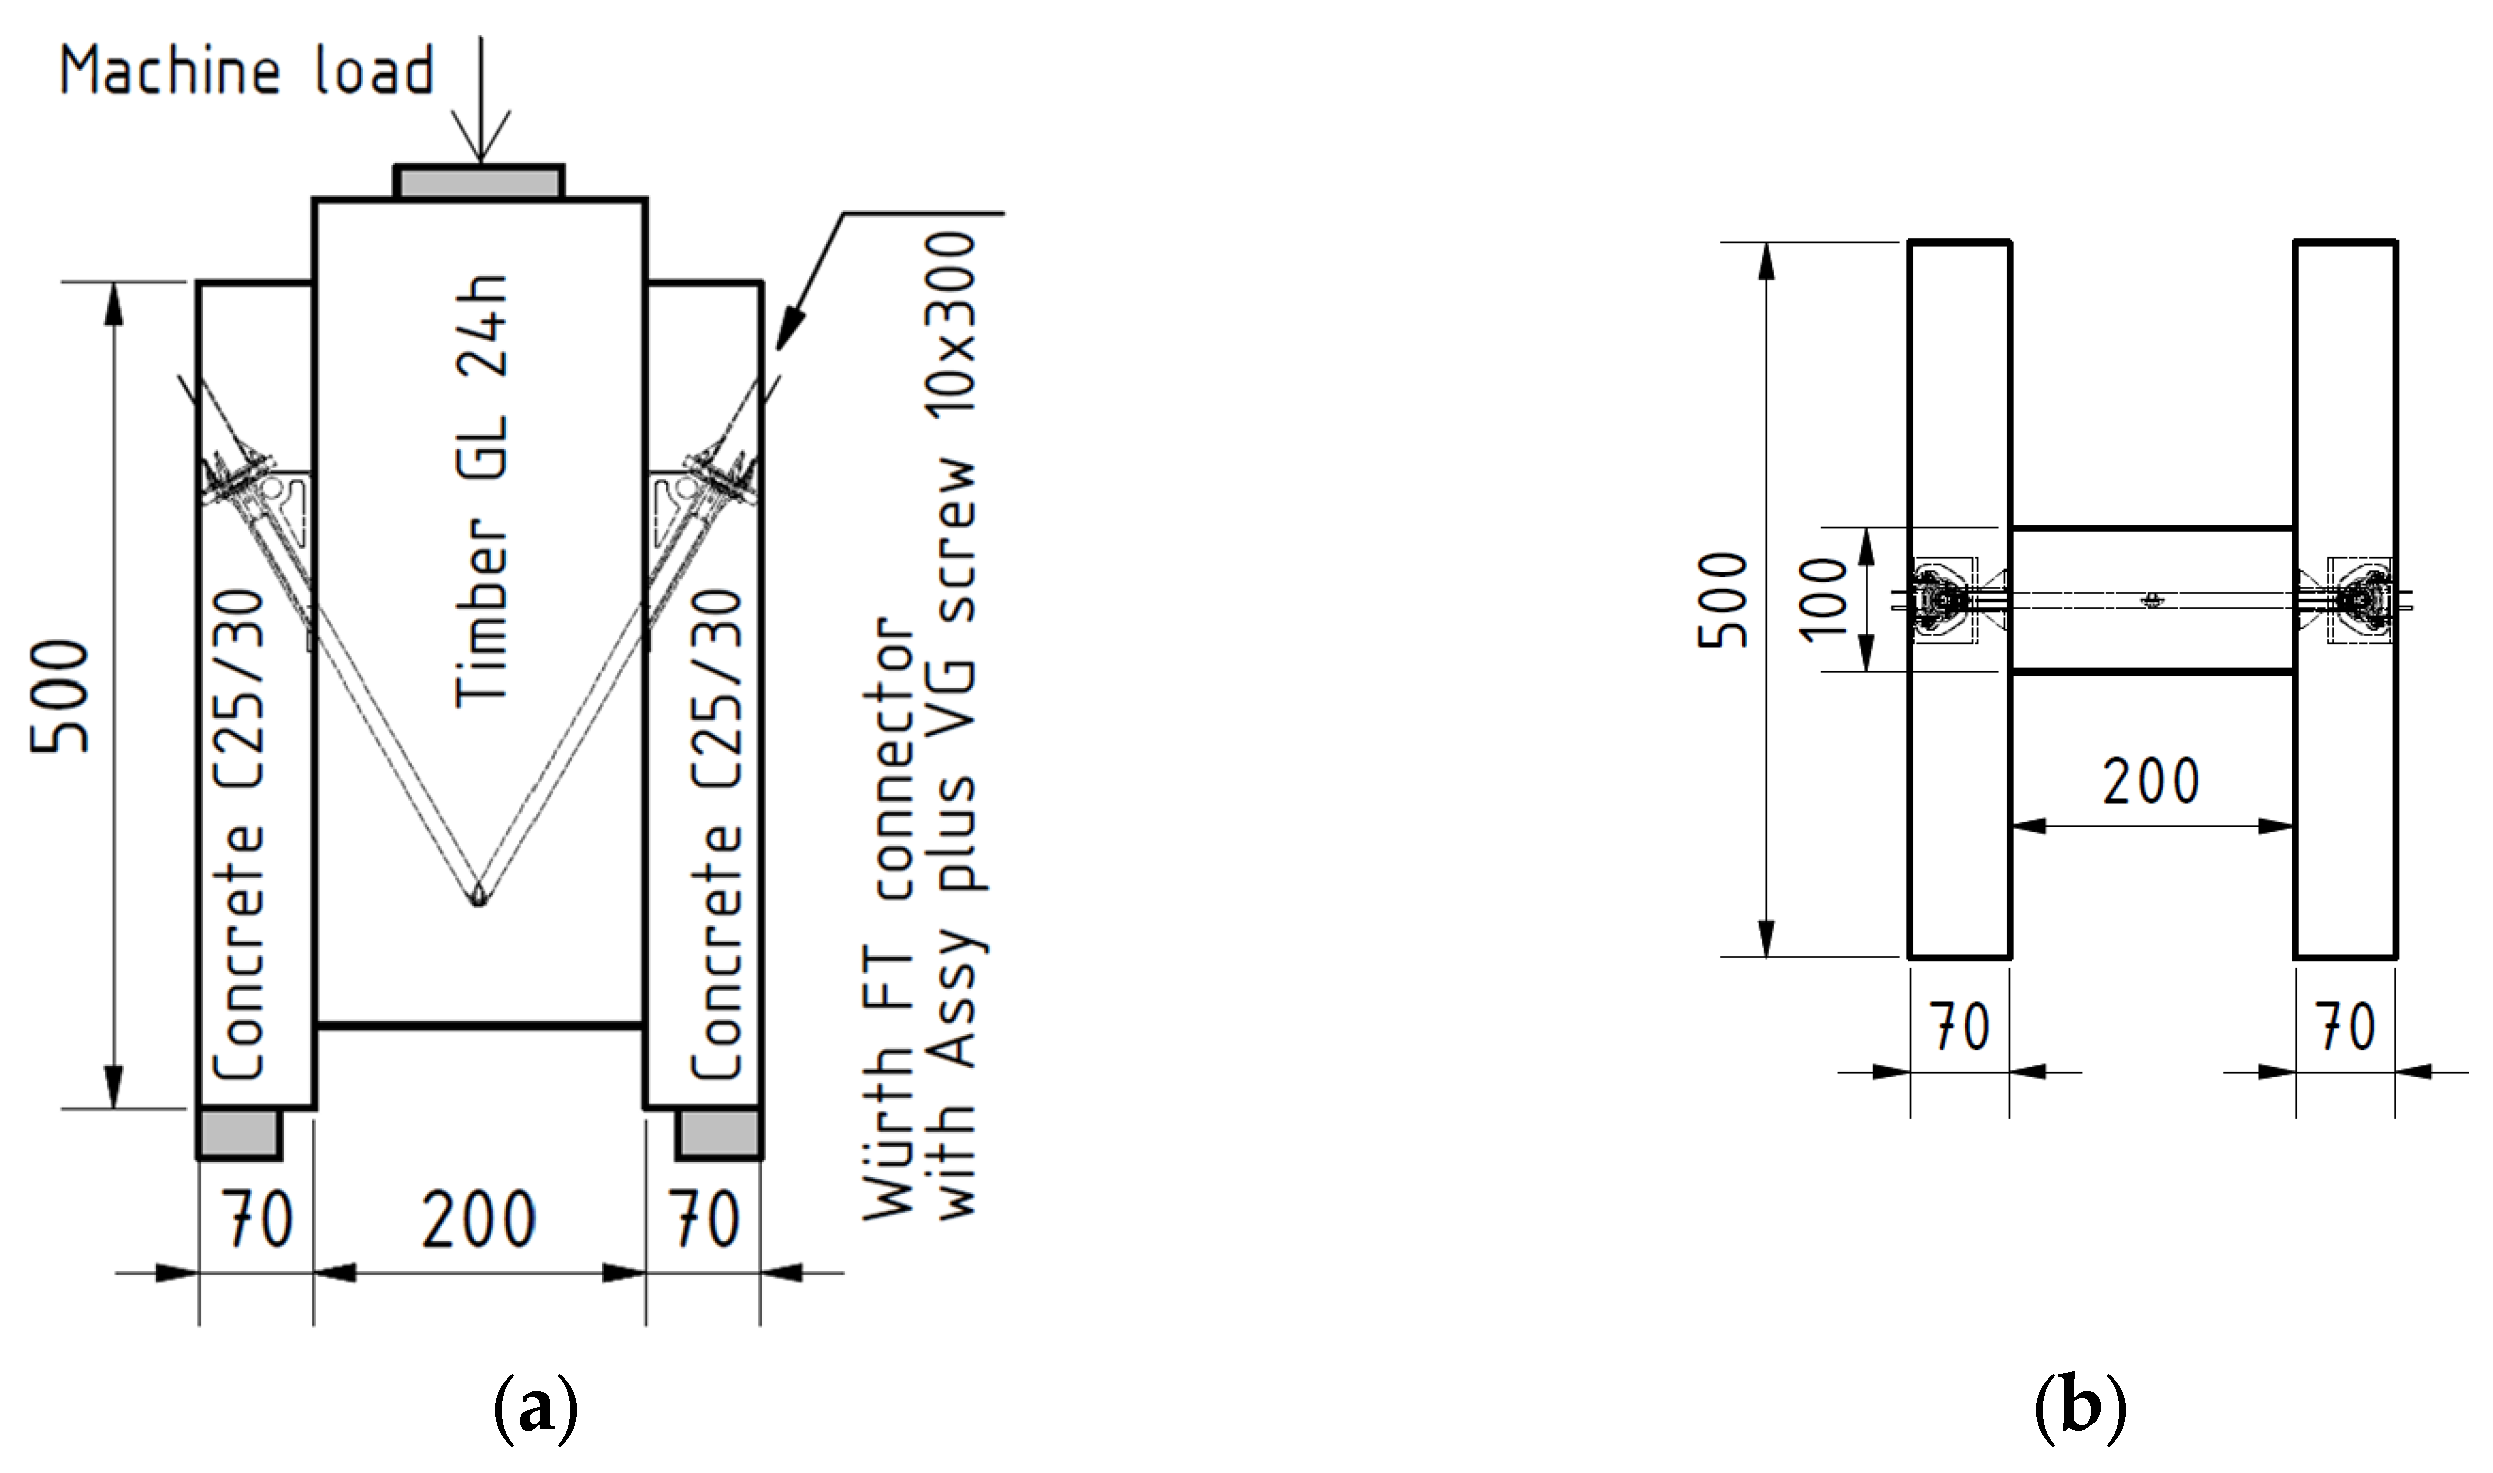
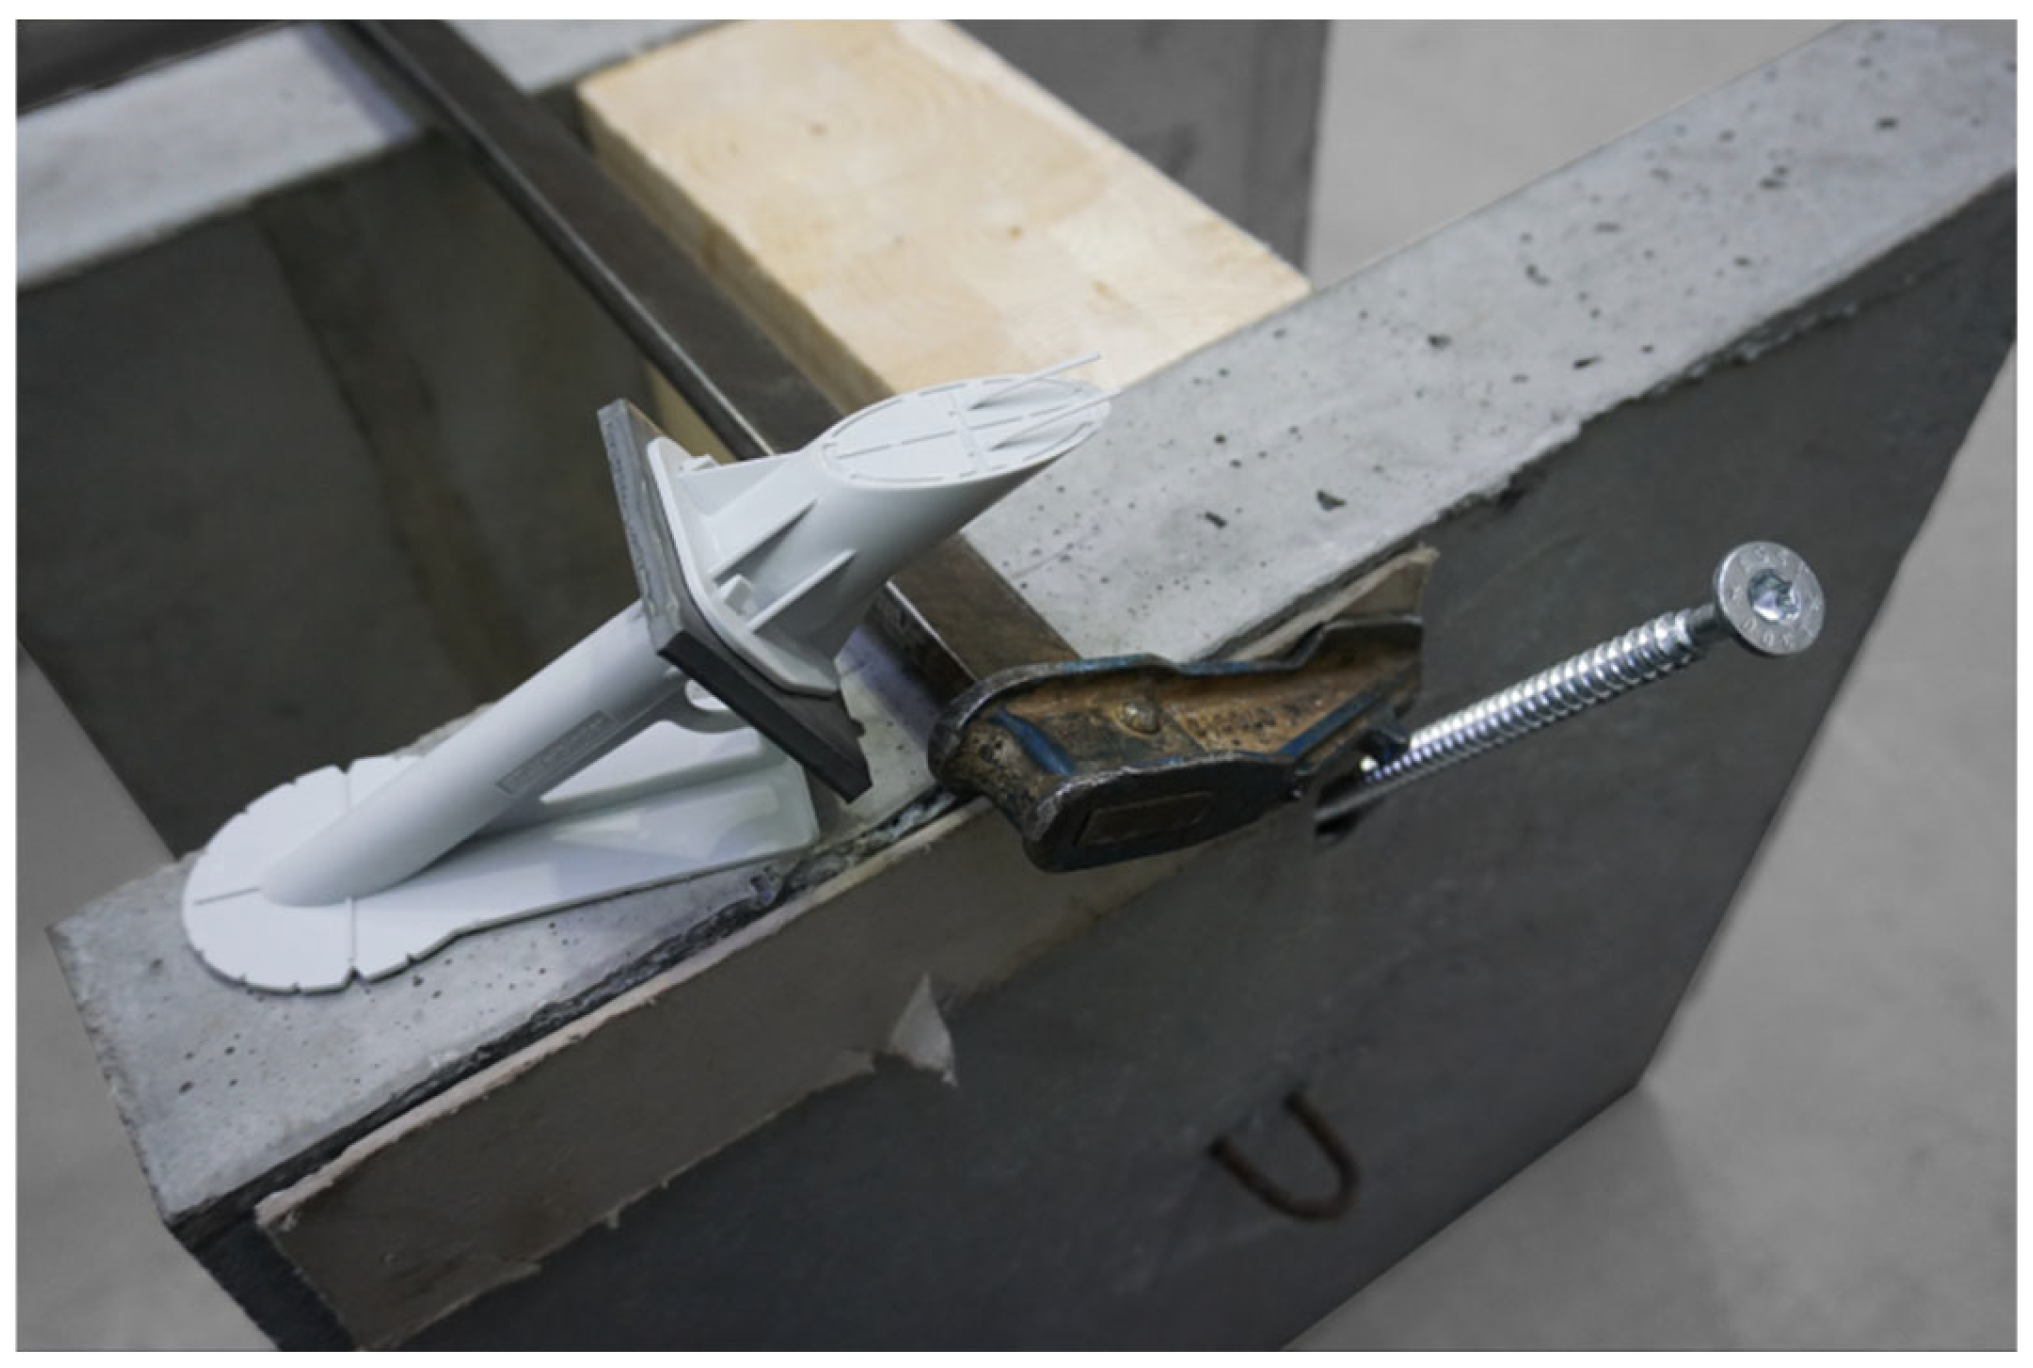
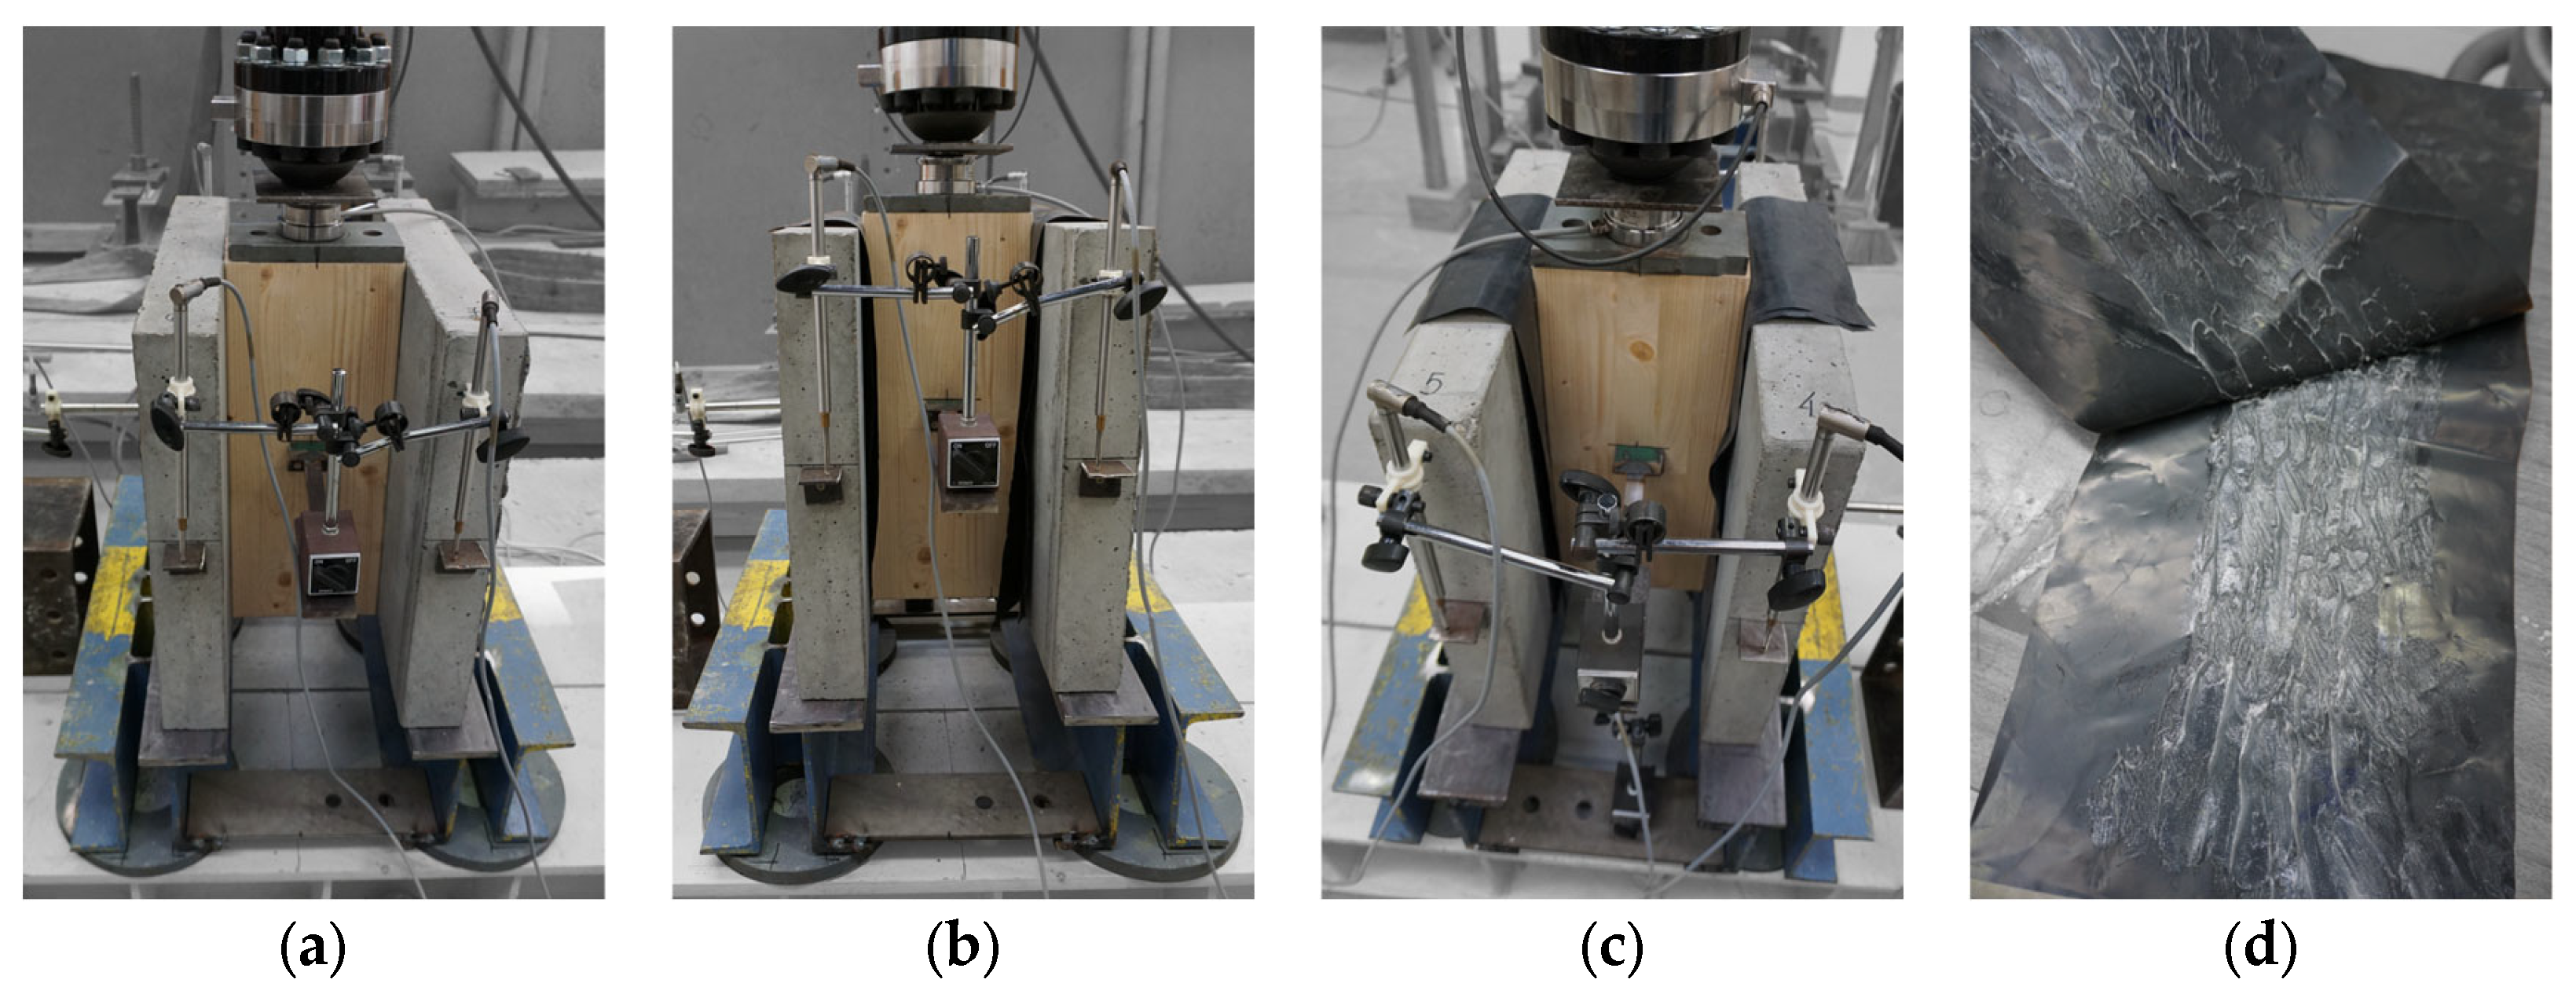
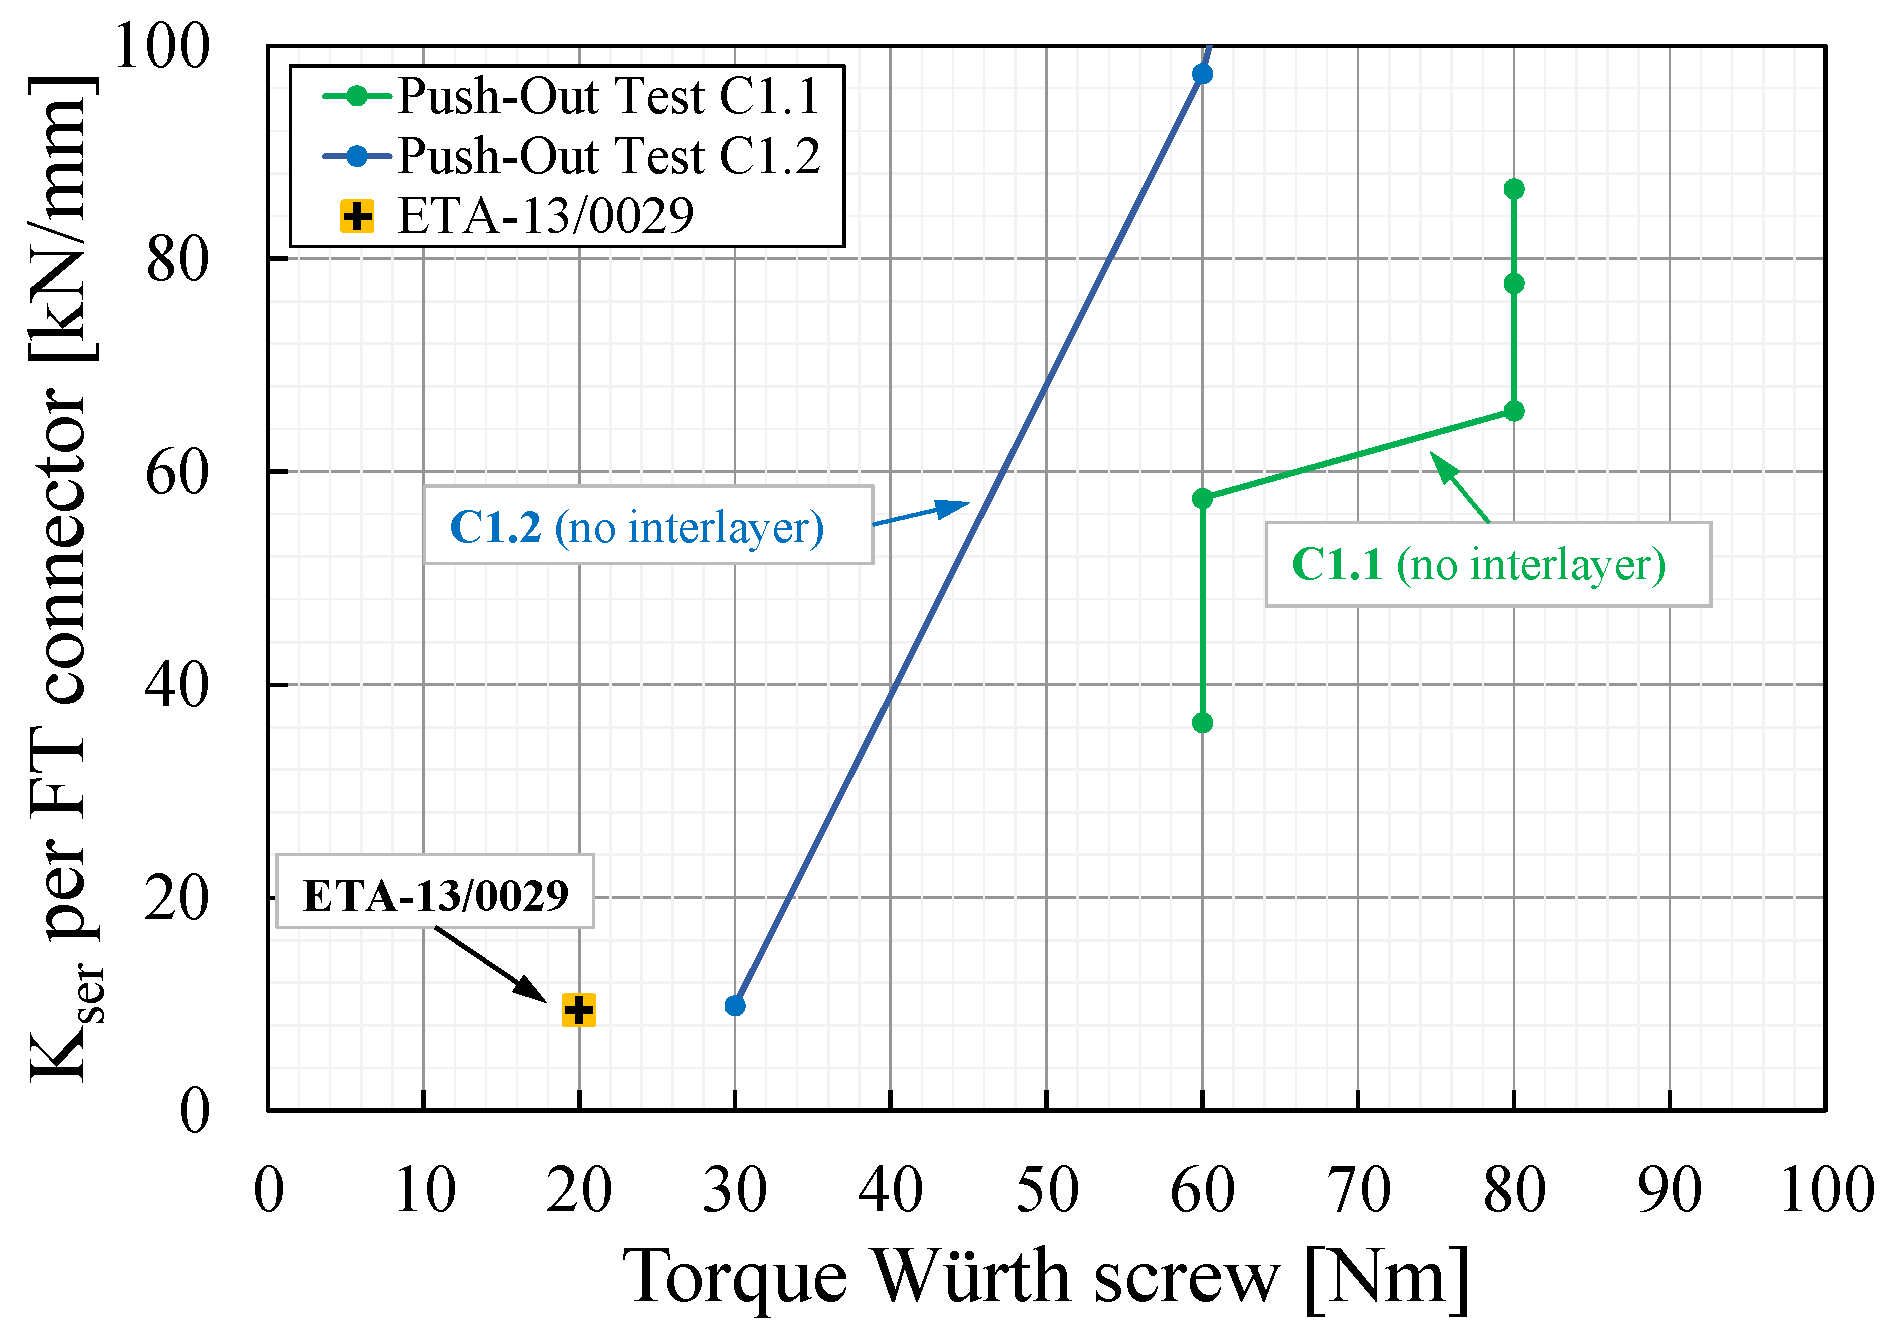
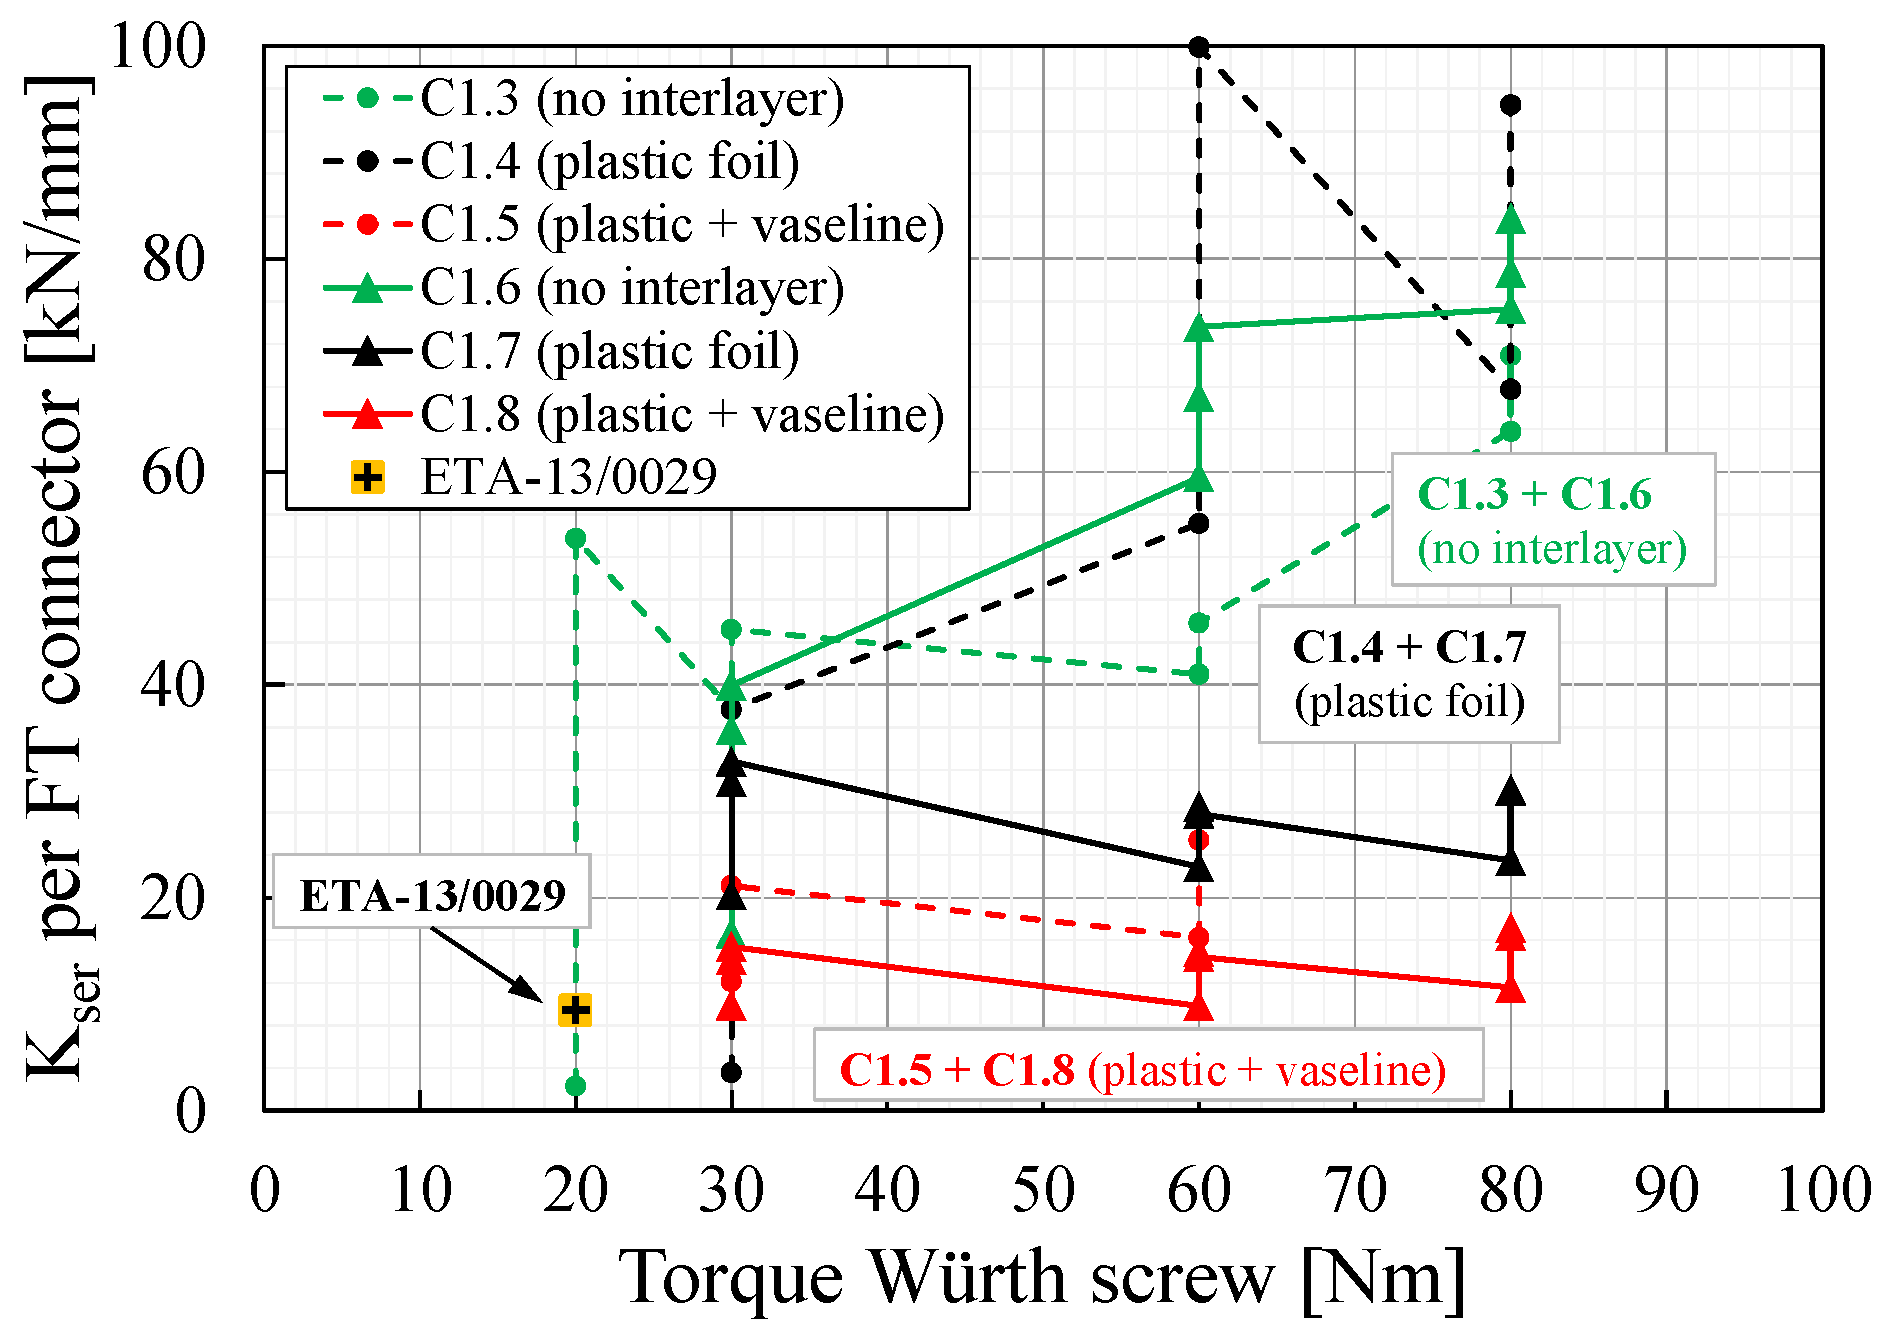
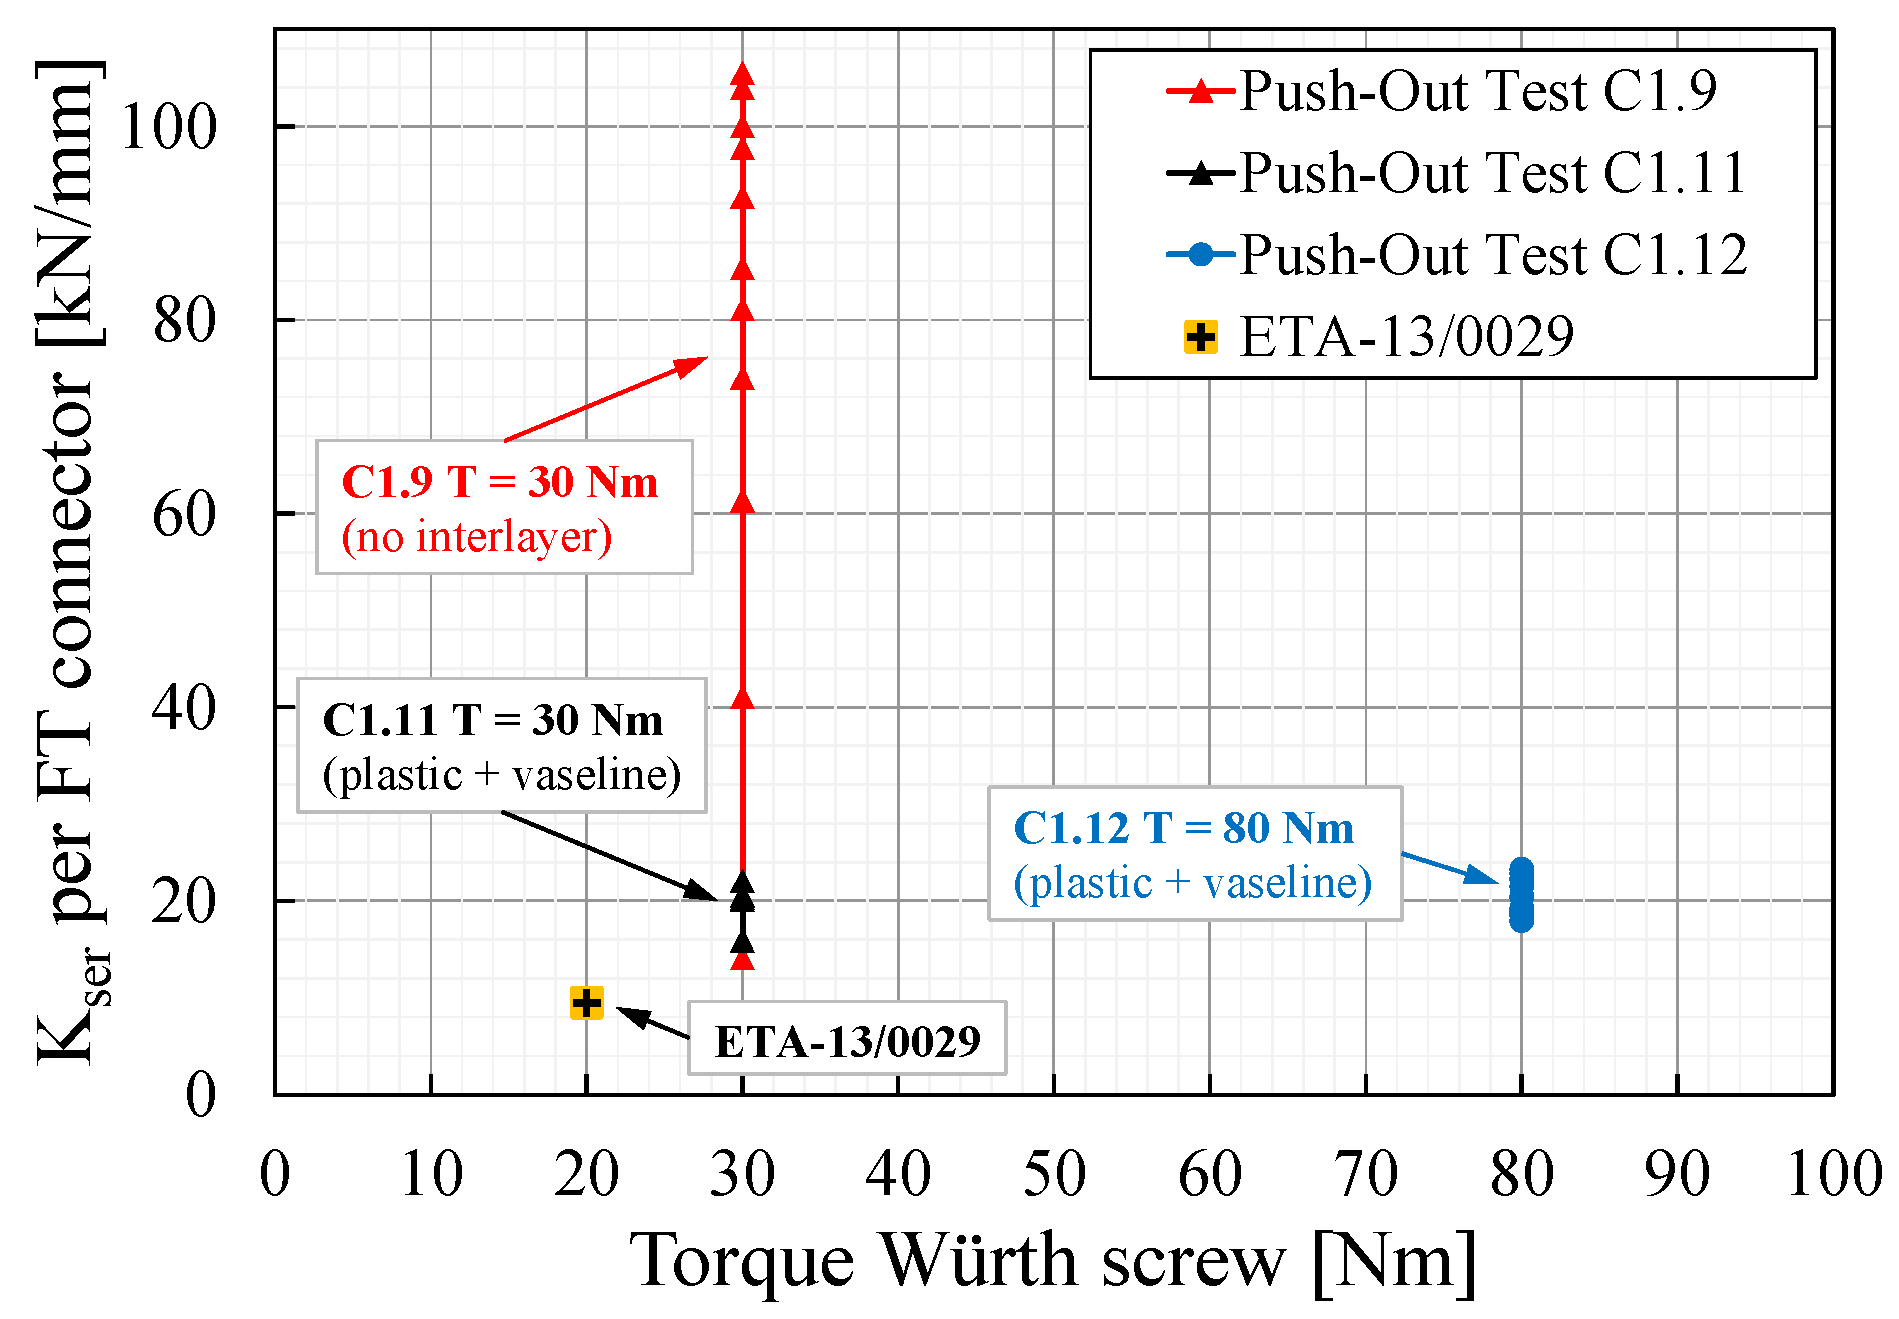
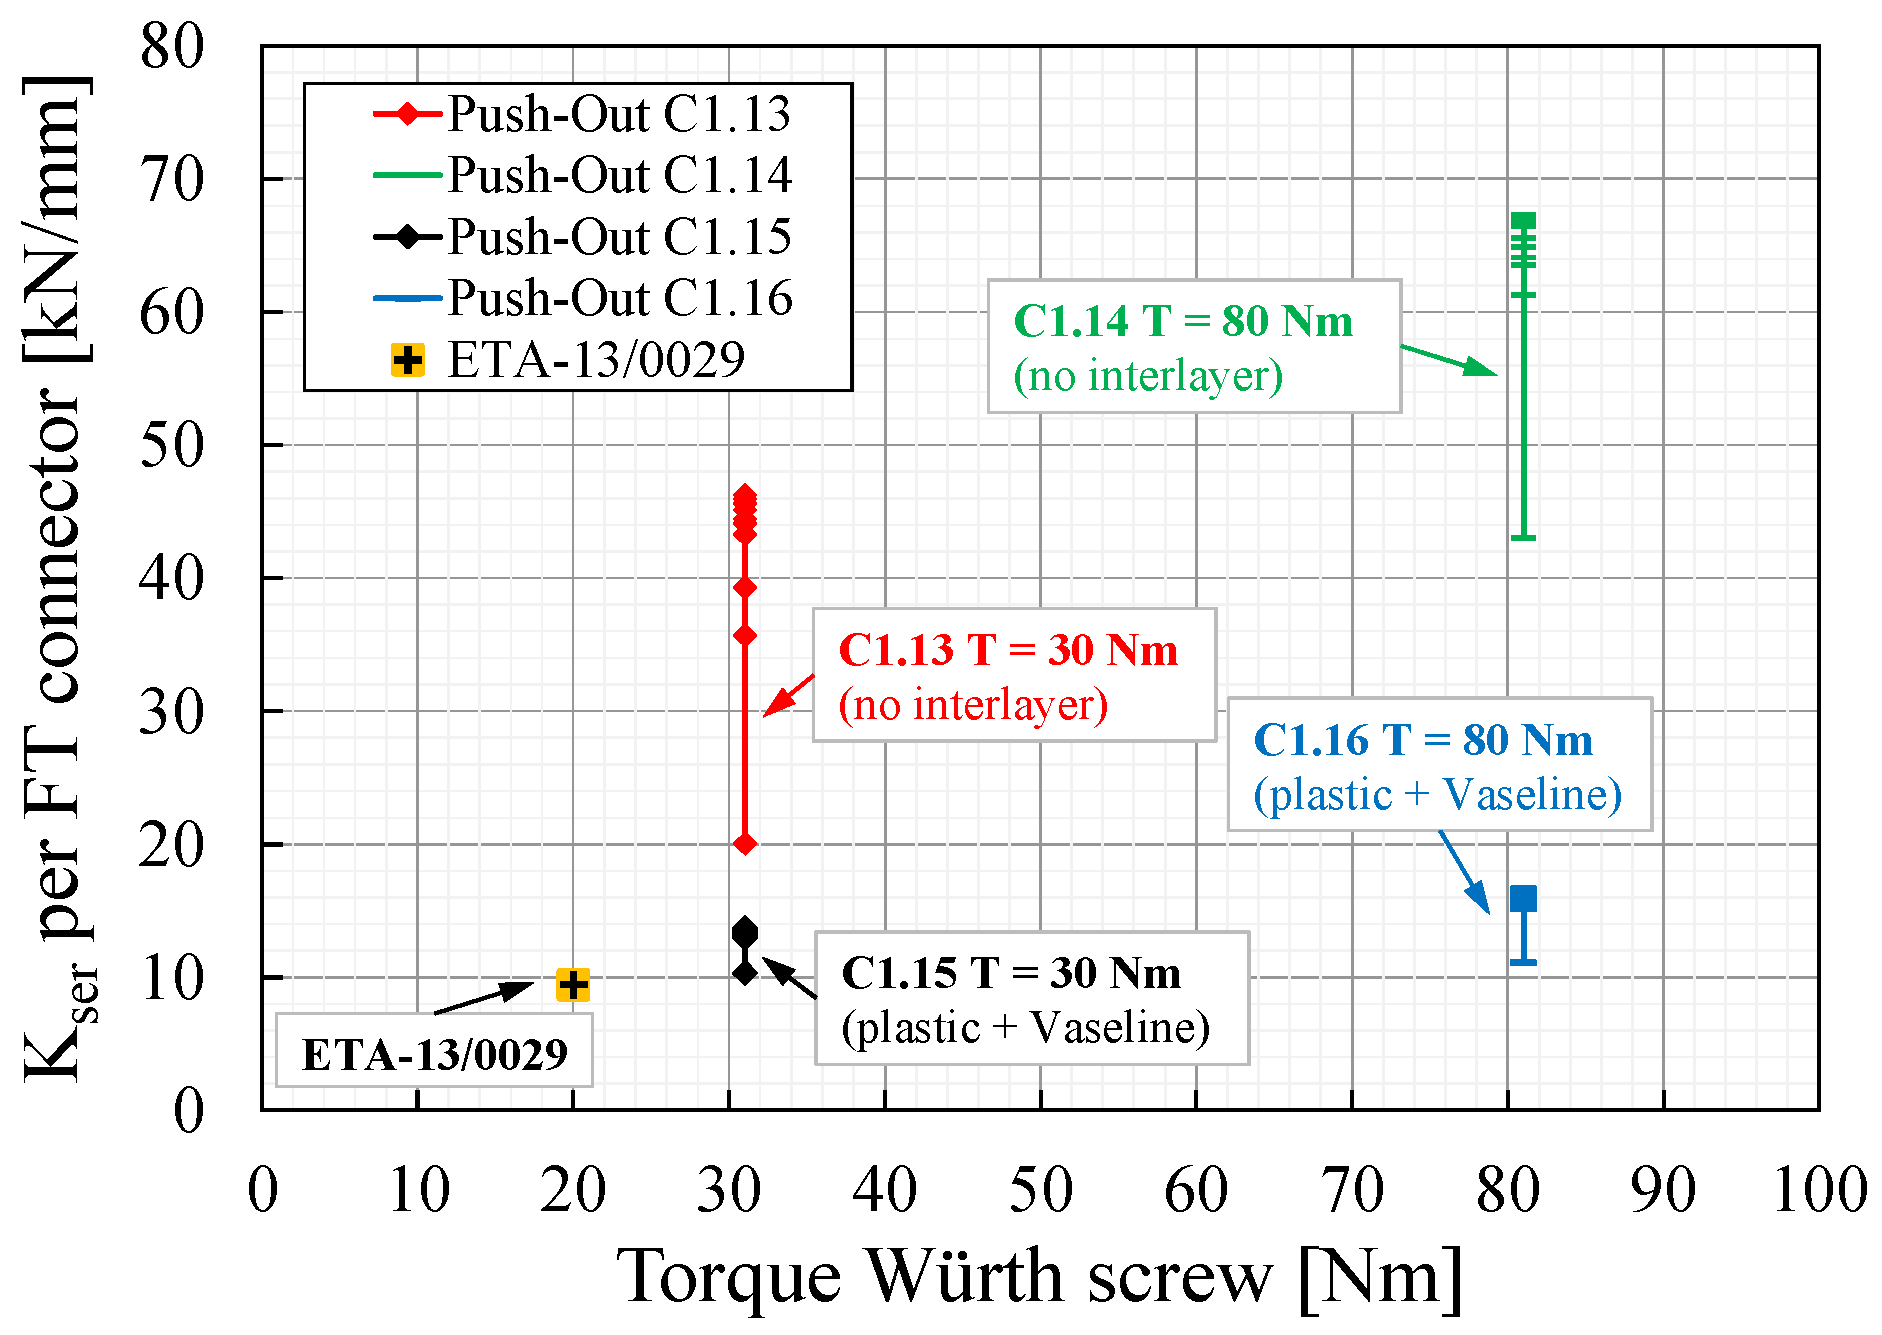
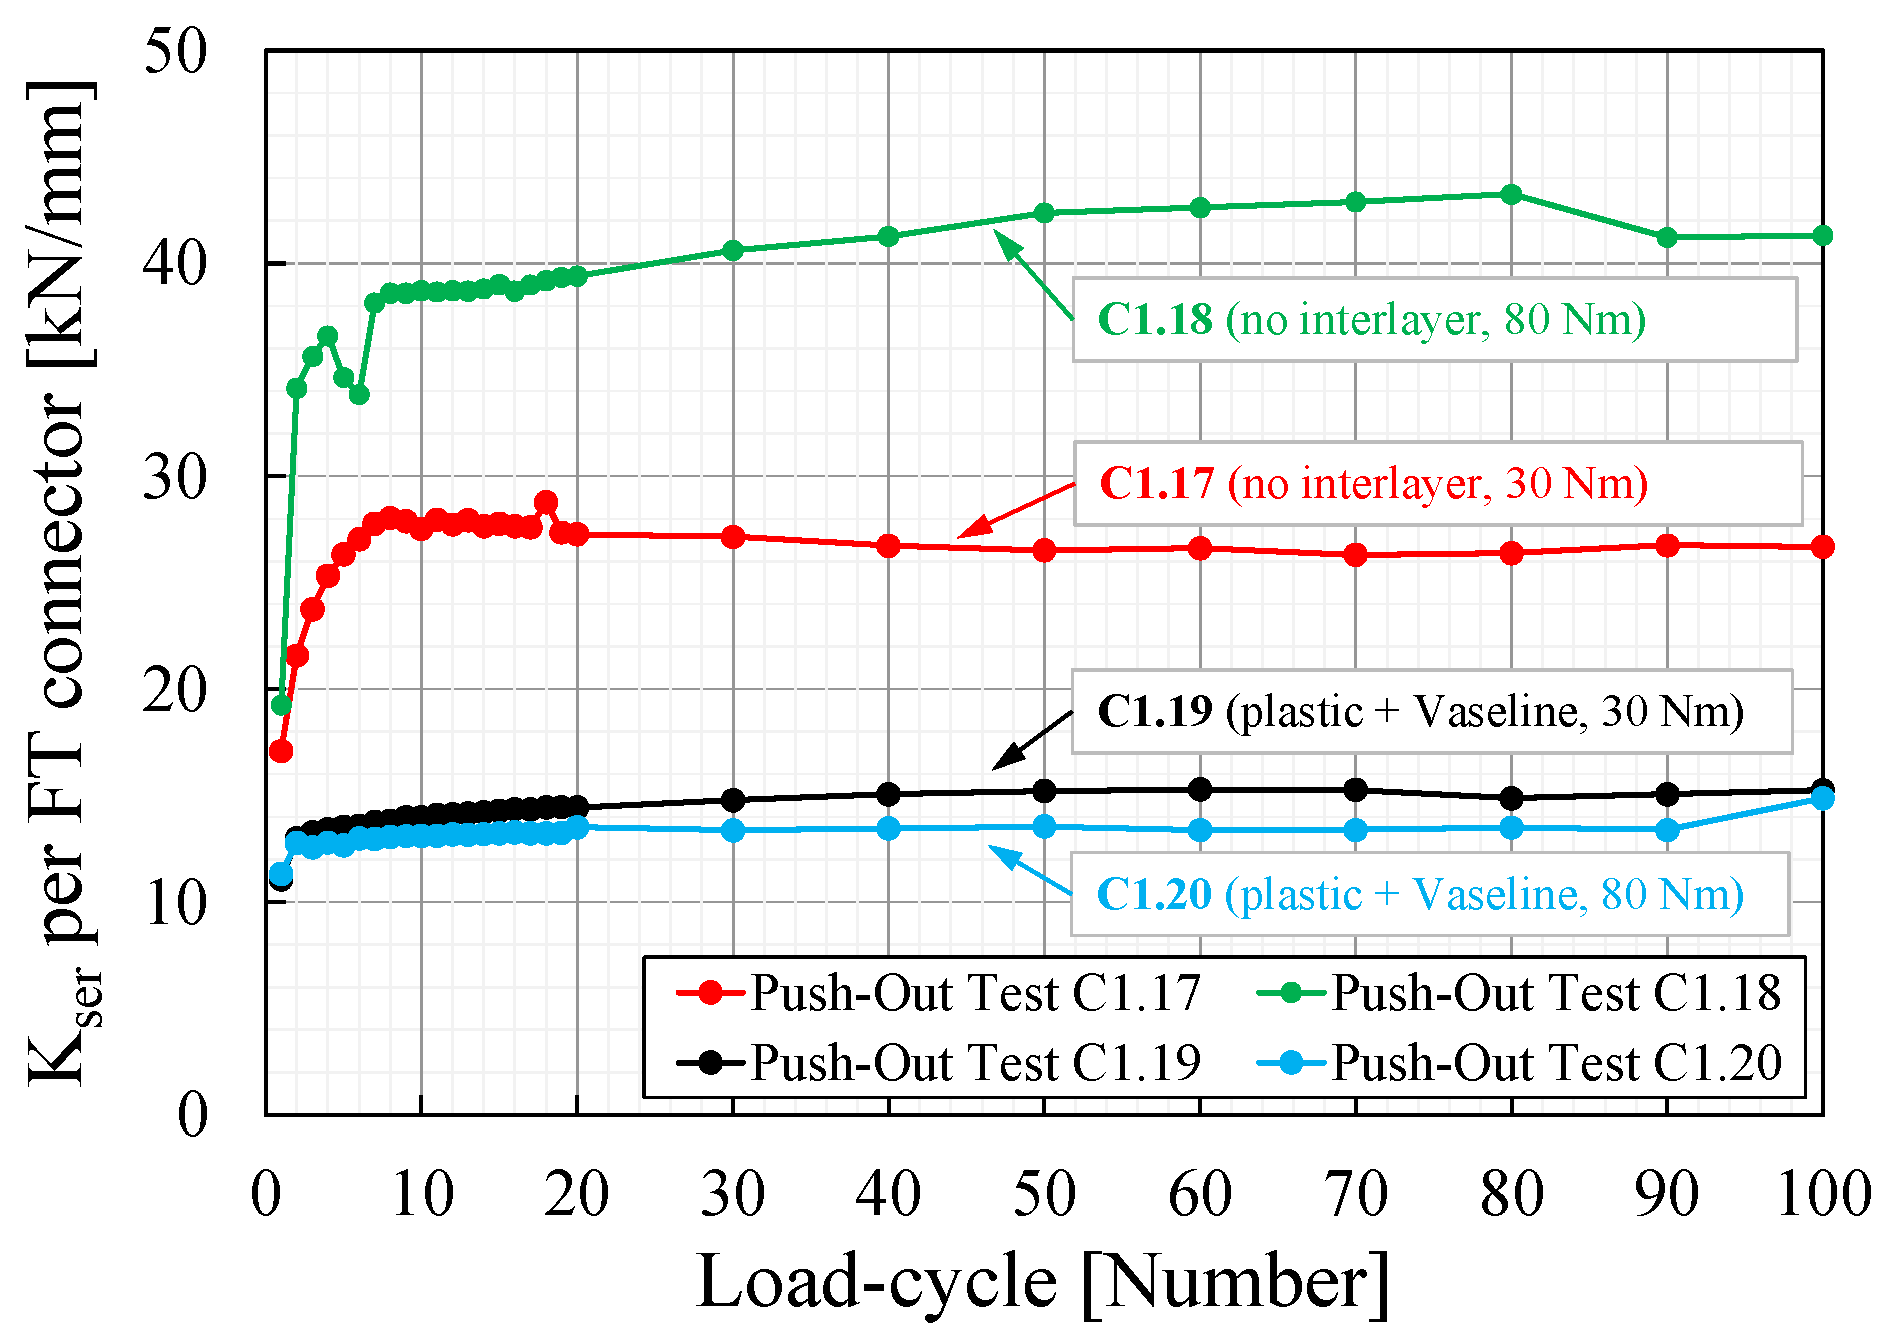
3.1. Test Series C1
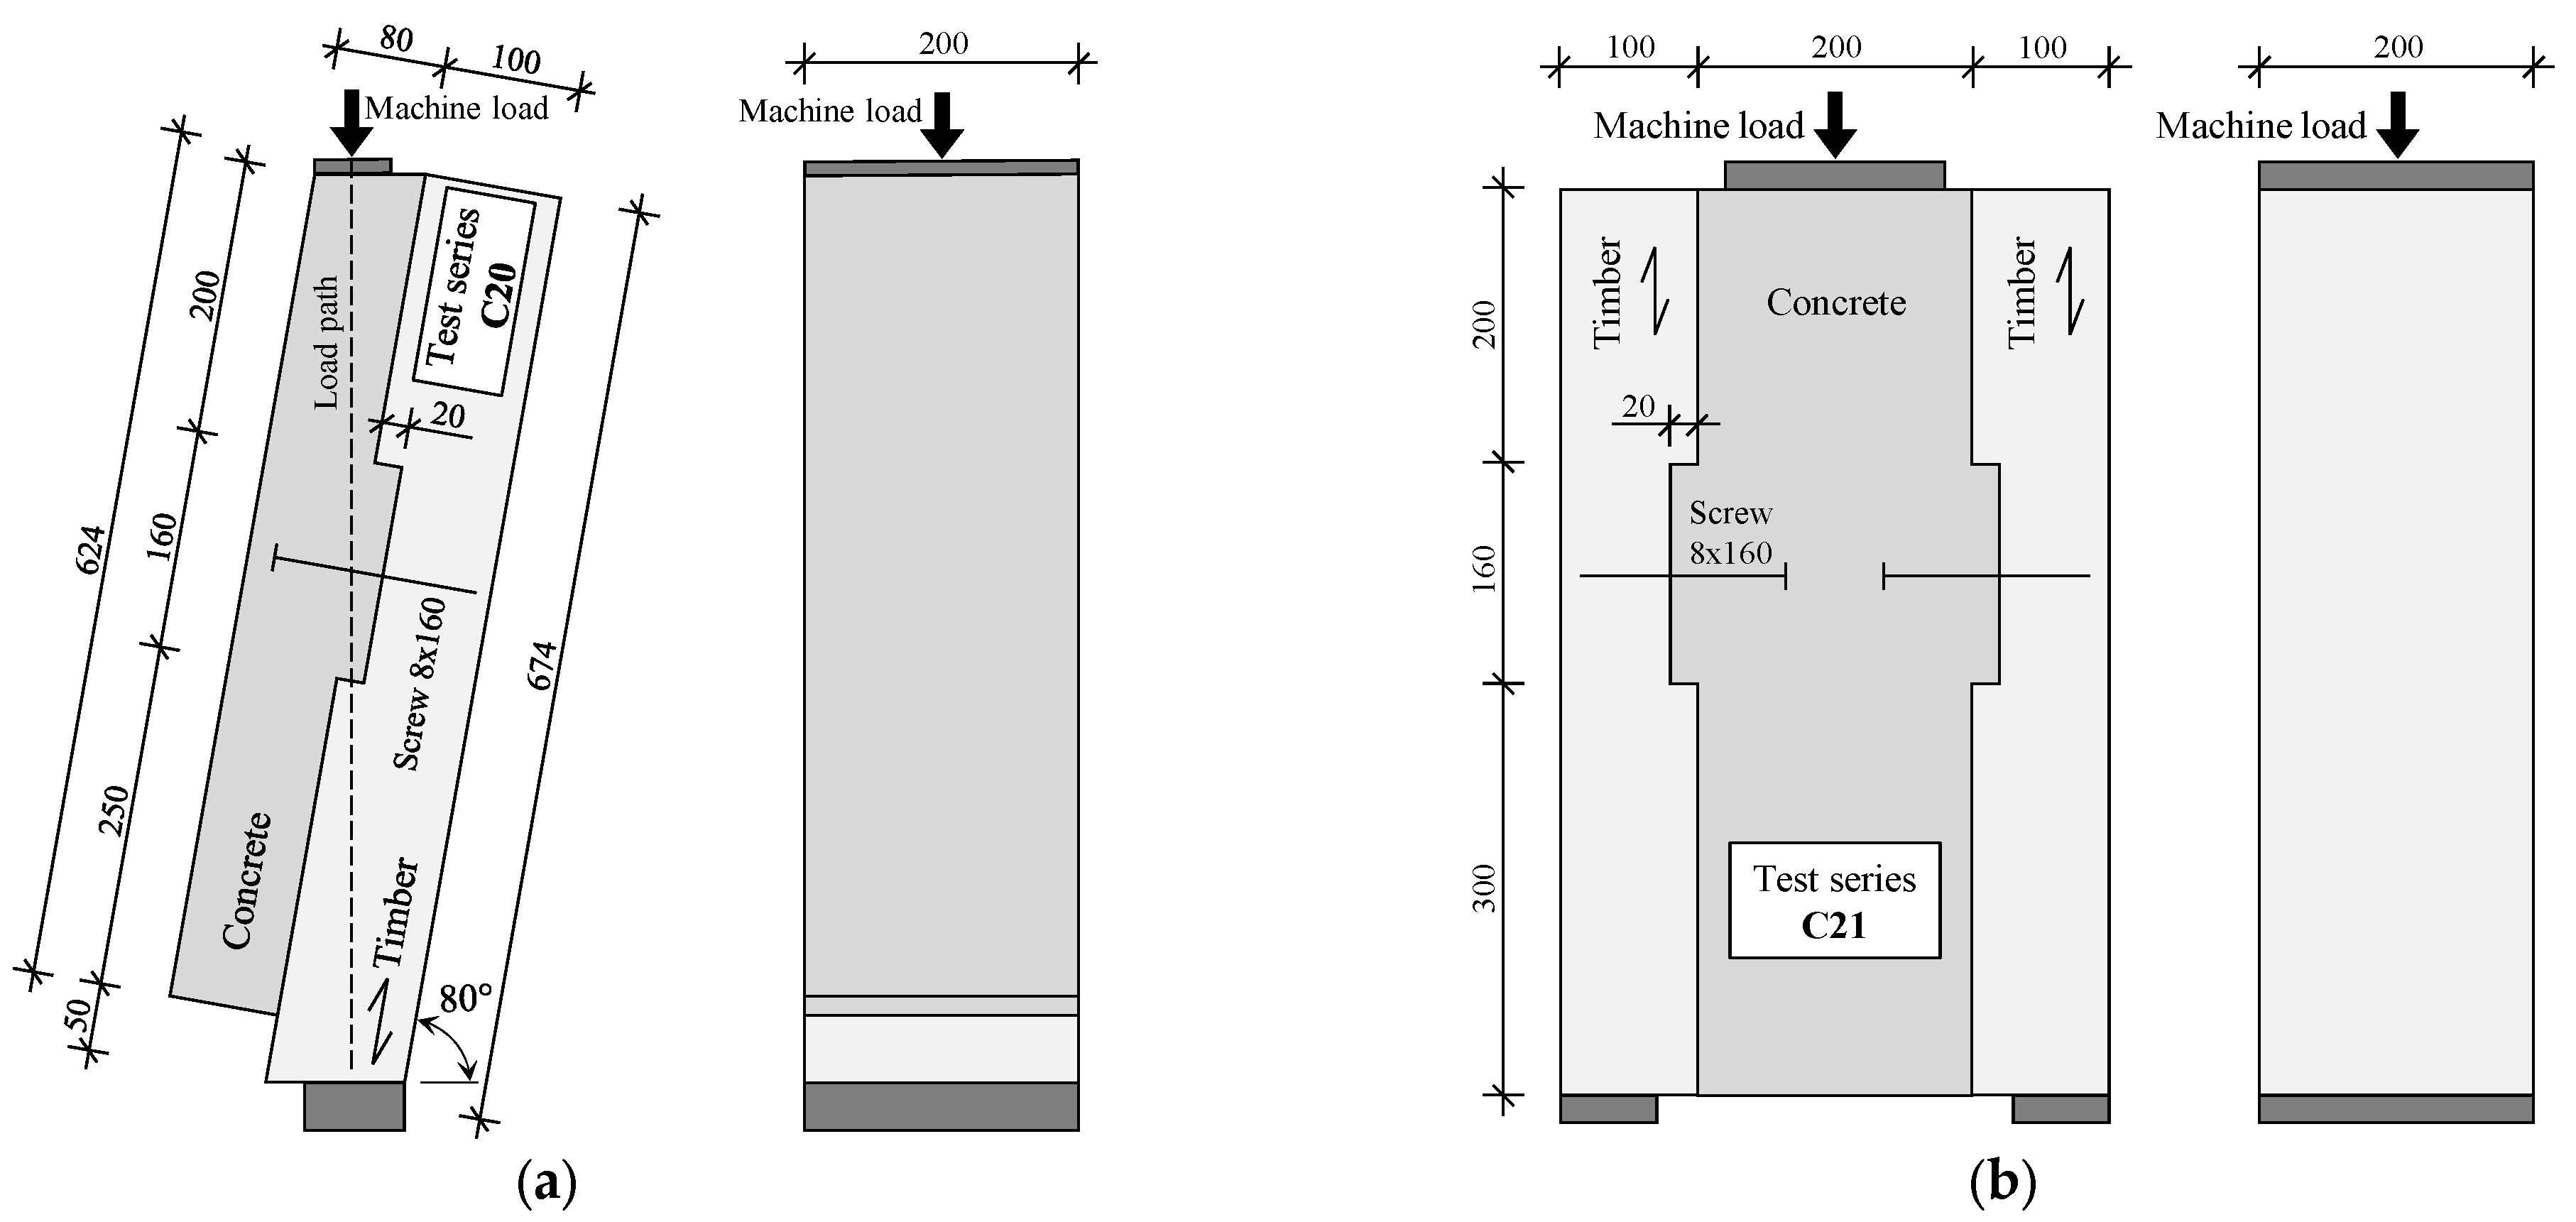
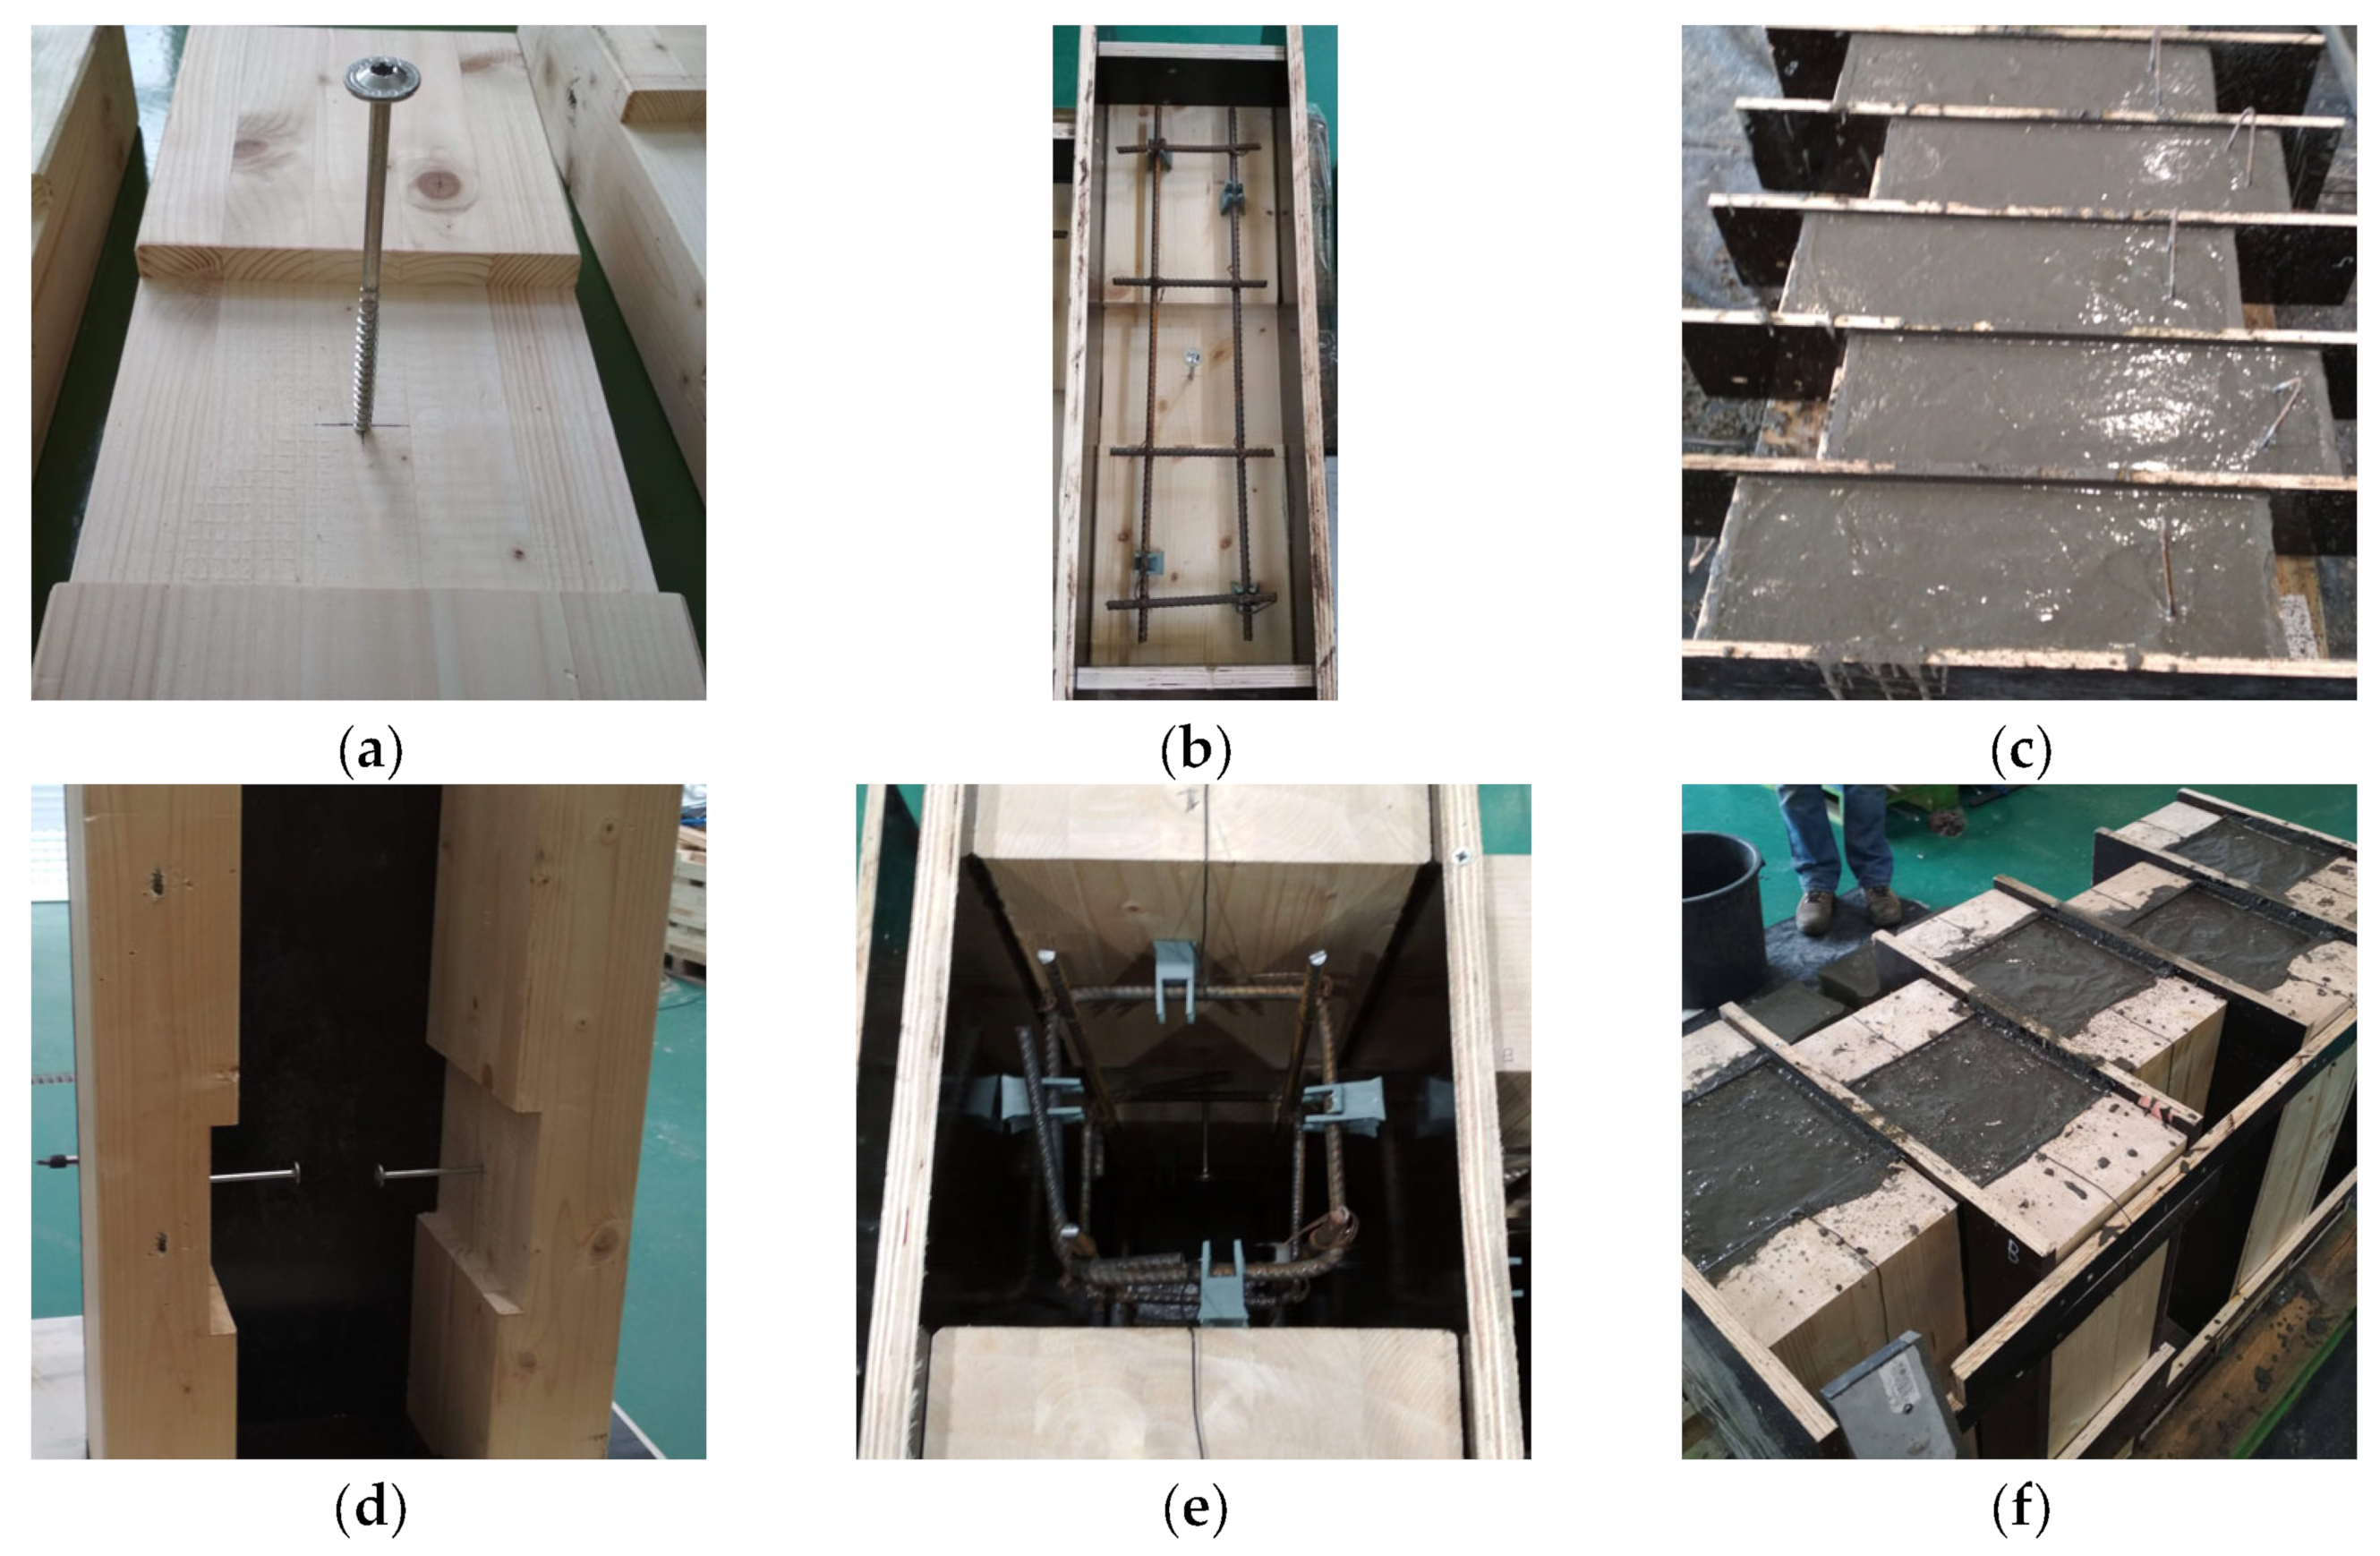
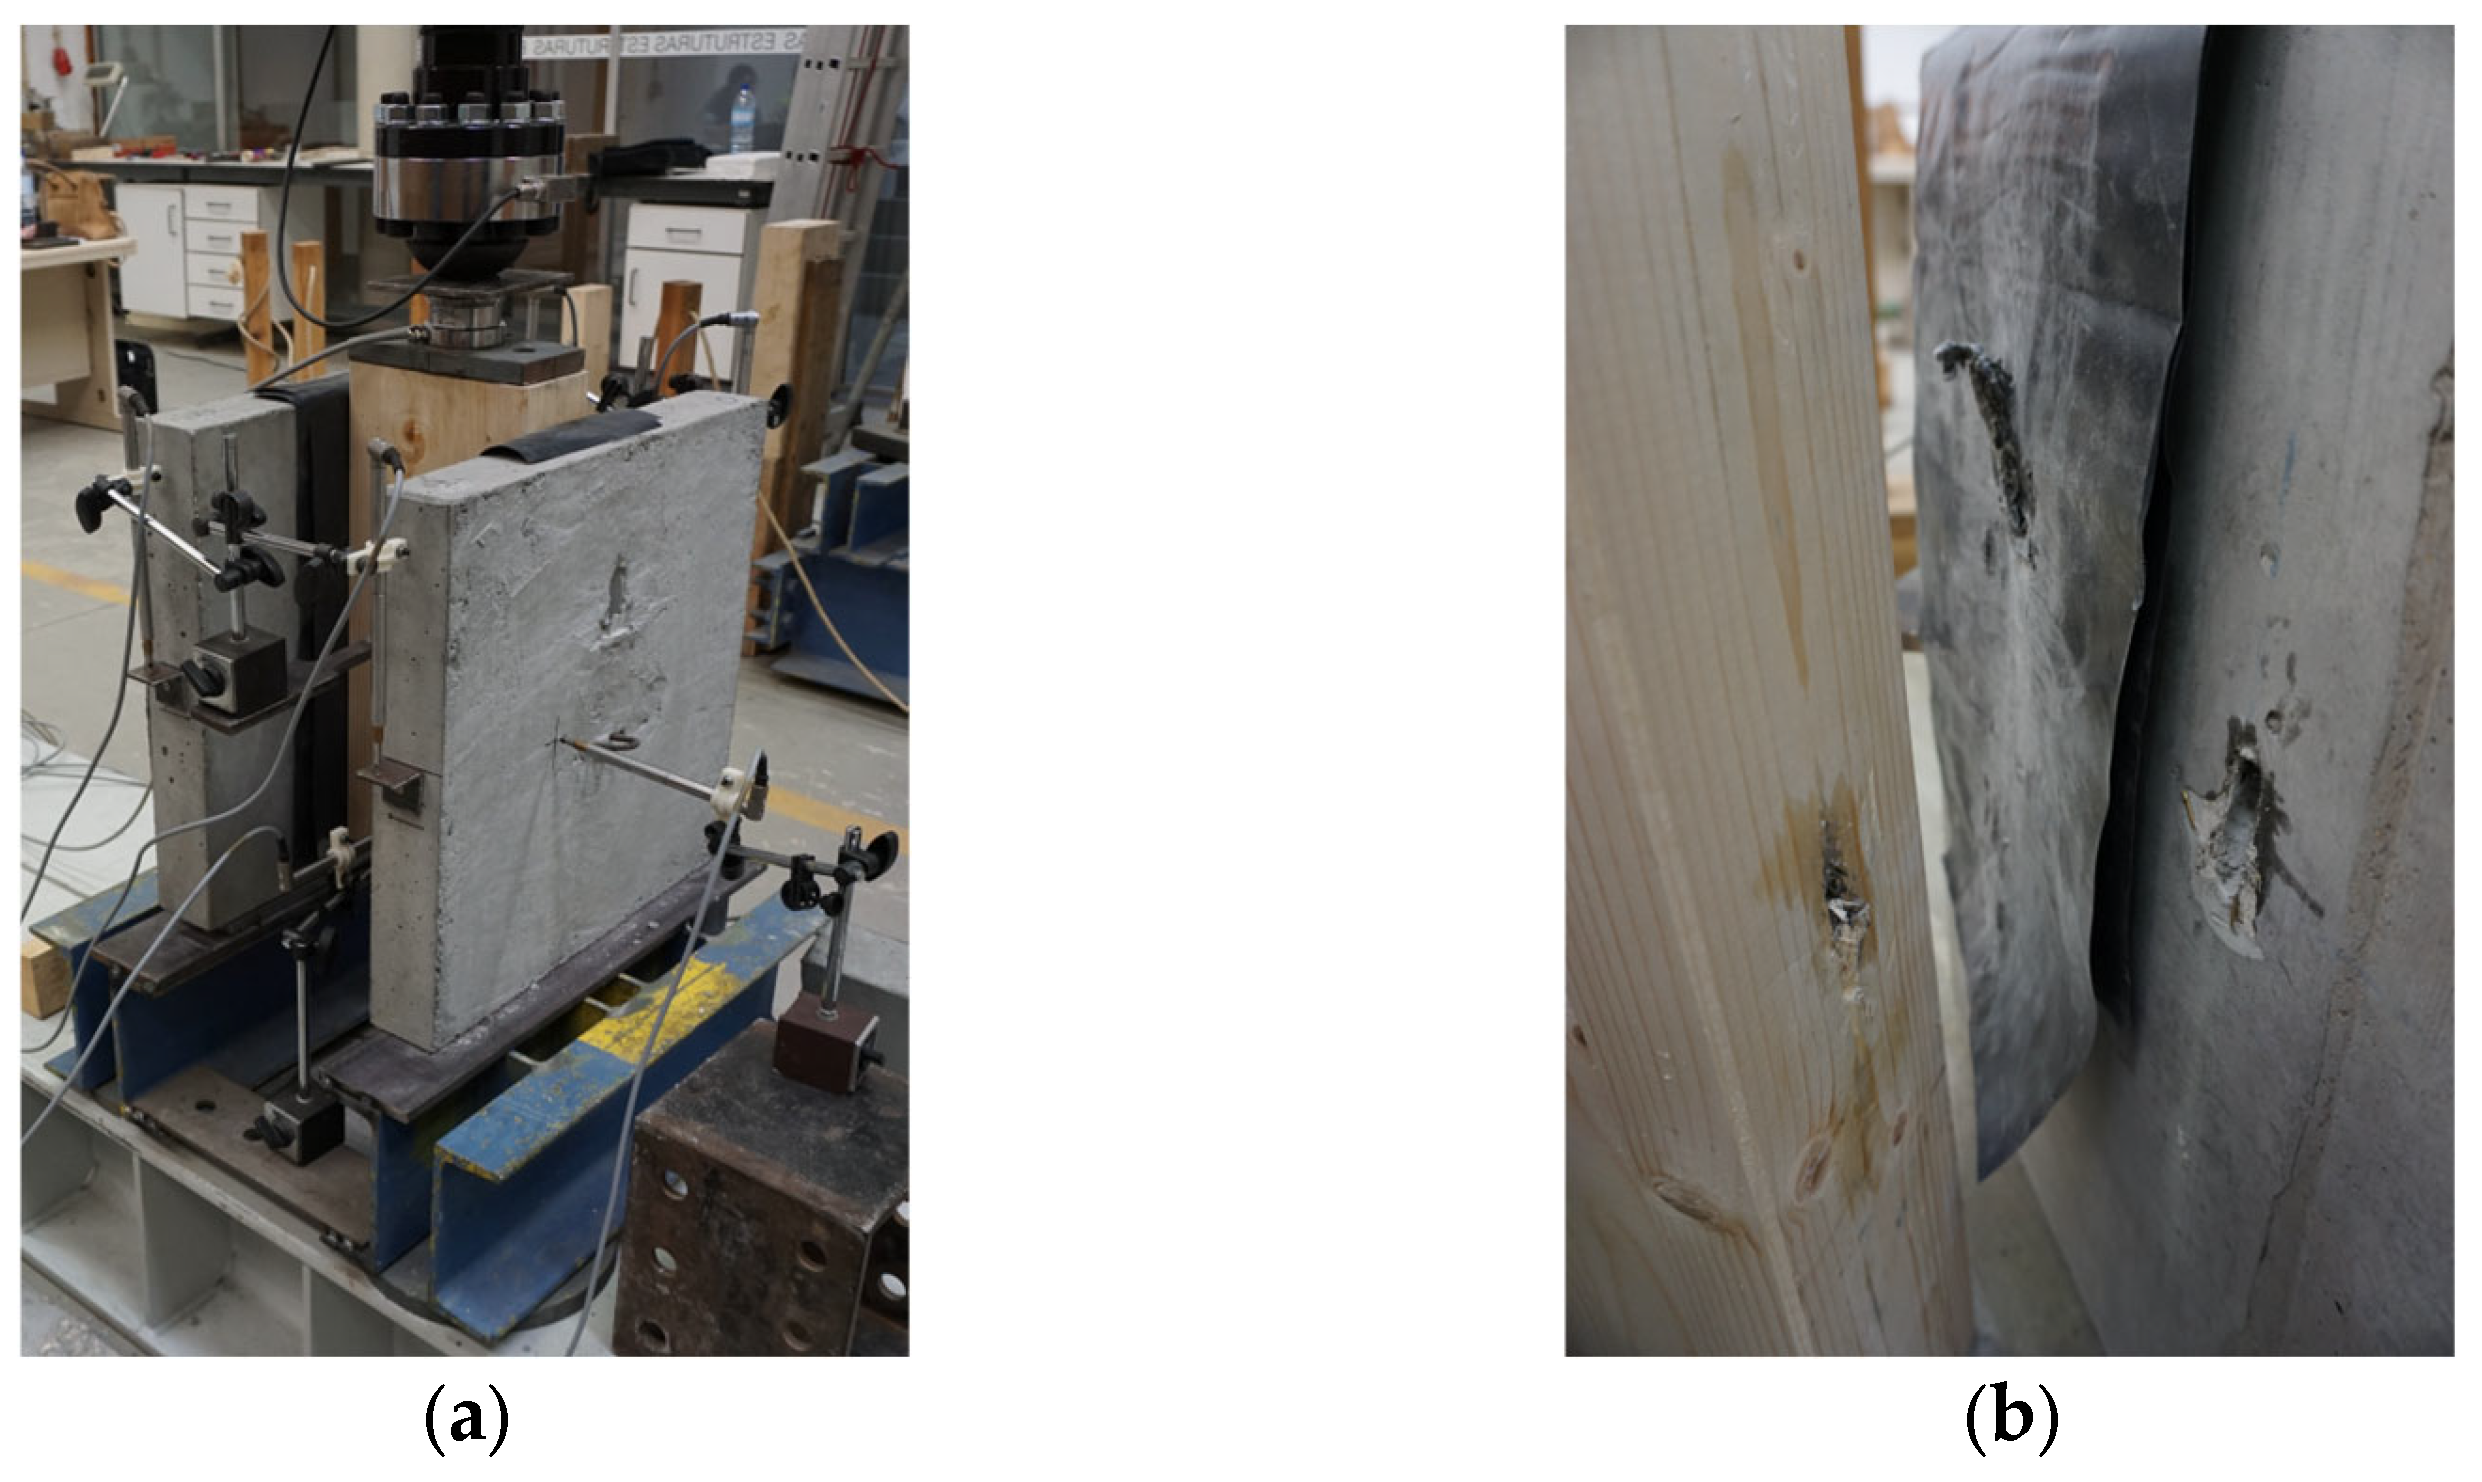
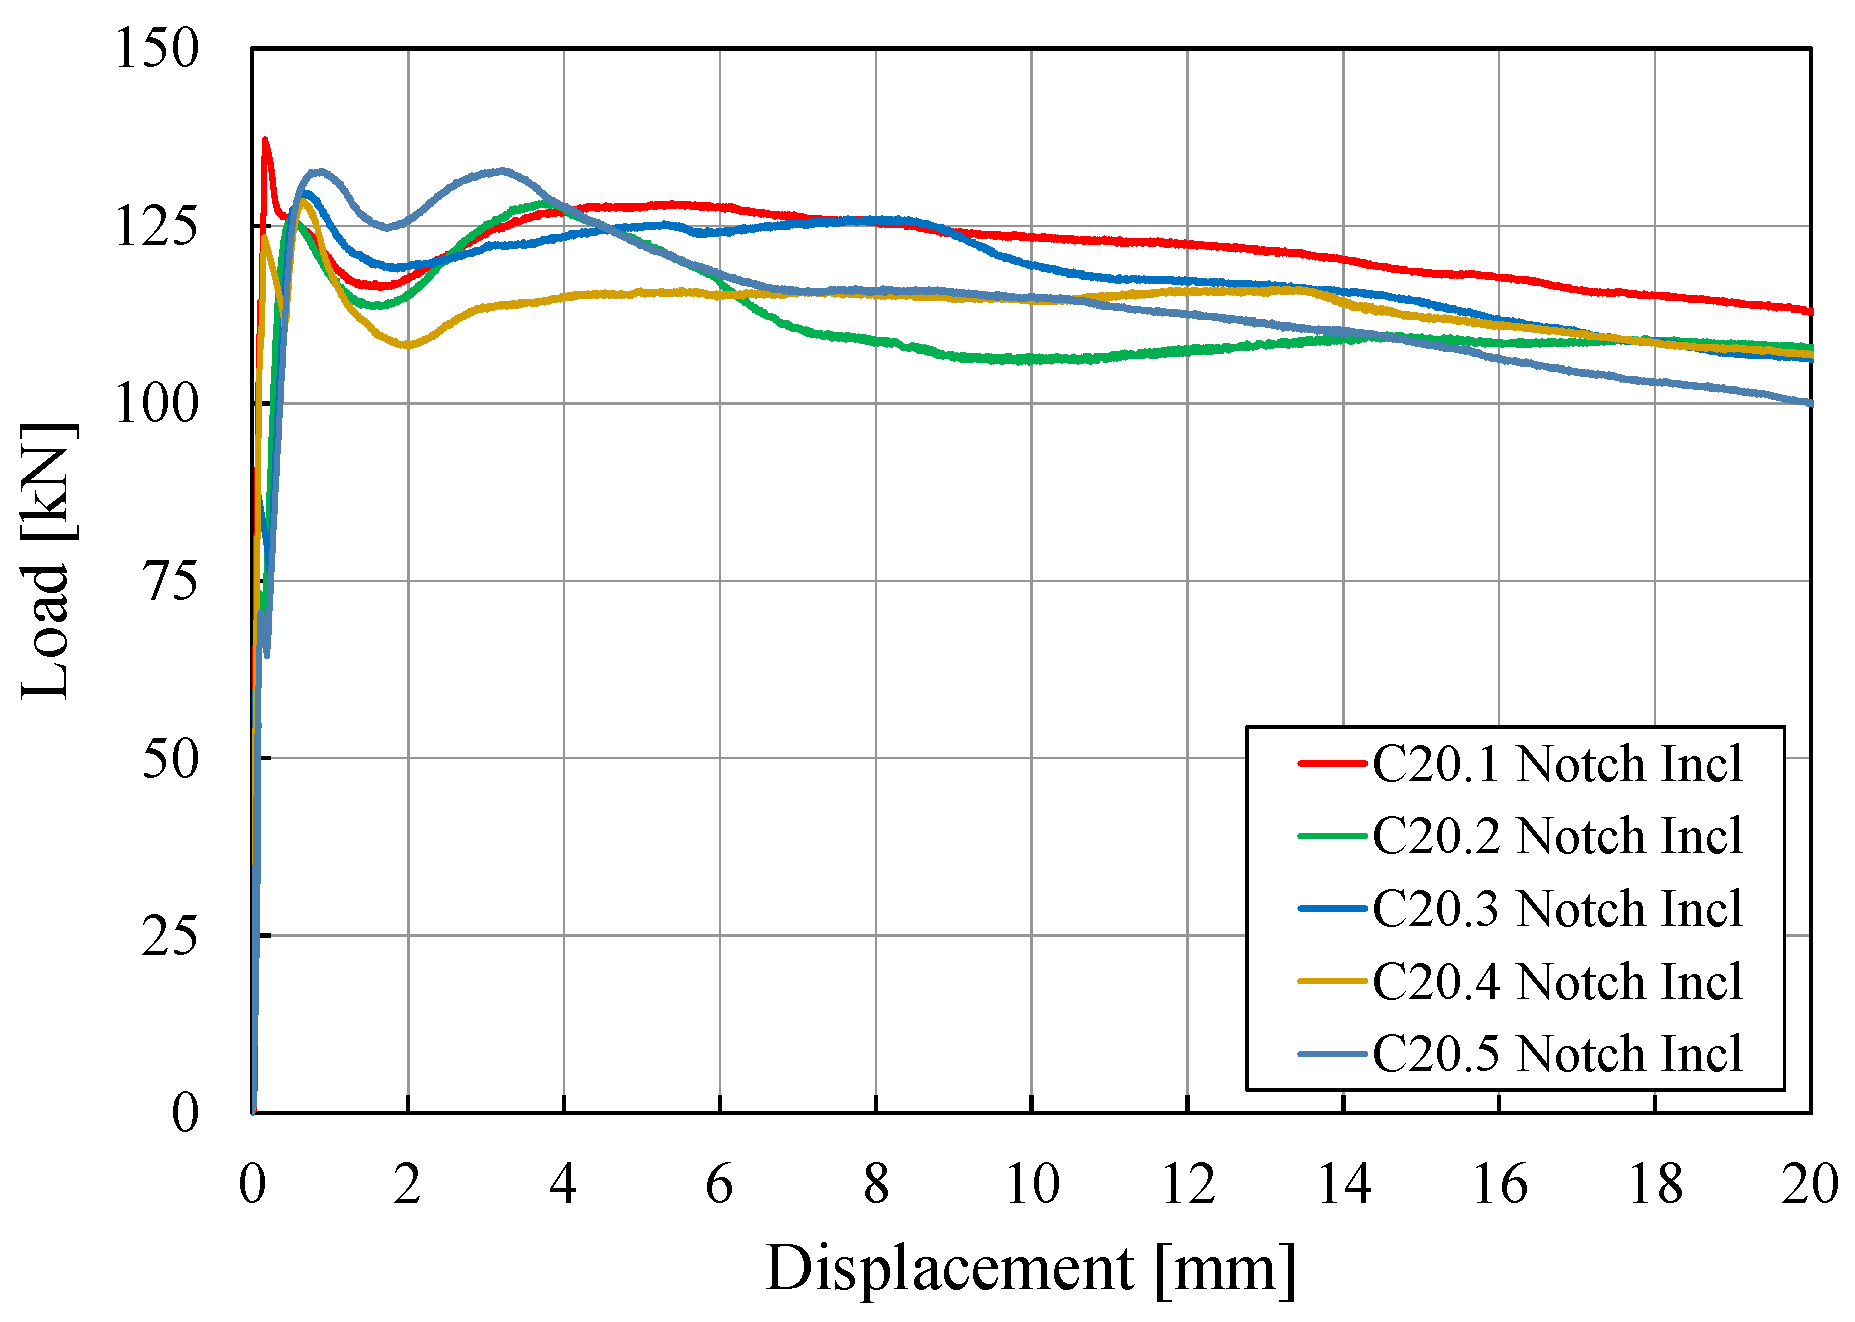
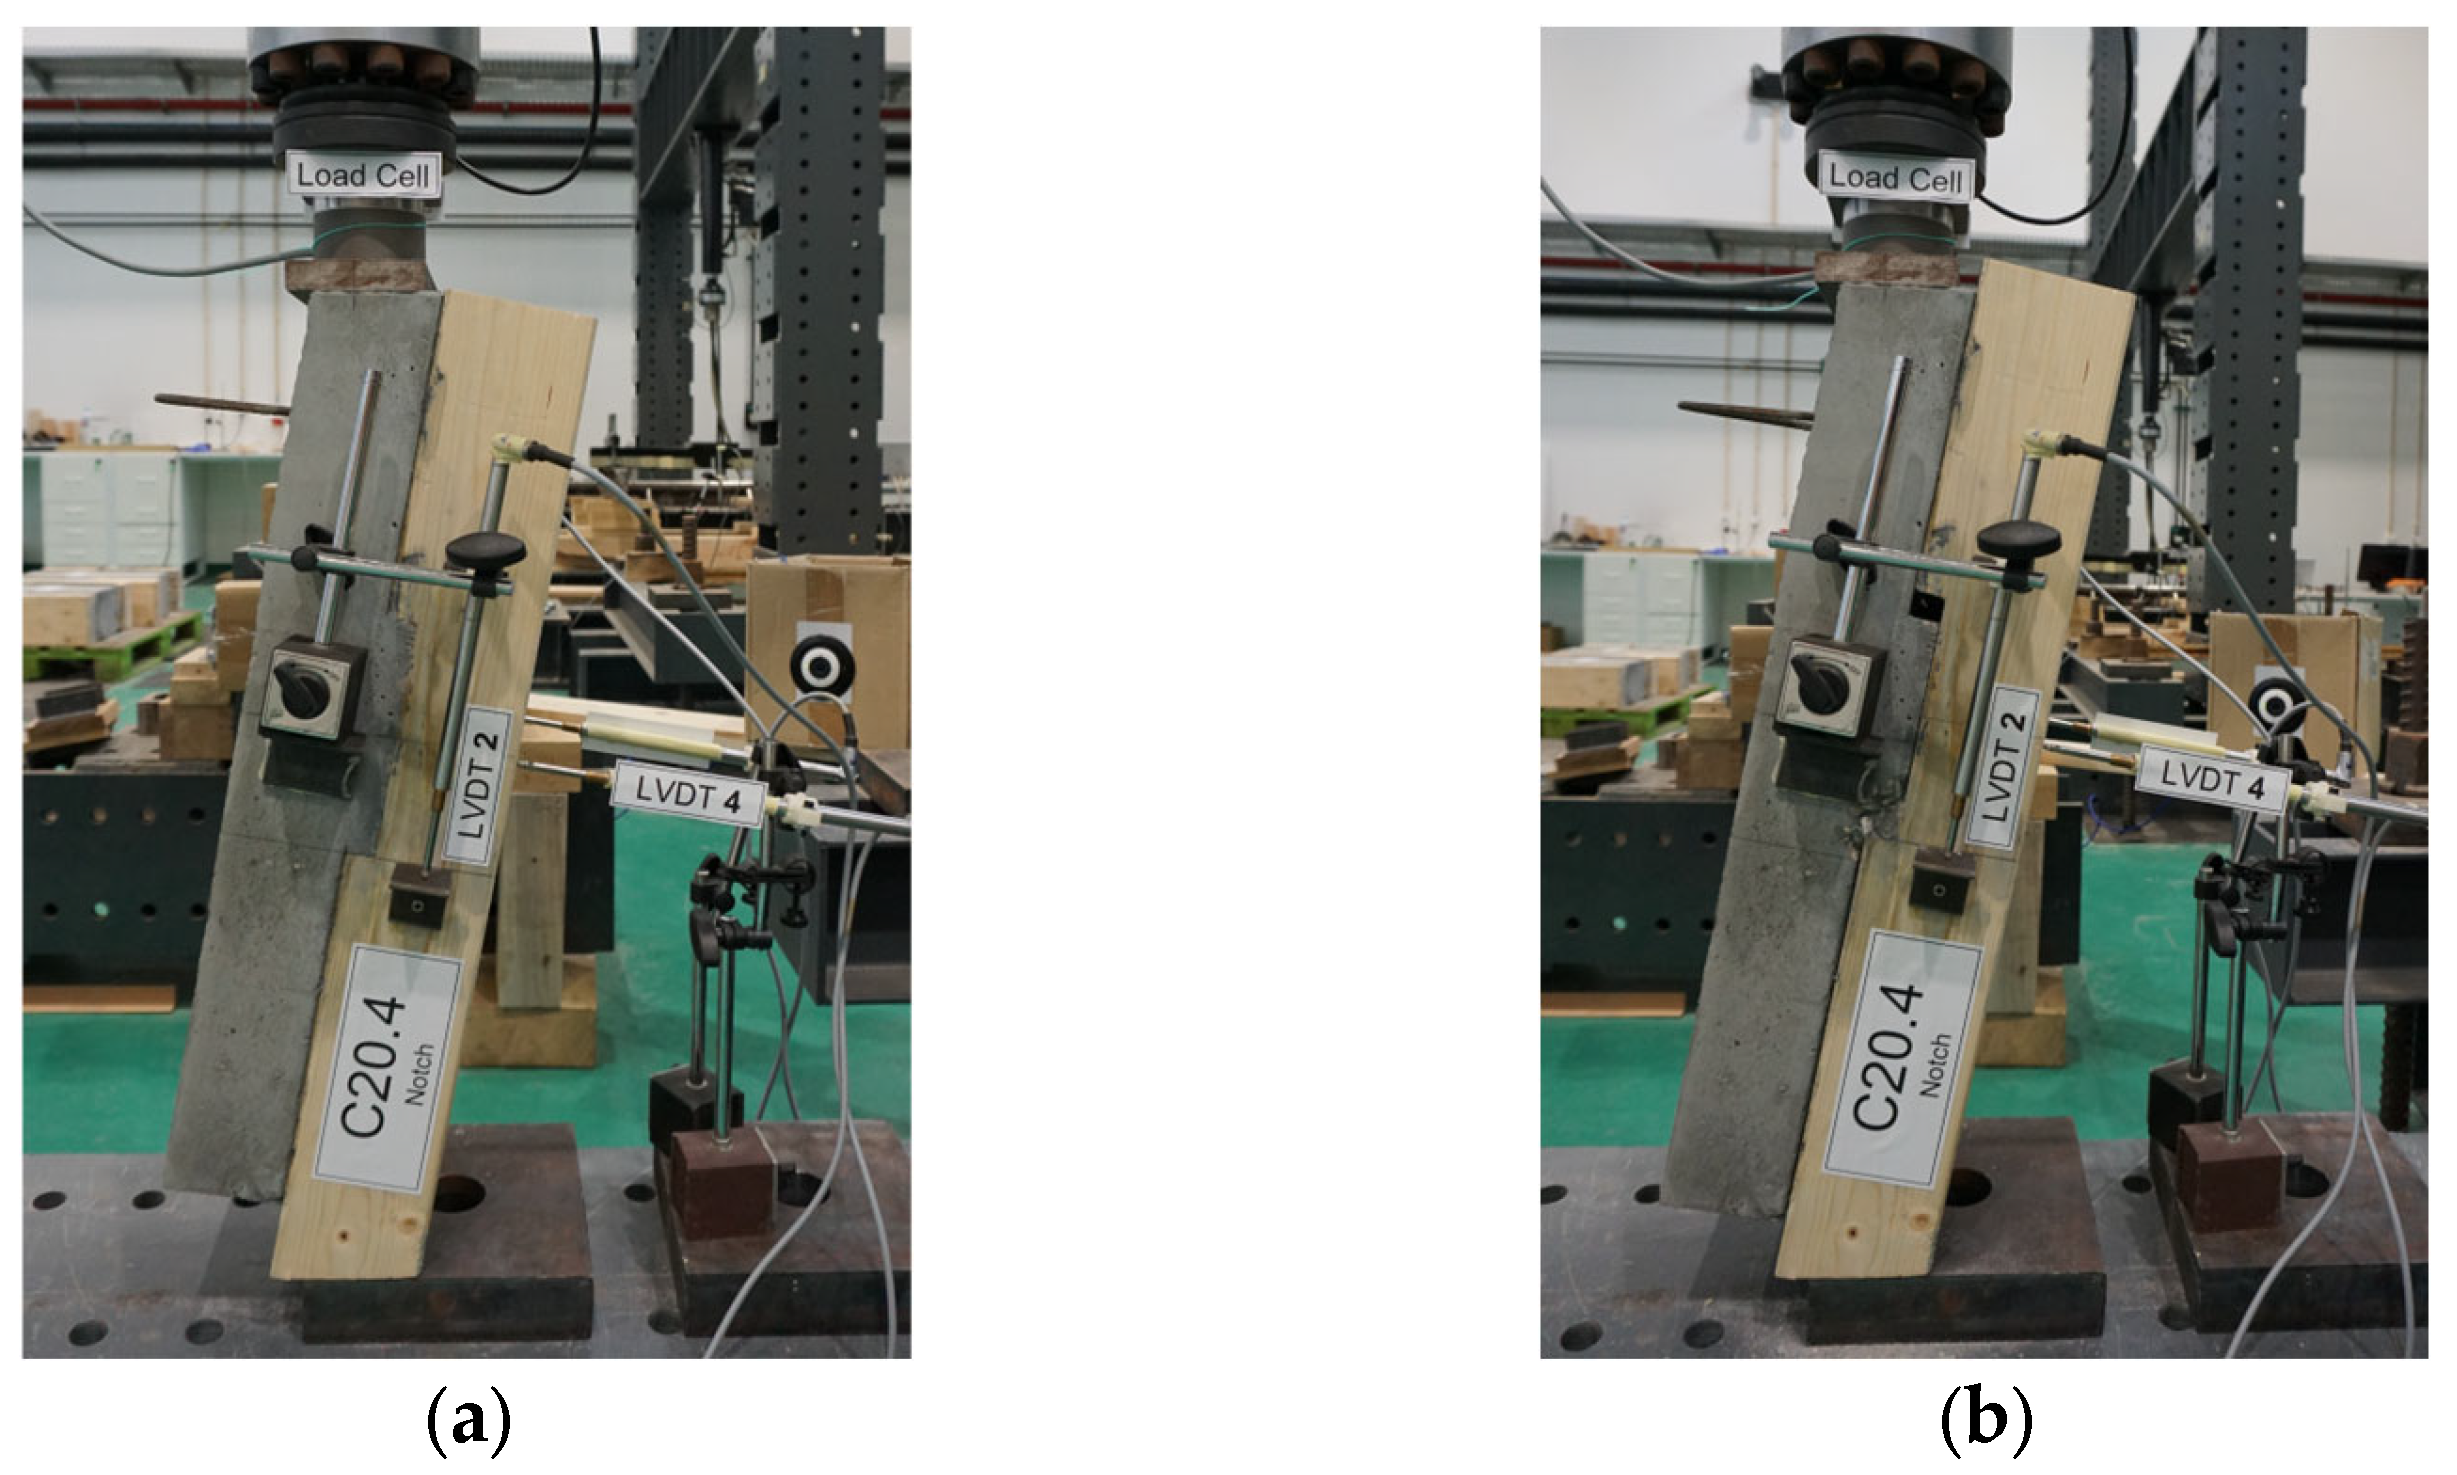
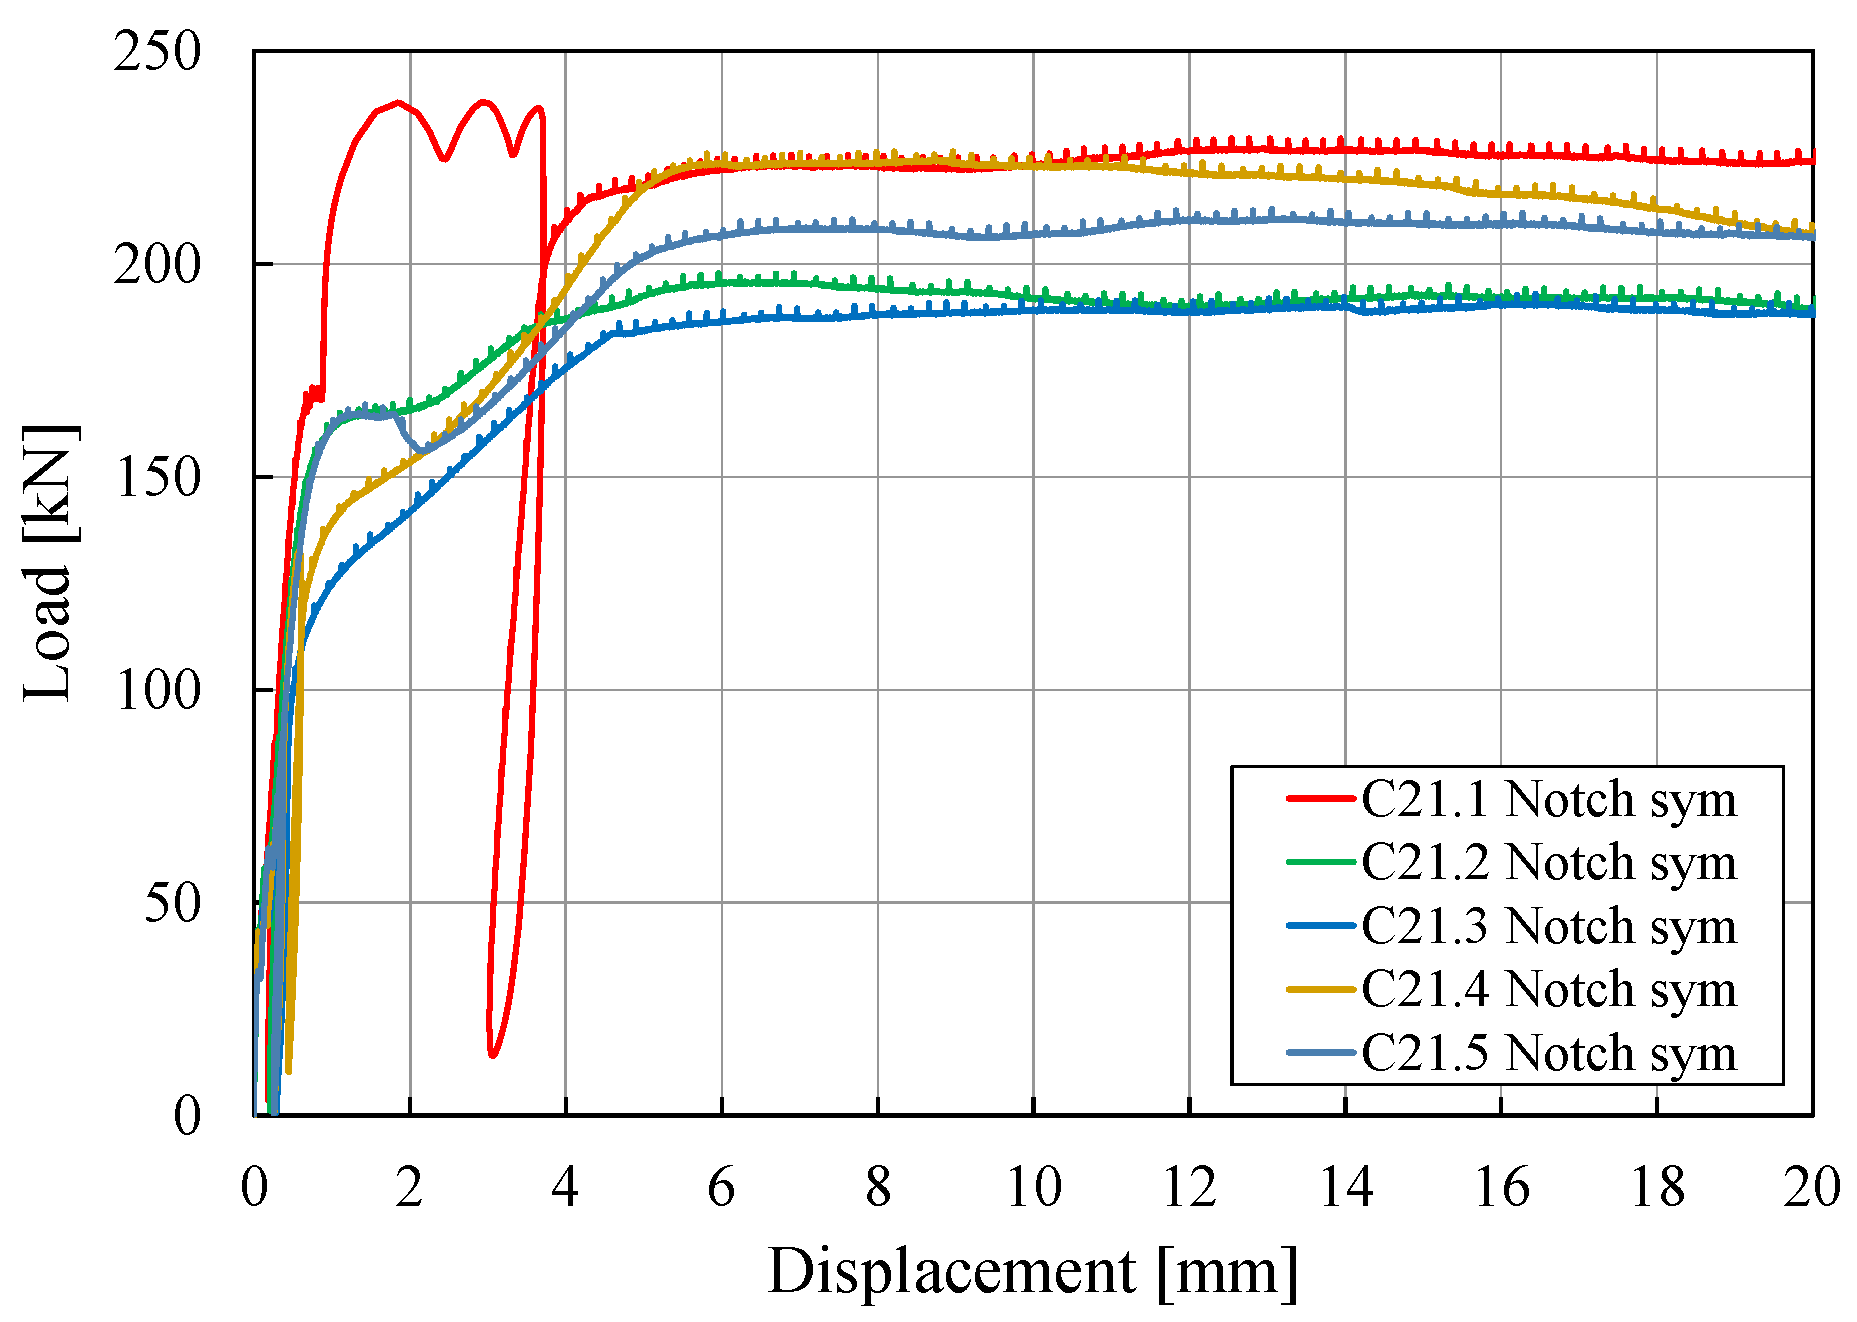
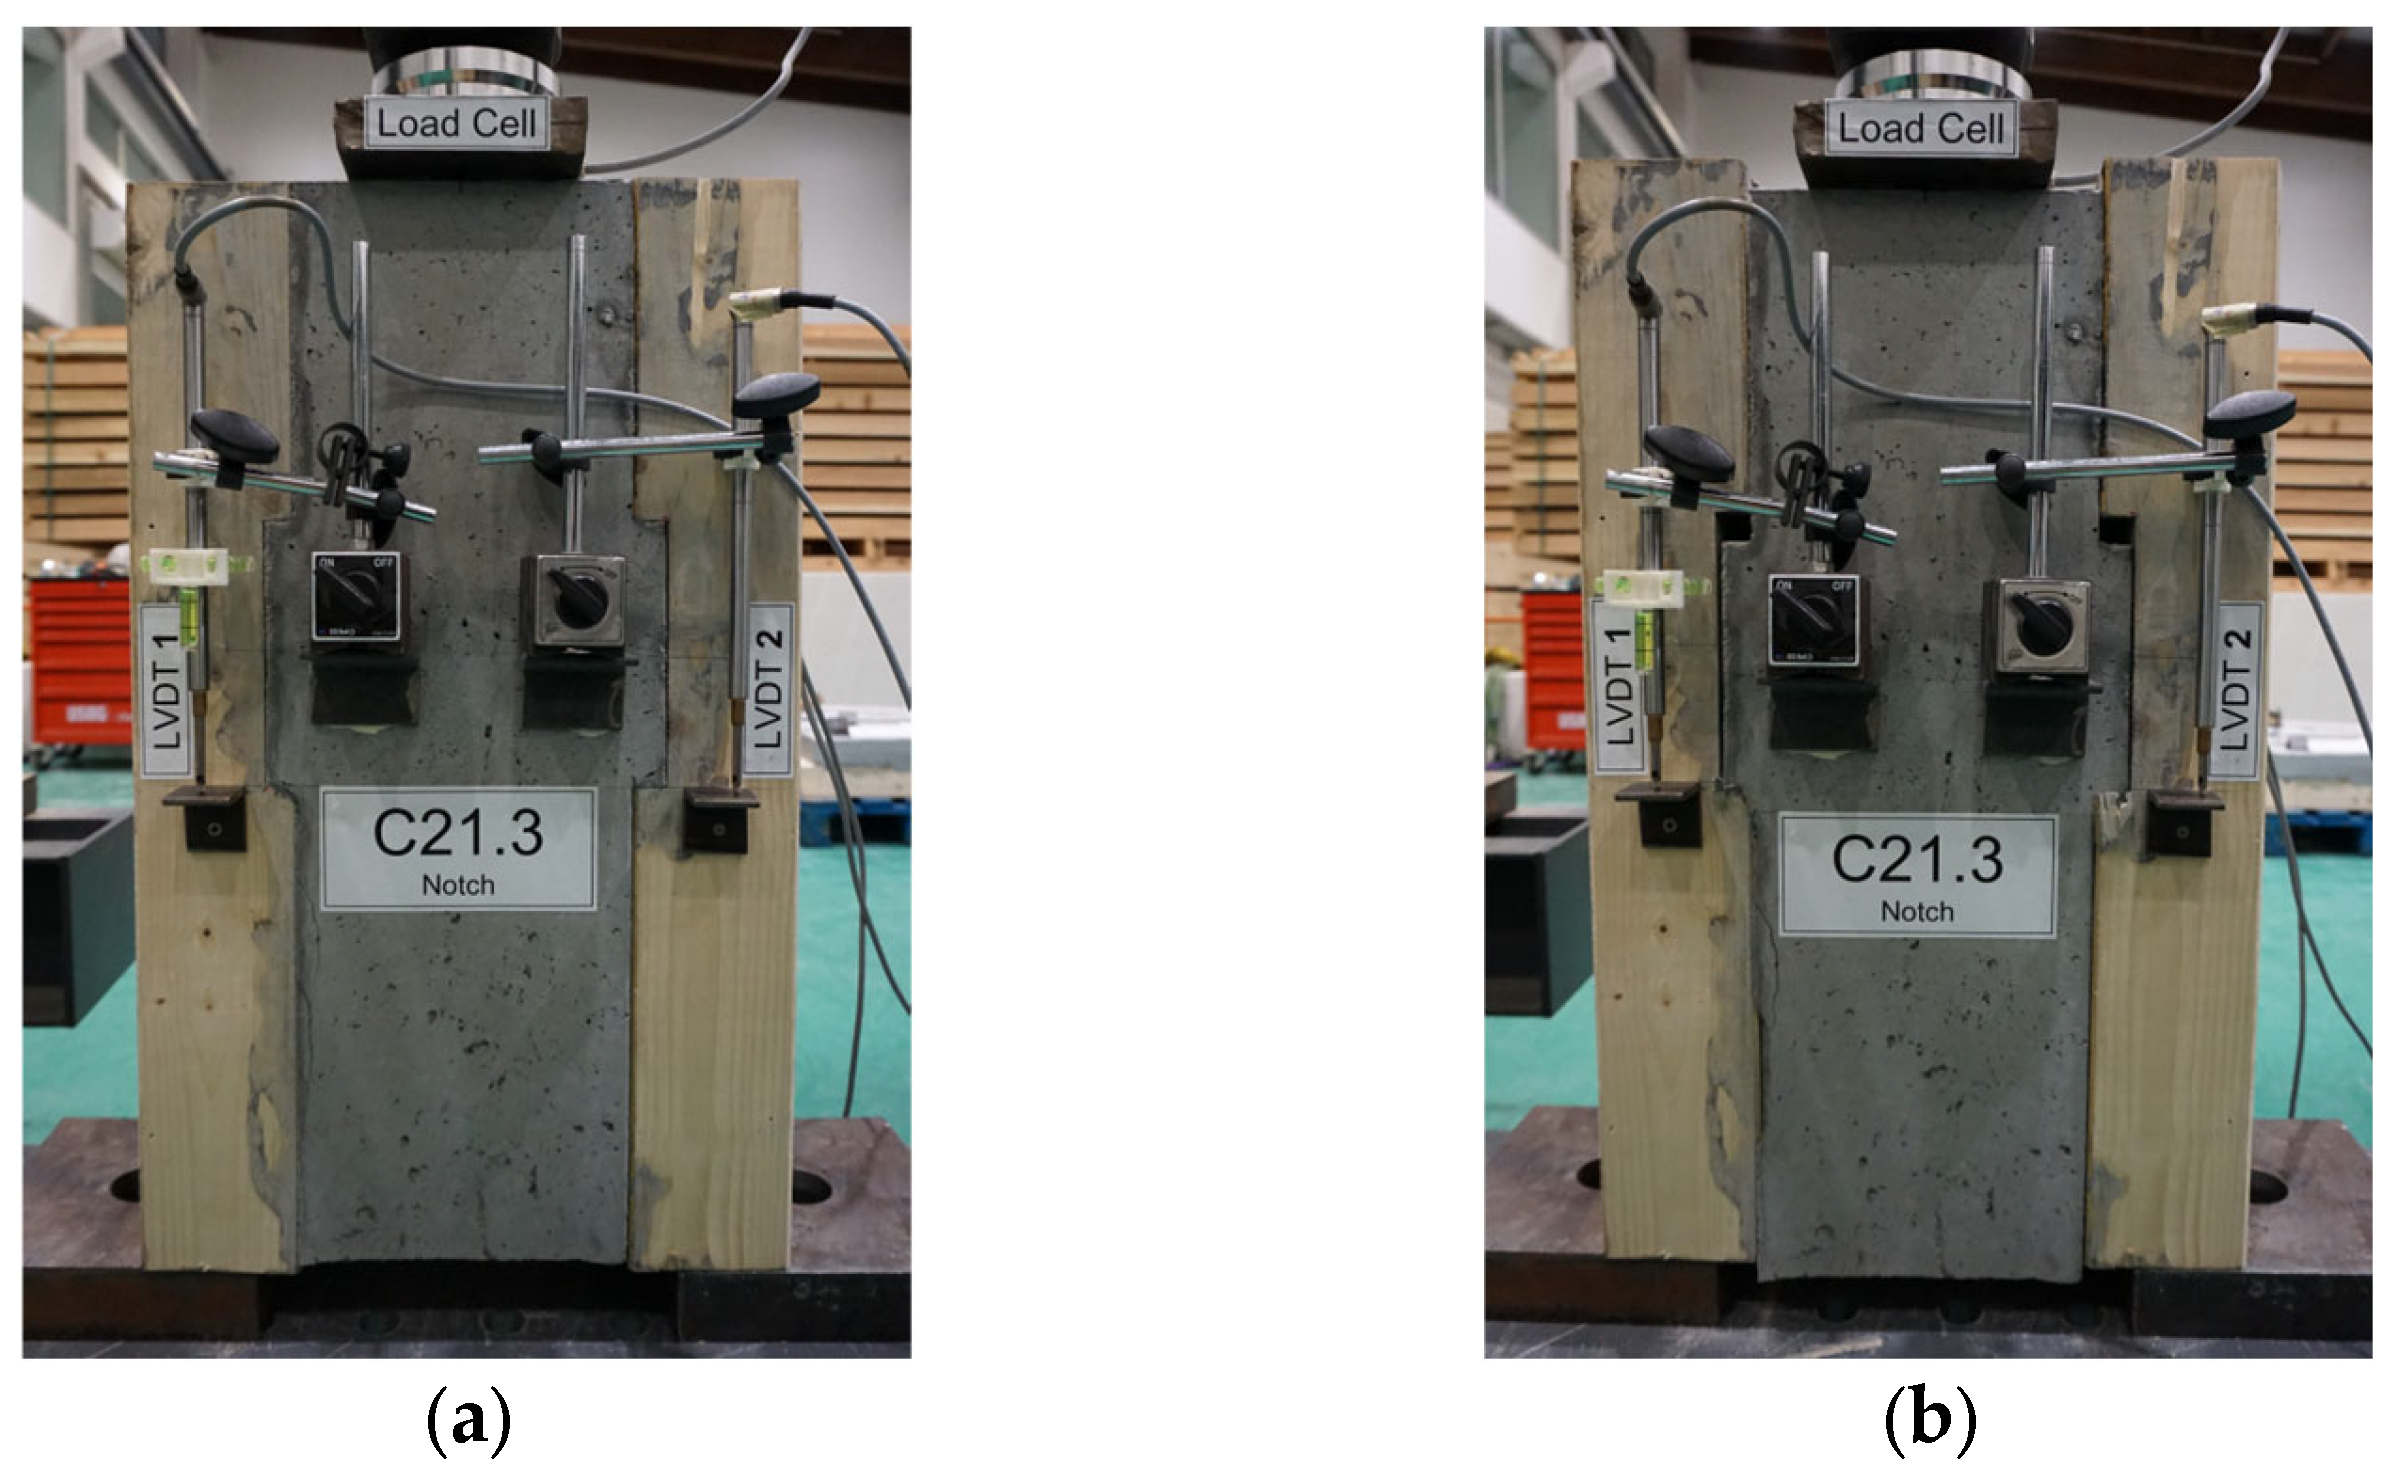
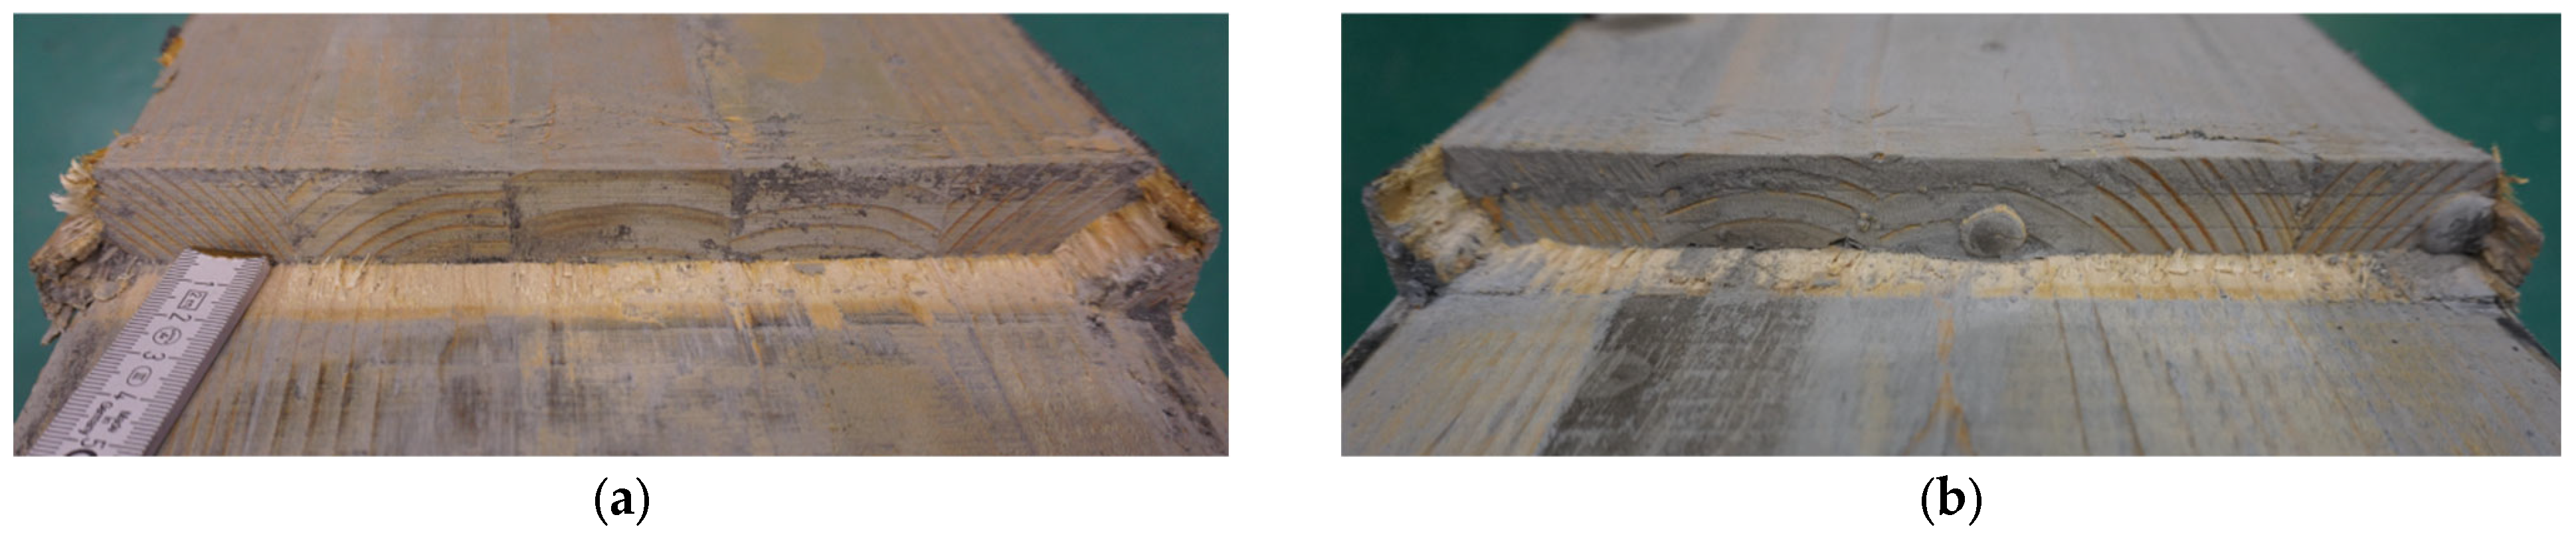
3.2. Test Series C20 and C21
4. Conclusions
Author Contributions
Funding
Institutional Review Board Statement
Informed Consent Statement
Data Availability Statement
Acknowledgments
Conflicts of Interest
References
- Blass, H.J.; Aune, P.; Choo, B.S.; Goerlacher, D.R.; Hilson, B.O.; Racher, P.; Steck, G. Timber Engineering STEP 2: Design—Details and Structural Systems, 1st ed.; Centrum Hout: Almere, The Netherlands, 1995. [Google Scholar]
- Carvalho, E.; Carrasco, E. Influence of test specimen on experimental characterization of timber-concrete composite joints. Constr. Build. Mater. 2010, 24, 1313–1322. [Google Scholar] [CrossRef]
- Skinner, J.; Martins, C.; Bregulla, J.; Harris, R.; Paine, K.; Walker, P.; Dias, A.M.P.G. Concrete upgrade to improve the vibration response of timber floors. Proc. Inst. Civ. Eng.-Struct. Build. 2014, 167, 559–568. [Google Scholar] [CrossRef]
- Lukaszewska, E.; Johnsson, H.; Fragiacomo, M. Performance of connections for prefabricated timber–concrete composite floors. Mater. Struct. 2008, 41, 1533–1550. [Google Scholar] [CrossRef]
- Monteiro, S.R.S.; Dias, A.M.P.G.; Lopes, S.M.R. Bi-dimensional numerical modeling of timber-concrete slab-type structures. Mater. Struct. 2015, 48, 3391–3406. [Google Scholar] [CrossRef]
- Santos, P.G.G.; Martins, C.E.D.; Skinner, J.; Harris, R.; Dias, A.M.P.G.; Godinho, L.M.C. Modal Frequencies of a Reinforced Timber-Concrete Composite Floor: Testing and Modeling. J. Struct. Eng.—ASCE 2015, 141, 04015029. [Google Scholar] [CrossRef]
- Fragiacomo, M.; Lukaszewska, E. Development of prefabricated timber-concrete composite floor systems. Proc. Inst. Civ. Eng. Struct. Build. 2011, 164, 117–129. [Google Scholar] [CrossRef]
- Monteiro, S.; Dias, A.; Negrão, J. Assessment of Timber-Concrete Connections Made with Glued Notches: Test Set-Up and Numerical Modelling. Exp. Tech. 2011, 37, 50–65. [Google Scholar] [CrossRef]
- Ceccotti, A. Composite concrete-timber structures. Prog. Struct. Eng. Mater. 2002, 4, 264–275. [Google Scholar] [CrossRef]
- Van De Kuilen, J.W.G.; Dias, A.M.P.G. Long-term load-deformation behaviour of timber-concrete joints. Proc. Inst. Civ. Eng.-Struct. Build. 2011, 164, 141–154. [Google Scholar] [CrossRef]
- Monteiro, S. Avaliação Experimental e Numérica do Comportamento Mecânico de Ligações Madeira-Betão Entalhadas. Master’s Thesis, Faculdade de Ciências e Tecnologia da Universidade de Coimbra, Coimbra, Portugal, 2009. [Google Scholar]
- Mönch, S.; Kuhlmann, U. Notched Connections for Timber-Concrete Composite Bridges-Investigations on the Fatigue Behaviour. In Proceedings of the 4th International Conference on Timber Bridges, ICTB2021 Plus, Biel/Bienne, Switzerland, 9–12 May 2022. [Google Scholar] [CrossRef]
- Kuhlmann, U.; Mönch, S. Design Parameters of Notched Connections for TCC Structures as Part of Eurocode 5. In Proceedings of the International Network on Timber Engineering Research, Tallinn, Estonia, 13–16 August 2018. [Google Scholar]
- Dias, A.; Cruz, H.; Lopes, S.; Kuilen, J. Experimental shear-friction tests on dowel type fastener timber timber-concrete joints. In Proceedings of the 8th Conference on Timber Engineering, WCTE 2004, Lahti, Finland, 14–17 June 2004. [Google Scholar]
- Capretti, S.; Ceccotti, A.; del Senno, M.; Lauriola, M. On the Experimental Determination of Strength and Deformation Characteristics of Timber-Concrete Composite Joints. In Proceedings of the 5th World Conference on Timber Engineering, WCTE 1998, Montreux, Switzerland, 17–20 August 1998. [Google Scholar]
- De Santis, Y.; Sciomenta, M.; Spera, L.; Rinaldi, V.; Fragiacomo, M.; Bedon, C. Effect of Interlayer, and Inclined Screw Arrangements on the Load-Bearing Capacity of Timber-Concrete Composite Connections. Buildings 2022, 12, 2076. [Google Scholar] [CrossRef]
- CEN/TS 19103; Eurocode 5: Design of Timber Structures—Structural Design of Timber-Concrete Composite Structures—Common Rules and Rules for Buildings. European Committee for Standardization (CEN): Brussels, Belgium, 2021.
- ETA-13/0029; European Technical Assessment ETA-13/0029 of 11/07/2017, ASSY plus VG Screw, Self-Tapping Screws for Use in Wood-Concrete Slab Kits, ETA-Danmark. European Organisation for Technical Approvals: Brussels, Belgium, 2017.
- ETA-12/0114; European Technical Approval ETA-12/0114, SPAX Self-Tapping Screws, ETA-Danmark. European Organisation for Technical Approvals: Brussels, Belgium, 2012.
- Mönch, S. Performance of Notched Connections under Static and Cyclic Loading for Timber-Concrete Composite Systems. Ph.D. Thesis, Institute of Structural Design, University of Stuttgart, Stuttgart, Germany, 2024. in preparation. [Google Scholar]
- EN 408; Timber Structures—Structural Timber and Glued Laminated Timber—Determination of Some Physical and Mechanical Properties. European Committee for Standardization (CEN): Brussels, Belgium, 2010.
- NP EN 206; Betão: Especificação, Desempenho, Produção e Conformidade. Instituto Português da Qualidade: Lisboa, Portugal, 2013.
- EN 26891; Timber Structures—Joints Made with Mechanical Fasteners—General Principles for the Determination of Strength and Deformation Characteristics. European Committee for Standardization (CEN): Brussels, Belgium, 1991.
- Kudla, K. Kerven als Verbindungsmittel für Holz-Beton-Verbundstraßenbrücken. Ph.D. Thesis, Institute of Structural Design, University of Stuttgart, Stuttgart, Germany, 2017. Mitteilung Nr. 2017-02 (In Germany). [Google Scholar]


| Series | Timber Class | Concrete Class | Type of Connection | Specimen Geometry |
|---|---|---|---|---|
| C1.i | GL 24h | C 25/30 | Screw (Würth Assy Plus self-tapping VG screws 10 × 300 and FT connectors (screw under 30° to shear plane) according to ETA-13/0029 [18]) | Symmetric |
| C20 | GL 24h | C 30/37 | Notch + screw under 90° to shear plane (Spax 8 × 160 washer head and partial thread according to ETA-12/0114 [19]) | Asymmetric |
| C21 | GL 24h | C 30/37 | Notch + screw under 90° to shear plane (Spax 8 × 160 washer head and partial thread according to ETA-12/0114 [19]) | Symmetric |
| Series No. | Interface between Timber and Concrete | Test Procedure | No. of Specimens |
|---|---|---|---|
| C1.x | Direct contact Plastic foil Plastic + Vaseline | Static and cycle | 20 |
| C20 | Direct contact | Static | 5 |
| C21 | Direct contact | Static | 5 |
| Test Series | Load Protocol | Load Procedure | Fest [kN] | Speed |
|---|---|---|---|---|
| C1.x | See Table 4 | Load controlled | 50.0 | 0.1667 kN/s |
| C20 | Static | Displacement controlled | 110.0 | 0.50 mm/min |
| C21 | Static | Displacement controlled | 220.0 | 0.50 mm/min |
| Test No. | Contact between Timber and Concrete | Torque [Nm] of Screws (per Cycle Level) | Number of Cycles (per Torque Level) |
|---|---|---|---|
| C1.1 | Direct contact | 60-80 | 2-3 |
| C1.2 | Direct contact | 30-60 | 1-1 |
| C1.3 | Direct contact | 20-30-60-80 | 2-2-2-2 |
| C1.4 | Plastic foil | 30-60-80 | 2-2-2 |
| C1.5 | Plastic + Vaseline | 30-60-80 | 2-2-2 |
| C1.6 | Direct contact | 30-60-80 | 3-3-3 |
| C1.7 | Plastic foil | 30-60-80 | 3-3-3 |
| C1.8 | Plastic + Vaseline | 30-60-80 | 3-3-3 |
| C1.9 | Direct contact | 30 | 11 |
| C1.10 | Direct contact | 80 | 10 |
| C1.11 | Plastic + Vaseline | 30 | 10 |
| C1.12 | Plastic + Vaseline | 80 | 10 |
| C1.13 | Direct contact | 30 | 10 |
| C1.14 | Direct contact | 80 | 10 |
| C1.15 | Plastic + Vaseline | 30 | 10 |
| C1.16 | Plastic + Vaseline | 80 | 10 |
| C1.17 | Direct contact | 30 | 100 |
| C1.18 | Direct contact | 80 | 100 |
| C1.19 | Plastic + Vaseline | 30 | 100 |
| C1.20 | Plastic + Vaseline | 80 | 100 |
| Specimen | Kser [kN/mm] | Fmax [kN] |
|---|---|---|
| C1.21 | 49.4 | 74.8 |
| C1.22 | 31.4 | 45.6 |
| Mean | 40.4 | 60.2 |
| Test No. | Fmax/Notch [kN] |
|---|---|
| C20.1 | 137.2 |
| C20.2 | 128.2 |
| C20.3 | 129.7 |
| C20.4 | 128.5 |
| C20.5 | 132.9 |
| MV | 131.1 |
| CoV | 2.9% |
| C21.1 | 119.0 |
| C21.2 | 96.8 |
| C21.3 | 93.2 |
| C21.4 | 108.2 |
| C21.5 | 102.0 |
| MV | 103.8 |
| CoV | 10% |
Disclaimer/Publisher’s Note: The statements, opinions and data contained in all publications are solely those of the individual author(s) and contributor(s) and not of MDPI and/or the editor(s). MDPI and/or the editor(s) disclaim responsibility for any injury to people or property resulting from any ideas, methods, instructions or products referred to in the content. |
© 2024 by the authors. Licensee MDPI, Basel, Switzerland. This article is an open access article distributed under the terms and conditions of the Creative Commons Attribution (CC BY) license (https://creativecommons.org/licenses/by/4.0/).
Share and Cite
Mönch, S.; Campos, J.A.A.; Dias, A.M.P.G.; Kuhlmann, U. Influence of the Geometric Properties, the Timber–Concrete Interface, and the Load Protocol on the Mechanical Properties of Timber–Concrete Composite Connections. Appl. Sci. 2024, 14, 6768. https://doi.org/10.3390/app14156768
Mönch S, Campos JAA, Dias AMPG, Kuhlmann U. Influence of the Geometric Properties, the Timber–Concrete Interface, and the Load Protocol on the Mechanical Properties of Timber–Concrete Composite Connections. Applied Sciences. 2024; 14(15):6768. https://doi.org/10.3390/app14156768
Chicago/Turabian StyleMönch, Simon, Joana A. A. Campos, Alfredo M. P. G. Dias, and Ulrike Kuhlmann. 2024. "Influence of the Geometric Properties, the Timber–Concrete Interface, and the Load Protocol on the Mechanical Properties of Timber–Concrete Composite Connections" Applied Sciences 14, no. 15: 6768. https://doi.org/10.3390/app14156768
APA StyleMönch, S., Campos, J. A. A., Dias, A. M. P. G., & Kuhlmann, U. (2024). Influence of the Geometric Properties, the Timber–Concrete Interface, and the Load Protocol on the Mechanical Properties of Timber–Concrete Composite Connections. Applied Sciences, 14(15), 6768. https://doi.org/10.3390/app14156768