Article

Preparation and Performance Characterization of Low-Density 3D-Printed Expanded Perlite–Foam Concrete

College of Materials Science and Engineering, Nanjing Tech University, Nanjing 211816, China
*
Author to whom correspondence should be addressed.
Appl. Sci. 2024, 14(15), 6796; https://doi.org/10.3390/app14156796
Submission received: 26 June 2024 / Revised: 31 July 2024 / Accepted: 2 August 2024 / Published: 4 August 2024
(This article belongs to the Section Additive Manufacturing Technologies)

Abstract

:
Traditional lightweight foam concrete typically introduces a large number of voids into the concrete using surfactants to reduce density. However, in 3D printing, the instability of lightweight foam concrete can affect the workability of the slurry. Additionally, the lower strength of foam with more pores also reduces its mechanical performance. This study found that by replacing sand with expanded perlite in 3D-printed foam concrete, the stability of the foam is improved, enhancing the workability of the mixture and increasing the constructability of printed concrete. Furthermore, analyses of mechanical properties, porosity, and pore size distribution showed that at the same dry density, foam concrete with a higher expanded perlite replacement ratio exhibited higher compressive strength, with a maximum strength increase of up to 39%. Moreover, the introduction of expanded perlite optimized the pore distribution of the foam concrete, resulting in a more uniform material structure. The 3D-printed expanded perlite–foam concrete (3DPFC) prepared in this study provides new insights for the preparation of lightweight 3D-printed concrete, which is of significant importance for the sustainable development of the construction industry.

1. Introduction

Estimates suggest that nearly 30 million housing units will be needed annually in the future to meet the increased demand due to population growth [1]. However, the traditional construction industry, mainly based on reinforced concrete (RC), faces significant challenges. Issues such as high accident rates, low efficiency, heavy reliance on labor, and high construction costs are prevalent. Template costs alone account for 60% of total costs, while the preparation time for templates consumes 50–70% of the total construction duration [2,3,4]. Therefore, it is necessary to seek new construction technologies that are safer, more efficient, and require fewer templates [5]. Concrete 3D printing technology is an emerging form of architectural automation and digital manufacturing. Compared to traditional construction methods, concrete 3D printing technology significantly reduces labor costs, saves construction time, mitigates construction accidents, and allows for the construction of complex structures [6,7,8,9,10,11]. The geometric complexity offered by concrete 3D printing technology allows for the design of freely shaped architectural elements, paving the way for low-cost and highly customized designs [12,13]. Lightweight concrete (LWC), as a historically proven functional building material [14], makes significant contributions to reducing component weight, saving costs, enhancing fire resistance, and reducing transportation and placement costs [15,16,17]. Buildings constructed with lightweight concrete also exhibit excellent thermal insulation and durability [18,19]. Therefore, the application of lightweight concrete in the field of 3D printing for construction holds great promise. Particularly, the use of 3D-printed lightweight concrete in construction enables non-load-bearing modular lightweight units for light to medium structural loads, reducing the overall weight and rigging risks while improving engineering efficiency [20,21]. Furthermore, 3D-printed lightweight concrete exhibits low thermal conductivity, as well as excellent thermal insulation and soundproofing performance, offering broad application prospects [22].
Research on 3D-printed lightweight concrete has primarily focused on foamed concrete and lightweight aggregate concrete. Foam concrete (FC) refers to the introduction of a large volume of foam into a fresh cement matrix [23], primarily achieved through mechanical foaming and chemical foaming methods. Studies have shown that 3D-printed foamed concrete (3DFC) enhances mechanical performance in its fresh state compared to traditional foamed concrete, with minimal deformation observed. Additionally, when the mixing speed was increased from 1200 RPM to 3000 RPM, the compressive strength increased by 70% [24]. Recent studies on 3D-printed lightweight concrete have also achieved compression strengths exceeding 10 MPa within a density range of 1100–1580 kg/m3 [25]. The main challenge of applying foam concrete (FC) in concrete 3D printing lies in its lower fresh-state yield stress, which affects its constructability. The fragility of foam during mixing and pumping exacerbates this issue, necessitating the use of a cementitious base with low yield stress to ensure foam stability [26]. To use foam concrete in concrete 3D printing, efforts have focused on improving the rheological properties of the mixture through additives. Cho et al. [27] enhanced the mixture rheology by introducing nanoparticles and calcium sulfoaluminate cement, enabling the continuous printing of 15 layers without collapse. Liu et al. [28] improved foam stability and adjusted rheological properties by adding hydroxypropyl methylcellulose and silica fume, achieving compressive strengths exceeding 20 MPa under conditions of 1815 kg/m3 density. However, increased additives prolong setting times, and different types of foaming agents affect the fresh properties of the mixture. Therefore, low yield stress remains a critical factor limiting the application of foam concrete in 3D printing [26]. Using lightweight aggregates instead of sand to reduce foam usage without altering density seems a feasible solution. Expanded perlite is a white or light-colored porous material made from crushed perlite, which has advantages such as good thermal insulation, sound insulation, fire resistance, and low density [29,30]. Researchers have explored the possibility of using expanded perlite in 3D-printed lightweight concrete, citing its ability to reduce material density, minimize shrinkage, lower thermal conductivity, enhance fire resistance, and increase sound insulation [31,32]. Incorporating porous perlite materials into concrete increases the porosity of components, allowing them to absorb more CO2 over their lifecycle [33]. At the same time, these components can also reduce the energy consumption of buildings due to their excellent thermal insulation properties [18,19]. Despite showing promising performance, the water absorption characteristics of expanded perlite pose challenges related to material yield stress, apparent viscosity, and constructability [34]. Research by Tukem and Kantarci [35,36] indicates that substituting natural sand with expanded perlite can reduce the workability of the mixture, but research by Karakoç, Demirboga [37], and Oktay et al. [38] indicates that substituting expanded perlite for natural sand can enhance the workability of the mixture. This requires further exploration and practical application to investigate the rheological properties and printability of 3D-printed foam concrete using expanded perlite instead of sand.
To address these issues, this paper introduces a perlite–foam composite system. It proposes using expanded perlite as a direct replacement for river sand in 3DFC, utilizing its porous and water-absorbent properties to further reduce the dry density of 3DFC. By adjusting the amounts of expanded perlite and foam, the rheological and hardening characteristics can be modified, thereby enhancing the material’s printability and constructability.

2. Materials and Methods

2.1. Materials

This experiment used ordinary Portland cement as the binder, with hydroxypropyl methyl cellulose as a rheology modifier. A plant-based protein surfactant, diluted with water at a 1:60 ratio, served as the foaming agent. The aggregates consisted mainly of river sand and expanded perlite from the Haohui Thermal Insulation Material Factory in Henan Province. The chemical composition of the cement and expanded perlite is shown in Table 1, and the basic physical properties of the expanded perlite are listed in Table 2.

2.2. Formulation Design and Preparation

Five sets of 3DPFCs with different expanded perlite replacement rates were designed, with the specific mix designs detailed in Table 3. Expanded perlite replaced the river sand in the 3DFCs at different volume ratios, allowing us to study how material properties vary with different replacement rates. The preparation of the 3DFCs was carried out as follows: first, the premixed powder was dry-blended for 5 min; then, water was added to create a uniform slurry through stirring. The dissolved surfactant in water was transformed into uniform foam through a foam generator, and then the foam was added into the concrete, stirring thoroughly until the foam was evenly mixed with the concrete [19]. The stirring process involved low-speed stirring to prevent the foam rupture that can occur during high-speed stirring. Due to the high water absorption of expanded perlite, maintaining a uniform water–cement ratio is crucial for the flowability of 3D-printed expanded perlite–foam concrete. Therefore, the initial flowability of the 3DPFC samples was standardized to 140 mm. The prepared paste-like material was used for subsequent experiments.

2.3. Printing Parameters

The HC-3DPRT-type four-axis gantry concrete 3D printer was utilized in this study to print the foam–perlite specimens. A single-channel digital model with a length of 200 mm was designed, and the printer parameters were set as follows: extrusion rate, 1.3 s−1; X-axis movement speed, 35 mm/s; Z-axis movement speed, 5 mm/s.

2.4. Experimental Methods for Fresh 3DPFC

2.4.1. Flowability and Mini-Slump Testing

Flowability is a critical indicator for assessing the pumpability and extrudability of 3DPC, and is measured using a cement concrete flowability tester [30]. According to the ASTM C1437-15 standard [39], the fresh 3DPFC was divided into two batches and loaded into a truncated cone mold, then compacted using a pestle. Subsequently, the mold was swiftly lifted vertically for initial mini-slump testing [40]. Measurements were taken from three angles to determine the height difference between the truncated cone mold and the slumped 3DPFC. The average of these measurements represents the slump. After this, the flowability was evaluated by starting the flow table for 25 jolts. A caliper was used to measure the expansion diameter in two perpendicular directions, and the arithmetic mean was calculated and recorded as the flowability, measured in millimeters.

2.4.2. Rheological Testing

Using the R/SP-SST Brookfield rheometer equipped with a four-blade rotor, the rheological properties of the 3DPFCs were measured, including static yield stress, dynamic yield stress, and apparent viscosity. Before testing, each 3DPFC was pretreated to ensure a consistent initial state. First, the slurry was sheared at a shear rate of 30 s−1 for 60 s. Then, the shear rate was reduced to 0 s−1 within 10 s and left undisturbed for 60 s to prepare for subsequent testing. The static yield stress of the 3DPFC was determined by continuously shearing it at a constant low shear rate of 0.2 s−1 for 120 s. The apparent viscosity of the 3DPFC was measured using a procedure in which the shear rate was linearly increased from 0 s−1 to 35 s−1 over 60 s, then held at a constant shear rate of 35 s−1 for 30 s, and then finally linearly decreased to 0 s−1 over 60 s.

2.4.3. Constructability Evaluation

We used the preset printing parameters to continuously print the sample until it collapsed, with the layer count set at N. We restarted the program to print the sample for the N-1 layer, and maintained the stability of the printing for at least 1 min. The single continuous printable layer count for that sample would then be N-1 layers. After repeating this experiment three times and calculating the average of the results, we evaluated the constructability of the 3DPFC by characterizing the printability based on the printed layer count.

2.5. Experimental Plan for Hardened Foam–Perlite Concrete

2.5.1. Compressive Strength and Dry Density

The compressive strength of the 3DPFCs after specific curing periods was tested using a fully automatic compression tester controlled through a WHY-200 microcomputer. To minimize errors, three samples were selected for testing in each curing period, and the average of the test results was calculated to represent the compressive or flexural strength of the samples. The curing periods included 3 days, 7 days, 28 days, and 60 days. The dry density of 3DPFCs was determined using a WLD-1203MD electronic density meter. The samples were cured for 28 days under standard procedures, with three replicates used for each group. The final result was calculated by averaging the test values of the three samples.

2.5.2. Mercury Intrusion Porosimetry

The GT-60 porosimeter was used in this study to analyze the pore structure of the samples with different perlite substitution rates. Before testing, the specimens needed to undergo a drying process; then, we crushed them into 3–5mm particles.

2.5.3. SEM

The samples used for testing were 3DPFC specimens that had been cured for 28 days. After halting hydration, the samples were cut into 5 mm square thin slices. They were then vacuum-dried at 40 °C for 12 h. The porous structure of the 3DPFCs was observed using a ZEISS Sigma 300 field emission scanning electron microscope from Germany.

2.5.4. Heat Resistance Performance

The heat resistance of the 3DPFCs was evaluated by measuring the variation in compressive strength of the samples after high-temperature calcination. For each formulation, three samples were placed in an oven and heated at a rate of 10 °C/min to 200 °C, where they were kept for 2 h before naturally cooling to room temperature. Additionally, six samples for each formulation were divided into two groups and heated in a muffle furnace at a rate of 10 °C/min to 400 °C and 800 °C, respectively, and then maintained at these temperatures for 2 h before being naturally cooled to room temperature in the muffle furnace. The 3DPFCs’ compressive strength after calcination was tested using a fully automatic compression testing machine controlled through a WHY-200 microcomputer.

3. Results and Discussion

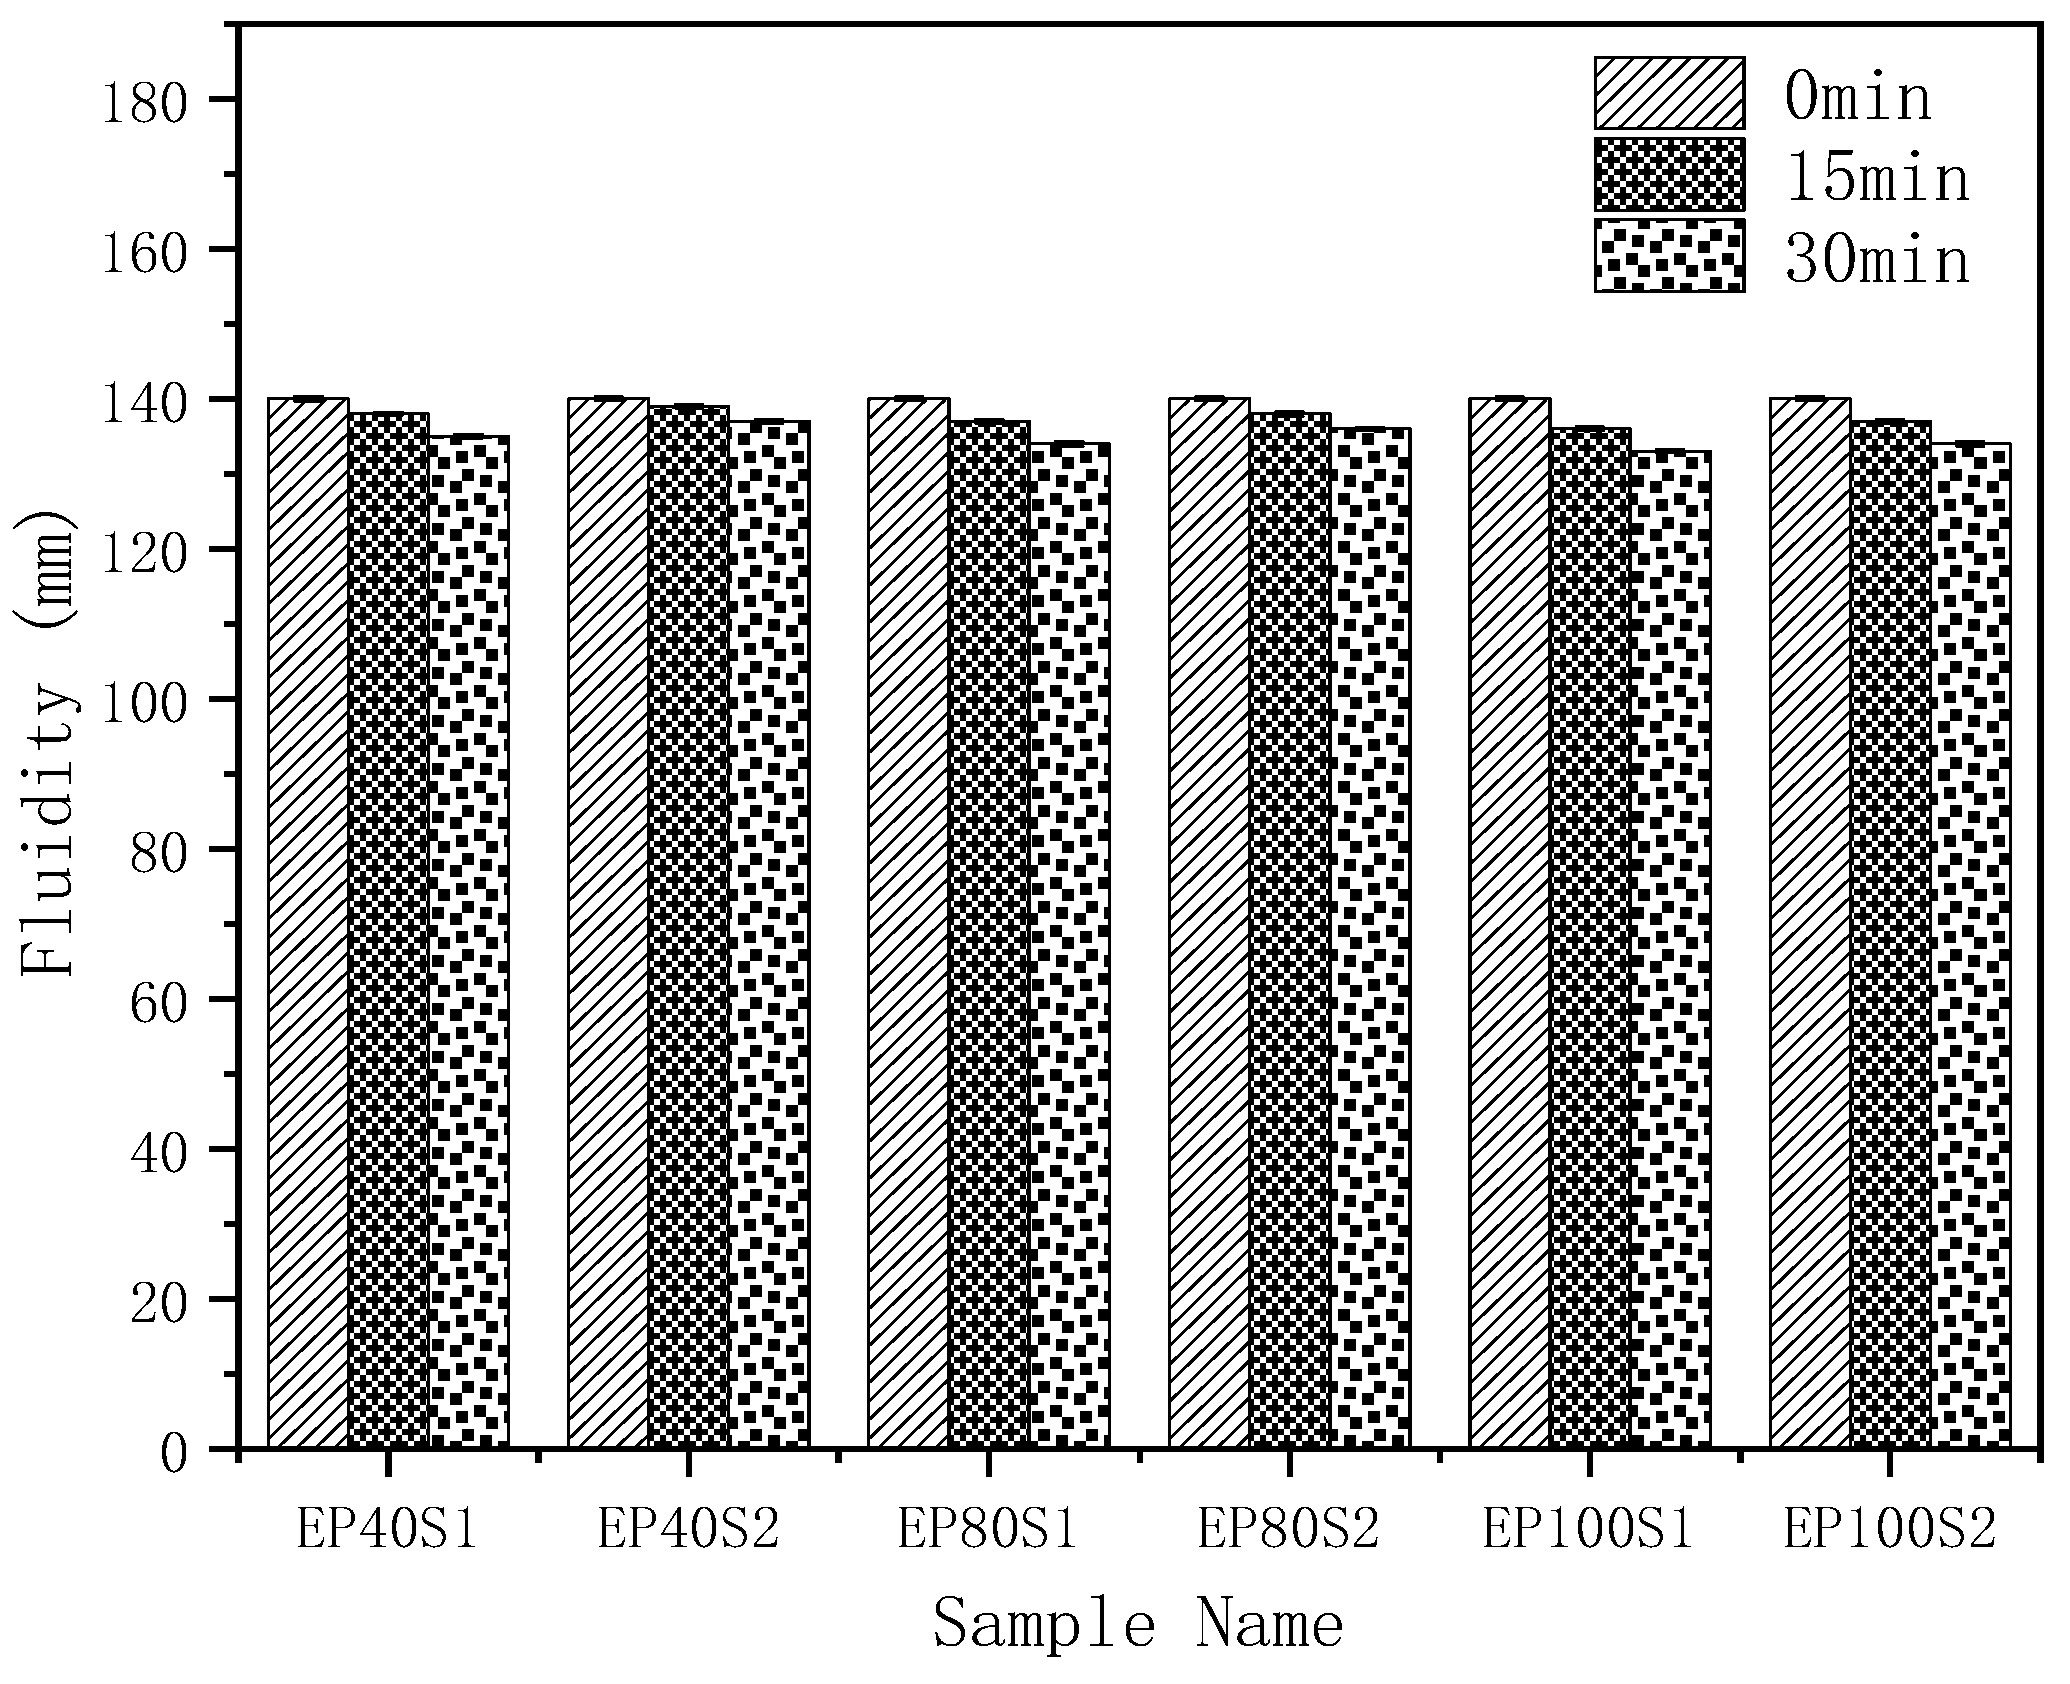
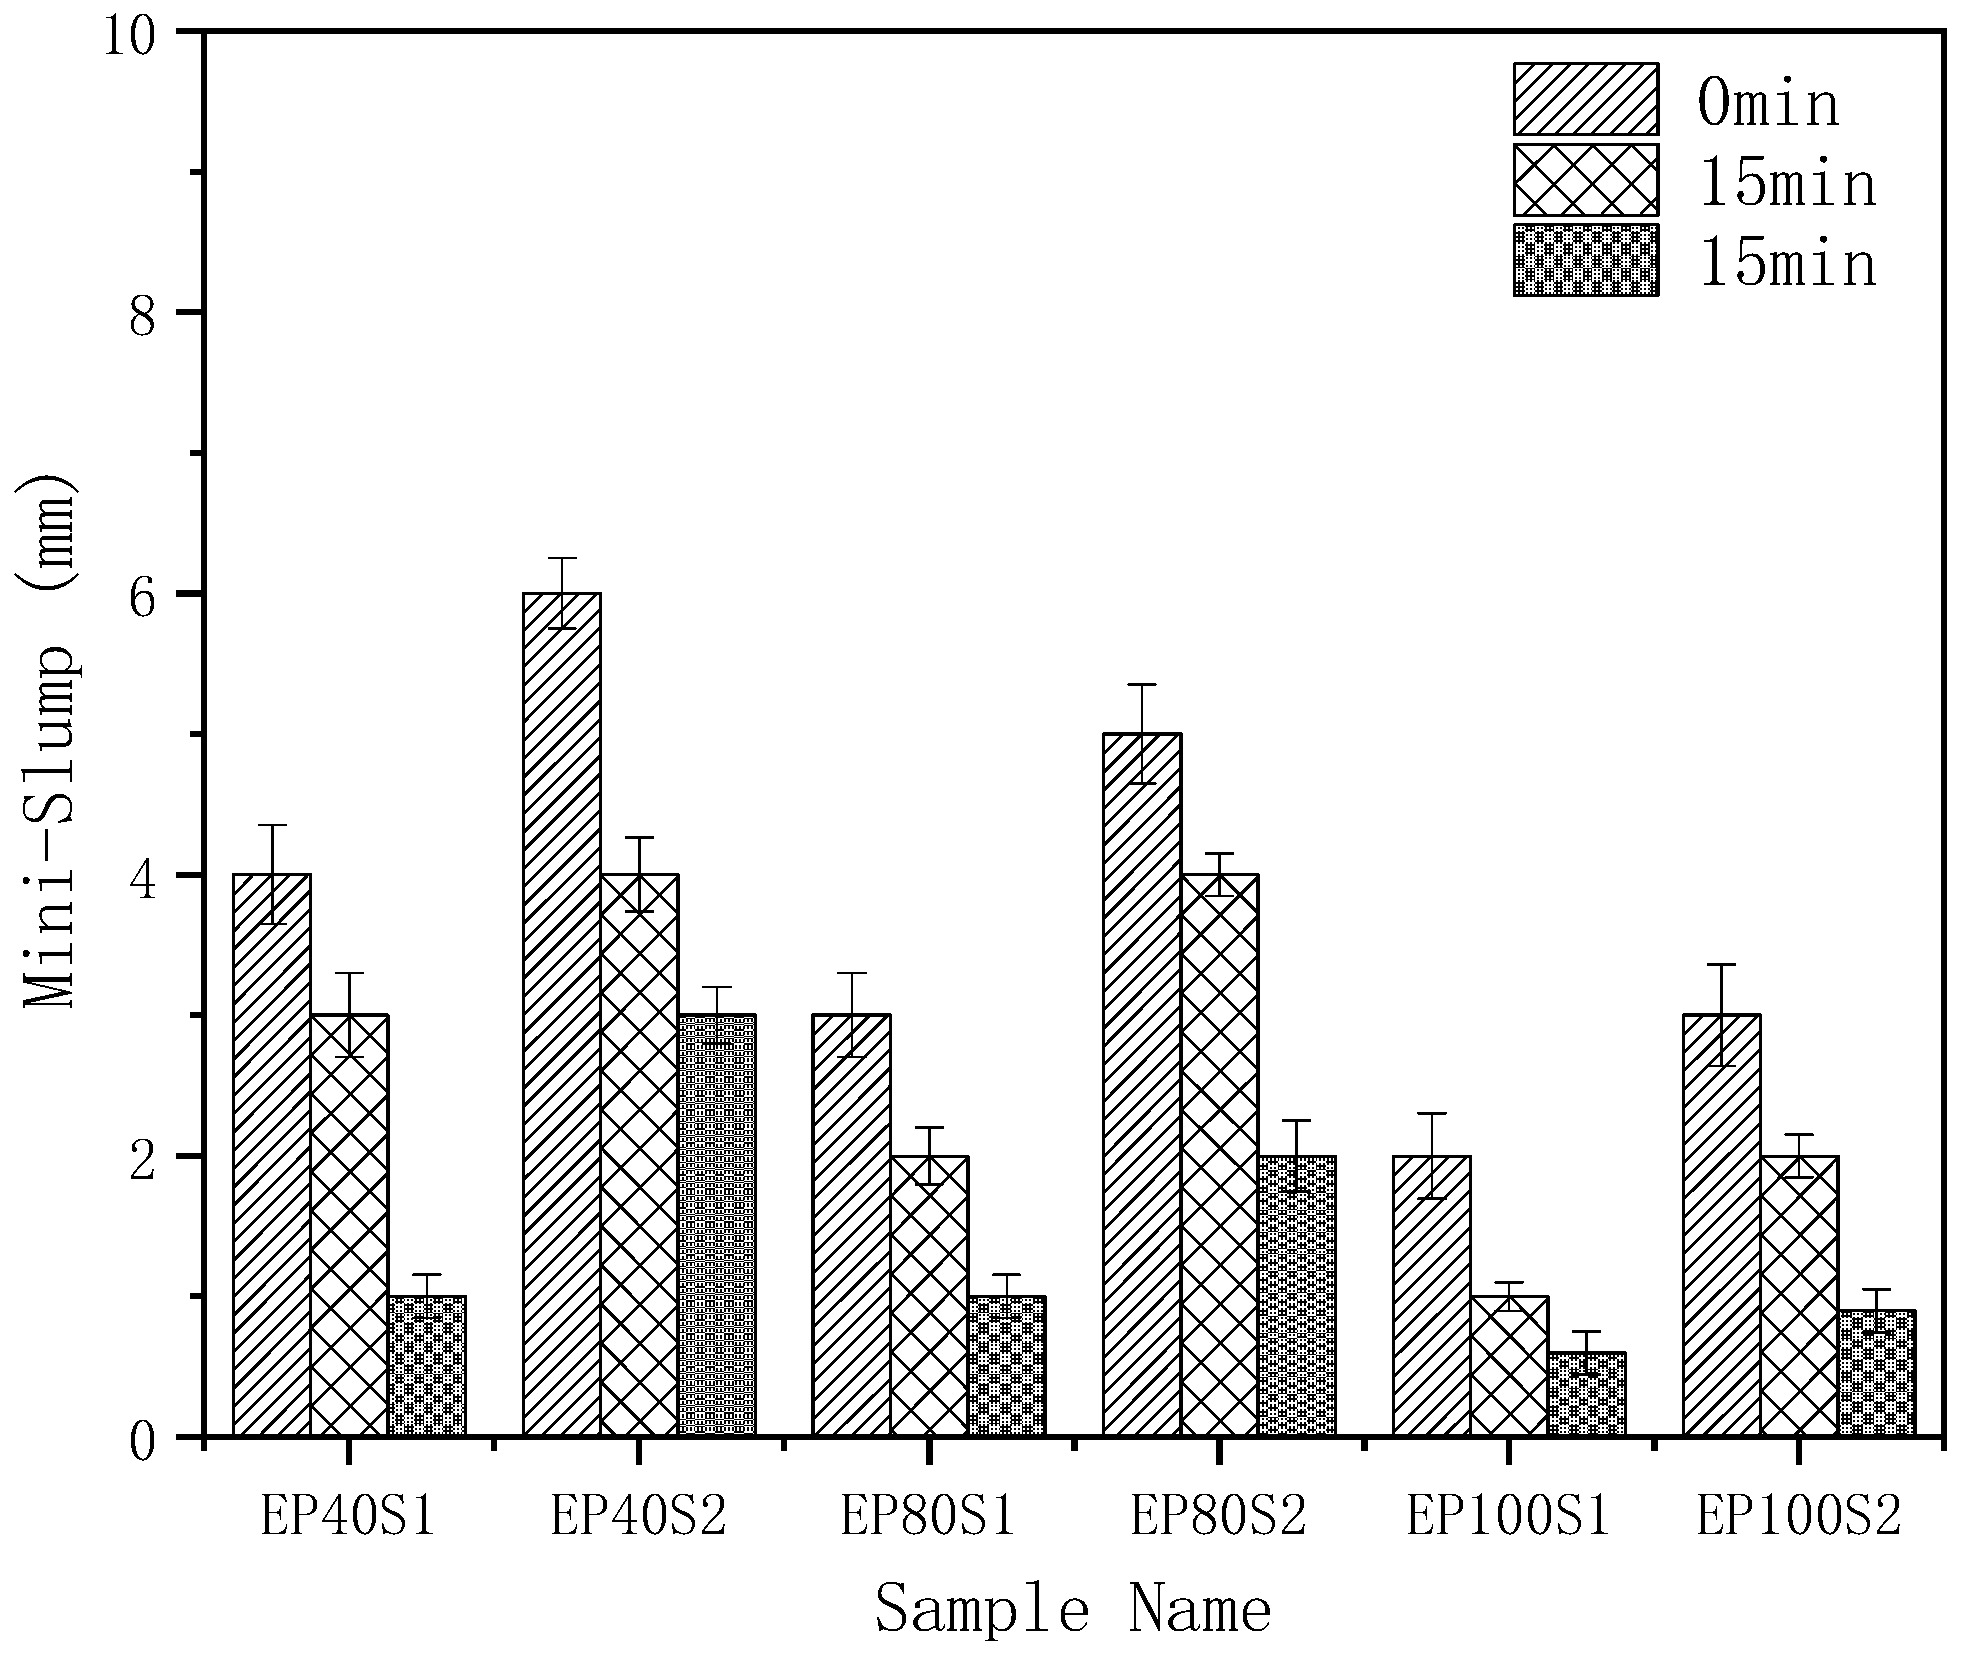
3.1. Flowability and Mini-Slump Testing

The high water absorption and irregular shape of expanded perlite can affect the printability of 3DPFC. Therefore, this study fixed the initial flowability of the different 3DPFCs at 140 mm. Figure 1 and Figure 2 show the results of the flowability and mini-slump tests for the 3DPFCs.
From Figure 1, it can be observed that the flowability of the different 3DPFCs changed over time. The influence of expanded perlite and foam on the flowability loss of 3DPFCs varies, but as shown in Figure 1, the overall trend in concrete flowability decreases from left to right. However, the decrease in flowability across different groups was minor, indicating that the substitution of expanded perlite enhances the stability of the foam. Figure 2 indicates that, while the initial flowability meets the printing requirements, the slump of the 3DPFCs remains within the range of 0–10 mm, indicating excellent constructability of the 3DPFCs. Over time, the slump of 3DPFCs decreases to varying degrees. Groups with a lower foam content have both a lower initial slump and a lower rate of change in slump compared to the groups with a higher foam content. This is due to the reduced impact of foam collapse in groups with less foam, where the added perlite provides better support for the concrete, resulting in greater foam stability [26].

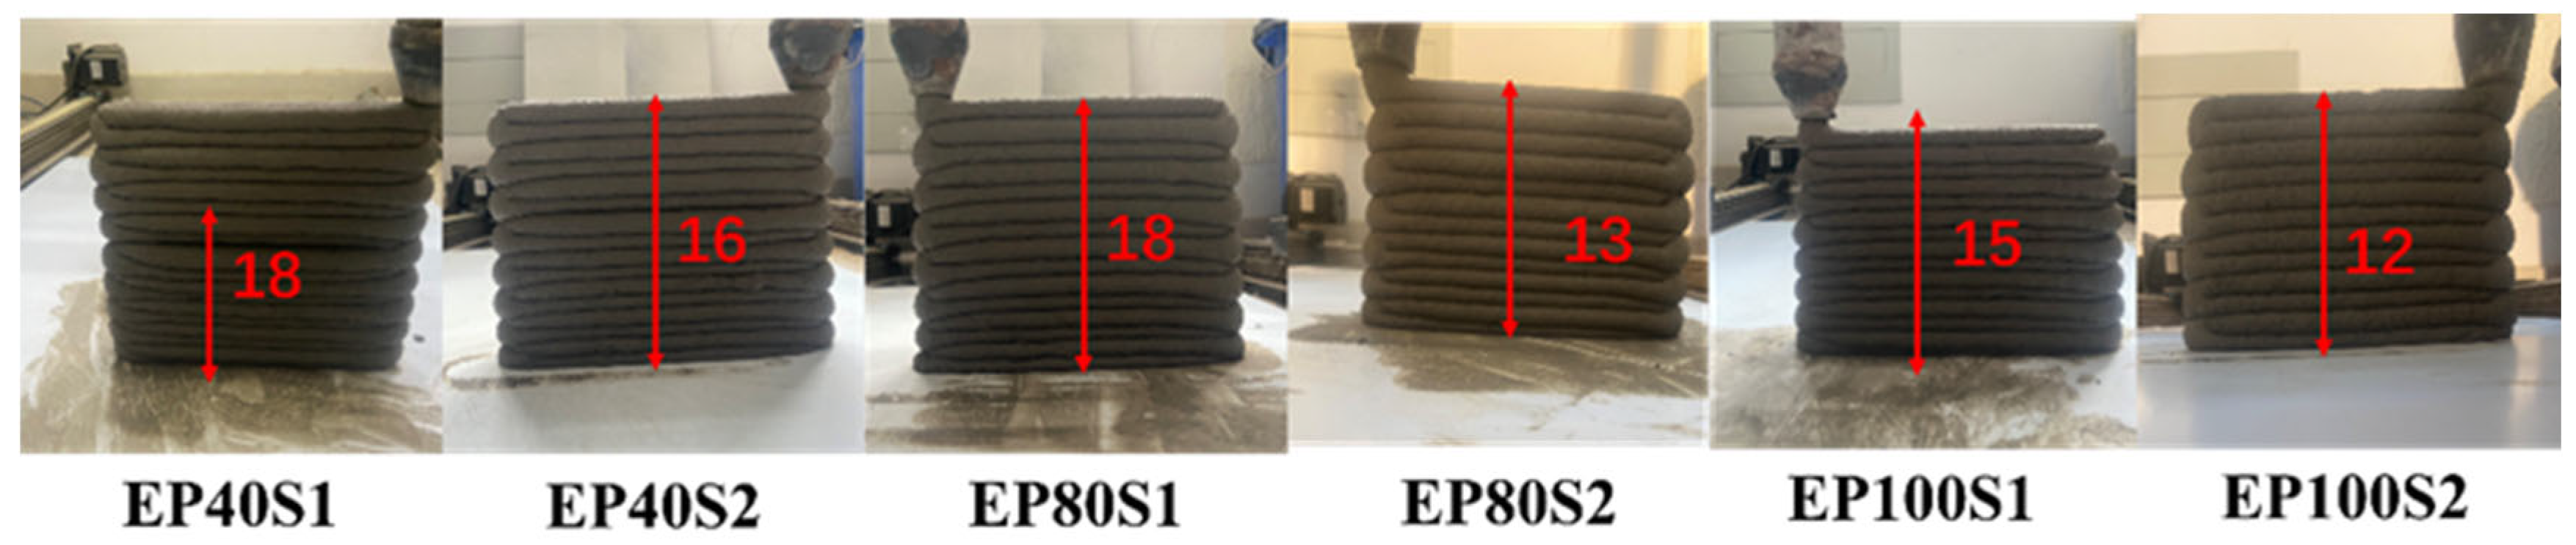
3.2. Constructability Testing

Figure 3 shows the laboratory printing results regarding the 3DPFC samples’ constructability. It can be observed that with the change in the formulation of 3DPFC, the printing height of the samples also varies significantly. Both sample EP40S1 and sample EP80S1 have a maximum single-print height of 18 layers. The maximum single-print height of sample EP80S1 is two layers more than that of sample EP40S2, while the maximum single-print height of sample EP100S1 is three layers more than that of sample EP80S2. Within a similar density range, samples with a higher expanded perlite content exhibit superior constructability.

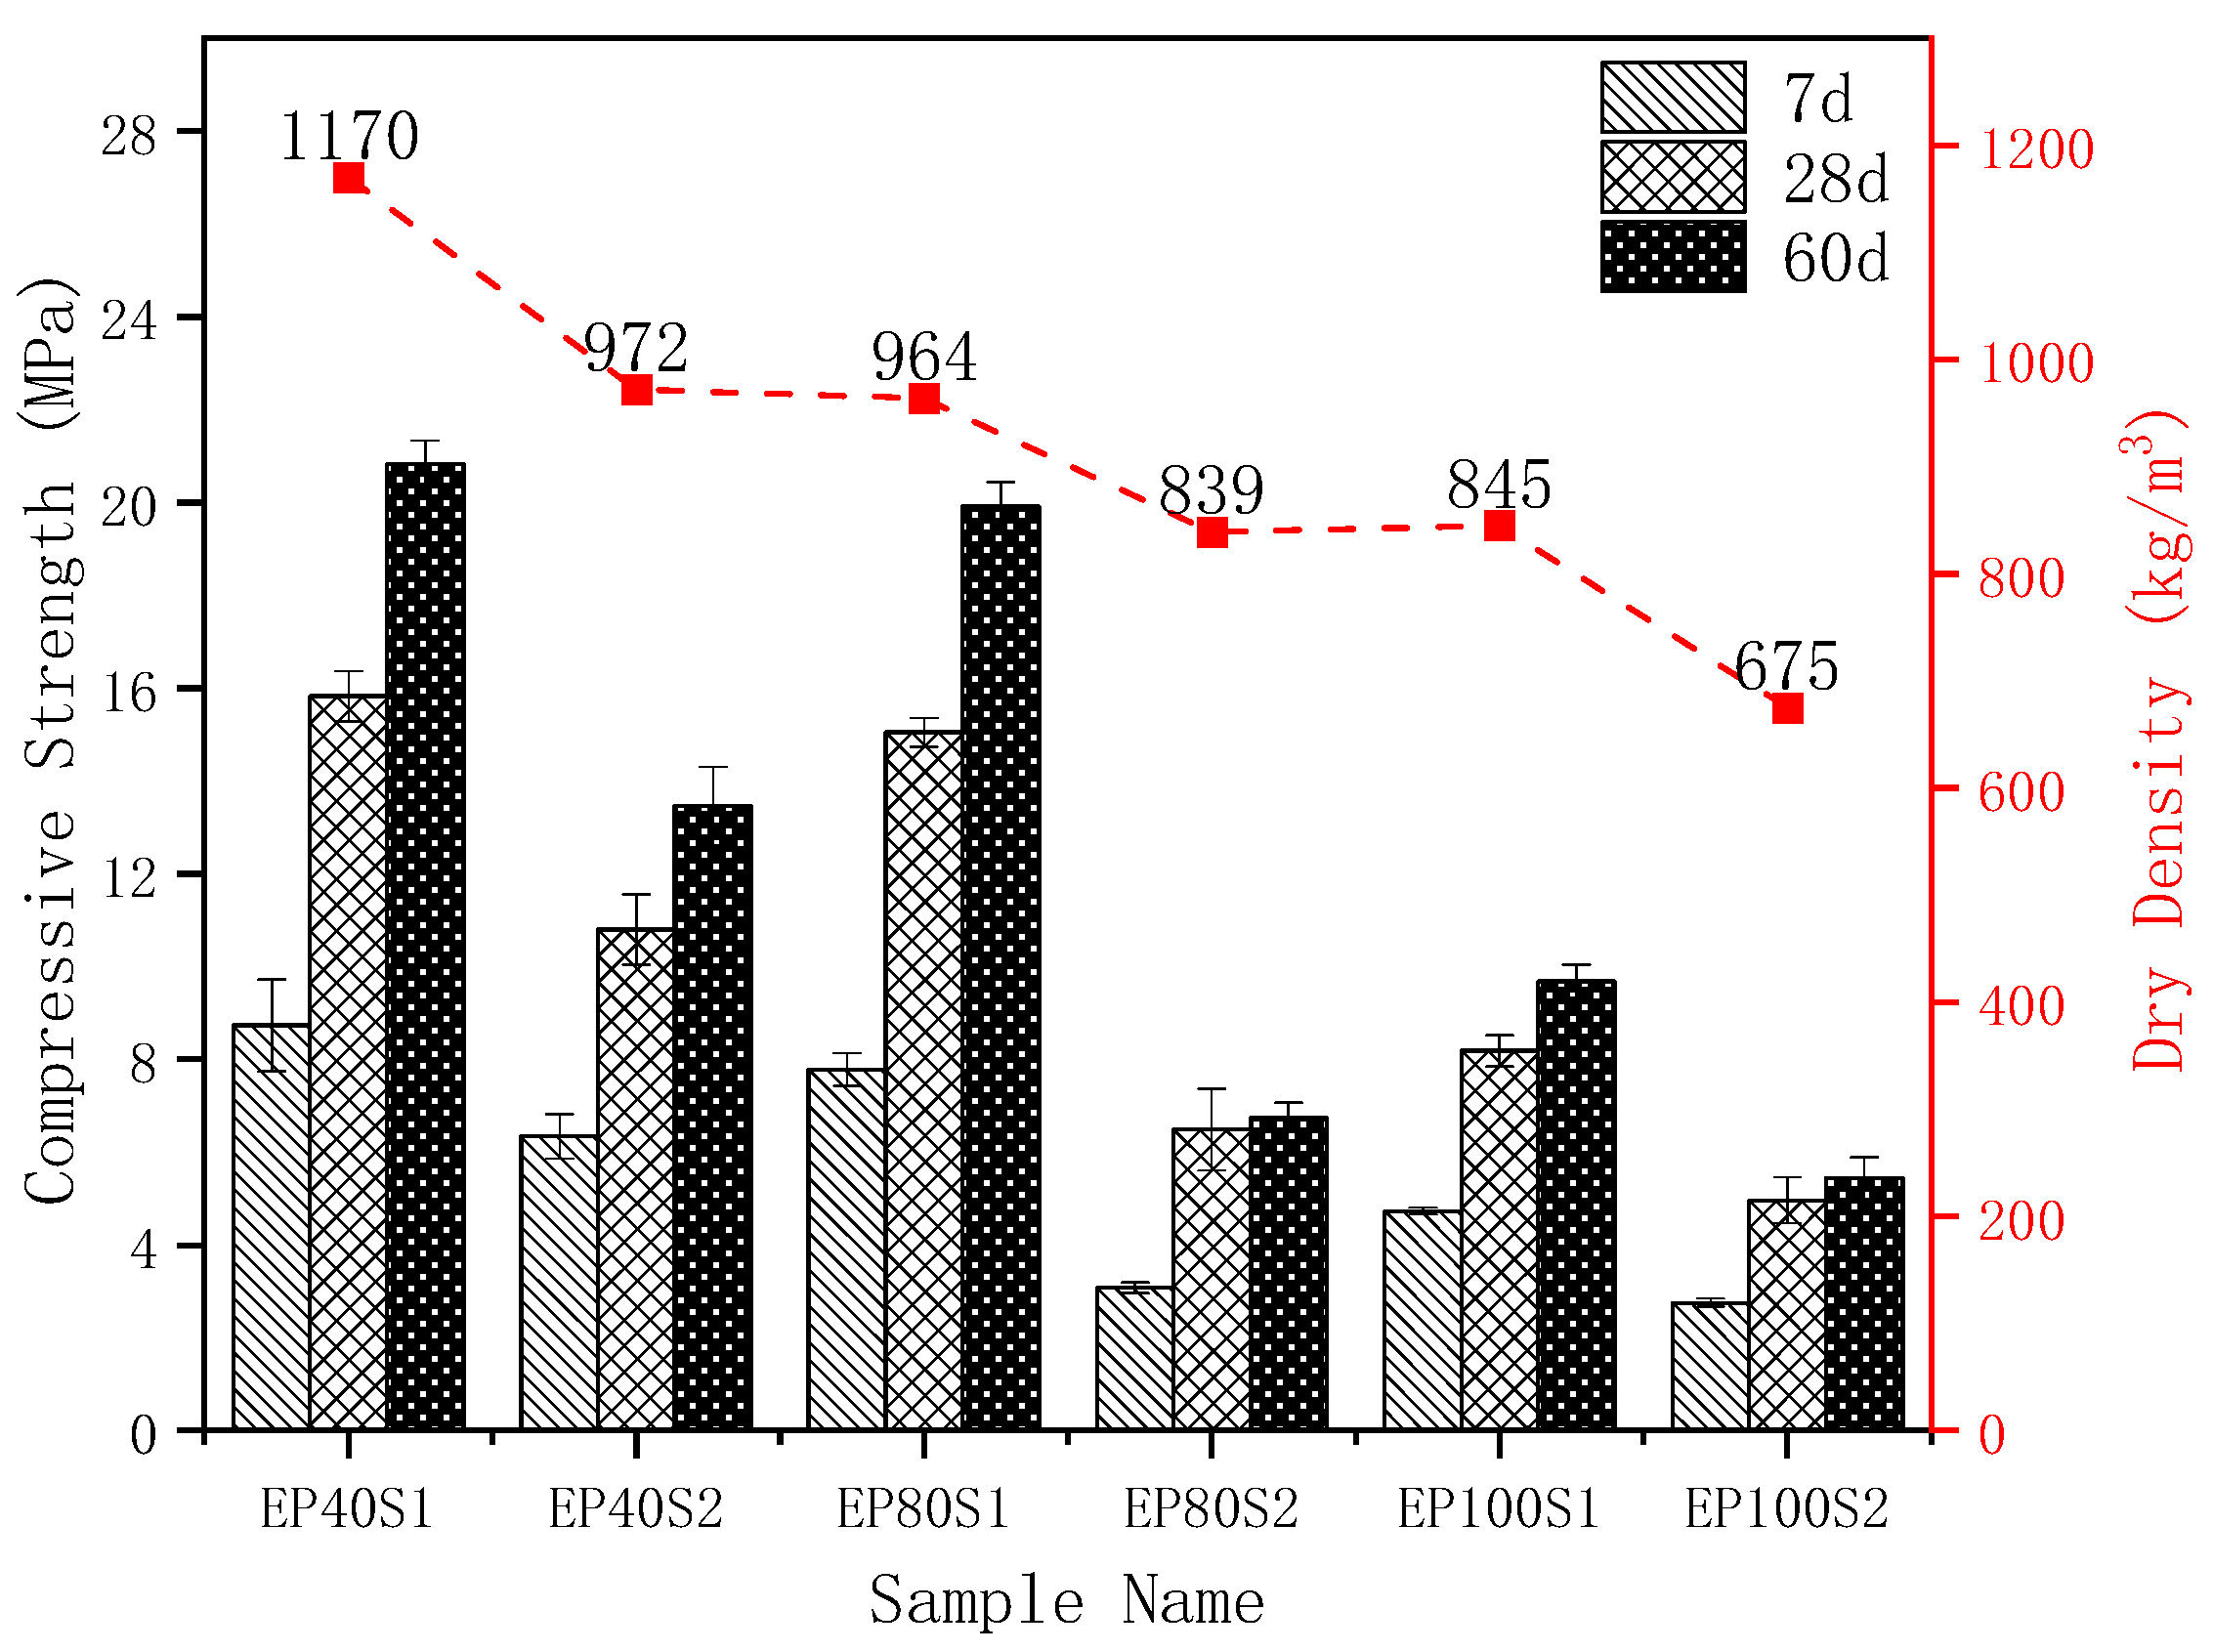
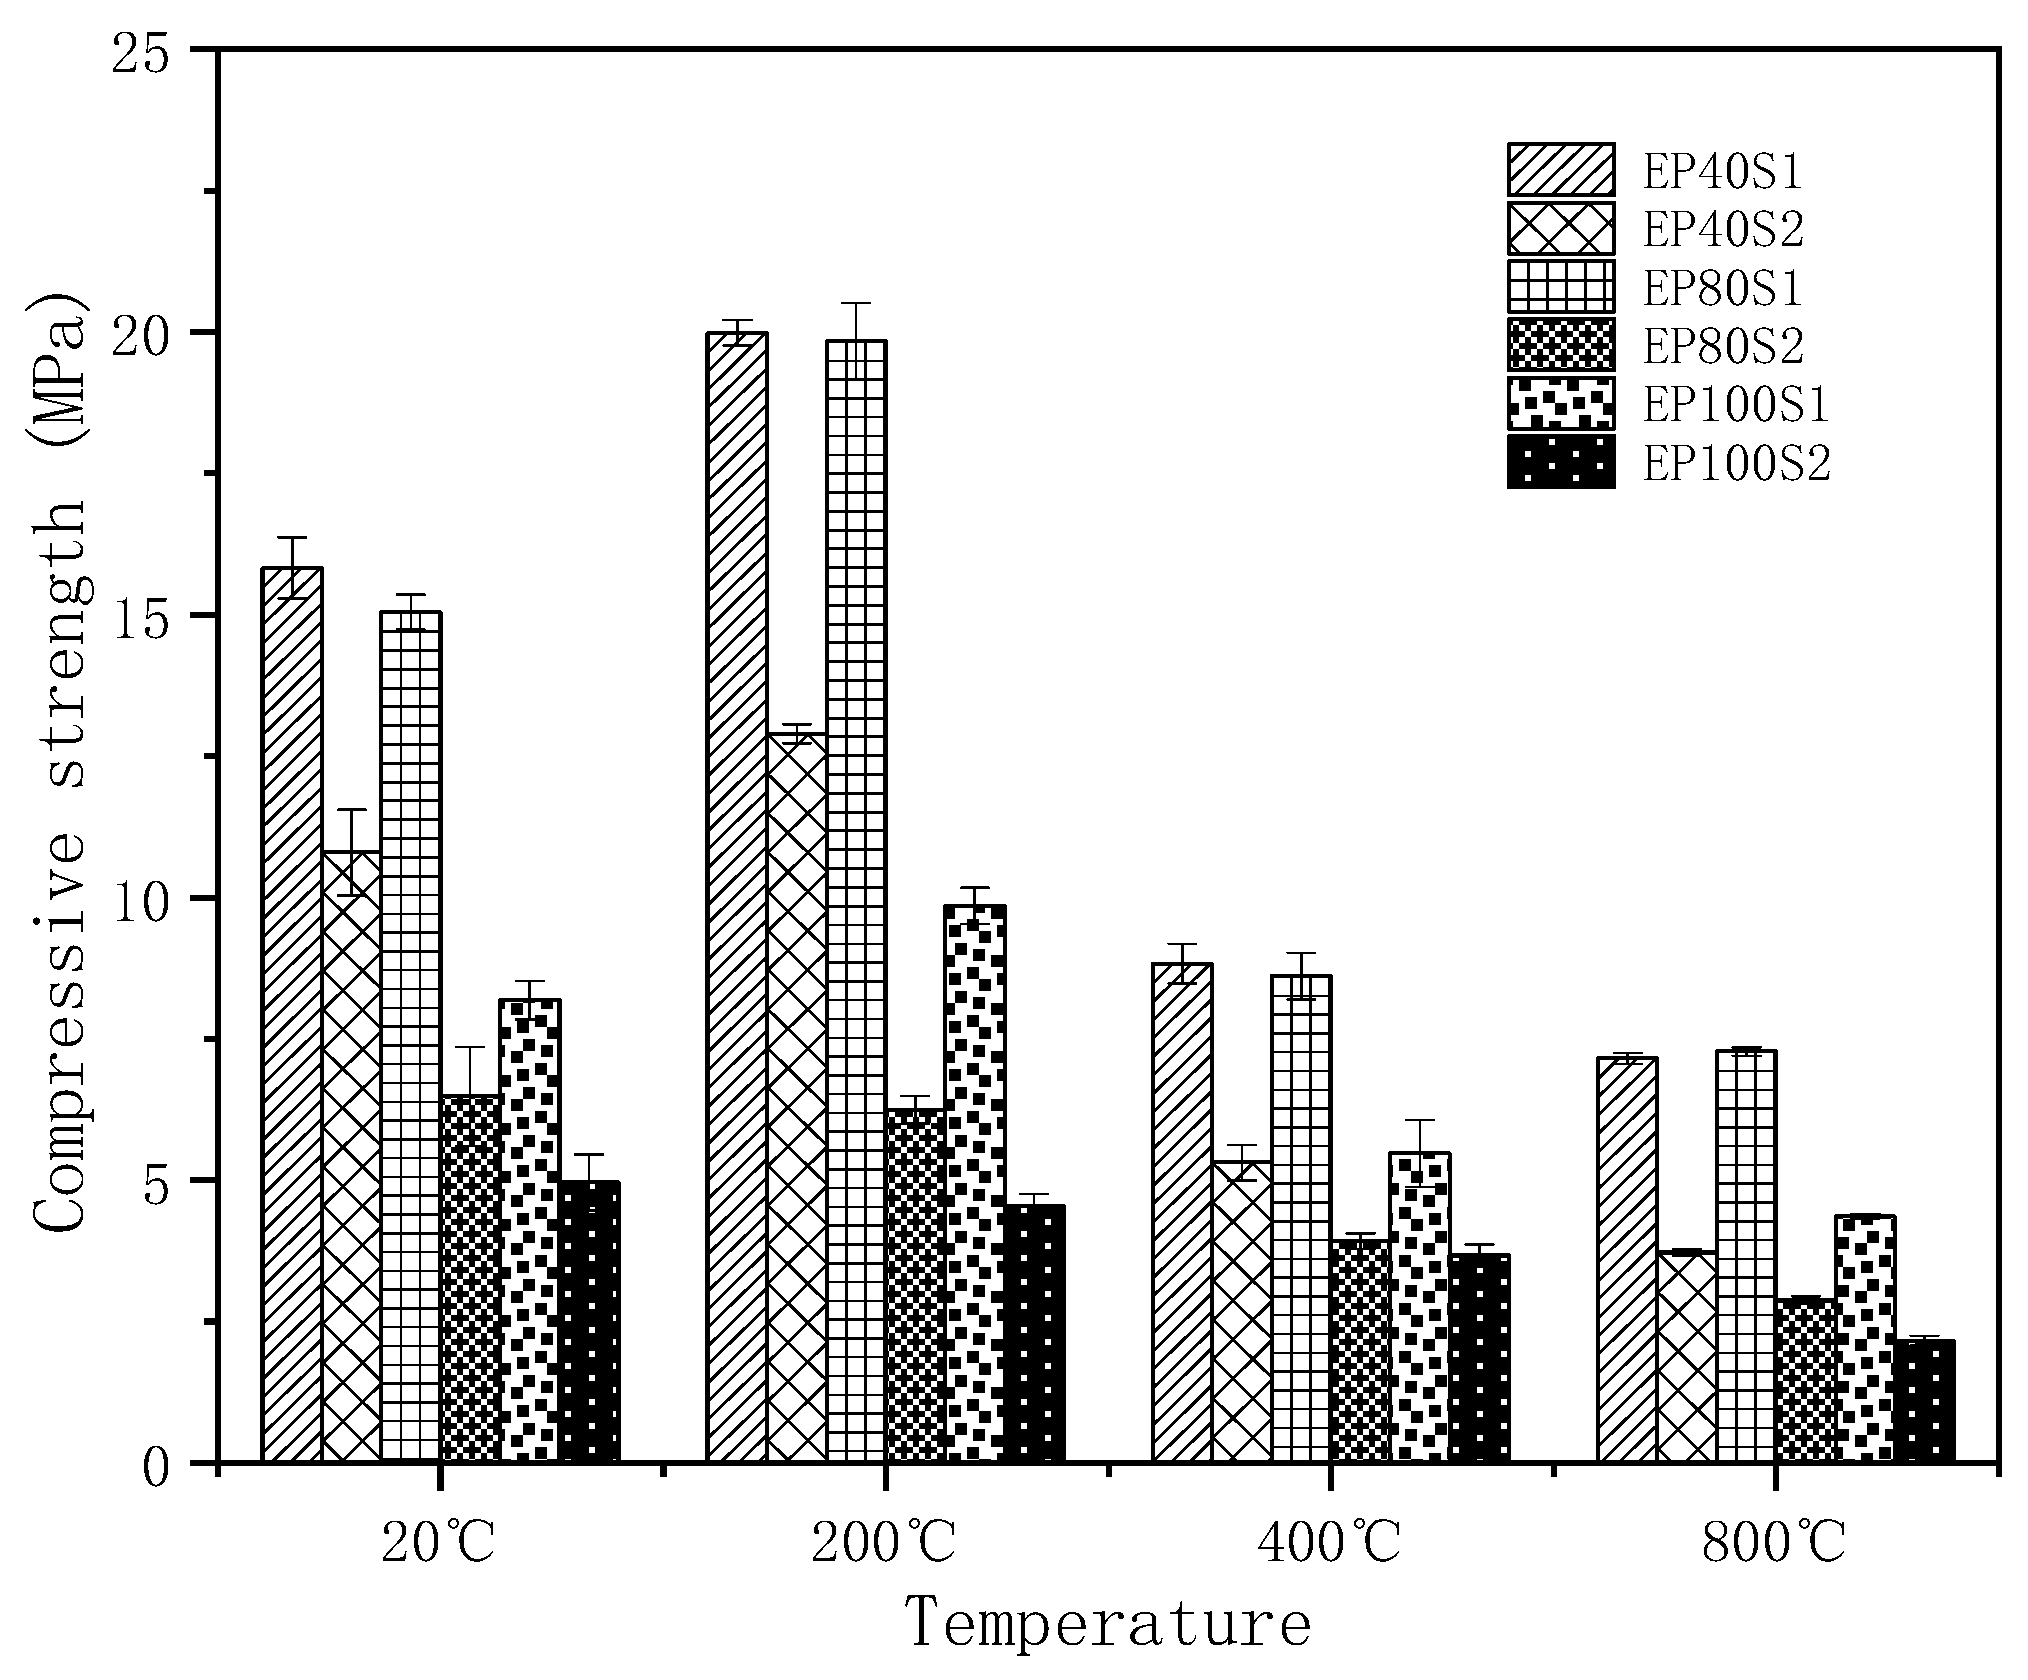
3.3. Compressive Strength and Dry Density

Figure 4 presents the test results for the compressive strength and dry density analyses of the 3DPFC. The specific parameters of the 3DPFC can be found in Table 2, with curing ages of 7 days, 28 days, and 60 days.
As shown in Figure 4, from left to right, the dry densities of the 3DPFC samples at 28 days are 1170 kg/m3, 972 kg/ m3, 964 kg/ m3, 839 kg/ m3, 845 kg/ m3, and 675 kg/ m3, respectively. Furthermore, it can be observed from Figure 4 that the compressive strength of the samples at 7 days, 28 days, and 60 days varies with the change in the formulation of the 3D-printed expanded perlite foam concrete. For instance, considering the 28-day compressive strength of the samples, sample EP40S2 and sample EP80S1 exhibit similar dry densities, with the 28-day compressive strength of sample EP40S2 at 10.80 MPa, while sample EP80S1 achieves a compressive strength of 15.05 MPa, indicating an increase of 39%. Similarly, samples EP80S2 and EP100S1, which have comparable dry densities, demonstrate 28-day compressive strengths of 6.49 MPa and 8.21 MPa, respectively, representing an increase of 26.5%. It is noteworthy that within the same density range, samples with higher replacement rates of expanded perlite exhibit significantly higher compressive strengths at 7 days, 28 days, and 60 days of curing compared to those with lower replacement rates. This variation can be explained by differences in foam content among the samples. Samples with lower replacement rates of expanded perlite often require more foam to achieve similar dry densities, while those with higher replacement rates require less foam, thereby enhancing the mechanical performance of the 3DPFC [41]. Additionally, samples with higher foam content exhibit higher porosity and larger pore sizes, which is a significant contributing factor to their lower compressive strength [42].
In comparison with previous studies on 3DFC [26,41], the 3DPFC presented in this study demonstrates notably higher compressive strength at similar dry densities.

3.4. Heat Resistance Performance Testing

Figure 5 illustrates the compressive strength of the 3DPFCs at different calcination temperatures. It is evident from Figure 5 that the compressive strength of the 3DPFCs underwent significant changes with increasing calcination temperatures. Following calcination at 200 °C, the compressive strength of all 3DPFCs noticeably increased. Specifically, sample EP80S1 exhibits a 31.8% increase in compressive strength after calcination at 200 °C, while sample EP40S2, with a similar density, only experienced a 19.4% increase. Similarly, the compressive strength of sample EP100S1 increases by 20.3%, while sample EP80S2 shows a modest increase of 1.5%. Evidently, samples with higher replacement rates of expanded perlite demonstrate greater improvements in compressive strength after calcination at 200 °C. This may be due to the expanded perlite reducing the foam content, which decreases the porosity and the number of large pores. Additionally, expanded perlite has better temperature stability than foam voids, resulting in less structural damage after high-temperature calcination [43,44]. As the calcination temperature rose to 400 °C, the compressive strength of all samples significantly decreased, stabilizing after calcination at 800 °C, which is consistent with previous research findings.

4. Mechanism Analyses

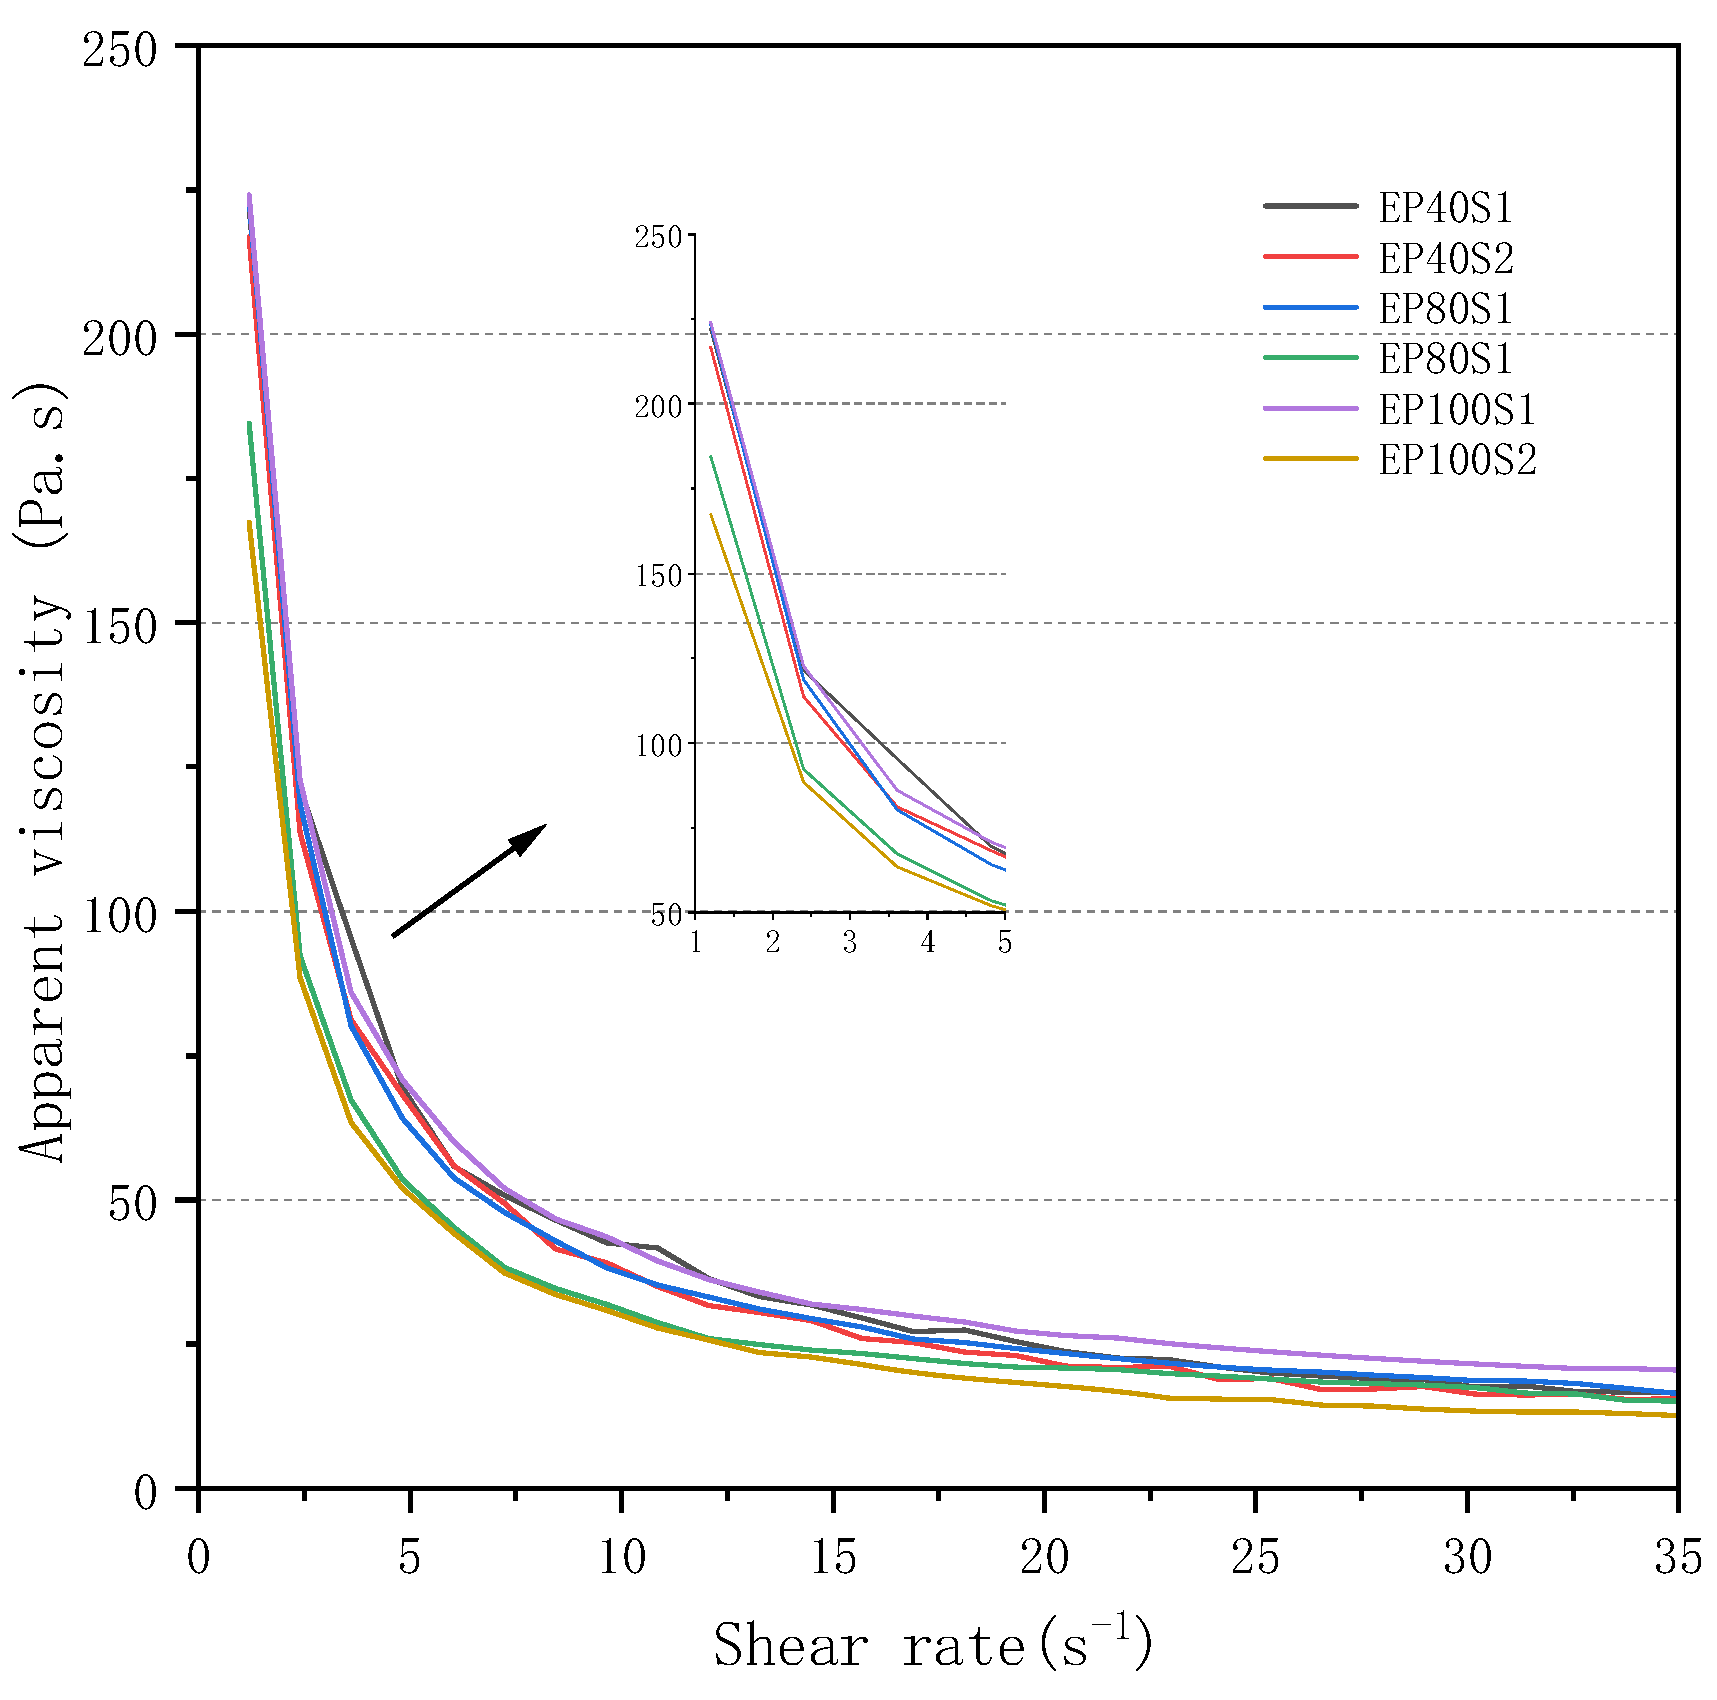
4.1. Rheological Analysis

Figure 6 shows the shear stress evolution over time for 3DPFC, while Figure 7 presents the static yield stress of the same material.
From Figure 6, it is evident that the shear stress of 3DPFC of different formulations exhibits an initial increase followed by a decrease over time, eventually stabilizing. The peak value of the shear stress evolution curve at a constant low shear rate over time is defined as the static yield stress [45,46]. Figure 7 shows that the substitution rate of expanded perlite significantly affects the static yield stress of 3DPFCs. Sample EP80S1 exhibits the highest static yield stress at 1722.374 Pa, which is 166.512 Pa higher than that of sample EP40S1. This could be due to the porous structure of expanded perlite, which absorbs free water between particles, thereby increasing interparticle friction. However, when the level of expanded perlite substitution reaches 100%, the static yield stress decreases to 1225.399 Pa, as seen for sample EP100S1. This phenomenon may be attributed to the low density and strength of expanded perlite itself, reducing the power required for rotation.
Furthermore, within a similar density range, sample EP80S1 exhibits higher static yield stress than sample EP40S2. Similarly, the static yield stress of sample EP100S1 is also higher than that of sample EP80S2. This can be explained by (1) the irregular shape and water absorption capacity of expanded perlite, which increase the interparticle friction in 3DPFC; and (2) the higher levels of expanded perlite substitution, which reduce foam usage and thereby decrease the total porosity and the number of large pores in 3DPFC under similar dry density conditions. However, when the substituted level of expanded perlite is the same, samples with a higher foam content exhibit lower static yield stress, which can also be explained by the development of the pore structure in the 3D-printed expanded perlite foam concrete [12,29].
According to Figure 8, it is evident that as the shear rate increases, the apparent viscosity of all 3DPFCs initially decreases rapidly, then slows down, and finally stabilizes. This means that the printing slurry under various proportions exhibits noticeable shear-thinning behavior as the shear rate increases, and with a further increase in shear rate, the plastic viscosity of the cement slurry gradually reaches a steady state. This is because the internal flocculation structure of the printing concrete is disrupted during the testing process, leading to a decrease in slurry viscosity. Additionally, from Figure 8, it can be observed that with a lower foam content, the apparent viscosities of samples EP40S1, EP80S1, and EP100S1 are similar. This indicates that at low foam concentrations in 3D-printed concrete, the substitution level of expanded perlite has little effect on the apparent viscosity of 3DPFC. In contrast, with a higher foam content, samples EP40S2, EP80S2, and EP100S2 exhibit a gradual decrease in apparent viscosity. This may be due to the reduced density of the paste around the foam at higher substitution rates of expanded perlite, which results in a better shape retention of the foam under the same compressive shear conditions, and the fact that most of the expanded perlite particles are irregularly shaped spheres, thus leading to a decrease in apparent viscosity with an increase in the expanded perlite substitution rate.

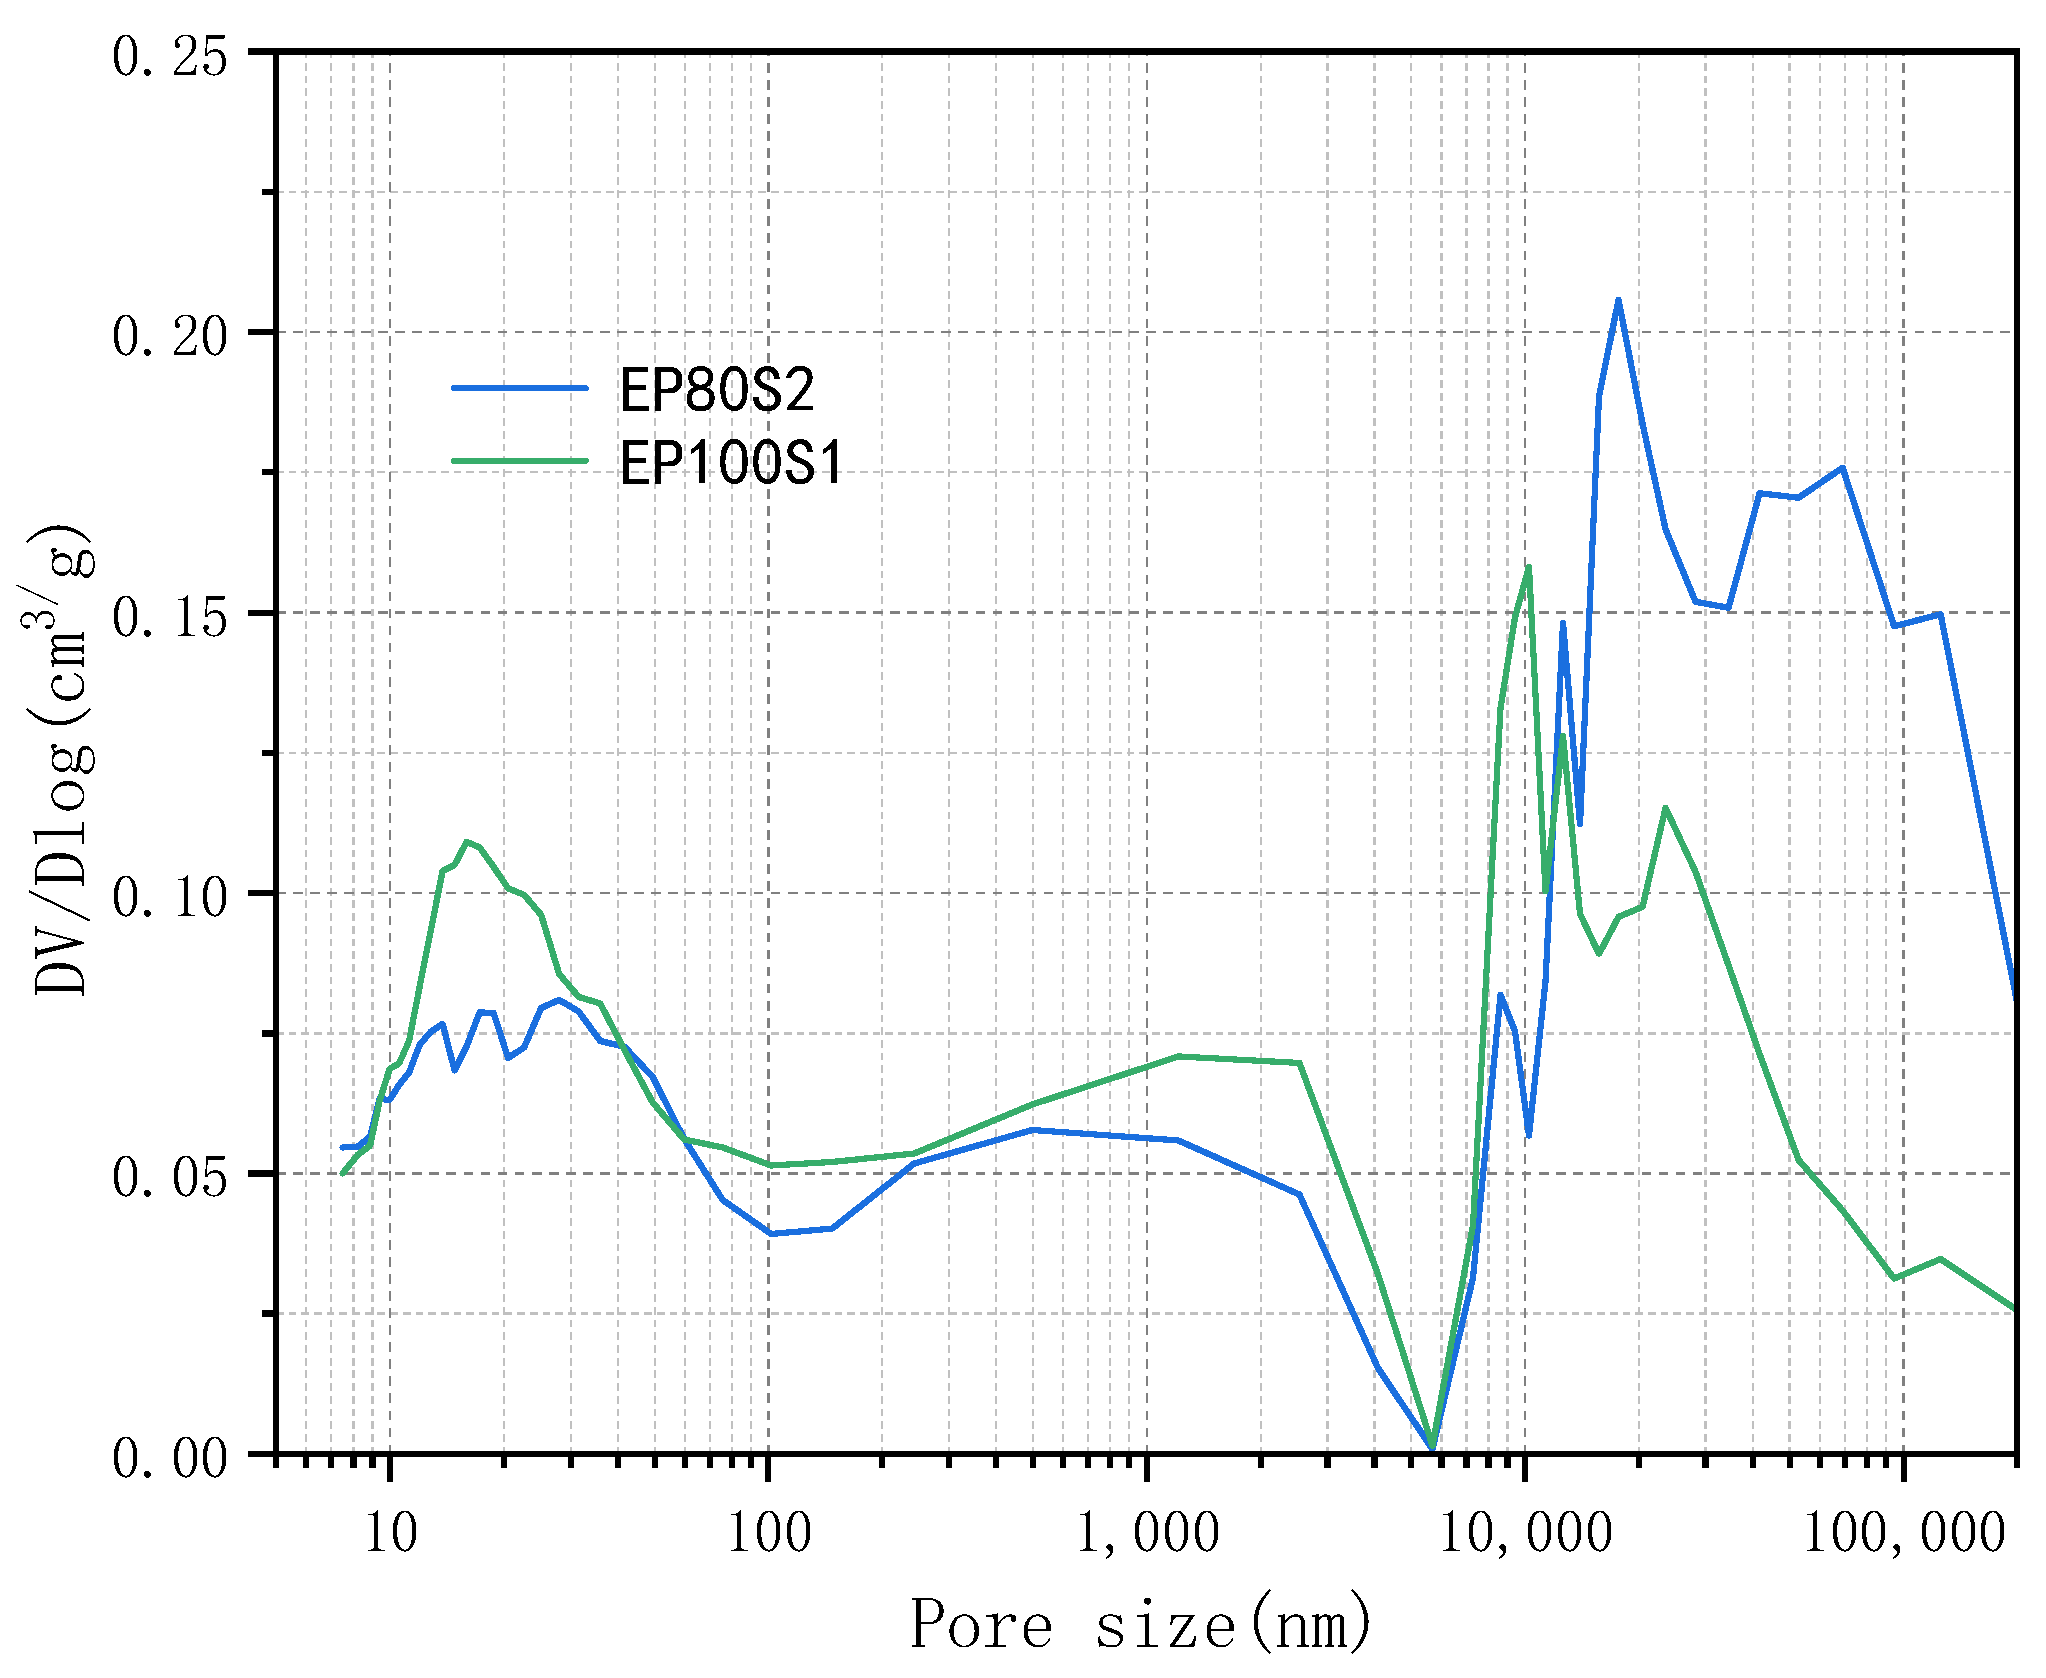
4.2. Pore Structure Analysis
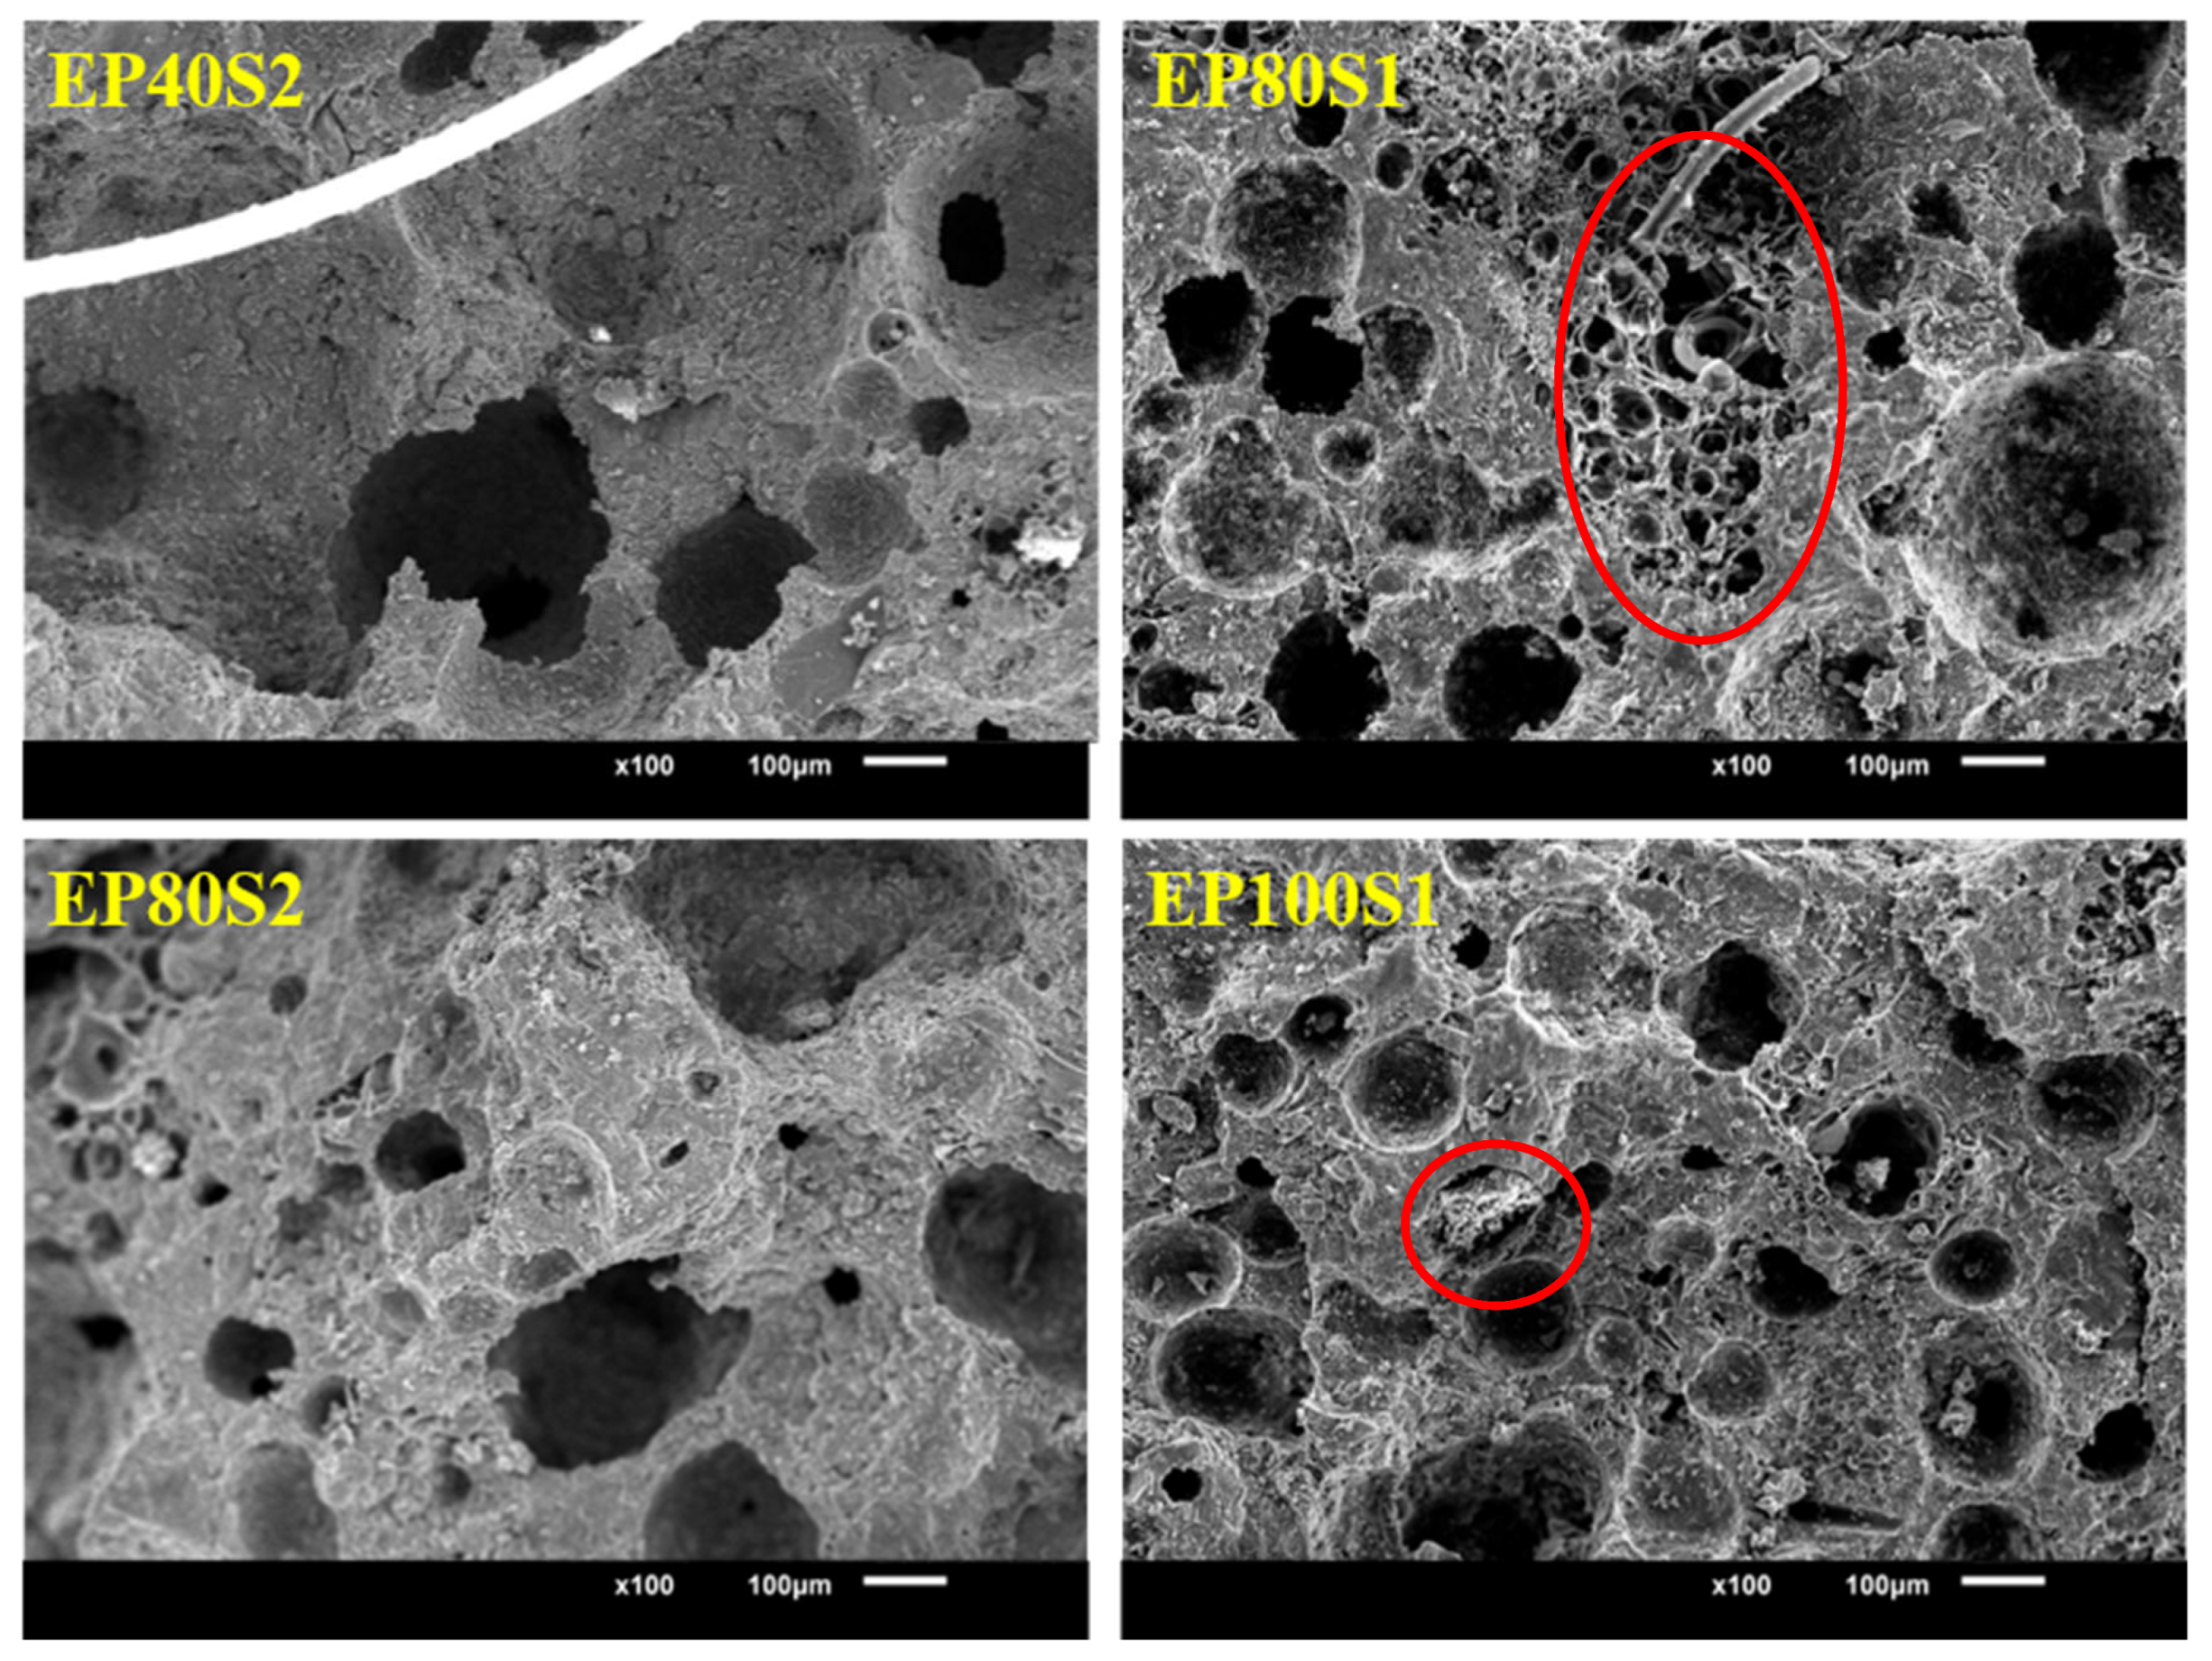
Figure 9 and Figure 10 illustrate the pore distribution patterns of samples EP80S2 and EP100S1. Based on the size of the pores in concrete, pores are generally categorized as micropores (diameter < 10 nm), mesopores (10–50 nm), capillary pores (50–1000 nm), and macropores (>1000 nm).
It is evident from Figure 9 that the distribution of micropores in samples EP100S1 and EP80S2 is essentially similar, possibly due to the fact that they share the same cementitious material system. However, sample EP100S1 evidently contains more mesopores and capillary pores, likely due to its increased content of expanded perlite and decreased foam content [31,41]. It is worth noting that the mercury intrusion porosimetry (MIP) method cannot accurately capture pores typically larger than 10,000 nm, so even if these pores collapse under compressive pressure, they cannot be captured with MIP. However, within the pore size range that can be measured by MIP, smaller pores merge under compressive pressure, forming larger pores. The corresponding differential volume curve obtained from the compressed sample reveals a significant increase in the peak and a rightward shift for sample EP80S2, indicating that it contains more macropores. As depicted in Figure 10, sample EP80S2 exhibits a higher total porosity. In a similar density range, the number of macropores and total porosity of sample EP100S1 decreases compared to sample EP80S2, a reduction associated with the lower foam content in EP100S1 [26]. It should be noted that the 3DPFCs’ macropores contents and total porosity are closely related to their mechanical properties. Generally, the compressive strength of the 3DPFCs decreases with an increase in porosity, which is consistent with the results of compressive strength tests.

4.3. SEM

Figure 11 depicts the SEM images of samples EP40S2, EP80S1, EP80S2, and EP100S1 at a magnification of 100 times. The SEM images reveal significant differences in the pore sizes and distributions within the hardened foam concrete among the various samples. A noticeable decrease in pore size is observed in EP80S1 compared to sample EP40S2; a similar phenomenon is also observed in EP80S2 and EP100S1. This may be attributed to the reduction in foam content and the incorporation of expanded perlite, which decreases the coalescence of foam pores and stabilizes them within a smaller pore size range; additionally, in samples with higher expanded perlite content, it was observed that the expanded perlite filled the larger pores formed by the foam, which further reduced the porosity and the number of large pores (As shown in the red circle in Figure 11). By comparing the pore morphology of the hardened pastes at similar densities, it is evident that the size of voids in mixtures with a high perlite replacement rate significantly decreases. This phenomenon is attributed to the increased perlite replacement rate and the reduced foam content in these 3DPFCs [26].

5. Conclusions

To reduce the dry density of 3DPFCs and enhance their mechanical properties and printability, this study investigated the impact of replacing river sand with expanded perlite on the printability, constructability, mechanical strength, thermal insulation, and heat resistance of 3DFC, and provides a mechanistic analysis.
  • Introducing expanded perlite (EP) to replace river sand in 3DFC reduces its dry density and thermal conductivity. Higher perlite replacement ratios lead to superior mechanical performance within a similar density range.
  • At similar densities, the group with higher perlite replacement ratios exhibits higher static yield stress and apparent viscosity. The addition of expanded perlite enhances the constructability of 3DFC.
  • Higher perlite replacement ratios result in lower porosity and smaller pore sizes at similar densities.
  • Expanded perlite reduces foam coalescence, maintaining smaller pore sizes and filling larger pores. This decreases the amount of large pores and the total porosity, thus enhancing strength.

Author Contributions

S.J.: methodology, validation, formal analysis, investigation, data curation, writing—original draft preparation. Y.W.: investigation, data curation, resources. S.H.: conceptualization, writing—review and editing, supervision. H.Y.: writing—review and editing, supervision. Y.Z.: investigation, formal analysis, data curation, resources. All authors have read and agreed to the published version of the manuscript.

Funding

This research received no external funding.

Institutional Review Board Statement

Not applicable.

Informed Consent Statement

Not applicable.

Data Availability Statement

The original contributions presented in the study are included in the article, further inquiries can be directed to the corresponding author.

Acknowledgments

This work was supported by funds from Priority Academic Program Development of Jiangsu Higher Education Institutions (PAPD) and the Social Development of Science and Technology Department of Jiangsu Province as part of the Major Science and Technology Demonstration Project (BE2022608).

Conflicts of Interest

The authors declare no conflicts of interest.

References

  1. Jindal, B.B.; Sharma, R. The effect of nanomaterials on properties of geopolymers derived from industrial by-products: A state-of-the-art review. Constr. Build. Mater. 2020, 252, 119028. [Google Scholar] [CrossRef]
  2. Paul, S.C.; Tay, Y.W.D.; Panda, B.; Tan, M.J. Fresh and hardened properties of 3D printable cementitious materials for building and construction. Arch. Civ. Mech. Eng. 2018, 18, 311–319. [Google Scholar] [CrossRef]
  3. Batikha, M.; Jotangia, R.; Baaj, M.Y.; Mousleh, I. 3D concrete printing for sustainable and economical construction: A comparative study. Autom. Constr. 2022, 134, 104087. [Google Scholar] [CrossRef]
  4. Zhang, J.; Wang, J.; Dong, S.; Yu, X.; Han, B. A review of the current progress and application of 3D printed concrete. Compos. Part A Appl. Sci. Manuf. 2019, 125, 105533. [Google Scholar] [CrossRef]
  5. Jindal, B.B.; Jangra, P. 3D Printed Concrete: A comprehensive review of raw material’s properties, synthesis, performance, and potential field applications. Constr. Build. Mater. 2023, 387, 131614. [Google Scholar] [CrossRef]
  6. Wrobel, R.; Mecrow, B. Additive manufacturing in construction of electrical machines–a review. In Proceedings of the 2019 IEEE Workshop on Electrical Machines Design, Control and Diagnosis (WEMDCD), Athens, Greece, 22–23 April 2019; pp. 15–22. [Google Scholar]
  7. Du Plessis, A.; Babafemi, A.J.; Paul, S.C.; Panda, B.; Tran, J.P.; Broeckhoven, C. Biomimicry for 3D concrete printing: A review and perspective. Addit. Manuf. 2021, 38, 101823. [Google Scholar] [CrossRef]
  8. Furet, B.; Poullain, P.; Garnier, S. 3D printing for construction based on a complex wall of polymer-foam and concrete. Addit. Manuf. 2019, 28, 58–64. [Google Scholar] [CrossRef]
  9. Xiao, J.; Liu, H.; Ding, T. Finite element analysis on the anisotropic behavior of 3D printed concrete under compression and flexure. Addit. Manuf. 2021, 39, 101712. [Google Scholar] [CrossRef]
  10. Kruger, J.; du Plessis, A.; van Zijl, G. An investigation into the porosity of extrusion-based 3D printed concrete. Addit. Manuf. 2021, 37, 101740. [Google Scholar] [CrossRef]
  11. Lowke, D.; Talke, D.; Dressler, I.; Weger, D.; Gehlen, C.; Ostertag, C.; Rael, R. Particle bed 3D printing by selective cement activation–Applications, material and process technology. Cem. Concr. Res. 2020, 134, 106077. [Google Scholar] [CrossRef]
  12. Liu, Z.; Li, M.; Tay, Y.W.D.; Weng, Y.; Wong, T.N.; Tan, M.J. Rotation nozzle and numerical simulation of mass distribution at corners in 3D cementitious material printing. Addit. Manuf. 2020, 34, 101190. [Google Scholar] [CrossRef]
  13. Jones, S.Z.; Hipp, J.B.; Allen, A.J.; Gagnon, C.V. Rheology and microstructure development of hydrating tricalcium silicate-implications for additive manufacturing in construction. Cem. Concr. Res. 2022, 152, 106651. [Google Scholar] [CrossRef]
  14. Narayanan, N.; Ramamurthy, K. Structure and properties of aerated concrete: A review. Cem. Concr. Compos. 2000, 22, 321–329. [Google Scholar] [CrossRef]
  15. Concrete, A. Guide for Structural Lightweight; ACI: Indonesia, India, 1987. [Google Scholar]
  16. Ke, Y.; Beaucour, A.; Ortola, S.; Dumontet, H.; Cabrillac, R. Influence of volume fraction and characteristics of lightweight aggregates on the mechanical properties of concrete. Constr. Build. Mater. 2009, 23, 2821–2828. [Google Scholar] [CrossRef]
  17. Dinelli, G.; Belz, G.; Majorana, C.; Schrefler, B. Experimental investigation on the use of fly ash for lightweight precast structural elements. Mater. Struct. 1996, 29, 632–638. [Google Scholar] [CrossRef]
  18. Roberz, F.; Loonen, R.; Hoes, P.; Hensen, J. Ultra-lightweight concrete: Energy and comfort performance evaluation in relation to buildings with low and high thermal mass. Energy Build. 2017, 138, 432–442. [Google Scholar] [CrossRef]
  19. Real, S.; Gomes, M.G.; Rodrigues, A.M.; Bogas, J.A. Contribution of structural lightweight aggregate concrete to the reduction of thermal bridging effect in buildings. Constr. Build. Mater. 2016, 121, 460–470. [Google Scholar] [CrossRef]
  20. Jones, M.; McCarthy, A. Utilising unprocessed low-lime coal fly ash in foamed concrete. Fuel 2005, 84, 1398–1409. [Google Scholar] [CrossRef]
  21. Alnahhal, A.M.; Alengaram, U.J.; Yusoff, S.; Singh, R.; Radwan, M.K.; Deboucha, W. Synthesis of sustainable lightweight foamed concrete using palm oil fuel ash as a cement replacement material. J. Build. Eng. 2021, 35, 102047. [Google Scholar] [CrossRef]
  22. Alghamdi, H.; Neithalath, N. Synthesis and characterization of 3D-printable geopolymeric foams for thermally efficient building envelope materials. Cem. Concr. Compos. 2019, 104, 103377. [Google Scholar] [CrossRef]
  23. Dhasindrakrishna, K.; Ramakrishnan, S.; Pasupathy, K.; Sanjayan, J. Collapse of fresh foam concrete: Mechanisms and influencing parameters. Cem. Concr. Compos. 2021, 122, 104151. [Google Scholar] [CrossRef]
  24. Falliano, D.; De Domenico, D.; Ricciardi, G.; Gugliandolo, E. 3D-printable lightweight foamed concrete and comparison with classical foamed concrete in terms of fresh state properties and mechanical strength. Constr. Build. Mater. 2020, 254, 119271. [Google Scholar] [CrossRef]
  25. Markin, V.; Nerella, V.N.; Schröfl, C.; Guseynova, G.; Mechtcherine, V. Material design and performance evaluation of foam concrete for digital fabrication. Materials 2019, 12, 2433. [Google Scholar] [CrossRef] [PubMed]
  26. Pasupathy, K.; Ramakrishnan, S.; Sanjayan, J. Enhancing the properties of foam concrete 3D printing using porous aggregates. Cem. Concr. Compos. 2022, 133, 104687. [Google Scholar] [CrossRef]
  27. Cho, S.; Kruger, J.; van Rooyen, A.; van Zijl, G. Rheology and application of buoyant foam concrete for digital fabrication. Compos. Part B Eng. 2021, 215, 108800. [Google Scholar] [CrossRef]
  28. Liu, C.; Wang, X.; Chen, Y.; Zhang, C.; Ma, L.; Deng, Z.; Chen, C.; Zhang, Y.; Pan, J.; Banthia, N. Influence of hydroxypropyl methylcellulose and silica fume on stability, rheological properties, and printability of 3D printing foam concrete. Cem. Concr. Compos. 2021, 122, 104158. [Google Scholar] [CrossRef]
  29. Zhang, J.; Liu, Y.; Feng, T.; Zhou, M.; Zhao, L.; Zhou, A.; Li, Z. Immobilizing bacteria in expanded perlite for the crack self-healing in concrete. Constr. Build. Mater. 2017, 148, 610–617. [Google Scholar] [CrossRef]
  30. Wang, L.; Jiang, H.; Li, Z.; Ma, G. Mechanical behaviors of 3D printed lightweight concrete structure with hollow section. Arch. Civ. Mech. Eng. 2020, 20, 1–17. [Google Scholar]
  31. Gencel, O.; Bayraktar, O.Y.; Kaplan, G.; Arslan, O.; Nodehi, M.; Benli, A.; Gholampour, A.; Ozbakkaloglu, T. Lightweight foam concrete containing expanded perlite and glass sand: Physico-mechanical, durability, and insulation properties. Constr. Build. Mater. 2022, 320, 126187. [Google Scholar] [CrossRef]
  32. Jiang, L.; Lu, W.; Wang, W.; Zhang, Y.; Han, Q.; Li, Z. Mechanical properties and frost resistance of self-healing concrete based on expended perlite immobilized bacteria. Constr. Build. Mater. 2022, 348, 128652. [Google Scholar] [CrossRef]
  33. Schlaich, M.; Hückler, A. Infraleichtbeton: Reif für die Praxis. Beton-Und Stahlbetonbau 2017, 112, 772–783. [Google Scholar] [CrossRef]
  34. Cho, S.; Van Rooyen, A.; Kearsley, E.; Van Zijl, G. Foam stability of 3D printable foamed concrete. J. Build. Eng. 2022, 47, 103884. [Google Scholar] [CrossRef]
  35. Türkmen, İ.; Kantarci, A. Effects of Expanded Perlite Aggregate and Different Curing Conditions on the Drying Shrinkage of Self-Compacting Concrete; CSIR: New Delhi, India, 2006. [Google Scholar]
  36. Türkmen, İ.; Kantarcı, A. Effects of expanded perlite aggregate and different curing conditions on the physical and mechanical properties of self-compacting concrete. Build. Environ. 2007, 42, 2378–2383. [Google Scholar] [CrossRef]
  37. Karakoç, M.B.; Demirboga, R. HSC with expanded perlite aggregate at wet and dry curing conditions. J. Mater. Civ. Eng. 2010, 22, 1252–1259. [Google Scholar] [CrossRef]
  38. Oktay, H.; Yumrutaş, R.; Akpolat, A. Mechanical and thermophysical properties of lightweight aggregate concretes. Constr. Build. Mater. 2015, 96, 217–225. [Google Scholar] [CrossRef]
  39. Różycka, A.; Pichór, W. Effect of perlite waste addition on the properties of autoclaved aerated concrete. Constr. Build. Mater. 2016, 120, 65–71. [Google Scholar] [CrossRef]
  40. Rashad, A.M. A synopsis about perlite as building material–A best practice guide for Civil Engineer. Constr. Build. Mater. 2016, 121, 338–353. [Google Scholar] [CrossRef]
  41. Schumacher, K.; Saßmannshausen, N.; Pritzel, C.; Trettin, R. Lightweight aggregate concrete with an open structure and a porous matrix with an improved ratio of compressive strength to dry density. Constr. Build. Mater. 2020, 264, 120167. [Google Scholar] [CrossRef]
  42. Othman, R.; Jaya, R.P.; Muthusamy, K.; Sulaiman, M.; Duraisamy, Y.; Abdullah, M.M.A.B.; Przybył, A.; Sochacki, W.; Skrzypczak, T.; Vizureanu, P. Relation between density and compressive strength of foamed concrete. Materials 2021, 14, 2967. [Google Scholar] [CrossRef]
  43. Matalkah, F.; Ababneh, A.; Aqel, R. Synthesis of calcined kaolin-based geopolymer foam: Assessment of mechanical properties, thermal insulation, and elevated temperature stability. Ceram. Int. 2023, 49, 9967–9977. [Google Scholar] [CrossRef]
  44. Peng, X.; Shuai, Q.; Li, H.; Ding, Q.; Gu, Y.; Cheng, C.; Xu, Z. Fabrication and fireproofing performance of the coal fly ash-metakaolin-based geopolymer foams. Materials 2020, 13, 1750. [Google Scholar] [CrossRef] [PubMed]
  45. Yuan, Q.; Zhou, D.; Khayat, K.H.; Feys, D.; Shi, C. On the measurement of evolution of structural build-up of cement paste with time by static yield stress test vs. small amplitude oscillatory shear test. Cem. Concr. Res. 2017, 99, 183–189. [Google Scholar] [CrossRef]
  46. Qian, Y.; Kawashima, S. Distinguishing dynamic and static yield stress of fresh cement mortars through thixotropy. Cem. Concr. Compos. 2018, 86, 288–296. [Google Scholar] [CrossRef]
Figure 1. Flowability of 3DPFC samples.
Applsci 14 06796 g001
Figure 2. Mini-slump test of 3DPFC samples.
Applsci 14 06796 g002
Figure 3. Laboratory test for assessing the buildability of the 3DPFC samples.
Applsci 14 06796 g003
Figure 4. Compressive strength and dry density analyses of the 3DPFC samples.
Applsci 14 06796 g004
Figure 5. Compressive strength of 3DPFCs after burning at different temperatures.
Applsci 14 06796 g005
Figure 6. Yield stress curve of 3DPFCs over time.
Applsci 14 06796 g006
Figure 7. Static yield stress of 3DPFCs.
Applsci 14 06796 g007
Figure 8. Apparent viscosity of 3DPFC samples.
Applsci 14 06796 g008
Figure 9. Pore distribution of 3DPFC.
Applsci 14 06796 g009
Figure 10. Cumulative pore distribution of 3DPFC.
Applsci 14 06796 g010
Figure 11. SEM images of different samples within the same density range.
Applsci 14 06796 g011
Table 1. Chemical composition of raw materials (%).
ComponentCaOSiO2Al2O3Fe2O3MgOSO3Na2OK2OTiO2LOI
Cement48.9827.6110.343.392.321.850.210.650.473.66
Expanded perlite2.6272.1312.910.9160.650.03885.992.880.1641.42
Note: LOI stands for Loss on Ignition.
Table 2. Basic physical properties of perlite.
NameAppearanceParticle
Size
Bulk
Density
Thermal
Conductivity
Water
Absorption Rate
Expanded perliteWhite solid particles30–50
mesh
240–300
kg/m3
0.070
W/(m·K)
30%
Table 3. Mix design of 3DPFC samples.
SampleCement/gExpanded Perlite/gSand/gSurfactant/gSlushing Agent/gThickener/gW/C
EP40S11008.757210.20.10.43
EP40S21008.757220.20.10.43
EP80S110017.52410.20.10.45
EP80S210017.52420.20.10.45
EP100S110021.875010.20.10.46
EP100S210021.875020.20.10.46
Disclaimer/Publisher’s Note: The statements, opinions and data contained in all publications are solely those of the individual author(s) and contributor(s) and not of MDPI and/or the editor(s). MDPI and/or the editor(s) disclaim responsibility for any injury to people or property resulting from any ideas, methods, instructions or products referred to in the content.

