Article

Experimental Study on Shear Creep Characteristics of Residual Soil with Different Stone Content

College of Geosciences and Engineering, North China University of Water Resources and Electric Power, Zhengzhou 450045, China
*
Author to whom correspondence should be addressed.
Appl. Sci. 2024, 14(15), 6829; https://doi.org/10.3390/app14156829 (registering DOI)
Submission received: 16 June 2024 / Revised: 29 July 2024 / Accepted: 31 July 2024 / Published: 5 August 2024

Abstract

:
The residual soil on a slope can slowly move downward under the influence of gravity, forming a creep landslide. These types of landslides are known for their extensive coverage, significant magnitude, and prolonged duration of hazard. A systematic study of the creep properties of creep landslide geotechnical bodies is essential for the analysis of the deformation process and long-term safety evaluation of landslides. This paper focuses on studying a creep landslide involving residual soil in western Henan Province. The creep characteristics of residual soil with different stone content are investigated through direct shear creep experiments. The findings reveal that stone content has a profound impact on the creep behavior of residual soil. As the stone content of the soil increased, the structure of the test soil changed significantly, resulting in a gradual decrease in its shear creep. The Burgers model can effectively fit the deceleration creep and steady-state creep stages of the residual soil. With the increase in stone content, the four parameters of the Burgers model show a significant increase, with the instantaneous elasticity coefficient G1 and the viscosity coefficient η1 experiencing more noticeable changes. The average long-term strength of specimens with different stone content is only 54% of their instantaneous strength. Additionally, as the stone content increases, the ratio of long-term strength to instantaneous strength also increases. Notably, the long-term strength of specimens with 10–30% stone content is significantly lower than that of specimens with 50–70% stone content.

1. Introduction

Creep landslide refers to the type of landslide with continuous, slow, and long-term deformation. The creep properties of landslide materials are often the primary reason for failure and instability in such cases [1,2,3,4,5]. Therefore, analyzing the creep properties of landslide materials serves as a crucial theoretical foundation for studying the deformation mechanism and conducting stability analyses of creep landslides.
The study of creep properties of landslide materials primarily involves creep tests, constitutive models, and long-term strength [6,7,8,9]. Previous research on creep landslides mainly concentrated on homogeneous soils such as loess, clay, sandy clay, and silty clay, as well as soft rocks. The creep process typically encompasses three stages: initial creep, steady-state creep, and accelerated creep. In cases where the stress exerted on the rock or soil surpasses its long-term strength, accelerated creep occurs, leading to significant sliding damage [10,11,12,13,14].
The development of a constitutive model that effectively captures the rheological properties of rock and soil based on an analysis of their rheological characteristics is a key focus in the field of rheological mechanics research [15,16,17]. Extensive research has been conducted by scholars globally on rheological models, with the component model, particularly the Burgers model, being widely utilized for describing the creep behavior of different rock and soil formations [18,19]. The Burgers model is favored due to its intuitive concept, parameters with clear physical meaning, and straightforward calculations [20].
Residual soil is the sediment that slowly moves downhill after undergoing natural weathering and eventually deposits on gentle slopes. Under the action of gravity, the residual soil exhibits slowly over an extended period, leading to the formation of a creep landslide. These landslides can cause wide-ranging, large-scale, and long-term damage. Currently, due to the limitations of instruments and equipment, there is limited research on the creep behavior of geotechnical bodies with particle sizes larger than 2 mm [21,22,23], and there is a lack of studies on the creep characteristics of residual soil containing large particles. Hu et al. carried out a triaxial creep test of Majiagou landslide in the Three Gorges Reservoir area. The study showed that the coarse-grained soil exhibited evident nonlinear creep characteristics, with the surrounding pressure and stress levels having a significant impact on the creep rate and stage division. The Singh–Mitchell creep model was used to describe the creep behavior of coarse-grained soil [24]. Dong et al. conducted a direct shear creep test on a landslide deposit, revealing decelerated creep and steady-state creep characteristics. The deposit would transition into an accelerated creep state when subjected to a larger horizontal load, and the long-term strength of the deposit was found to be between 39% and 59% of its instantaneous shear strength [25]. In another investigation, Dong et al. performed a large-scale triaxial creep test on a strongly weathered muddy sandstone slide zone. They found that the adjustment of the internal structure of the specimen at lower stress levels is primarily governed by void compression and particle movement, and particle fragmentation was observed mainly at higher stress levels [26]. Additionally, Wen et al. conducted a study on two groups of landslide soils with different stone contents. They found that a significant increase in creep stresses led to specimen failure and the ratio of creep stresses to residual strengths as the stone content increased [27].
The residual soil in mountainous regions exhibits wide distribution, poor structural properties, and varying stone content. The stone content plays a crucial role in their creep properties. This study focuses on a creep landslide involving residual soil in western Henan Province. The objective is to investigate the creep characteristics and develop a creep model by conducting direct shear creep experiments on residual soil samples with varying stone content. Furthermore, this study aims to analyze the impact of stone content on the creep behavior and long-term strength of the soil. The findings of this research can serve as a valuable reference for the study and management of similar landslides.

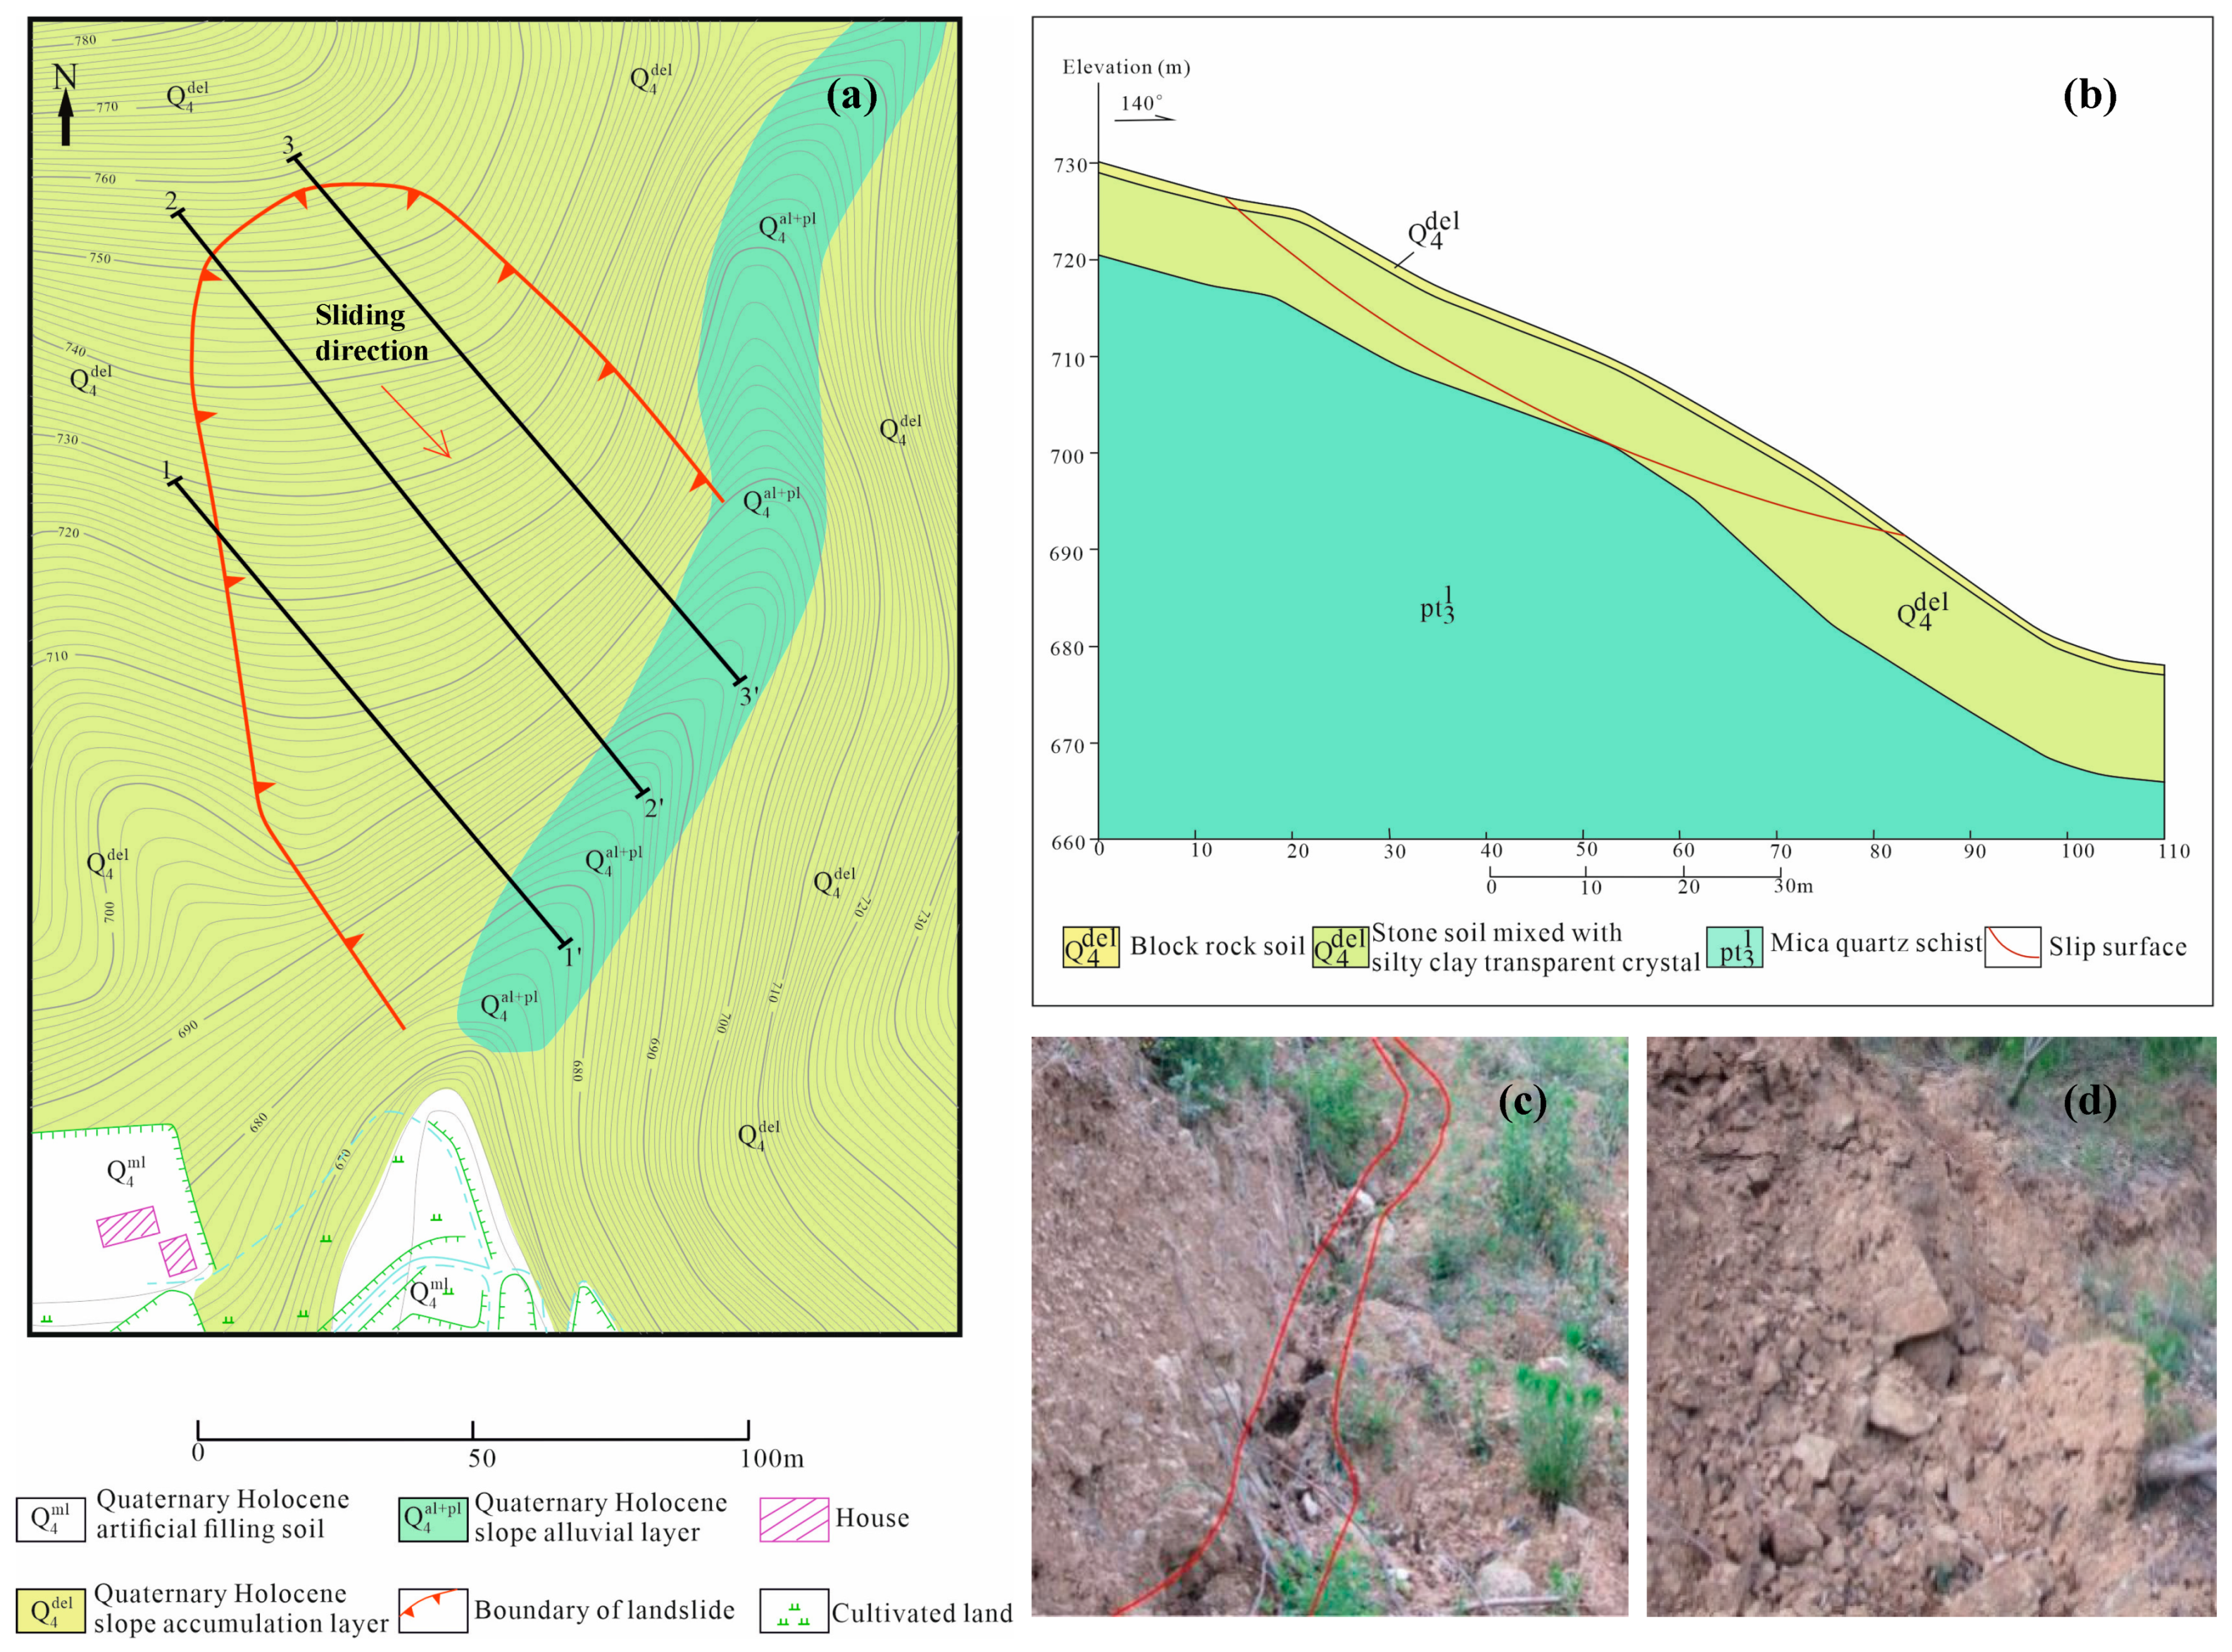
2. Residual Soil Landslide Overview

In western Henan, there is a residual soil landslide with dimensions of 130 m in length and 105 m in width (Figure 1a). The slide body has a thickness ranging from 6 to 12 m, with a volume of 105,000 m3. The average slope of the landslide is 40°, extending in the north–south direction (Figure 1b). Since 2000, noticeable creep deformation has been observed, with a slip crack measuring 30–50 cm in width and approximately 60 m in length at the rear edge of the landslide (Figure 1c). The rear wall of the landslide shows evidence of rock fracture and sliding, with the sliding boundary clearly visible. The landslide is seriously affecting the lives and property safety of local residents. Through the field investigation of the residual soil landslide, it was noted that the block stone within the residual soil primarily consisted of quartz schist. These stones had an average diameter of approximately 20–45 cm and exhibited a light gray color. The block content varied depending on the location of the residual soil, ranging from approximately 45% to 75%. The surface layer of the slope was adorned with lush vegetation, and the residual soil contained abundant plant roots (Figure 1d). The soil itself was identified as silty clay, appearing light gray with gray stripes. The residual soil samples of the landslide were mainly collected in the boreholes and trenches. These samples were promptly sealed and subjected to indoor routine tests to obtain their physical and mechanical properties, as shown in Table 1.

3. Test Program

3.1. Test Equipment

For the test, the ZY50-2G large-scale direct shear testing machine (shown in Figure 2) was chosen as the instrument. This machine consists primarily of a support frame, vertical oil pump, horizontal oil pump, shear box, electronic force meter, displacement meter, and a data acquisition system. The shear box is designed to accommodate specimens with a diameter of 500 mm and a height of 400 mm, with a maximum particle size of 80 mm. To ensure stability in the horizontal load during the creep test, the machine is equipped with a stabilized energy storage tank. The machine allows for a minimum horizontal shear speed of 0.01 mm/min, enabling slow shear and creep testing.

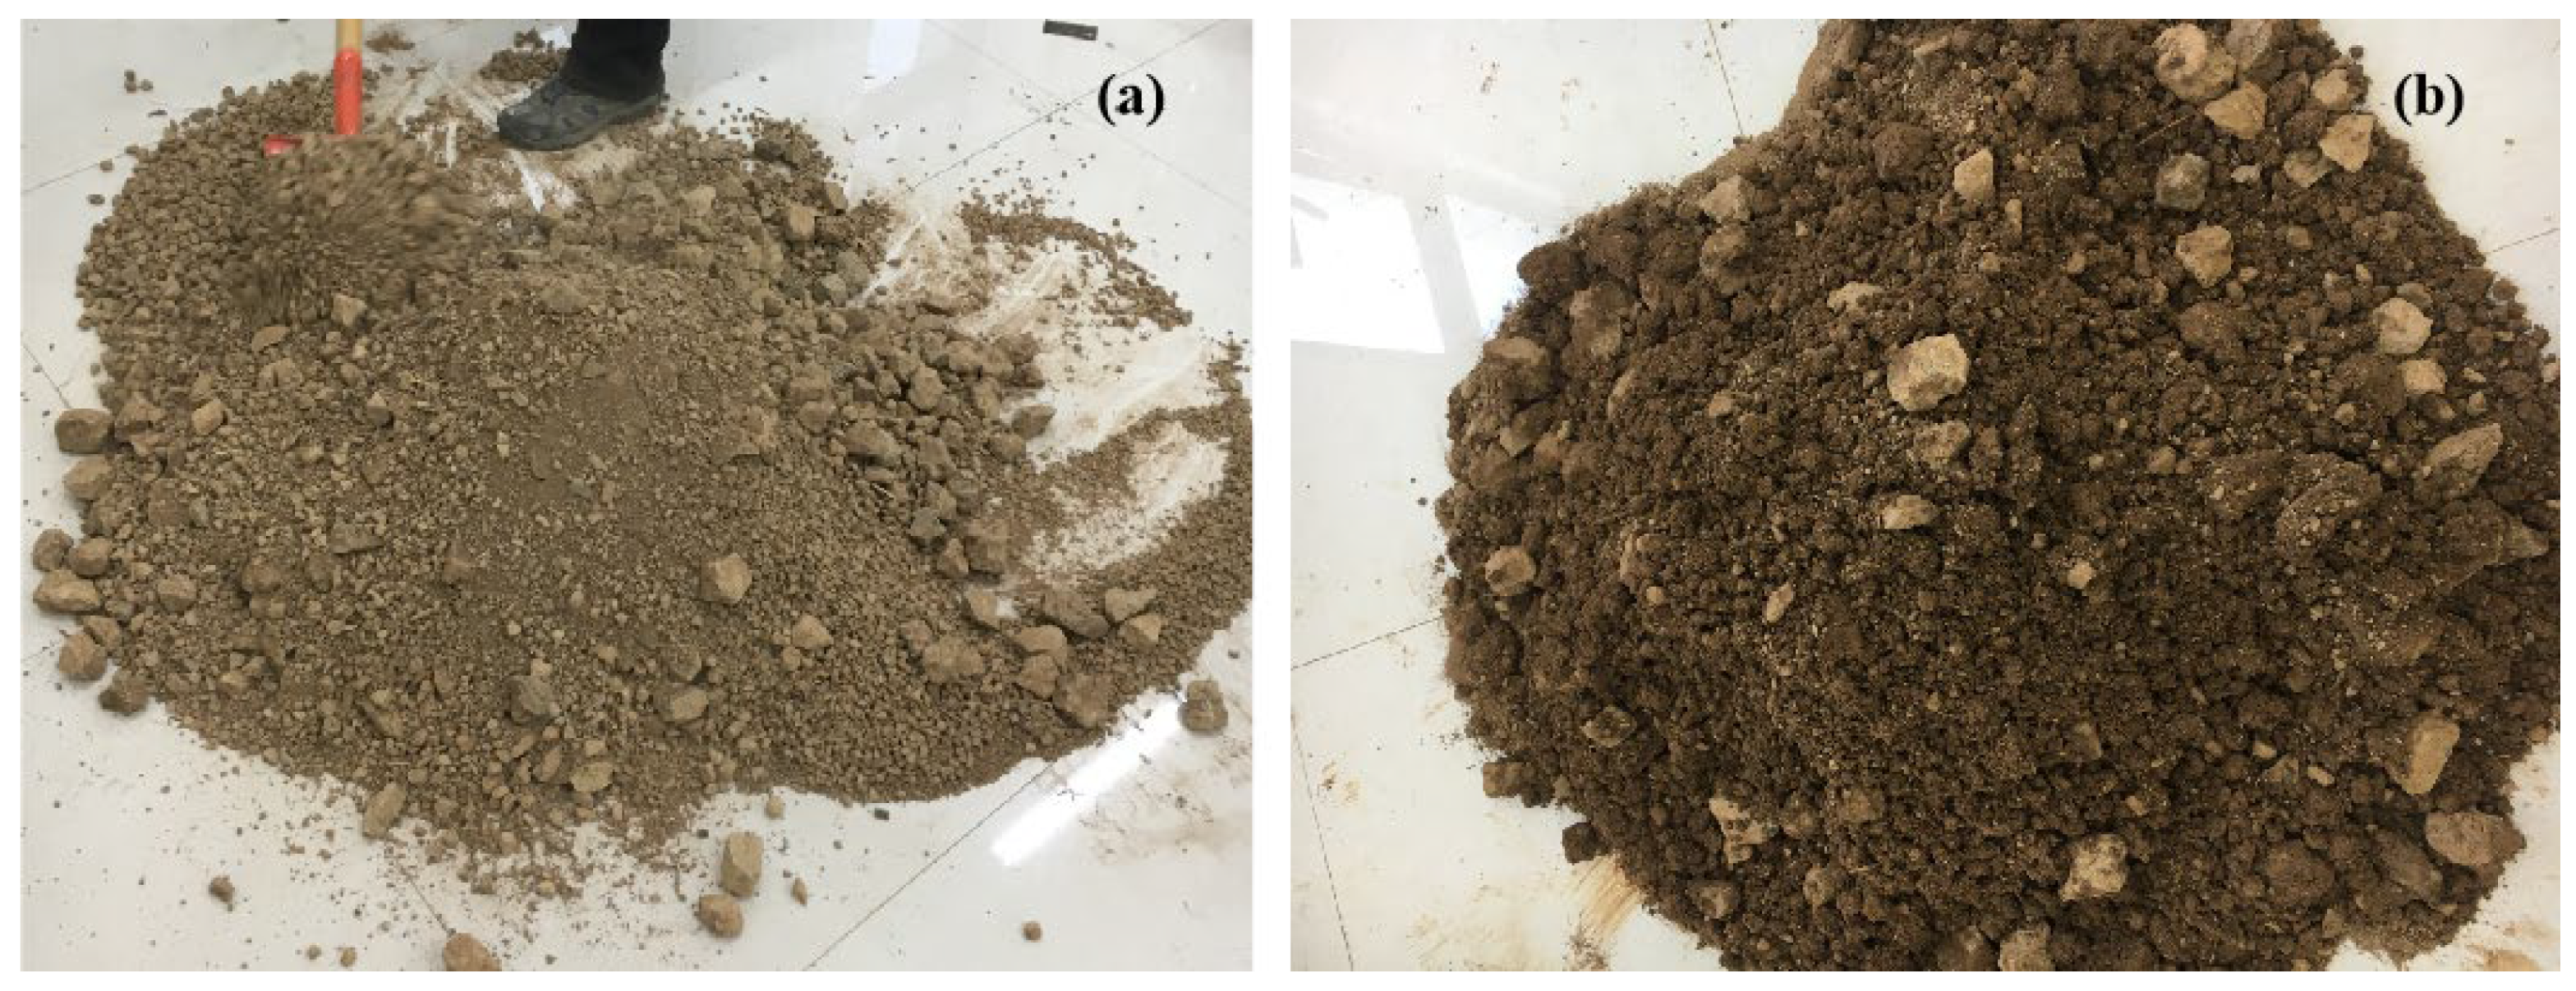
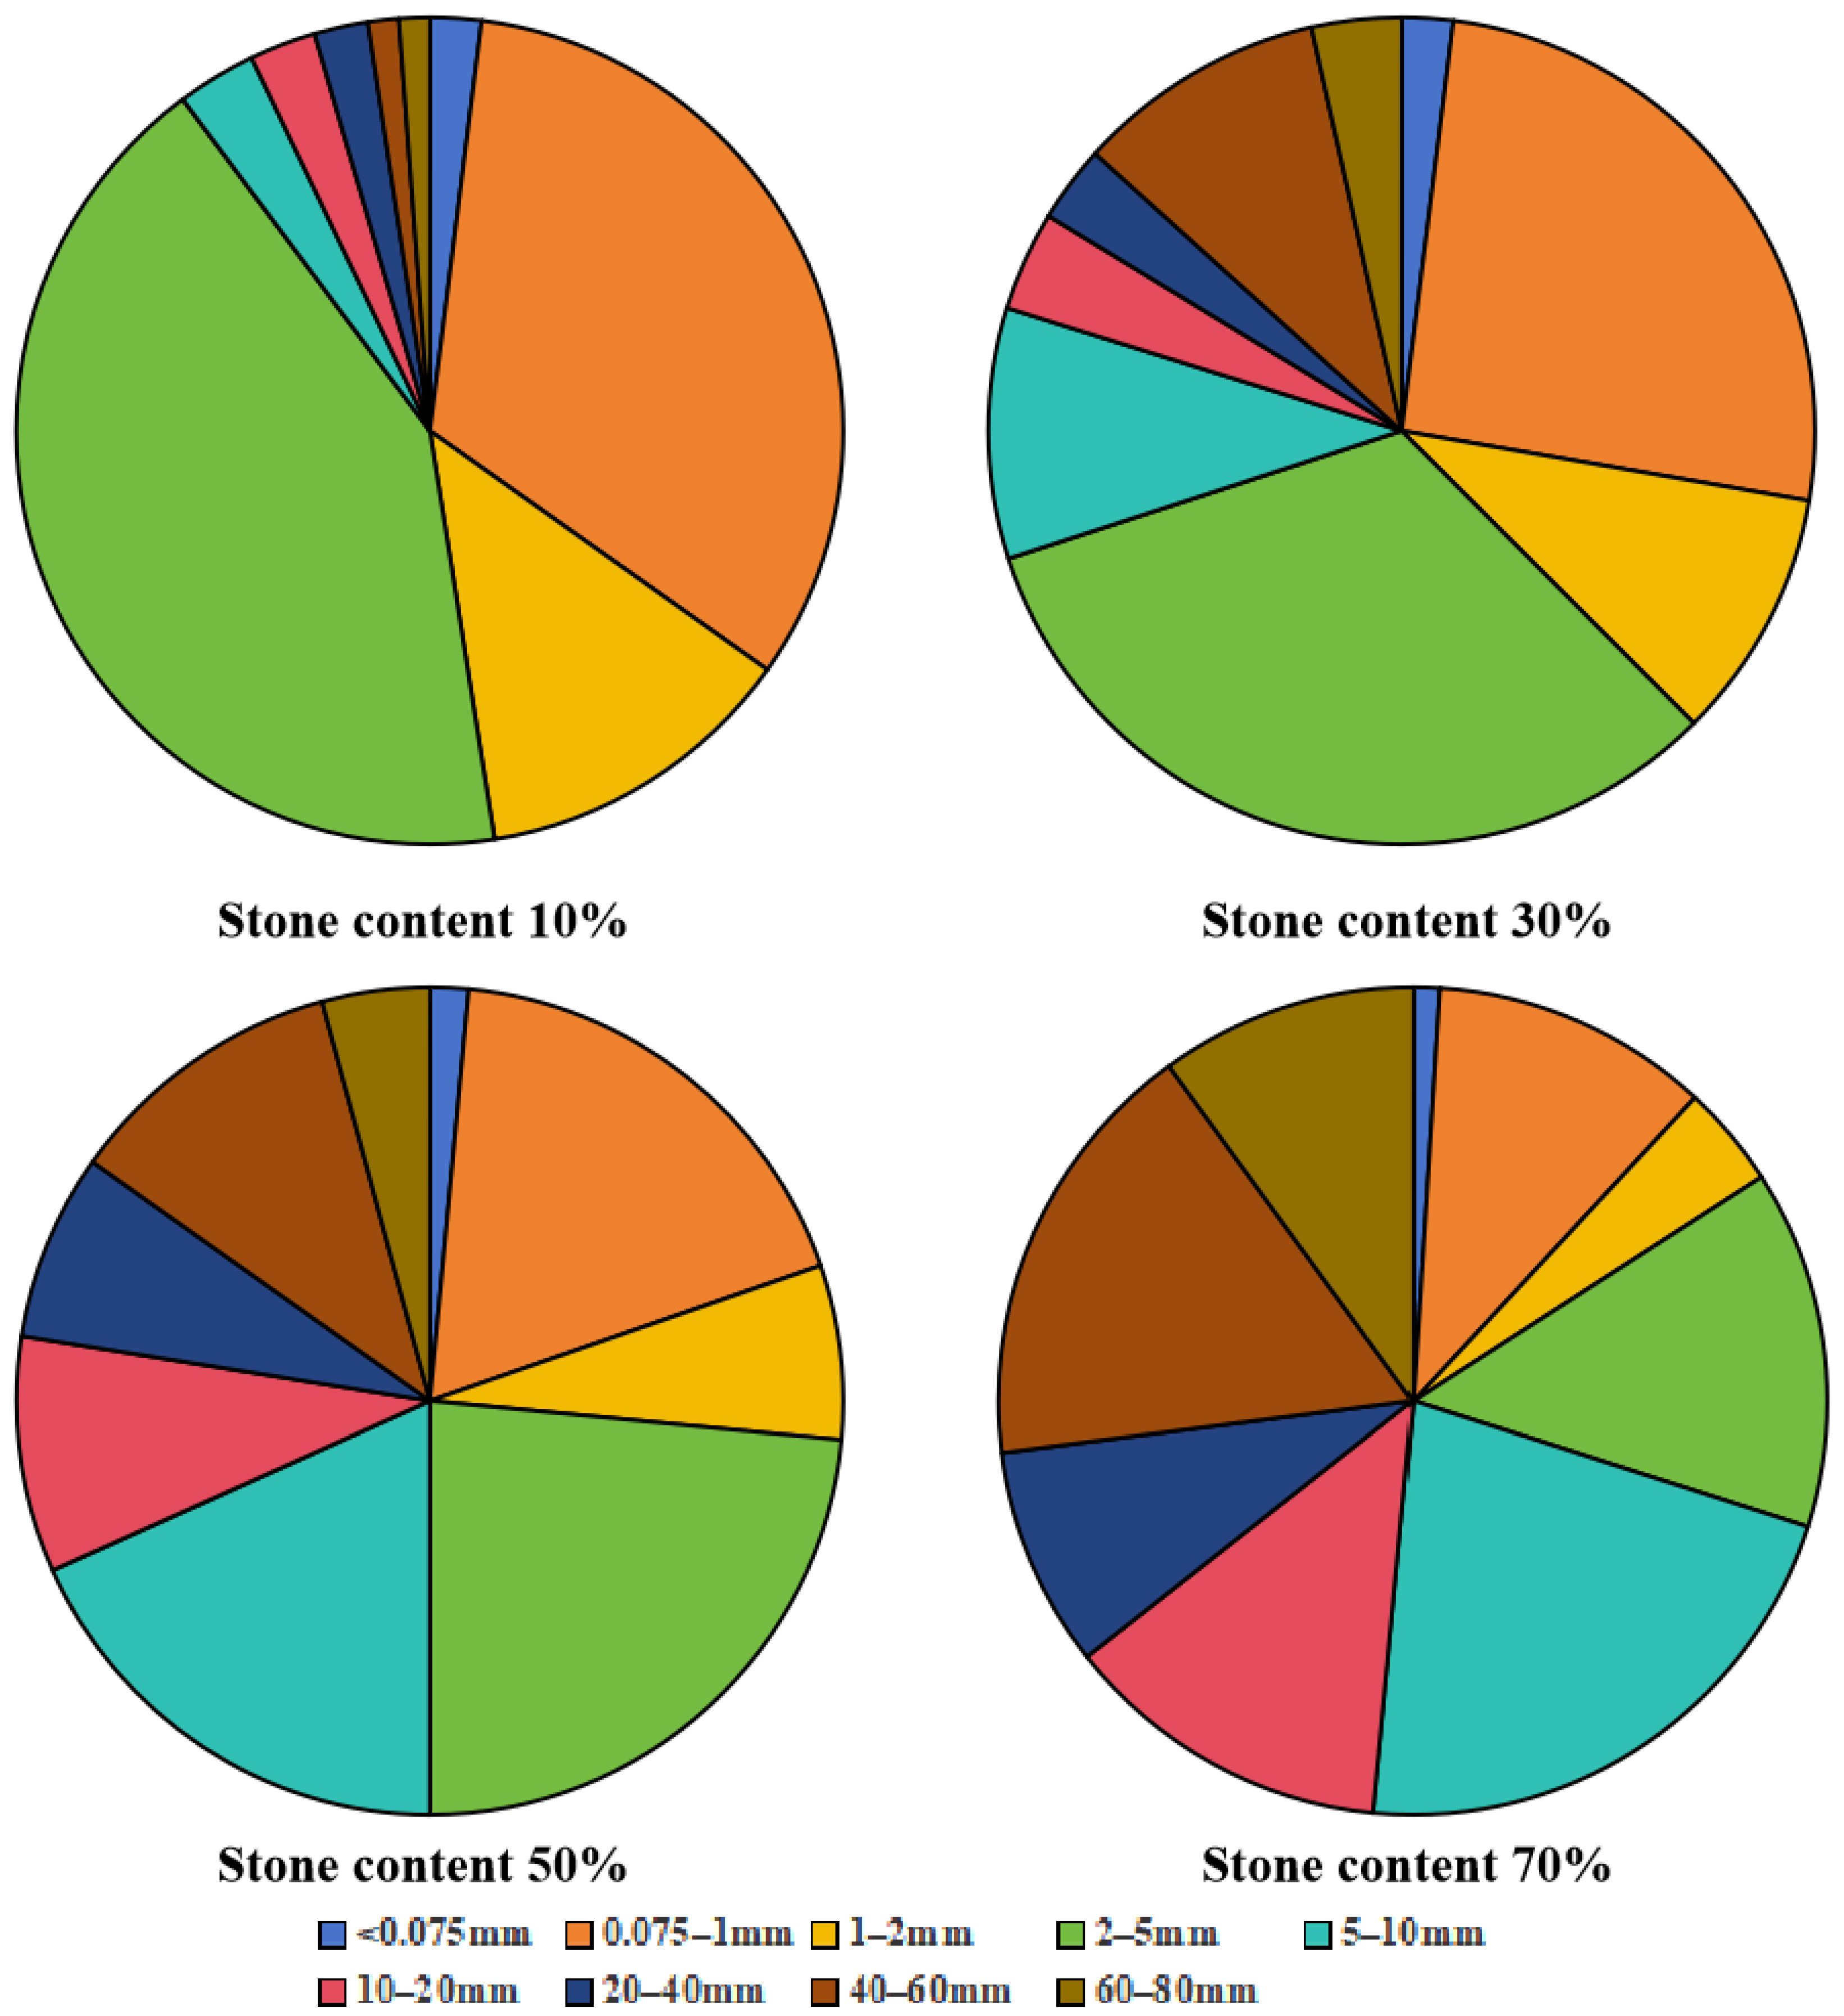
3.2. Sample Preparation

The samples used in this test are residual soil, which contains block stones, some of which have huge particle sizes. The distribution of these block stones is not uniform at the top and foot of the slope. In this test, particles with a size greater than 5 mm are classified as stones, while particles smaller than 5 mm are considered soil. The stone content is calculated as the ratio of the mass of particles larger than 5 mm to the total specimen mass. The stone content in the collected specimens ranged from 45% to 75%. In order to investigate the effect of stone content on the creep of residual soil more scientifically, four groups of different stone contents of 10%, 30%, 50%, and 70% were configured. The water content for all specimens was set at 15%.
To prepare the sample, first dry the natural residual soil. Then, separate the block stones and soil by rolling. Use a 5 mm sieve to divide the accumulated material into >5 mm block stones and <5 mm soil. Mix the soil and stone in the desired proportion for large-scale direct shear tests, such as 10% block stones and 90% soil, to obtain a shear specimen with a stone content of 10%. Divide each group of samples into three equal parts and mix with water at 15% moisture content. The sample ingredients and mixing process are shown in Figure 3. Load the soil sample into the shear box in three stages, compacting it to a fixed height each time. Ensure that the second soil layer is higher than the shear surface to avoid compaction on the shear surface. The gradation of the specimens with different stone contents is presented in Table 2 and Figure 4.

3.3. Loading Program

Before conducting the creep tests, consolidated quick shear tests were performed to determine the instantaneous shear strengths of specimens with different stone contents under three consolidation pressures (as shown in Table 3). To analyze the creep characteristics of residual soil with varying stone contents in different areas of the landslide more effectively, four groups of shear creep tests were conducted on specimens with different stone contents under a normal consolidation stress of 200 kPa. The creep tests were conducted in a stress-controlled method, and a steady horizontal thrust was applied to the specimens according to their respective instantaneous shear strength gradations. After the installation of the specimens, the testing machine initiated the application of vertical consolidation pressure, and the vertical displacement of the specimens was monitored. When the vertical displacement remained below 0.05 mm within one hour, it was determined that the specimens had achieved consolidation stability, and the next test step could be conducted. In the creep test, four sets of samples with varying stone contents were subjected to graded shear loading. Each sample experienced loading levels at 0.2, 0.4, 0.6, and 0.8 times the shear strength value. The stress magnitudes for each loading level are summarized in Table 3. After achieving stability at each load level, the subsequent load level was applied. To ensure specimen stabilization, the requirement was set for vertical settlement during the day to remain below 0.01 mm.

4. Test Results and Analysis

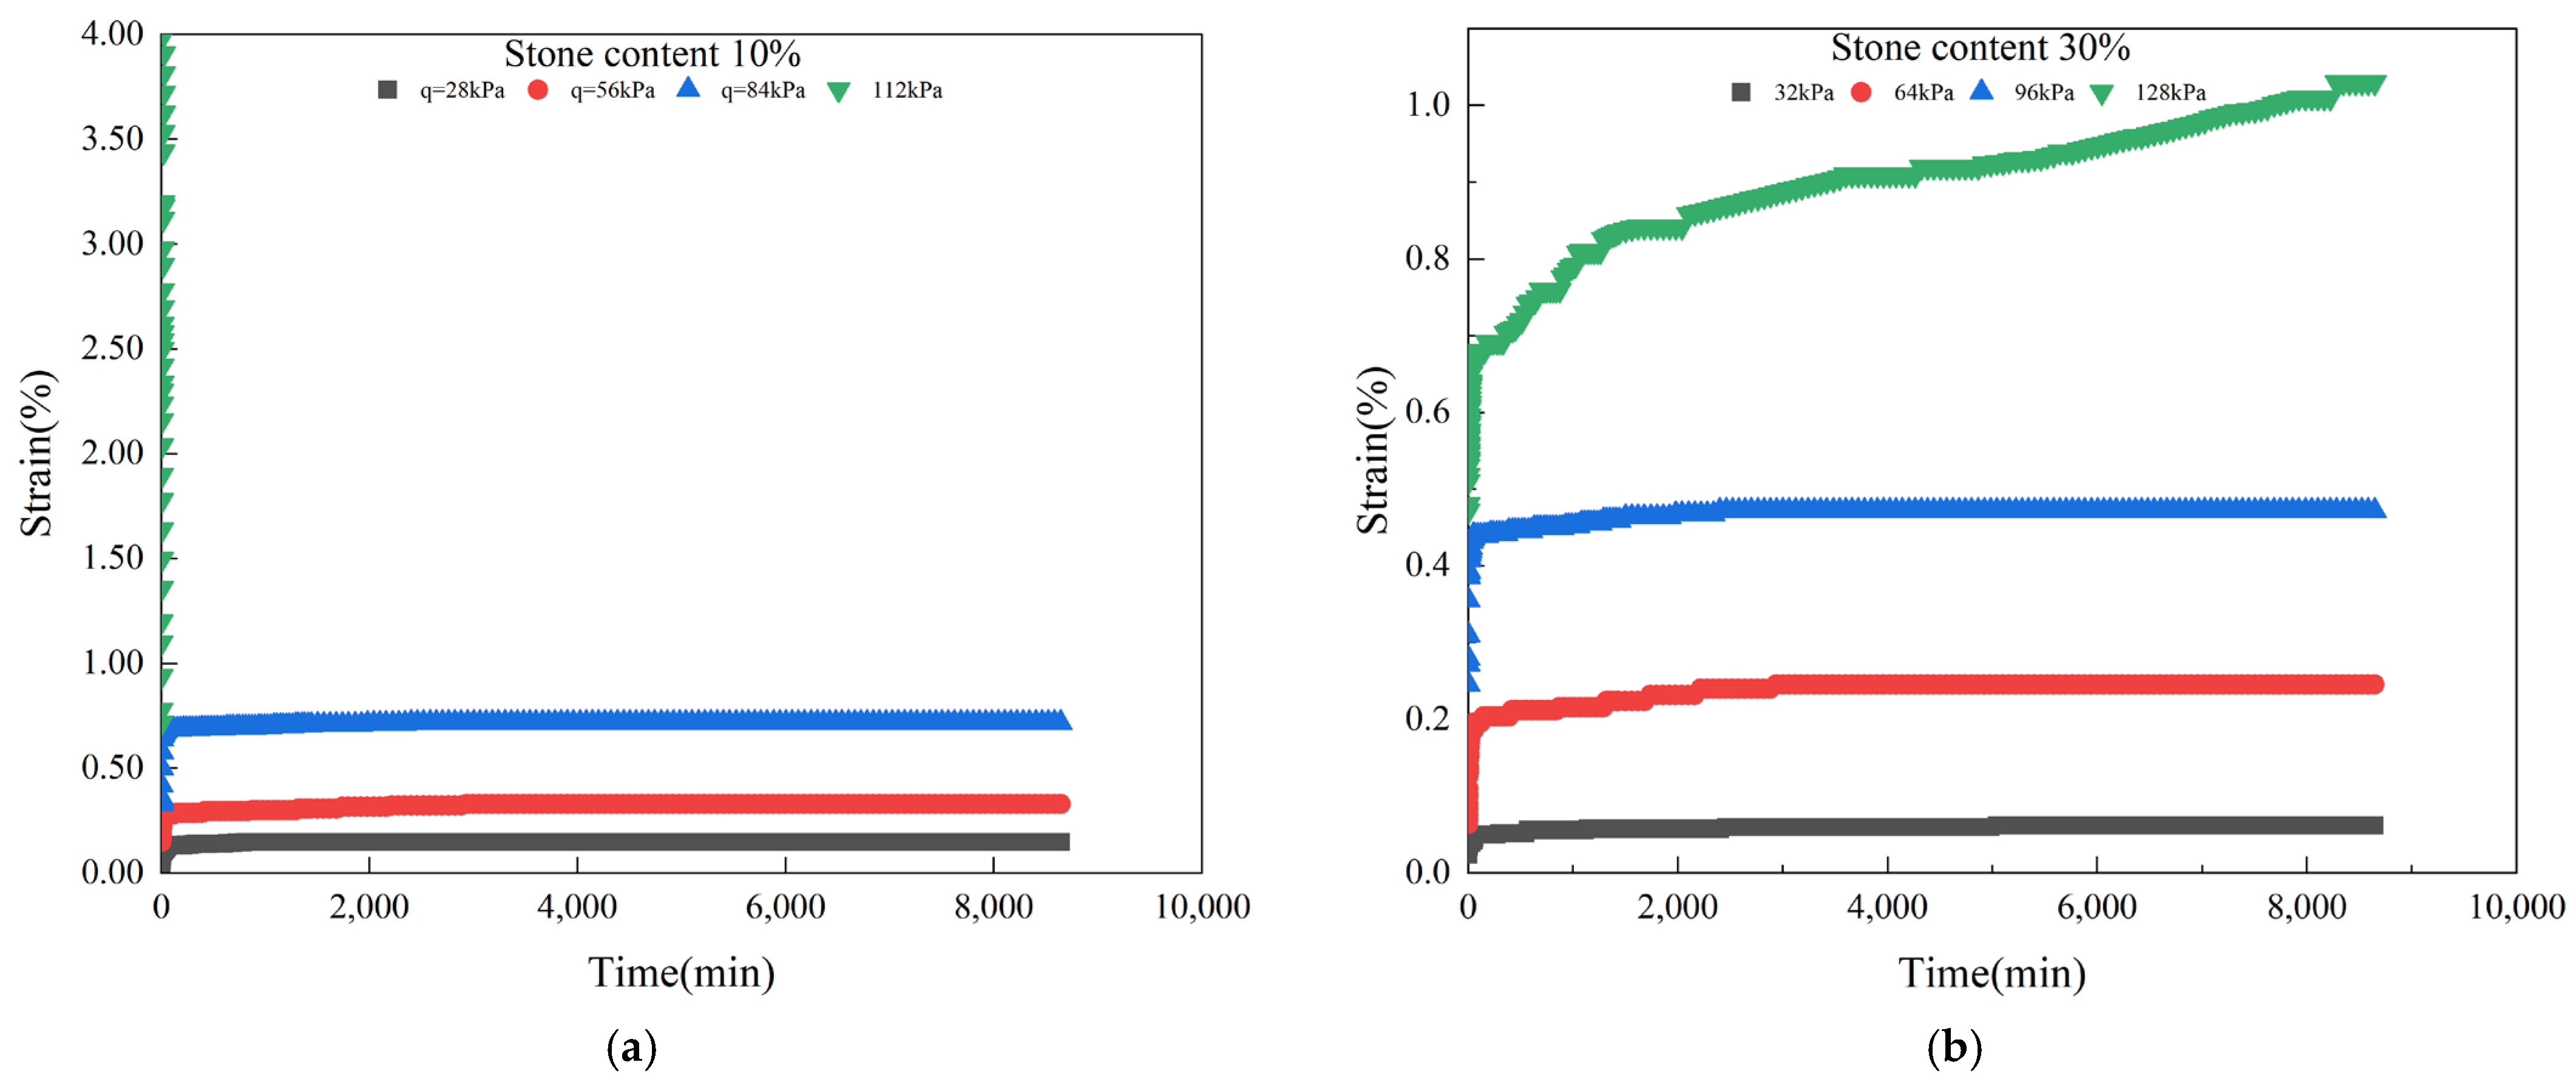
4.1. Characteristics of Creep Curve of Residual Slope Accumulation Soil

By conducting the creep tests, it is possible to obtain the complete creep process curves for specimens with different stone contents under various shear stresses. By using these curves combined with Chen’s loading method, the creep curve of separate loading is obtained, as shown in Figure 5.
As can be seen from Figure 5, it is evident that the creep behavior of specimens with different stone contents varies under different shear stress levels. When subjected to shear stress ranging from 0.2 to 0.4 times the instantaneous shear strength, the specimens exhibit relatively minimal creep and slow creep growth. When the shear stress is increased to 0.6 times, the amount of creep in the specimens becomes more significant, and the creep rate accelerates. Under the influence of a shear stress of 0.8 times the instantaneous shear strength, some specimens demonstrate a continuously increasing creep rate over time, indicating accelerated creep. Notably, the specimen with 10% stone content experiences rapid shear damage and enters the accelerated creep phase quickly under a shear stress of 0.8 times its shear strength. The creep results show that, even under the smaller shear stress, the specimen deformation is also growing with time, indicating the presence of pronounced creep characteristics in the landslide.
During graded loading, a significant transient deformation occurs at each shear stress level, accounting for over 60% of the total deformation. Furthermore, the magnitude of transient deformation increases with increasing shear stress. As shear stress increases, the total creep of the specimen at each load level also increases, and the time required to reach a stable creep state lengthens. This behavior can be attributed to the continuous adjustment of soil and rock particles within the specimen, accompanied by particle breakage, at the onset of shear creep loading. Gradually, the soil and rock particles compact, resulting in a transient creep phase characterized by a decreasing creep rate. As shear stress increases, the time required for the specimen to achieve the desired soil and rock compaction also increases, leading to a longer duration of transient creep. With the continued application of shear force, the positions between particles in the sample gradually stabilize, causing strain to increase slowly. As time progresses, the creep rate gradually approaches a stable value. At this point, the residual soil enters the constant creep stage. However, in certain cases, such as the 30% and 70% stone content specimens under a shear stress loading of 0.8 times their shear strength, the creep amount continues to increase rapidly after the transient creep and constant creep stages. Eventually, the creep amount reaches an extreme value, resulting in excessive specimen deformation and shear failure.

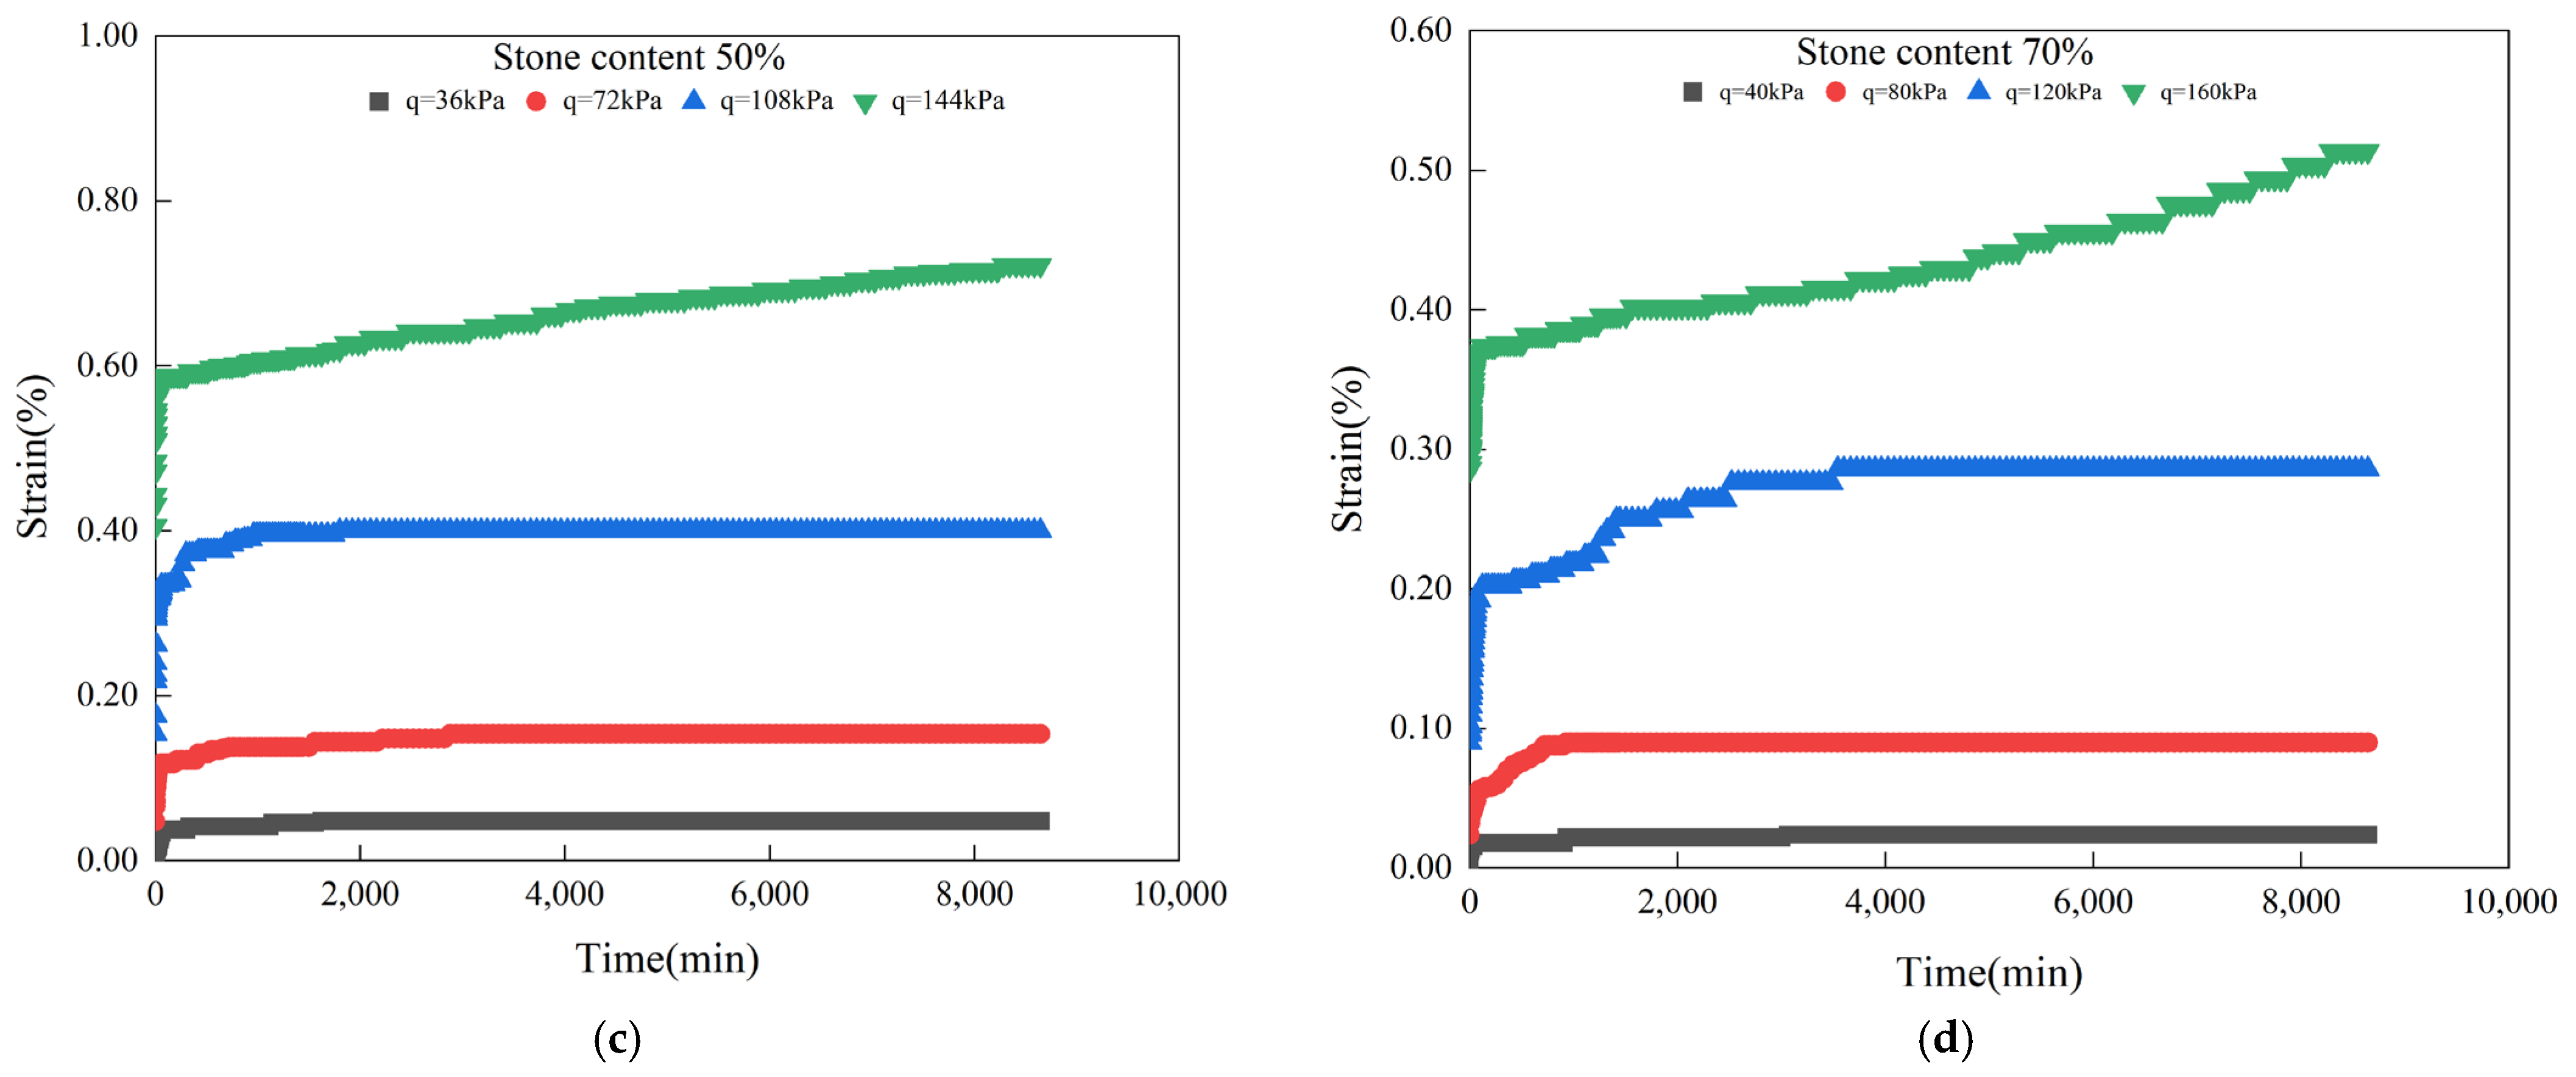
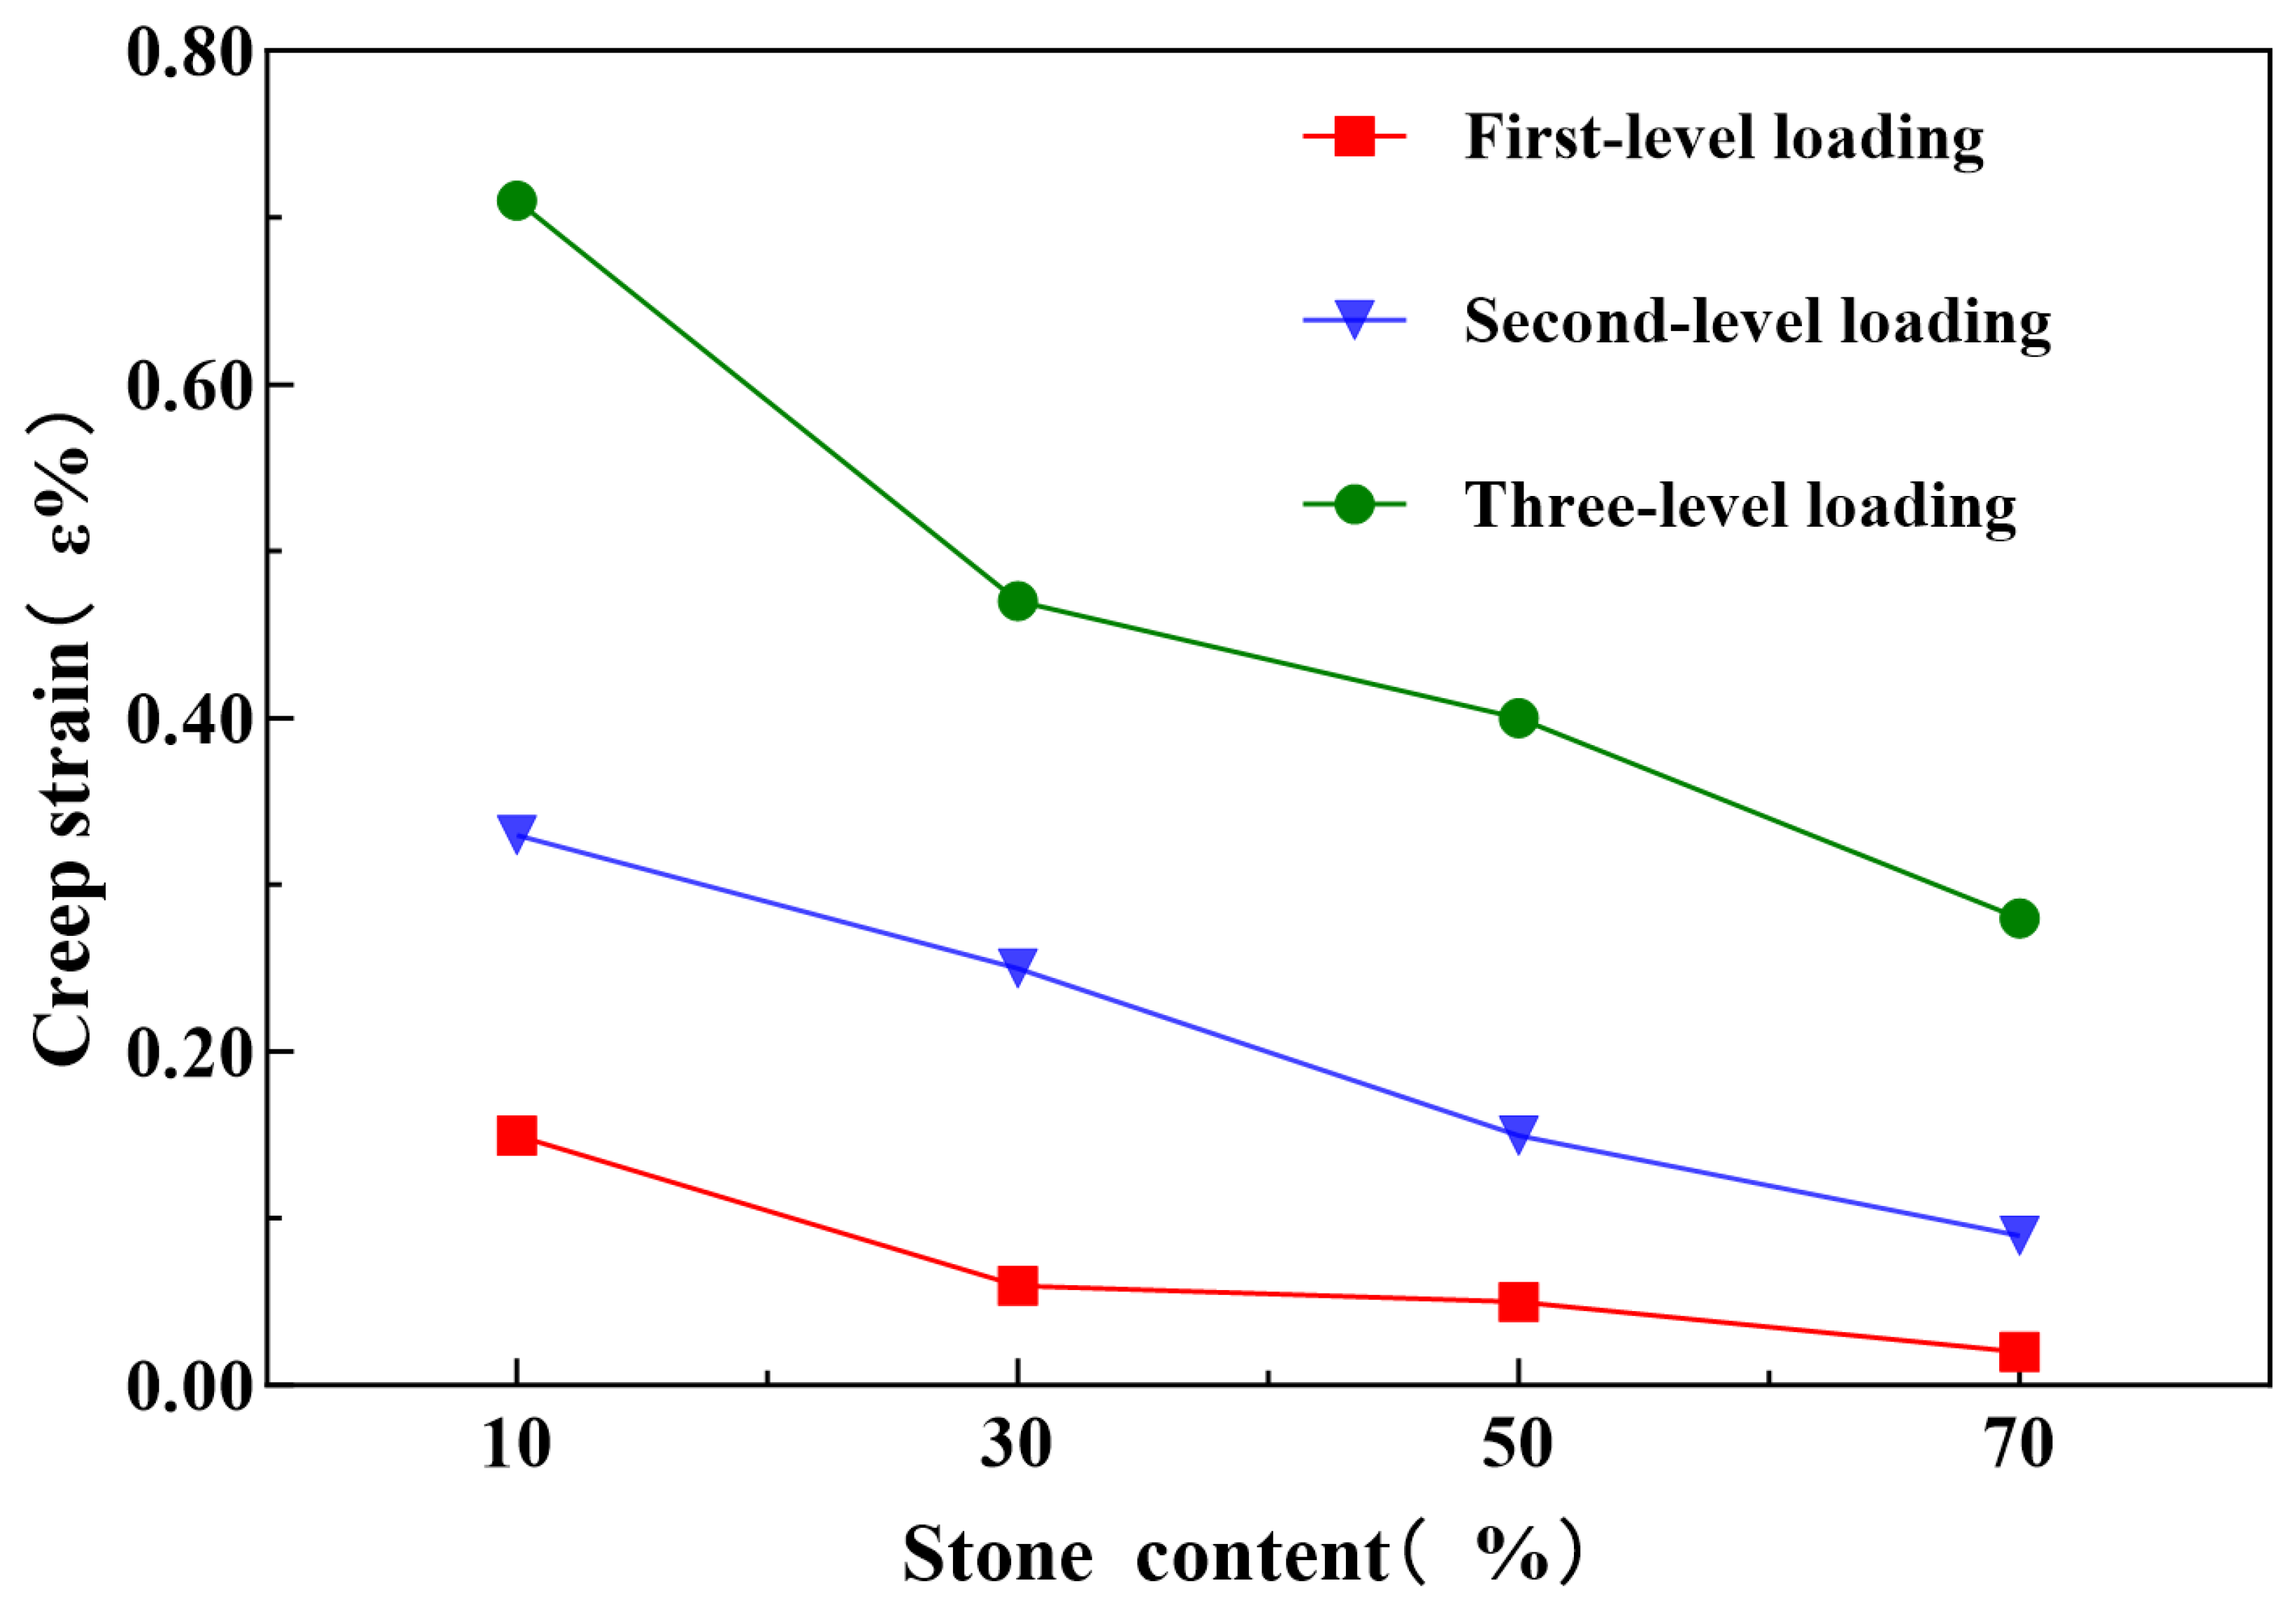
4.2. Influence of Stone Content on Creep of Residual Soil

Figure 6 illustrates the relationship between the final creep strain and the stone content of the specimen after each loading level. It is evident from the figure that, as the stone content increases, the total creep deformation decreases. This phenomenon can be attributed to two factors. Firstly, this is due to the fact that with the increase in stone content in the specimen, the density of the specimen increases, the number of block stones with large grain size on the shear surface increases, and the movement of large particles is more difficult during the shear process. Furthermore, as the content of rock fragments varies, there are significant changes in the soil–rock structure characteristics of the shear surface in the experiment. Figure 7 illustrates the particle distribution in samples with varying stone content. Specifically, Figure 7a shows the shear face under a consolidation pressure of 200 kPa when the stone content is 10%. At this stone content level, the influence of stones on the specimen is minimal, and particles with a size smaller than 5 mm dominate. During the shear creep process, the deformation is primarily governed by the dislocation between the fine particles. It is worth noting that specimens with 10% stone content have a lower density and relatively larger porosity. As a result, block stone particles located on the shear surface are more prone to rotational deformation, ultimately leading to a larger shear creep in the specimen. As the stone content ranges from 30% to 70%, the number of block stones on the shear surface gradually increases, leading to the formation of a skeleton structure through the filling and interlocking of fine particles. This process results in a significant increase in specimen density, making it challenging for rock particles to rotate during the shear creep process. During this stage, the specimen’s deformation is primarily characterized by slight dislocation of both coarse and fine particles, as well as the breaking deformation of larger particles. As a result, shear creep is noticeably reduced. With further increases in stone content, the skeleton-embedding action becomes more pronounced. Particle rotation becomes increasingly difficult, leading to a further reduction in specimen shear creep.

5. Creep Model and Parameterization

The component model is widely used in creep analysis and consists of three types of components: Hookean solid, Newtonian fluid, and Saint–Venant’s body. The Hookean solid represents pure elastic behavior, the Newtonian fluid simulates viscosity, and the Saint–Venant’s body represents ideal plasticity.
The Burgers model, a type of component model, effectively describes attenuation creep and stable creep. It consists of a series arrangement of a Kelvin body and a Maxwell body. The Maxwell body is composed of a series arrangement of Newtonian fluid and Hookean solid, representing elastic and viscous deformation. The Kelvin body consists of a parallel arrangement of Hookean solid and Newtonian fluid, as depicted in Figure 8.
Based on the results of the creep test conducted on residual soil, it is evident that there is a clear and stable creep process. To accurately represent the creep curve observed in the test, the Burger model is employed.
The one-dimensional creep equation for the Burger model is as follows:
ε t = 1 η 1 σ 0 t + σ 0 E 1 + σ 0 E 2 ( 1 e x p E 2 η 2 t )
where E 1 and E 2 are the elasticity coefficients of the Maxwell and Kelvin bodies, respectively; η 1 and η 2 are the viscosity coefficients of the Maxwell and Kelvin bodies, respectively.
In the direct shear creep test, the applied stress is shear stress, and the following equation is obtained by transformation:
γ t = τ 1 1 G 1 + t η 1 + 1 G 2 1 e x p G 2 η 2 t
where G 1 ,   G 2 ,   η 1 ,  and η 2 are the unit shear modulus and viscous coefficient of the creep model, respectively.
Through the nonlinear least squares method, four sets of test data were fitted to determine the values of the two unit shear modulus, G 1 and G 2 , as well as viscosity parameters η 1 and η 2 . These values are presented in Table 4. The fitting performance of the Burgers model, as shown in Figure 9, is particularly strong for the first three load levels, exhibiting a high degree of accuracy. The fitted samples demonstrate a favorable steady-state creep effect. The predicted results align well with the experimental findings, effectively illustrating the creep behavior of samples with varying stone contents. While there exists a slight discrepancy between the fitted and experimental results, the error is relatively minor. The fitting correlation coefficient, R2, exceeds 85%.
The Burger model consists of four parameters, with G1 representing the instantaneous elasticity coefficient that reflects the material’s ability to undergo immediate elastic deformation upon the application and removal of a loading force, and η1 represents the viscosity coefficient, which reflects the material’s ability to undergo irrecoverable deformation under the influence of a loading force. The parameters η2 and G2 reflect the material’s ability to slowly deform and recover under applied or unloaded conditions and are closely related to creep and deformation recovery [28]. As shown in Table 4, the four parameters of Burgers’ model increase significantly with the increase in stone content. Analyzing the secondary level loading creep curves of specimens with different stone content, the changes in these four parameters with stone content are illustrated in Figure 10. From Figure 10, it is evident that as the stone content increases all four parameters increase. The instantaneous elasticity coefficient G1 experiences a more pronounced change compared to G2. Similarly, the viscosity coefficient η1 exhibits a more substantial change compared to η2. This indicates that the specimen’s ability to resist instantaneous deformation and irrecoverable deformation increases significantly with an increase in stone content. Additionally, the specimen’s ability to resist slow deformation and recover also improves. These observations are closely related to the structural characteristics of the residual soil. During shear creep, the deformation caused by s dislocation, rotation, and crushing of the residual soil particles was large and irreversible. With the increase in stone content, particle motion and damage become more difficult, so the instantaneous elasticity coefficient G1 and viscosity coefficient η1 change more obviously.

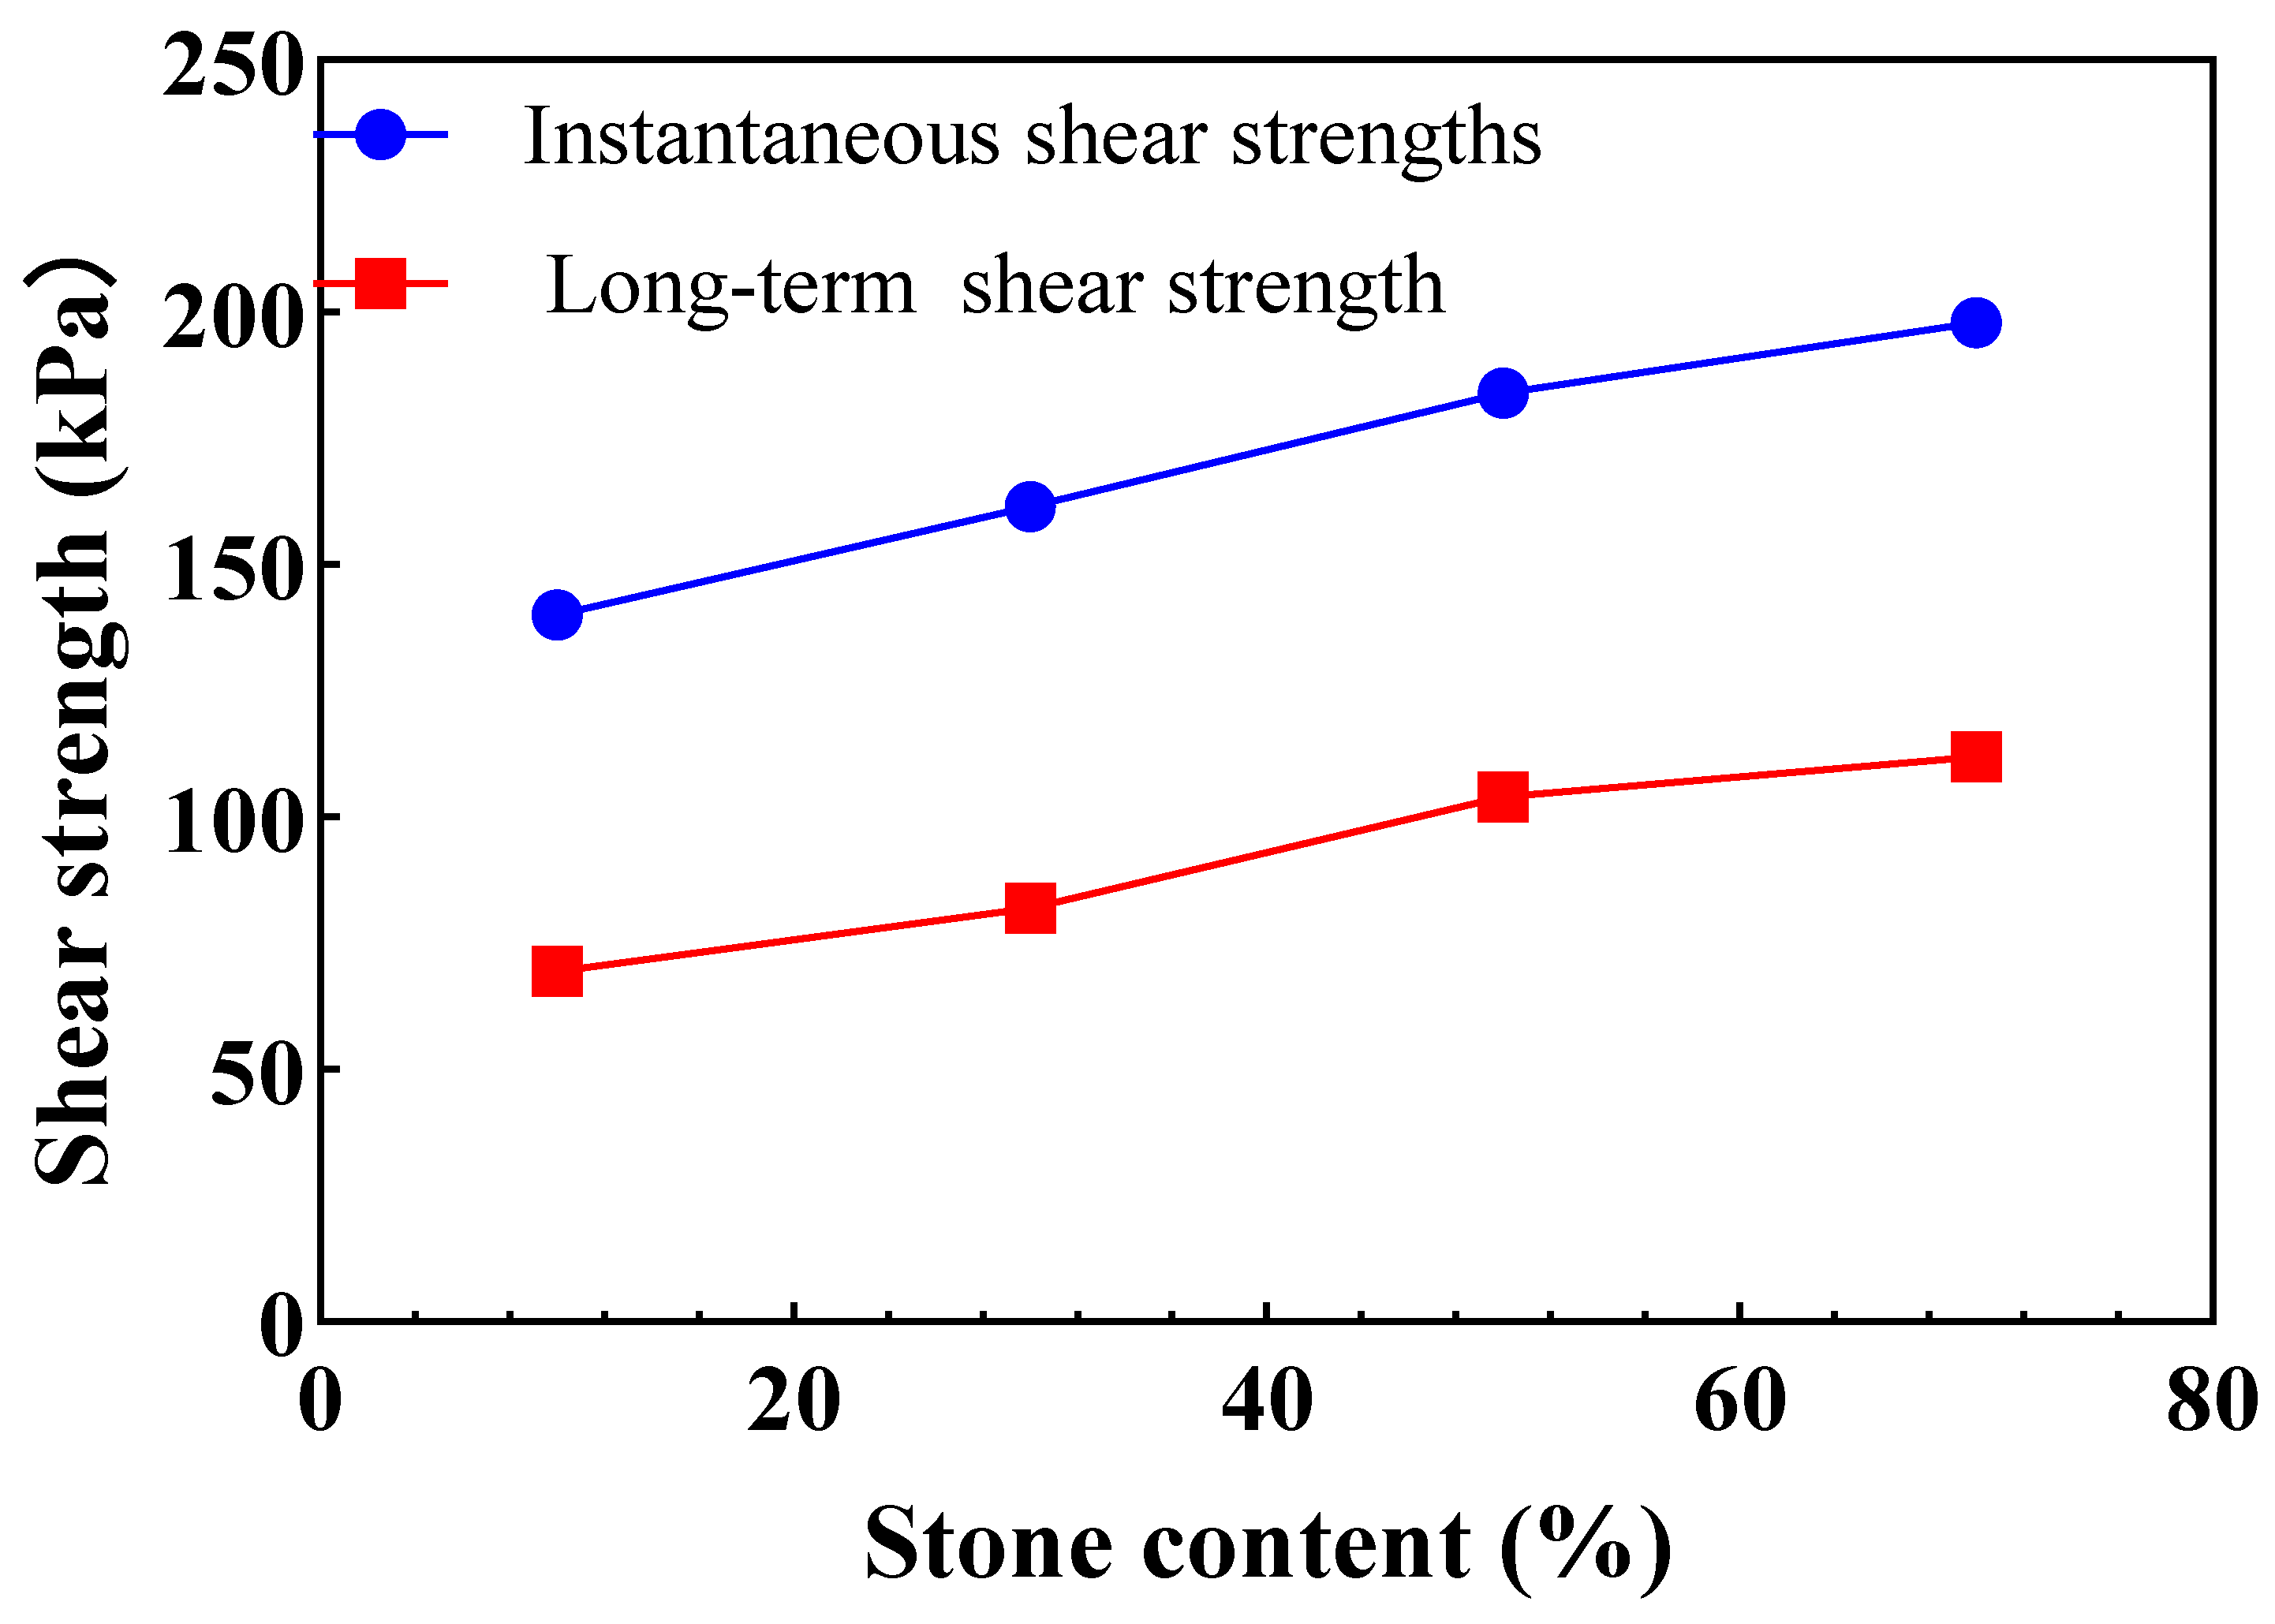
6. Long-Term Strength

Long-term strength is a crucial parameter for landslide stability analysis. Various methods can be employed to determine long-term strength, including transition creep, isochronous curve, and the first inflection point method of the creep curve. For this particular test, the stress–strain isochronous curve method was selected to determine the long-term strength of the residual soil. In this method, the turning point on the curve is selected as the long-term strength of the specimen. Creep stress–strain isochronous curves were established, with parameters such as 50% stone content (Figure 11).
By analyzing the creep rate–stress isochronal curves of four specimen groups with varying stone contents, the long-term strengths of each group can be determined, as presented in Table 5. The discount factor can be defined as the ratio of the long-term strength to the instantaneous shear strength.
From Table 5, it is evident that the average long-term strength of the four specimen groups with different stone contents is only 54% of their instantaneous strength under a consolidation pressure of 200 kPa. Furthermore, the long-term strength of specimens with stone contents ranging from 10% to 30% decreases more significantly compared to specimens with stone contents ranging from 50% to 70%. The strength discount factor for soil–stone mixtures with more than 50% stone content is considerably larger than that for specimens with less than 30% stone content. In creep tests conducted under the same consolidation pressure, the strength discount factor of the specimen increases as the stone content increases. Previous studies on landslide tests have also indicated that soil landslides with the same slope gradient are more susceptible to destabilization and damage compared to soil–stone mixtures [27].

7. Discussion

The deformation and strength of the residual soil are closely related to its soil and stone structural characteristics, which can be observed through macroscopic particle displacement and fragmentation. The role of coarse particles in providing a skeleton framework and the embedding role of fine particles undergo significant changes with varying stone content in residual soil. Consequently, the transient shear strength and long-term strength of the soil are also affected. To analyze the impact of particle gradation on residual soil strength, the uniformity coefficient and curvature coefficient of the coarse-grained soil are employed. It is determined that when the uniformity coefficient (Cu) exceeds 5, and the curvature coefficient (Cc) falls within the range of 1–3, the soil sample exhibits well-graded properties. In cases where the gradation is satisfactory, a higher uniformity coefficient implies a more pronounced compaction effect and a more evenly distributed and rational force transmission. Figure 12 displays the uniformity coefficient and curvature coefficient of samples with different stone contents. It is evident that, although the uniformity coefficient of each stone content specimen exceeds 5, the curvature coefficient of specimens with 10% and 30% stone content is equal to or less than 1. This indicates an excessive presence of fine particles in these specimens, which hinders the formation of a well-compacted skeleton structure.
The grading condition of residual soil directly affects its strength characteristics. As the stone content increases, the instantaneous shear strength shows a linear increase, while the long-term strength exhibits a smaller value below 50% stone content and a larger value above 50% (refer to Figure 13). This phenomenon can be attributed to the following factors: in the instantaneous shear test, equal strain loading was applied, resulting in a higher proportion of large boulders on the shear surface. This leads to greater resistance during shear, increased fragmentation of large particles, and, consequently, higher shear strength. During the creep test, step-by-step equal stress loading was employed. In specimens with a stone content below 10% and 30%, the higher concentration of fine material leads to a loose soil structure, resulting in a significant decrease in long-term strength. On the other hand, specimens with a stone content of 50% and above exhibit good gradation and a dense structure, leading to a noticeable increase in long-term strength.
Overall, the long-term strength of residual soil is more influenced by gradation effects than its instantaneous shear strength. In future studies, advanced analysis methods such as fractal theory can be utilized to analyze the influence of residual soil gradation on its long-term strength.
Furthermore, studies have indicated that the long-term strength and instantaneous shear strength of 70% of the samples exhibit only marginal improvements compared to 50% of the samples, with insignificant growth. Existing research has found that, with an increase in stone content, the cohesion of the sample initially increases. However, beyond a certain stone content value (some suggest around 60%), the cohesion starts to decrease [29]. At higher levels of stone content, such as 80, the soil may become non-cohesive, resulting in a reduced shear strength [30].

8. Conclusions

In this paper, the focus was on investigating the creep characteristics of residual soil with varying stone content. The Burgers model was utilized to accurately fit the creep curve, enabling the determination of the long-term strength index for landslide accumulation bodies. Based on the conducted research, the following conclusions were drawn:
(1)
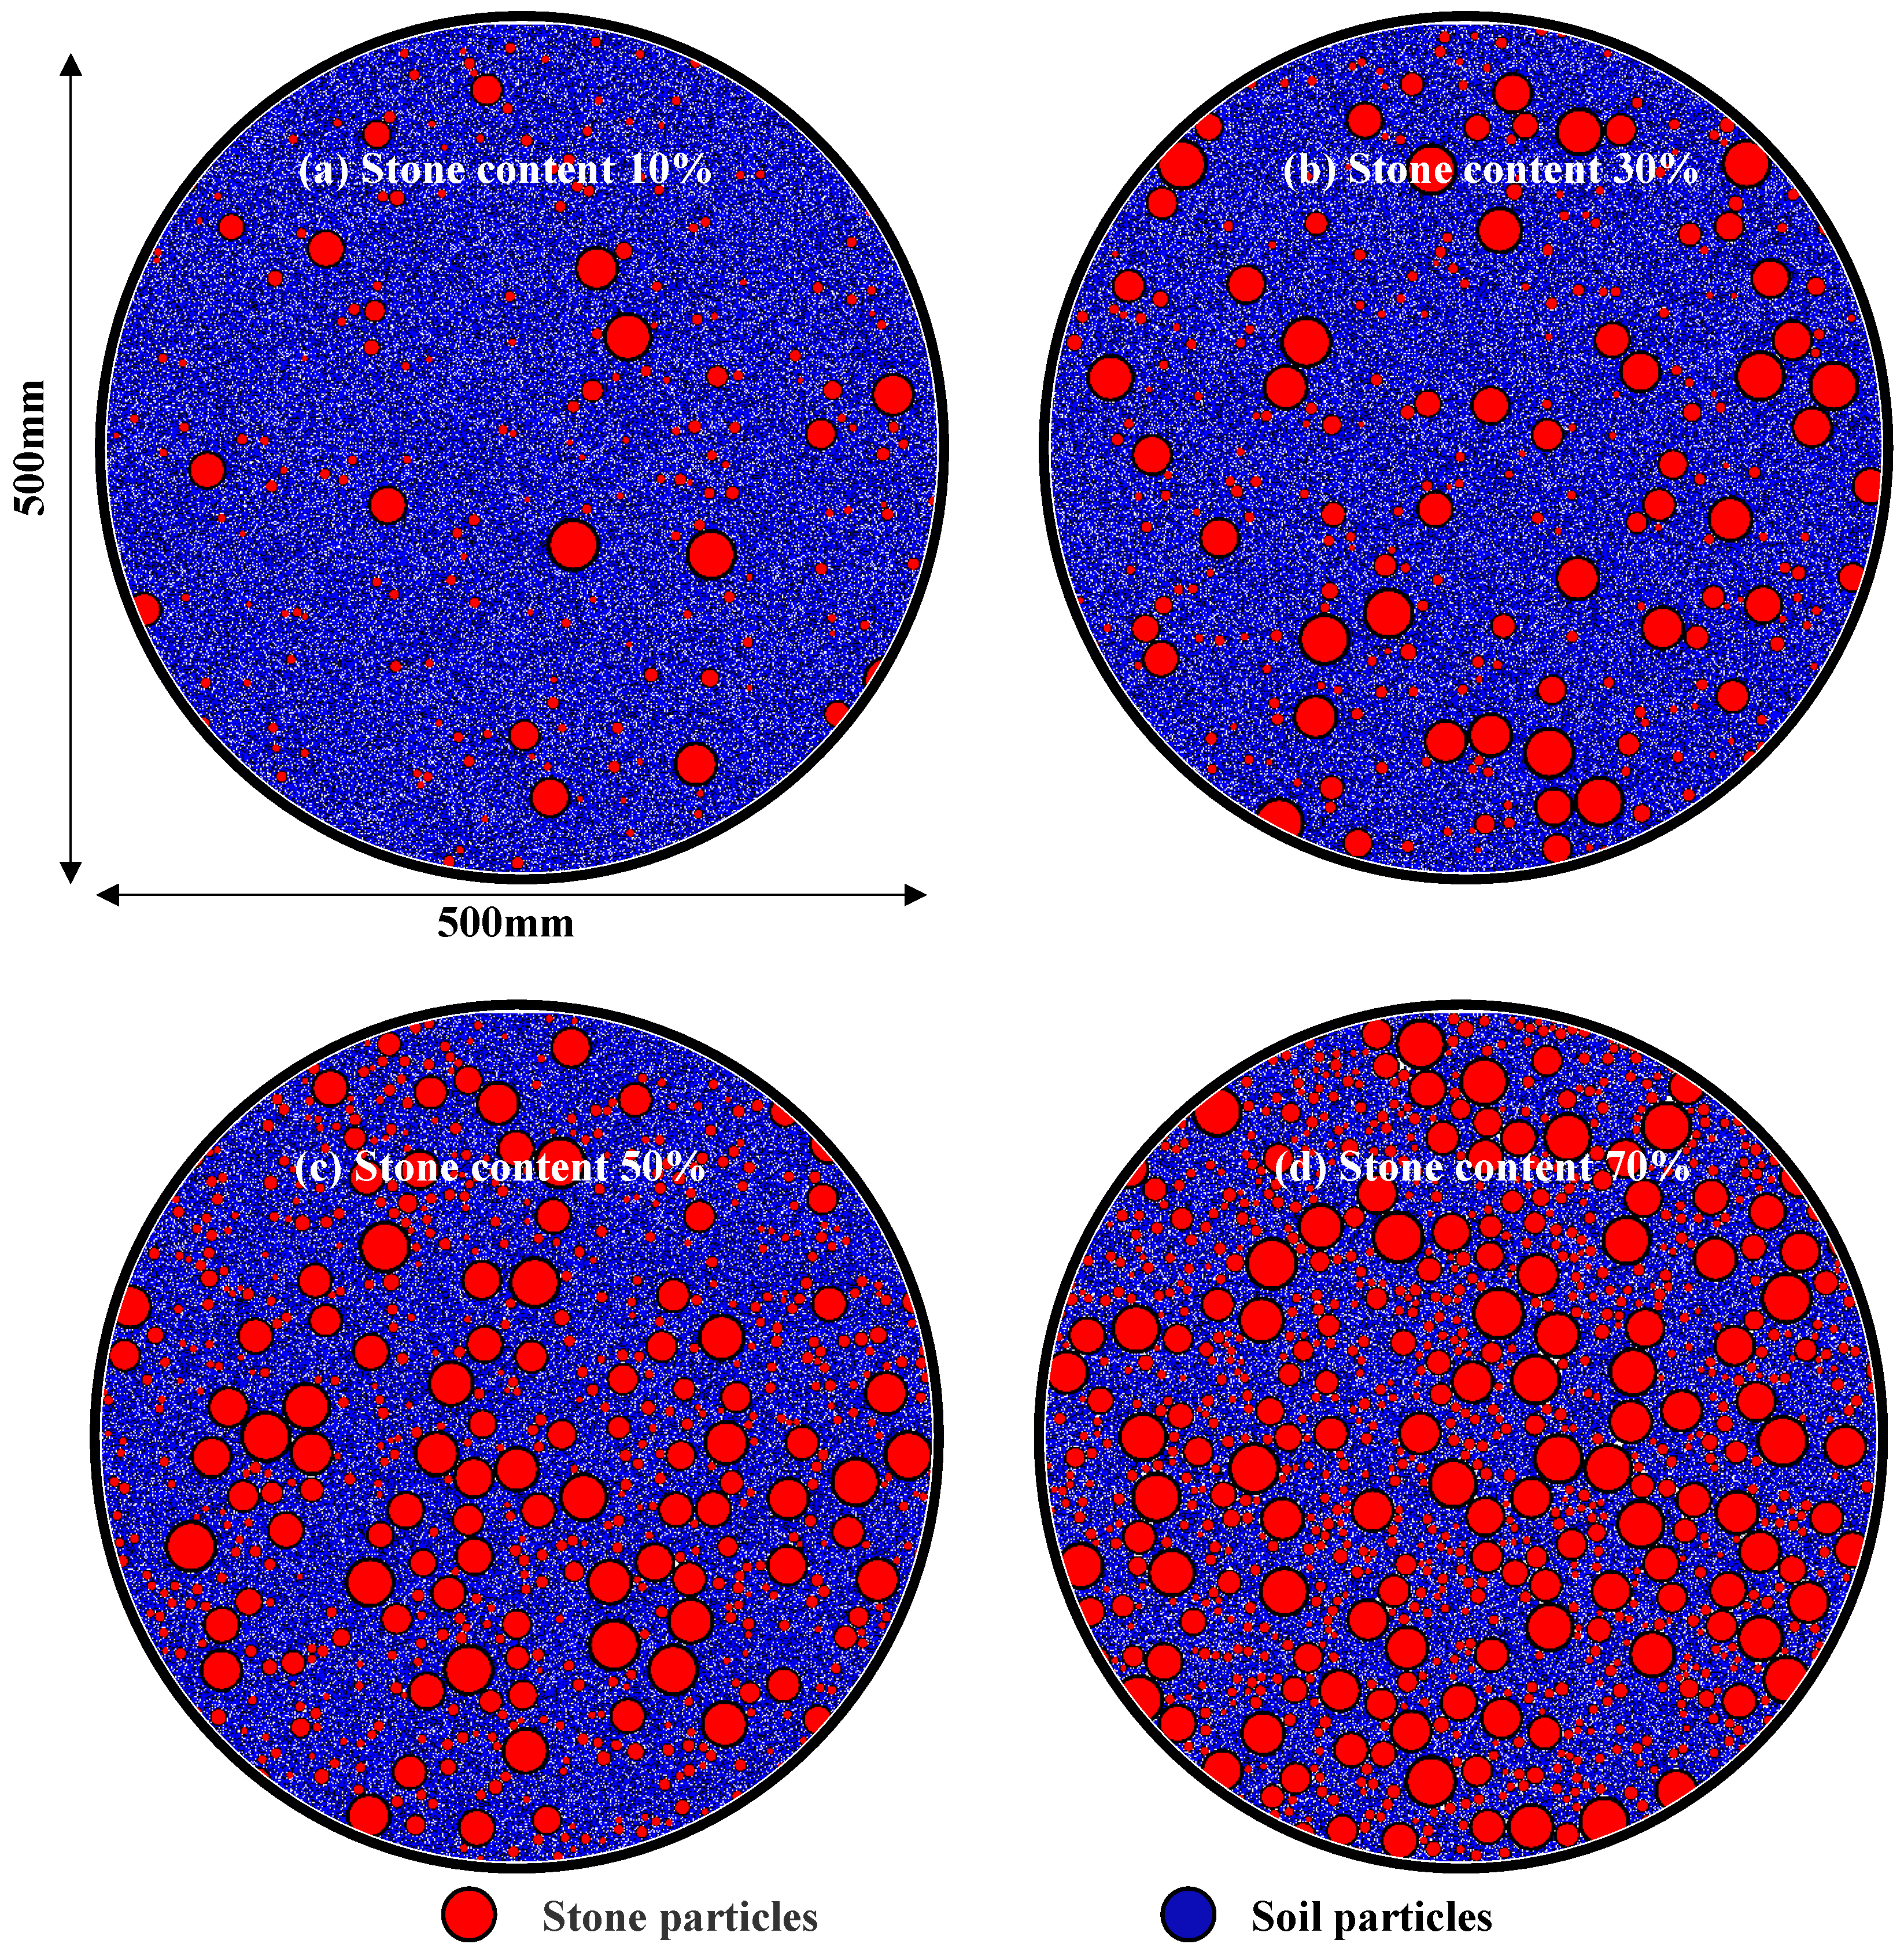
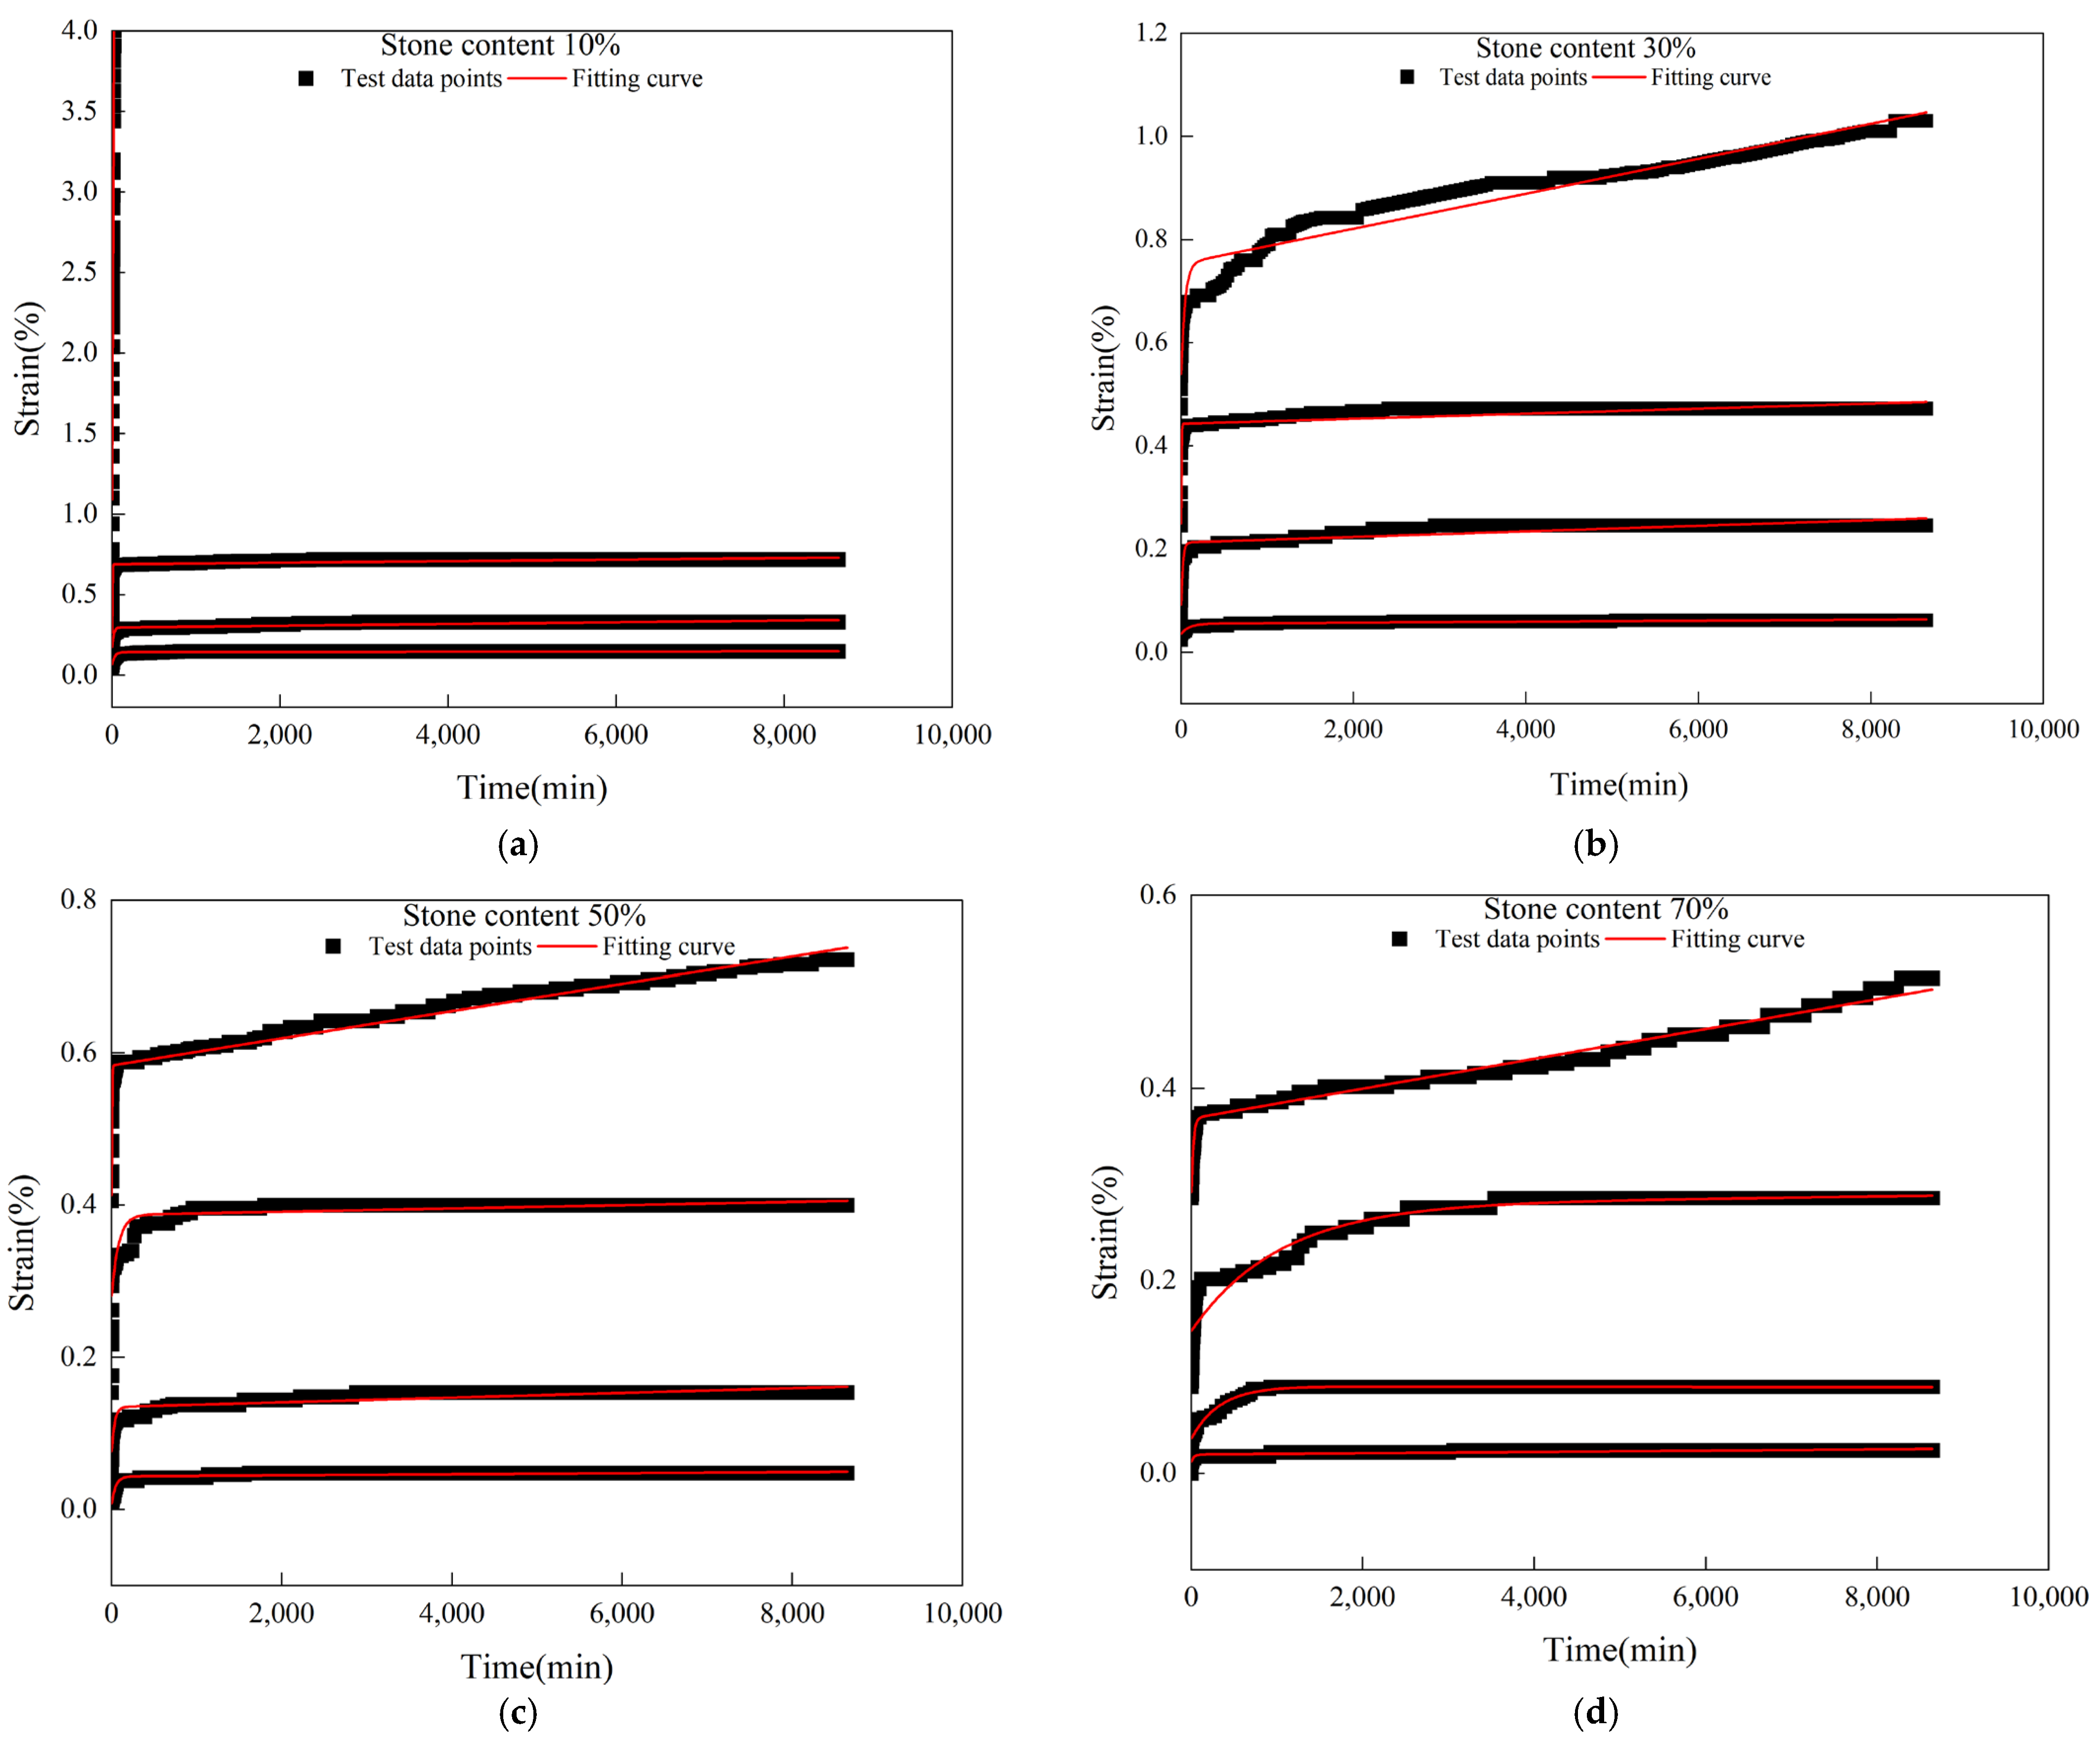
Residual slope soil with varying rock contents exhibits noticeable creep behavior. At lower stress levels, it tends to transition from attenuation creep to steady-state creep. However, under high stress, it undergoes accelerated creep. As the stone content increases, the deformation of the sample shifts from primarily displacement of fine particles to a combination of displacement of coarse and fine particles, as well as damage deformation of large particle block stones. With a higher stone content, the interlocking effect of the particle skeleton becomes more pronounced, making particle rotation more challenging, resulting in a decrease in the shear creep of the sample.
(2)
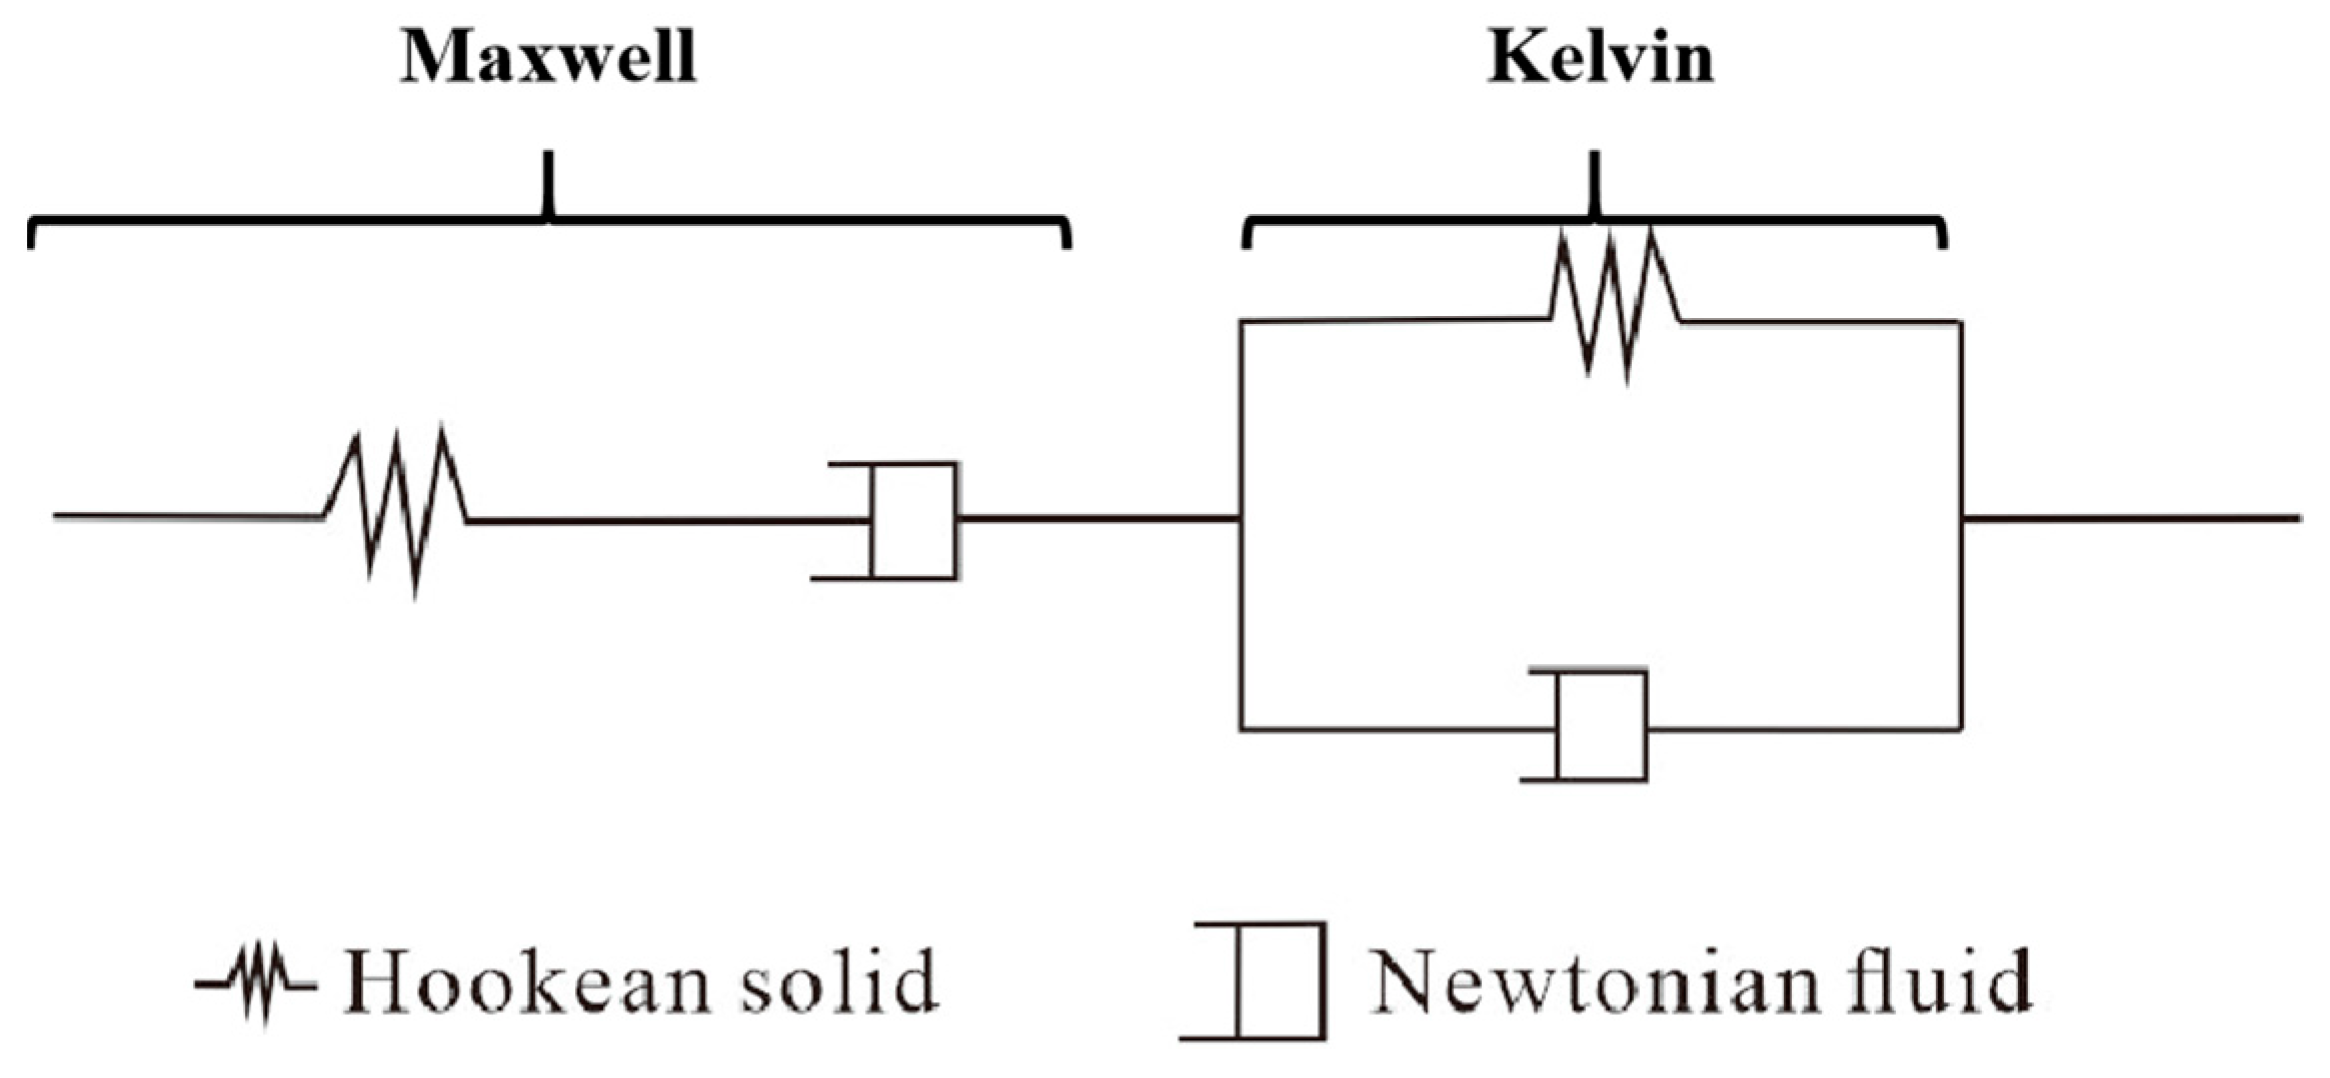
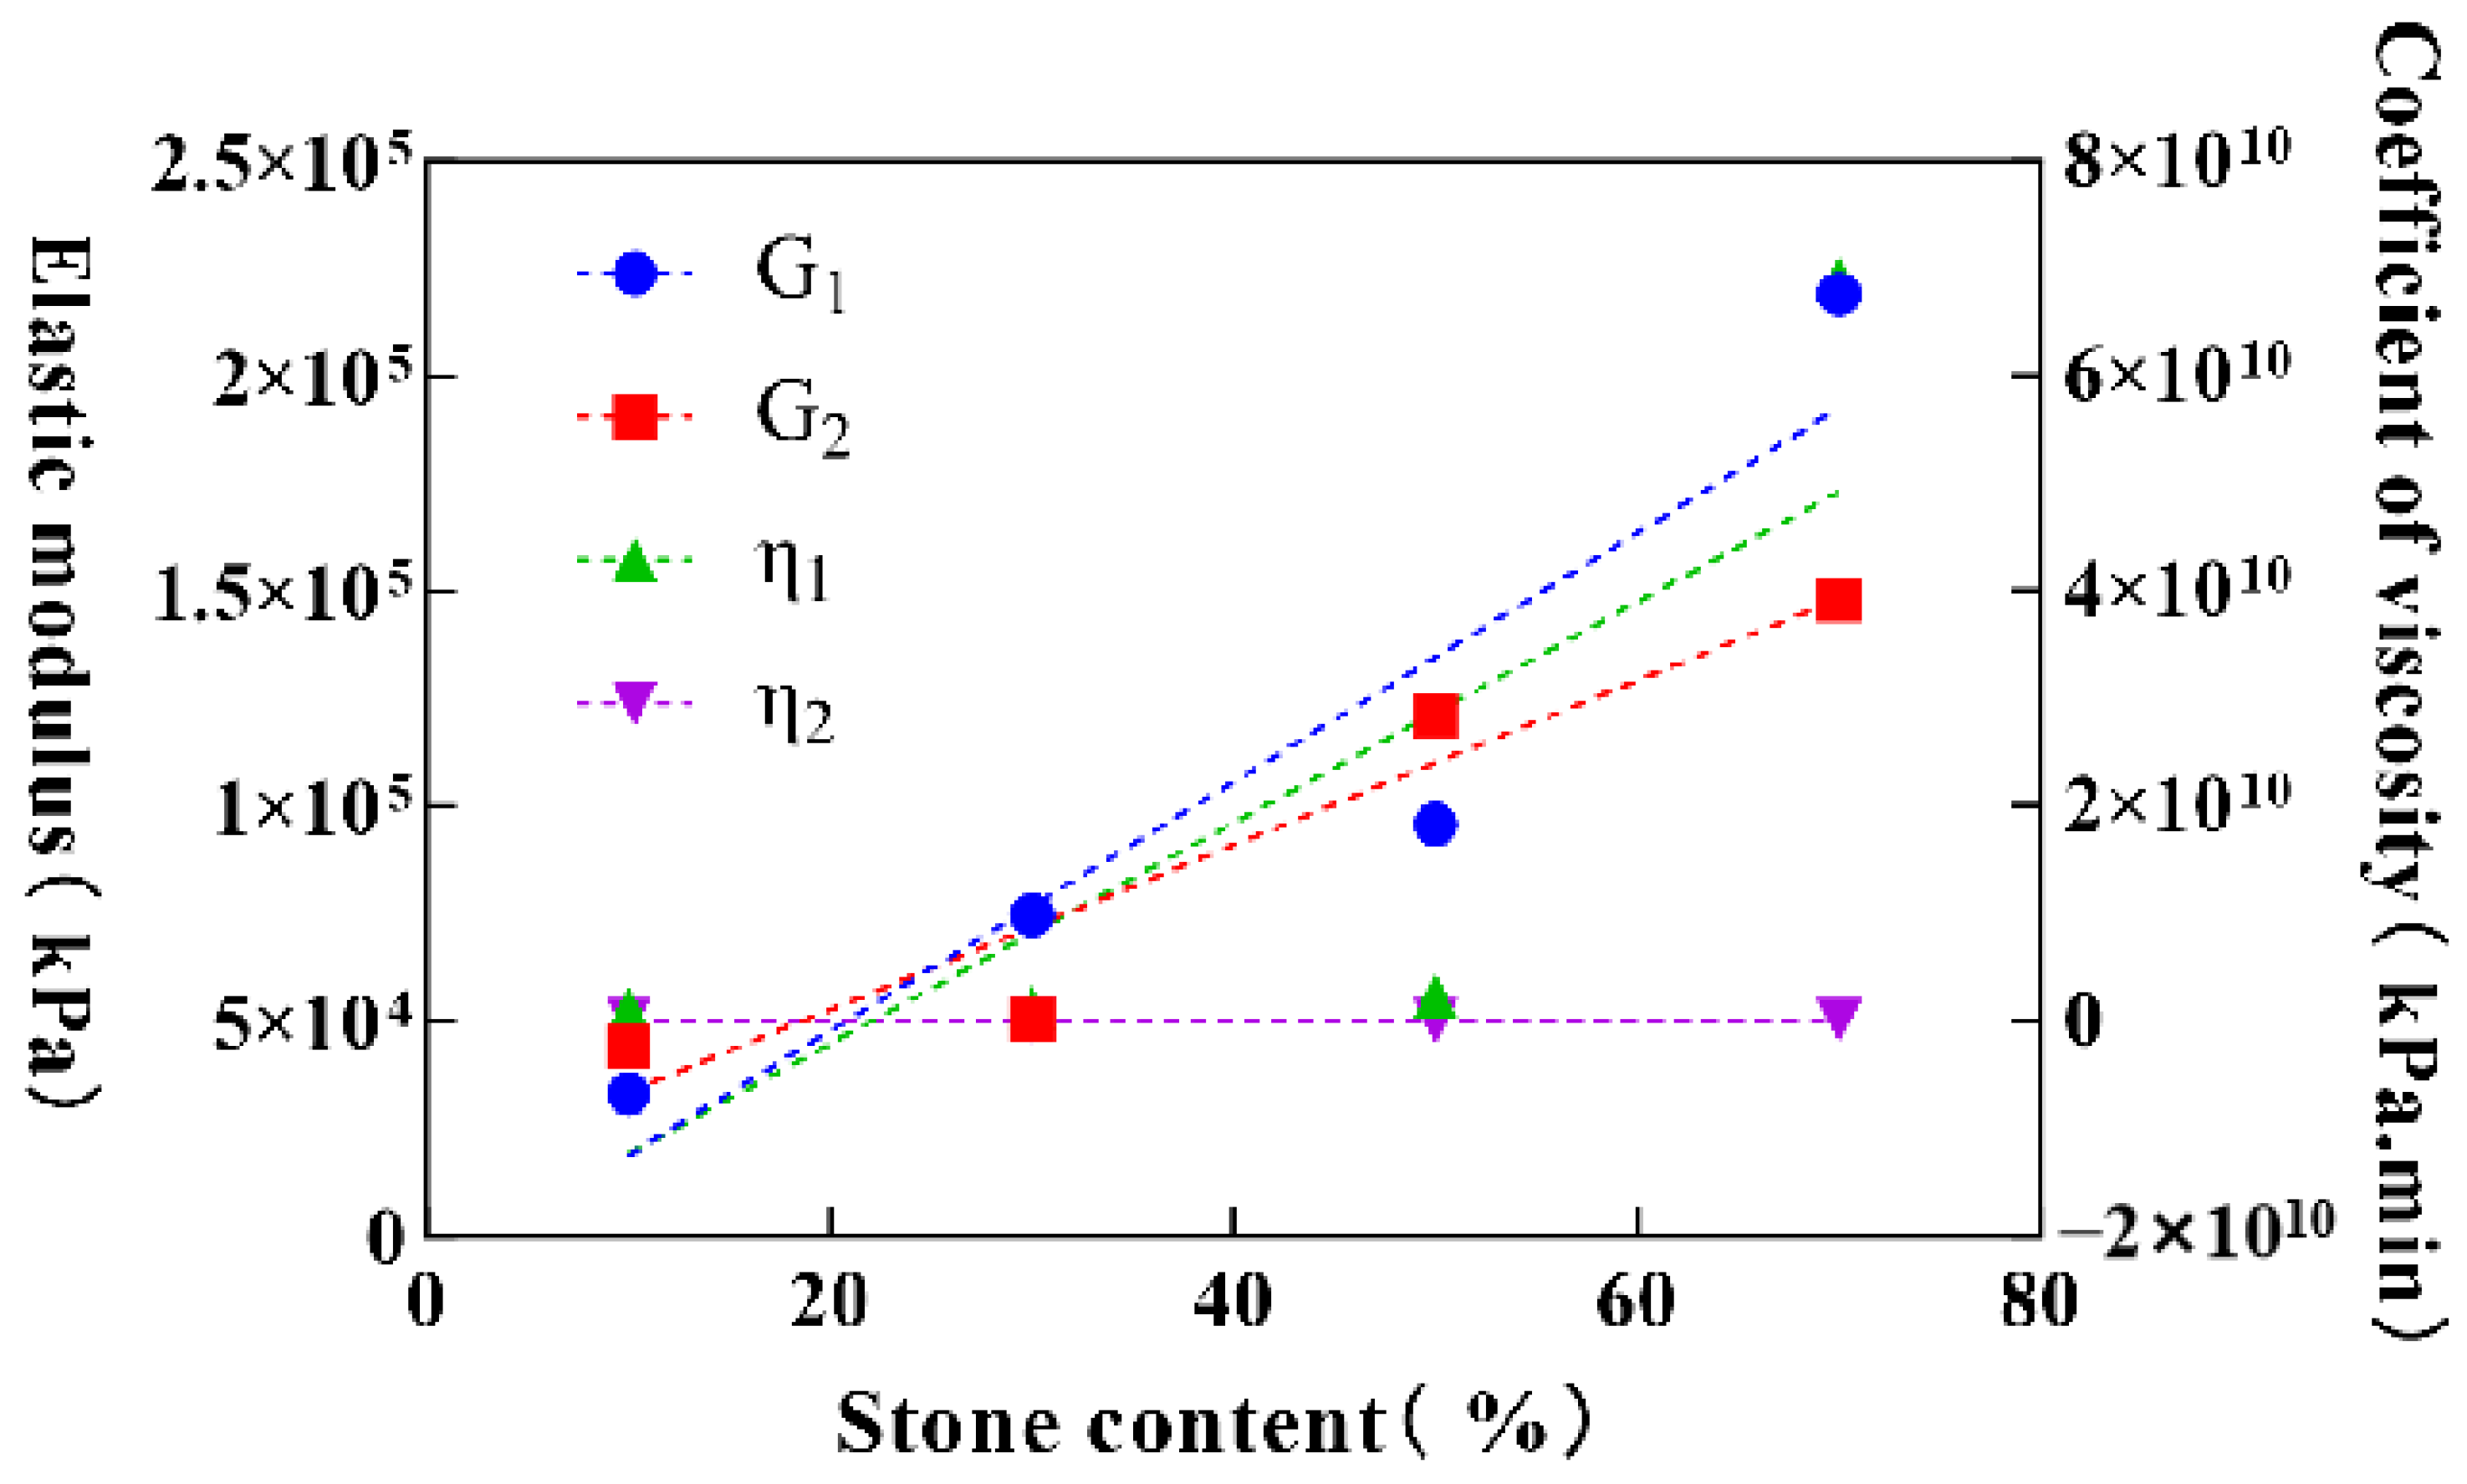
The Burgers model is employed to effectively fit the creep curve, particularly during the decelerated creep and steady-state creep stages. As the stone content increases, the four parameters of the Burgers model significantly increase, with the instantaneous elasticity coefficient (G1) and viscosity coefficient (η1) experiencing more pronounced changes. This indicates that, with an increase in stone content, the specimen’s ability to resist instantaneous deformation and irrecoverable deformation significantly improves, while its ability to resist slow deformation and recovery also increases.
(3)
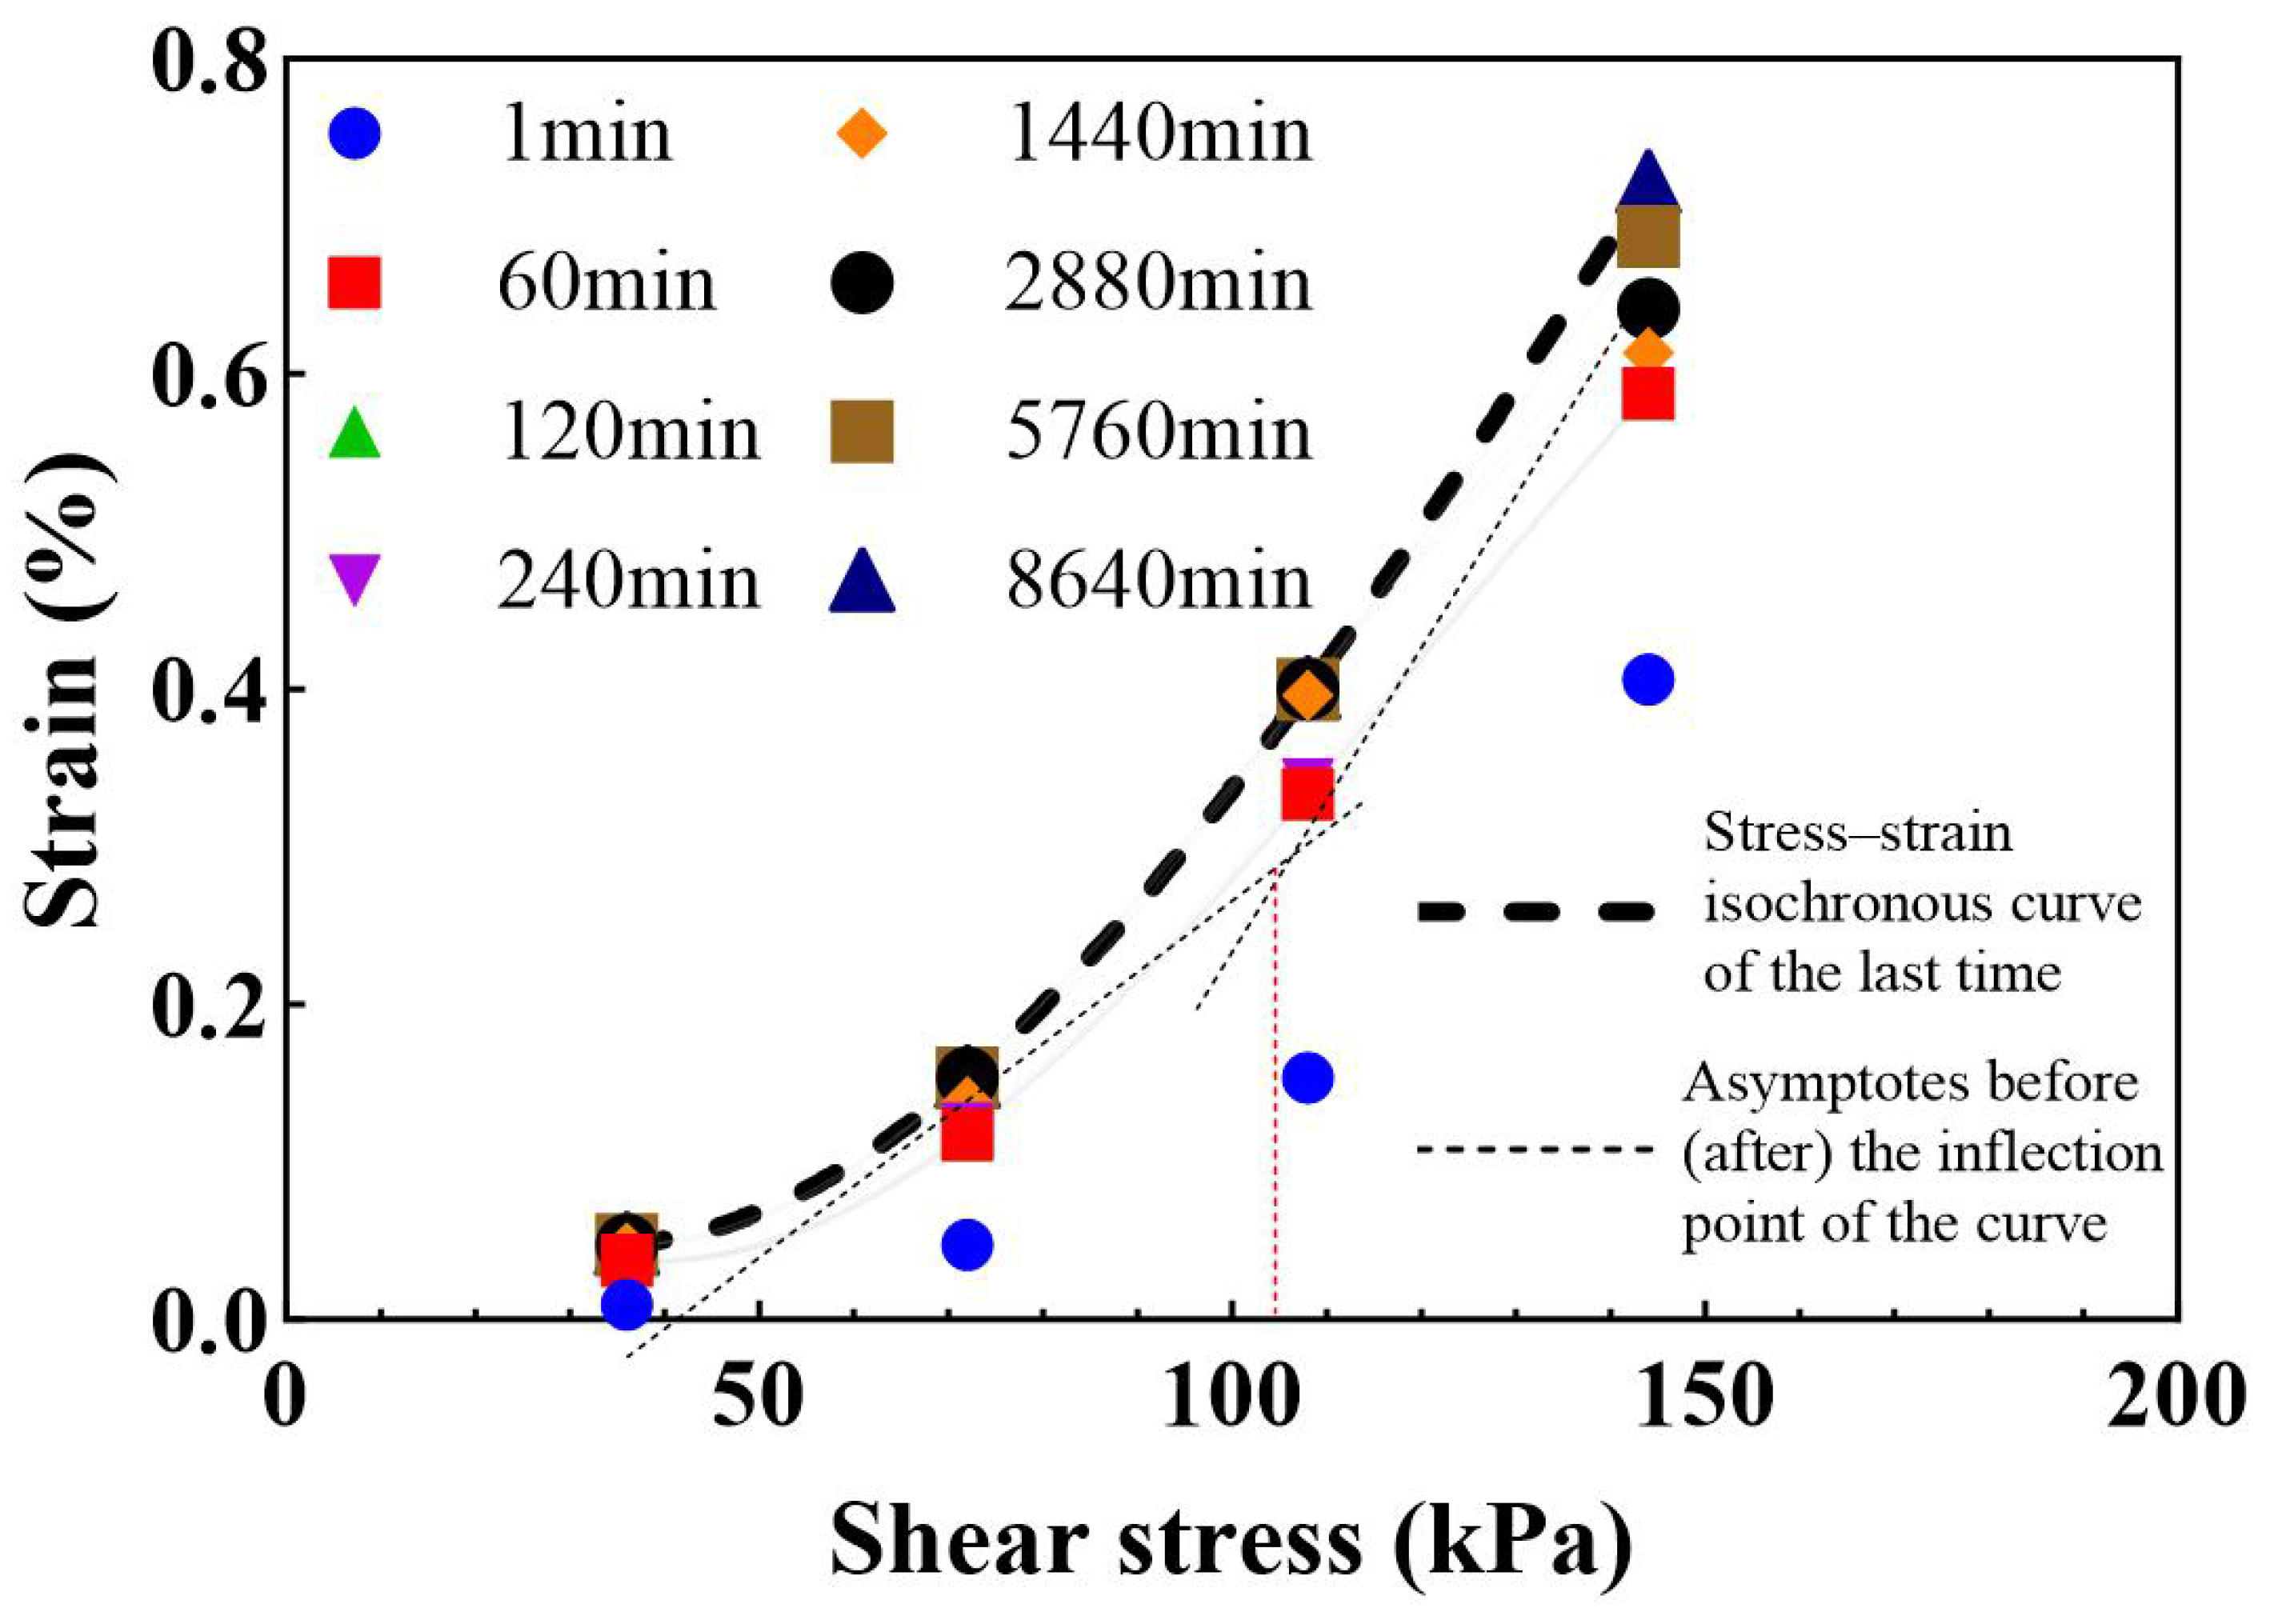
The average long-term strength of specimens with different stone content is found to be approximately 54% of their instantaneous strength. As the stone content increases, the ratio of long-term strength to instantaneous strength also increases.

Author Contributions

J.D. is responsible for experimental planning and data analysis. T.W. is responsible for conducting experiments and writing papers. Y.Z. is responsible for data analysis and paper revision. All authors have read and agreed to the published version of the manuscript.

Funding

This research was funded by The Key Research and Development Project of Henan Province (Grant No. 241111322900).

Institutional Review Board Statement

Not applicable.

Informed Consent Statement

Not applicable.

Data Availability Statement

All the data used in this research are easily accessible by downloading the various documents appropriately cited in this paper.

Acknowledgments

This research work was sponsored by the Key Research and Development Project of Henan Province (Grant No. 241111322900).

Conflicts of Interest

Authors have no conflicts of interest to declare.

References

  1. Li, S.-Y.; Li, D.-D.; Liu, H.-D.; Wang, S.-W.; Geng, Z.; Peng, B. Formation and failure mechanism of the landslide: A case study for Huaipa, Western Henan, China. Environ. Earth Sci. 2021, 80, 478. [Google Scholar] [CrossRef]
  2. Massey, C.I.; Petley, D.N.; Mcsaveney, M.J. Patterns of movement in reactivated landslides. Eng. Geol. 2013, 159, 1–19. [Google Scholar] [CrossRef]
  3. Ehrlich, M.; Da Costa, D.P.; Silva, R.C. Behavior of a colluvial slope located in Southeastern Brazil. Landslides 2018, 15, 1595–1613. [Google Scholar] [CrossRef]
  4. Den Ham, G.V.; Rohn, J.; Meier, T.; Czurda, K. A Method for Modeling of a Creeping Slope with a Visco-Hypoplastic Material Law. Math. Geol. 2006, 38, 711–719. [Google Scholar] [CrossRef]
  5. Carey, J.M.; Petley, D.N. Progressive shear-surface development in cohesive materials; implications for landslide behaviour. Eng. Geol. 2014, 177, 54–65. [Google Scholar] [CrossRef]
  6. Yang, W.; Zhang, Q.; Li, S.; Wang, S. Time-Dependent Behavior of Diabase and a Nonlinear Creep Model. Rock Mech. Rock Eng. 2014, 47, 1211–1224. [Google Scholar] [CrossRef]
  7. Wu, F.; Zhang, H.; Zou, Q.; Li, C.; Chen, J.; Gao, R. Viscoelastic-plastic damage creep model for salt rock based on fractional derivative theory. Mech. Mater. 2020, 150, 103600. [Google Scholar] [CrossRef]
  8. Li, S.-N.; Peng, Z.; Huang, Z.-H.; Liang, Q.; Liu, J.; Zhou, W.-Q. Time-Dependent Deformation and Long-Term Strength of Carbonaceous Mudstone under Dry and Wet Cycles. Sustainability 2022, 14, 12044. [Google Scholar] [CrossRef]
  9. Wang, Z.; Shen, M.; Gu, L.; Zhang, F. Creep Behavior and Long-Term Strength Characteristics of Greenschist under Different Confining Pressures. Geotech. Test. J. 2018, 41, 55–71. [Google Scholar] [CrossRef]
  10. Jiang, X.; Wen, B. Creep behavior of slip zone of reactivated slow-moving landslide and its characteristic strength. Rock Soil Mech. 2015, 36, 495–501+549. [Google Scholar]
  11. Zhu, F.; Duan, Z.; Wu, Z.; Wu, Y.; Li, T.; Cai, Y. Experimental Study on Direct Shear Creep Characteristics and Long-Term Strength of Red Layer Sliding Zone Soil in Southern Hunan. Adv. Mater. Res. 2013, 842, 782–787. [Google Scholar] [CrossRef]
  12. Lai, X.L.; Wang, S.M.; Ye, W.M.; Cui, Y.J. Experimental investigation on the creep behavior of an unsaturated clay. Can. Geotech. J. 2014, 51, 621–628. [Google Scholar] [CrossRef]
  13. Zheng, H.; Feng, X.-T.; Hao, X.-J. A creep model for weakly consolidated porous sandstone including volumetric creep. Int. J. Rock Mech. Min. Sci. 2015, 78, 99–107. [Google Scholar] [CrossRef]
  14. Long, Z.; Cheng, Y.; Yang, G.; Yang, D.; Xu, Y. Study on Triaxial Creep Test and Constitutive Model of Compacted Red Clay. Int. J. Civ. Eng. 2020, 19, 517–531. [Google Scholar] [CrossRef]
  15. Sun, J. Some advances in rock rheological mechanics and its engineering applications. Chin. J. Rock Mech. Eng. 2007, 26, 1081–1106. (In Chinese) [Google Scholar]
  16. Jiang, Z.; Wang, H. Study on Shear Creep Characteristics and Creep Model of Soil-Rock Mixture Considering the Influence of Water Content. Front. Phys. 2022, 10, 819709. [Google Scholar] [CrossRef]
  17. Yin, Q.; Dai, J.; Dai, G.; Gong, W.; Zhang, F.; Zhu, M. Study on Creep Behavior of Silty Clay Based on Fractal Derivative. Appl. Sci. 2022, 12, 8327. [Google Scholar] [CrossRef]
  18. Yao, X.; Zhang, X.; Lin, X.; Jin, L.; Wang, W. A Modified Plastic Burgers Model for the Non-Decaying Creep of Frozen Soils. Appl. Sci. 2024, 14, 2092. [Google Scholar] [CrossRef]
  19. Xiao, M.; Guo, X.; Li, C.; Ren, J.; Dong, J.; Zhuang, Y.; Li, Z. Study of fractional Burgers damage creep model and creep properties of asphalt mixtures. Mater. Struct. 2024, 57, 74. [Google Scholar] [CrossRef]
  20. Cheng, L.; Liu, J.; Ren, Y.; Liang, C.; Zhang, Q. Study on long-term uniaxial compression creep mechanical behavior of rocksalt-mudstone combined body. Int. J. Damage Mech. 2022, 31, 275–293. [Google Scholar]
  21. Okubo, S.; Fukui, K.; Hashiba, K. Long-term creep of water-saturated tuff under uniaxial compression. Int. J. Rock Mech. Min. Sci. 2010, 47, 839–844. [Google Scholar] [CrossRef]
  22. Sun, M.; Tang, H.; Wang, X.; Hu, X.; Wang, M.; Ni, W. Creep properties of sliding-zone soil from a creeping landslide. Rock Soil Mech. 2017, 38, 385–391+399. [Google Scholar]
  23. Liu, H.; Miao, H.; Chen, Z. Shear creep behaviors of sliding-zone soil of bedding landslide in Jurassic stratum in Three Gorges Reservoir area. Chin. J. Geotech. Eng. 2019, 41, 1573–1580. [Google Scholar]
  24. Hu, X.; Sun, M.; Tang, H.; Xie, N.; Guo, J. Creep tests of gravel-soil of Majiagou landslide in Three Gorges Reservoir area. Rock Soil Mech. 2014, 35, 3163–3169+3190. [Google Scholar]
  25. Dong, J.; Jing, M.; Zhao, Y. Study on creep characteristics of Huahuayanzu landslide deposits. J. North China Univ. Water Resour. Electr. Power (Nat. Sci. Ed.) 2024, 45, 77–84. [Google Scholar]
  26. Dong, J.; Zhao, Y.; Liu, H.; Zhao, J.; Zhang, Z.; Chi, Q.; Yang, J. Creep Characteristics of a Strongly Weathered Argillaceous Sandstone Sliding Zone and the Disaster Evolution Mechanism of the Huaipa Landslide, China. Appl. Sci. 2023, 13, 8579. [Google Scholar] [CrossRef]
  27. Wen, B.; Jiang, X. Effect of gravel content on creep behavior of clayey soil at residual state: Implication for its role in slow-moving landslides. Landslides 2017, 14, 559–576. [Google Scholar] [CrossRef]
  28. Wang, H.; Ma, Z.; Wulan, T.; Fan, Z.; Wang, C. Calibration method of mesoscopic parameters using BP neural network and Burgers model. Trans. Chin. Soc. Agric. Eng. 2022, 38, 152–161. [Google Scholar]
  29. Yang, J.; Dong, J.; Huang, Z.; Zheng, Z.; Qi, D. Large-scale direct shear tests on accumulation body with different stone contents. Chin. J. Geotech. Eng. 2016, 38, 161–166. [Google Scholar]
  30. Jiang, Q.; Xu, Y.; Wang, H. Research on shear deformation characteristics of soil-rock mixtures under different stone contents. J. Eng. Geol. 2020, 28, 951–958. [Google Scholar]
Figure 1. Site conditions of the landslide. (a) Landslide engineering geological plan, (b) landslide 1-1 ‘ engineering geological profile, (c) tensile cracks caused by slope sliding, and (d) accumulation.
Applsci 14 06829 g001
Figure 2. ZJ50-2G-Large direct shear test machine.
Applsci 14 06829 g002
Figure 3. Mixing of sheared soil samples. (a) Mixing process and (b) sample after mixing with water.
Applsci 14 06829 g003
Figure 4. Particle size distribution of specimens with different stone content.
Applsci 14 06829 g004
Figure 5. Loading creep curves respectively.
Applsci 14 06829 g005aApplsci 14 06829 g005b
Figure 6. Final creep strain of specimens with different stone content.
Applsci 14 06829 g006
Figure 7. The schematic diagram of shear surface of samples with different stone content.
Applsci 14 06829 g007
Figure 8. Burgers creep model.
Applsci 14 06829 g008
Figure 9. Fitting curve of Burgers model.
Applsci 14 06829 g009
Figure 10. The variation of Burgers model parameters with stone content under secondary loading.
Applsci 14 06829 g010
Figure 11. Stress–strain isochronous curve point of 50% stone content specimen.
Applsci 14 06829 g011
Figure 12. Uniformity coefficient and curvature coefficient with different stone content.
Applsci 14 06829 g012
Figure 13. Instantaneous shear strength and long-term strength of specimens with different stone content.
Applsci 14 06829 g013
Table 1. Comprehensive selection of physical and mechanical parameters of sliding body and sliding zone.
Moisture ConditionGravity
(kN/m3)
Cohesion
(kPa)
Friction
(°)
Natural Water Content%2 mm
Plastic Limit/%
10 mm
Liquid Limit/%
Nature26.312.524.811–1720.3333.34
Saturation27.38.022.0
Table 2. Percentage of mass in each particle size group of samples/%.
Stone Content/%Quality of Water/kgPercentage of Mass of Particles/%
<0.075 mm0.075–1 mm1–2 mm2–5 mm5–10 mm10–20 mm20–40 mm40–60 mm60–80 mm
1012.7232.812.742.33.12.62.11.21.2
3010.7225.79.832.59.83.939.83.5
508.21.518.26.823.518.39.27.3114.2
705.2110.941421.612.98.61710
Table 3. Creep test loading stress.
Consolidation Pressure/kPaStone Content%Instantaneous Shear Strength/kPaCreep Grading Loading Stress/kPa
2001014028, 56, 84, 112
20030161.532, 64, 96, 128
2005018436, 72, 108, 144
2007019840, 80, 120, 160
Table 4. Burgers model parameters of samples with different stone content.
Stone ContentΤ [kPa] G 1 [kPa] G 2 [kPa] η 1 [kPa.min] η 2 [kPa.min] R 2
10%284.17 × 1043.63 × 1044.41 × 1091.16 × 1060.97
563.30 × 1044.41 × 1041.04 × 1091.08 × 1050.93
841.13 × 1041.37 × 1041.77 × 1092.27 × 1040.93
1121.19 × 1042.97 × 1042.04 × 1085.38 × 1060.92
30%328.95 × 1041.61 × 1053.39 × 1091.54 × 1070.97
647.46 × 1045.04 × 1041.18 × 1091.23 × 1050.93
965.41 × 1043.61 × 1041.97 × 1093.02 × 1040.89
1282.39 × 1045.85 × 1043.77 × 1085.74 × 1050.97
50%364.85 × 1059.88 × 1045.24 × 1094.88 × 1060.98
729.57 × 1041.21 × 1052.32 × 1092.55 × 1050.94
1083.86 × 1041.01 × 1055.00 × 1098.81 × 1050.86
1444.01 × 1046.42 × 1048.07 × 1085.26 × 1040.98
70%403.26 × 1055.28 × 1055.99 × 1091.57 × 1070.85
802.19 × 1051.48 × 1056.91 × 10102.66 × 1060.99
1201.28 × 1059.19 × 1041.22 × 1095.26 × 1050.94
1605.54 × 1042.00 × 1051.03 × 1093.66 × 1050.99
Table 5. Long-term strength of the sample.
Consolidation Pressure/kPaStone Content%Instantaneous Strength/kPaLong-Term Strength/kPaReduced
Factor
2001014069.50.49
30161.5820.53
501841040.57
701981120.57
Disclaimer/Publisher’s Note: The statements, opinions and data contained in all publications are solely those of the individual author(s) and contributor(s) and not of MDPI and/or the editor(s). MDPI and/or the editor(s) disclaim responsibility for any injury to people or property resulting from any ideas, methods, instructions or products referred to in the content.

