Article

Optimizing the Influence of Fly Ash as an Anti-Sagging Additive in Highly Deviated Geothermal Well Drilling Fluids Using Surface Response Method

Department of Energy and Petroleum Engineering, University of North Dakota, Grand Forks, ND 58203, USA
*
Author to whom correspondence should be addressed.
Appl. Sci. 2024, 14(15), 6833; https://doi.org/10.3390/app14156833 (registering DOI)
Submission received: 13 July 2024 / Revised: 30 July 2024 / Accepted: 31 July 2024 / Published: 5 August 2024
(This article belongs to the Special Issue Recent Advances in Drilling Fluid Technologies)

Abstract

:
Weighting materials such as barite and ilmenite are crucial for controlling fluid density during deep or ultra-deep drilling operations. However, sagging poses significant challenges, especially in highly deviated high-pressure and high-temperature (HP/HT) wells. This leads to inadequate well control, wellbore instability, and variations in hydrostatic pressure in extended-reach wells. Given the challenges of experimental research, reliable prediction models are imperative for evaluating the interaction between the ratio of anti-sagging additives, temperature, and wellbore inclination on sag factor (SF). This research presents statistical-based empirical models for predicting the SF at various wellbore inclinations (0°, 30°, 45°, 60°, 70°, 80°, and 90°) and assessing the influence of fly ash on the SF. The regression equations, developed using the Response Surface Methodology in Minitab 18 software, show high reliability, with R2 values approaching unity. Contour and surface response plots provide a clear understanding of the variable interactions. The analysis reveals that sagging is most severe at 60° to 65° inclination. At 400 °F and 60° inclination, adding 4 lb/bbl of fly ash reduces sagging in barite and ilmenite-densified fluid by 63.9% and 63.1%, respectively. Model validation shows high accuracy, with percentage errors below 3%. This study offers valuable insights for optimizing drilling fluid formulations in HP/HT well environments.

1. Introduction

Directional drilling, particularly in high-temperature environments, presents a unique set of challenges, one of which is the phenomenon of weight material sagging in the drilling fluids. The ability of drilling fluids to effectively suspend weight materials is paramount for the success of drilling operations. Weight materials that settle out of the fluid column not only cease to contribute to hydrostatic pressure but also have the potential to induce fluctuations in hydrostatic pressure. The inadequate design of drilling fluids to address sagging issues can lead to significant drilling challenges, including insufficient mud density, which in turn may result in critical issues such as compromised well control, pipe sticking, downhole mud losses, and even formation fractures. Thus, understanding and effectively managing weight material sag in deviated drilling operations is imperative for ensuring drilling efficiency, safety, and overall project success. Sag occurs when the weight material settles out of the drilling fluid, leading to fluctuations in mud density and hydrostatic pressure. This phenomenon is observed in both vertical and inclined well positions, as well as in static and dynamic conditions, although it is more prevalent under dynamic conditions with low shear rates. Several factors contribute to sag, including particle size distribution, densifying material, subsurface temperature, fluid density, type of fluid, reduced fluid flow, and wellbore configuration. Numerous techniques have been adopted in previous studies to understand and simulate the sagging phenomena. Bern et al. [1] suggested measuring fluid density at the surface by capturing the density of returning fluid when making or coming out of a hole. Practical simulation and prediction of barite sag under stable and dynamic conditions have been studied using different approaches including flow-circuit experimental setups, a Viscometer Sag Shoe Test (VSST), and a form of sag envelope apparatus setups. Flow properties and viscoelastic data obtained from viscometers are used in a distinct technique for detecting barite sag, correlating the obtained sag data with sag propensities. Magnetic and acoustic methods have been applied to study sagging tendencies by noting the density difference in the data obtained from both principles. An innovative approach by Ofei et al. [2] involved using a stability analyzer with a light source to scan drilling fluids under static and dynamic conditions. The dynamic and static settings were studied using a rheometer and an optical scanning apparatus. The settling rates of solids and stability were characterized by applying the modified Stokes law of settling, while the dynamic data were reported by comparing the shear rates between oscillatory and rotational conditions. To address this persistent issue, reduction in the particle size of the weight material and the combination of weighting agents have been explored as alternative ways to lower the settling rate and increase the solid particle suspension.
Jamison and Clements [3] proposed the use of a high-angle sag tester (HAST) instrument that may identify sag susceptibility by changing the location of the test fluid’s center of mass at temperatures up to 300 °F and inclination angles between 20° and 90°. The outcomes show that the data on the viscosity measurement of drilling muds are not accurate for estimating sag behavior in extended-reach well drilling. The angle of borehole inclination during drilling, as an important parameter in the study of barite sagging, was explored by Bern et al. [1]. The outcome showed that the highest sag factor ranged from 60° to 75°, often occurring at reduced annular velocities. They asserted that drill stem rotation has been shown to be particularly helpful in minimizing barite settling. The influence of the dynamic barite sag and shear rate obtained from a rheometer and a borehole-hydraulics flow circuit on an invert-emulsion fluid (IEFs) was studied by Dye et al. [4]. The results suggest that the dynamic sag tendency increases with increasing hole deviation during drilling and is usually initiated at low shear rates below 4 s−1 when the inclination is between 45° and 60°. Drilling fluids formulated from IEFs, rheology improver additives, and nanoparticles have been investigated. The negative effect of sagging may be more devastating in elevated wells under inclined conditions. To reduce sagging incidence in dynamic and static drilling operations, it is expedient to design drilling mud to withstand HPHT conditions. Numerous materials, including the reduction of particle size of weighting materials or a blend (ilmenite, barite, vermiculite, hematite), organophilic clay, nano silica, urea-based copolymer, and polyethylene glycol, have all been studied as sag inhibitors to prevent sagging in the drilling sector. Basfar et al. [5]. investigated the adoption of a barite-manganese tetroxide (Micromax) blend to mitigate barite sag challenges in IEFs under elevated conditions. A Micromax of 1.7 µm was added to the IEFs as anti-sagging additives at various concentrations of 0, 15, and 30 wt% of barite. The report showed that Micromax addition enhanced IEF stability by reducing the tendency to sag. Sag was minimized at 350 °F in both dynamic and static settings by adding only 30 wt% of the Micromax additive. Additionally, manganese tetroxide as a sag-resistant additive was also evaluated with micro-sized hematite in a water-based fluid. The formulations had a range of anti-sagging additive/weighting agent ratios (0/100, 10/90%, 15/85%, and 20/80%). The outcomes of the dynamic and static sag setting at HPHT indicated that 20% of manganese tetroxide resolved the sagging problem with hematite and brought the sag susceptibility to an acceptable range. The investigation of vermiculite as a sag-resistant additive in water-based mud (WBM) was explored by Ahmed et al. [6]. The addition of micronized vermiculite to WBM at different concentrations (0, 1, 2, 3, and 4 lb/bbl) was studied at an elevated temperature of 250 °F. The obtained results of the WBM formulated with 4 lb/bbl of vermiculite were efficient in bringing sag to the API acceptable standard. The viability of employing fly ash as a sag-resisting additive in both barite and invert-emulsion fluids was verified to safely reduce sagging in a significantly inclined well and compared with the outcomes of other existing anti-sagging materials. The settling of weight material out of the mud column was thoroughly investigated in deviated positions (30°, 45°, 60°, 70°, 80°, and 90°) while testing at different temperatures (250 °F, 300 °F, 350 °F, and 400 °F). The fluid samples were also assessed while in motion by utilizing a VSST to measure the sag potential in a dynamic setting. In addition, the flow parameters of high-density water-based fluids were evaluated at elevated temperatures. Oni et al. [7]. provided a comprehensive analysis of the drilling fluid design and mitigation strategies for sagging during drilling operations in challenging environments. Recent advances in the oil and gas industry are toward the development of high-pressure, high-temperature (HPHT) reservoirs, which may be accessed through deepwater wells or extended-reach wells that are more prone to the sagging phenomenon. This conundrum is yet to be fully understood and may occur unexpectedly. Regardless of ongoing research, there are no immediate universal remedies, and this may be a limiting factor in the development of geothermal reservoirs. Therefore, it is highly imperative to optimize the ratio of various additives in the formulation of drilling fluids for highly deviated geothermal drilling boreholes. This study aims to optimize the influence of fly ash as an anti-sagging additive in highly deviated geothermal well drilling fluids using the surface response method. By understanding and effectively managing weight material sag, this study seeks to improve drilling fluid formulations, enhance drilling efficiency, and ensure the safety and success of drilling operations.

2. Materials and Methods

2.1. Materials

Barite, bentonite, industrial copolymer, and calcium carbonate were provided by Newpark Resources, Katy, TX, USA, a reputable drilling fluid company worldwide. At the same time, other additives were obtained from reliable chemical-producing companies in the United States. The Harold Hamm School of Geology and Geological Engineering, University of North Dakota, United States, provided the ilmenite rock sample. The fly ash was sourced from the Antelope Valley power station in Beulah, North Dakota.

2.2. Preparation of Drilling Fluid Samples
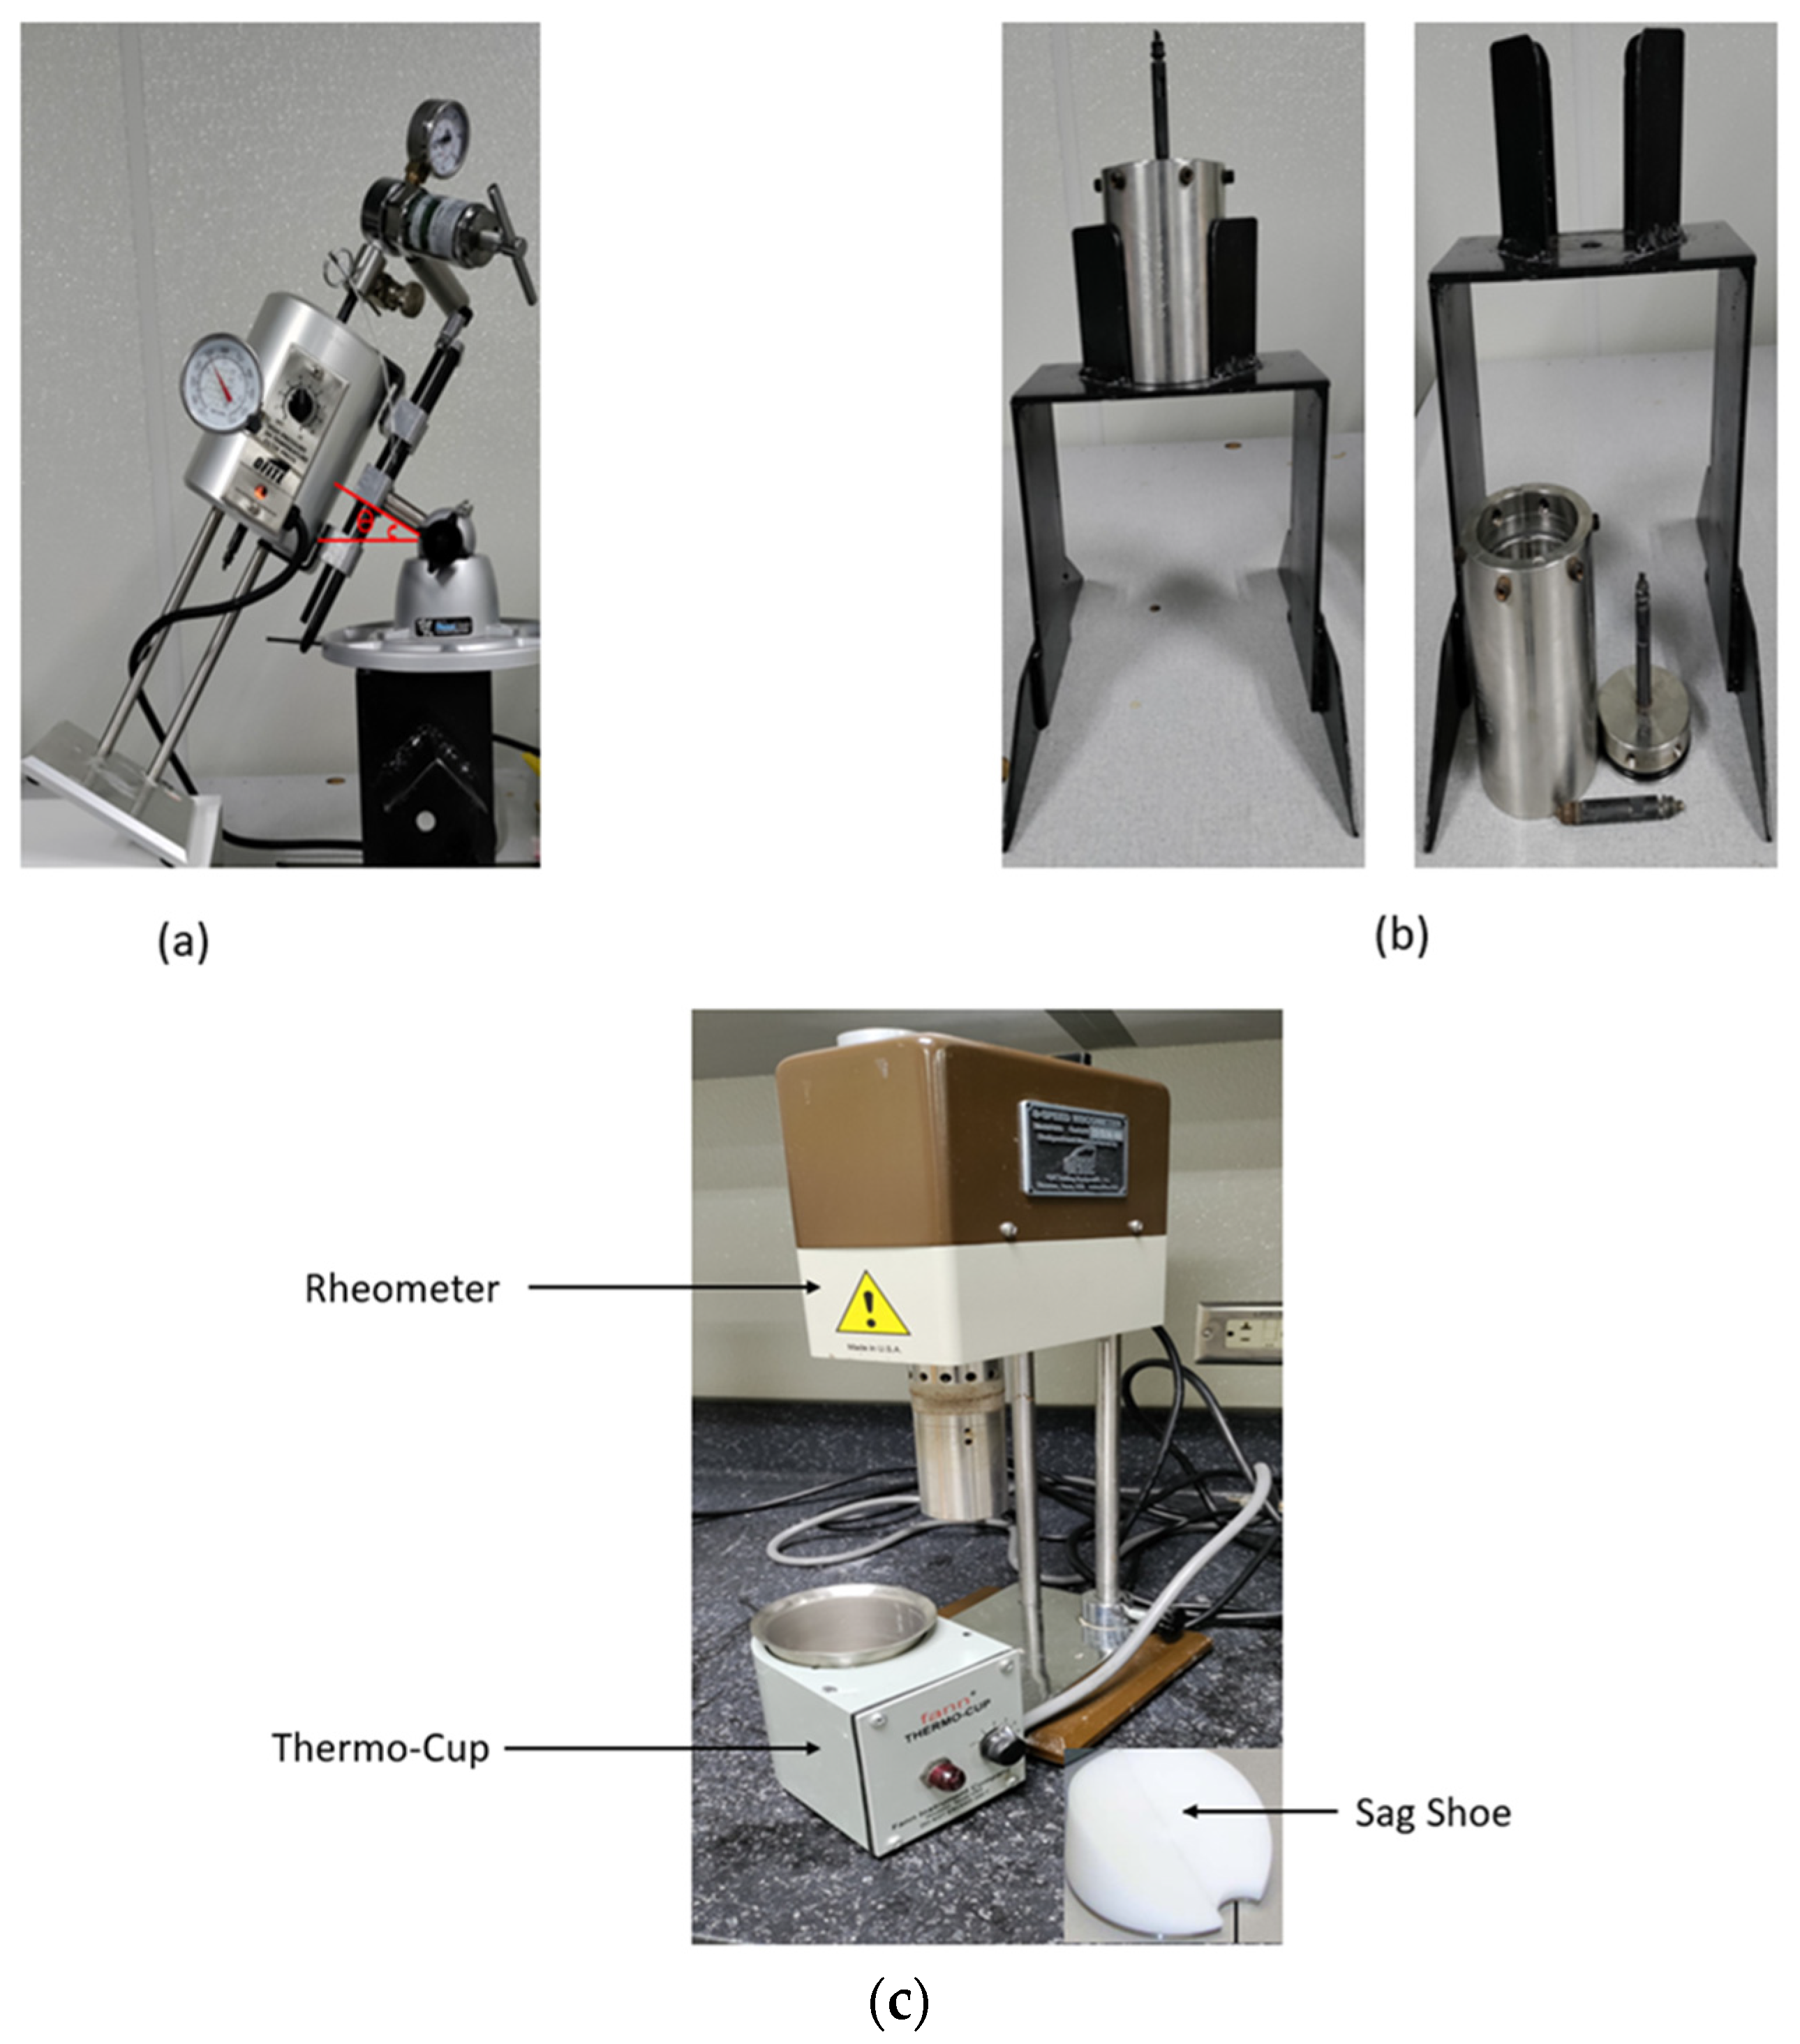
A Hamilton Beach multimixer was adopted to homogeneously mix 350 cm3 of drilling fluid formulated from the combination of the additives shown in Table 1 at ambient temperature. The formulation of the Base Fluid and other fluid samples comprised the additives indicated in each column. The additives were selected based on low cost, efficiency, and in line with the industry-standardized composition. Following the table, six laboratory barrels of drilling fluids with various ratios of fly ash (0, 1, 2, 3, and 4 lb/bbl) were prepared, and their effects on barite and ilmenite sagging mitigation were investigated. The Base Fluid and fluids 1 through 4, densified with barite, weighed 15.8 ppg, while the sixth sample (Fluid 5), densified with ilmenite, weighed 16.2 ppg. The addition of a partially hydrolyzed polyacrylamide (PHPA) copolymer to the fluid samples augmented their thermal stability, shale inhibition, and flow deficiencies.
As supplied by Newpark Resources, the weighting agent barite is of an acceptable oil and gas standard. The results of the X-ray fluorescence (XRF) analysis of the elemental composition of barite, as displayed in Figure 1, usually have barium (Ba) present at 77.5 wt%, sulfur (S) at 17.7 wt%, and a minor trace of potassium, silicon, and iron [8]. While the obtained outcome of XRF analysis of Beulah fly ash as reported by Oni et al. [9] revealed that it is made up of silicon oxide (SiO2) at 24.5%, calcium oxide (CaO) at 17.7 wt%, sodium oxide (Na2O) at 15.8 wt%, iron (III) oxide (Fe2O3) present at 11.2 wt%, aluminum oxide (Al2O3) at 10.9 wt%, sulfur trioxide (SO3) at 10.7 wt%, magnesium oxide (MgO) present at 5.1 wt%, and potassium oxide (K2O) at 1.9 wt% as shown by Figure 2. The elemental composition of ilmenite was measured utilizing the RIGAKU Benchtop Spectrometer and was found to contain 54.7% iron (Fe), 38.4% titanium (Ti), 1.8% magnesium (Mg), 1.4% silicon (Si), 1.3% manganese (Mn), 1.0% aluminum (Al), 0.4% calcium (Ca), 0.3% phosphorus (P), 0.2% zirconium (Zr), 0.1% sulfur (S), 0.1% niobium (Nb), 0.08% potassium (K), 0.07% zinc (Zn), 0.04% copper (Cu), 0.03% nickel (Ni), and 0.01% chlorine (Cl), as presented in Figure 3.
A sieve analysis test was carried out to determine the weight of the material particle size and size distribution. The test was performed following the American Society for Testing Materials (ASTM) C136 [10] standard test procedure. The sample (Ilmenite rock) was crushed and pulverized, and a representative quantity was obtained for analysis. The weight of the empty sieves was recorded (Sieve weight). The sieves were stacked, and the sample was emptied on the topmost sieve. The stack was placed in a mechanical sieve shaker and turned on for 5 min. The weight of the retained sample was recorded (Sample retained). The percentage of retained, percentage of cumulative retained, and percentage of finer (µm) particles were calculated. Thereafter, the cumulative weight percentage was plotted against size (µm). The same procedure was repeated for barite, except for crushing and milling. The result presented in Figure 4 shows that barite and ilmenite were made up of 6.5 µm and 22 µm at D50 (median particle size), respectively, and were utilized in this research. From the data, it is evident that the ilmenite particle size was larger than that of barite, even for D10 (fine) and D90 (large). As depicted by the scanning electron microscopic (SEM) analysis in Figure 5, barite contains heterogeneous particles with cutting edges and erratic shapes. Typically, the surface of a particle is rough and may contain some fractures [8]. Additionally, SEM showed that the fly ash particles are spherically structured and change in shape and size distribution [11]. The SEM morphology of fly ash is shown in Figure 6.

2.3. Sag Behavior

The sag-resistant influence of fly ash on the drilling fluid’s sag susceptibility was investigated both statically and dynamically. Figure 7a shows the static sag testing apparatus, which consists of an HPHT Single-Cell Filter Press, OFI Testing Equipment Inc., Houston, TX, USA. It was redesigned for this purpose by mounting an inclinometer to measure the trajectories. The Base Fluid (0 lb/bbl of fly ash), fluids 3, and 4 were evaluated by conducting a static sag test at various temperatures (250 °F, 300 °F, 350 °F, and 400 °F) and deviations (30°, 45°, 60°, 70°, 80°, and 90°). Various inclinations of the cell were used to represent deviated wells. The sample (140 cm3) was emptied into a stainless steel cup while on the metal stand and capped (Figure 7b). Afterward, it was transferred to the HPHT Single-Cell Filter Press. It was then pressurized with nitrogen gas at 500 psi to prevent fluid vaporization. The temperature switch was turned on. The inclinometer holds the ceramic cell in place at a desired trajectory. The trajectory can be adjusted by loosening and locking the black screw. The trajectory may be determined with the aid of a protractor placed between the inclinometer, as shown by the red lines. When the drilling fluid was left to age for 24 h at the desired deviations and temperatures, 10 cm3 of fluid was obtained from the cell’s top through the cannula into a transparent graduated syringe. For the top density, the mass was obtained using a digital weighing balance and divided by volume. The procedure was repeated, but this time, the material was drawn from the lower section of the cell. The results were then applied to the following equations:
ρ b o t t o m = M a s s   o f   f l u i d   d r a w n   f r o m   t h e   b o t t o m V o l u m e   o f   f l u i d   d r a w n   f r o m   t h e   b o t t o m
ρ t o p = M a s s   o f   f l u i d   o b t a i n e d   a t   t h e   t o p V o l u m e   o f   s a m p l e   o b t a i n e d   a t   t h e   t o p
Sag   Factor   ( SF ) = ρ b o t t o m ρ b o t t o m + ρ t o p
ρ b o t t o m = Density   of   mud   at   the   bottom   of   the   cup  
ρ t o p = Density   of   mud   at   the   top   of   the   cup  
The tendency of the weight material in the drilling fluid to precipitate out either by hindered or free settling is an indication of the sag factor (SF) of the fluid. Higher SF values imply a more pronounced tendency to sag. The acceptable range for the sag factor’s safe zone lies between 0.5 and 0.53 [12].
A dynamic sagging apparatus (Figure 7c) was employed to perform the VSST test. It consists of an 8-Speed Ofite Viscosimeter, OFI Testing Equipment Inc., Houston, TX, USA. a thermo-cup, a sag shoe, and a syringe. The sag shoe was placed inside the thermo-cup before filling it up with a 140 cm3 volume of sample. Following this, the sample was agitated by the viscosimeter at 100 rpm for 30 min while applying a temperature of 120 °F to the fluid. Afterward, a fluid volume of 10 cm3 was drawn into a transparent graduated syringe from the lowermost part of the sag shoe and weighed. The mass was obtained before and after agitation. The following equation was applied to obtain the VSST:
VSST = 0.833   ×   ( W a f t e r W b e f o r e ) W a f t e r = Mass   of   fluid   drawn   into   the   syringe   after   30   min   of   agitation   W b e f o r e = Mass   of   fluid   drawn   into   the   syringe   before   agitation  
A stable fluid is identified with a VSST of 1 ppg and below (uniform mixture), while an unstable fluid typically has a value of above 1.6 ppg (non-uniform mixture), which may be the beginning of sagging [7,13]. The envelope that lies between 1–1.6 ppg may be regarded as the transition boundary.

3. Results

3.1. Sag Test

Figure 8 depicts static results of barite sag propensity in the absence of fly ash at 250 °F, 300 °F, 350 °F, and 400 °F under various inclinations of 30°, 45°, 60°, 70°, 80°, and 90°. At 250 °F, which is the lowest temperature at which the static sag was examined, the lowest SF was obtained for all inclinations. A sharp increase in SF was observed to have started from 45° to 62°. This trend seems applicable to all other temperatures and inclinations. Noticeably, from 45° to 62°, at 250 °F, 300 °F, 350 °F, and 400 °F, a percentage increase of 2.9, 1.91, 1.71, and 1.51% respectively was noticed. This shows that the highest increase in SF of 2.9% occurred between 45° and 62° at 250 °F. However, this may be traceable to the severe impact of 17° (62°–45°) increase in hole inclination on the base fluid sample at 250 °F. Also, it was noticeable that the base fluid’s SF exceeded the safe boundary at 250 °F, 300 °F, 350 °F, and 400 °F, while exhibiting sagging tendencies from 58°, 55°, 52°, and 46° accordingly. This may be due to the inability of the base fluid to withstand thermal stability in these situations. Afterward, the sagging disappeared at 63°, 65°, 73°, and 78° for the respective test temperatures. Deductively, it may be said that the higher the static sag test temperature, the sooner the barite sag may occur, and vice versa. The highest SF exhibited by all the test temperatures was 62°, which for this study may be referred to as the notorious angle of inclinations. This may be due to the intense influence of hole deviation (62°) on the drilling fluid additives and temperatures. The principle of settling and the surface area of the hole may be applicable to explain barite sagging. A vertical wellbore has a smaller surface area as compared to an inclined wellbore; hence, the particles are closely packed in the wellbore column. Due to gravity differences, the particles tend to settle out of the column, but the effect of hindered settling prevents the free settling of particles. A falling particle may be hindered by a suspended particle, thereby mitigating the settling rate. Conversely, when the wellbore is more inclined, the surface area increases, and particles become sparsely populated. Hence, free settling is initiated, which may increase the settling rate. Consequently, there is a dominance of free settling in deviated wells [7]. In addition, the effect of free settling may be most acute at 62°, due to the high SF experienced at this inclination.
Figure 9 displays the positive impact of 3 lb/bbl of fly ash on Fluid 3. The trend is similar to the trend of the base fluid (without fly ash), apart from a sudden hike in SF from 45° to 63° inclinations. As compared with the base fluid, a smooth trend of percentage increase in SF of 0.20, 0.77, 0.38, and 0.38% occurred between 45° to 63° inclinations at 250 °F, 300 °F, 350 °F, and 400 °F, respectively. The influence of the notorious angle (63° inclination) on Fluid 3 did not cause a devastating increase in SF, which may be due to the presence of fly ash as opposed to the base fluid without fly ash.
Comparatively, Figure 10 and Figure 11 graphically describe the positive impacts of fly ash concentrations on the weighting agents (barite and ilmenite). Generally, Fluid 4, which is a barite-densified fluid, yielded less SF than Fluid 5, which is an ilmenite-densified fluid. For instance, at 0° and 400 °F, Fluid 4 yielded less SF of 0.5107 than Fluid 5 with SF of 0.5130. With 0 lb/bbl of fly ash, the barite-densified fluid exhibited a lower percentage SF of 1.4% (0.545–0.537) than the ilmenite-densified fluid. This difference may be traceable to the impact of the specific gravity of the weighting agents. Ilmenite has a higher specific gravity of about 4.7 g/cm3 than barite, which is approximately 4.20 g/cm3. Despite having the same particle size (D50), ilmenite and barite are 22 µm and 6.5 µm, respectively. Therefore, ilmenite may sag faster than barite in the fluid column, resulting in a higher SF. It can be inferred that the addition of 4 lb/bbl of fly ash further lowered the static sag SF of the weighting agents at various inclinations and temperatures investigated. However, fly ash was discovered to be more effective as an anti-sagging additive in barite-densified fluid than in ilmenite-densified fluid. This is more evident in Figure 12, as barite-densified fluid yielded a lower SF than ilmenite-densified fluid for the same quantity of fly ash utilized. A percentage sag reduction of 3.4% and 2.4% was exhibited by 4 lb/bbl fly ash in barite-densified fluid (Fluid 4) and ilmenite-densified fluid (Fluid 5), respectively.
However, there are clear differences between the anti-sagging properties of the ilmenite-densified fluid and barite-densified fluid. This may be caused by factors like specific gravity, particle size distribution, and chemical composition. Ilmenite has a higher specific gravity than barite, which may result in higher sagging tendencies against barite with a lower specific gravity. The D50 particle size of ilmenite was 22 µm, while barite was 6.5 µm, reducing the anti-sagging efficiency of the ilmenite-densified fluid. The chemical composition of ilmenite and barite, as analyzed by XRF, may also be a contributory factor.
Theoretically, the sagging mitigating ability exhibited by fly ash may be traceable to its properties. The fly ash surface area varies from 170 to 1000 m2/kg and has a specific gravity of about 2.1–3.0. Due to its surface area, solubility, and specific gravity, a quantity of fly ash may have a reasonable impact on its surroundings and form a kind of suspending agent in water, which could retard the settling of barite. This tendency may be supported by the activity of a natural suspending agent like xanthan gum and copolymer included in the fluid’s formulation. Thereby exhibiting an acceptable performance as an anti-sagging additive. In field applications, despite obtaining acceptable values of SF at notorious angles, usually close to 60°, it is suggested that drillers should avoid drilling at these slopes.
As shown in Figure 13, it can be inferred that the dynamic sagging results of Fluid 3 (based fluid plus 3 lb/bbl of fly ash) exhibited an anti-sagging effect on the fluid column. However, the reverse was the case for Fluid 0 without fly ash, as it provided a sagging performance and was above the safe boundary. When both fluids were compared, Fluid 3 had a percentage decrease of 69, 70, 70, and 63% in VSST observed at 250 °F, 300 °F, 350 °F, and 400 °F, respectively. The highest values of VSST, 1.72 and 0.63 ppg, were experienced at 400 °F by both fluids 0 and 3, respectively. This may be an indication of the role of the temperature increase in the dynamic sagging tendencies. However, 1.72 ppg was above the safe boundary. Theoretically, the effect of temperature on fluid samples, which increases viscosity, may result in increased sagging tendencies. When the temperature increases, molecules move apart, hindered settling is reduced, and free settling is initiated, which may result in a reduction in the suspending ability of the fluid. However, this was more prominent in Fluid 0 than in Fluid 3 due to the absence of fly ash in Fluid 0.
Figure 14 presents the effect of different ratios of fly ash on the dynamic sagging propensity of barite and ilmenite at 400 °F. At 0 lb/bbl of fly ash, a percentage sag reduction of 3.9% was observed for barite. The addition of 4 lb/bbl of fly ash reduced the dynamic sagging of barite and ilmenite by 63.9% and 63.1%, respectively. It can be deduced that the influence of 4 lb/bbl fly ash was slightly more effective in the barite-densified fluid, with a difference of 0.8%, than in the ilmenite-densified fluid. Even though the dynamic sag test simulates sagging tendencies while the drill string is rotating, the influence of the weight material density on the annular velocity may be significant as solids tend to settle out. The chances of ilmenite particles settling faster may be an indication of their high density, which may result in a higher VSST than barite particles of the same size. Due to this, it may be logical to mitigate dynamic sagging at a reasonably high annular velocity that is at least sufficient to overcome the opposing force of the solid particles and keep them in motion while the fluid is being circulated in the wellbore. This is necessary to prevent well control challenges, which are usually the outcome of sagging.
Based on almost the same mud formulation as Ahmed et al. [6]. Figure 15 compares the efficiency of fly ash as an anti-sagging additive with that of vermiculite [6]. A 4 lb/bbl of fly ash was found to be more effective in mitigating barite sag than ilmenite sag, as an SF of 0.5021 and 0.504 were obtained, respectively, at 0° wellbore inclinations. A percentage decrease of 1.176% SF was observed for ilmenite using fly ash as an anti-sagging additive over vermiculite with barite as a weighting agent. In like manner, a percentage decrease of 1.5490% was recorded for fly ash (barite) over vermiculite (barite). A similar trend was also observed at 45° wellbore inclination. However, a marginal difference of 0.003 SF was exhibited by the fly ash-based mud samples (barite and ilmenite). From the results presented in Figure 15 and Table 2, fly ash may be a more efficient anti-sagging additive than vermiculite. This may be due to the chemical reaction between these additives and the base fluids. Economically, fly ash may be cheaper than vermiculite because it is an industrial waste, while vermiculite occurs naturally as a clay mineral that can be mined or purchased at a cost.

3.2. Optimization

The optimization and validation of the experimental results were conducted through the utilization of regression equations derived from the response values, as outlined by Ren et al. [14]. In this study, the focus was on investigating the influence of fly ash concentration and temperature of the base mud on the sag factor (SF) at various angles of inclination using a response surface design. The response surface methodology (RSM), facilitated by Minitab 18 software, was employed for this purpose, involving the design of experiments (DOE) and regression analysis. The experimental design encompassed the selection of appropriate ranges for fly ash concentrations and temperature values, as indicated in Table 3. Subsequently, the response surface design, illustrated in Table 4, was generated based on the experimental data obtained using barite as the weighting agent, chosen for its stability in the sag factor compared to ilmenite. The optimization process sought to determine the optimal levels of fly ash concentration and temperature that would minimize sag factors across various wellbore inclinations (0°, 30°, 45°, 60°, 70°, 80°, and 90°). The reliability of the response surface tool was assessed through Analysis of Variance (ANOVA), as depicted in Table 5, revealing the significant effects of fly ash concentration, temperature, and their interaction on SF for fluids 3 and 4 (Barite densified). A significance level of p-value <0.05 was established as the threshold. Furthermore, Table 6 summarizes the model’s reliability, with coefficients of determination (R2, R2(adj), and R2(pred)) indicating the acceptability of the response surface models. Notably, higher R2 values denote a better fit of the model to the observed data, with values approaching unity indicating a high degree of accuracy in prediction.
The optimization and validation process underscored the efficacy of the response surface methodology in identifying optimal conditions for minimizing the sag factor in barite-densified fluids, thereby enhancing the understanding and management of sagging phenomena in highly deviated geothermal drilling operations.
Below is a list of the linear regression (quadratic) equations in uncoded units that were derived for each wellbore inclination from the response surface tool:
0° = 0.4806 − 2.1 × 10⁻⁴C + 1.43 × 10⁻⁴T – 9 × 10⁻⁴CT
30° = 0.49118 + 1.04 × 10⁻³C + 1.01 × 10⁻⁴T – 7 × 10⁻⁶CT
45° = 0.49474 + 5.9 × 10⁻⁴ C + 1.01 × 10⁻⁴ T – 4 × 10⁻⁶ CT
60° = 0.49748 − 8.3 × 10⁻⁴ C + 1.16 × 10⁻⁴ T – 1 × 10⁻⁶ CT
70° = 0.4970 − 5.0 × 10⁻⁴ C + 1.05 × 10⁻⁴ T – 2 × 10⁻⁶ CT
80° = 0.5028 − 3.95 × 10⁻³ C + 9.3 × 10⁻⁵ T + 7 × 10⁻⁶ CT
90° = 0.5248 − 1.018 × 10⁻² C + 3 × 10⁻⁵ T + 1.7 × 10⁻⁵ CT
where C is the concentration of the fly ash in lb/bbl, and T is the temperature in °F.
As observed from quadratic Equations (5)–(11), it is evident that there is an empirical relationship between the concentration of fly ash (C) and temperature (T) that influences the SF differently at the wellbore inclinations investigated. Each of the quadratic equations above (5)–(11) was used to develop the contour and response surface plots below. The contour plots in Figure 16 depict the empirical relationship between the temperature (°F) and concentration of fly ash (lb/bbl) at different SF for the individual wellbore inclinations. With this, the optimal variables within the experimental limits can be easily identified. From physical observations, it can be inferred that there is a high interaction between temperature and fly ash concentrations as the slope of the SF was high for 0°, 80°, and 90° wellbore inclinations, while less interaction was noticed for 30°and 45°. The average slope of SF may be said to be 60° and 70°. This response may be due to the chemical reactions among the fly ash ratio, temperature, and wellbore inclination on the components of the BF. The 0° inclination (I-0) contour plot showed that a high sag factor (SF) of (˃0.514 ppg) was achieved by blending 3.0–3.1(lb/bbl) of fly ash with Base Fluid (BF) at 390–400 °F, while a low SF (˂0.502 ppg) was obtained from a blend of 3.9–4.0 lb/bbl of fly ash with BF at 250–255 °F. The contour plot is observed to bend outward (Convex shape). The highest SF usually occurs around 60 deg inclination (I-60), and at the highest temperature of exposure [7]. Consequently, an extremely high SF of (˃0.524 ppg) was yielded by a combination of 3.0–4.0 lb/bbl of fly ash with BF at 360–400 °F. However, the concentration of fly ash was observed to decrease from 3.0 to 4.0 lb/bbl with increasing temperature. This further confirms that the sagging of the BF is temperature-dependent. A low SF of (˂0.518 ppg) was achieved by formulating 3.0 to 4.0 lb/bbl of fly ash with BF at 250–275F. At 90° inclinations (I-90), the contour plot seems to have a high slope and is highly responsive to the variables (temperature and fly ash concentration). A high SF of (˃0.522 ppg) was yielded by formulating 3.00–3.05 lb/bbl of fly ash with BF at about 400 °F, while a low SF of (˂0.510 ppg) was observed for 3.5–4.0 lb/bbl of fly ash blended with BF at 250–285 °F. The shape of the contour plot is the reverse of the 0° well inclination as it bends inward (Concave shape).
The response surface plot is another tool of optimization, which is a 3D pictorial representation of the regression equations or contour plots. It does not only optimize and predict response values but also the interpretation of the interaction of two variables to achieve interaction settings. The degree to which the variables influenced the response value was positively associated with the surface curvature. From these curves, predictions of the SF can be made in any region of the experimental investigation and the optimum combination of variables [15]. A sharper curvature and steeper surface are an indication of a strong effect of the variable on the response value [16]. Figure 17 indicates the variation in the SF as a function of the concentration of fly ash (lb/bbl) and temperature (°F). It shows an increase in SF with increasing concentration of fly ash and decreasing temperature. The positive influence of fly ash as an anti-sagging additive in WBF was also observed by [7]. Furthermore, this indicates that the fly ash ratio increases the potency of the forces acting at the surface and the hydrogen bonds in the WBF components. The RSM (contour and response surface plot) further confirms that increasing the concentration of fly ash with a decrease in temperature is expected to increase the anti-sagging efficiency of fly ash. The addition of 3 to 4 lb/bbl of fly ash at 250 °F to 325 °F may be a reliable limit for good anti-sagging behavior and vice versa.
The optimized response surface plot of the SF is shown in Figure 18, created by utilizing the Response Optimizer tool of Minitab Software 18. Since the acceptable value of the SF is 0.535 ppg, the target tool of the optimizer was set to this value for all the well inclinations. Consequently, the optimized values of SF (y) were evaluated for the angles investigated. The highest value of 0.5257–0.5256 ppg was achieved for (y) at 60°–70° inclinations, which further validates the consistency of the experimental results with the predicted models. It can also be inferred from the data that the optimum combination of variables is achievable by redefining the limits within the experimental investigation.

3.3. Validation of Experiments

As earlier stated, the reliability of the models was indicated by the high percentage values of R-square. In Table 7, wellbores are often designed and drilled at the trajectories identified for validation. However, wellbores drilled at 70° and 80° are uncommon. The model and experimental results ranging from low to high were selected as these signified the limits of the SF expected. The percentage error was estimated to determine the reliability of the models. Since the percentage error may indicate a deviation of the model’s result from the experimental result. The results of the percentage error are very low, which indicates the high reliability of the models. In addition, the percentage errors are within the acceptable standard. Therefore, the models are very accurate and can be applied in oil and gas industrial applications to predict SFs.

4. Conclusions

The potency of the anti-sagging properties of fly ash was investigated using ilmenite and barite as weighting agents, and the results were compared. However, the experimental results obtained for barite and fly ash concentrations at different temperatures were developed into empirical models using RSM at different wellbore inclinations. The results of the regression equation depicted a high confidence level, as the R2 tended to unity. The empirical equations were presented in pictorial form using contour and response surface plots. To determine the reliability of the models in predicting the SF of the drilling fluid system as applicable to the oil and well industry, their accuracy was validated by calculating the percentage error to be less than 3% when compared with the experimental results. The following findings were obtained in this research:
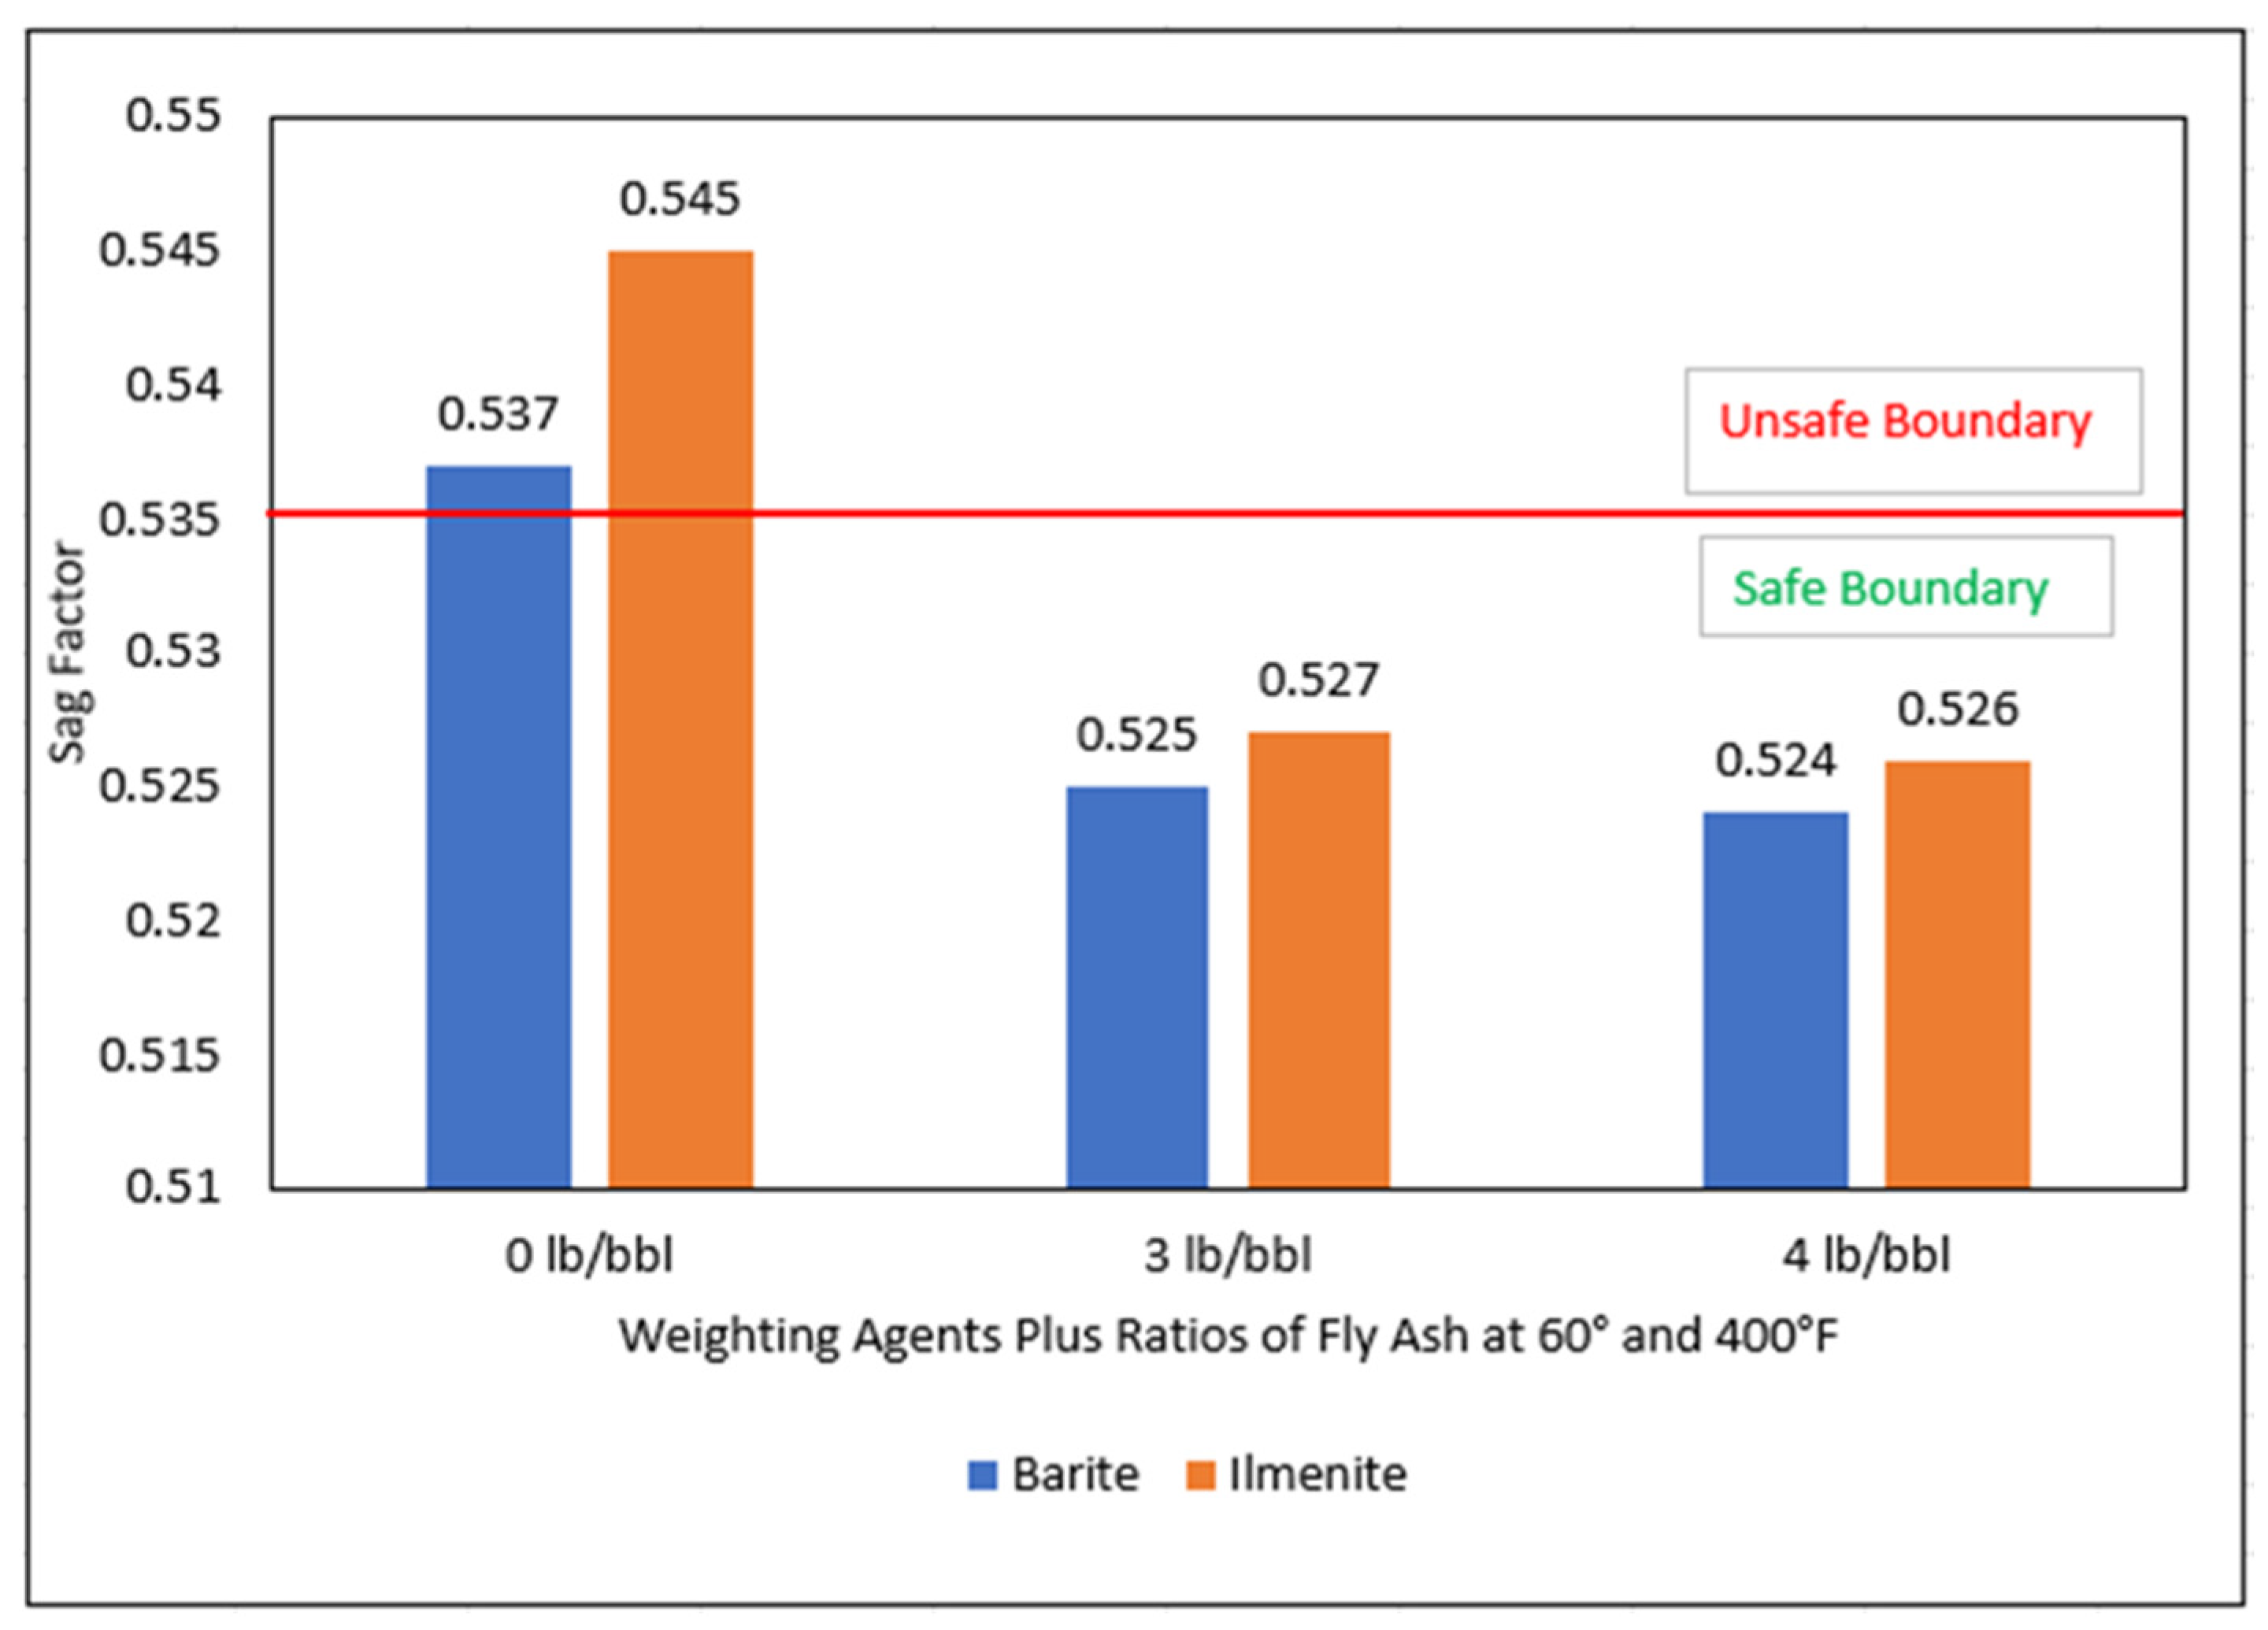
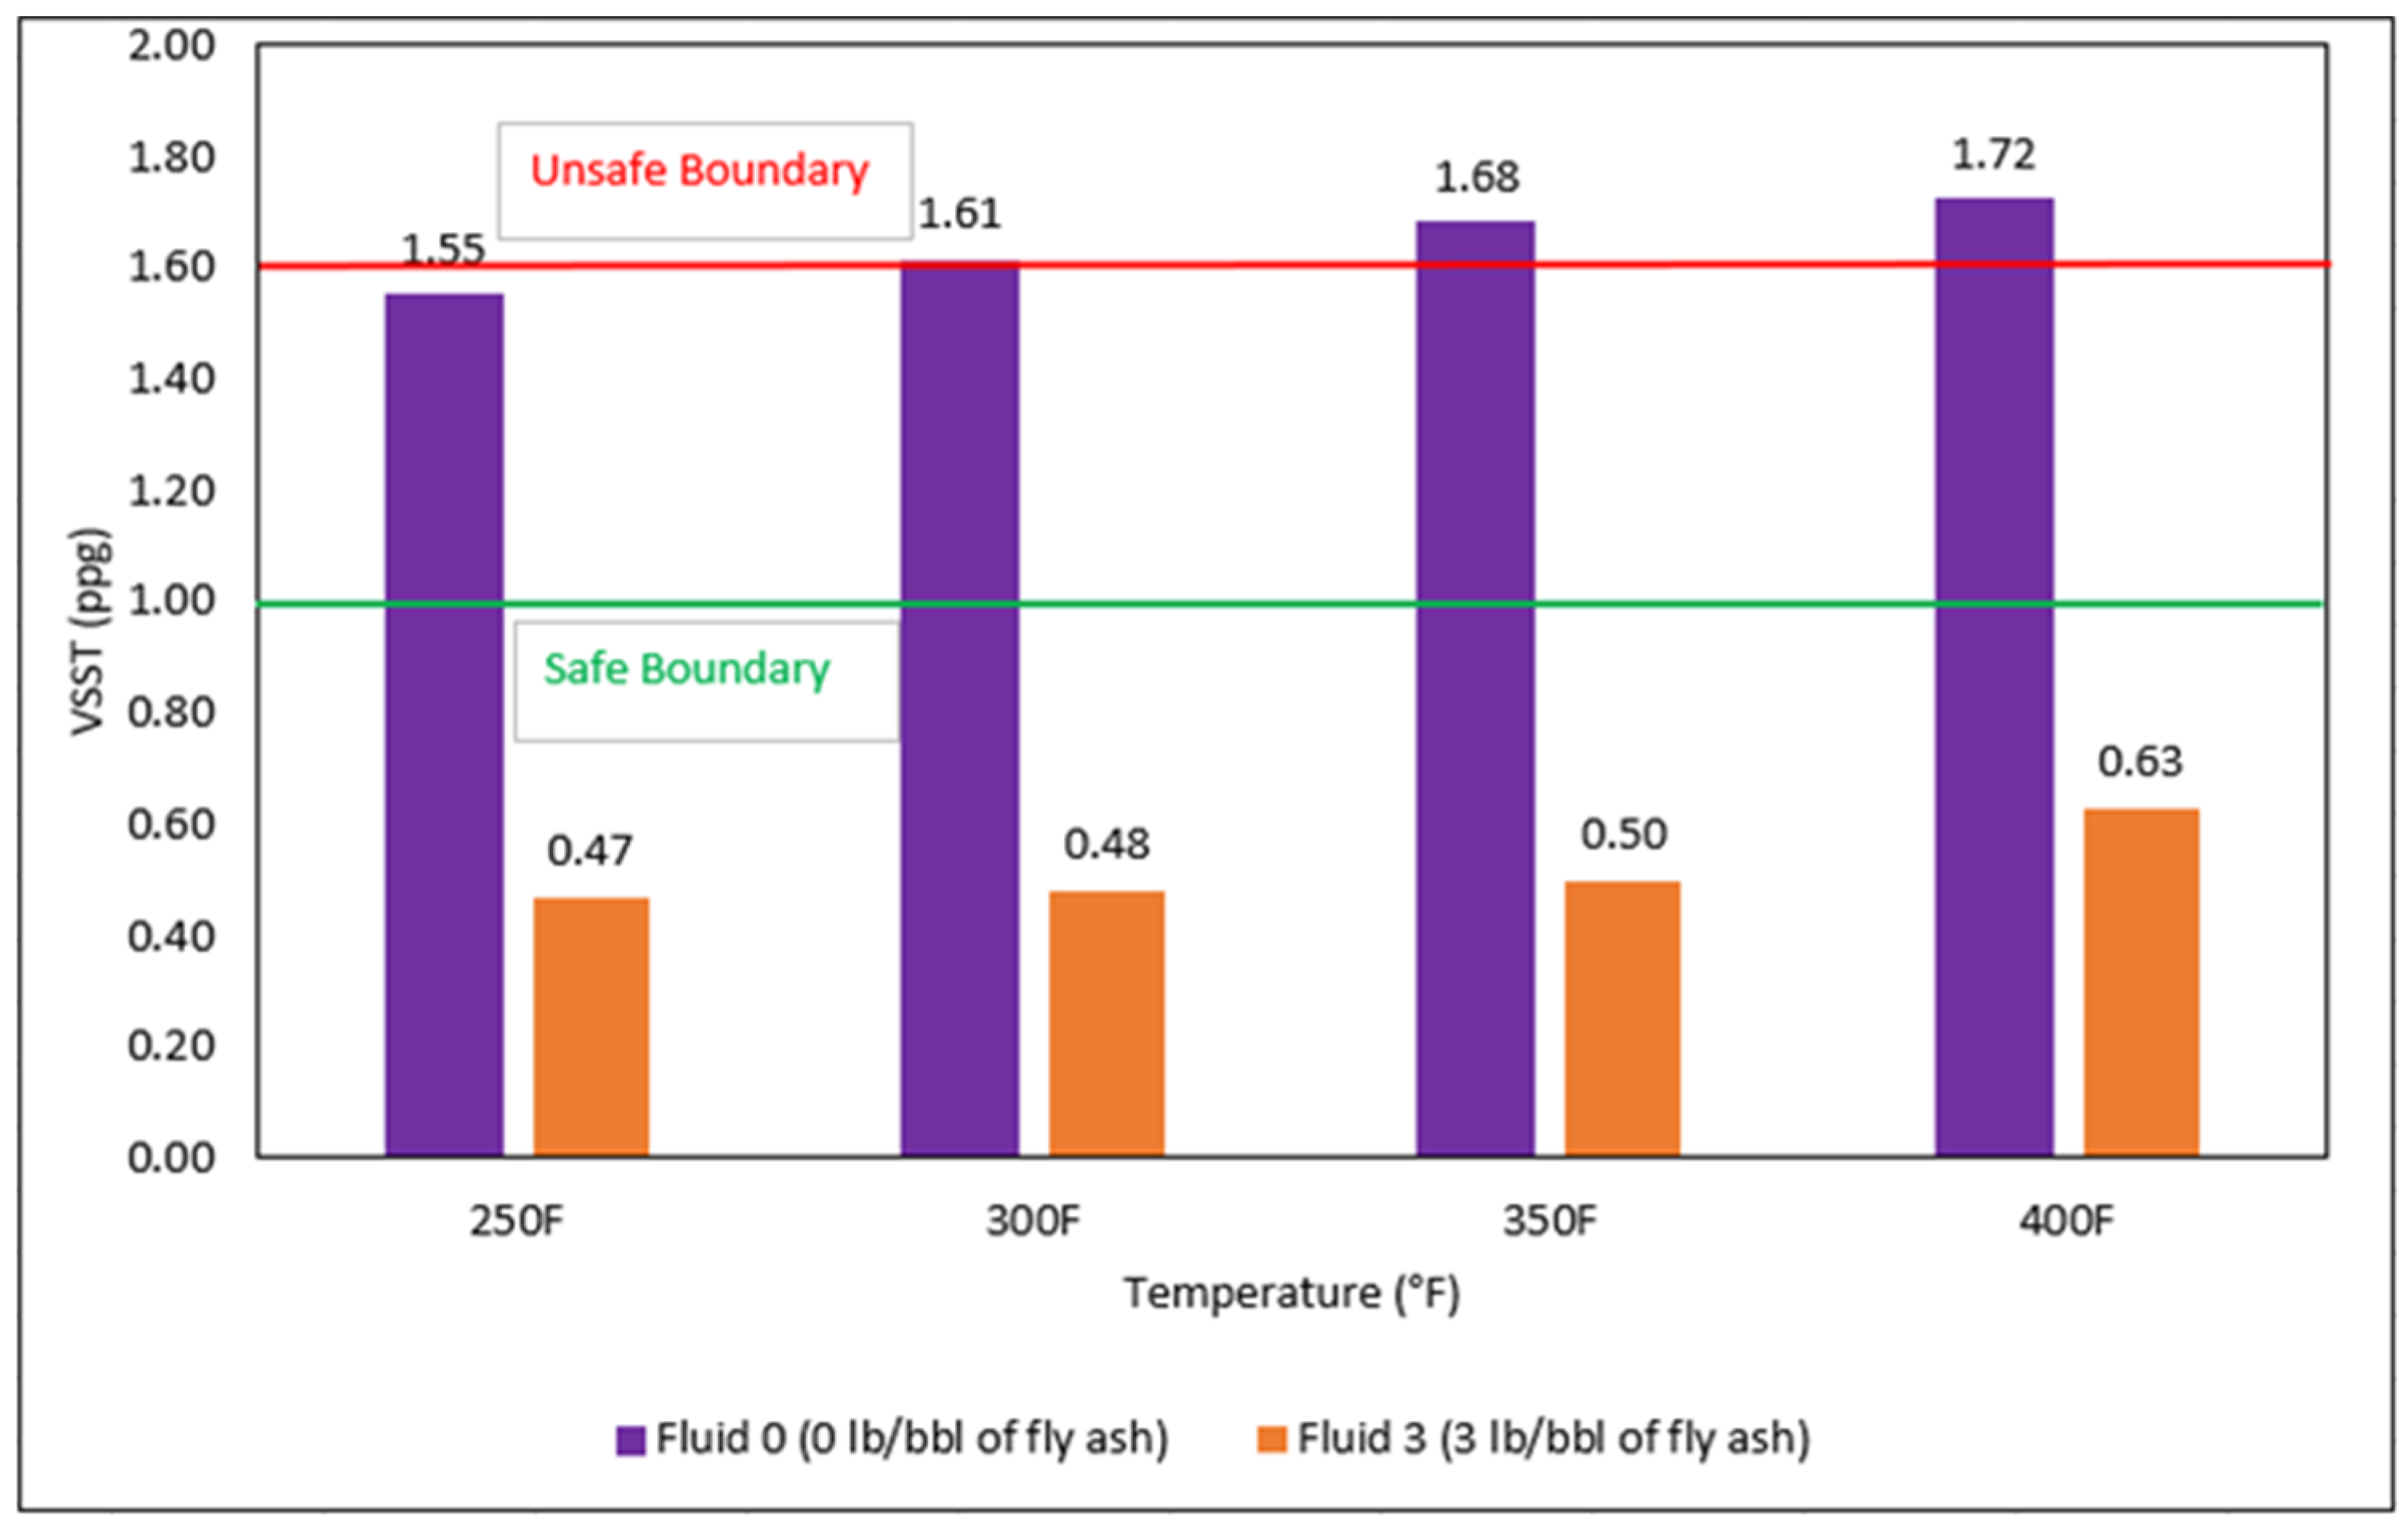
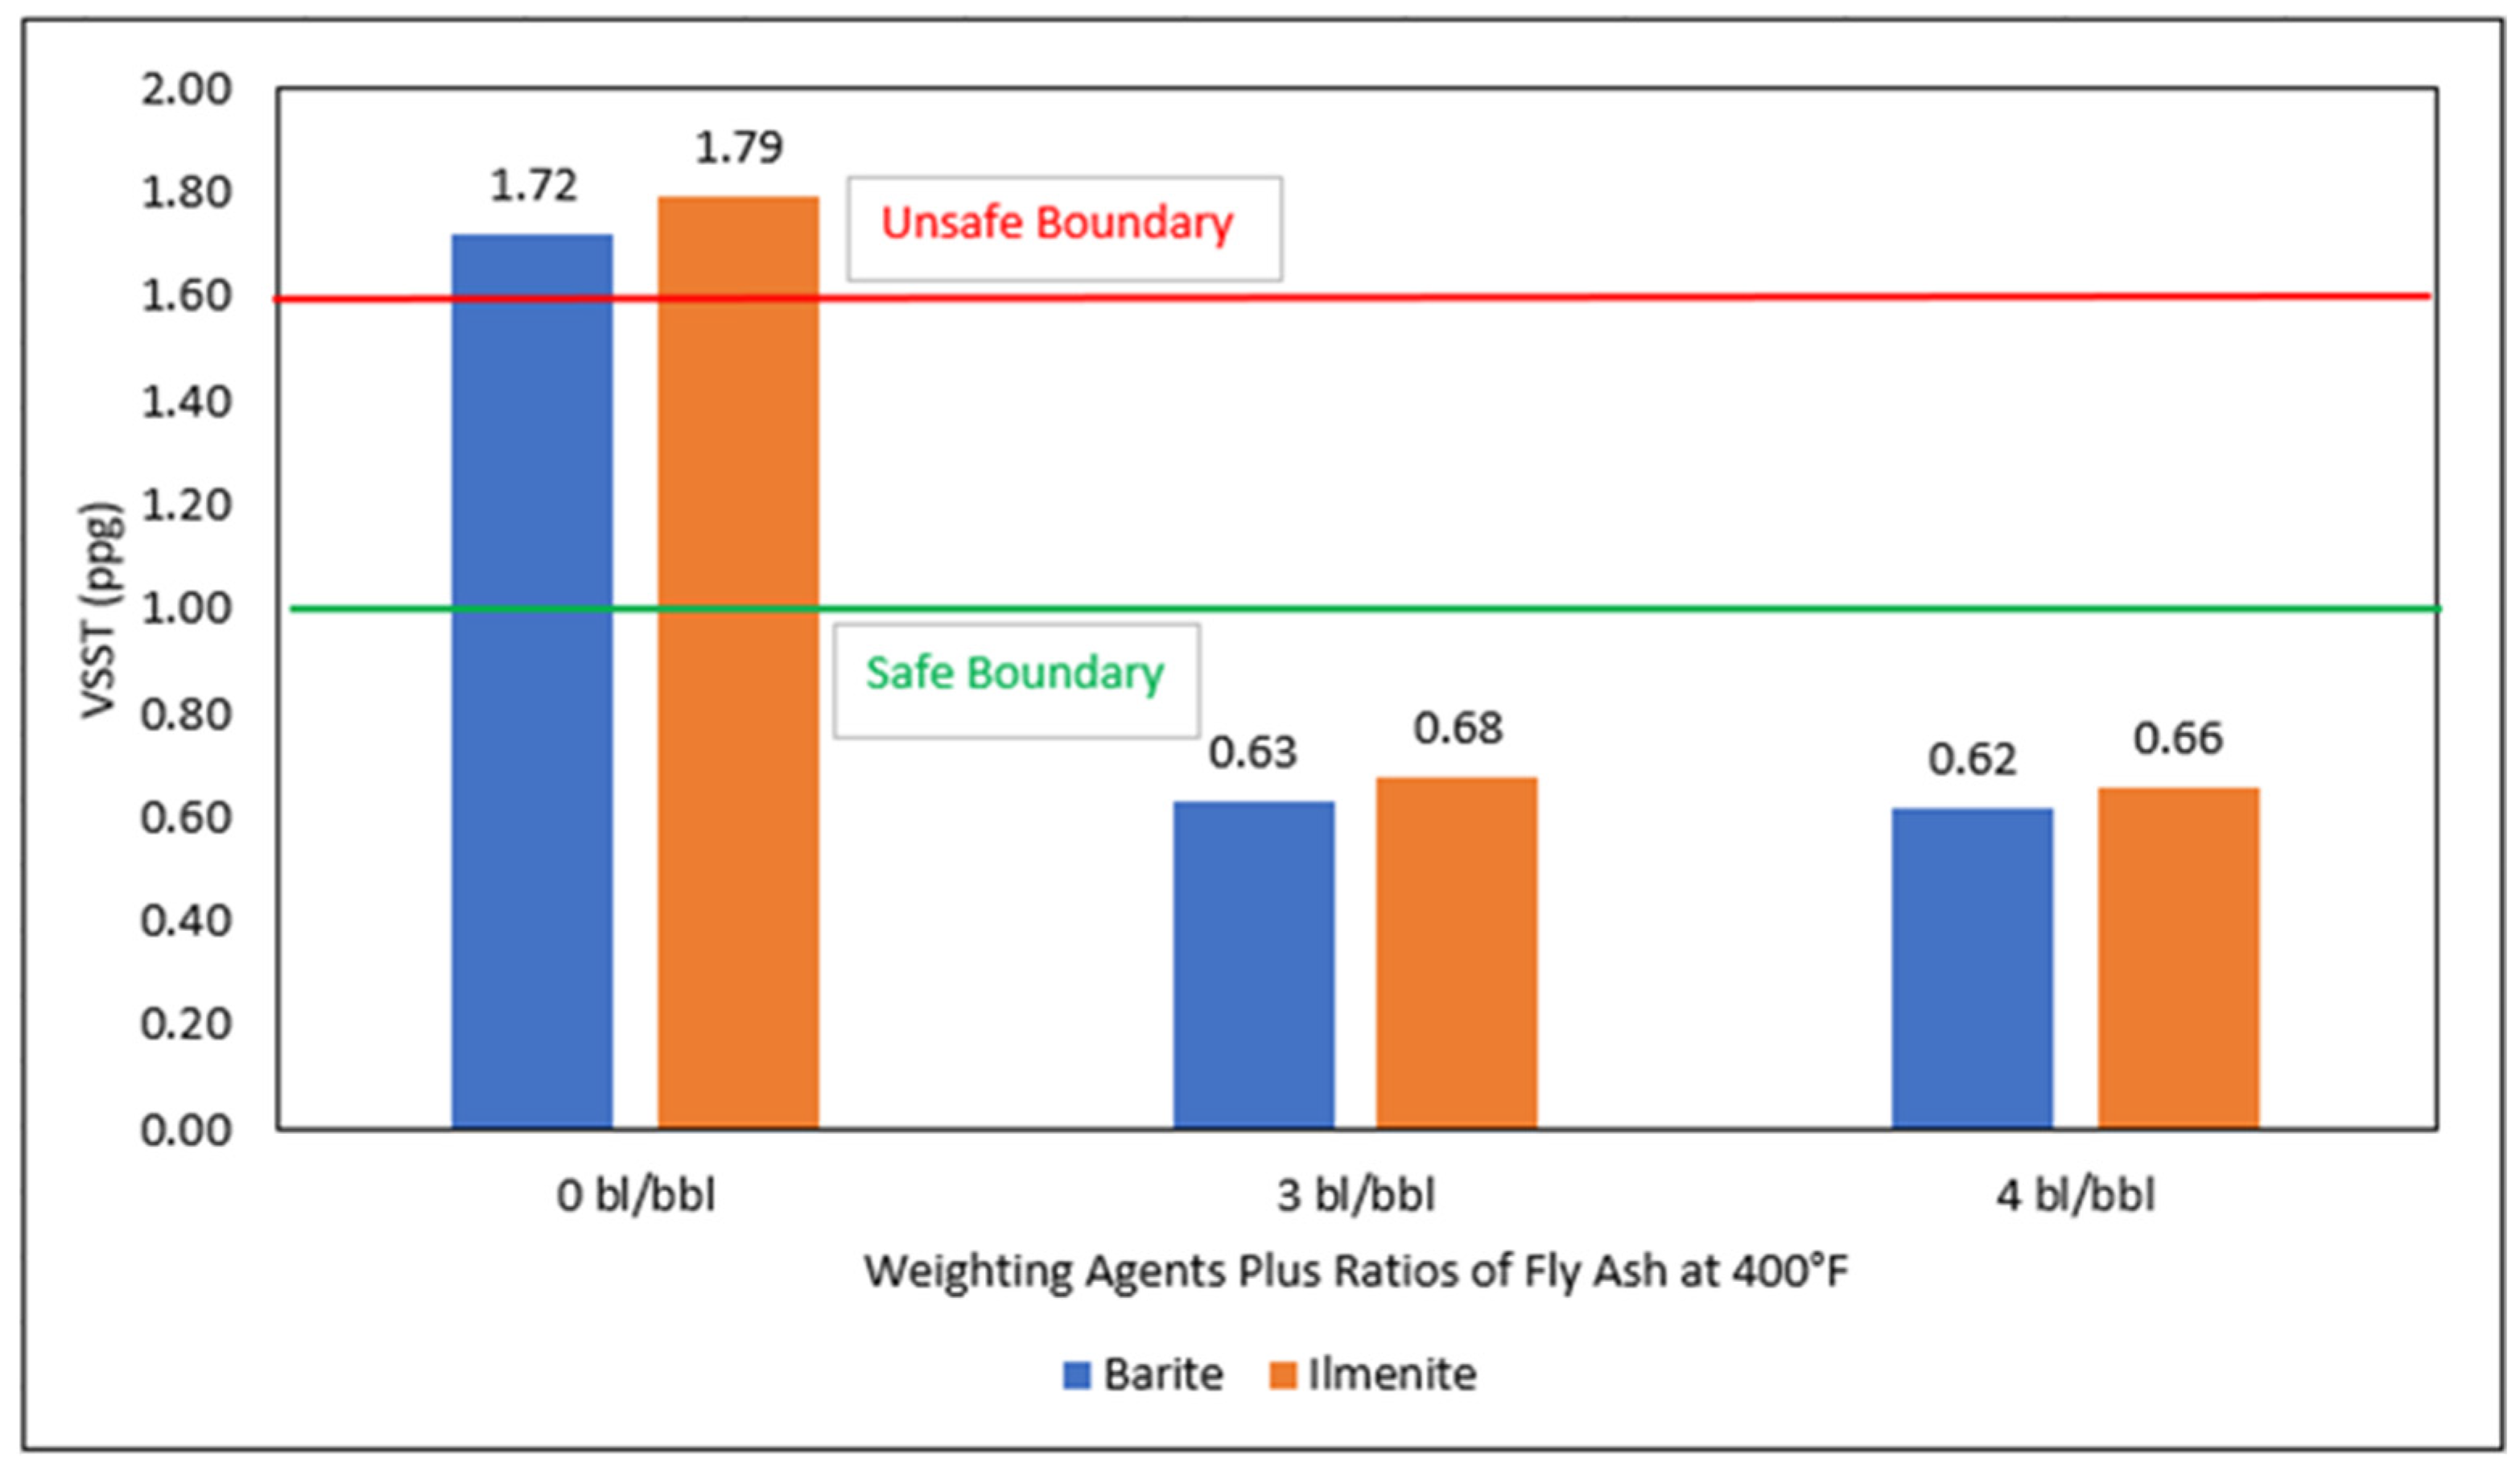
  • The fluid sample formulated without fly ash was discovered to exhibit a higher SF and VSST above the acceptable API recommended value of 0.530 and 1 ppg, respectively. The addition of 4 lb/bbl of fly ash in the barite-densified fluid was effective in reducing the SF and VSST by 3.4% and 63.9%, respectively. However, it was slightly less effective in the ilmenite-densified drilling fluid by reducing the SF and VSST by 2.4% and 63.1%, respectively, which was earlier reported in [3].
  • The static and dynamic anti-sagging properties of fly ash were more potent in barite-densified drilling fluid than in ilmenite-densified drilling fluid for all temperatures, angles of inclination, and concentrations (3 and 4 lb/bbl) of fly ash investigated.
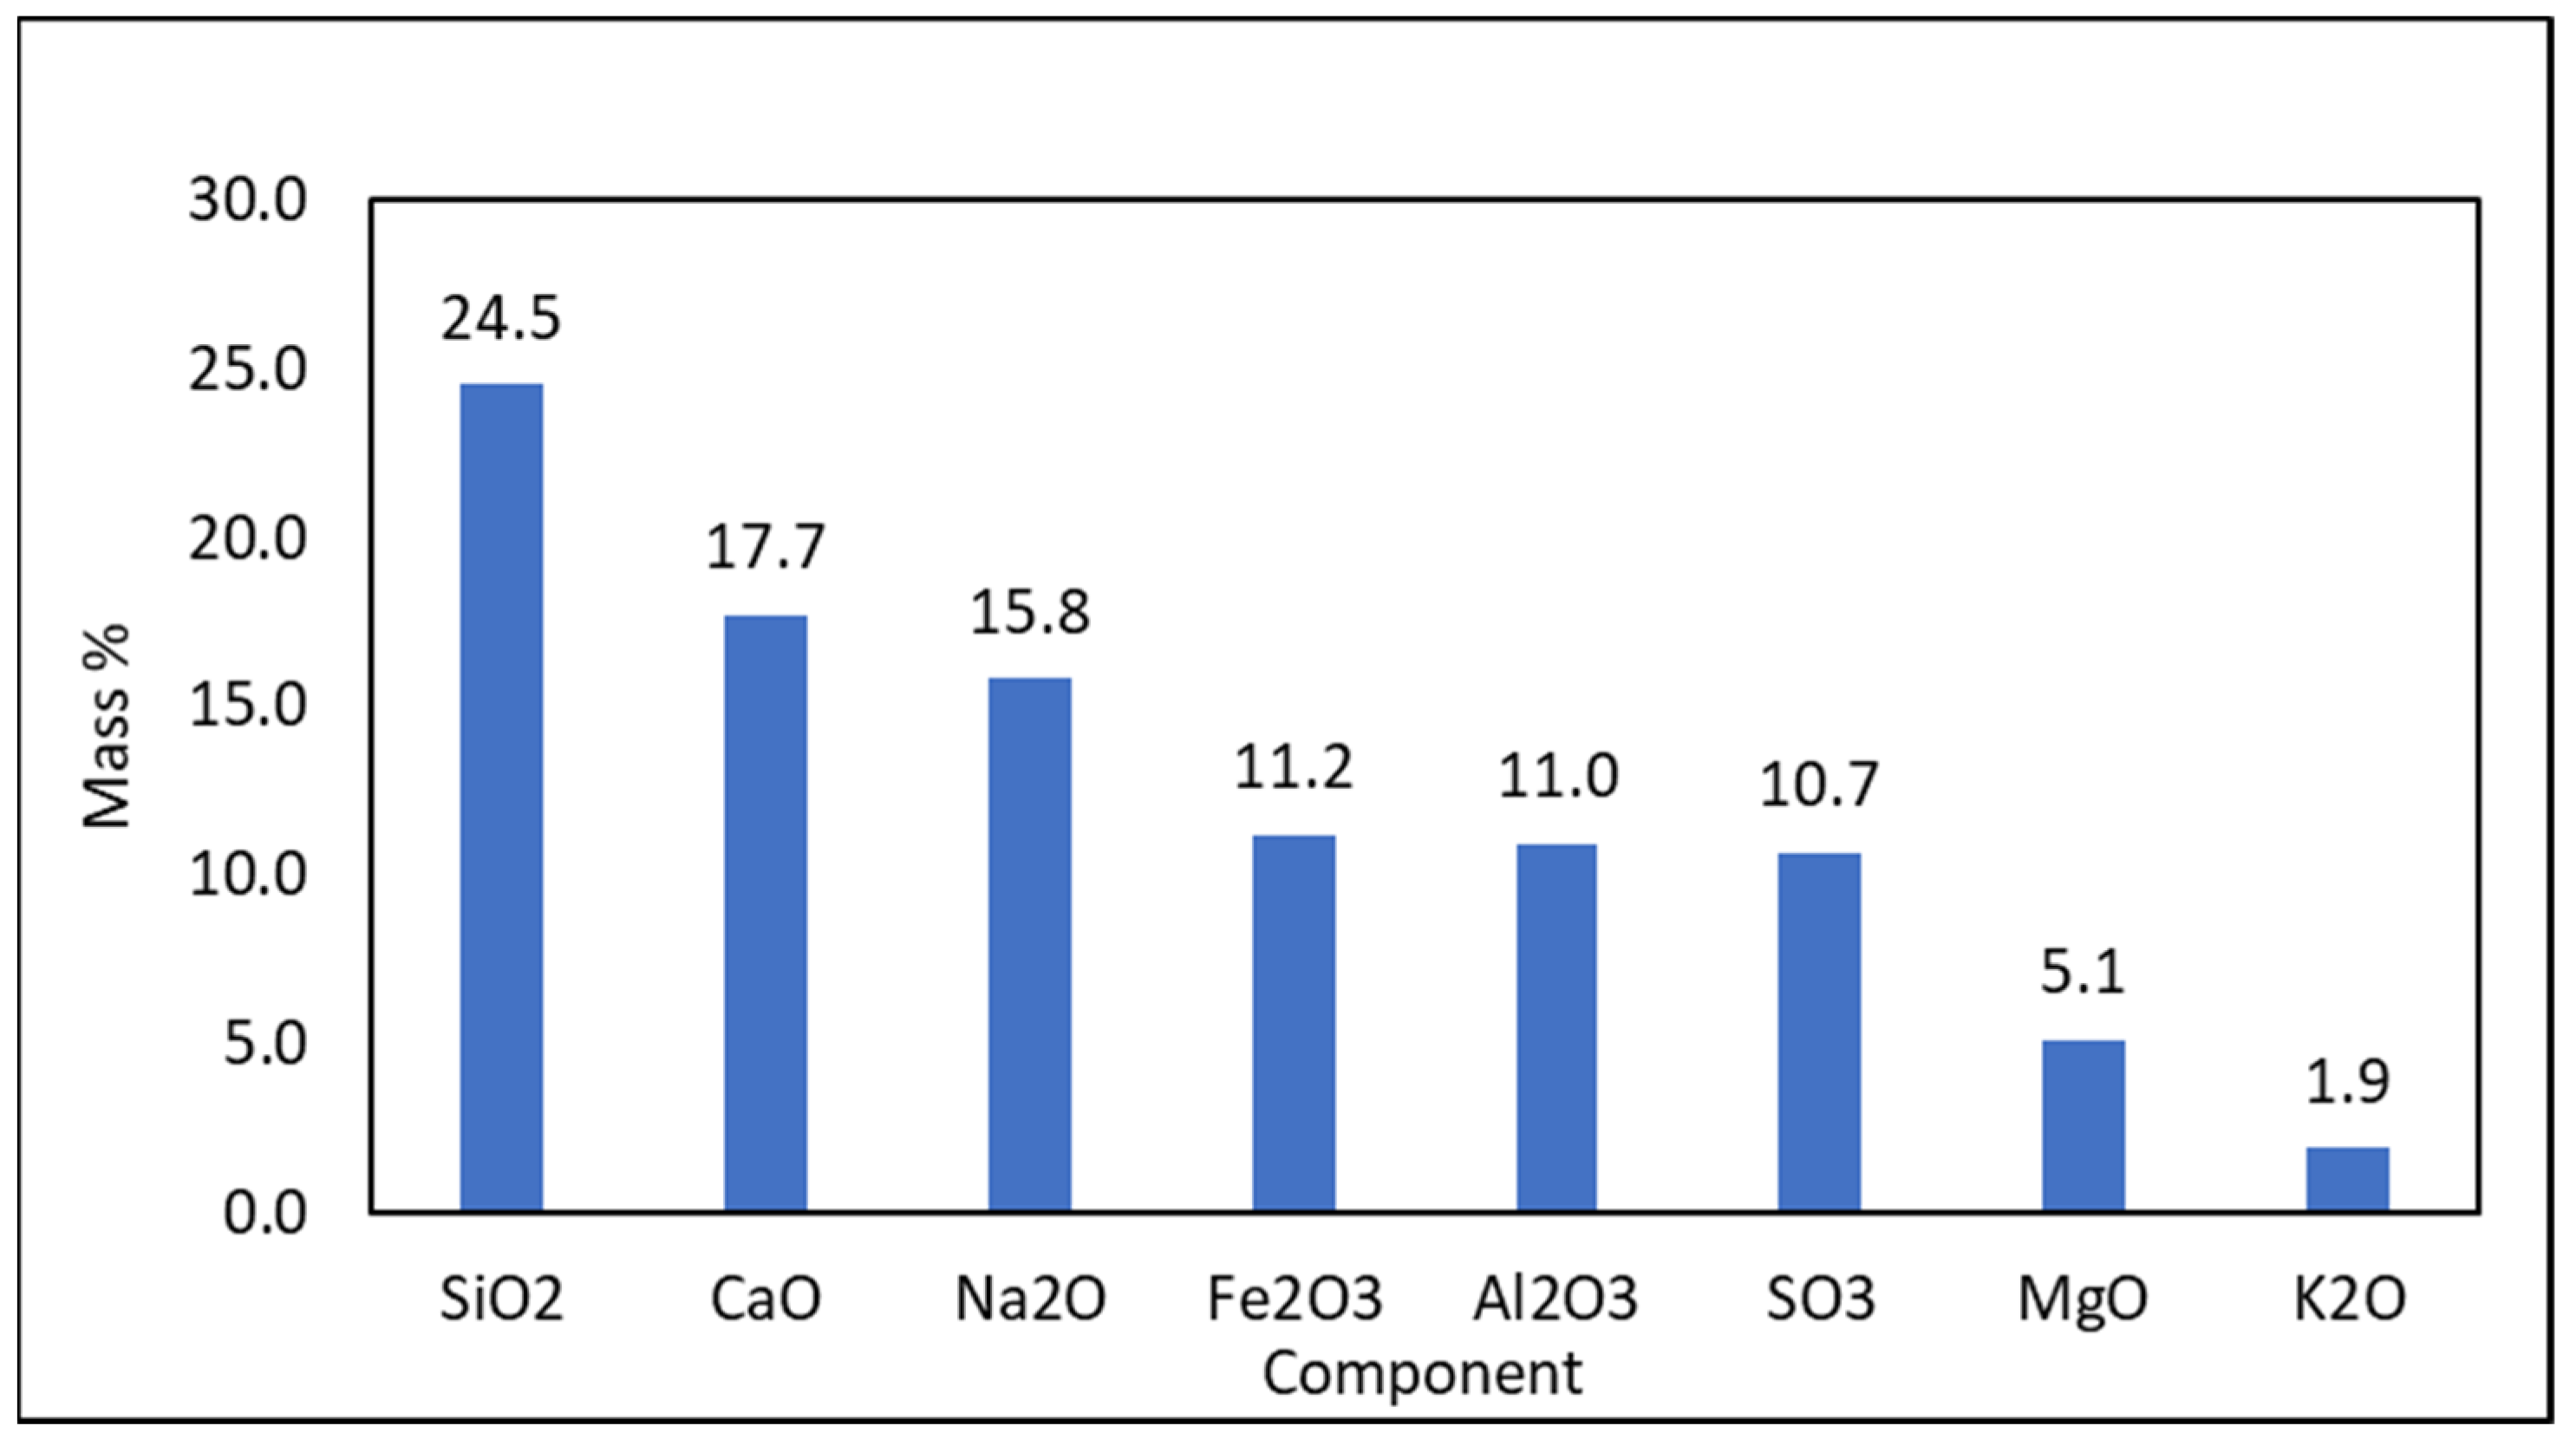
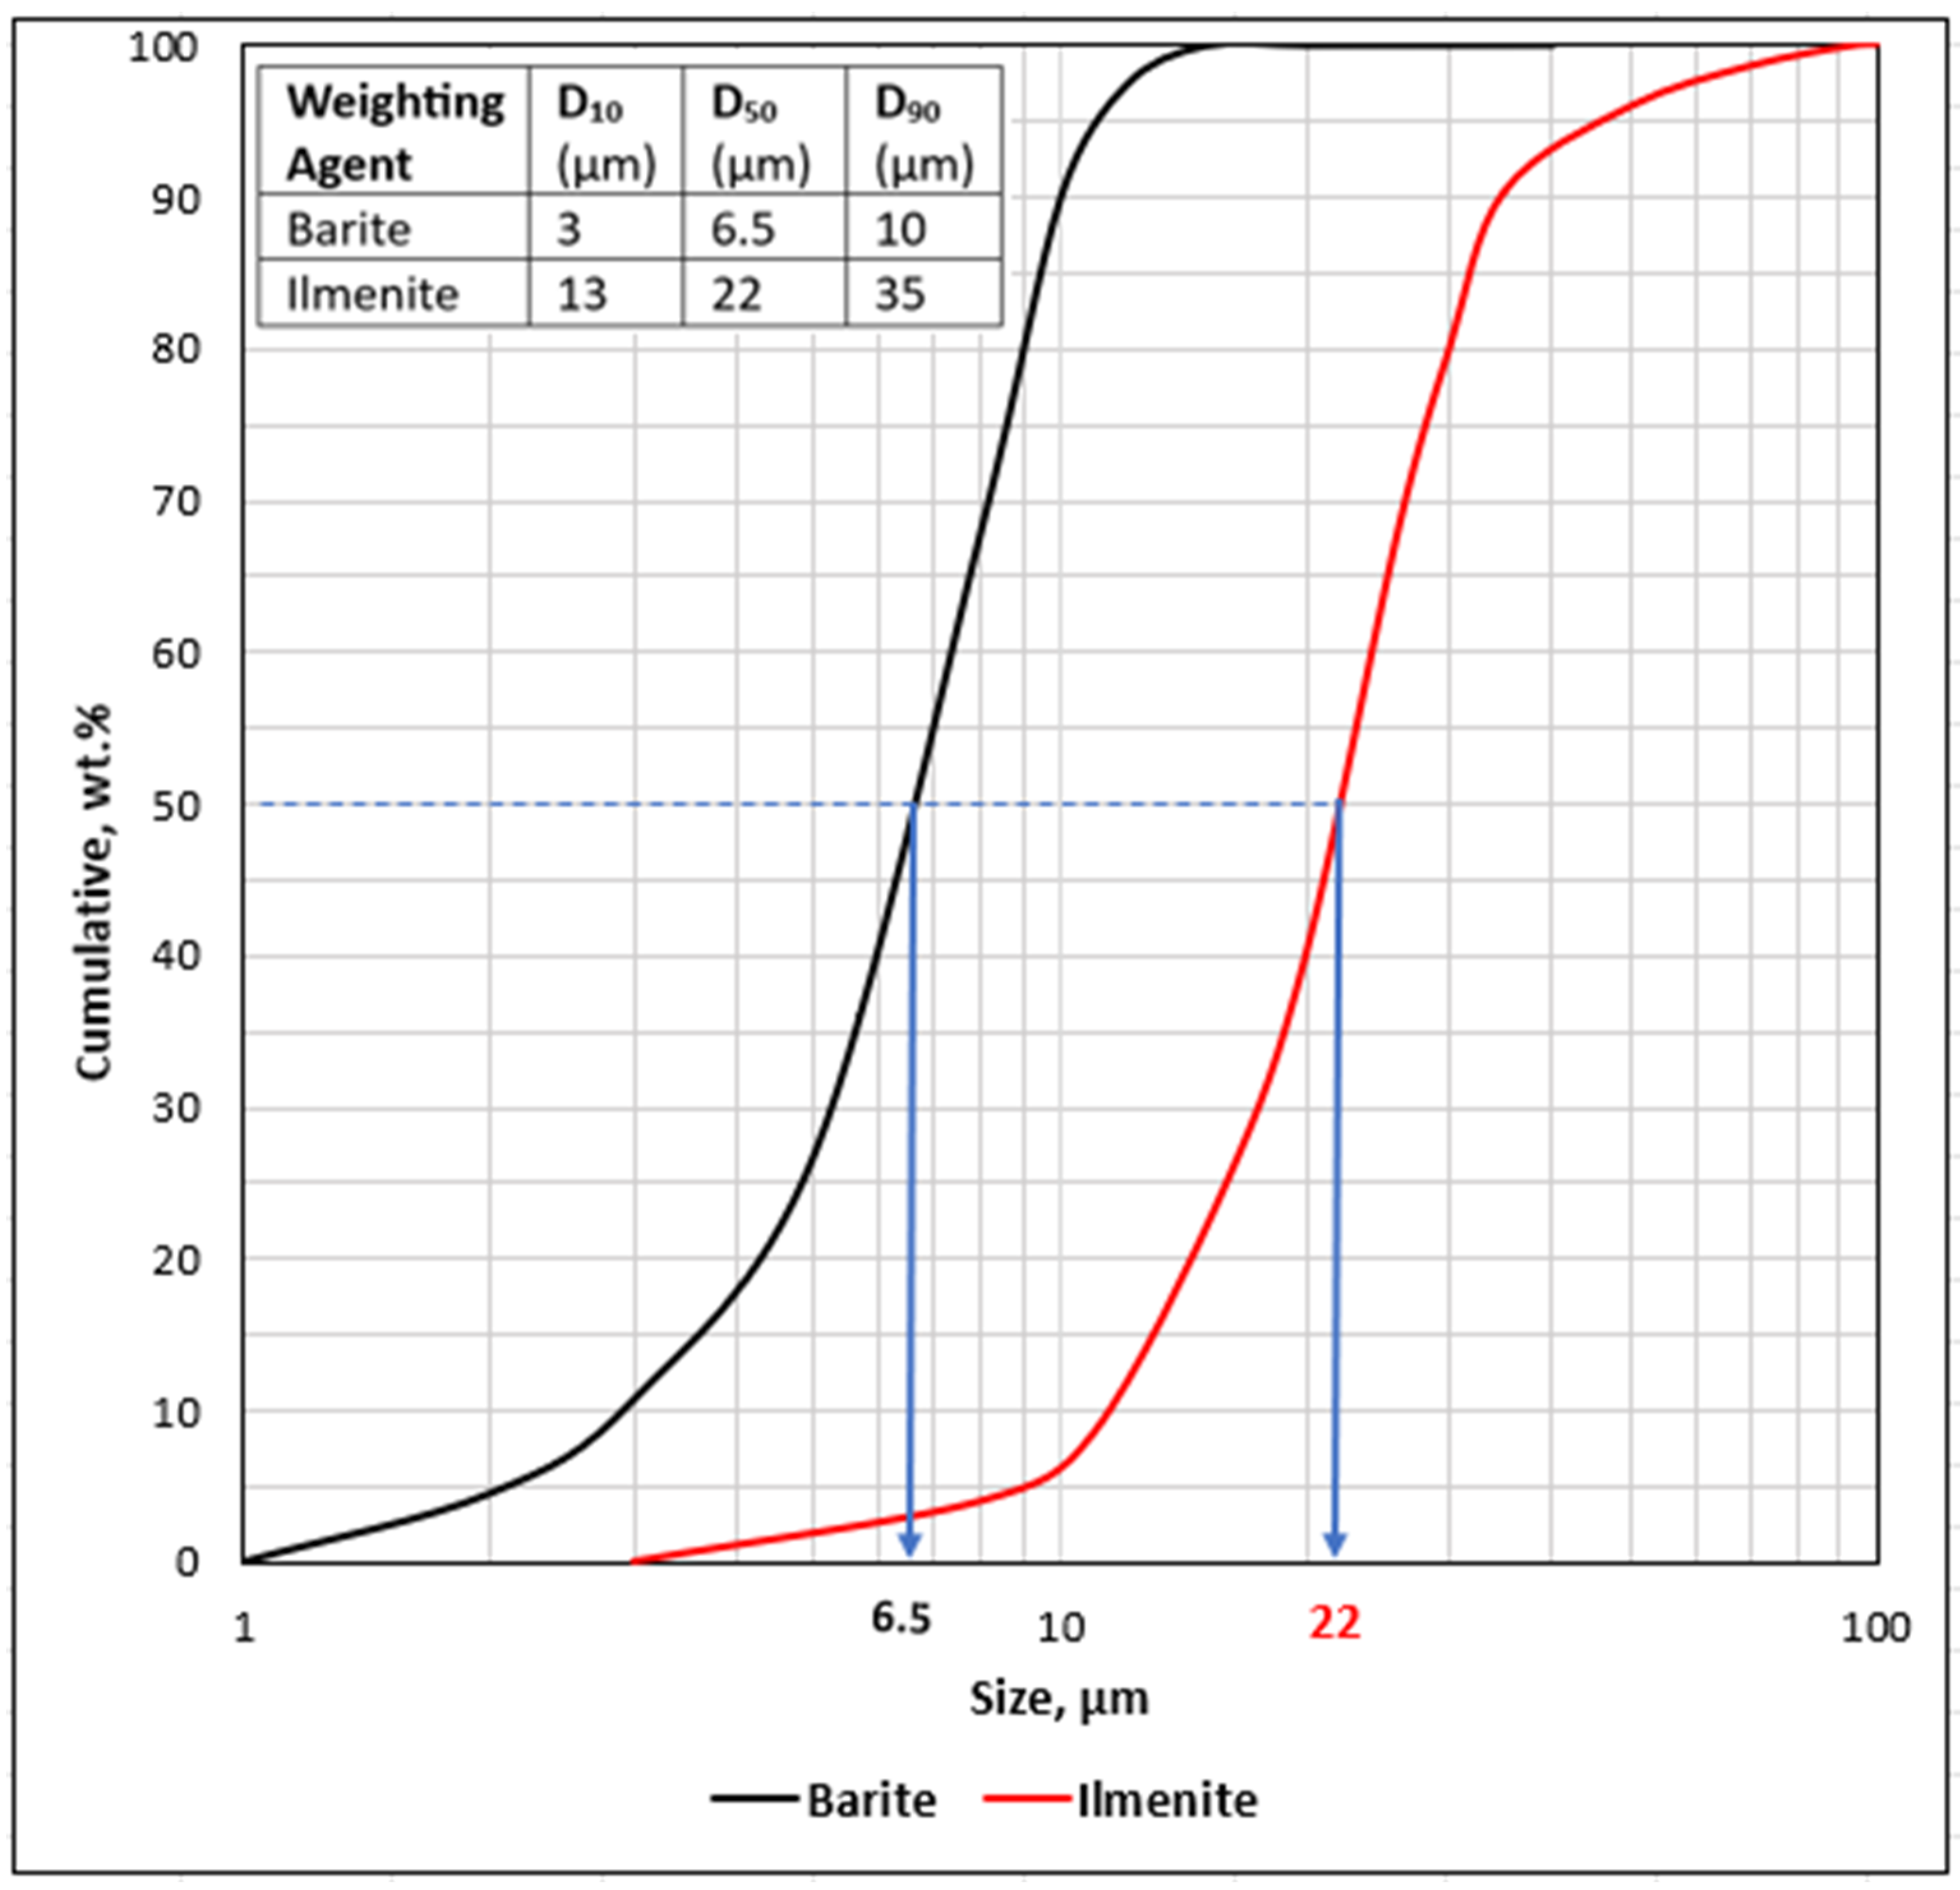
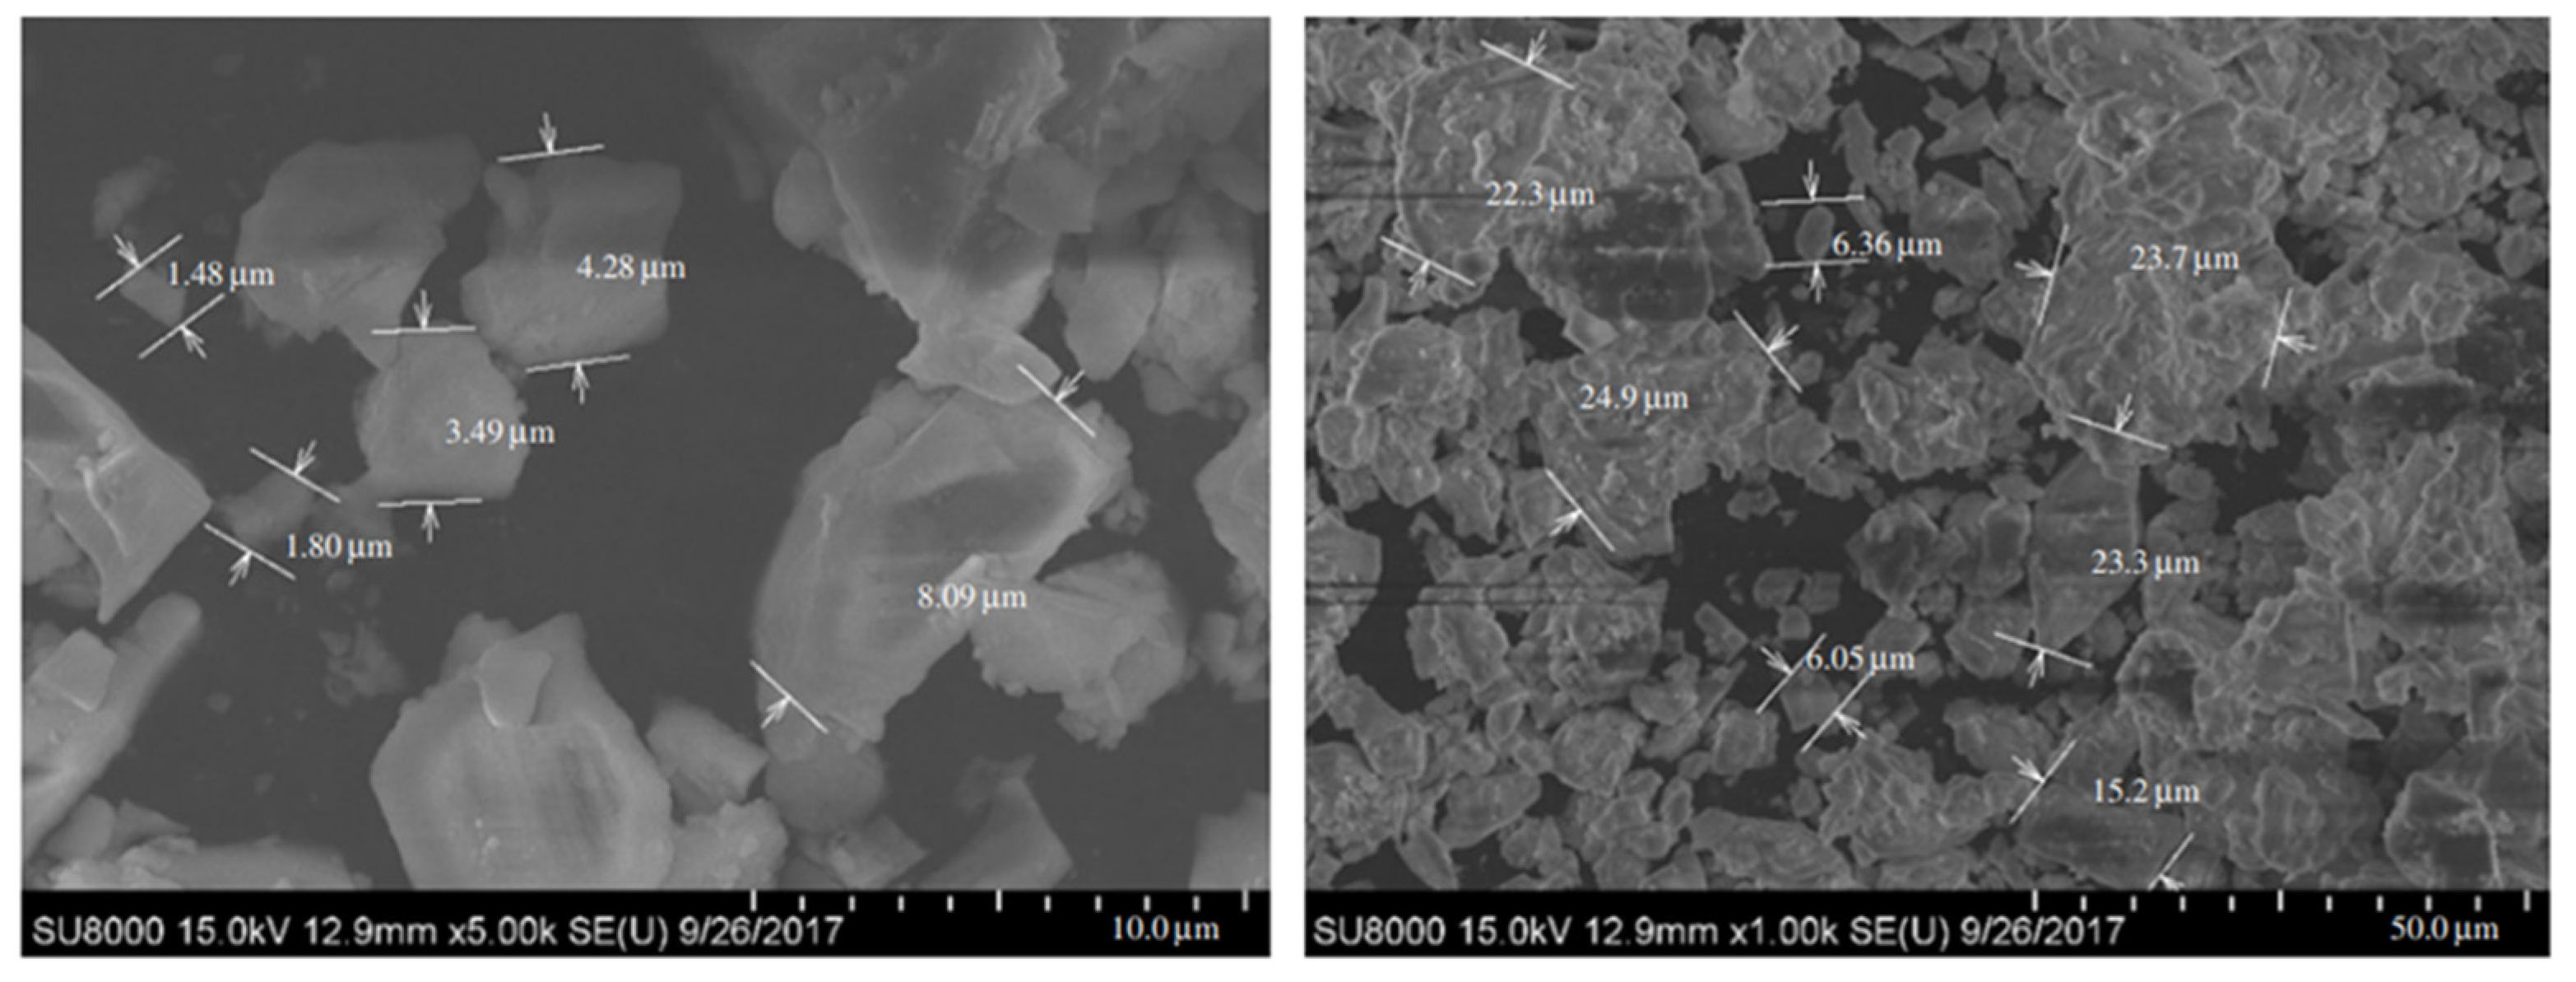
  • It was unveiled from the elemental composition, as revealed by the XRF analysis result of ilmenite, that it predominantly contains 54.72% iron (Fe), which may be responsible for its higher density as compared with barite, which was made up of 77.5% barium, a less dense element. The D50 PSD of ilmenite (22 µm) is larger than that of barite (6.5 µm); the larger particle size of ilmenite, in addition to its density, may be responsible for faster sagging of ilmenite, and thus less potency of fly ash in ilmenite-densified fluid.
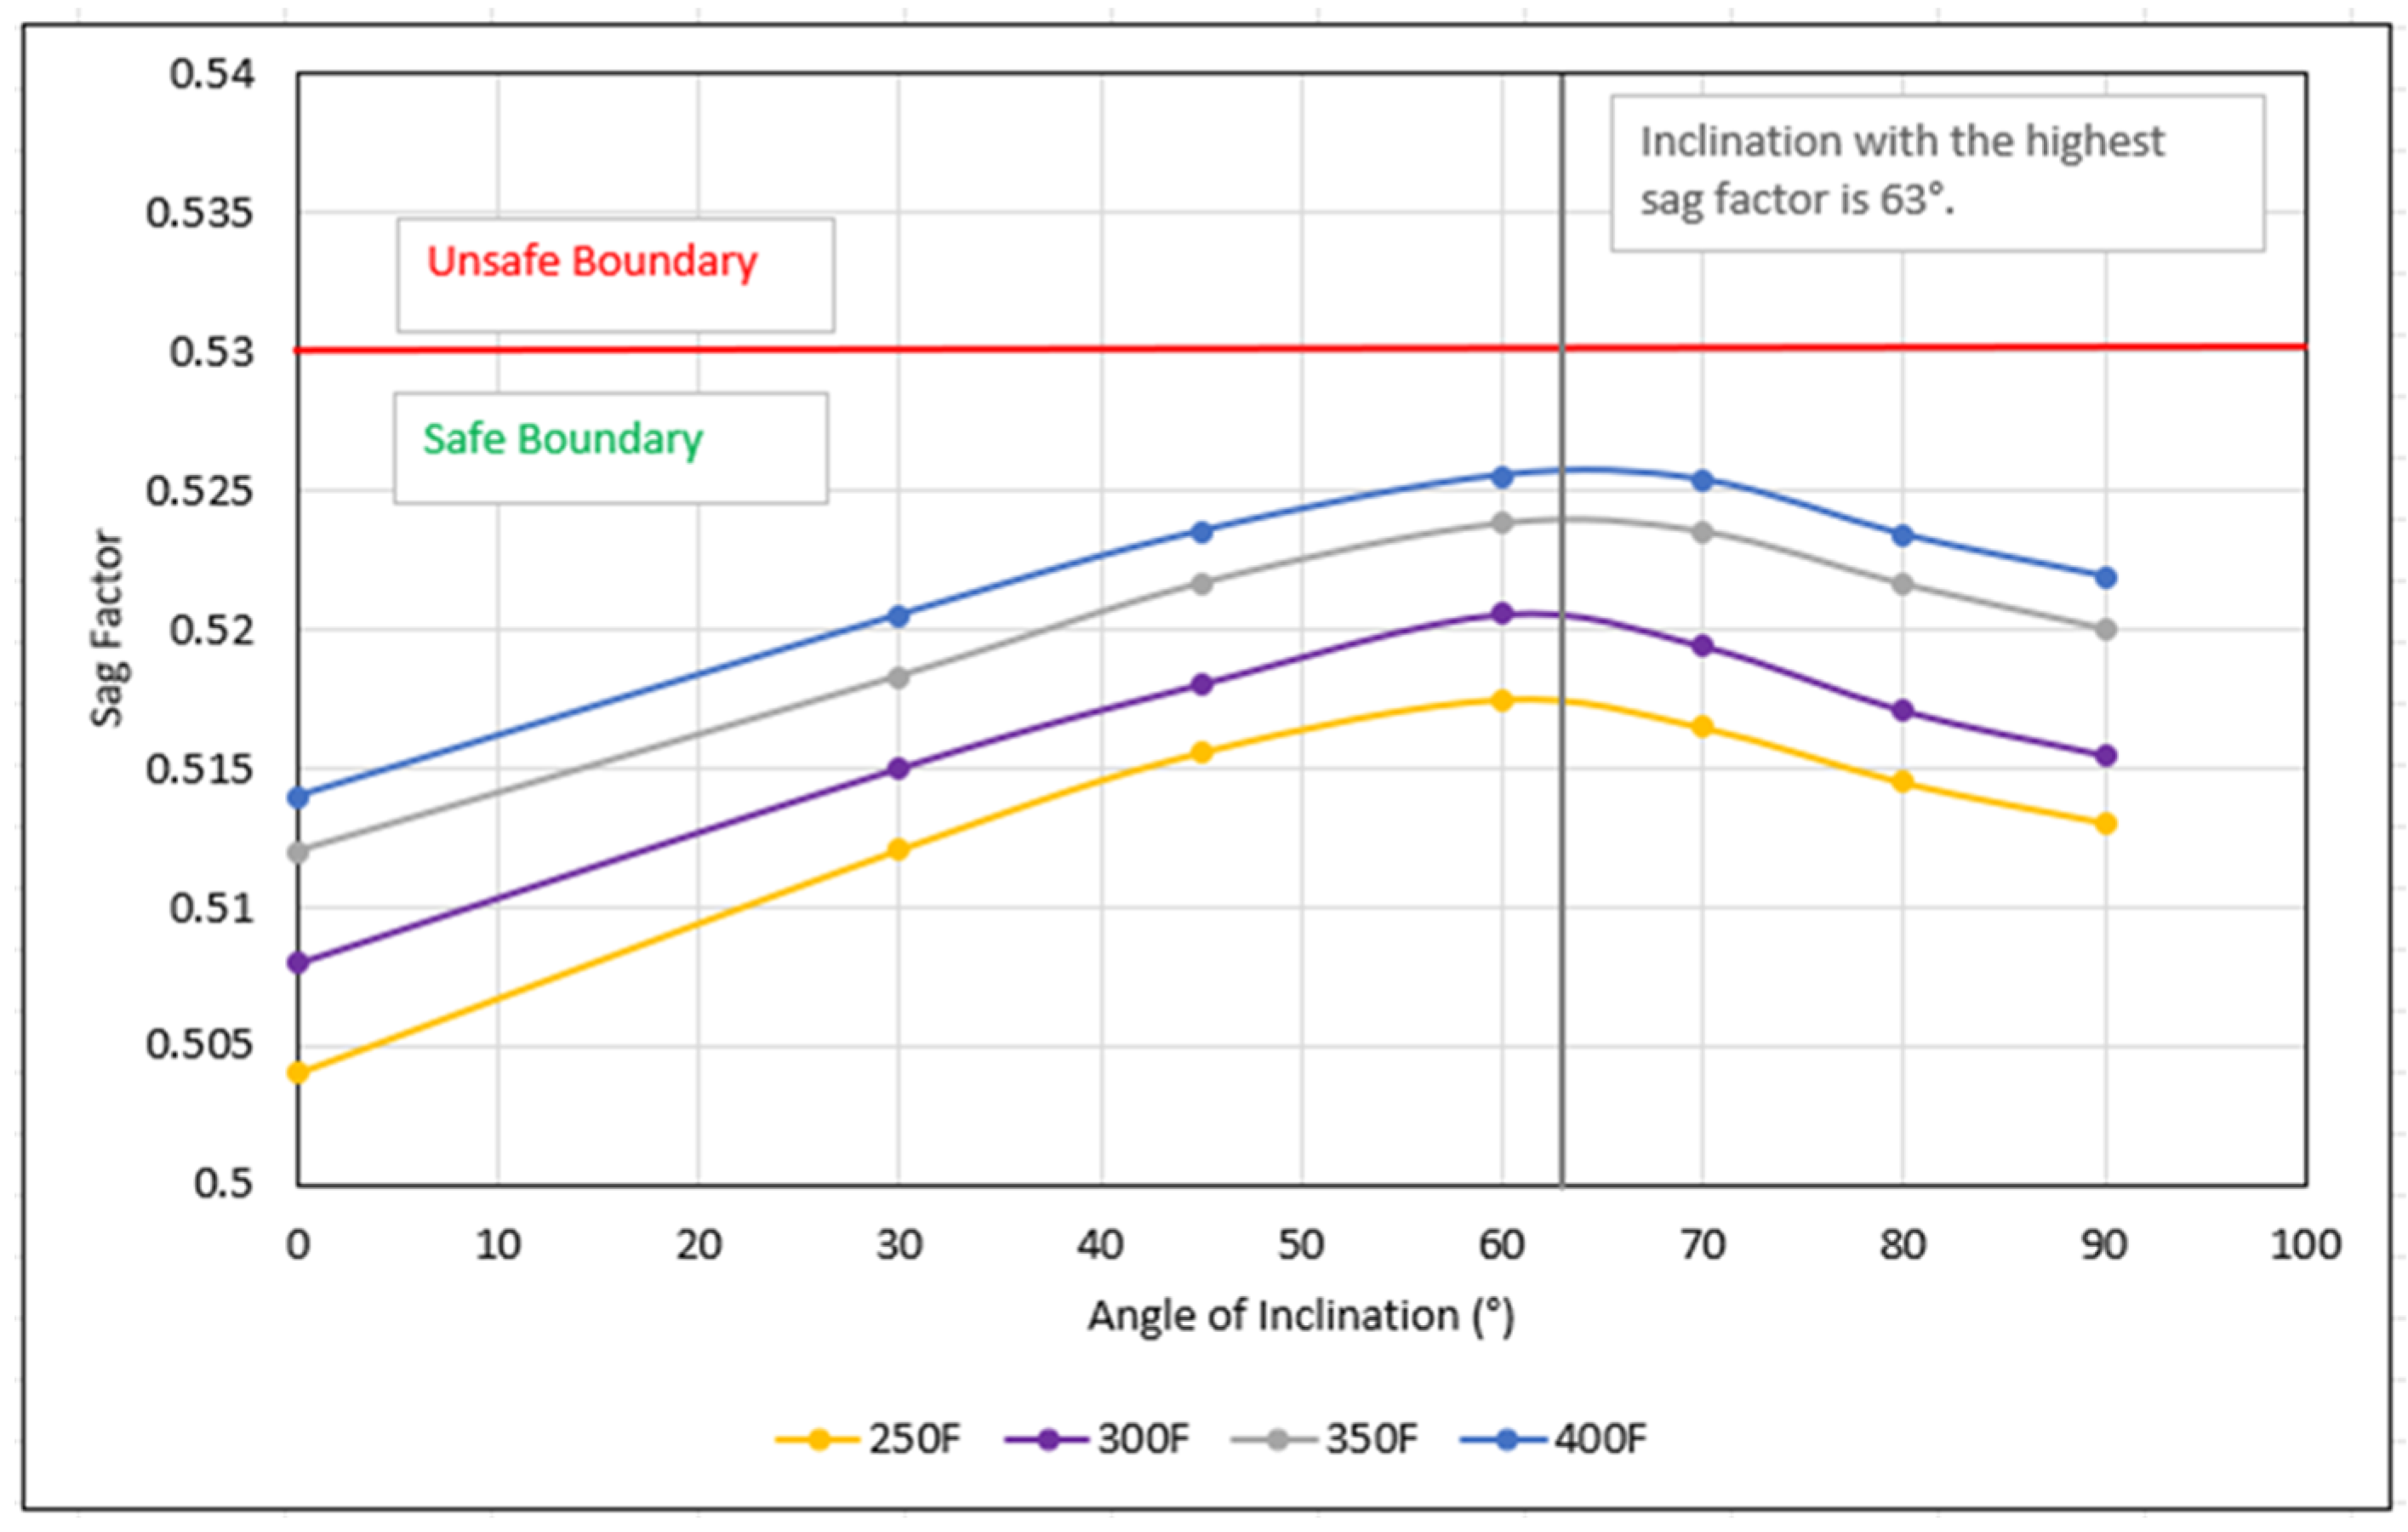
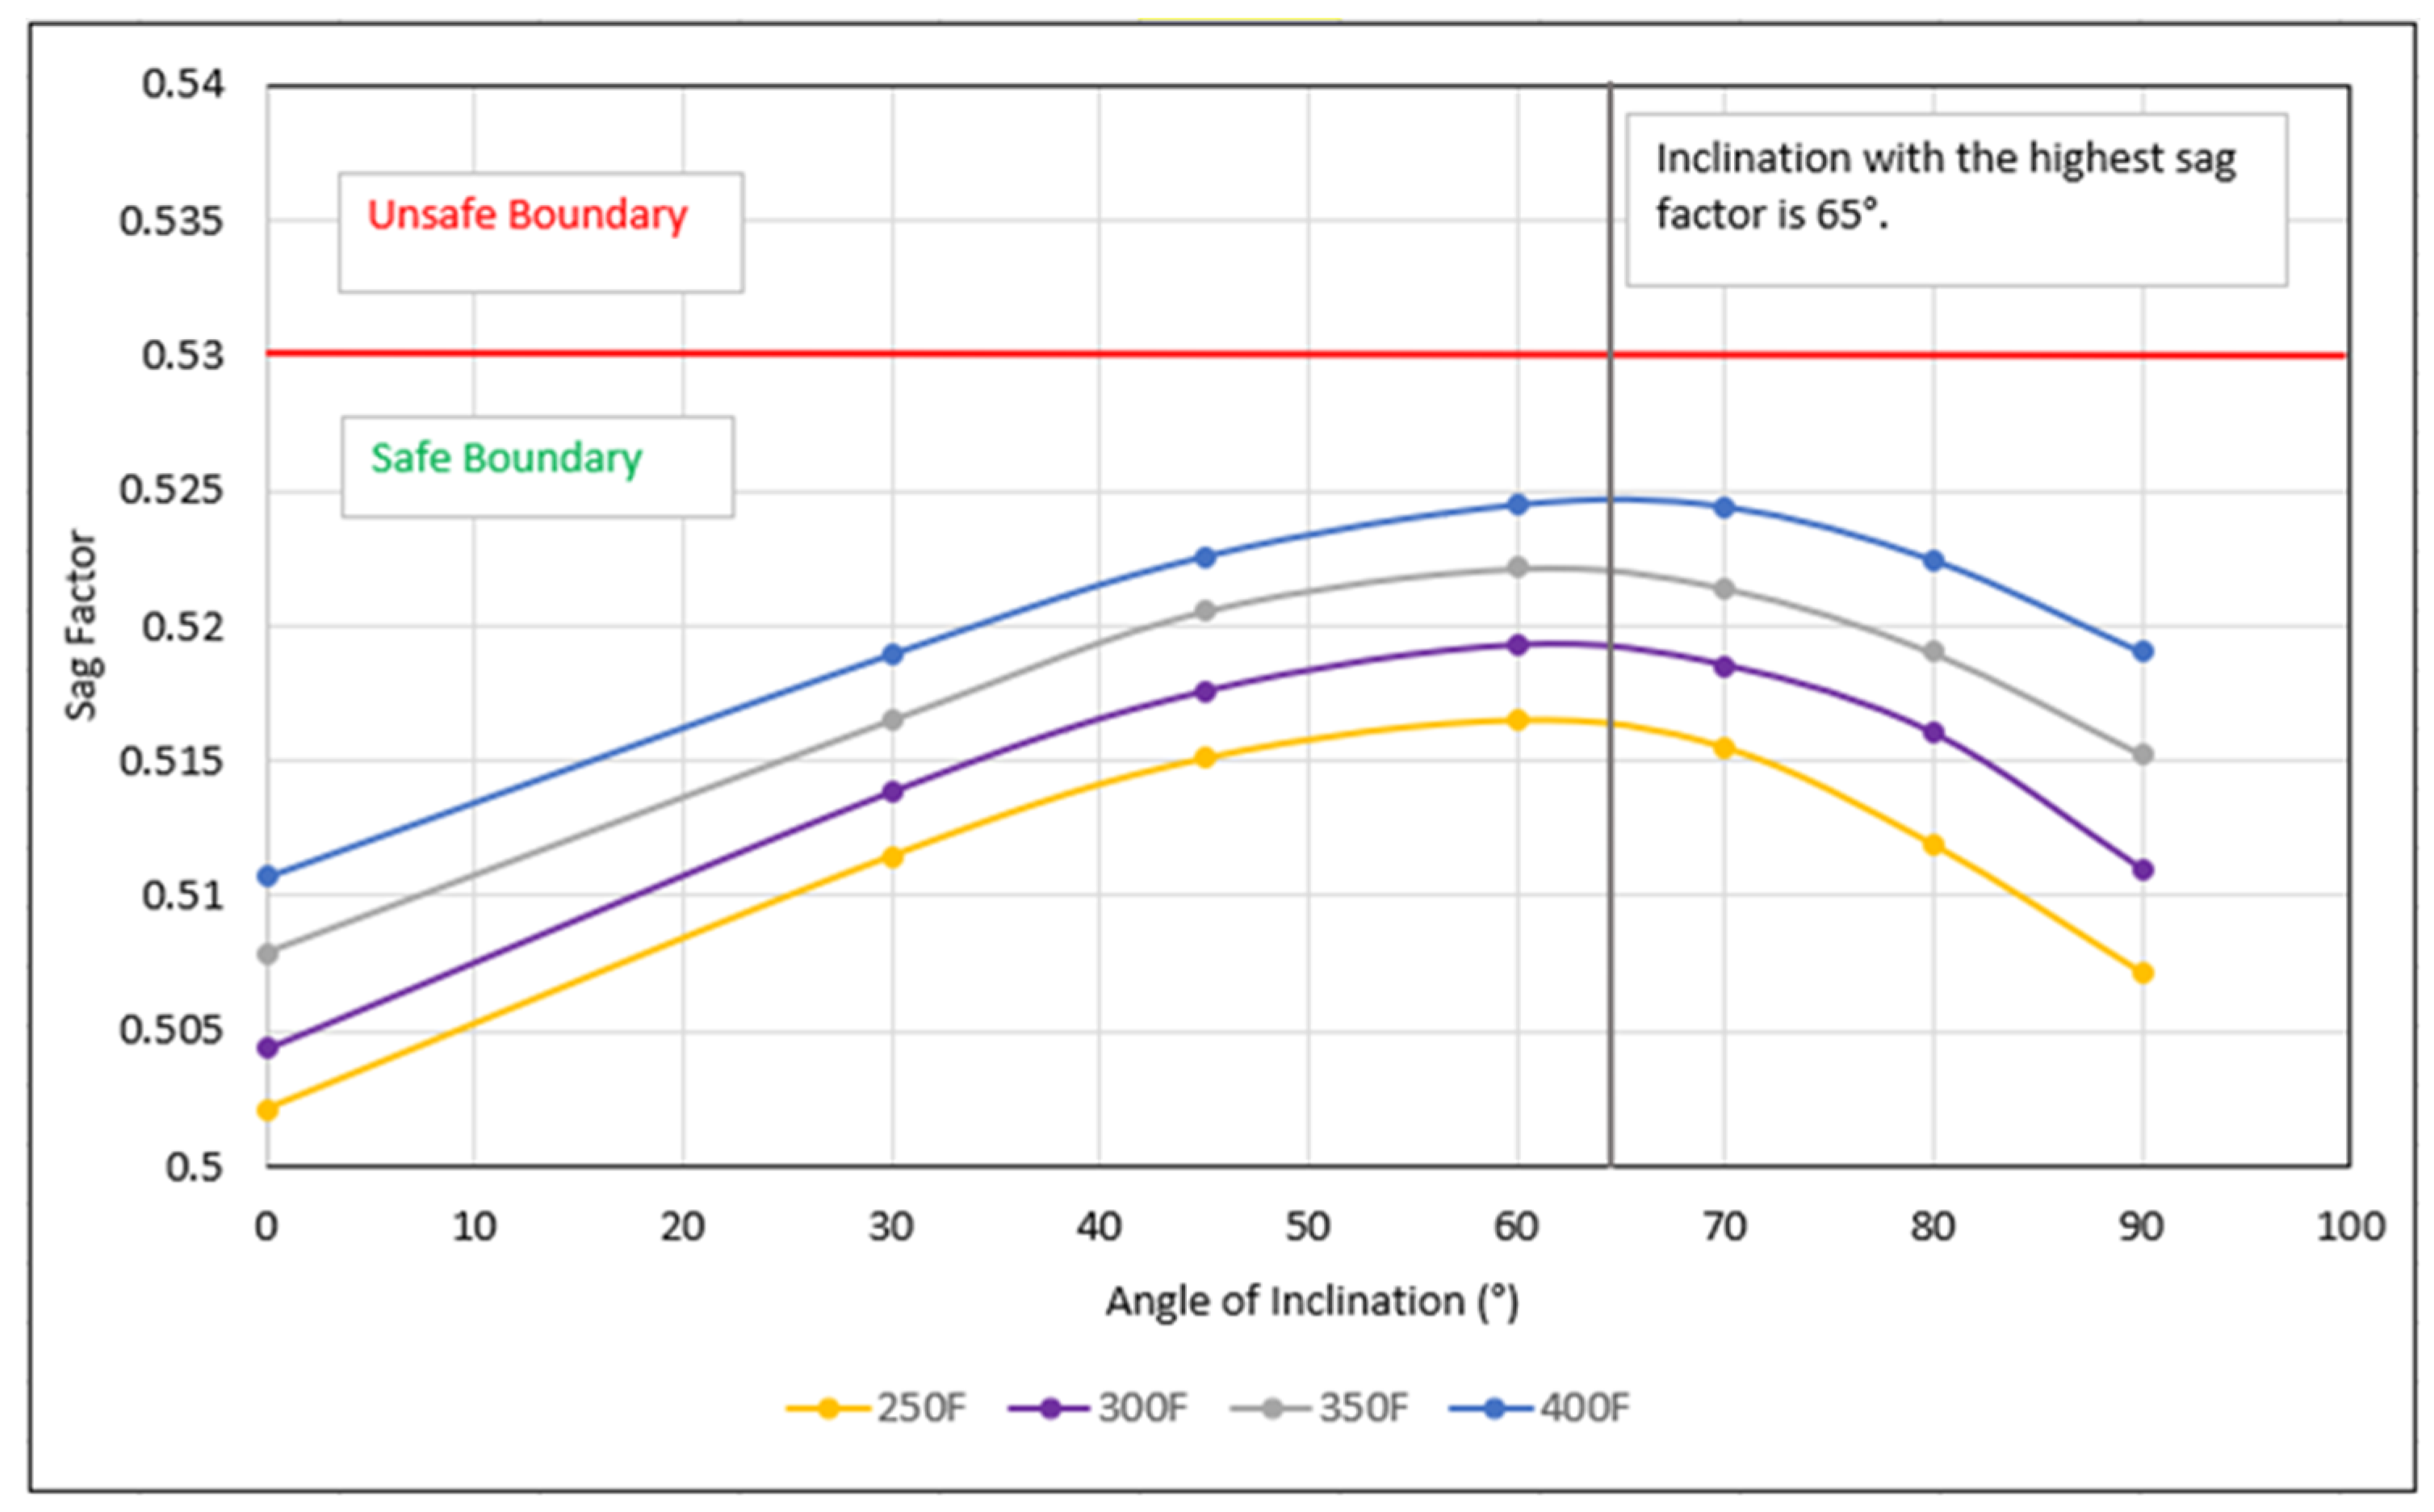
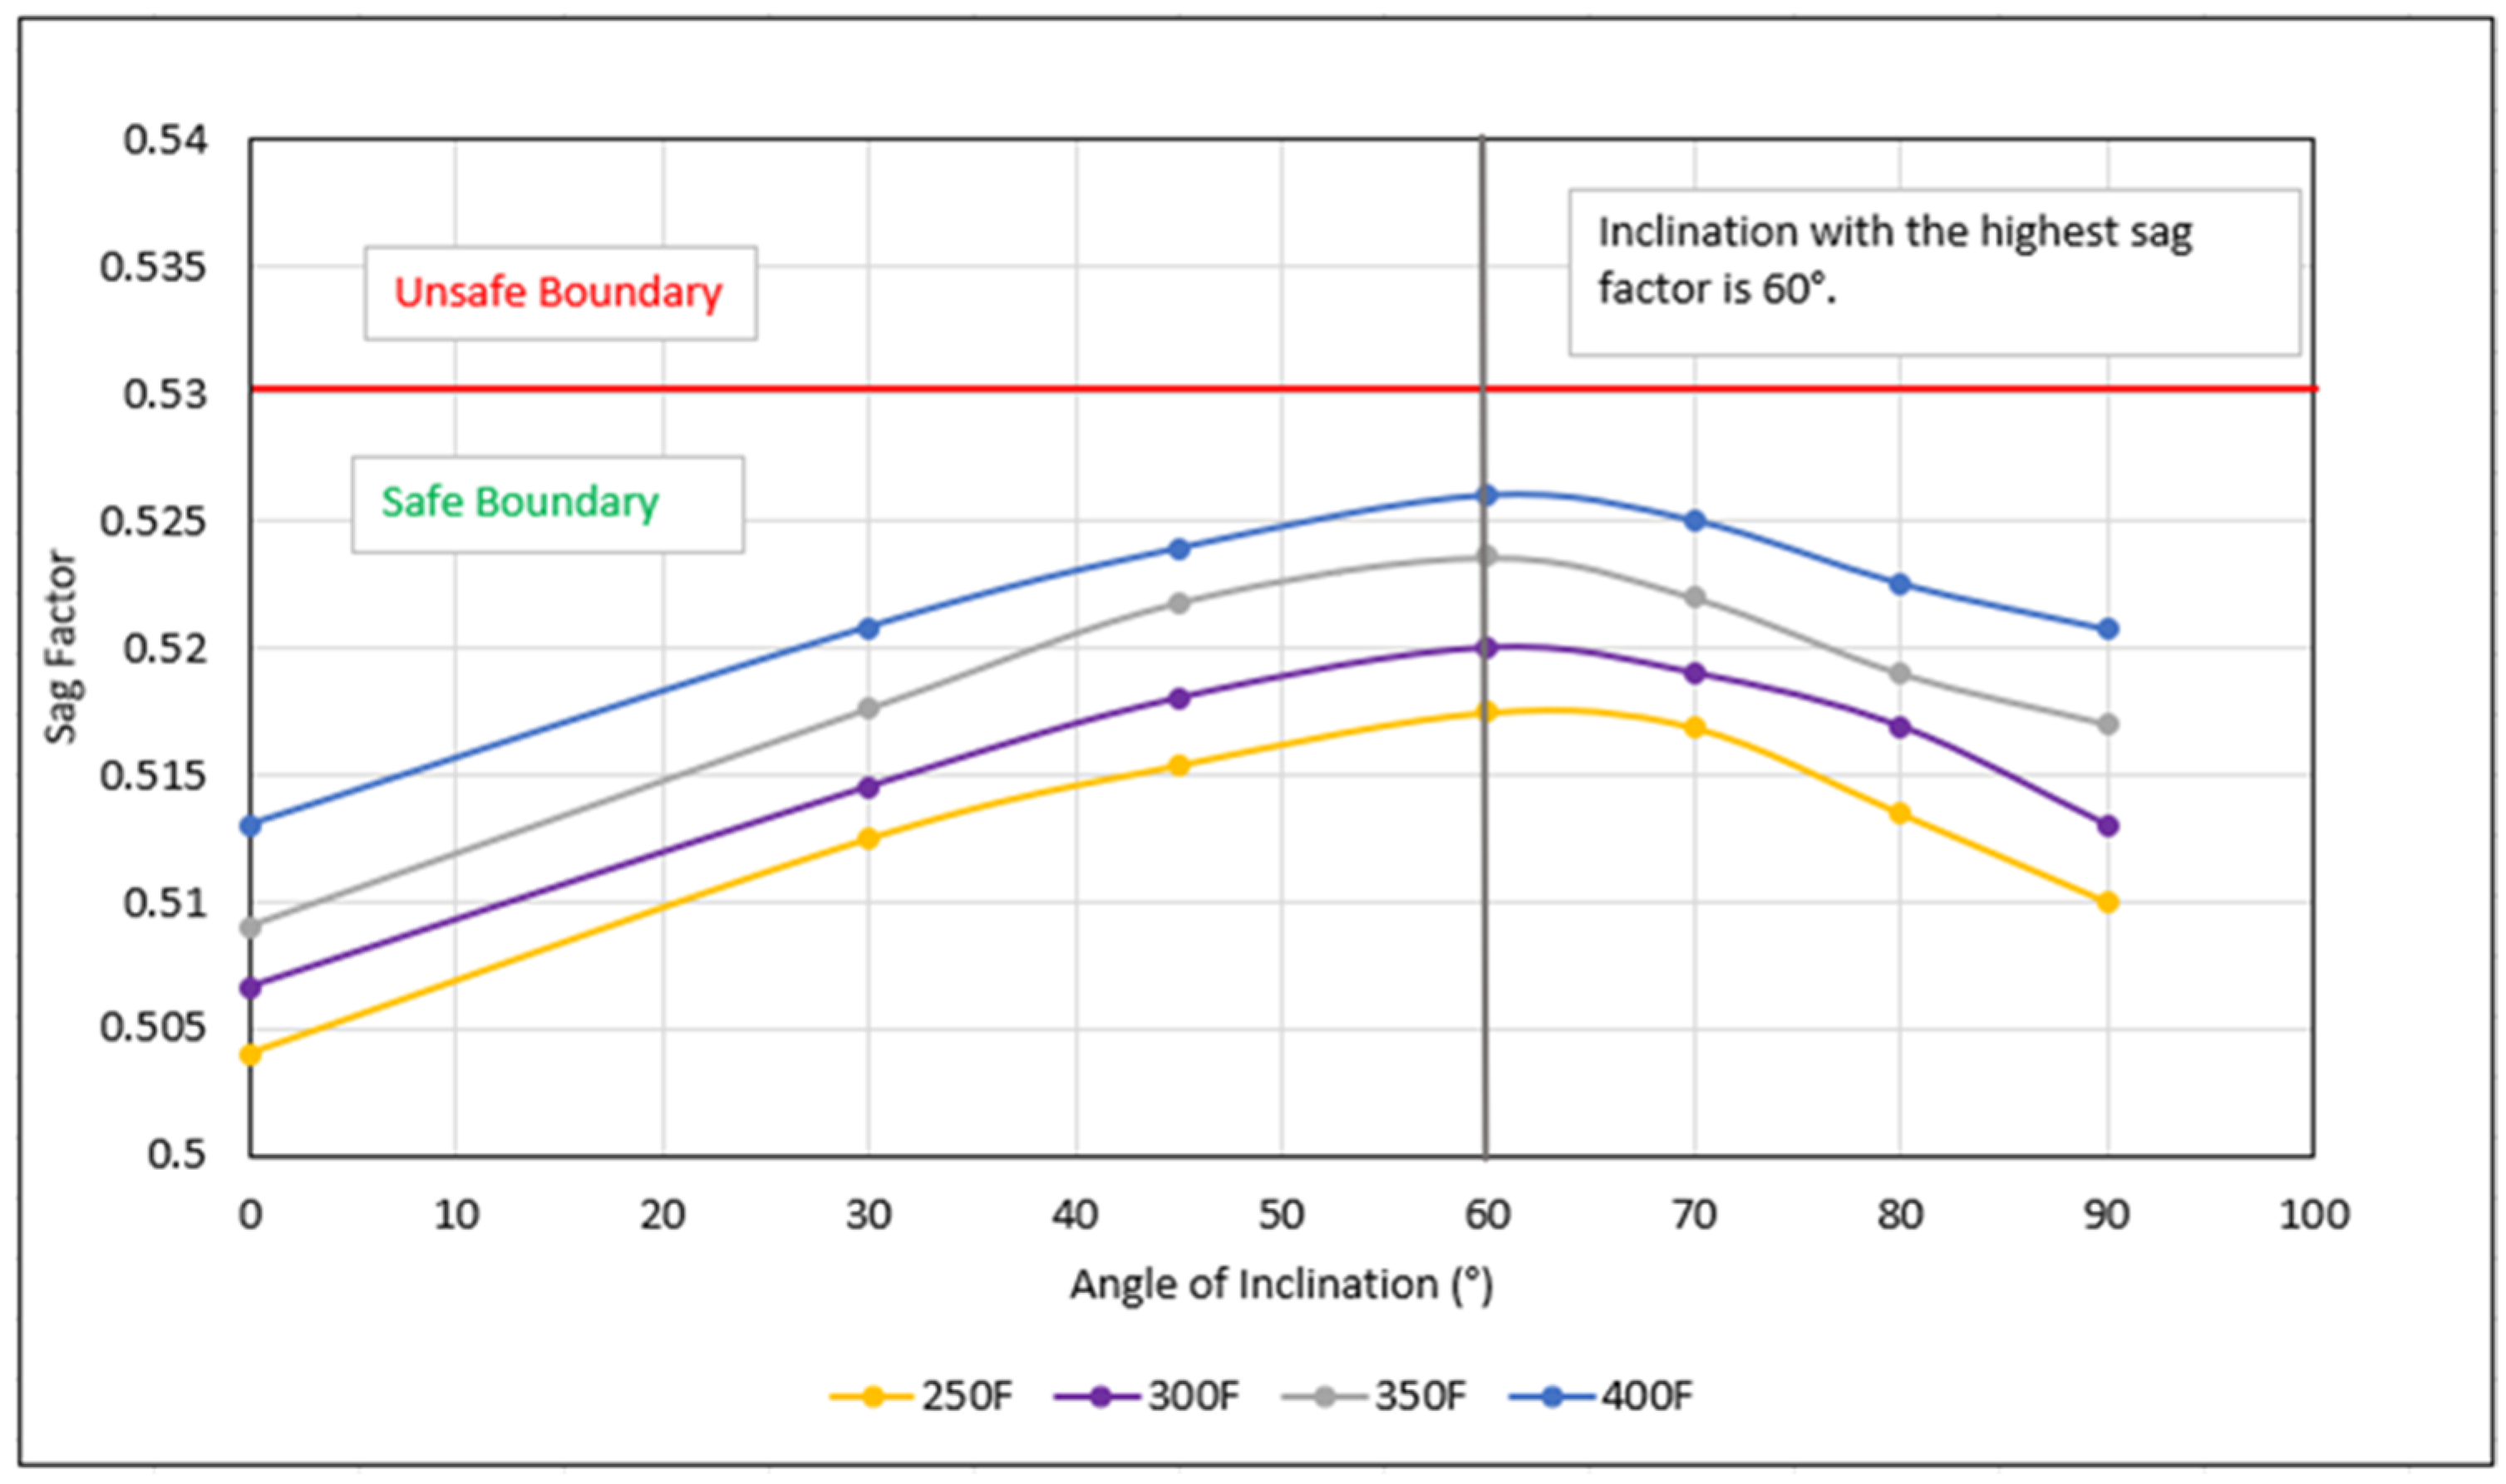
  • An increase in the quantity of fly ash added to the barite-densified fluid caused a corresponding increase in the critical angle; 0, 3, and 4 lb/bbl of fly ash resulted in critical angles of 62°, 63°, and 65°, respectively.
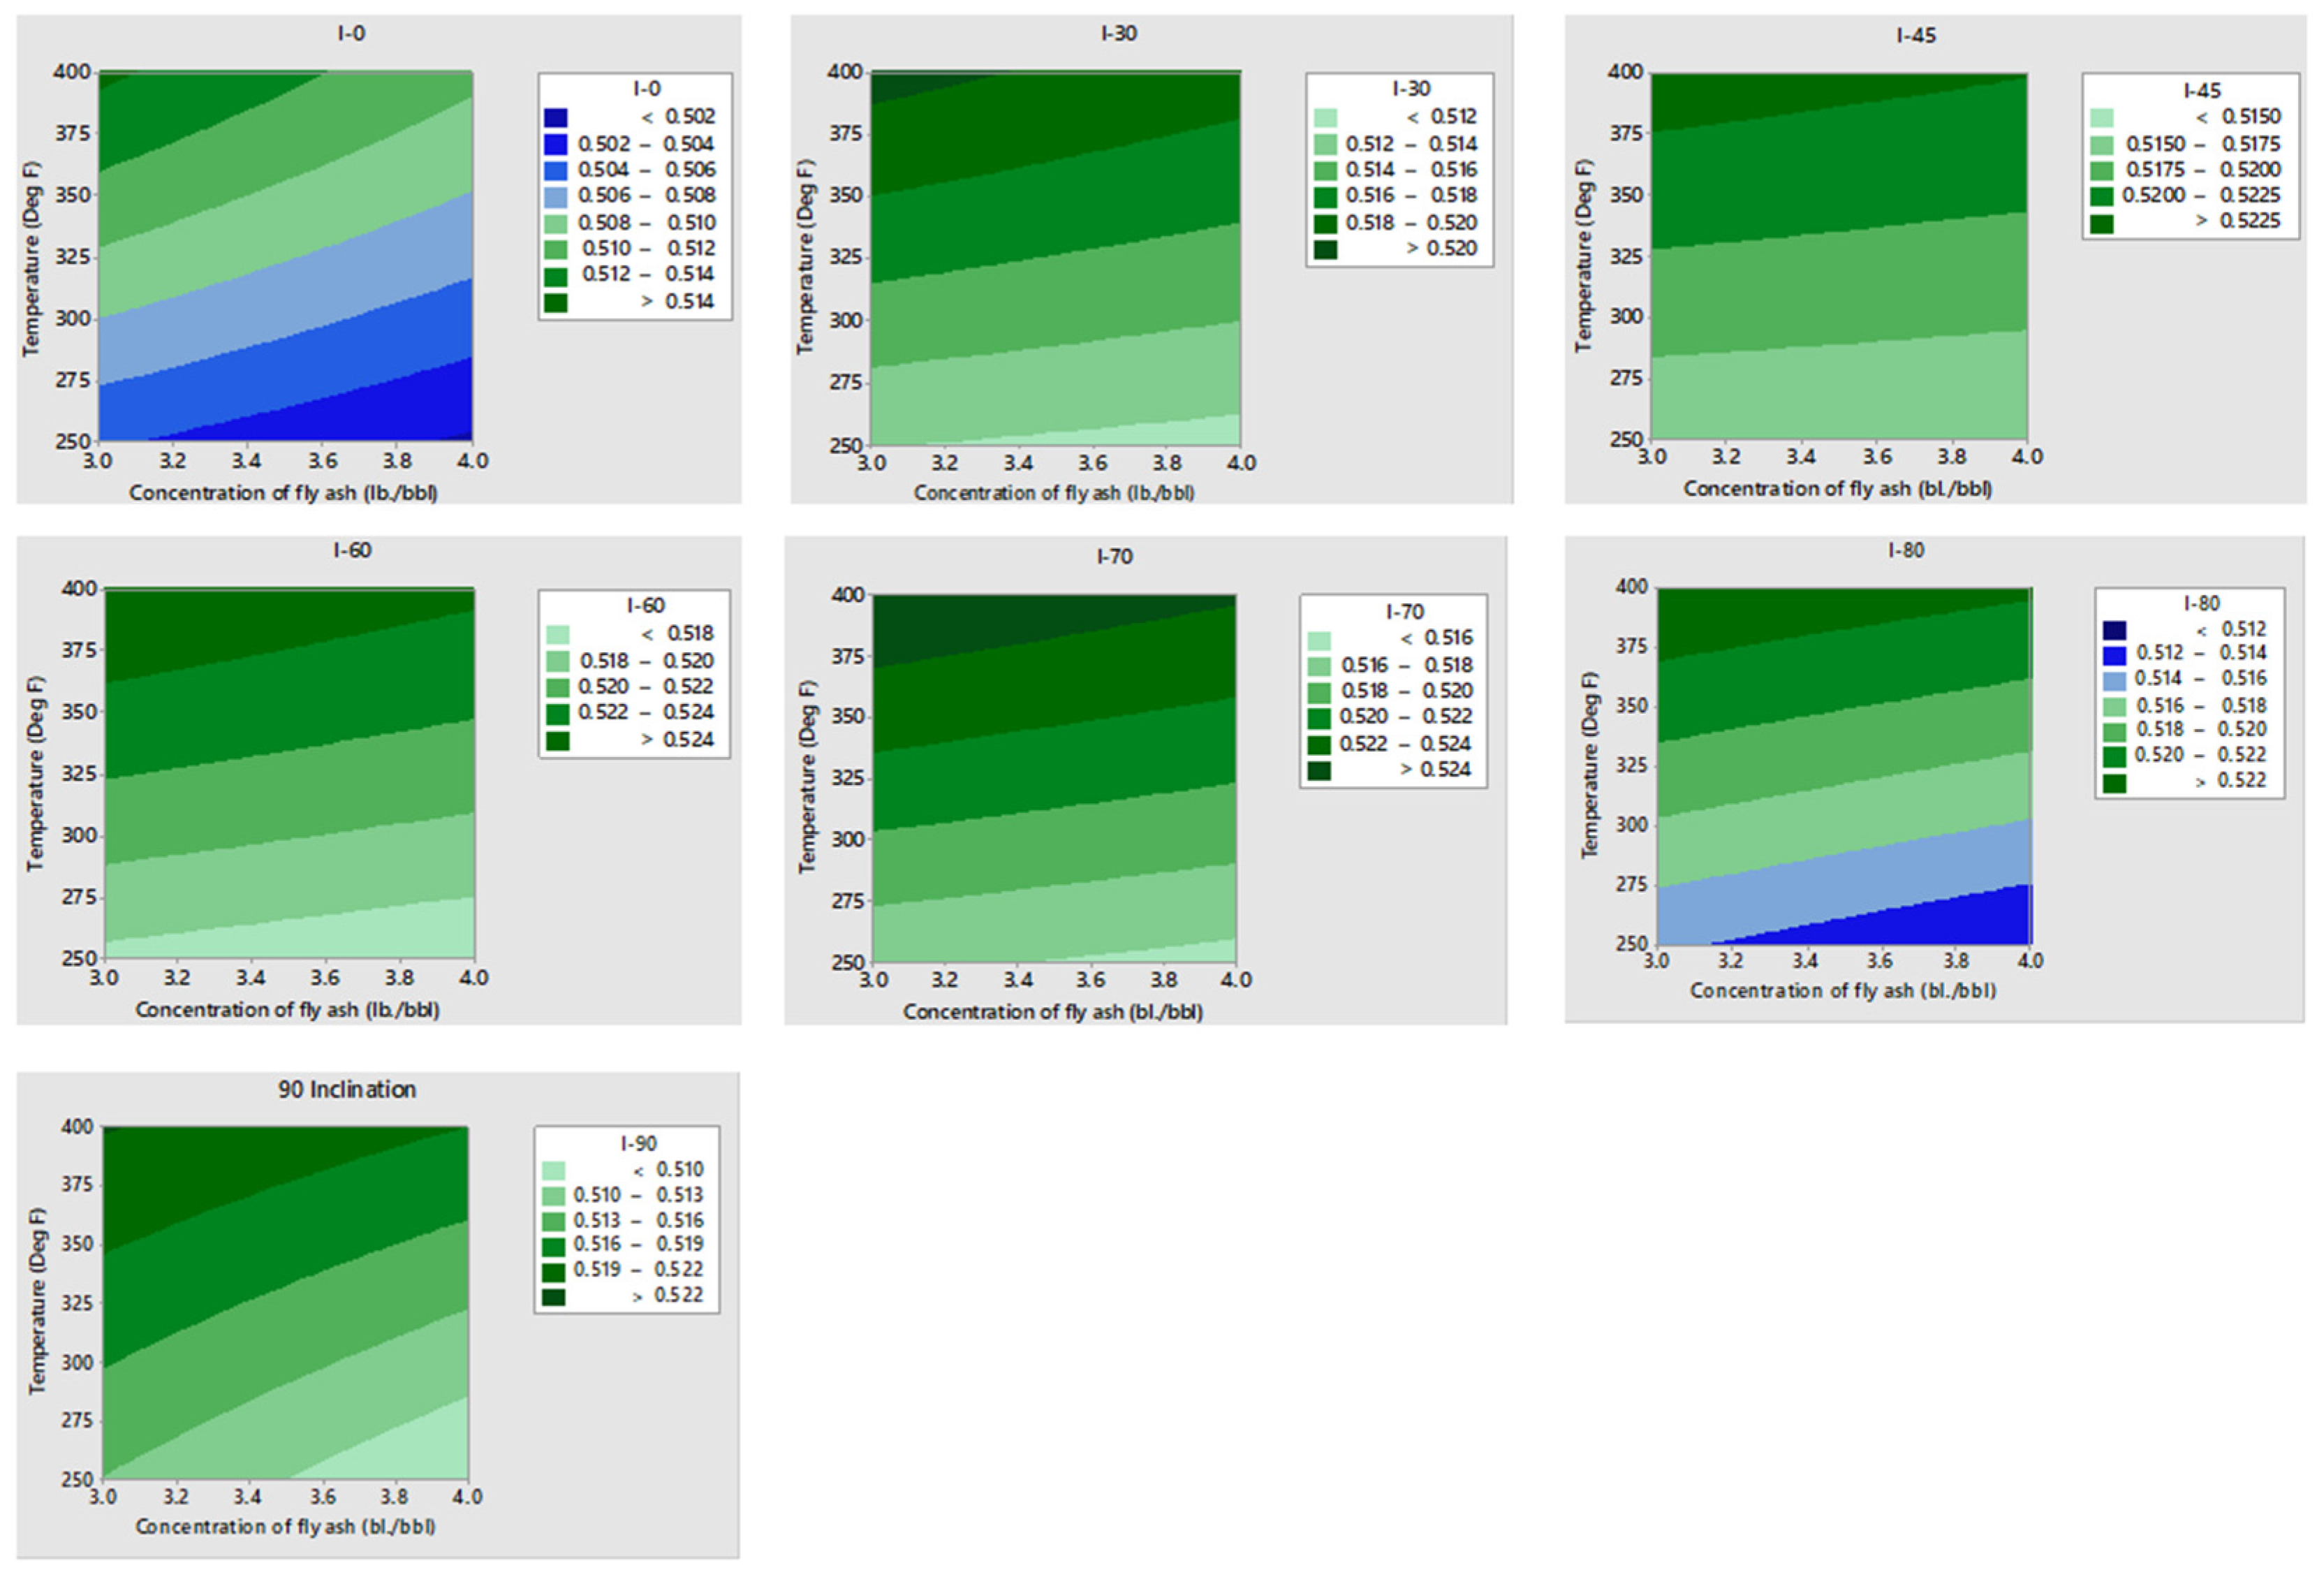
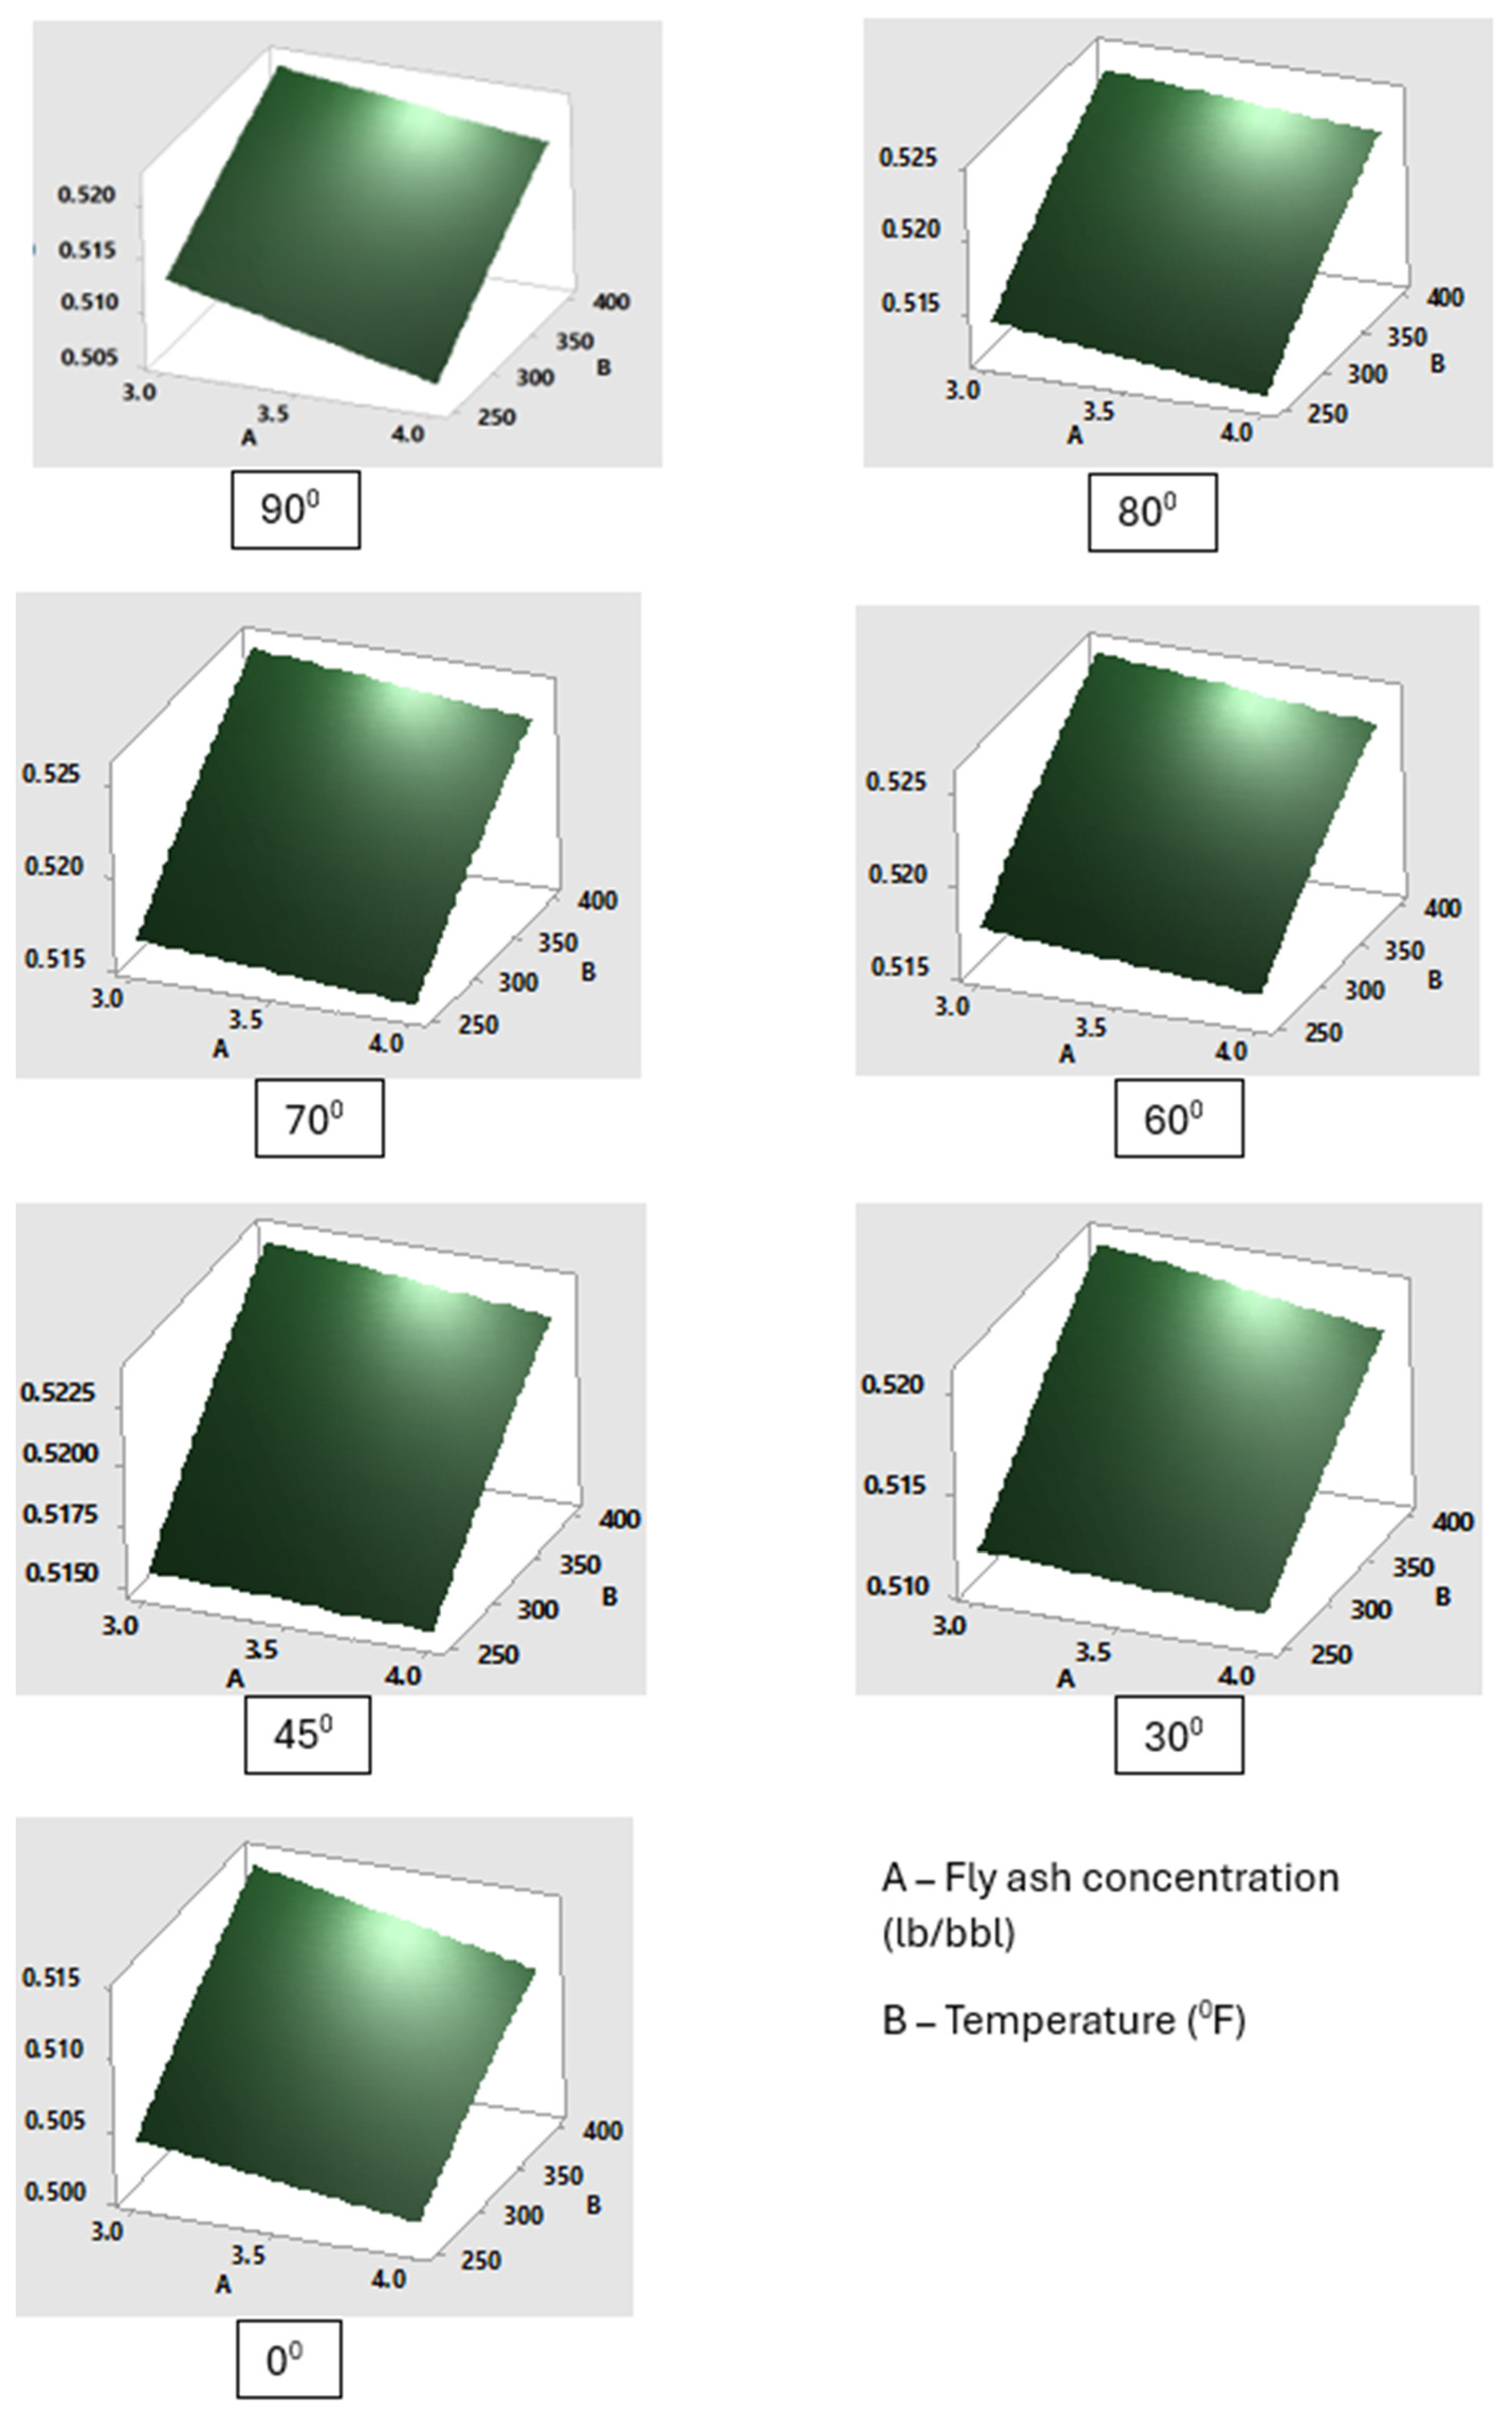
  • Optimization of the variables through the 3D surface response plots shows an inverse relationship between the ratio of fly ash and temperature. Increasing the ratio of fly ash and decreasing the temperature improves the SF of the WBF.
  • The contour plots of 45°, 60°, and 70° well deviations show that a high quantity of fly ash ratio may be required to mitigate sagging due to the observed fewer interactions between the variables (fly ash and temperature at wellbore angles), which resulted in fewer slope contour lines. However, this further validates the huge sagging challenges encountered at these well inclinations.

Author Contributions

Conceptualization, A.F.; Methodology, O.O.; Validation, O.O.; Formal analysis, A.F.; Investigation, O.O. and A.F.; Data curation, O.O.; Writing—original draft, O.O.; Writing—review & editing, A.F.; Supervision, A.F. All authors have read and agreed to the published version of the manuscript.

Funding

This research was funded by the North Dakota Industrial Commission (NDIC), grant number UND0026755.

Data Availability Statement

Data is contained within the article.

Acknowledgments

The authors would like to acknowledge Newpark Resources Inc., Katy, TX, USA, for material donation and technical contribution to the research work.

Conflicts of Interest

The authors declare no conflicts of interest.

References

  1. Bern, P.A.; Zamora, M.; Slater, K.S.; Hearn, P.J. The Influence of Drilling Variables on Barite Sag. In All Days; SPE: Denver, CO, USA, 1996; p. SPE-36670-MS. [Google Scholar] [CrossRef]
  2. Ofei, T.N.; Lund, B.; Saasen, A.; Sangesland, S.; Linga, H.; Gyland, K.R.; Kawaji, M. Barite Sag Measurements. In Day 2 Wed, March 04, 2020; SPE: Galveston, TX, USA, 2020; p. D092S000R004. [Google Scholar] [CrossRef]
  3. Jamison, D.; Clements, W. A New Test Method to Characterize Setting/Sag Tendencies of Drilling Fluids in Extended Reach Drilling. Drill. Tech. Symp. 1990, 27, 109. [Google Scholar]
  4. Dye, W.; Hemphill, T.; Gusler, W.; Mullen, G. Correlation of Ultralow-Shear-Rate Viscosity and Dynamic Barite Sag. SPE Drill. Complet. 2001, 16, 27–34. [Google Scholar] [CrossRef]
  5. Basfar, S.; Mohamed, A.; Elkatatny, S. Barite–Micromax Mixture, an Enhanced Weighting Agent for the Elimination of Barite Sag in Invert Emulsion Drilling Fluids. J. Pet. Explor. Prod. Technol. 2020, 10, 2427–2435. [Google Scholar] [CrossRef]
  6. Ahmed, A.; Basfar, S.; Elkatatny, S.; Bageri, B. Vermiculite for Enhancement of Barite Stability in Water-Based Mud at Elevated Temperature. Powder Technol. 2022, 401, 117277. [Google Scholar] [CrossRef]
  7. Oni, O.; Fadairo, A.; Gosnold, W.; Egenhoff, S. Fly Ash as an Additive for Controlling Sagging Tendency in Ilmenite Densified Water-Based Mud for a Highly Inclined High Temperature Well. Geoenergy Sci. Eng. 2023, 230, 212232. [Google Scholar] [CrossRef]
  8. Xu, P.; Xu, M.; Tao, Z.; Wang, Z.; Huang, T. Rheological Properties and Damage-Control Mechanism of Oil-Based Drilling Fluid with Different Types of Weighting Agents. R. Soc. Open Sci. 2018, 5, 180358. [Google Scholar] [CrossRef] [PubMed]
  9. Oni, O.; Fadairo, A.S.; Gosnold, W.; Egenhoff, S.; Adeyemi, G.; Ling, K. Investigating the Suitability of North Dakota Fly Ash as Fluid Loss Reducing Additive in Densified Water-Based Drilling Fluid. Powder Technol. 2023, 430, 118972. [Google Scholar] [CrossRef]
  10. Wang, W.; Li, C.; Zhao, X.; Song, P.; Li, J.; Zheng, J.; Wang, X. An Image-based method for evaluating changes in particle size and morphology distributions of aggregate materials after vibratory compaction test. Constr. Build. Mat. 2024, 430, 136483. [Google Scholar] [CrossRef]
  11. Longarini, N.; Crespi, P.; Zucca, M.; Giordano, N.; Silvestro, G. The advantages of fly ash use in concrete structures. Inżynieria Miner. 2014, 15, 141–145. [Google Scholar]
  12. AlAbdullatif, Z.; Al-Yami, A.; Wagle, V.; Bubshait, A.; Al-Safran, A. Development of New Kill Fluids with Minimum Sagging Problems for High Pressure Jilh Formation in Saudi Arabia. In Day 3 Wed, November 12, 2014; SPE: Abu Dhabi, UAE, 2014; p. D031S057R002. [Google Scholar] [CrossRef]
  13. Mohamed, A.; Al-Afnan, S.; Elkatatny, S.; Hussein, I. Prevention of Barite Sag in Water-Based Drilling Fluids by A Urea-Based Additive for Drilling Deep Formations. Sustainability 2020, 12, 2719. [Google Scholar] [CrossRef]
  14. Ren, Z.; Liu, Y.; Yuan, L.; Luan, C.; Wang, J.; Cheng, X.; Zhou, Z. Optimizing the content of nano-SiO2, nano-TiO2 and nano-CaCO3 in Portland cement paste by response surface methodology. J. Build. Eng. 2021, 35, 102073. [Google Scholar] [CrossRef]
  15. Derdour, F.Z.; Kezzar, M.; Khochemane, L. Optimization of Penetration Rate in Rotary Percussive Drilling Using Two Techniques: Taguchi Analysis and Response Surface Methodology (RMS). Powder Technol. 2018, 339, 846–853. [Google Scholar] [CrossRef]
  16. Ebrahimzade, I.; Ebrahimi-Nik, M.; Rohani, A.; Tedesco, S. Higher Energy Conversion Efficiency in Anaerobic Degradation of Bioplastic by Response Surface Methodology. J. Clean. Prod. 2021, 290, 125840. [Google Scholar] [CrossRef]
Figure 1. Analysis of the X-ray fluorescence of barite.
Applsci 14 06833 g001
Figure 2. Analysis of the X-ray fluorescence of fly ash from Beulah lignite.
Applsci 14 06833 g002
Figure 3. Analysis of the X-ray fluorescence of ilmenite.
Applsci 14 06833 g003
Figure 4. Sieve analysis result of weighting agents.
Applsci 14 06833 g004
Figure 5. Scanning electron microscopic images of barite [8].
Applsci 14 06833 g005
Figure 6. SEM morphology of fly ash [11].
Applsci 14 06833 g006
Figure 7. Static sag testing apparatus: (a) inclined (30°, 45°, 60°, 70°, 80°, and 90°) and (b) vertical. (c) The major apparatus for the VSST test (syringe not included).
Applsci 14 06833 g007
Figure 8. Static sag results for base fluid (0 lb/bbl of fly ash plus 350 lb of barite).
Applsci 14 06833 g008
Figure 9. Static sag results for Fluid 3 (3 lb/bbl of fly ash plus 350 lb of barite).
Applsci 14 06833 g009
Figure 10. Static sag results for Fluid 4 (4 lb/bbl of fly ash plus 350 lb of barite).
Applsci 14 06833 g010
Figure 11. Static sag result for Fluid 5 (4 lb/bbl of fly ash plus 350 lb of ilmenite).
Applsci 14 06833 g011
Figure 12. Effect of ratios of fly ash on static sagging of weighting agents.
Applsci 14 06833 g012
Figure 13. Dynamic sag results for Fluid 0 and Fluid 3 at different temperatures.
Applsci 14 06833 g013
Figure 14. Effect of ratios of fly ash on the dynamic sagging of weighting agents.
Applsci 14 06833 g014
Figure 15. Comparison between fly ash (This study) and vermiculite [6] under static conditions.
Applsci 14 06833 g015
Figure 16. Contour plots.
Applsci 14 06833 g016
Figure 17. Response surface plots.
Applsci 14 06833 g017
Figure 18. Optimized response surface plot.
Applsci 14 06833 g018
Table 1. Composition of a laboratory barrel of drilling fluid.
Based FluidFluid 1Fluid 2Fluid 3Fluid 4Fluid 5FunctionUnit
Water0.70.70.70.70.70.7Based fluidbbl
PAC-R111111Fluid loss regulatorlb
Soda ash0.50.50.50.50.50.5Calcium controllerlb
KCL202020202020The shale stabilizerlb
CaCO3555555Bridging additivelb
Defoamer0.080.080.080.080.080.08Foam fighting agentlb
Corn starch666666Fluid loss regulatorlb
Xanthan gum0.50.50.50.50.50.5Viscosity regulatorlb
KOH0.50.50.50.50.50.5Alkalinity regulatorlb
Industrial
copolymer
111111Copolymerlb
Bentonite444444Viscosity regulatorlb
Barite3503503503503500Weighting agentlb
Ilmenite00000350Weighting agentlb
Fly ash012344Fluid loss regulatorlb
Table 2. Summary of comparisons between this study (fly ash) and [6].
ParametersThis Study[6]
Anti-sagging additiveFly ashFly ashVermiculite
Weighting agentBariteIlmeniteBarite
The ratio of anti-sagging additive (lb/bbl)444
Temperature (°F)250250250
Pressure (psi)500500300
Particle size distribution (D50) (μm)6.52221.64
Sag factor000.50210.50400.5100
4500.51510.51540.5200
Table 3. Setting of factors for the application of surface response.
VariableSymbolUnitLevel
LowHigh
Concentration of fly ashClb/bbl34
TemperatureT°F250400
Table 4. Optimization of static condition: the design of the response surface and the measured sag factors at wellbore inclinations (responses).
Run
Order
Fly
Ash Ratio (lb/bbl)
Temperature
°F
Wellbore Inclinations
CT30°45°60°70°80°90°
132500.5040000.5120670.5155750.5174930.5164820.5144890.513049
233000.5080000.5150190.5180290.5205470.5194040.5170810.515487
333500.5120000.5183100.5216370.5237960.5234960.5216020.520002
434000.5140000.5205140.5235200.5255310.5253460.5233920.521900
542500.5021000.5114670.5150750.5164930.5154820.5118890.507149
643000.5043510.5138190.5175290.5192470.5185040.5160080.511000
743500.5079000.5165100.5205370.5221300.5213960.5190020.515231
844000.5107000.5189140.5225200.5244310.5243640.5223920.519000
(Variables presented in uncoded levels).
Table 5. Coefficient and specific coefficients for static sag factor at different inclinations.
InclinationVariableCoef.SE Coef.p-Value
Constant0.5081080.0003610
C−0.001620.0002260.006
T0.0047510.0003030.001
C2−0.000410.0005080.48
C.T−0.000350.0003030.333
30°Constant0.5159360.0001470
C−0.000650.0000920.006
T0.0040250.0001230
C2−0.0001960.0002060.412
C.T−0.000270.0001230.115
45°Constant0.5194660.000240
C−0.0003870.000150.082
T0.0039590.0002010
C2−0.0002930.0003380.449
C.T−0.0001570.0002010.491
60°Constant0.5214850.0001680
C−0.0006330.0001050.009
T0.0040550.0001410
C2−0.0004980.0002360.126
C.T−0.000050.0001410.747
70°Constant0.5207350.0002760
C−0.0006230.0001720.036
T0.0045170.0002310
C2−0.0003170.0003880.474
C.T−0.0000860.0002310.735
80°Constant0.5184710.0003580
C−0.0009090.0002240.027
T0.004930.00030
C2−0.0004310.0005040.455
C.T0.0002450.00030.474
90°Constant0.5154490.0003520
C−0.0022570.000220.002
T0.0053140.0002950
C2 −0.0001750.0004950.747
C.T0.0006540.0002950.114
Table 6. Model Summary.
Static Sag InclinationR-sq (%)R-sq (adj) (%)R-sq (pred) (%)
99.0197.6986.26
30°99.7499.3897.17
45°99.2598.2495.46
60°99.6699.2096.49
70°99.2598.2493.86
80°98.9797.5993.81
90°99.3198.4095.70
Table 7. Validation of the concentration-temperature models for different oilwell inclinations.
Concentration
of Fly Ash
(lb/bbl)
Temperature
°F
Range of Model’s
Results for SF.
Range of Experimental Results for SF. % Error
CTLow–HighLow–HighLow–High
3–4 250–400 0.50897–0.526370.50400–0.514000.98611–2.40661
30°3–4250–4000.51359–0.526300.51147–0.520510.415081–1.11159
45°3–4250–4000.51835–0.532110.51508–0.523520.63583–1.64204
60°3–4 250–4000.52216–0.540190.51649–0.525531.09721–2.78937
90°3–4250–4000.50858–0.526660.50715–0.521900.28217–0.91205
Disclaimer/Publisher’s Note: The statements, opinions and data contained in all publications are solely those of the individual author(s) and contributor(s) and not of MDPI and/or the editor(s). MDPI and/or the editor(s) disclaim responsibility for any injury to people or property resulting from any ideas, methods, instructions or products referred to in the content.

