Article

Capturing Snowmelt Runoff Onset Date under Different Land Cover Types Using Synthetic Aperture Radar: Case Study of Sierra Nevada Mountains, USA

1
School of History, Nanjing University, Nanjing 210023, China
2
National Space Science Center, Chinese Academy of Sciences, Beijing 100190, China
*
Author to whom correspondence should be addressed.
Appl. Sci. 2024, 14(15), 6844; https://doi.org/10.3390/app14156844
Submission received: 5 June 2024 / Revised: 1 August 2024 / Accepted: 2 August 2024 / Published: 5 August 2024

Abstract

:
Snow plays a crucial role in the global water and energy cycles, and its melting process can have a series of impacts on hydrological or climatic systems. Accurately capturing the timing of snowmelt runoff is essential for the utilization of snow resources and the early warning of snow-related disasters. A synthetic aperture radar (SAR) offers an effective means for capturing snowmelt runoff onset dates (RODs) over large areas, but its accuracy under different land cover types remains unclear. This study focuses on the Sierra Nevada Mountains and surrounding areas in the western United States. Using a total of 3117 Sentinel-1 images from 2017 to 2023, we extracted the annual ROD based on the Google Earth Engine (GEE) platform. The satellite extraction results were validated using the ROD derived from the snow water equivalent (SWE) data from 125 stations within the study area. The mean absolute errors (MAEs) for the four land cover types—tree cover, shrubland, grassland, and bare land—are 24, 18, 18, and 16 d, respectively. It indicates that vegetation significantly influences the accuracy of the ROD captured from Sentinel-1 data. Furthermore, we analyze the variation trends in the ROD from 2017 to 2023. The average ROD captured by the stations shows an advancing trend under different land cover types, while that derived from Sentinel-1 data only exhibits an advancing trend in bare land areas. It indicates that vegetation leads to a delayed trend in the ROD captured by using Sentinel-1 data, opposite to the results from the stations. Meanwhile, the variation trends of the average ROD captured by both methods are not significant (p > 0.05) due to the impact of the extreme snowfall in 2023. Finally, we analyze the influence of the SWE on RODs under different land cover types. A significant correlation (p < 0.05) is observed between the SWE and ROD captured from both stations and Sentinel-1 data. An increase in the SWE causes a delay in the ROD, with a greater delay rate in vegetated areas. These findings will provide vital reference for the accurate acquisition of the ROD and water resources management in the study area.

1. Introduction

Snow is a critical component of the cryosphere and can cover up to about half of the land area in the Northern Hemisphere during winter [1,2]. As a crucial freshwater resource with high reflectivity, snow plays an important role in the global water cycle [3,4], freshwater supply [5,6], and climate system [7]. However, rapid seasonal snowmelt can lead to snow-related disasters such as avalanches, snowmelt floods, and glacial landslides [8,9]. Therefore, monitoring snowmelt is crucial for effective utilization of snow resources and early warning of snow-related disasters.
A key indicator in snowmelt monitoring is the onset of runoff [10,11,12,13,14,15]. According to existing studies, the snowmelt process can be divided into three phases based on snow wetness changes: the warming phase, ripening phase, and runoff phase [16,17]. In the first two phases, as temperatures gradually rise, snow begins to melt, and then the wetness increases. As temperatures continue to rise, the liquid water content in the snow exceeds its maximum water-holding capacity, leading to the release of meltwater and the formation of runoff. The date when meltwater begins to flow is defined as the runoff onset date (ROD).
The ROD can be determined based on the variation in the snow water equivalent (SWE) during the snowmelt period. During the pre-runoff phase of snowmelt, the SWE typically exhibits a continuous increase. Once the snowmelt runoff is formed, the SWE rapidly decreases [18,19]. Therefore, the date of maximum SWE can be used to estimate the initial date of the runoff [20]. However, obtaining high-precision SWE data over large areas is challenging. Remote sensing technology provides a solution for large-scale monitoring of snowmelt [21,22]. Synthetic aperture radar (SAR) data with strong penetration capabilities, can be used to capture changes in the internal parameters of snow. Microwave signals are highly sensitive to wetness, which is closely related to the ROD, making it possible to quickly and conveniently obtain the ROD using SAR data [23,24]. SAR data have high spatial resolution, reaching meter-level or even sub-meter-level, which is suitable for fine-scale monitoring of snowmelt in watersheds. An increase in wetness leads to an increase in the snow’s dielectric loss factor, thereby enhancing the absorption of SAR backscatter signals [25,26,27]. When the wetness reaches its maximum value, the SAR backscatter diminishes to its minimum. When the meltwater flows out, which marks the beginning of the runoff phase, scattering at the air–snow interface becomes dominant in the backscatter. Moreover, the backscatter will gradually increase due to the increased roughness of the snow surface. Hence, the date when the backscatter reaches its minimum can be designated as the ROD. The relationship between the snow wetness, SWE, and backscatter during the snowmelt process is illustrated in Figure 1.
Certain studies have explored the capability of a SAR to capture the ROD in different regions. Ref. [17] used the SWE data measured from five meteorological stations in the European Alps to validate the ROD captured from Sentinel-1 data during the hydrological year 2016/2017 and 2017/2018. Some scholars also used Sentinel-1 data to capture the ROD in Greenland and the Sierra Nevada mountain range of Spain, respectively. However, their studies both lacked validation through the corresponding ground measurements [28,29]. Ref. [30] explored the elevation–ROD relationship in the Cascade Range of the western United States, revealing the median absolute offset between the ROD extracted from SWE data and that from Sentinel-1 data. The results of experiments conducted by Darychuk et al. in Canada’s La Joie Basin indicate a deviation between the ROD extracted from SWE data and that from Sentinel-1 data ranging from 1 to 18 days [31]. All above-mentioned studies only analyzed the feasibility of SAR data in extracting the ROD under limited years and site conditions. However, the accuracy of the ROD extracted from SAR data is still unclear, especially when the different land cover types are considered, which will have an important impact on snowmelt [32,33,34]. In addition, there is currently a lack of analysis on multi-year ROD changes. Current discussions on the influencing factors of the ROD mainly focus on altitude, slope, and aspect, with the influence of snow parameters on the ROD often being overlooked. In addition to exploring the impact of external factors on snowmelt, it is equally important to understand the relationship between the intrinsic parameters of snow and the melt process.
This study uses the vertical–vertical (VV) polarization Sentinel-1 data during the snowmelt periods from 2017 to 2023 to extract the ROD in the Sierra Nevada Mountains of the western United States. The ROD extracted from the measured SWE under different land cover types is used to validate the ROD extracted from Sentinel-1 data. Then, we analyzed the interannual variation of the ROD and the impact of the SWE on the ROD. The main innovations of this study include: (i) Quantifying the accuracy of Sentinel-1 in identifying the ROD under different vegetation densities; (ii) Clarifying the interannual variation in the ROD under different land cover types in the study area in the context of climate change in recent years; (iii) Exploring the impact of snow’s intrinsic factor, namely the SWE, on the ROD under different land cover types.

2. Study Area and Data
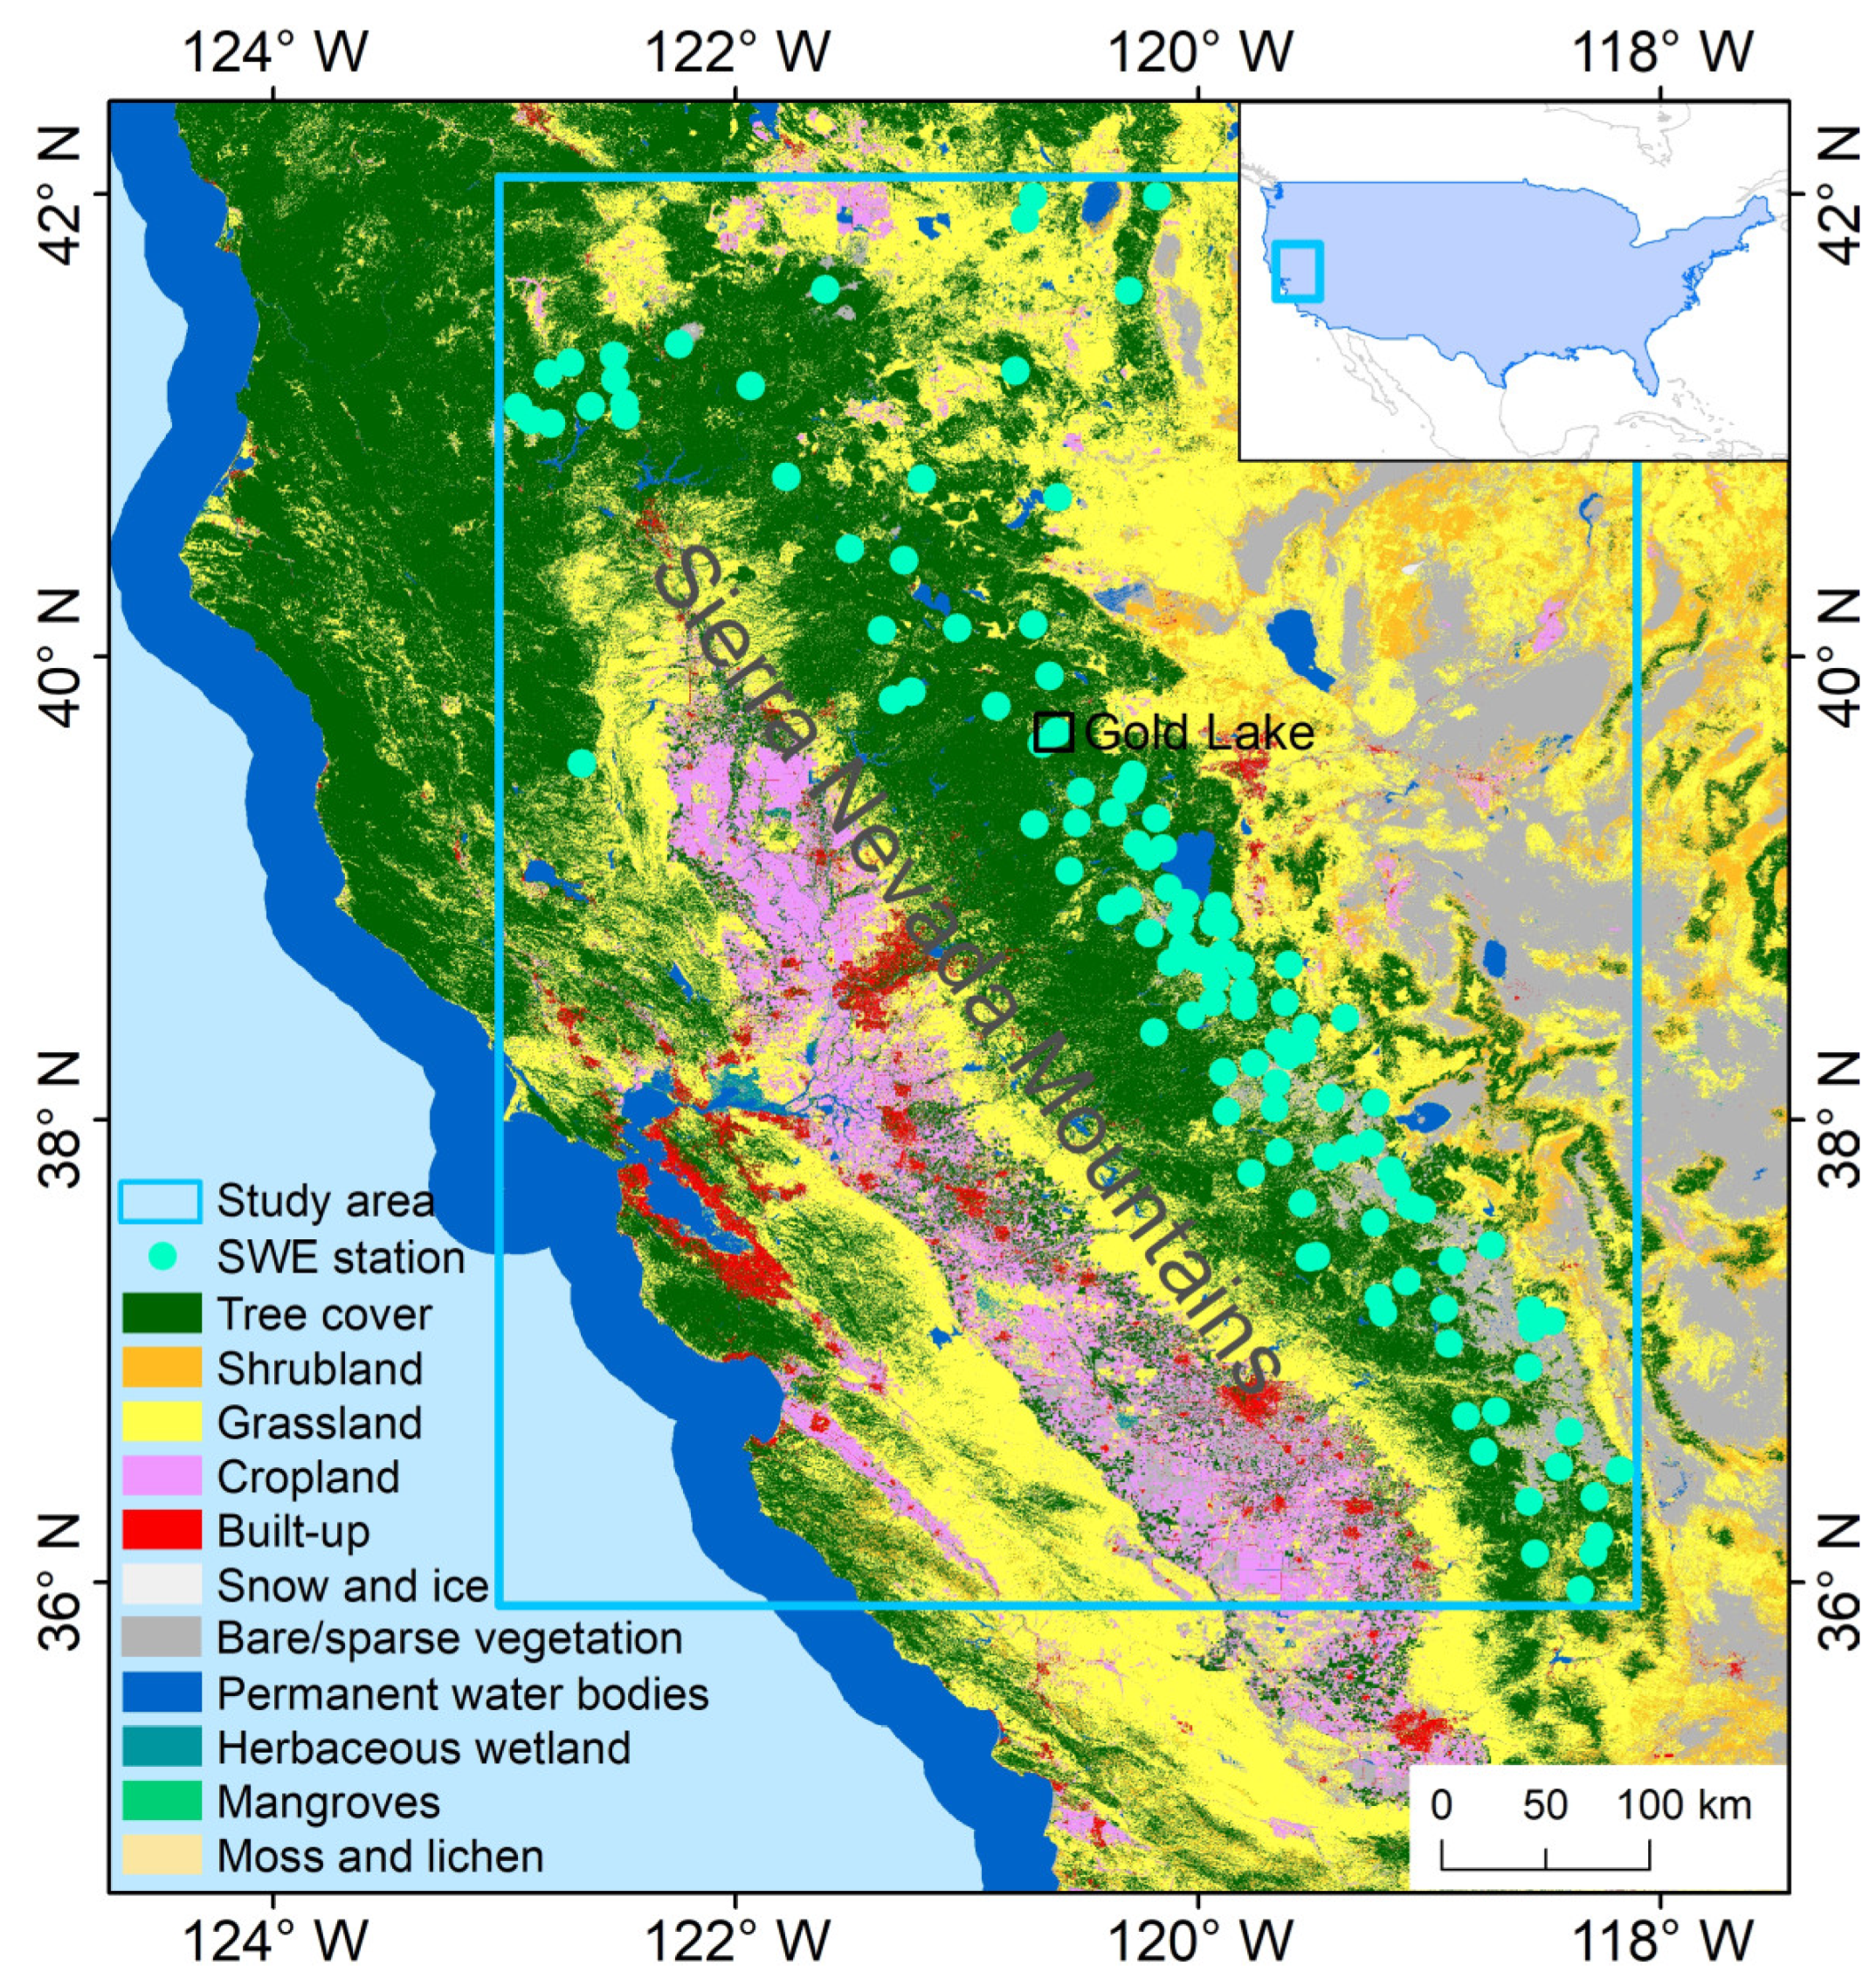
2.1. Study Area

This study focuses on the Sierra Nevada Mountains and the surrounding areas in the western United States (Figure 2). Situated between California’s Central Valley and the Great Basin, the Sierra Nevada Mountains stretch approximately 640 km from north to south, with a width ranging from 80 to 130 km from east to west. The elevation of the mountain ranges gradually increases from about 150 m in the Central Valley to around 4300 m at the peaks as it extends eastward. The variation in altitude results in diverse surface cover types in the region, including tree cover, shrubland, grassland, cropland, bare land, and so on. Due to the terrain’s elevation, significant snowfall and precipitation occur annually in the mountains, with maximum snow depths exceeding 5 m. The snow cover period mainly extends from November to July of the following year, with March to April mainly being the snowmelt period [35,36]. The snow cover in the study area serves as a primary water source and an essential source of hydroelectric power for California.

2.2. Sentinel-1 Data

The SAR data used in the study are C-band Sentinel-1 data. Sentinel-1 is an important constellation system in the Copernicus Program of the European Space Agency (ESA) (https://browser.dataspace.copernicus.eu/, accessed on 8 May 2024), comprising the Sentinel-1A and Sentinel-1B satellite, and the satellite data are available for free. Sentinel-1A was launched on 3 April 2014, and Sentinel-1B on 25 April 2016. Positioned 180° apart in the same orbit plane, they conduct the same site observations every 6 days. Regrettably, Sentinel-1B ceased data acquisition due to a malfunction by December 2021.
The Sentinel-1 data are acquired in interferometric wide swath (IW) mode with a spatial resolution of 20 m. In this study, the Level-1 Ground Range Detected (GRD) product was collected on the Google Earth Engine (GEE) platform. The specific data processing workflow are explained in the Section 3.
Based on existing studies [17,31], only VV polarization data were used in this study because they are more suitable for identifying the ROD. Due to the rapid changes in snow cover, the revisit cycle of Sentinel-1 images directly determines the accuracy of ROD identification. We conduct an annual count of the number of Sentinel-1 images corresponding to the snowmelt period (set from 1 February to 31 July in the study) for each station within the study area since 2014 (Section 2.3). The results indicate that the number of images in the melting period of the stations from 2014 to 2016 is generally less than 20, which can hardly meet monitoring requirements. Therefore, we collect the Sentinel-1 data from 2017 to 2023 in this study (with the dataset containing only Sentinel-1A data after December 2021), and explore its accuracy in extracting the ROD under different land cover types.

2.3. In Situ Data

In situ SWE data are sourced from the National Water and Climate Center (NWCC) in the United States. Partial data are gained by the center’s SNOwpack TELemetry (SNOTEL) network where the data are freely available (https://www.nrcs.usda.gov/programs-initiatives/sswsf-snow-survey-and-water-supply-forecasting-program/national-water-and, accessed on 18 May 2024). The SNOTEL network comprises 867 automated observation stations for monitoring snow conditions in the western mountainous regions of the country, with 35 located within the study area. The stations measure the SWE using snow pillow devices and pressure transducers, with an instrument measurement accuracy of up to 0.1 inches. The remaining SWE data are gained through the 90 cooperator snow sensors of the center. All these observation records are used to extract the ROD. However, prior to extracting the ROD, it is necessary to screen the stations. Firstly, some stations cannot extract the ROD for all years due to the lack of observation records. In this study, we only choose those that can extract the ROD for that year when selecting stations for a single year. Additionally, the number of Sentinel-1 images corresponding to each station also can affect the extraction accuracy. Therefore, those corresponding to fewer than 20 Sentinel-1 images are excluded based on the length of the snowmelt period in the study area. After the above screening steps, the number of ROD stations under different land cover types in various years, the annual number of Sentinel-1 images within the study area, and the minimum and maximum number of corresponding images among all stations each year, are listed in Table 1.
Figure 3 illustrates the variation in the SWE recorded at the Gold Lake station from February to July 2021, alongside the corresponding changes in the Sentinel-1 VV polarization backscatter. In late March, the snow wetness gradually increases as the melting season approaches, resulting in a decrease in backscatter. In early April, the runoff begins when the snow reaches its maximum water-holding capacity, leading to a reduction in the SWE. Subsequently, the SWE decreases rapidly with the further acceleration in melting, while the increase in snow surface roughness causes an increase in backscatter.

2.4. Land Cover Data
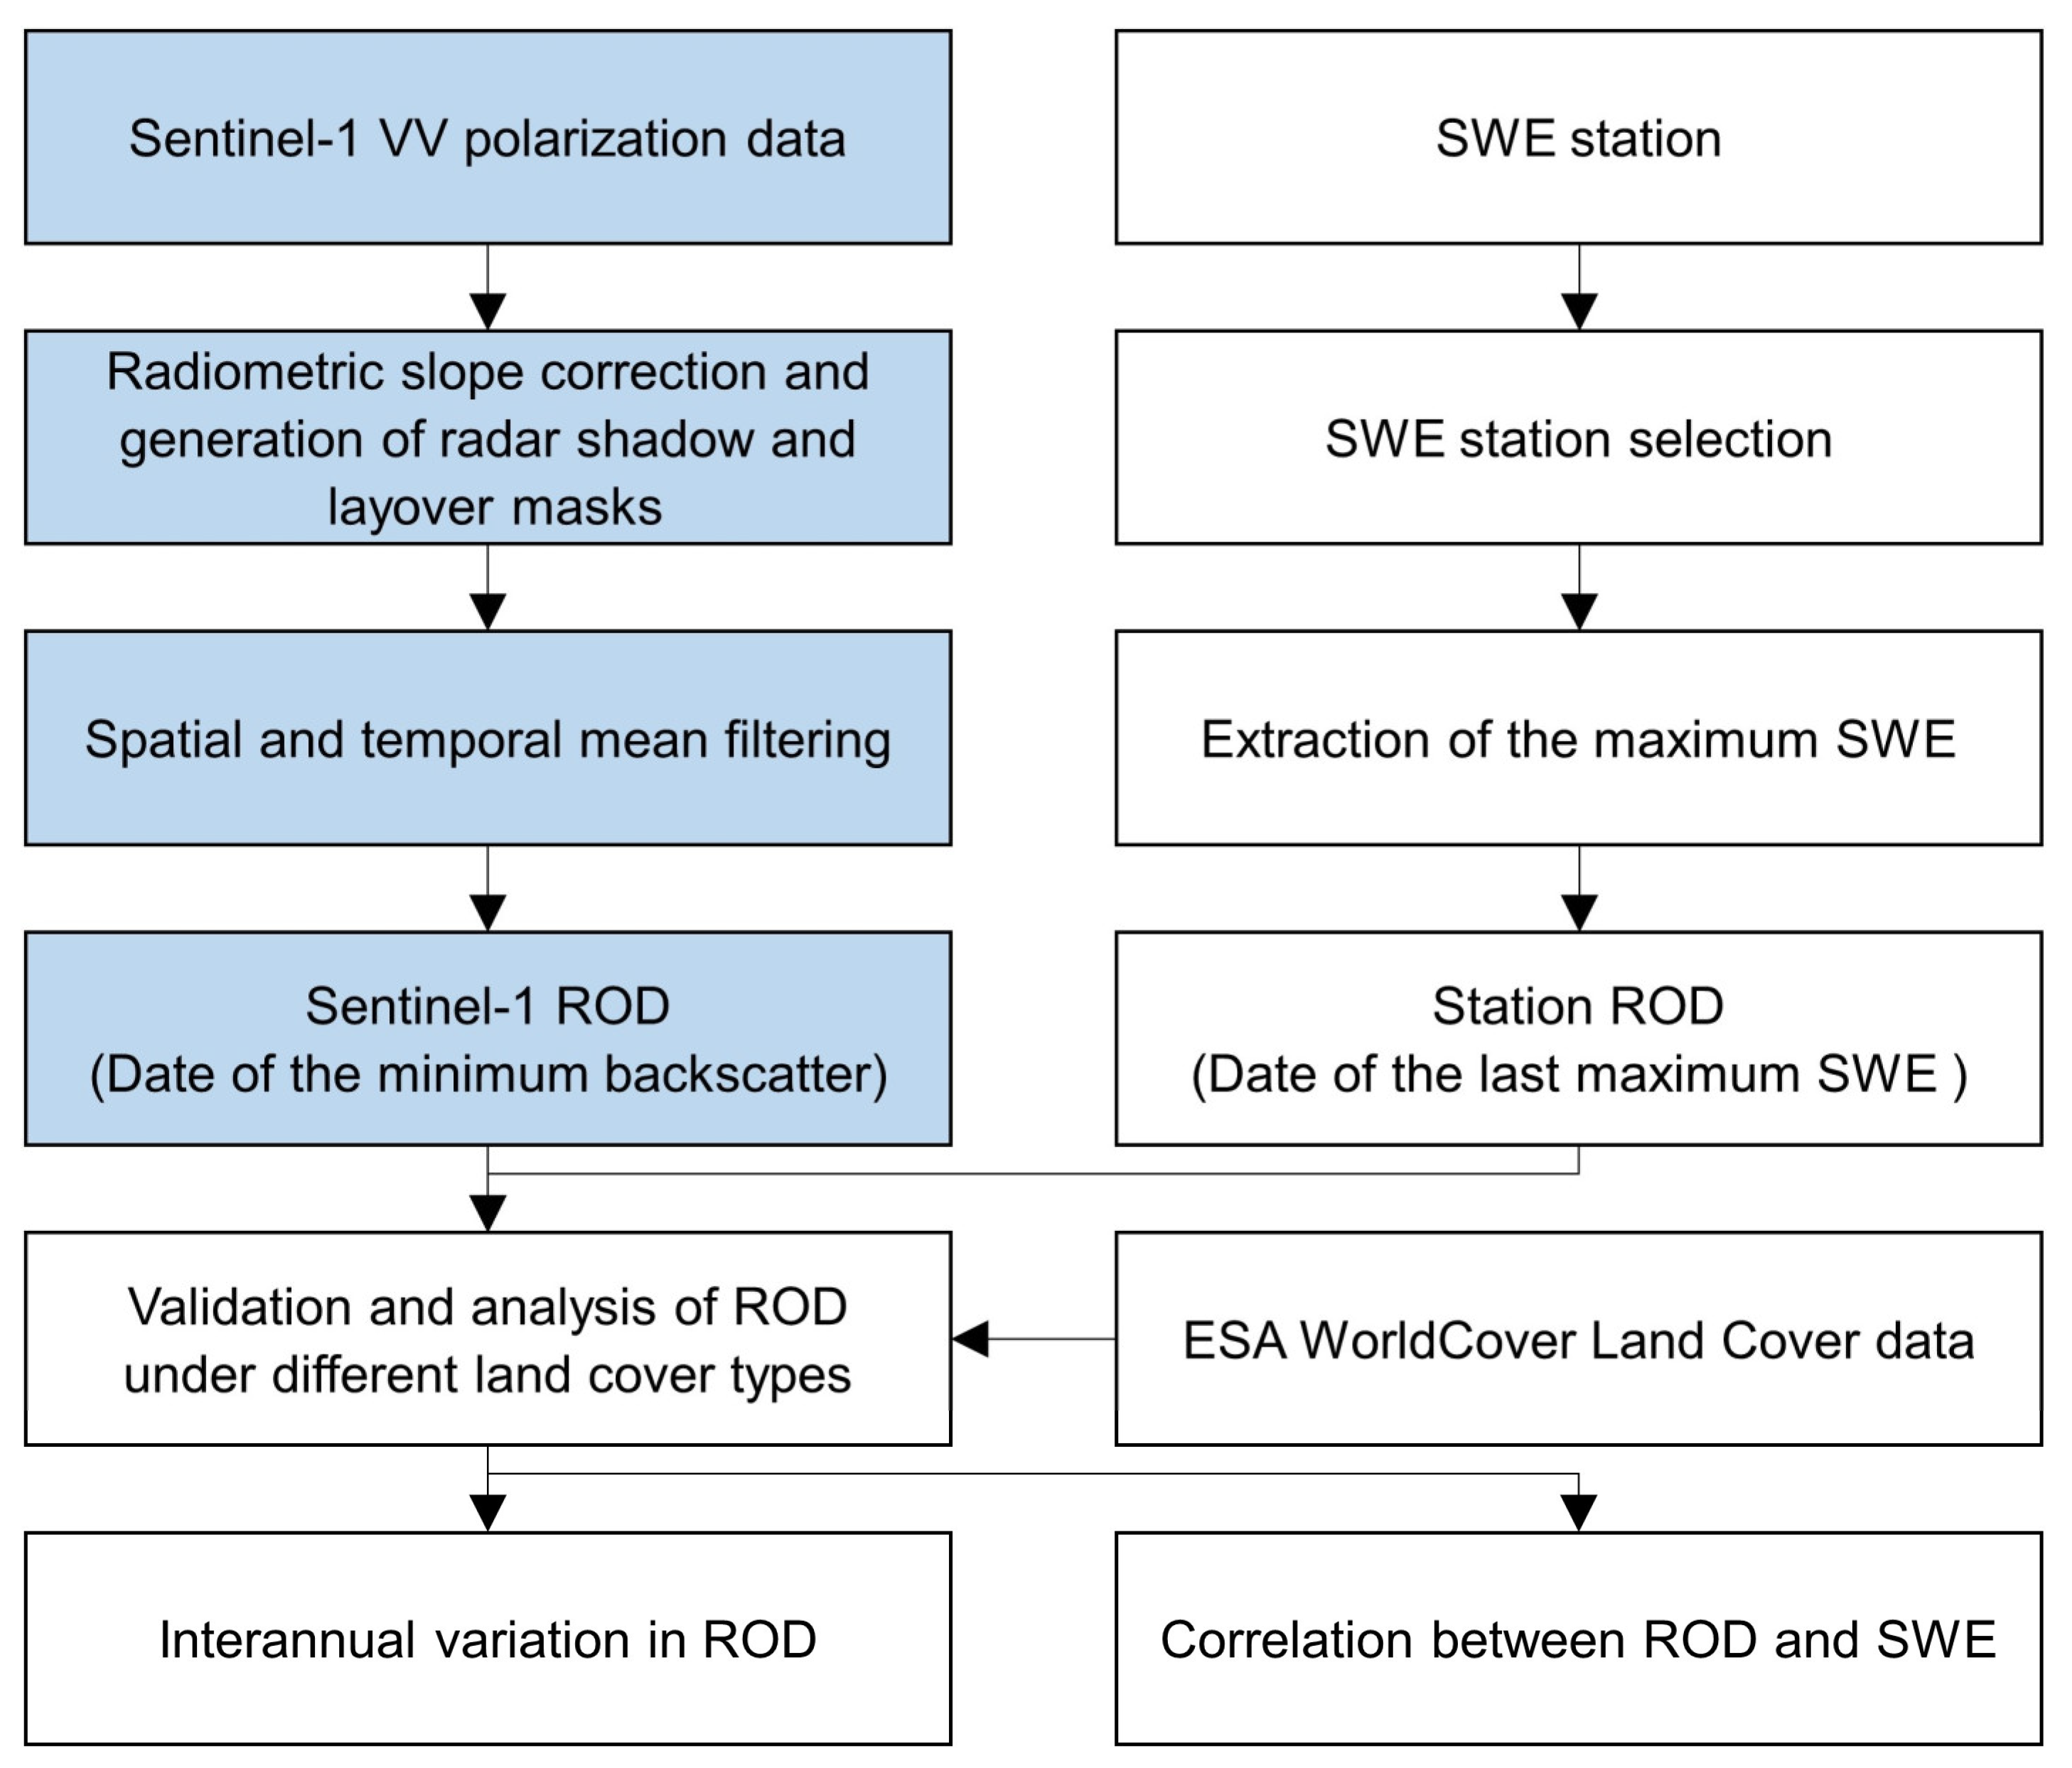
The land cover data are derived from the European Space Agency (ESA) WorldCover 10 m 2020 product for free (https://esa-worldcover.org/en, accessed on 20 May 2024) [37]. The WorldCover product provides a global land cover map for 2020 at 10-m resolution based on Sentinel-1 and Sentinel-2 data. It comprises 11 land cover types, which is consistent with the classification of land cover by the Food and Agriculture Organization (FAO) (https://www.fao.org/4/x0596e/X0596e00.htm#P-1_0, accessed on 20 May 2024). Based on this, we determine the land cover types corresponding to the stations and categorize both “Moss and lichen” and “Bare/sparse vegetation” types as bare land. Therefore, the land cover types corresponding to the stations include tree cover, shrubland, grassland, and bare land, which are also the focus of this study.

3. Method

Based on the snowmelt dynamics theory, [17] noted that during the snowmelt period, the maximum snow wetness corresponds to the minimum backscatter and maximum SWE. The ROD was extracted using changes in the SAR backscatter, and validated it with measured SWE data. This study employs the same method to extract the ROD for the study area, encompassing both Sentinel-1 data extraction and in-situ data extraction (Figure 4). The ROD extraction process for Sentinel-1 data was conducted on the GEE platform. Within the GEE platform, existing resources for Sentinel-1 GRD products are available, which are the results of previous processing steps such as thermal noise removal, radiometric calibration, and terrain correction using the Sentinel-1 Toolbox software (Version 3). However, further processing steps are still necessary, and the processing is performed in the Google Earth Engine. First, the radiometric slope correction as well as the removal of the radar shadow and layover areas should be conducted. The authors of [38] have provided the method which is used in this study. The equation of the radiometric slope correction can be expressed:
γ f 0 = σ 0 t a n 90 θ i c o s θ i t a n 90 θ i + α r
where γ f 0 is the backscatter after correction; σ 0 is the backscatter before correction; θ i is the incidence angle, which is available in the Sentinel-1 metadata; α r is the slope steepness in range, which can be written as:
α r = a r c t a n t a n α s c o s ϕ i ϕ s
where α s and ϕ s are terrain geometry factors, and ϕ i is the radar geometry factor. For their calculation methods, please refer to [38]. The shadow and layover areas can be obtained using:
s h a d o w :   α r < 90 θ i
l a y o v e r :   α r > θ i
Subsequently, temporal-spatial filtering is also necessary to further reduce the SAR image noise and mitigate the effects of short-term snowmelt on microwave signals. Considering the large dataset, a highly efficient mean filtering is employed for the temporal–spatial filtering. Spatial filtering is performed using a mean filter with a window size of 3 × 3 pixels. Temporal filtering is performed using a mean filter with a window size of 5 observations. Following these steps, the resulting image spatial resolution is 20 m.
The processed SAR data include observations from both the Sentinel-1A and Sentinel-1B satellites, covering both ascending and descending orbit modes. This results in variations in both the data acquisition time and the observational geometry for the same geographical area. However, we analyze all available data to improve the revisit frequency, given the rapid changes in snow during the melting period. Additionally, wetness is considered the primary factor affecting the SAR backscatter during the melting period. Hence, differences in data acquisition time and observational geometry for the same area were ignored in this study. Combining these considerations, the date of the minimum occurrence of VV polarization backscatter within the snowmelt period from 1 February to 31 July is identified as the ROD.
The maximum SWE at the selected stations is calculated within the snowmelt period, and the date on which this maximum value occurs is taken as the ROD. If the SWE remains at its maximum value for several consecutive days, we use the last day as the ROD. We also exclude the stations where the ROD extracted from Sentinel-1 occurs after the date when the SWE reaches 0 cm to ensure the rationality of the results. Then, we use the ROD extracted from stations to validate that extracted from Sentinel-1 data under different land cover types, and analyze the interannual variation in the ROD and the relationship between the ROD and SWE.

4. Results

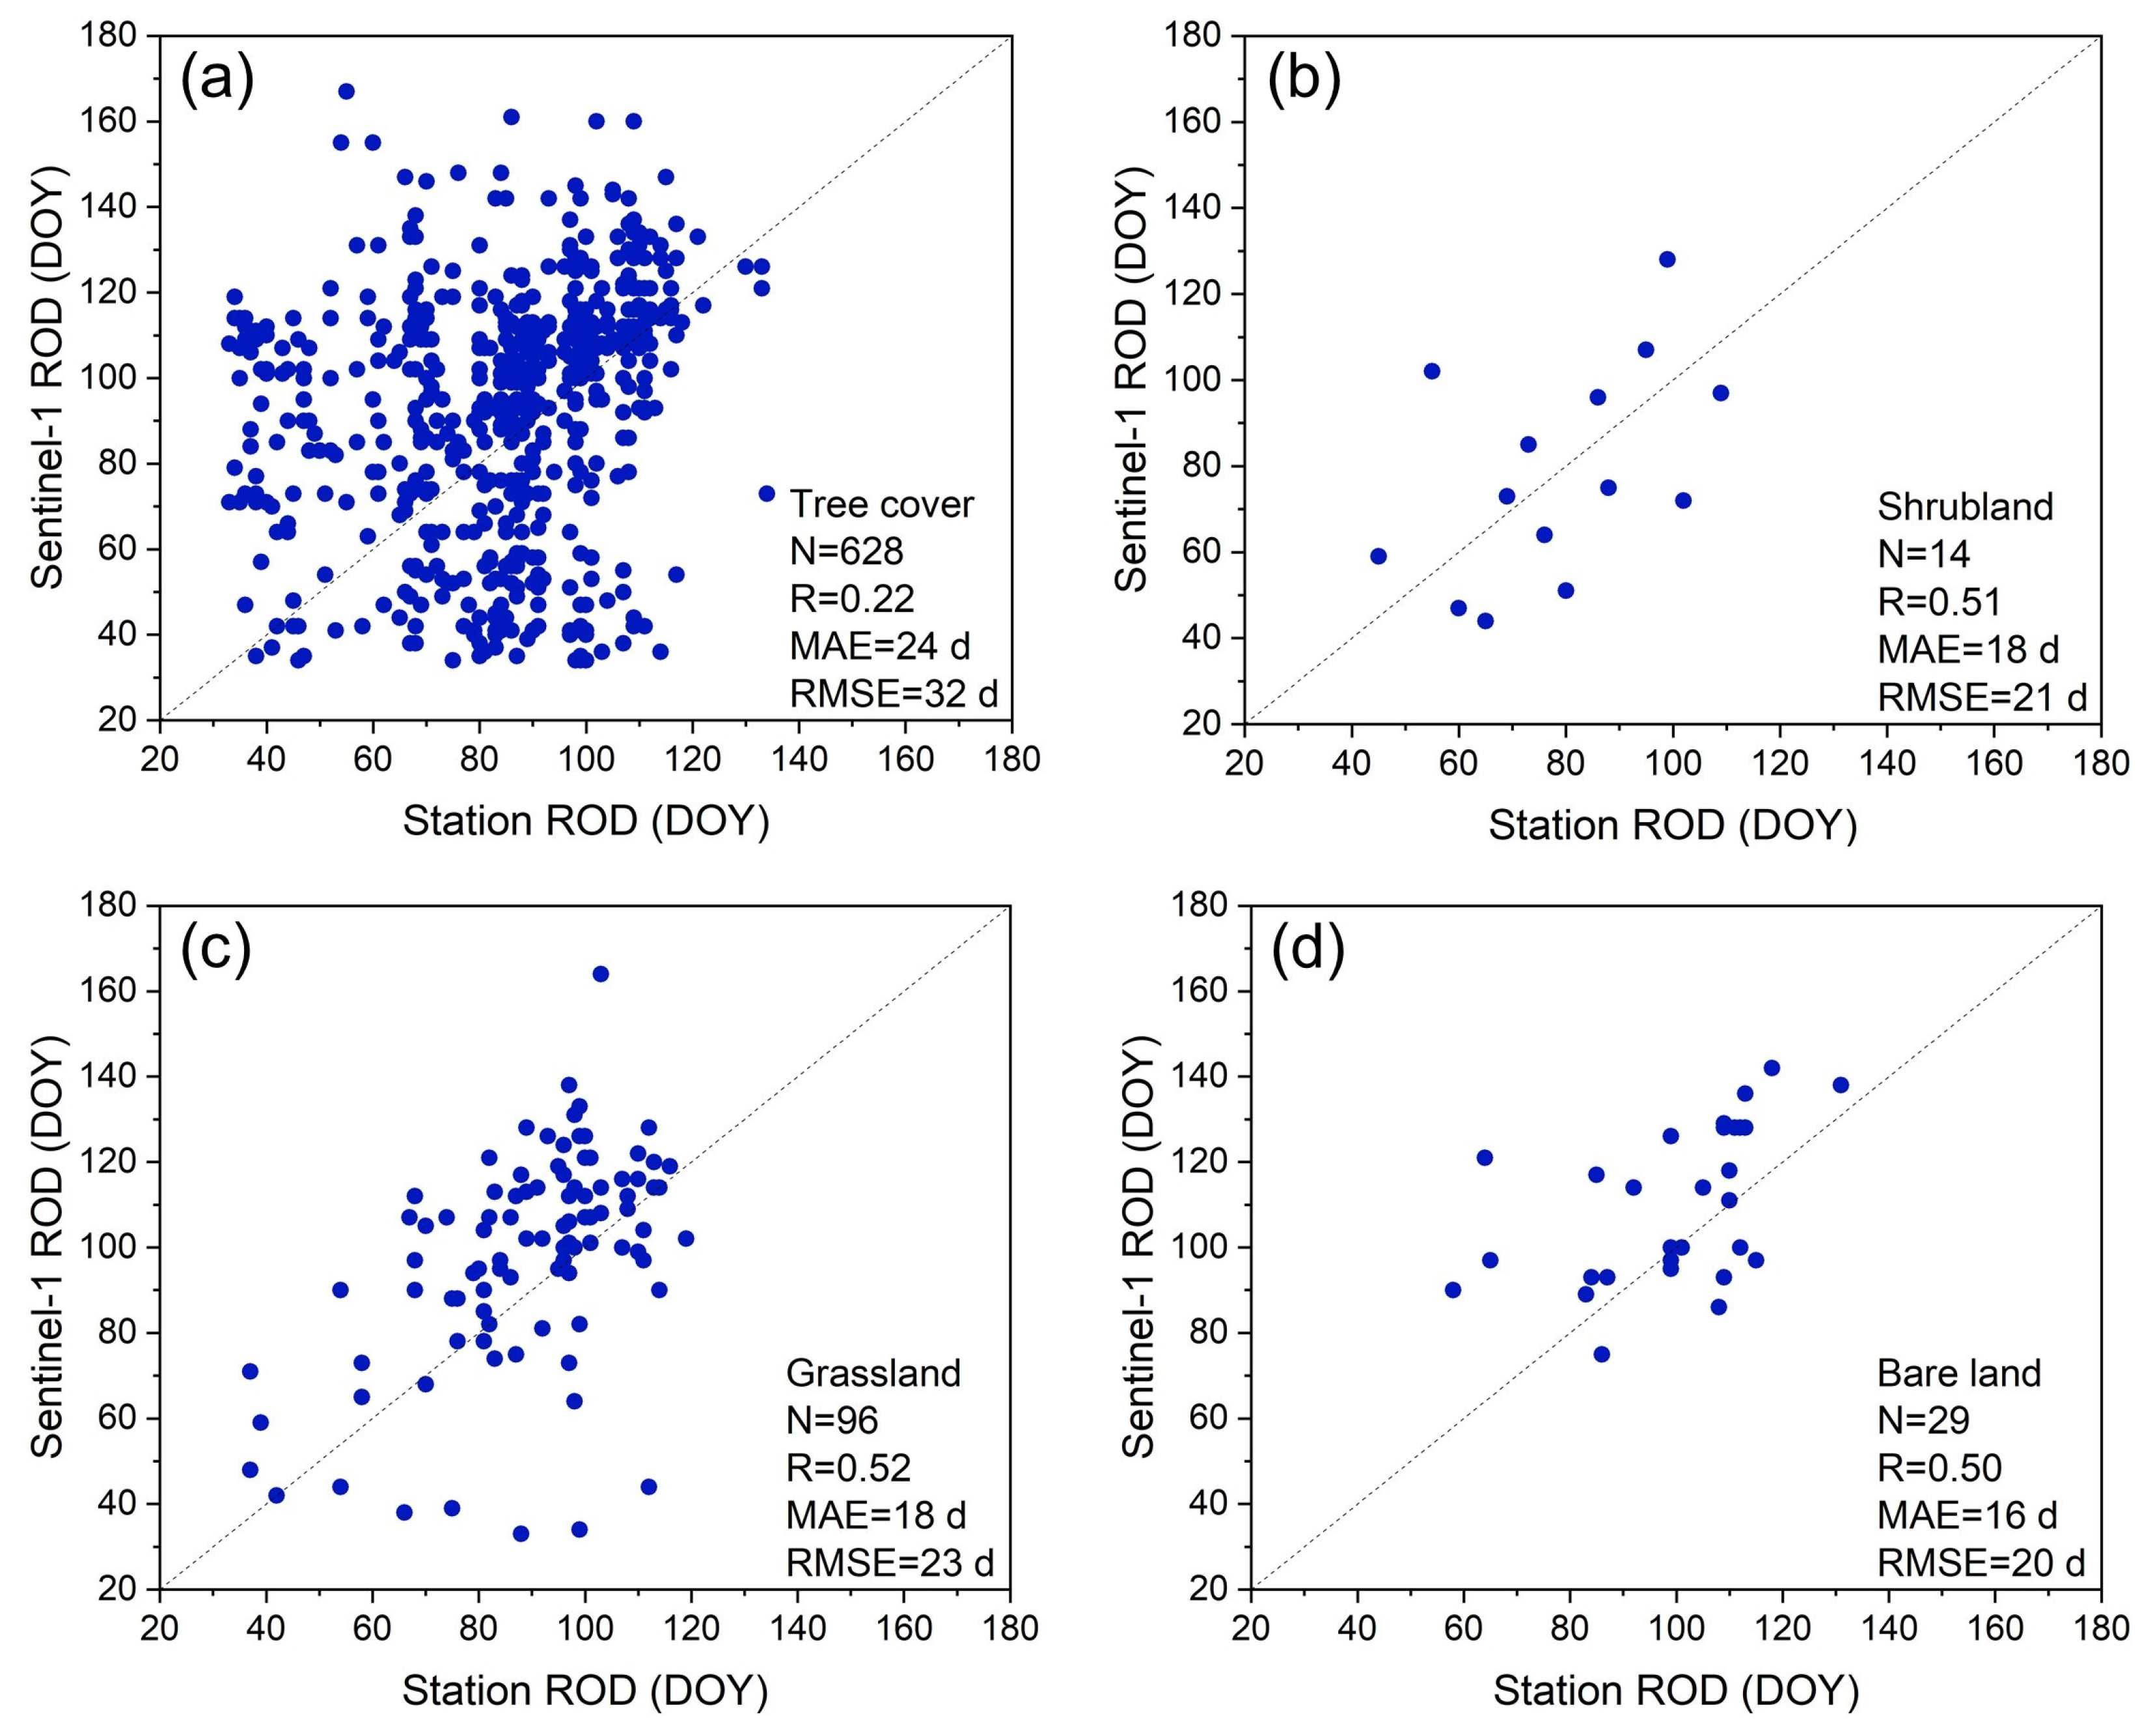
4.1. Validation of the Extracted ROD

The ROD extracted from the measured SWE was used to validate the accuracy of that extracted from Sentinel-1 data (Figure 5). It shows that bare land has the highest accuracy among all land cover types. The correlation coefficient (R), mean absolute error (MAE), and root-mean-square error (RMSE) between the ROD of stations and that of Sentinel-1 are 0.50, 16 d, and 20 d, respectively. The accuracy of the tree cover is the lowest, with the R of 0.22, the MAE of 24 d, and the RMSE of 32 d. The accuracy for shrubland and grassland was similar, falling between that of bare land and tree cover. The R for shrubland and grassland are 0.51 and 0.52, respectively. The MAE are both 18 d, and the RMSE are 21 d and 23 d, respectively.
The above results confirm that vegetation significantly affects the accuracy of the ROD extracted from C-band SAR data. Especially in densely vegetated areas, the accuracy of the tree cover is the lowest with the MAE of 24 d. Therefore, it is necessary to improve the accuracy of the ROD.
Using 2023 as an example, Figure 6 presents the spatial distribution of the ROD extracted by Sentinel-1 under four land cover types in the study area and the area proportions of different land cover types at different runoff onset dates. The ROD in the tree cover area mainly concentrates in middle and late March. In the subsequent period, the proportion of tree cover land decreases in the areas where the ROD occurs. The ROD of grassland and bare land is mainly concentrated in June.

4.2. Interannual Variation in ROD

To evaluate how snowmelt is affected by different land cover types, ROD changes were analyzed in the study area from 2017 to 2023. Since not every station can extract the ROD every year, we first filtered the stations to ensure the consistency in multi-year analysis, retaining only those that can extract the ROD in all years. The numbers of retained stations for tree cover, shrubland, grassland, and bare land were 65, 2, 7, and 2, respectively. Then, the average ROD was calculated using results from both station and Sentinel-1 data for each land cover type annually and we analyzed their trends (Figure 7).
Figure 7 shows that the average ROD extracted from station data exhibits an advance in areas of tree cover, shrubland, and grassland, with the number of days advanced each year approximately 1.7, 2.2, and 0.6 d, respectively. However, the average ROD extracted from Sentinel-1 data shows a trend in the delay, with the number of days delayed each year being approximately 1.3, 4.9, and 1.7 d, respectively. In bare land, the average ROD extracted from the two methods both exhibit the advancing trend with similar rates of change. The average ROD extracted from station data advances by approximately 0.8 d per year, while that extracted from Sentinel-1 data advances by approximately 1.1 d per year. These results illustrate the impact of vegetation on ROD extraction from Sentinel-1 data, resulting in an opposite trend between the average ROD extracted from Sentinel-1 and that extracted at the stations. However, regardless of the ROD extraction method, the annual ROD trends for all land cover types from 2017 to 2023 are not significant, with all p values greater than 0.05.
Based solely on station observations, the annual advance in the average ROD for tree cover, shrubland, grassland, and bare land areas is approximately 1.7, 2.2, 0.6, and 1.1 d, respectively. In areas with higher vegetation density, the variation in average ROD is more obvious, primarily because vegetation traps blowing snow and increases radiation exchanges, thereby causing earlier snowmelt [39]. An advance in the ROD observed at stations is consistent with some recent research findings, indicating that snow in the western United States has been experiencing earlier melting in recent years [10,11].
In 2023, there was a significant delay in the average ROD across all land cover types. Based on station observations, the average ROD for the four land cover types in 2023 was delayed by 28.2, 20.0, 19.1, and 28.5 d, respectively, compared to 2022. The variation in the average ROD extracted from Sentinel-1 data is similar. The phenomenon has significantly influenced the trend in the average ROD extracted by Sentinel-1 from 2017 to 2023. Especially in vegetated areas, the average ROD extracted by Sentinel-1 and that extracted at the stations show opposite trends. It is also the main reason why the trends in the average ROD extracted by the two methods from 2017 to 2023 are not significant (p > 0.05).
According to the station observations, an extreme snowfall event occurred in the study area in 2023 with the SWE in some stations reaching the highest on the record. To explore the impact of the unusual snowfall on the delay of the ROD, we calculate the annual average SWE for stations under different land cover types (Figure 8). These stations are consistent with those used in Figure 7.
Figure 8 shows that in 2023, the average SWE for the four land cover types—tree cover, shrubland, grassland, and bare land—reached their maximum values of 141.6, 98.4, 120.6, and 248.8 cm, respectively. Correspondingly, the average ROD for these land cover types exhibited a significant delay in the same year (Figure 7). Similarly, in 2017 and 2019, the average SWE shows a peak, and the average ROD observed at the stations shows a corresponding delay of varying degrees. These results indicate the control of the SWE on the ROD. We will further explore the relationship between the two in Section 4.3.

4.3. SWE’s Control on the ROD

In the previous section, we find that an increase in the SWE leads to a delay in the ROD. To further explore the control of the SWE on the ROD, we firstly fit the relationship between the SWE and ROD (Figure 9). The results for all four land cover types show a significant positive correlation (p < 0.05) between the two. In other words, as the SWE increases, the ROD consequently exhibits a delay. The extent of vegetation cover also affects the magnitude of the correlation between them. In tree cover areas, the correlation is the weakest with R2 being 0.22. In grassland and bare land areas, the R2 are 0.23 and 0.3, respectively. In shrubland areas, the R2 reaches 0.4, while further validation will be necessary in the future by increasing the samples considering that there are only 14 samples in the area. Tree cover and shrubland areas, which are more heavily vegetated, have a greater rate of delay than grassland and bare land. The delay rates for the four land cover types are 0.2, 0.3, 0.1, and 0.1, respectively.
The fitting relationship between the ROD extracted from Sentinel-1 data and the SWE shows similar results (Figure 10). As the SWE increases, the ROD for all four land cover types is significantly delayed (p < 0.05). Except for the shrubland area with fewer samples, the correlation is weakest in the tree cover area and greatest in the bare land. Areas covered with vegetation also showed greater ROD delay rates.

5. Discussion

5.1. Effect of Parameters Besides Wetness on ROD Extraction from SAR Data

Wetness is the primary parameter influencing the SAR backscatter during the snowmelt period. The theoretical basis for using SAR backscatter to extract the ROD is that the date of maximum wetness corresponds to the date of minimum backscatter, which defines the ROD. However, under certain conditions, other parameters besides wetness may cause the two dates to be inconsistent, resulting in inaccurate ROD extraction based on the backscatter.
Besides wetness, other intrinsic attributes of snow such as density, grain size, depth, and surface roughness also have an influence on the SAR backscatter [24,40,41]. The impact of SWE on the ROD discussed in Section 4.3 can be seen as the combined effect of density and snow depth. Additionally, SAR parameters, such as the polarization mode and local incidence angle, as well as underlying surface parameters, such as type and roughness, also affect the SAR backscatter. During the melting process, the magnitude of their respective influences also changes, thereby limiting the accuracy of ROD extraction to varying degrees.
Extracting the ROD based on wetness is an effective way to improve the accuracy, but the multitude of backscatter-influencing parameters makes it challenging to retrieve snow wetness using SAR data. Existing retrieval algorithms mainly use full polarization [42,43,44] or VV and HH polarization data [45,46]. However, these algorithms are not applicable to Sentinel-1 data, making it impossible to extract the ROD based on the variations in wetness. Therefore, quantitatively assessing the role of different parameters in snow wetness retrieval and developing more universal wetness retrieval algorithms will help improve the accuracy of ROD extraction.

5.2. Effect of Sentinel-1 Temporal Resolution on ROD Extraction

Snowmelt is a rapidly changing process. This variation is evident not only between different dates but also within a single day, as snowmelt conditions can significantly differ due to changes in temperature or sunlight. Therefore, monitoring snowmelt requires high temporal resolution. However, due to the high-resolution imaging characteristics of SAR satellites and the limitation of their relatively small number, achieving high-frequency monitoring over large areas is currently a challenge. The Sentinel-1 data used in this study include data from both the A and B satellites, as well as ascending and descending orbit data. The orbits and times of Sentinel-1A and Sentinel-1B crossings are shown in Table 2.
To enhance the temporal resolution, we utilize all available data while disregarding differences in acquisition times. Part of the discrepancy between the ROD extracted from SAR data and that from the SWE can be attributed to the insufficient temporal resolution of SAR data. Combining multiple sources of SAR data, such as Radarsat-2, GaoFen-3, etc., is an effective way to improve the temporal resolution. The upcoming launch of Sentinel-1C will also help compensate for data gaps resulting from the damage to Sentinel-1B.

5.3. Future Work

The validation results indicate a significant decrease in the accuracy of the ROD extraction when C-band microwave signals are influenced by vegetation. In contrast, the L-band, with its stronger penetration capability, is more suitable for snowmelt monitoring in vegetated areas. Currently available L-band satellite data include ALOS-2 with a 14-day revisit cycle and LT-1 with an 8-day single satellite and 4-day dual satellite revisit cycle. Additionally, the upcoming NASA-ISRO SAR (NISAR) Mission plans a revisit cycle of 12 days. We plan to use L-band data to extract the ROD and compare the results with those obtained from the C-band.
We explored the potential of Sentinel-1 data for the ROD extraction under different land cover types in this study. However, we only analyzed the ROD in the Sierra Nevada Mountains of the western United States, leaving the annual ROD variations in other regions unclear. In future research, we will further utilize the GEE platform to analyze the differences in ROD variations among different regions.

6. Conclusions

In this study, we evaluated the accuracy of the ROD extraction from Sentinel-1 data under different vegetation densities, analyzed the interannual variation in RODs in the study area, and explored the controlling effect of SWE on the ROD. Under different land cover types, the accuracy of the ROD extracted from Sentinel-1 data decreases with increasing vegetation density. The MAE for tree cover, shrubland, grassland, and bare land areas are 24, 18, 18, and 16 d, respectively. The ROD extracted from SWE data shows an advancing trend from 2017 to 2023, and in the areas with higher vegetation density, the advancing trend is more obvious. However, the ROD extracted from Sentinel-1 data, except in bare land areas, exhibits a delaying trend. The reasons for this difference include the influence of vegetation and an extreme snowfall event that occurred in the study area in 2023. The extreme snowfall event is also a major factor contributing to the non-significant trends (p > 0.05) of either an advancement or delay in the ROD extracted by the two methods. Moreover, we found that the SWE and ROD are positively correlated, and the correlation is significant (p < 0.05). When the SWE increases, the ROD shows a significant delay, with a greater delay rate observed in vegetated areas. These findings provide a reference for error analysis in extracting the ROD from SAR data and offer insights for improving subsequent ROD extraction models. In the future, we will try to use L-band SAR data to reduce the influence of vegetation on ROD extraction, and analyze the inter-annual changes in the ROD in other regions of the world.

Author Contributions

Conceptualization, B.G. and W.M.; methodology, W.M.; software, B.G.; validation, W.M.; formal analysis, B.G.; investigation, B.G.; data curation, B.G.; writing—original draft preparation, B.G.; writing—review and editing, W.M.; visualization, B.G.; supervision, W.M. All authors have read and agreed to the published version of the manuscript.

Funding

This research received no external funding.

Institutional Review Board Statement

Not applicable.

Informed Consent Statement

Not applicable.

Data Availability Statement

The original data presented in the study are openly available. The URLs are referred to in the main text.

Acknowledgments

The authors would like to thank Google and the National Water and Climate Center (NWCC) for free access to the Google Earth Engine and the SWE data.

Conflicts of Interest

The authors declare no conflicts of interest.

References

  1. Hall, D.K.; Riggs, G.A.; Salomonson, V.V. Development of Methods for Mapping Global Snow Cover Using Moderate Resolution Imaging Spectroradiometer Data. Remote Sens. Environ. 1995, 54, 127–140. [Google Scholar] [CrossRef]
  2. Dietz, A.J.; Kuenzer, C.; Gessner, U.; Dech, S. Remote Sensing of Snow—A Review of Available Methods. Int. J. Remote Sens. 2012, 33, 4094–4134. [Google Scholar] [CrossRef]
  3. Rittger, K.; Painter, T.H.; Dozier, J. Assessment of Methods for Mapping Snow Cover from MODIS. Adv. Water Resour. 2013, 51, 367–380. [Google Scholar] [CrossRef]
  4. Bormann, K.J.; Brown, R.D.; Derksen, C.; Painter, T.H. Estimating Snow-Cover Trends from Space. Nat. Clim. Chang. 2018, 8, 924–928. [Google Scholar] [CrossRef]
  5. Tang, Z.; Deng, G.; Hu, G.; Zhang, H.; Pan, H.; Sang, G. Satellite Observed Spatiotemporal Variability of Snow Cover and Snow Phenology over High Mountain Asia from 2002 to 2021. J. Hydrol. 2022, 613, 128438. [Google Scholar] [CrossRef]
  6. Han, J.; Liu, Z.; Woods, R.; McVicar, T.R.; Yang, D.; Wang, T.; Hou, Y.; Guo, Y.; Li, C.; Yang, Y. Streamflow Seasonality in a Snow-Dwindling World. Nature 2024, 629, 1075–1081. [Google Scholar] [CrossRef]
  7. Dharpure, J.K.; Patel, A.; Goswami, A.; Kulkarni, A.V. Snehmani Spatiotemporal Snow Cover Characterization and Its Linkage with Climate Change over the Chenab River Basin, Western Himalayas. Gisci. Remote Sens. 2020, 57, 882–906. [Google Scholar] [CrossRef]
  8. Huang, X.; Deng, J.; Ma, X.; Wang, Y.; Feng, Q.; Hao, X.; Liang, T. Spatiotemporal Dynamics of Snow Cover Based on Multi-Source Remote Sensing Data in China. Cryosphere 2016, 10, 2453–2463. [Google Scholar] [CrossRef]
  9. Karas, A.; Karbou, F.; Giffard-Roisin, S.; Durand, P.; Eckert, N. Automatic Color Detection-Based Method Applied to Sentinel-1 SAR Images for Snow Avalanche Debris Monitoring. IEEE Trans. Geosci. Remote Sens. 2022, 60, 1–17. [Google Scholar] [CrossRef]
  10. Xiao, M. A Warning of Earlier Snowmelt. Nat. Clim. Chang. 2021, 11, 380–381. [Google Scholar] [CrossRef]
  11. Musselman, K.N.; Addor, N.; Vano, J.A.; Molotch, N.P. Winter Melt Trends Portend Widespread Declines in Snow Water Resources. Nat. Clim. Chang. 2021, 11, 418–424. [Google Scholar] [CrossRef] [PubMed]
  12. Barnett, T.P.; Adam, J.C.; Lettenmaier, D.P. Potential Impacts of a Warming Climate on Water Availability in Snow-Dominated Regions. Nature 2005, 438, 303–309. [Google Scholar] [CrossRef] [PubMed]
  13. Biemans, H.; Siderius, C.; Lutz, A.F.; Nepal, S.; Ahmad, B.; Hassan, T.; von Bloh, W.; Wijngaard, R.R.; Wester, P.; Shrestha, A.B.; et al. Importance of Snow and Glacier Meltwater for Agriculture on the Indo-Gangetic Plain. Nat. Sustain. 2019, 2, 594–601. [Google Scholar] [CrossRef]
  14. Wang, X.; Wang, T.; Guo, H.; Liu, D.; Zhao, Y.; Zhang, T.; Liu, Q.; Piao, S. Disentangling the Mechanisms behind Winter Snow Impact on Vegetation Activity in Northern Ecosystems. Global. Change Biol. 2018, 24, 1651–1662. [Google Scholar] [CrossRef] [PubMed]
  15. Zheng, J.; Jia, G.; Xu, X. Earlier Snowmelt Predominates Advanced Spring Vegetation Greenup in Alaska. Agric. For. Meteorol. 2022, 315, 108828. [Google Scholar] [CrossRef]
  16. Dingman, S.L. Physical Hydrology, 3rd ed.; Waveland Press: Long Grove, IL, USA, 2015. [Google Scholar]
  17. Marin, C.; Bertoldi, G.; Premier, V.; Callegari, M.; Brida, C.; Hürkamp, K.; Tschiersch, J.; Zebisch, M.; Notarnicola, C. Use of Sentinel-1 Radar Observations to Evaluate Snowmelt Dynamics in Alpine Regions. Cryosphere 2020, 14, 935–956. [Google Scholar] [CrossRef]
  18. Colombo, R.; Garzonio, R.; Di Mauro, B.; Dumont, M.; Tuzet, F.; Cogliati, S.; Pozzi, G.; Maltese, A.; Cremonese, E. Introducing Thermal Inertia for Monitoring Snowmelt Processes With Remote Sensing. Geophys. Res. Lett. 2019, 46, 4308–4319. [Google Scholar] [CrossRef]
  19. Tsai, Y.-L.S.; Klein, I.; Dietz, A.; Oppelt, N. Monitoring Large-Scale Inland Water Dynamics by Fusing Sentinel-1 SAR and Sentinel-3 Altimetry Data and by Analyzing Causal Effects of Snowmelt. Remote Sens. 2020, 12, 3896. [Google Scholar] [CrossRef]
  20. Premier, V.; Marin, C.; Bertoldi, G.; Barella, R.; Notarnicola, C.; Bruzzone, L. Exploring the Use of Multi-Source High-Resolution Satellite Data for Snow Water Equivalent Reconstruction over Mountainous Catchments. Cryosphere 2023, 17, 2387–2407. [Google Scholar] [CrossRef]
  21. Liang, D.; Guo, H.; Zhang, L.; Cheng, Y.; Zhu, Q.; Liu, X. Time-Series Snowmelt Detection over the Antarctic Using Sentinel-1 SAR Images on Google Earth Engine. Remote Sens. Environ. 2021, 256, 112318. [Google Scholar]
  22. Gao, L.; Zhang, L.; Shen, Y.; Zhang, Y.; Ai, M.; Zhang, W. Modeling Snow Depth and Snow Water Equivalent Distribution and Variation Characteristics in the Irtysh River Basin, China. Appl. Sci. 2021, 11, 8365. [Google Scholar] [CrossRef]
  23. Karbou, F.; Veyssière, G.; Coleou, C.; Dufour, A.; Gouttevin, I.; Durand, P.; Gascoin, S.; Grizonnet, M. Monitoring Wet Snow Over an Alpine Region Using Sentinel-1 Observations. Remote Sens. 2021, 13, 381. [Google Scholar] [CrossRef]
  24. Antropova, Y.K.; Komarov, A.S.; Richardson, M.; Millard, K.; Smith, K. Detection of Wet Snow in the Arctic Tundra from Time-Series Fully-Polarimetric RADARSAT-2 Images. Remote Sens. Environ. 2022, 283, 113305. [Google Scholar] [CrossRef]
  25. Nagler, T.; Rott, H. Retrieval of Wet Snow by Means of Multitemporal SAR Data. IEEE Trans. Geosci. Remote Sens. 2000, 38, 754–765. [Google Scholar] [CrossRef]
  26. Ulaby, F.; Long, D.; Blackwell, W.; Elachi, C.; Fung, A.; Ruf, C.; Sarabandi, K.; Zyl, J.; Zebker, H. Microwave Radar and Radiometric Remote Sensing; University of Michigan Press: Ann Arbor, MI, USA, 2014. [Google Scholar]
  27. Nagler, T.; Rott, H.; Ripper, E.; Bippus, G.; Hetzenecker, M. Advancements for Snowmelt Monitoring by Means of Sentinel-1 SAR. Remote Sens. 2016, 8, 348. [Google Scholar] [CrossRef]
  28. Buchelt, S.; Skov, K.; Rasmussen, K.K.; Ullmann, T. Sentinel-1 Time Series for Mapping Snow Cover Depletion and Timing of Snowmelt in Arctic Periglacial Environments: Case Study from Zackenberg and Kobbefjord, Greenland. Cryosphere 2022, 16, 625–646. [Google Scholar] [CrossRef]
  29. Torralbo, P.; Pimentel, R.; Polo, M.J.; Notarnicola, C. Characterizing Snow Dynamics in Semi-Arid Mountain Regions with Multitemporal Sentinel-1 Imagery: A Case Study in the Sierra Nevada, Spain. Remote Sens. 2023, 15, 5365. [Google Scholar] [CrossRef]
  30. Gagliano, E.; Shean, D.; Henderson, S.; Vanderwilt, S. Capturing the Onset of Mountain Snowmelt Runoff Using Satellite Synthetic Aperture Radar. Geophys. Res. Lett. 2023, 50, e2023GL105303. [Google Scholar] [CrossRef]
  31. Darychuk, S.E.; Shea, J.M.; Menounos, B.; Chesnokova, A.; Jost, G.; Weber, F. Snowmelt Characterization from Optical and Synthetic-Aperture Radar Observations in the La Joie Basin, British Columbia. Cryosphere 2023, 17, 1457–1473. [Google Scholar] [CrossRef]
  32. Toure, A.M.; Luojus, K.; Rodell, M.; Beaudoing, H.; Getirana, A. Evaluation of Simulated Snow and Snowmelt Timing in the Community Land Model Using Satellite-Based Products and Streamflow Observations. J. Adv. Model Earth. Sy. 2018, 10, 2933–2951. [Google Scholar] [CrossRef]
  33. Connon, R.F.; Chasmer, L.; Haughton, E.; Helbig, M.; Hopkinson, C.; Sonnentag, O.; Quinton, W.L. The Implications of Permafrost Thaw and Land Cover Change on Snow Water Equivalent Accumulation, Melt and Runoff in Discontinuous Permafrost Peatlands. Hydrol. Process 2021, 35, e14363. [Google Scholar] [CrossRef]
  34. Liu, C.; Li, Z.; Zhang, P.; Huang, L.; Li, Z.; Gao, S. Wet Snow Detection Using Dual-Polarized Sentinel-1 SAR Time Series Data Considering Different Land Categories. Geocarto Int. 2022, 37, 10907–10924. [Google Scholar] [CrossRef]
  35. Molotch, N.P.; Meromy, L. Physiographic and Climatic Controls on Snow Cover Persistence in the Sierra Nevada Mountains. Hydrol. Process. 2014, 28, 4573–4586. [Google Scholar] [CrossRef]
  36. Musselman, K.N.; Molotch, N.P.; Margulis, S.A. Snowmelt Response to Simulated Warming across a Large Elevation Gradient, Southern Sierra Nevada, California. Cryosphere 2017, 11, 2847–2866. [Google Scholar] [CrossRef]
  37. Zanaga, D.; Van De Kerchove, R.; De Keersmaecker, W.; Souverijns, N.; Brockmann, C.; Quast, R.; Wevers, J.; Grosu, A.; Paccini, A.; Vergnaud, S.; et al. ESA WorldCover 10 m 2020 v100. 2021.
  38. Vollrath, A.; Mullissa, A.; Reiche, J. Angular-Based Radiometric Slope Correction for Sentinel-1 on Google Earth Engine. Remote Sens. 2020, 12, 1867. [Google Scholar] [CrossRef]
  39. Rumpf, S.B.; Gravey, M.; Brönnimann, O.; Luoto, M.; Cianfrani, C.; Mariethoz, G.; Guisan, A. From White to Green: Snow Cover Loss and Increased Vegetation Productivity in the European Alps. Science 2022, 376, 1119–1122. [Google Scholar] [CrossRef]
  40. Baghdadi, N.; Gauthier, Y.; Bernier, M.; Fortin, J.-P. Potential and Limitations of RADARSAT SAR Data for Wet Snow Monitoring. IEEE Trans. Geosci. Remote Sens. 2000, 38, 316–320. [Google Scholar] [CrossRef]
  41. Magagi, R.; Bernier, M. Optimal Conditions for Wet Snow Detection Using RADARSAT SAR Data. Remote Sens. Environ. 2003, 84, 221–233. [Google Scholar] [CrossRef]
  42. Shi, J.; Dozier, J. Inferring Snow Wetness Using C-Band Data from SIR-C’s Polarimetric Synthetic Aperture Radar. IEEE Trans. Geosci. Remote Sens. 1995, 33, 905–914. [Google Scholar]
  43. Surendar, M.; Bhattacharya, A.; Singh, G.; Yamaguchi, Y.; Venkataraman, G. Development of a Snow Wetness Inversion Algorithm Using Polarimetric Scattering Power Decomposition Model. Int. J. Appl. Earth Obs. Geoinf. 2015, 42, 65–75. [Google Scholar] [CrossRef]
  44. Ma, W.; Xiao, P.; Zhang, X.; Song, Y.; Ma, T.; Ye, L. Retrieving Snow Wetness Based on Surface and Volume Scattering Simulation. ISPRS J. Photogramm. Remote Sens. 2020, 169, 17–28. [Google Scholar] [CrossRef]
  45. Singh, G.; Venkataraman, G. Snow Wetness Mapping Using Advanced Synthetic Aperture Radar Data. J. Appl. Remote Sens. 2007, 1, 013521. [Google Scholar] [CrossRef]
  46. Singh, G.; Venkataraman, G. Snow Permittivity Retrieval Inversion Algorithm for Estimating Snow Wetness. Geocarto Int. 2010, 25, 187–212. [Google Scholar] [CrossRef]
Figure 1. Schematic diagram of the temporal evolution of snow wetness, SWE, and backscatter (modified from [17]).
Applsci 14 06844 g001
Figure 2. Location and land cover type of the study area.
Applsci 14 06844 g002
Figure 3. Changes in SWE and Sentinel-1 VV polarization backscatter at Gold Lake station during the snowmelt period in 2021.
Applsci 14 06844 g003
Figure 4. Extraction process and result analysis of ROD under different land cover types. The blue-filled boxes represent the steps processed by the GEE platform.
Applsci 14 06844 g004
Figure 5. Validation of the ROD under different land cover types ((a) tree cover, (b) shrubland, (c) grassland, and (d) bare land) extracted from Sentinel-1 data.
Applsci 14 06844 g005
Figure 6. (a) Spatial distribution of the ROD extracted by Sentinel-1 under four land cover types in the study area in 2023 and (b) the area proportions of different land cover types at different runoff onset dates.
Applsci 14 06844 g006
Figure 7. Interannual variation in average ROD under different land cover types ((a) tree cover, (b) shrubland, (c) grassland, and (d) bare land). The shadows indicate the standard error.
Applsci 14 06844 g007
Figure 8. Interannual variation in average SWE under different land cover types.
Applsci 14 06844 g008
Figure 9. Correlation between the ROD extracted from stations and the SWE under different land cover types ((a) tree cover, (b) shrubland, (c) grassland, and (d) bare land).
Applsci 14 06844 g009
Figure 10. Correlation between the ROD extracted from Sentinel-1 data and the SWE under different land cover types ((a) tree cover, (b) shrubland, (c) grassland, and (d) bare land).
Applsci 14 06844 g010
Table 1. Information about station and Sentinel-1 data used in this study.
YearNumber of StationsNumber of Sentinel-1 Images Number of the Minimum Images Corresponding to the StationsNumber of the Maximum Images Corresponding to the Stations
Tree CoverShrublandGrasslandBare Land
20179021263322660
20189221463092154
20199521645054086
202090214462641118
202191214263744119
20228721443512859
20238321233572961
Table 2. Orbit and time of transit of Sentinel-1 data used in the study.
SatellitePassHH:MM (UTC)
Sentinel-1AAscending01:59
Descending14:07
Sentinel-1BAscending01:59
Descending14:06
Disclaimer/Publisher’s Note: The statements, opinions and data contained in all publications are solely those of the individual author(s) and contributor(s) and not of MDPI and/or the editor(s). MDPI and/or the editor(s) disclaim responsibility for any injury to people or property resulting from any ideas, methods, instructions or products referred to in the content.

