Featured Application
The methodology and findings can be used as a basis for further research into other predictive models for various diseases, contributing to the advancement of predictive analytics in healthcare.
Abstract
Chronic atrophic gastritis is a serious health issue beyond the stomach health problems that affect normal life. This study aimed to explore the influencing factors related to chronic atrophic gastritis (CAG) using non-invasive indicators and establish an optimal prediction model to aid in the clinical diagnosis of CAG. Electronic medical record data from 20,615 patients with CAG were analyzed, including routine blood tests, liver function tests, and coagulation tests. The logistic regression algorithm revealed that age, hematocrit, and platelet distribution width were significant influences suggesting chronic atrophic gastritis in the Chongqing population (p < 0.05), with an area under the curve (AUC) of 0.879. The predictive model constructed based on the Random Forest algorithm exhibited an accuracy of 83.15%, precision of 97.38%, recall of 77.36%, and an F1-score of 70.86%, outperforming the models constructed using XGBoost, KNN, and SVC algorithms in a comprehensive comparison. The prediction model derived from this study serves as a valuable tool for future studies and can aid in the prediction and screening of chronic atrophic gastritis.
1. Introduction
Chronic atrophic gastritis is a significant precursor lesion for gastric cancer, and its presence markedly elevates the risk of developing this malignancy [1,2,3]. As a highly prevalent and lethal tumor, stomach cancer poses a serious threat to human health and safety. The early identification and intervention of chronic atrophic gastritis not only aids in preventing its progression to gastric cancer but also substantially enhances the quality of life for patients [4]. Currently, the majority of gastritis detection methods in China rely on clinical techniques such as modified gastroscopy and pathological tissue biopsy. While these methods exhibit high diagnostic accuracy, they often induce discomfort and anxiety in patients due to their invasive nature, thereby impacting patient compliance [5,6,7]. Furthermore, the gastroscopy procedure may result in pain, nausea, and other uncomfortable symptoms, with potential complications such as bleeding and infection occurring in some cases [8]. These factors may lead some patients to be unable to tolerate or refuse gastroscopy, resulting in missed or misdiagnosis of early gastritis. Additionally, these methods necessitate specialized medical equipment and trained personnel, which increases diagnostic costs and strains medical resources. Consequently, the pursuit of a safe, convenient, and efficient non-invasive testing method has emerged as a focal point and challenge in current gastritis diagnosis research.
In recent years, noninvasive tests have emerged as a significant entry point for the diagnosis and treatment of gastritis [9,10,11,12,13,14,15]. Existing studies demonstrate that machine learning algorithms are extensively utilized for predictive modeling of various physical examination results, including cardiovascular disease [16], diabetes [17], breast cancer [18,19], lung cancer [20], and chronic obstructive pulmonary disease [21]. Through noninvasive examination, patients can be evaluated for histologic changes in the gastric mucosa, identify potential lesions, and receive early warnings. This is crucial for predicting and assessing chronic atrophic gastritis, which can facilitate early intervention and treatment, thereby improving clinical outcomes and enabling long-term monitoring. However, current noninvasive testing methods exhibit certain limitations in the diagnosis of gastritis. First, a single noninvasive detection index may lack sufficient sensitivity and specificity, making it challenging to comprehensively and accurately reflect the pathological changes in the gastric mucosa. Second, the results from different noninvasive testing methods may exhibit variability and inconsistency, which can adversely affect their diagnostic accuracy and reliability. These limitations indicate that noninvasive tests are not yet capable of fully replacing invasive procedures, such as gastroscopy and biopsy, in the diagnosis of gastritis.
To address this issue, we propose a new predictive model for the non-invasive prediction of chronic atrophic gastritis based on electronic medical record data and machine learning algorithms. By analyzing the electronic medical record data of 20,615 patients, we identified the significant influencing factors using a logistic regression algorithm and applied Random Forest, XGBoost, SVC, and KNN algorithms to build the prediction model. In this study, MATLAB 9.12 was used to construct and train the neural network. Our results show that the Random Forest algorithm performs well in predicting gastritis and provides strong support for future noninvasive diagnostic methods.
2. Materials and Methods
2.1. Study Participants
2.1.1. Data Sources
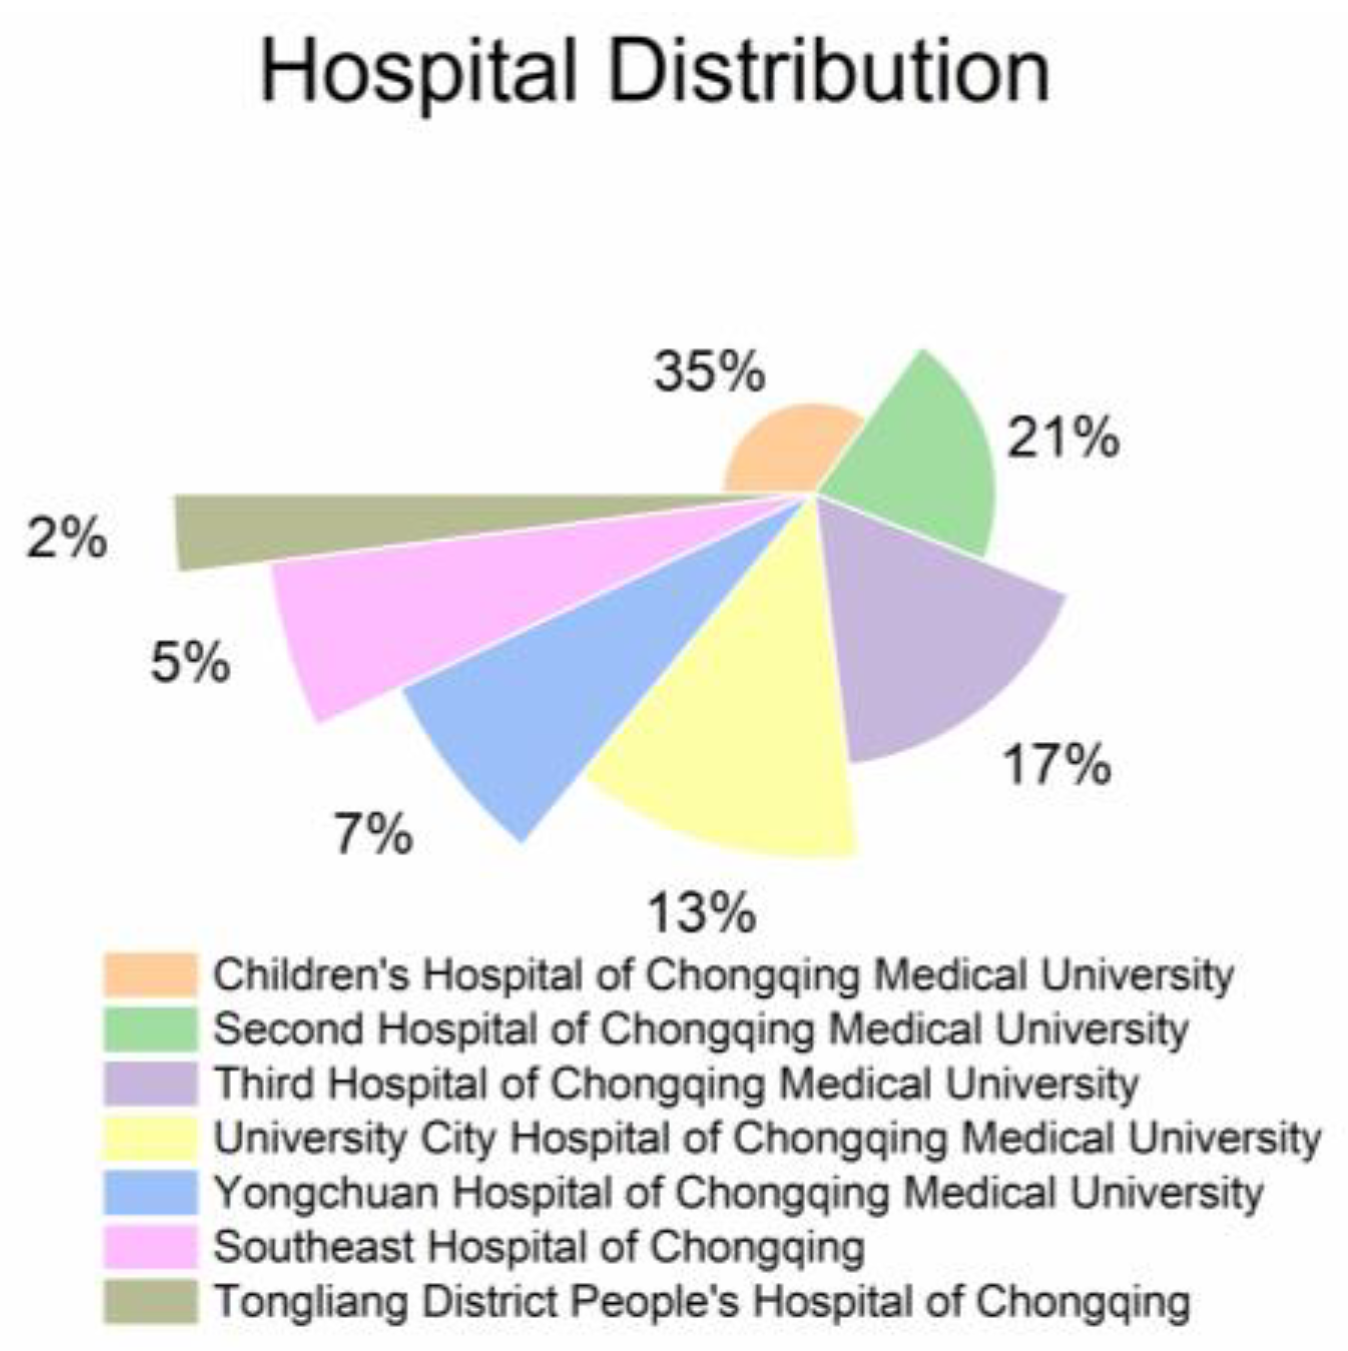
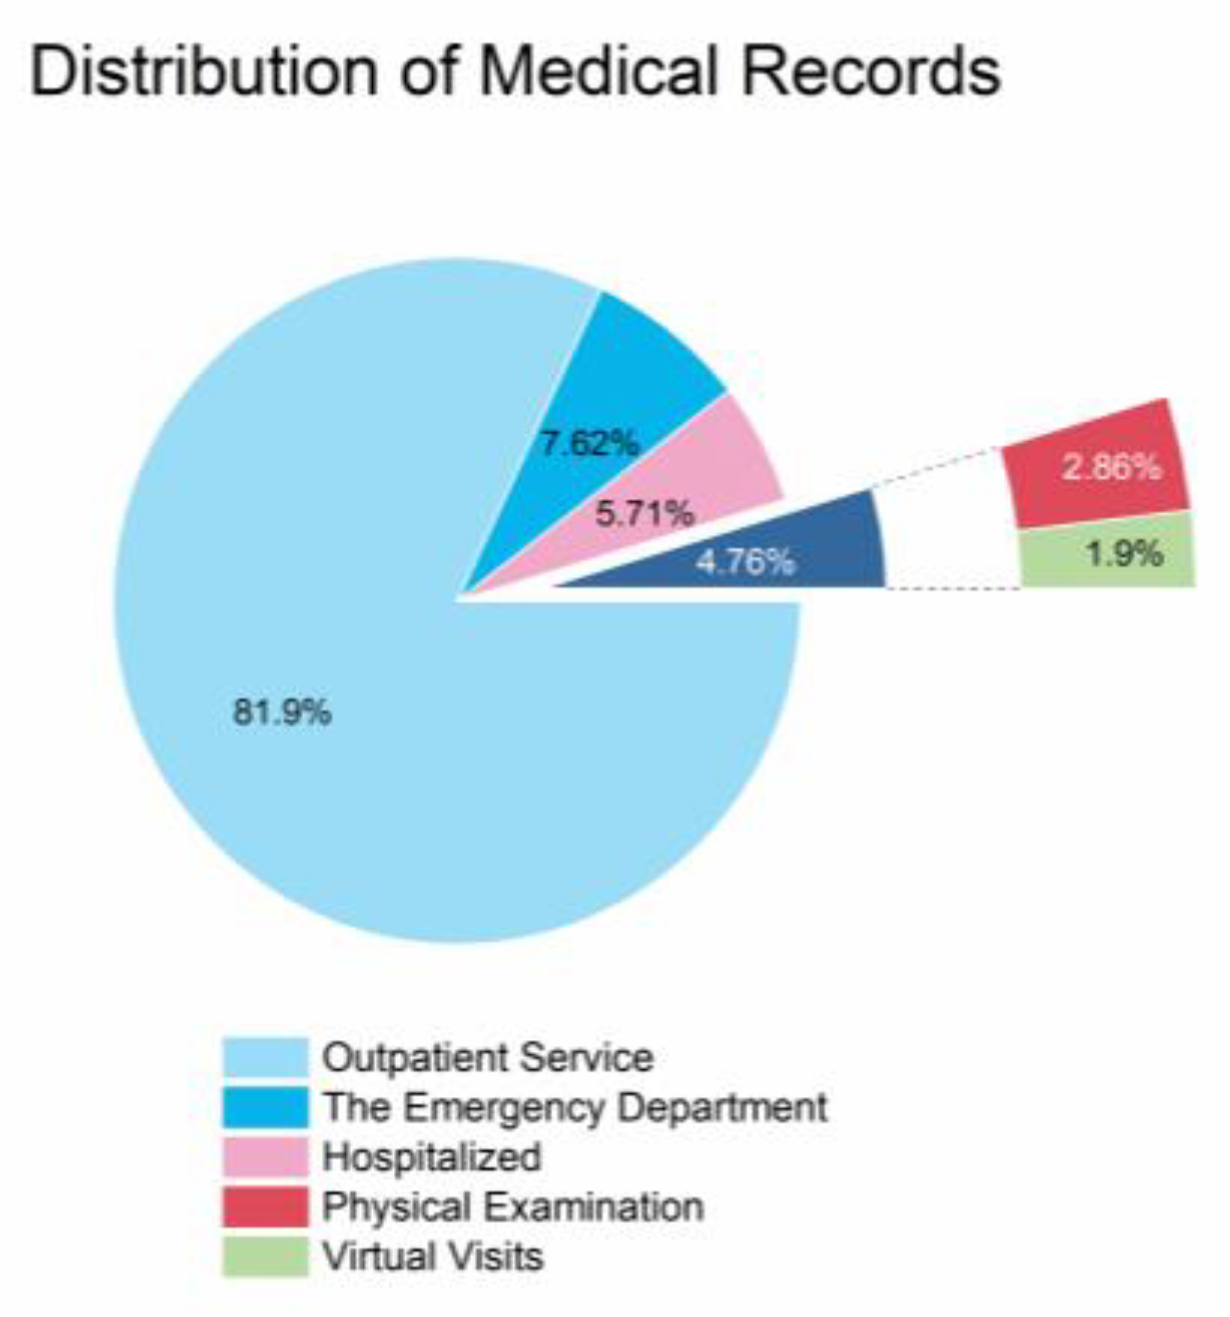
The data in this study were obtained from the Chongqing Research Institute Medical Data Intelligence Platform. The Chongqing Research Institute Medical Data Intelligence Platform is a big data medical platform based on seven hospitals, including Children’s Hospital of Chongqing Medical University, Second Hospital of Chongqing Medical University, Third Hospital of Chongqing Medical University, University City Hospital of Chongqing Medical University, Yongchuan Hospital of Chongqing Medical University, Southeast Hospital of Chongqing, and Tongliang District People’s Hospital of Chongqing. From 1987 to now, the platform has included a total of more than 14 million patients and 50 million case records, and its case information comes from the inpatient department, outpatient department, emergency department, virtual consultation platform, and physical examination center, as shown in Figure 1 and Figure 2.

Figure 1.
Distribution of hospitals on Chongqing Research Institute’s medical data intelligence platform.

Figure 2.
Sources of medical records on Chongqing Research Institute’s medical data intelligence platform.
2.1.2. NAMI Standards
The criteria for natriuresis were established based on the Chinese Consensus on Chronic Gastritis and expert guidance [22].
- 1.
- Inclusion Criteria
Diseased Group: Outpatients or inpatients diagnosed with chronic atrophic gastritis by gastric and pathohistologic examination, aged 40–81 years.
Normal Group: Outpatients or inpatients without chronic atrophic gastritis, aged 40–81 years.
- 2.
- Exclusion Criteria
- Patients with a history of gastric surgery.
- Patients with lesions such as peptic ulcer, gastrointestinal bleeding, and gastrointestinal tumors.
- Patients with combined cardiac, cerebrovascular, hepatic, renal, hematopoietic organs, and other serious organic diseases.
- Patients with metabolic diseases and autoimmune diseases.
A total of 5000 case records from the medical records of Chongqing Research Institute’s Medical Data Intelligence Platform from 2010–2022 were randomly selected, meeting the criteria for natriuresis, and divided into the diseased group and the normal group.
2.1.3. Data Pre-Processing
In this study, the data pre-processing phase included outlier detection and processing, removal of duplicate samples, deletion of indicators with excessive missing values in case records, and removal of case records with missing indicator values.
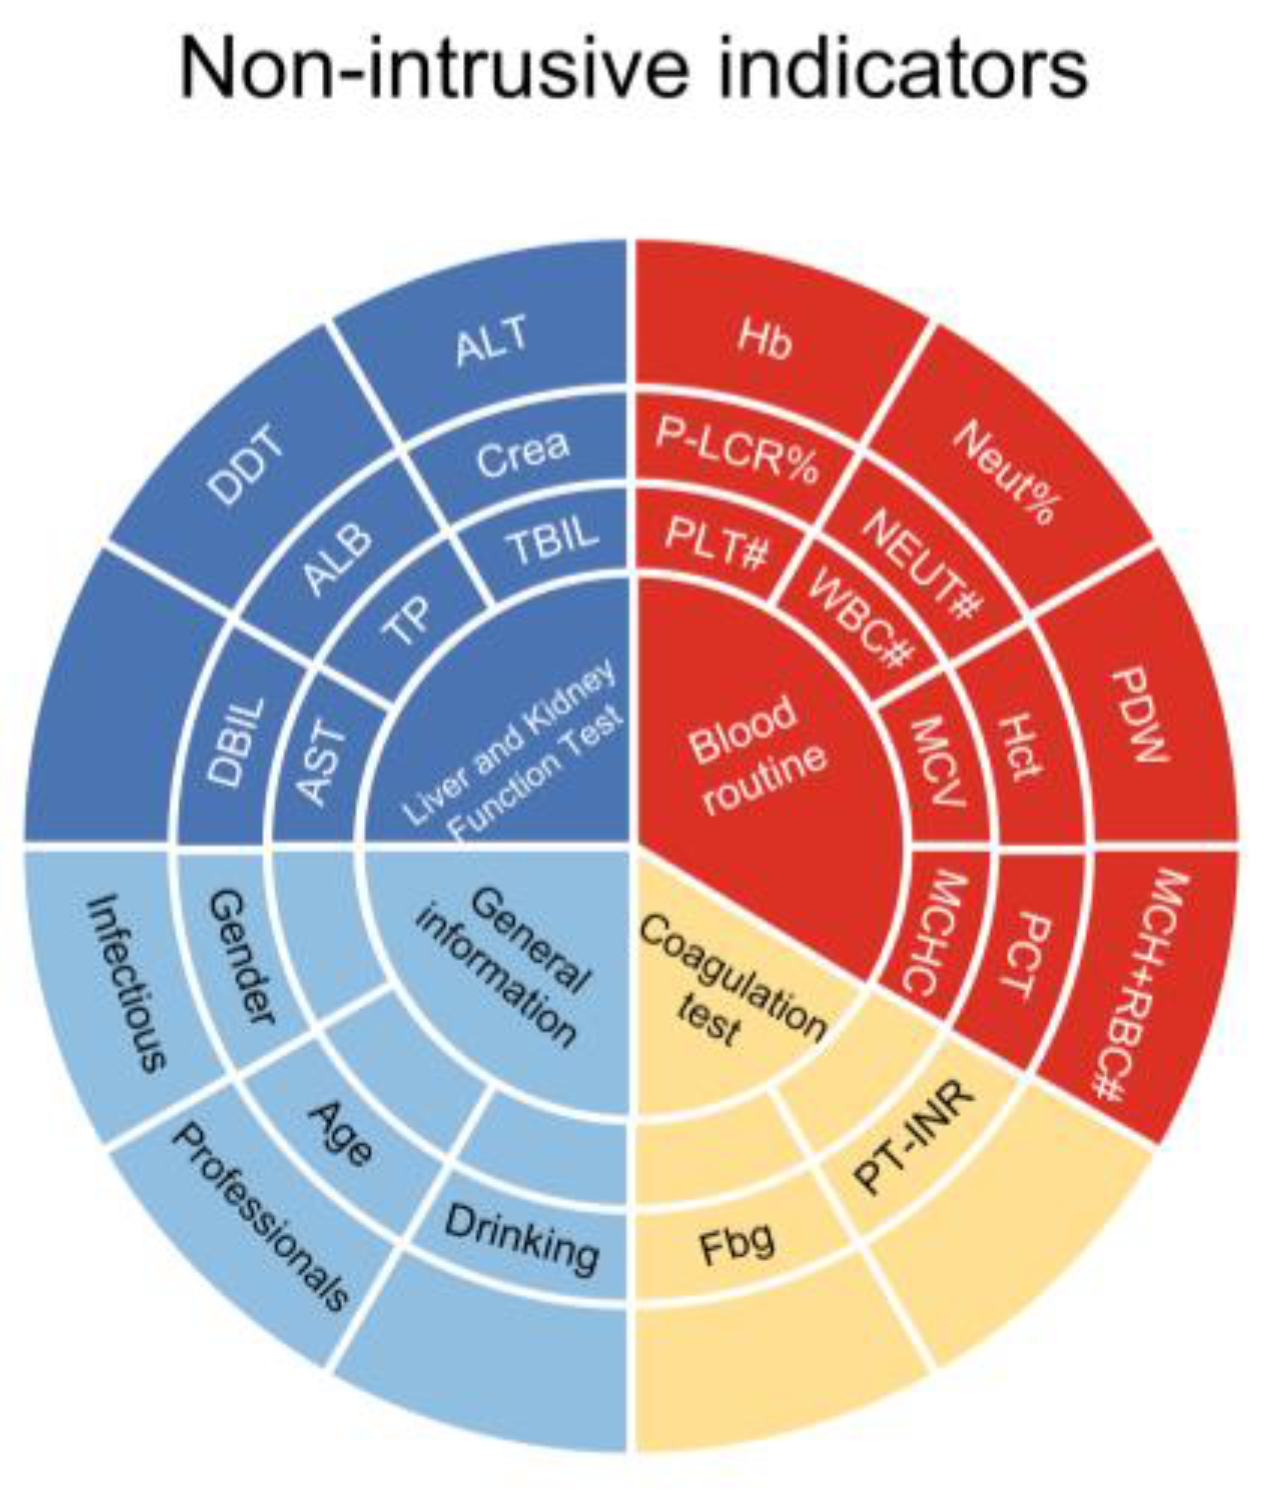
After the initial data cleaning, a total of 2845 case records were included in the study, with 28 non-invasive indicators. These indicators consist of 13 blood routine parameters, 8 liver and kidney function indicators, 2 coagulation test indicators, and 5 general information indicators, as shown in Figure 3. Among the included case records, 1109 were from the diseased group and 1736 were from the normal group. There were 1318 male case records and 1527 female case records. The average age of the patients was 46 years.

Figure 3.
Non-invasive indicators.
To further process the data, the preprocessing scale function from the Scikit-learn library was used to standardize the data, followed by normalization.
2.2. Statistical Analysis Methods for Predictive Modeling
2.2.1. Logistic Regression
Logistic regression analysis was used to explore the influencing factors of chronic atrophic gastritis. The logistic regression model identified age, hematocrit, and platelet distribution width as significant influencing factors.
2.2.2. Classification Modeling
Machine learning builds risk models by learning from data obtained from a patient’s existing medical tests or investigations and is commonly used to predict diseases, diagnose disease severity, evaluate the recovery of the disease, etc. [23,24,25,26]. In this study, four classical machine learning algorithms are used, including the Random Forest algorithm, XGBoost, SVM, and the KNN algorithm.
2.2.3. Statistical Analyses
The Random Forest algorithm is a classifier that contains multiple decision trees, and the category of the output is determined by the mode of the categories in individual trees. The advantages of Random Forest are that it can produce highly accurate classifiers for a wide variety of data, handle a large number of input variables, and assess the importance of variables in determining categories. When building a forest, it can internally produce unbiased estimates of generalized errors. For unbalanced classified datasets, it can balance the error and contains a good way to estimate the missing data, which still maintains accuracy if a large part of the data is missing. The full name of XGBoost is eXtreme Gradient Boosting, the core of which is an integrated algorithm based on a gradient boosting tree. It is faster than other integrated algorithms using gradient lift and has superior performance on both classification and regression problems. SVC (Support Vector Classification) is a commonly used machine learning algorithm. It is a binary classification model that separates samples of different classes by finding an optimal hyperplane. The KNN (K-Nearest Neighbor) classification algorithm is one of the simplest methods in data mining classification technology. K-Nearest Neighbor represents K-Nearest Neighbors, meaning that each sample can be represented by its nearest K neighbor values. The nearest neighbor algorithm is a method that classifies every record in a dataset. All four of these algorithms are often applied to build disease prediction models and the models have high prediction accuracy [27,28]. In this study, Scikit-learn from the Python learning library was used to build the model, and the optimal parameters were searched by grid search to improve the performance of the model.
3. Results
3.1. Logistic Regression Model
In this study, we conducted a preliminary analysis of the factors influencing chronic atrophic gastritis using a one-way rank sum test and binary logistic regression. The single-factor rank sum test is used to compare whether there is a significant difference in the median of two independent samples and is based on the comparison of the rank sum. In a single-factor rank sum test, the median difference between two or more different groups is compared to determine whether they come from the same population. This test is often used to compare the effects of different treatments or interventions on the observed results.
3.1.1. One-Way Rank Sum Test
Applied statistical analyses were performed using SPSS software, version 26.0 (SPSS, Chicago, IL, USA), with a one-way rank sum test using the noninvasive indicators included in this dataset as the independent variable and the presence of chronic atrophic gastritis as the dependent variable. When the p-value of the independent variable was less than 0.05, it indicated that the variable might be an influential factor associated with chronic atrophic gastritis, and the effects of occupation, mean erythrocyte hemoglobin concentration, platelet specific volume, and total bilirubin on the disease were excluded.
3.1.2. Binary Logistic Regression Mode
Binary logistic regression was performed with the variables screened in the one-way rank sum test as the dependent variable and the presence of chronic atrophic gastritis as the independent variable. The forecasting ability of the Logistic model was evaluated using Receiver Operating Characteristic (ROC) curve.
3.1.3. Variables That Passed the Test in the Mode
The results of the logistic regression model showed that the screened influencing factors (p < 0.05) were age (OR = 1.061), gender (OR = 0.257), alcohol consumption (OR = 1.473), the presence of infectious diseases (0.597), fibrinogen (OR = 0.709), the international normalized ratio of prothrombinogen (OR = 0.261), albumin (OR = 0.980), erythrocyte-specific volume (OR = 0.791), platelet distribution width (OR = 0.743), mean hemoglobin content (OR = 0.817), percent neutrophils (OR = 1.019), neutrophil count (OR = 0.878), hemoglobin (OR = 1.087), and percent large platelets (OR = 1.020), as shown in Table 1.

Table 1.
Logistic regression analysis of factors affecting chronic atrophic gastritis.
3.1.4. Logistic Regression Model Forecasting Capability
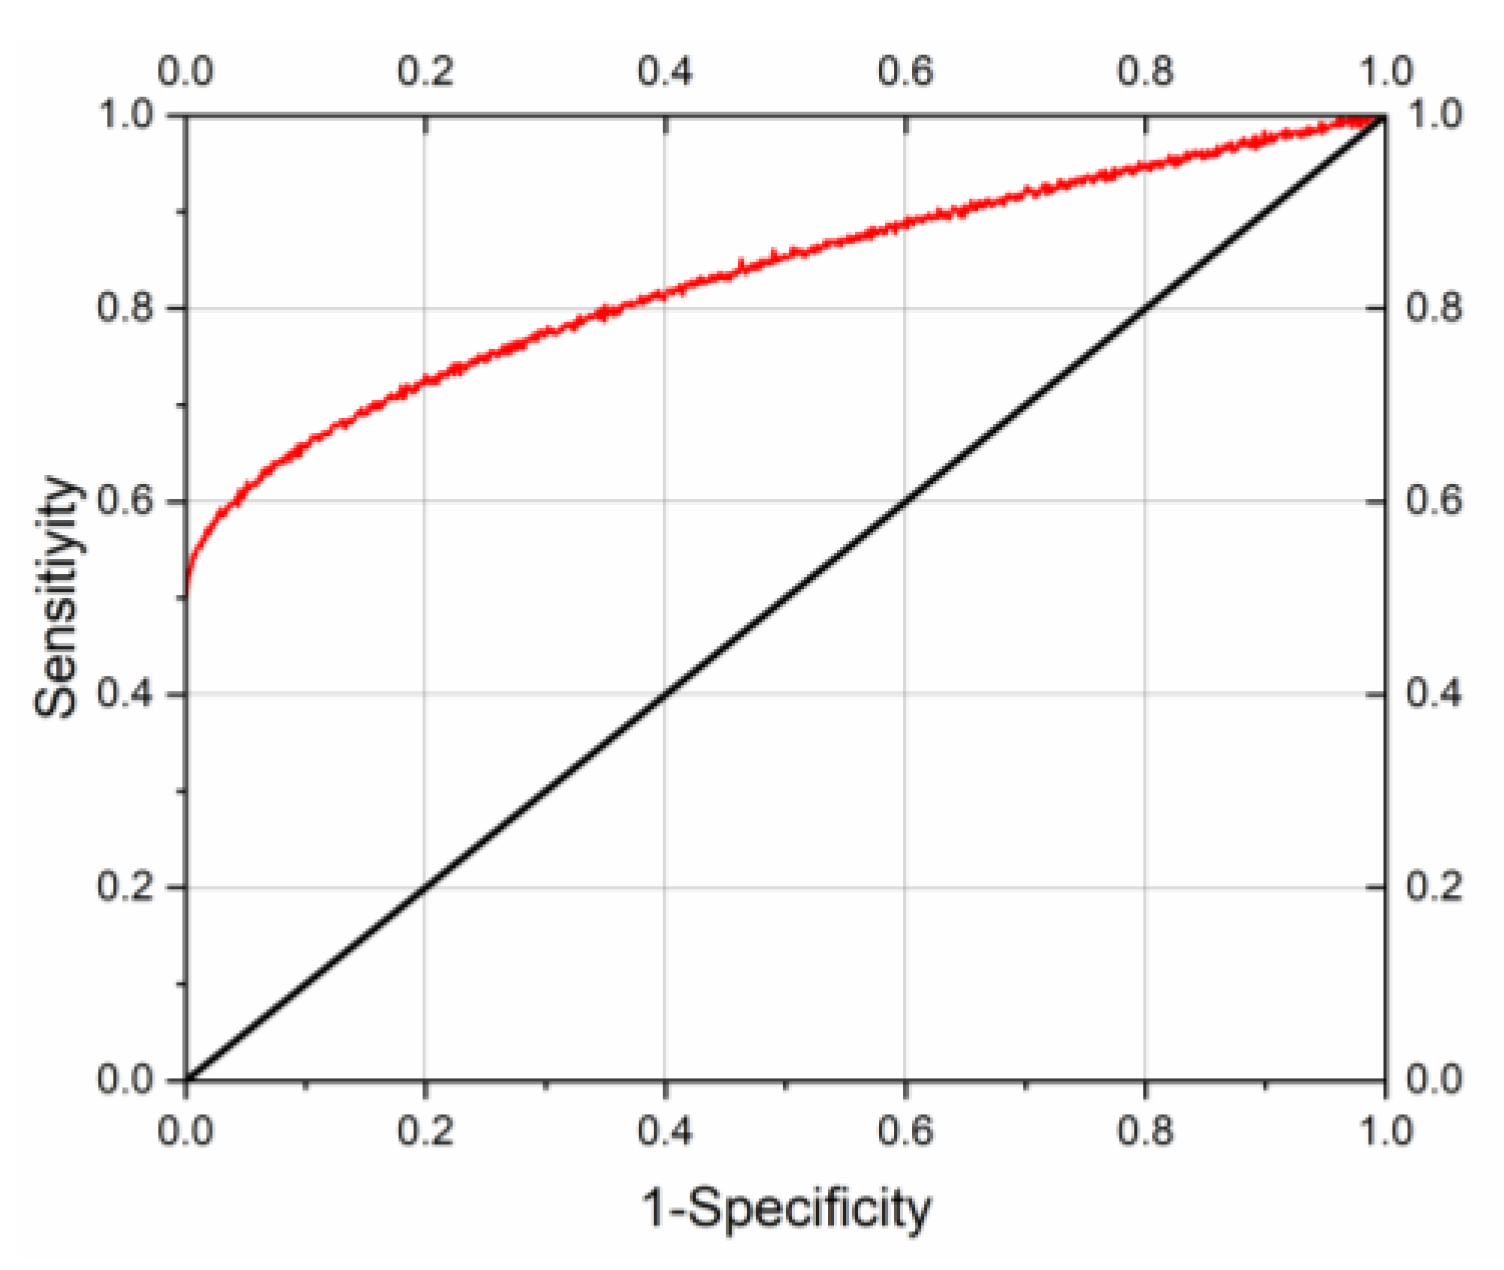
Area under the curve Az = 0.878; standard deviation SE(Az) = 0.005; 95% confidence interval (0.869~0.889).
The curve of the final logistic regression model and its calibration curve are given in Figure 4, where the red line in the graph represents the ROC curve and the black line represents the reference line. The area under the curve (AUC) of the ROC curve was 0.878, p < 0.05. the accuracy of the logistic regression model was 80.0%, sensitivity was 75.4%, and specificity was 86.0%, and the simulation results showed that the model had a good prediction effect.
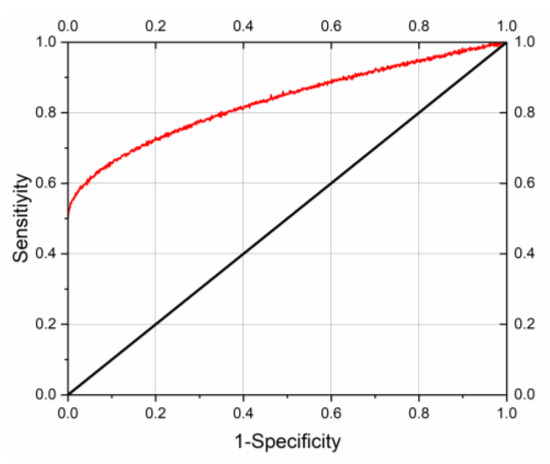
Figure 4.
Logistic regression model ROC curve.
Logistic regression model forecasting ability area under the curve Az = 0.878; standard error SE(Az) = 0.005; 95% confidence interval (0.869~0.889).
3.2. Random Forest Model
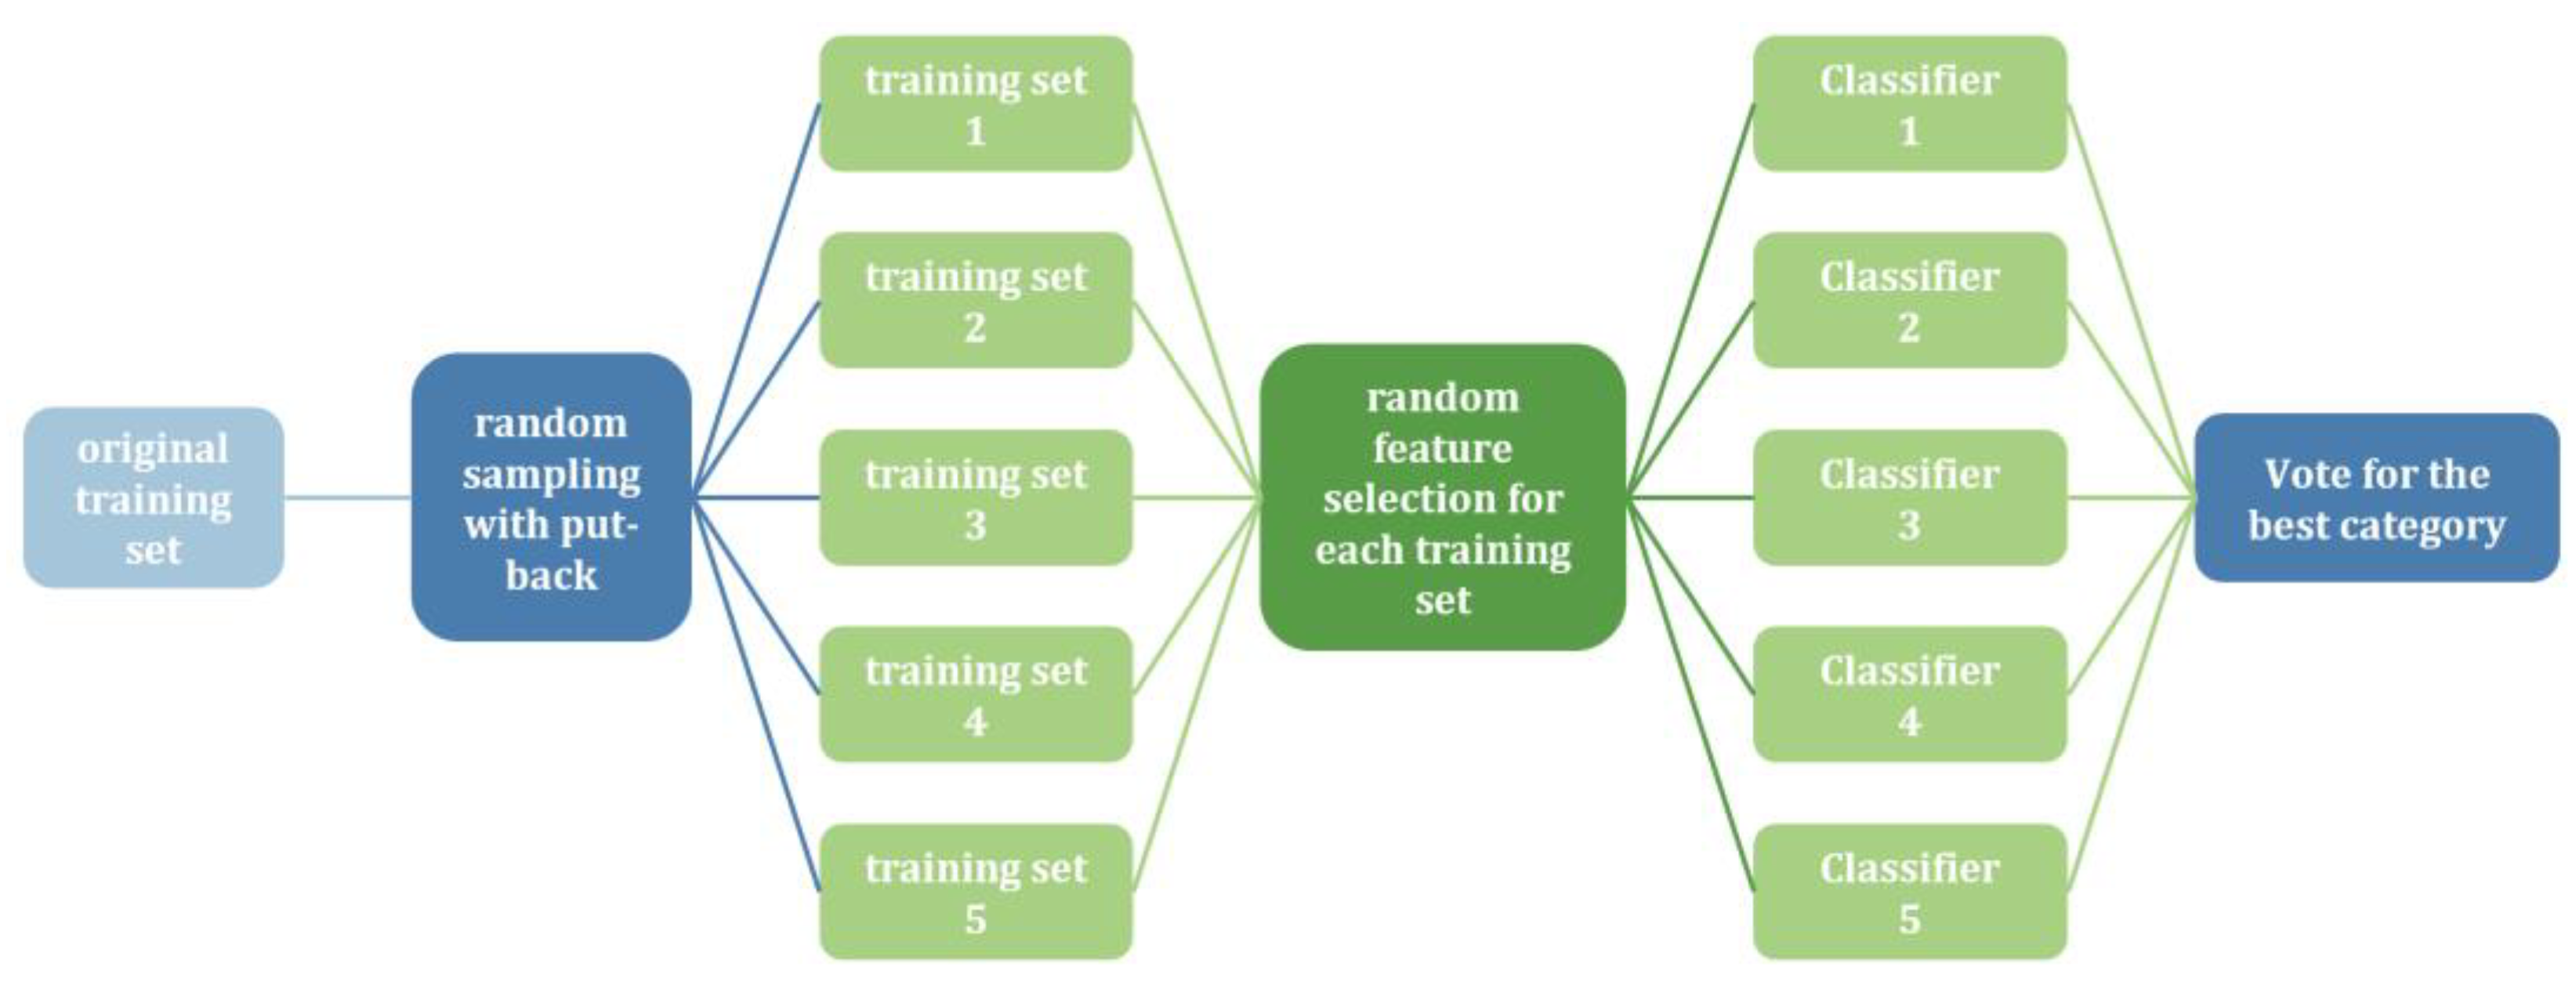
The Random Forest algorithm, proposed by Breiman [29], is an ensemble learning method used in supervised learning. It employs decision trees as base classifiers and combines multiple decision trees to overcome the limitations of single classifiers, thereby achieving improved prediction accuracy. By introducing random samples and features, Random Forest is resistant to noise and avoids overfitting. Figure 5 illustrates the implementation flowchart of the Random Forest algorithm.
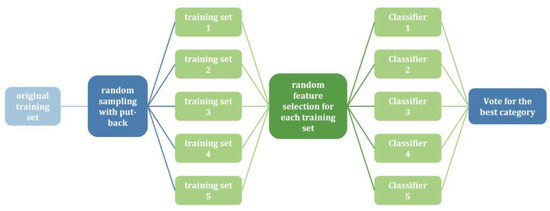
Figure 5.
Flowchart of Random Forest implementation.
First, we loaded two preprocessed gastric cancer datasets containing rich non-invasive metrics, such as routine blood tests, liver function tests, and coagulation function tests. Next, we performed a grid search to identify the optimal hyperparameter combinations for the Random Forest algorithm, aiming to enhance model performance. To improve the generalization ability of the model, we used a K-fold cross-validation method to repeatedly train and validate the model. Finally, we analyzed the performance of the Random Forest model against other commonly used machine learning algorithms, such as XGBoost, Support Vector Classification (SVC), and K-Nearest Neighbor (KNN) algorithms, to ensure robust performance across various metrics. This series of steps ensures that our model is not only accurate but also robust and applicable to real-world medical data. The flowchart of the model is shown in Figure 6.
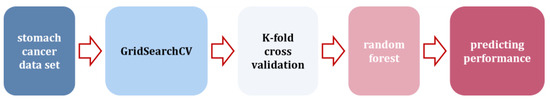
Figure 6.
Model flowchart.
3.3. Feature Selection
Influential factors associated with chronic atrophic gastritis in the middle-aged and elderly populations with p < 0.05 in binary logistics were selected as characteristic variables in the Random Forest model.
3.4. Random Forest Model Construction
The samples are randomly divided into a training subset and a test subset by a simple cross-validation method, where the training set has a sample capacity of 80% and is used for model construction. The test set sample capacity is 20%, which is used for the evaluation of the model. Parameter optimization was performed using grid search in the Random Forest algorithm so as to construct the prediction model and further analyze the importance of the influence of p < 0.05 on the eigenvectors in the binary logistic regression analysis.
- Optimal parameter
The Random Forest algorithm is run to perform a grid search, in which the number of classifiers selected is 10 to 70, the step size is 5, and the maximum depth ranges from 5 to 30; the step size selected is 1, the maximum number of features ranges from 1–14, the minimum number of samples required for internal node delineation ranges from 1–30, and the minimum number of samples for leaf nodes ranges from 1–30. The results show that the model is most accurate and achieves the local optimum when the number of classifiers is 45, the maximum depth is 9, the maximum number of features is 8, the minimum number of samples required for internal node division is 19, and the minimum number of samples for leaf nodes is 3.
- Characteristic importance results
The eigenvalues characterizing the importance of each eigenvariable were obtained from the Random Forest algorithm as shown in Figure 7, where the larger the parameter value of the eigenvariable, the stronger the correlation between the characteristic and whether or not the person has chronic atrophic gastritis in the model of this study.
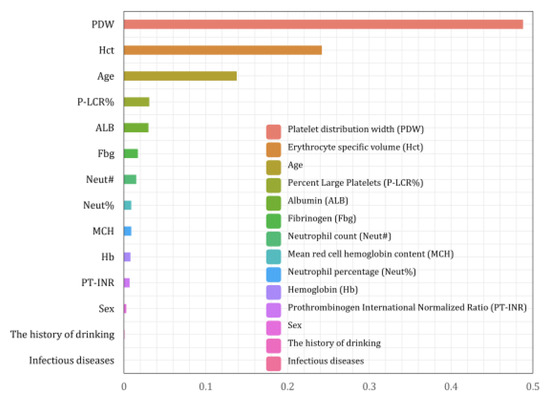
Figure 7.
Importance ranking of Random Forest features.
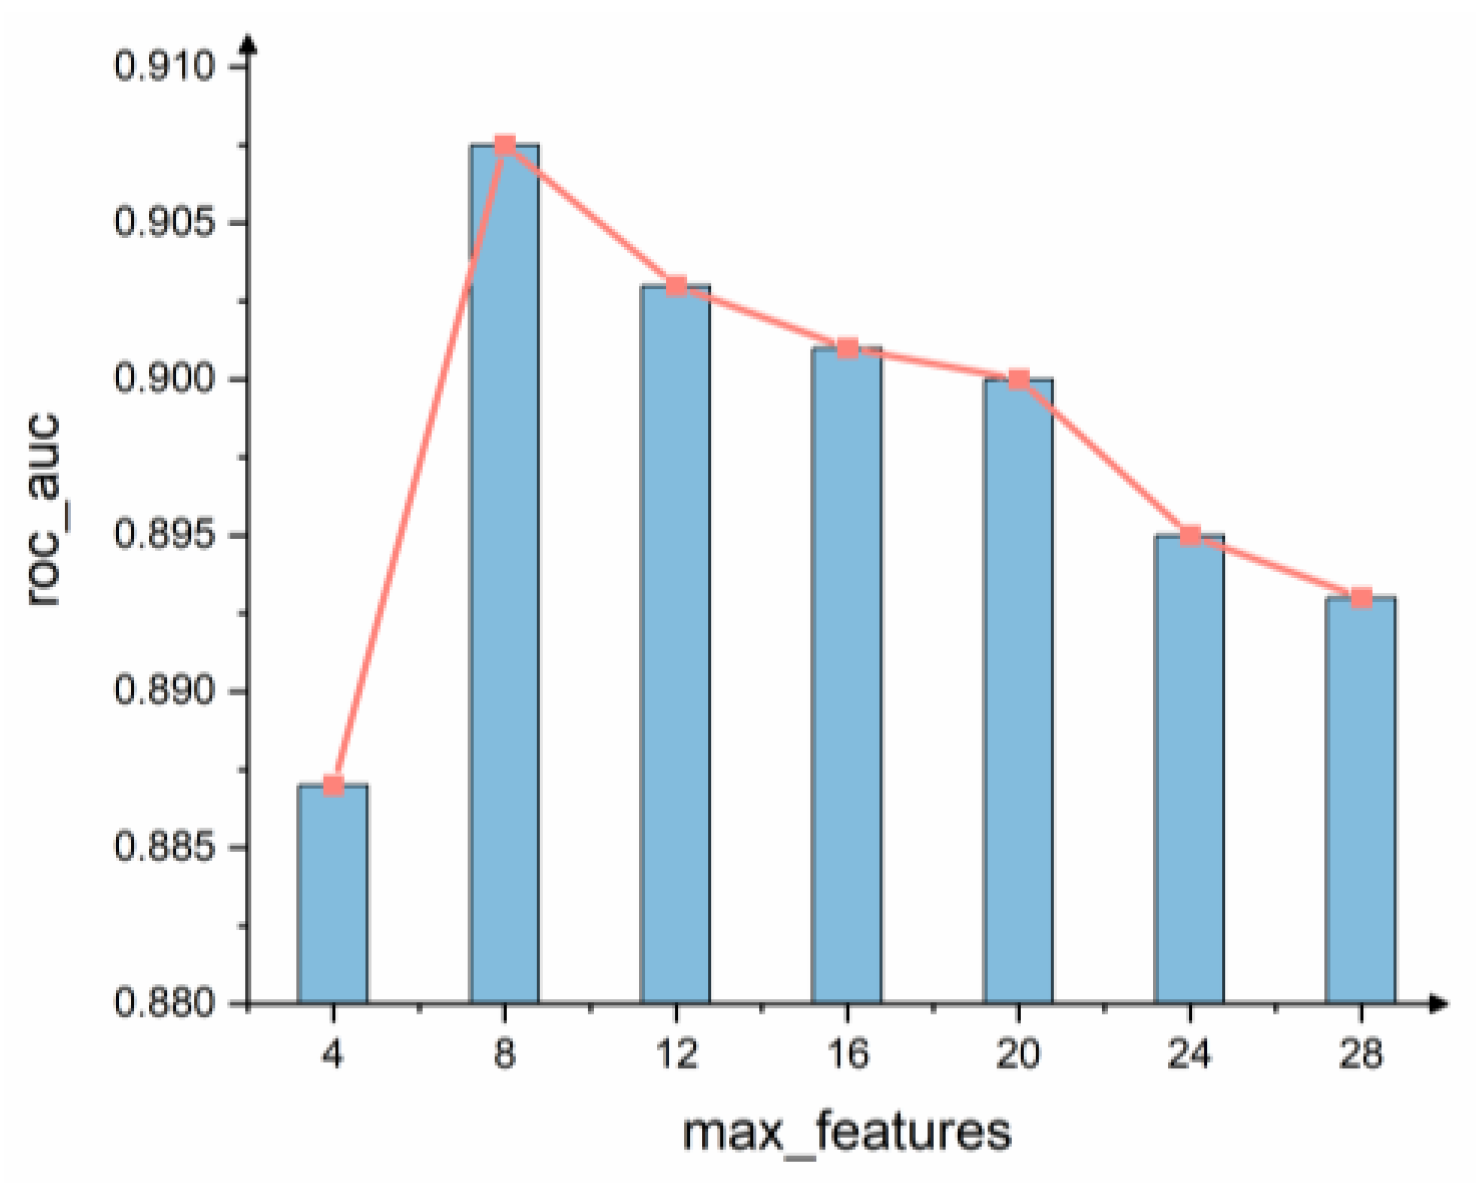
Max_features is an important parameter of the Random Forest model and is the maximum number of features allowed in the forest for a single decision tree. According to the results of the grid search shown in Figure 8, the performance of the model is optimized when max_features = 8. The top eight ranked indicators of feature importance in the model are taken as strong correlation factors, and the strong correlation factors derived in this paper using the random forest model are PDW, Hct, Age, P-LCR%, ALB, Fbg, Neut#, and MCH.
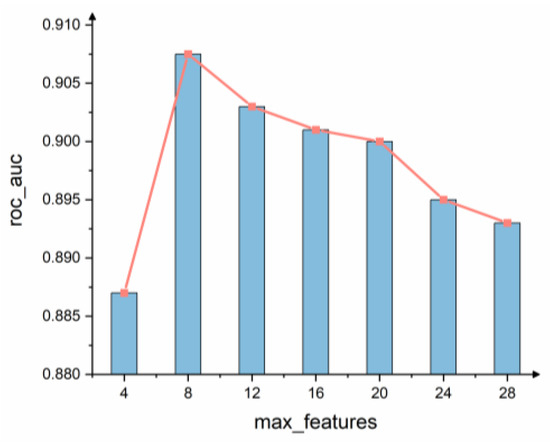
Figure 8.
Feature number selection.
3.5. Evaluation of Model Prediction Performance
In order to better evaluate the performance of the prediction model, the proposed model is tested in this paper using a ten-fold cross-validation method.
3.5.1. Basic Principle
Ten-fold cross-validation involves randomly dividing the original dataset into ten subsets, each containing an approximately equal number of samples. In each iteration, nine subsets are combined to form the training set, while the remaining subset is used as the test set. The model’s generalization ability is evaluated by averaging the results across all ten trials [30]. This method reduces the variability introduced by a single division of the dataset and provides a robust evaluation of the model’s performance.
3.5.2. Basic Process
- (1)
- Divide the original dataset evenly into 10 copies.
- (2)
- Take the first sample as the test set and the remaining nine copies as the training set.
- (3)
- Conduct model training and prediction.
- (4)
- Repeat the last two steps, and samples 2–10 take turns to be the test set.
- (5)
- Average the results of 10 iterations as the final result.
3.5.3. Performance Evaluation Metrics
There are several ways to evaluate the performance of a classifier. A confusion matrix can retain correct and incorrect classification results, thus measuring the quality of the classifier, where TP, TN, FP, and FN denote true positive, true negative, false positive, and false negative, respectively. We evaluate the model performance using the following four evaluation metrics, specifically calculated as follows:
In order to measure the performance of the model, the optimization results of the above model are compared with XGBoost, KNN, and SVM. The experiments use a confusion matrix to classify the prediction results, which are categorized into four classes, TP, TN, FP, and FN, as shown in Table 2.
Table 2.
Confusion matrix.
The ROC curves for the four models are shown in Figure 6, where AUC is the area under the ROC curve enclosed with the axes; the closer the AUC is to 1.0, the higher the accuracy of the model. Based on the AUC values of the four models, it can be seen that the random forest model has the highest accuracy (AUC = 0.90).
In this study, the model was evaluated by AUC (Figure 6) and the values accuracy, precision, recall, and F1-score (Table 3).
Table 3.
Evaluation metrics.
The assessment metrics for the four models are shown in Table 3 and Figure 9, The blue dashed line in Figure 9 represents the reference line.
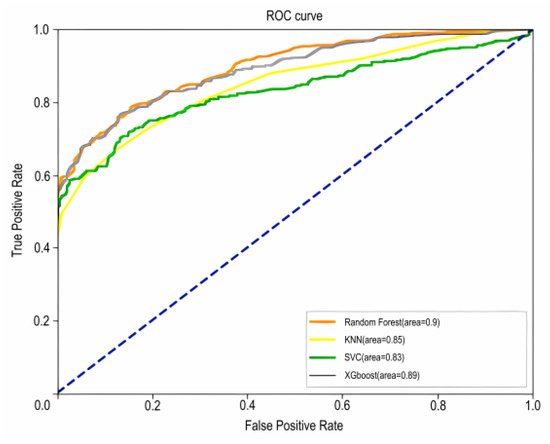
Figure 9.
Plot of ROC curves for the four models.
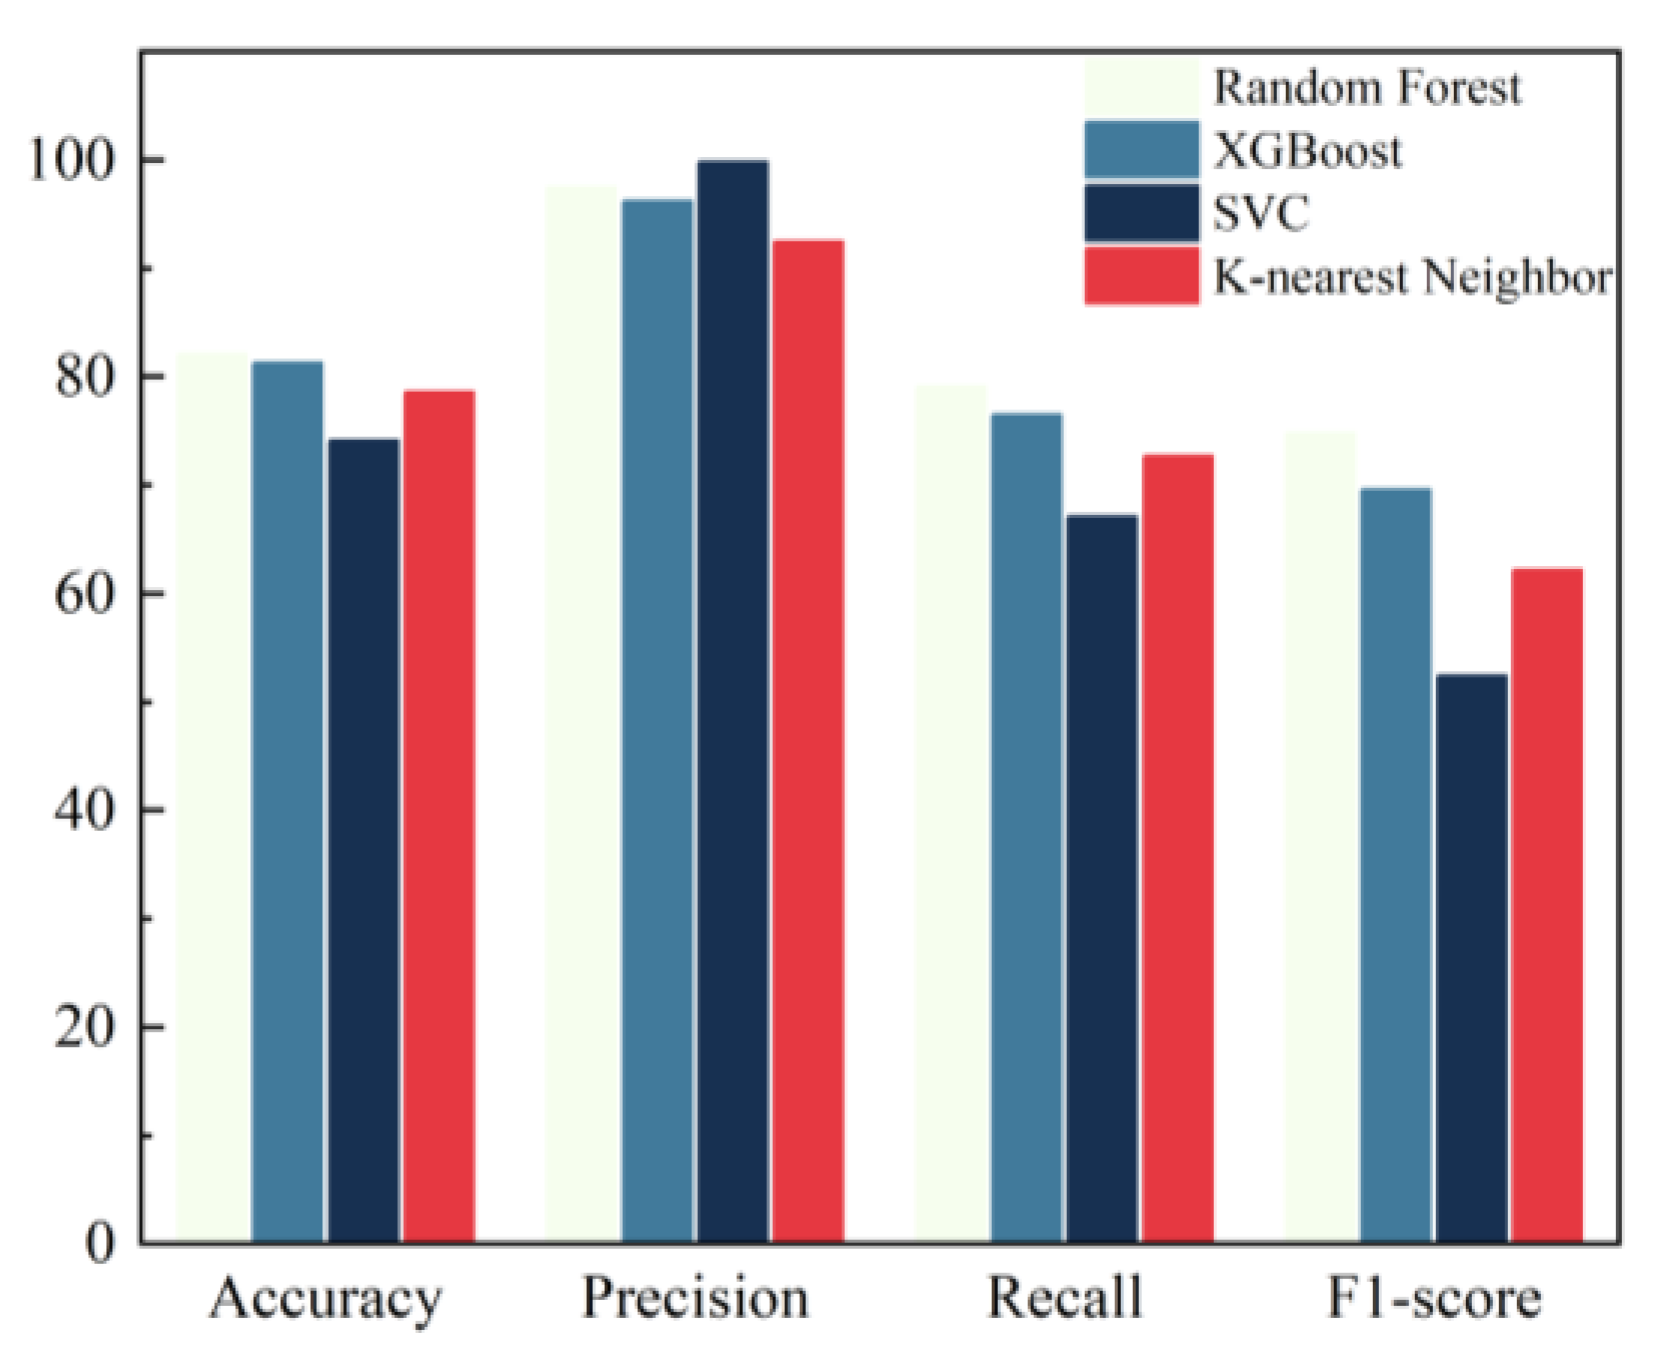
In this paper, the four indicators of accuracy, precision, recall, and F1-score are selected for the comprehensive evaluation of model performance, and the specific values are shown in Table 4 and Figure 10.
Table 4.
Predictive performance metrics of different methods.
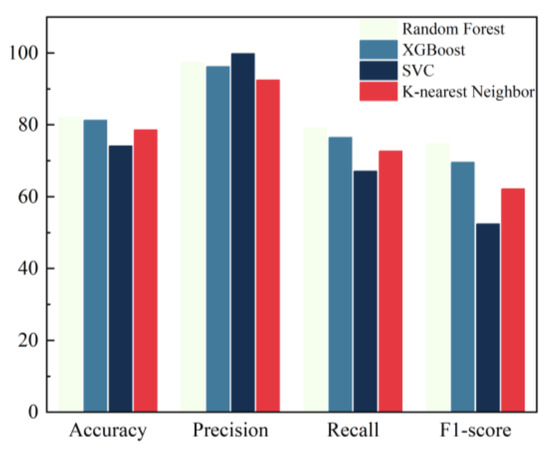
Figure 10.
Comparison of model performance.
In summary, the accuracy, precision, recall, F1-score, and AUC values of the four models were compared, and the results showed that the prediction model based on the Random Forest was the most effective.
4. Discussion
This study utilizes non-invasive indicators to construct a predictive diagnostic model for chronic atrophic gastritis using Random Forests, achieving an accuracy of 83.15%, a precision of 97.83%, a recall of 77.14%, an F1-score of 72.36%, and an AUC of 0.90. A comprehensive comparison of these five metrics shows that the Random Forest-based predictive diagnostic model outperforms those based on XGBoost, KNN, and SVC.
Research has shown that HP infection, pepsinogen I, gastrin-17, the number of lesions, Pepsinogen II, and the pepsinogen I/II ratio are independent risk factors for intestinal metaplasia or dysplasia in patients with CAG. This study shows that eight non-invasive indicators, including platelet distribution width PDW, hematocrit HCT, Age, large platelet percentage p-lcr%, albumin ALB, fibrinogen Fbg, neutrophil count Neut#, and mean erythrocyte hemoglobin content MCH could be applied to clinical aid diagnosis. This supplements and improves the already identified risk factors.
Although our study has made progress in the noninvasive detection of chronic atrophic gastritis, there are still some limitations that need to be clarified and confronted. Currently, we have not been able to perform independent external validation of the proposed predictive model due to limitations in data acquisition and study design. This limitation may affect the broad application and generalizability of the model to different populations and clinical settings. To compensate for this shortcoming, we plan to collect more patient data from diverse sources and larger sizes for multi-center and multi-region validation studies in subsequent studies. In addition, we will further optimize the model algorithm and explore the combination and application of more non-invasive indicators to improve the accuracy and stability of the prediction model. Through these efforts, we hope to establish a more comprehensive and reliable noninvasive detection model to provide stronger support for early diagnosis and intervention of chronic atrophic gastritis.
5. Conclusions
This study significantly contributes to the field by developing a robust predictive model for chronic atrophic gastritis (CAG) using non-invasive indicators. The model, based on a comprehensive analysis of electronic medical records from 20,615 patients, incorporates factors such as age, hematocrit, and platelet distribution width, identified as significant predictors of CAG. By leveraging the Random Forest algorithm, which outperformed other machine learning approaches in terms of accuracy, precision, recall, and F1-score, this study not only enhances the predictive capability but also provides a practical tool that could be integrated into clinical decision support systems. This predictive model represents a significant advancement in aiding the early diagnosis and screening of chronic atrophic gastritis, with potential implications for improving patient management and treatment strategies.
Although the predictive model developed in this study represents a significant advancement, there are still a number of areas that require further attention for effective implementation. Currently, the integration of the model into clinical workflow and decision support systems remains a serious challenge. Several factors need to be addressed to implement this strategy, including training healthcare professionals to effectively interpret and utilize the model’s outputs, ensuring system compatibility with existing EHR systems, and validating the model in different clinical settings to confirm its generalizability. In addition, the ongoing evaluation of patient outcomes and feedback from healthcare providers is critical to refining and improving the model. Future research should focus on these aspects to improve the practical application and impact of the predictive model in real clinical settings.
From a future research perspective, we suggest that the accuracy and robustness of predictions can be improved by exploring more modern machine learning algorithms; techniques such as deep learning or ensemble methods can be used to gain more insight into the factors influencing chronic atrophic gastritis. In addition, the integration of methods to improve the interpretability of results, such as interpretable artificial intelligence techniques, is essential to increase the transparency and clinical utility of models. Future studies should also focus on expanding datasets to include diverse populations and incorporating longitudinal data to assess model performance over time. These advances will help refine predictive models and their practical application in clinical settings.
Author Contributions
Conceptualization, X.Z.; methodology, X.Z.; resources, G.W. and J.W.; data curation, X.Z.; writing—original draft preparation, X.Z.; writing—review and editing, M.Z., G.W. and J.W.; visualization, M.Z.; supervision, G.W. and J.W.; project administration, M.Z. All authors have read and agreed to the published version of the manuscript.
Funding
This research was funded by the Science and Technology Research Program of Chongqing Municipal Education Commission (Grant No. KJQN202100434), the research foundation of Chongqing University of Science and Technology (Grant No. 182201038), and the Intelligent Medicine Program of Chongqing Medical University (Grant No. ZHYX202120).
Institutional Review Board Statement
This study was conducted in accordance with the Declaration of Helsinki and was approved by Chongqing Medical University (2023083 7 November 2023).
Informed Consent Statement
Informed consent was obtained from all subjects involved in the study.
Data Availability Statement
The data that support the findings of this study are not publicly available due to privacy and ethical restrictions. Access to the data is restricted to ensure the confidentiality and privacy of the participants involved in the study. Any inquiries regarding the data can be directed to the corresponding author.
Acknowledgments
We would like to express our sincere gratitude to Liping Tang at the First Affiliated Hospital of Chongqing Medical University and Xinke Li of Chongqing Medical University for their invaluable professional guidance and support throughout this research.
Conflicts of Interest
The authors declare no conflict of interest.
References
- Yoon, H.; Kim, N. Diagnosis and management of high risk group for gastric cancer. Gut Liver 2015, 9, 5–17. [Google Scholar] [CrossRef]
- Sugano, K.; Moss, S.F.; Kuipers, E.J. Gastric intestinal metaplasia: Real culprit or innocent bystander as a precancerous condition for gastric cancer? Gastroenterology 2023, 165, 1352–1366.e1. [Google Scholar] [CrossRef] [PubMed]
- Kamada, T.; Watanabe, H.; Furuta, T.; Terao, S.; Maruyama, Y.; Kawachi, H.; Kushima, R.; Chiba, T.; Haruma, K. Diagnostic criteria and endoscopic and histological findings of autoimmune gastritis in Japan. J. Gastroenterol. 2023, 58, 185–195. [Google Scholar] [CrossRef] [PubMed]
- Conti, C.B.; Agnesi, S.; Scaravaglio, M.; Masseria, P.; Dinelli, M.E.; Oldani, M.; Uggeri, F. Early Gastric Cancer: Update on Prevention, diagnosis and treatment. Int. J. Environ. Res. Public Health 2023, 20, 2149. [Google Scholar] [CrossRef]
- Zhang, Z.; Zhang, X. Chronic atrophic gastritis in different ages in South China: A 10-year retrospective analysis. BMC Gastroenterol. 2023, 23, 37. [Google Scholar] [CrossRef] [PubMed]
- Guidelines for diagnosis and treatment of chronic gastritis in China (2022, Shanghai). J. Dig. Dis. 2023, 24, 150–180. [CrossRef]
- Wan, W.; Wang, L.; Liu, Y.; Hu, Y. Improving the detection of Helicobacter pylori in biopsies of chronic gastritis: A comparative analysis of H&E, methylene blue, Warthin-Starry, immunohistochemistry, and quantum dots immunohistochemistry. Front. Oncol. 2023, 13, 1229871. [Google Scholar] [CrossRef]
- Mulcahy, H.E.; Kelly, P.; Banks, M.R.; Connor, P.; Patchet, S.E.; Farthing, M.J.; Fairclough, P.D.; Kumar, P.J. Factors Associated with Tolerance to, and Discomfort with, Unsedated Diagnostic Gastroscopy. Scandinavian J. Gastroenterol. 2001, 36, 1352–1357. [Google Scholar] [CrossRef]
- Lahner, E.; Marzinotto, I.; Lampasona, V.; Dottori, L.; Bazzigaluppi, E.; Brigatti, C.; Secchi, M.; Piemonti, L.; Conti, L.; Pilozzi, E.; et al. Autoantibodies toward ATP4A and ATP4B subunits of gastric proton pump H+,K+-ATPASE are reliable serological pre-endoscopic markers of corpus atrophic gastritis. Clin. Transl. Gastroenterol. 2020, 11, e00240. [Google Scholar] [CrossRef]
- Zhang, J.; Yu, J.; Fu, S.; Tian, X. Adoption value of deep learning and serological indicators in the screening of atrophic gastritis based on artificial intelligence. J. Supercomput. 2021, 77, 8674–8693. [Google Scholar] [CrossRef]
- Millarch, A.S.; Bonde, A.; Bonde, M.; Klein, K.V.; Folke, F.; Rudolph, S.S.; Sillesen, M. Assessing optimal methods for transferring machine learning models to low-volume and imbalanced clinical datasets: Experiences from predicting outcomes of Danish trauma patients. Front. Digit. Health 2023, 5, 1249258. [Google Scholar] [CrossRef]
- Aboelsoued, D.; Hendawy, S.H.M.; Abo-Aziza, F.a.M.; Megeed, K.N.A. Copro-microscopical and immunological diagnosis of cryptosporidiosis in Egyptian buffalo-calves with special reference to their cytokine profiles. J. Parasit. Dis. 2020, 44, 654–660. [Google Scholar] [CrossRef] [PubMed]
- Yoshida, N.; Doyama, H.; Yano, T.; Horimatsu, T.; Uedo, N.; Yamamoto, Y.; Kakushima, N.; Kanzaki, H.; Hori, S.; Yao, K.; et al. Early gastric cancer detection in high-risk patients: A multicentre randomised controlled trial on the effect of second-generation narrow band imaging. Gut 2020, 70, 67–75. [Google Scholar] [CrossRef] [PubMed]
- Hosseini, M.; Lotfi-Shahreza, M.; Nikpour, P. Integrative analysis of DNA methylation and gene expression through machine learning identifies stomach cancer diagnostic and prognostic biomarkers. J. Cell. Mol. Med. 2023, 27, 714–726. [Google Scholar] [CrossRef]
- Taninaga, J.; Nishiyama, Y.; Fujibayashi, K.; Gunji, T.; Sasabe, N.; Iijima, K.; Naito, T. Prediction of future gastric cancer risk using a machine learning algorithm and comprehensive medical check-up data: A case-control study. Sci. Rep. 2019, 9, 12384. [Google Scholar] [CrossRef] [PubMed]
- Yang, L.; Wu, H.; Jin, X.; Zheng, P.; Hu, S.; Xu, X.; Yu, W.; Yan, J. Study of cardiovascular disease prediction model based on random forest in eastern China. Sci. Rep. 2020, 10, 5245. [Google Scholar] [CrossRef] [PubMed]
- Kavakiotis, I.; Tsave, O.; Salifoglou, A.; Maglaveras, N.; Vlahavas, I.; Chouvarda, I. Machine learning and data mining methods in diabetes research. Comput. Struct. Biotechnol. J. 2017, 15, 104–116. [Google Scholar] [CrossRef] [PubMed]
- Sree, S.R.; Kunthavai, A. Hubness weighted SVM ensemble for prediction of breast cancer subtypes. Technol. Health Care 2022, 30, 565–578. [Google Scholar] [CrossRef]
- Guo, P.; Chen, W.; Li, H.; Li, M.; Li, L. The Histone Acetylation Modifications of Breast Cancer and their Therapeutic Implications. Pathol. Oncol. Res. 2018, 24, 807–813. [Google Scholar] [CrossRef] [PubMed]
- Li, Y.; Wu, X.; Yang, P.; Jiang, G.; Luo, Y. Machine learning for lung cancer diagnosis, treatment, and prognosis. Genom. Proteom. Bioinform. 2022, 20, 850–866. [Google Scholar] [CrossRef]
- Ma, X.; Wu, Y.; Zhang, L.; Yuan, W.; Yan, L.; Fan, S.; Lian, Y.; Zhu, X.; Gao, J.; Zhao, J.; et al. Comparison and development of machine learning tools for the prediction of chronic obstructive pulmonary disease in the Chinese population. J. Transl. Med. 2020, 18, 146. [Google Scholar] [CrossRef] [PubMed]
- Fang, J.; Du, Y.Q.; Liu, W.Z.; Ren, J.L.; Li, Y.Q.; Chen, X.Y.; Lv, N.H.; Chen, Y.X.; Lv, B. Chinese consensus on chronic gastritis (2017, Shanghai). J. Dig. Dis. 2018, 19, 182–203. [Google Scholar] [CrossRef]
- Deo, R.C. Machine learning in medicine. Circulation 2015, 132, 1920–1930. [Google Scholar] [CrossRef]
- Ngiam, K.Y.; Khor, I.W. Big data and machine learning algorithms for health-care delivery. Lancet Oncol. 2019, 20, e262–e273. [Google Scholar] [CrossRef] [PubMed]
- Uddin, S.; Khan, A.; Hossain, M.E.; Moni, M.A. Comparing different supervised machine learning algorithms for disease prediction. BMC Med. Inform. Decis. Mak. 2019, 19, 281. [Google Scholar] [CrossRef]
- Huyut, M.; Üstündağ, H. Prediction of diagnosis and prognosis of COVID-19 disease by blood gas parameters using decision trees machine learning model: A retrospective observational study. Med. Gas Res. 2022, 12, 60. [Google Scholar] [CrossRef]
- Zeng, Y.; Zhu, S.; Wang, Z.; Chen, J.; Dai, J.; Liu, Z.; Sun, G.; Liang, J.; Zhang, X.; Wang, Z.; et al. Multidisciplinary team (MDT) discussion improves overall survival outcomes for metastatic renal cell carcinoma patients. J. Multidiscip. Healthc. 2023, 16, 503–513. [Google Scholar] [CrossRef]
- Park, J.M.; Han, Y.M.; Park, Y.J.; Hahm, K.B. Dietary intake of walnut prevented helicobacter pylori-associated gastric cancer through rejuvenation of chronic atrophic gastritis. J. Clin. Biochem. Nutr. 2021, 68, 37–50. [Google Scholar] [CrossRef] [PubMed]
- Breiman, L. Random Forests. Mach. Learn. 2001, 45, 5–32. [Google Scholar] [CrossRef]
- Fushiki, T. Estimation of prediction error by using K-fold cross-validation. Stat. Comput. 2009, 21, 137–146. [Google Scholar] [CrossRef]


Disclaimer/Publisher’s Note: The statements, opinions and data contained in all publications are solely those of the individual author(s) and contributor(s) and not of MDPI and/or the editor(s). MDPI and/or the editor(s) disclaim responsibility for any injury to people or property resulting from any ideas, methods, instructions or products referred to in the content. |
© 2024 by the authors. Licensee MDPI, Basel, Switzerland. This article is an open access article distributed under the terms and conditions of the Creative Commons Attribution (CC BY) license (https://creativecommons.org/licenses/by/4.0/).