Article

Enrichment of Bakery Products with Antioxidant and Dietary Fiber Ingredients Obtained from Spent Coffee Ground

by
Christos Papageorgiou
,
Efimia Dermesonlouoglou
,
Dimitrios Tsimogiannis
and
Petros Taoukis
*
Laboratory of Food Chemistry and Technology, School of Chemical Engineering, National Technical University of Athens, Zografos Campus, 9 Iroon Polytechneiou Street, 15772 Athens, Greece
*
Author to whom correspondence should be addressed.
Appl. Sci. 2024, 14(16), 6863; https://doi.org/10.3390/app14166863
Submission received: 30 May 2024 / Revised: 30 July 2024 / Accepted: 31 July 2024 / Published: 6 August 2024

Abstract

:
Spent Coffee Ground (SCG) is the main coffee industry by-product, rich in dietary fibers and polyphenols. The extractable material of SCG was fractionated, and the phenolic compounds were identified and quantified. Chlorogenic and neochlorogenic acids were identified as the main phenolic components, and the Total Phenolic Content (TPC) of SCG was determined to be 2.16% (dry SCG basis). Furthermore, SCG was characterized in terms of Total Dietary Fiber content, which amounted to 66%. The SCG was valorized for the development of a bakery product (cookie) enhanced with fiber and bioactive polyphenols. Cookies were produced with the addition of 4% and 7% dry and defatted SCG (baked cookie basis). The produced cookie prototypes presented TPC and dietary fiber dependent on the addition level of SCG. TPC values were determined at 588 and 1017 ppm, while dietary fiber values were at 2.7 and 4.6%, respectively. The shelf life of the cookies was monitored over 143 days at three different temperatures (25 °C, 35 °C, and 45 °C) in terms of texture (hardness), color, Peroxide Value (PV), and TPC. It was observed that the PV value significantly increased in samples with incorporated SCG, stored at 45 °C, while in those stored at 25 °C and 35 °C, PV remained at low levels. The TPC of the SCG-enriched samples remained practically constant during the shelf life analysis, while color and hardness increased (mathematically modeled). SCG-added cookies were characterized by increased darkness, increased hardness, and a mild (desirable) coffee flavor. The overall sensory impression scores for 0%, 4%, and 7% SCG-added cookies were 7.5, 8.0, and 8.2, respectively. Based on sensory evaluation test results, the shelf lives of 0%, 4%, and 7% SCG at 25 °C were 359, 435, and 471 days, respectively. Overall, SCG is a potentially valuable ingredient that can be used to develop innovative food (baked) products with enhanced nutritional value and increased shelf life.

1. Introduction

Coffee is one of the most popular beverages around the world [1]. More than 70 countries are active in the field of coffee cultivation and export. According to statistics from the International Coffee Organization (ICO), global production for the years 2021/2022 was estimated at 168.5 million bags (60 kg per bag). The global consumption of coffee for 2021/2022 was 175.6 million bags (60 kg per bag), while Europe accounts for 31.5% of the annual global consumption [2]. Both the cultivation and coffee processing generate a large amount of waste. Coffee Silverskin (CS) and Spent Coffee Ground (SCG) are the main by-products from the coffee industry [3]. SCG consists of roasted and ground coffee beans that have been extracted during the brewing stage of the coffee beverage [4]. Considering the need to protect the environment and find renewable sources of energy and food, modern coffee industries are driven to develop by-product utilization strategies that allow not only the recovery of high nutritional value components but also their recycling through the creation of new products that find applications in various biotechnological sectors, such as the pharmaceutical, food, and cosmetic industries [5].
Spent Coffee Ground (SCG) consists of dark coffee powder with a high moisture content, as it has just been extracted with water or steam. It is observed that the SCG derived from small-scale extractions is richer in bioactive components than that obtained during the industrial production of instant coffee, since in the latter case, extraction conditions are chosen to maximize its performance. From 2000 to 2012, there has been an increase in the cultivation of green coffee on a global scale (17%), due to a 24% increase in production efficiency. Therefore, the increase in green coffee production also led to an increase in SCG production. SCG production amounts to six million tons per year worldwide, while one ton of fresh green coffee corresponds to 650 kg of SCG. This by-product contains many organic substances (e.g., lipids, amino acids, polyphenols, minerals, and polysaccharides) and thus becomes a suitable by-product for utilization [1,6,7,8].
The content of dietary fiber in SCG amounts to 62% w/w, where 20% of this is soluble fiber and the rest, 80%, is insoluble fiber [1]. Cellulose, mannans, galactomannans, type II arabinogalactans, and hemicellulose (which consists of mannose, galactose, and arabinose) are the major polysaccharides of the corresponding residue. Bioactive compounds, such as antioxidants and proteins, can be simultaneously isolated alongside dietary fibers as accompanying compounds. For example, coffee by-product fibers have antioxidant properties (2.4 mmol of Trolox/100 g dry weight) [7]. Thus, dietary fiber from SCG can be categorized as antioxidant dietary fiber, which is likely to be used as a food additive [6,7,8,9]. The antioxidant activity of the by-product is mainly due to its high phenolic content. According to research, where extractions (solvent extraction procedure using ethanol/water% v/v 0:100 and 60:40) were carried out on coffee residue to recover the natural antioxidants, the phenolic content was quantified, and the results showed that SCG contains 16–35 mg expressed as gallic acid equivalents per gram of dry sample [10,11]. The main phenolic components are chlorogenic acids (mainly 3-Caffeoylquinic acid—3-CQA) and free caffeic acid. These ingredients are very important for human health thanks to their antioxidant action. Caffeic acid corresponds to the phenolic part of all chlorogenic acids and belongs to the C6-C3 class of phenols. In chlorogenic acids, caffeic acid is esterified with quinic acid (Caffeoylquinic acids, CQAs). The percentage of phenolic components in the extract of the by-product depends on the variety of coffee and the type of extraction used. The concentration of chlorogenic acids amounts to 6.22–13.24 mg/g, which is four times higher than the corresponding concentration in the coffee beverage [6,12].
Dried SCG is in powder form and can be directly mixed with flour for the preparation of bakery products such as cookies. Cookies (small, flat, and baked food products usually containing fat, flour, eggs, sugar, baking agents, and other ingredients) hold an important position in the snack food industry due to their variety in taste, crispiness, and digestibility [13]. They also offer a valuable vehicle for supplementation with nutrients because of their popularity, relatively low cost, varied taste, ease of availability, high nutrient density, and long shelf life [14]. Extensive research has been conducted on using coffee industry by-products (coffee Silverskin CS and Spent Coffee Ground SCG) as a source of dietary fiber in cereal-based and/or bakery foods [15,16,17,18,19,20,21,22]. Coffee Silverskin has been explored for other applications such as a fat-replacer in cakes [20], as a nutraceutical ingredient in yogurt [23,24], as a weight-control agent in antioxidant beverages [25], and as a feed additive or fishmeal [26,27]. Ateş and Elmaci (2018) concluded that water-treated CS could be used as a fat substitute up to 30% in cake formulations to improve cake for high fiber content with no significant alterations on cake quality or sensory characteristics [20]. Dauber et al. (2024) studied CS powder (CSP) or ultrasound CS extract (UCSE) in the elaboration of cookies. They reported that in the cookies containing UCSE, the sensory acceptability was not modified with respect to the control cookies, and an increase in TPC and antioxidant activity was achieved. However, the incorporation of CSP leads to a decrease in acceptability, despite the fact that the cookies constitute a source of fiber [21]. Cantele et al. (2022) found that a 4% replacement of the wheat flour with decaffeinated CS could give a final product with a high content of accessible polyphenols and a biscuit appreciated by the consumer [28].
The present study aims to utilize the main coffee industry by-product, Spent Coffee Ground (SCG), through its incorporation into bakery products in pursuit of manufacturing innovative products with enhanced nutritional value.

2. Materials and Methods

2.1. Spent Coffee Ground Supply and Materials

Spent coffee ground (SCG) derived from 100% Colombian Arabica coffee beans was kindly provided by a local coffee shop (Coffee Lab, Athens, Greece). Considering the stability and freshness of raw material, immediately after its supply (in the same day), 1370 g of SCG was divided into six equivalent weight portions, vacuum sealed (BOSS NT421q, Boss Verpackungsmaschinen GmbH & Co. KG, Höhe, Germany), in Polyethylene-Polypropylene bags (PE-PP), and stored at −40 °C until further analysis.

2.2. Freeze Drying of Spent Coffee Ground

The frozen SCG was transferred to a Christ Alpha 1–4 LD Plus freeze-drier (Martin Christ GmbH, Osterode, Germany), where the vacuum pump reduced the pressure to 0.03 Mbar. The temperature was lowered to −50 °C, the sublimation of solid water to gas commenced, and the cycle lasted 48 h. After the freeze-drying cycle, the moisture content was determined via the gravimetric method. Then, 5.00 g of freeze-dried SCG was weighed into a glass vial and placed in an oven at 105 °C for 12 h. Subsequently, the vial was weighed again after reaching room temperature in a desiccator. The analysis was performed in duplicate.

2.3. Extraction of Phenolic Compounds from Spent Coffee Ground

A quantity of 20.0 g of SGC was placed in a fixed-bed extractor. A peristaltic pump was used to pump the solvent through the packed bed extractor at a flow rate of 6 mL/min, while the extract was collected in a volumetric cylinder. Aliquots of the extract were collected every 15 min to check the color of the extract. Once the extract’s color faded significantly, the cycle of extraction was completed. Four different solvents of different polarities were used sequentially to find the Total Phenolic Content of SCG (100% DI H2O, 1:1 MeOH-H2O, 1:1 scetone-H2O, and 100% acetone). The solvents were sorted based on their descending polarity and used in the following order: the more polar solvents extract the more polar phenolic compounds, while the less polar solvents extract the less polar phenolic compounds. The solvents were used in the following sequence: 100% DI H2O, 1:1 MeOH: H2O, 1:1 acetone:H2O, and 100% acetone.

2.4. Total Phenolic Content (TPC) Determination (Folin–Ciocalteu)

The present method was based on a previously reported method with some modifications [29]. An aliquot (7.9 mL) of DI water was transferred into the test tube, followed by the addition of 100 μL of extract and 500 μL of Folin–Ciocalteu reagent (Merck KGaA, Darmstadt, Germany). The mixture was stirred, 1.5 mL of saturated Na2CO3 solution (95%, Merck KGaA, Darmstadt, Germany) was added, and the final solution was thoroughly mixed. A blank sample was prepared with the same methodology as described, but the 100 μL of extract were replaced with an equivalent aliquot of DI water. The test tubes were stored for 2 h in a dark place. After 2 h, the absorbance of the samples was measured via UV/Vis spectrophotometer at 765 nm. The number of replications was n = 2. Gallic acid (Sigma Aldrich Chemical Co., St. Louis, MO, USA) was used for the development of the calibration curve, and all the results were expressed as mg Gallic Acid Equivalents (GAE) per L of solution (mg GAE/L). Then, depending on the determination, the final expressions were mg GAE/g dry SCG and mg GAE/g dry cookie.

2.5. HPLC-DAD Analyses of Phenolic Compounds

The identification and quantification of phenolic compounds was performed according to a well-established analytical method, as described in previous publications [29,30]. Chlorogenic acid (3-O-caffeoylquinic acid, 3-CQA) (Cambridge Biosciences, 95%, Cambridge, UK) was used for the development of the calibration curve, and all CQAs were quantified as chlorogenic acid equivalents. Neochlorogenic acid (5-CQA) (Extrasynthese, Genay, France) was also used as an internal standard so as to identify the respective peak in the extracts.

2.6. Total Dietary Fiber (TDF) Content Determination of Spent Coffee Ground

The determination the Total Dietary Fiber content of defatted Spent Coffee Ground (SCG) was based on the Megazyme kit assay K-TDFR-100A/K-TDFR-200A 04/17 (Bray Business Park, Bray, Co. Wicklow, Ireland). The method is comprised of three steps as follows: enzymatic digestion of SCG, ash content determination, and bound nitrogen content determination via the Kjeldahl method. The assay complied with the standard method for Total Dietary Fiber determination in foods, AOAC 985.29 [31,32].

2.6.1. Defatting and Oil Content Determination of SCG

A 20.0 g quantity of SGC was placed in a fixed bed extractor. The extraction was carried out using hexane, and once the extraction was completed, the hexane solution containing the extracted oils from SCG was transferred to a pre-weighed flask. The flask was attached to the rotary evaporator, Hei-VAP Value Digital (Heidolph, Schwabach, Germany). The pressure was decreased to P << 1 atm, and the sample was heated up to 40 °C for 25 min. Once the solvent was evaporated, the flask was weighed again to determine the oil content.

2.6.2. Enzymatic Digestion of Spent Coffee Ground

The dry and defatted SCG (1.0 g) was suspended within a beaker in 50 mL of 0.08 M phosphate buffer (pH = 6) (Panreac Química SLU, Castellar del Vallès, Barcelona, Spain). A 50 μL aliquot of thermostable α-amylase solution (Megazyme cat. no. E-BLAAM, Wicklow, Ireland) was added to the mixture. The beaker was covered with several layers of aluminum foil, placed in a water bath at 100 °C for 15 min, and agitated periodically. After the digestion of α-amylase, the beaker was removed from the water bath and cooled to ambient temperature. The pH of the solution was adjusted to 7.5 ± 0.1 by adding portions of 0.275 N NaOH solution (Lach-Ner, s.r.o., CZ—Neratovice, Neratovice, Czechia) before injecting an aliquot of 100 μL protease solution (Megazyme cat. no. E-BSPRT). The beaker was covered with several layers of aluminum foil and placed in a water bath at 60 °C with continuous mild agitation for 30 min. After the digestion of protease, the solution was removed from the water bath and cooled to ambient temperature. The pH was adjusted to 4.5 ± 0.1 using 0.325 N HCl solution (Panreac Química SLU, Castellar del Vallès, Barcelona, Spain), followed by the addition of 200 μL of amyloglycosidase solution (Megazyme cat. no. E-AMGDF). The beaker was covered with several layers of aluminum foil and placed in a water bath at 60 °C under continuous mild agitation for 30 min. After the digestion of amyloglycosidase, the solution was mixed with 280 mL of preheated (T = 60 °C) 95° EtOH (BG Spiliopoulos, Patras, Greece) in a 500 mL beaker. The solution was left at rest for 1 h for precipitation. The solution was filtered under vacuum on pre-weighed filter paper. The pellet was dried in an oven at 100 °C until it reached a constant weight, and the weight of the digested SCG was determined gravimetrically. The number of replications was n = 2.

2.6.3. Ash Content Determination of Enzymatically Digested Spent Coffee Ground

An aliquot (0.50 g) of enzymatically digested Spent Coffee Ground was placed in a dried and pre-weighed porcelain crucible. The crucible was placed in an ash furnace and heated up to 525 °C for 5 h. The ash content was determined gravimetrically (ICC standard No. 104/1 [33]). The number of replications was n = 2.

2.6.4. Total Kjeldahl Nitrogen (TKN) Determination of Enzymatically Digested Spent Coffee Ground

Total Kjeldahl Nitrogen (TKN) was determined (AOAC 979.09) [34]. The solid material of enzymatically digested SCG (0.500 g), 10.0 g of K2SO4 (Carl Roth Gmbh & Co. kg, Karlsruhe, Germany), 1.0 g of CuSO4·5H2O (Panreac Química SLU, Castellar del Vallès, Barcelona, Spain), 25 mL of 95–98% H2SO4 (Fisher Scientific, Waltham, MA, USA), and two boiling stones were added to a Kjeldahl glass vessel. The vessel was placed in a Kjeldahl combustion device and heated mildly for 35 min before being heated vigorously for another 30 min. The vessel was cooled to an ambient temperature before 75 mL of DI water and 125 mL of a 32% w/v NaOH solution (Lach-Ner, s.r.o., CZ—Neratovice) were transferred into the vessel. Then, the sample was placed in a Kjeldahl distillation device, where the distillation commenced. The distillate was collected in a beaker, which contained 50 mL of 0.5 N sulfuric acid. Once 200 mL of distillate were collected, the remaining sulfuric acid was titrated with a 0.5 N NaOH solution with methyl red-methylene blue as a color indicator, while a blank titration was performed as well. The TKN was determined using Equation (1) as follows:
T K N % = 1.4004 V 1 V 2 N β
where V1 and V2 are the consumed volumes of NaOH solution for the regular and blank samples, respectively. N is the normality of NaOH solution, and β is the weight of enzymatically digested SCG in grams.
The TDF content of SCG was determined using Equation (2) as follows:
T D F % = S C G r e s i d u e ( 1 T K N % A s h % ) S C G d e f a t t e d 1 + O i l 100
where SCGdefatted is the defatted SCG; Oil is the oil content of dried SCG; SCGresidue Spent Coffee Ground residue as derived by enzymatic digestion; TKN% is the total Kjeldahl Nitrogen in SCG; and Ash% is the ash content of SCG.

2.7. Preparation of Cookies

All-purpose flour, baking powder, salt, dried and defatted SCG, butter, sugar, and eggs were combined by means of an electric mixer (Chef KM400, Kenwood, Woking, UK) for 20 min. First, butter and sugar were mixed for 10 min at high speed, followed by the gradual addition of the eggs and mixing for 7 min. Finally, the flour and other ingredients were added and mixed for 5 min at a low speed. Cookies of 30 g were formed and baked at 180 °C (FD 240, Binder, Tuttlingen, Germany) for 20 min.
The cookies were cooled at ambient temperature for 120 min and packed in Polyethylene-Polypropylene bags (PE-PP). The mass of cookie dough and baked cookies was measured to calculate the mass loss during baking. The detailed concentration of ingredients is presented in Table 1. It should be noted that the incorporation of SCG in cookies was performed by substituting flour. About 3.44 g and 5.95 g of flour per 100 g of cookie dough were substituted with SCG in Cookie Formulas A and B, respectively. The cookies were stored at three different temperatures of 25 °C, 35 °C, and 45 °C, and sampling was carried out approximately every 30 days to monitor the product’s shelf life.

2.8. Moisture Content of Cookies

Cookie samples of 1.000 g (n = 3) were heated in an oven at 100 °C for 24 h (AOAC 23.003) [35].

2.9. Color Measurement of Cookies

The color of cookies was determined by measuring the L, a, and b parameters via a CR-200 colorimeter (Minolta, Tokyo, Japan). The colorimeter was calibrated against a white-colored tile before each batch measurement. Color measurements were taken at three different points on the top side of the cookie. The color measurement on cookies was conducted to monitor the color change at different storage temperatures (25 °C, 35 °C, and 45 °C). The color change as well as the browning index during storage time were calculated using Equations (3) and (4), respectively [36].
Δ Ε = L L o 2 + a a o 2 + b b o 2
B I = 100 ( x 0.31 ) 0.172 , x = a + 1.75 L 5.645 L + a 3.012 b
where ΔE is the total color change, L is the perpetual lightness, and a and b are the color parameters that represent the red, green, blue, and yellow colors. The subscript “o” in Equation (4) indicates the parameters at t = 0 days.
Data analysis on the acquired data points showed that the change in color expressed by ΔΕ index at all the monitored temperatures (25 °C, 35 °C, and 45 °C) follows a sigmoid curve of three parameters (Equation (5)).
Δ Ε = Δ Ε m a x 1 + exp t t o k
where Δ Ε m a x is the maximum monitored color change (ΔΕ) of the cookie; t o is the minimum storage time, where Δ Ε = Δ Ε m a x ; and k is the constant of color change.

2.10. Texture Analysis of Cookies

A TA-XT2i texture analyzer (Stable Micro Systems Ltd., Surrey, UK) equipped with a 5 kg load cell was employed to determine the breaking force of the cookie by attaching the three-point break (HDP/3PB) probe to the instrument’s arm. Force and distance calibration were performed prior to each batch measurement. The cookie was divided evenly into four quarters, and one quarter was placed in such a direction that the oncoming blade would divide it into two equally smaller pieces. The “break biscuit” protocol was used to determine the breaking force of the cookie, and the following parameters were specified: Pre-Test-Speed: 1 mm/s, Test-Speed: 2 mm/s, Post-Test-Speed: 10 mm/s, Distance: 7 mm, and Trigger Force: 0.049 N. The number of replications was n = 3.
Data analysis on the acquired data points showed that the hardness vs. storage time for all cookies at all monitored temperatures follows an exponential curve of three parameters (Equation (6)).
H = H ο + a ( 1 e b t )
where H is the hardness expressed in Newton; Ho is the initial hardness; a and b are the equation parameters expressed in Newton and days−1, respectively; while t is the storage time expressed in days.

2.11. Sample Preparation of Cookies for Total Phenolic Content (TPC) and Peroxide Value (PV) Determination

A pre-weighed portion (35.0 g) of milled cookie (Nutribullet Blender, Los Angeles, CA, USA) was suspended in 70 mL of hexane in a 250 mL beaker (Analytical Grade, CARLO ERBA Reagents SAS, Val de Reuil, France), and the mixture was stirred for 10 min. Then, the beaker was removed from the magnetic stirring plate and left to stand for 3 min to achieve phase separation between the liquid and the solid residue. The extract was retrieved via filtration and placed in a 500 mL round-bottom flask. The filtered cookie solid was resuspended in 70 mL of hexane, and the same procedure was performed two more times. The extracts were combined, and the oil was retrieved via hexane evaporation, as described in Section 2.6.1. The Peroxide Value (PV) of the resulting oil was analyzed as per Section 2.12.
The defatted, milled cookie was left at ambient temperature for 24 h for the evaporation of the remaining hexane. Then, 6.00 g of dried and defatted cookie powder was suspended in a 30 mL 50% MeOH solution to extract the total phenolic compounds. The extraction protocol was identical to the one previously described for the defatting of dry cookies. The collected extracts were heated (T = 40 °C) under low pressure (P << 1 atm) to remove the methanol fraction. The concentrated extract was stored at 4 °C for 24 h for the precipitation of residual solids from the cookie matrix. After 24 h, the extract was filtered (PVDF Membrane Filter, 0.22 μm, Millipore® Solutions, Merck SA, Darmstadt, Germany), and 10 mL of concentrated solution was stored in a vial at −16 °C for further analysis.

2.12. Peroxide Value Determination

The Peroxide Value was based on a published method [29]. For this, 4.0 g of oil was mixed with 20 mL of CH3COOH:CHCl3 (3:2) solution (Analytical Grade, Merck KGaA, Darmstadt, Germany) and 500 μL of saturated KI solution (Merck KGaA, Darmstadt, Germany) before the mixture was agitated for 1 min. A 20 mL aliquot of DI water and 500 μL of starch solution indicator were added to the mixture, and the solution was titrated with 0.01 N Na2S2O3 solution (Merck KGaA, Darmstadt, Germany). The Peroxide Value (PV) was determined using Equation (7).
P V = V s V b 10 m o i l ,
where Vs and Vb are the consumed volumes of 0.01 N Na2S2O3 solution for the sample and the respective blank determination, and moil is the mass of oil in grams.

2.13. Sensory Evaluation

The sensory characteristics of the cookies (control, 4% SCG-added, and 7% SCG-added cookies) were carried out using a panel of 8 members. The scored characteristics of the developed cookies are described as follows: intensity scale 1–9: appearance, color, odor, hardness, crispiness, flavor, coffee aroma, off-flavors, rancidity, and acceptability-hedonic-scale 1–9: appearance, color, texture (overall impression), flavor, after taste, and overall acceptability. Overall sensory quality/liking encompasses the panelists’ general opinion about the examined samples and is usually a good indicator of the evolution of a product’s quality. The dependence of the overall sensory liking on storage temperature is described by the following zero-order equation (Equation (8)):
S t = S 0 ± k s t
where S is the sensory score at time t, S0 is the sensory score at time zero, and ks is the rate of score deterioration. The dependence of the model parameter ks for the primary model (Equation (8)) on storage was mathematically modeled using the Arrhenius equation (Equation (9)):
k = k T r e f exp E a R 1 T 1 T r e f
where Ea is the activation energy of the parameter k, kTref is the deterioration rate at the reference temperature Tref, and R is the universal gas constant. The shelf life was then determined by the overall sensory acceptance as a function of storage temperature, as follows (Equation (10)):
S L s = S 0 S L k s T r e f exp E a s R 1 T 1 T r e f
where SL is the acceptance limit of the sensory parameter S fixed to 5.

2.14. Data and Statistical Analysis

The data fitting of color (ΔΕ) and hardness vs. storage time was performed via Sigmaplot 10 software (Systat Software Inc., Chicago, IL, USA, 2018). The effect of temperature and % SCG concentration of cookies on the shelf life parameters (i.e., ΔΕ, hardness, PV, and TPC) was investigated by performing a two-way ANOVA. The level of significance was set at p = 0.05 for the statistical test. A post-hoc analysis (i.e., Duncan test) was performed to investigate the effect of storage temperature and % SCG on modeled parameters.

3. Results and Discussion

3.1. Spent Coffee Ground Characterization

Spent Coffee Ground was supplied with an initial high moisture content, which was derived due to the extraction process via espresso machine. It was important to remove the contained moisture prior to any analysis. Considering the preservation of phenolic compounds, which might be unstable at high temperatures [36], the freeze-drying process was selected as the most suitable method to remove the contained moisture. The determined moisture content of raw SCG was 62 ± 2%.
The dried SCG was subjected to sequential extractions with four solvents of decreasing polarity, namely, water, MeOH:H2O (1:1), acetone:H2O (1:1), and pure acetone. The former two consist of higher polarity extracts, and the latter two consist of lower polarity extracts. Yields of both total solids and total phenols were determined. The results are presented in Table 2. The extract yields, in terms of total solids, were 60 ± 9 mg/gdry SCG, 17 ± 3 mg/gdry SCG, 11.0 ± 0.4 mg/gdry SCG, and 103 ± 5 mg/gdry SCG, respectively. Therefore, the total extractable material amounted to 191 mg/gdry SCG, of which 40% consisted of higher polarity compounds and 60% of lower polarity compounds. This is reasonable since SCG is the by-product of coffee brewed by hot water, and the majority of polar compounds have already been recovered. In contrast, only a minor part of the lipid fraction, mainly aroma compounds, has been extracted by hot water extraction, and the majority of lower polarity compounds are still present in SCG.
As presented in Table 2, the Total Phenolic Content (TPC) of the extracts was also determined via the Folin–Ciocalteu method. The TPC yields of the extracts were also determined on the basis of dry SCG and amounted at 11.0 ± 0.6 mg GAE/gdry SCG, 5.0 ± 0.2 mg GAE/gdry SCG, 2.2 ± 0.1 mg GAE/gdry SCG, and 3.3 ± 0.1 mg GAE/gdry SCG, respectively. The Total Phenolic Content of the four extracts combined was 21.6 ± 0.7 mg GAE/gdry SCG, whereas the contribution of higher and lower polarity extracts was 74% and 26%, respectively. The majority of phenolic compounds were extracted via the most polar solvent, that is, H2O (51.1%). MeOH:H2O (1:1) solvent extracted 23.3% of total TPC. Acetone:H2O (1:1) extracted 10.4%, while pure acetone extracted 15.2% of TPC. It is highly unlikely that the latter two successive extracts actually contain phenolic compounds but rather other reducing components that also respond to the Folin–Ciocalteu assay. The numerous non-phenolic compounds have been studied for interference with Folin–Ciocalteu method, as reported in the literature [37,38,39]. Among the compounds studied, several coffee-related compounds can be detected. The compounds in the respective literature that might be present in the lower polarity extracts of SCG are caffeine, theobromine, theophylline, furfural, and hydroxymethyl furfural, but none of the above have demonstrated interfering activity with the Folin–Ciocalteu reagent. However, the lower polarity ingredients of SCG, such as coffee oil, aroma compounds, coffee diterpenes, etc., constitute a complex mixture of components. Just the volatile fraction of coffee is composed of more than 900 compounds, which can be classified into several categories, such as (in order of abundance) furans, pyrazines, ketones, and pyrroles [40]. It would be very intriguing to search for non-phenolic, interfering compounds using the Folin–Ciocalteu method in such a complex mixture.
According to the HPLC analyses, mainly water extracted the CQAs. The HPLC chromatograms of water and MeOH:H2O (1:1) extracts, monitored at 320 nm, are presented in Figure 1. Most of the peaks produced chlorogenic-type spectra, while no flavonoids were detected. Chlorogenic as well as neochlorogenic acids were identified with the use of the respective pure compounds as internal standards. It can be observed that water extracted the majority of CQAs, while the MeOH:H2O mixture recovered mainly the residuals of CQAs from the water extraction. The methanol–water mixture additionally extracted 3 CQAs with retention times of 32.8, 33.9, and 36.8 min, and the water either recovered them as traces (former two) or did not extract them at all (CQA, with a retention time of 36.8 min).
The peaks that presented the characteristic spectrum of chlorogenic acid (3-CQA) (Figure 1) were summed, and their concentration in each extract was calculated according to the calibration curve of 3-CQA. The recovery of chlorogenic acids by the successive H2O and MeOH:H2O extractions was determined at 6.5 ± 0.4 and 0.98 ± 0.07 mg/gdry SCG, respectively. Chlorogenic and neochlorogenic acids were the most abundant CQAs, presenting concentrations of 2.43 ± 0.06 and 1.00 ± 0.04 mg/gdry SCG, or 37.3% and 15.4% of total CQAs, taking into consideration both higher polarity extracts. In general, the micromolecular phenolic components of SCG were recovered by the polar solvents, and the mixture MeOH:H2O was characterized as the most efficient since it not only extracted the residual phenolics that water could not recover but also the 3 lower polarity CQAs that were in traces or absent from water extract.
The following acetone–water and pure acetone extractions did not recover any CQAs (chromatograms not shown) or flavonoids, but at the same time, they possessed 25.6% of the TPC content of SCG. Hwang et al. (2019) [41] identified a- and b-tocopherols in the acetone extract of defatted SCG. The compounds consisted of low-polarity phenolics reactive to the Folin–Ciocalteu reagent. The total tocopherol content of SCG has been determined by Loyao et al. at 193.5 μg/gSCG [42]. In the current research, the lower polarity extracts presented TPC in total of 5.5 mg GAE/gdry SCG, almost 30-fold higher than the expected tocopherols. Therefore, TPC values cannot be justified only by tocopherols. The chromatograms of acetone–water and acetone extracts were examined thoroughly for the detection of tocopherols, but no relevant UV spectra were identified. This contradiction could be attributed to non-phenolic compounds that react with the Folin–Ciocalteu reagent, as mentioned above.
The low polarity content of SCG exhibits a high yield, up to 11%, according to the fractionation experiments presented in Table 2, a fact that could render coffee oil an exploitable material for future studies. It has been reported that the application of Soxhlet extraction with seven different (polar or non-polar) solvents on SCG at a range of temperatures (boiling point: 60–111 °C) yielded 9% to 15% oil content per dry base [43]. Furthermore, the low-polarity material could present a severe sensory impact after the incorporation of SCG in cookies. Therefore, it was decided to remove the coffee oil material prior to the addition of SCG to the cookie dough. In the present study, SCG oil removal was carried out with hexane extraction at ambient temperature. A series of direct hexane extractions on dry SCG yielded 12.2 ± 0.5% of SCG oil (Table 2).
The Total Dietary Fiber (TDF) determination was approached by employing the enzyme digestion methodology, as per the K-TDFR-100A/K-TDFR-200A 04/17 Megazyme kit, on defatted SCG. Analysis showed that the TDF of SCG was 66 ± 5% on a dry basis. This finding is in accordance with other previously reported TDF content determinations. It was reported that application of the same enzymatic digestion kit to dry SCG resulted in 60 ± 2% Total Dietary Fiber [1] (Table 2). TKN% and Ash% were determined as 2.0 ± 0.1% (in both cases) on dry SCG.

3.2. Moisture Content of Cookies and SCG Concentration in Baked Products

The SCG incorporation per baked control cookie and baked cookie formulas A and B was 0%, 4%, and 7%, respectively. The moisture content was determined at 7.0 ± 0.1%, 6.5 ± 0.4%, and 4.0 ± 0.4%, concerning control, formula A, and formula B, respectively.

3.3. Cookie Characterization

The cookies (control and SGC-added) were characterized as presented in Table 3. Before the incorporation of SCG into the cookie recipe, the oil content was removed by extraction. An additional extraction with a MeOH–water (1:1) mixture was then performed to determine the TPC of the defatted SCG. According to the TPC of SCG and the SCG content in the two recipes, the phenolic content of the two sets of cookies was expected to be 742 and 1283 mg GAE/kg, respectively. However, the respective TPCs were determined to be 588 and 1017 mg GAE/kg cookies. Excluding the 68 mg GAE/kg cookies of the control, the loss of phenolic compounds during baking ranges between 20 and 26%.
Cookies with 4% and 7% SCG contained fiber at 2.65 ± 0.18% and 4.64 ± 0.32% on a dry basis. According to the nutrition claims regulation by the European Union [44], cookies with 7% SCG are considered a source of dietary fiber (TDF ≥ 3 g/100 g cookie). The minimum percentage of SCG required to qualify the cookie as a “product with a high dietary fiber content” (TDF ≥ 6 g/100 g of cookie) is 9% coffee by-product.

3.4. Shelf Life Analysis of Produced Cookies

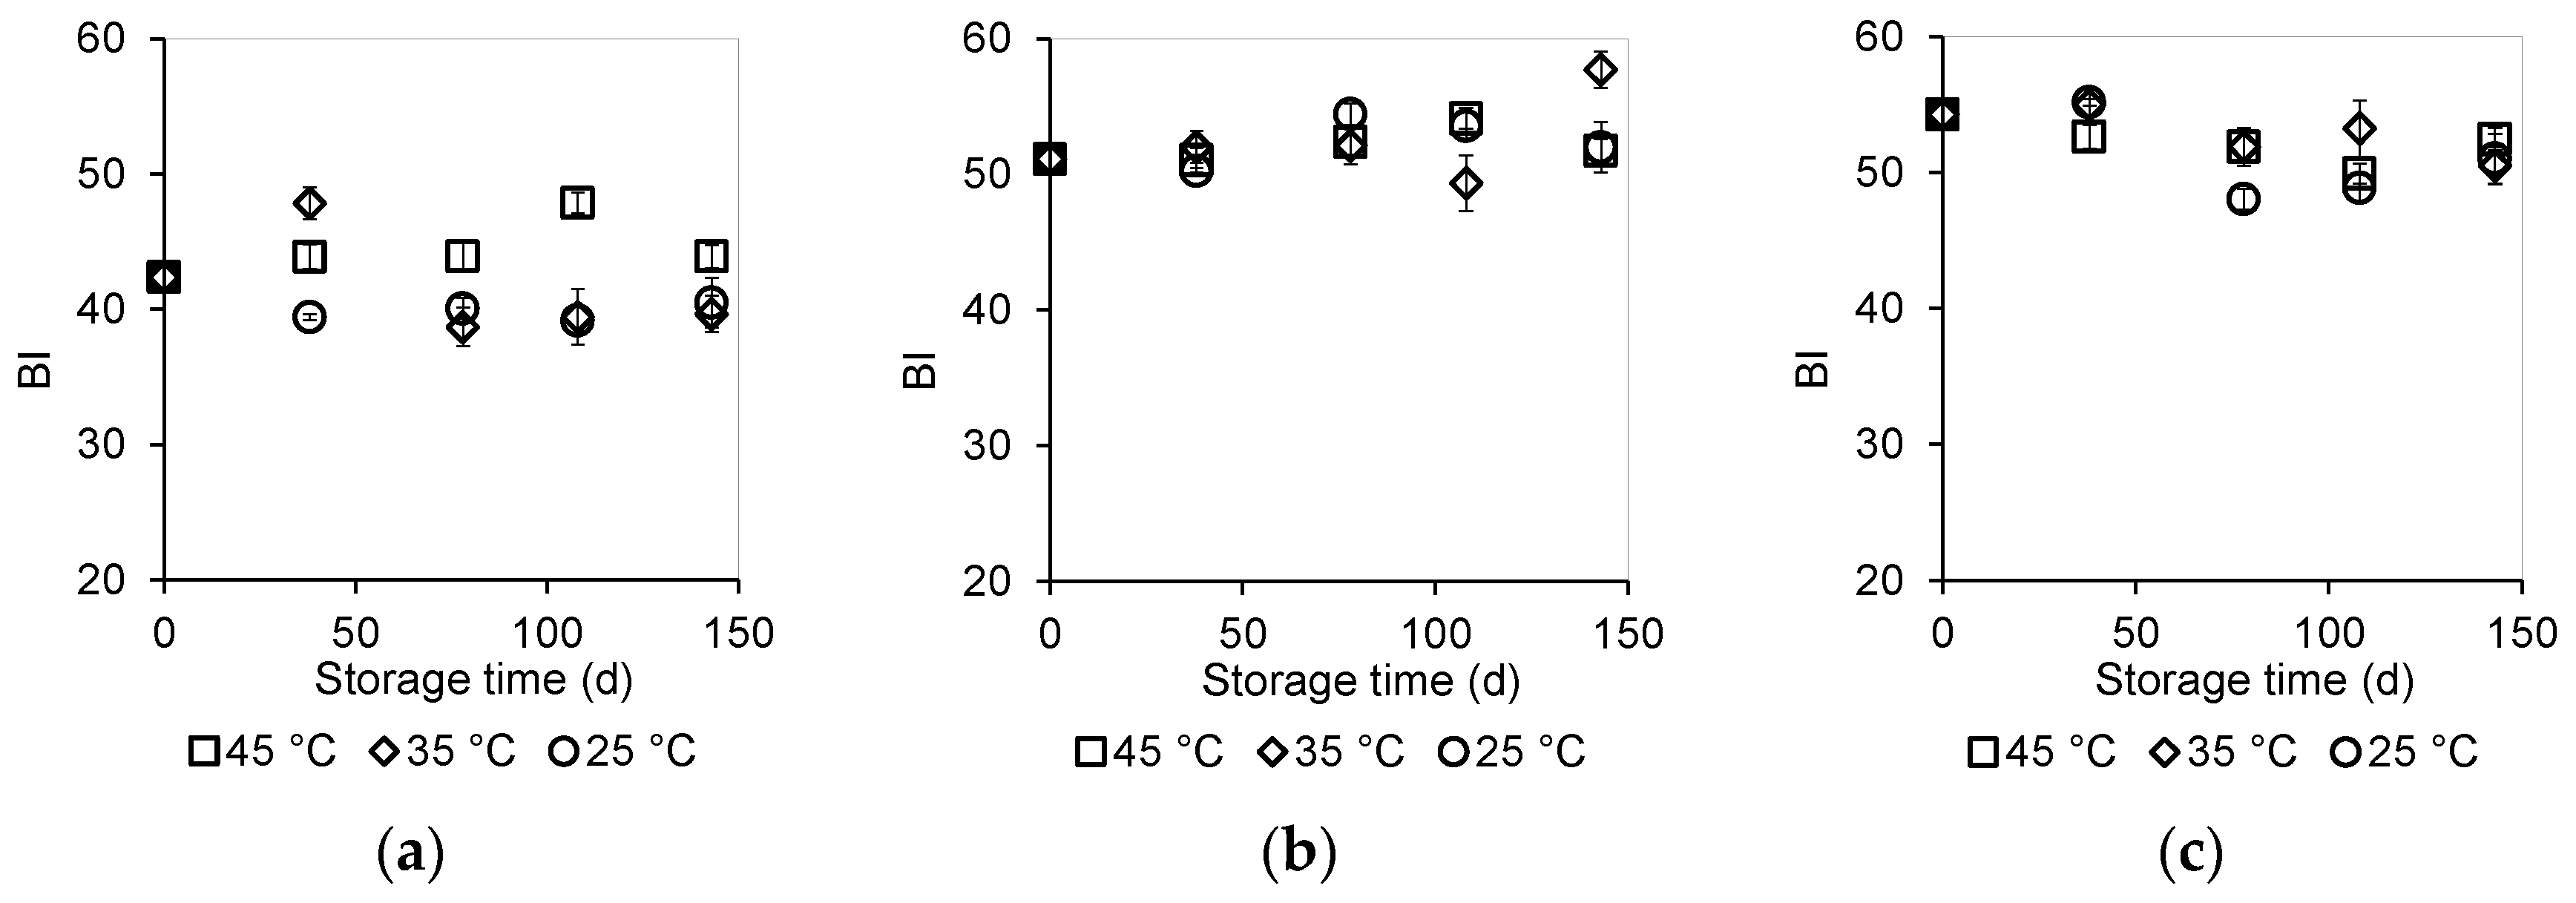
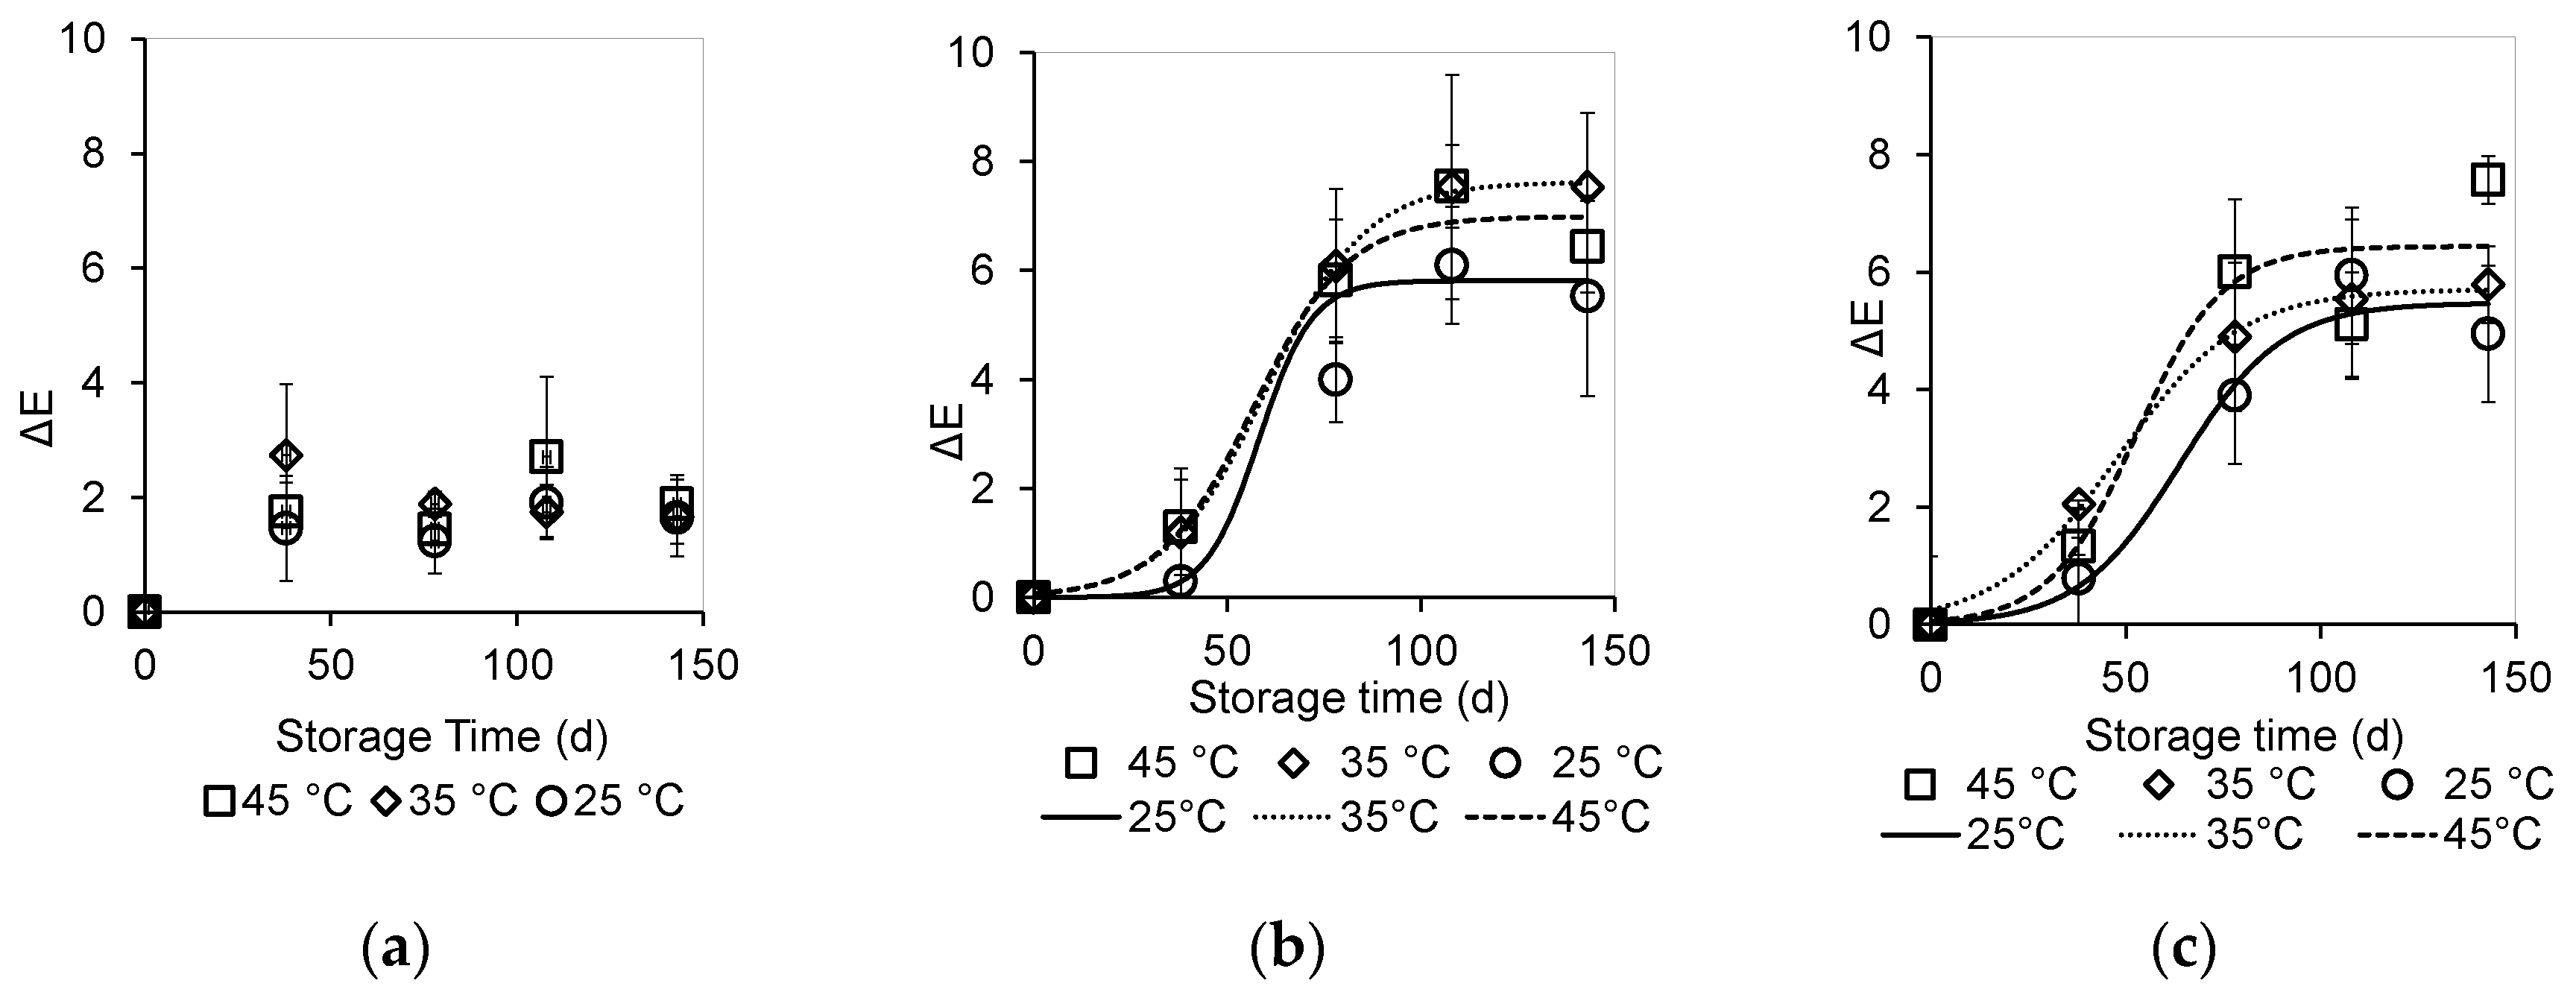
3.4.1. Color Measurement

Maillard and caramelization reactions that occur during baking at high temperatures are mainly associated with cookie color, depending on the ingredients’ color. SCG-added cookies were characterized by a darker color (lower L), a more red color (higher a), and a blue color (lower b) derived from the SCG beige-brown coloration compared to the non-SCG-added cookies. The color parameters of control cookies are presented in Table 3. Incorporation of SCG induced a darkening of cookie color (significantly lower L values; p < 0.05), as previously reported for fiber-enriched breads [25,32]. Increasing the SGC content further reduced the L value.
Browning Index (BI) values of control, 4% SCG-added, and 7% SCG-added cookies were calculated as 42.38 ± 1.27, 51.10 ± 3.18, and 54.27 ± 1.72, respectively. BI values for control, 4% SCG-added, and 7% SCG-added cookies during their storage at 25, 35, and 45 °C are presented in Figure 2a–c. As expected, higher browning index values were obtained for SCG-added cookies compared to the values of control cookies, initially and during storage. No trends were observed during storage for each cookie.
A color change, expressed by the ΔΕ index, during storage was observed for control, 4% SCG-added, and 7% SCG-added cookies. The ΔΕ values of SCG-added cookies were significantly higher for storage times >50 days (approximately ΔΕ = 2) (p < 0.05). The ΔΕ values of control cookies remained low (approximately ΔΕ = 2 and stabilized at ΔΕ = 6.0–7.6) during storage. The color change in cookies has been attributed to lipid oxidation. As reported in the literature, oil oxidation leads to the formation of brown-colored compounds [45,46,47]. In this study, the color change was not connected to the lipid oxidation of cookies during their storage. Data analysis on the acquired data points showed that the change in color for SCG-added cookies for all the monitored temperatures (25 °C, 35 °C, and 45 °C) followed a sigmoid curve of three parameters (Equation (5); Figure 3a–c; Table 4). The parameters that changed significantly (p < 0.05) were the ΔEmax and to values of the 7% SCG-added cookie at temperatures ≥ 35 °C.

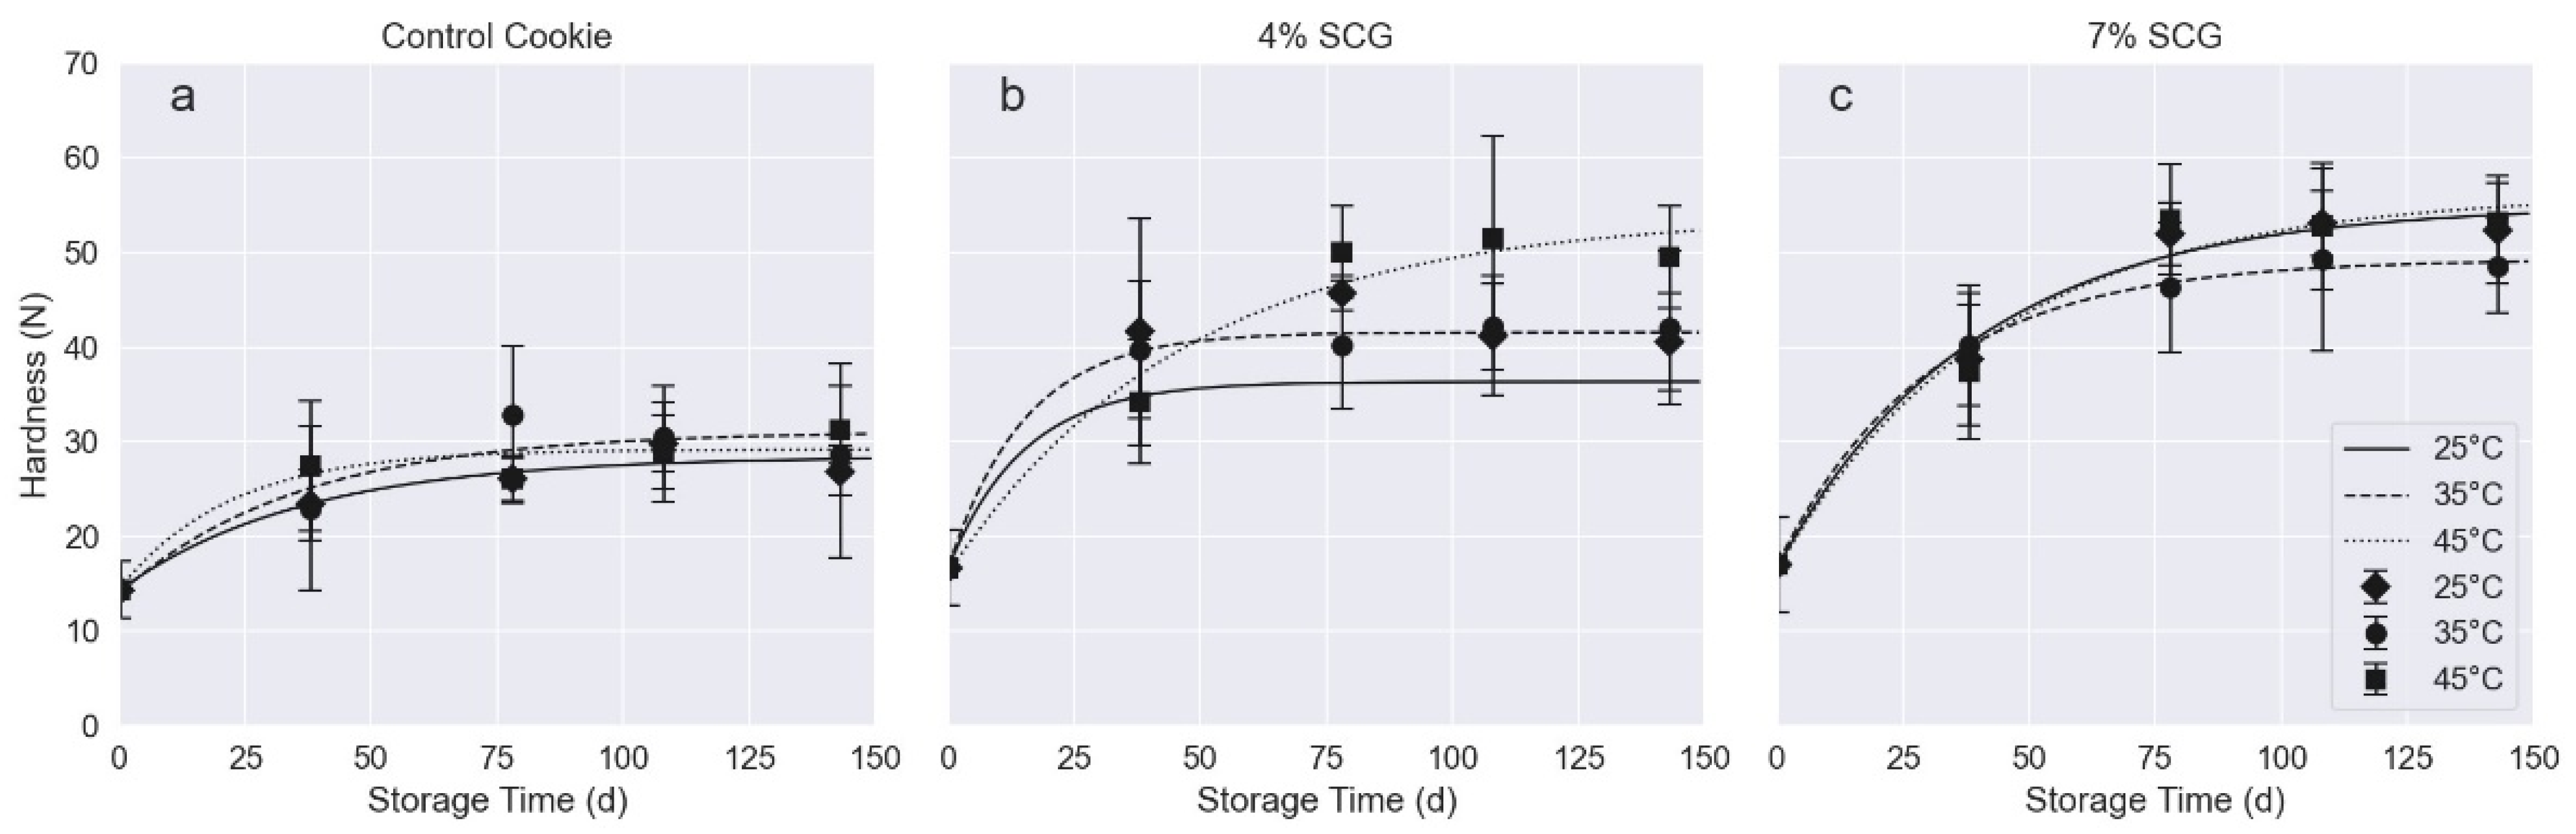
3.4.2. Texture Analysis

Texture analysis on cookies was conducted to monitor the hardness change during storage time at different storage temperatures (25 °C, 35 °C, and 45 °C) (Figure 4a–c). Data analysis on the acquired data points showed that the hardness vs. storage time for all cookies at all monitored temperatures follow an exponential curve of three parameters with good R2 (0.89–0.99) (Equation (6); Figure 4a–c). The addition of SCG resulted in harder cookies, as also reported in the literature [48]. It was observed that the hardness increased with storage time. This increase was more pronounced for 7% SGC-added cookies, followed by 4% SGC-added and control cookies. The same was observed in previous studies [49,50,51]. Morais et al. (2018) reported that the increase in hardness corresponded to a decrease in the moisture content of the product during storage at different temperatures [51]. The availability of water in biscuit products affects gel formation due to the starch retrogradation process, which causes hardness in such products. The hardening due to moisture loss is one of the main factors that determines the shelf life of baked products, including cookies [52].
The fitted parameters of Equation (6) are presented in Table 5. The parameter Hinf represents the final value of hardness at t → infinity. A Duncan test was performed to examine the effect of SCG% on the Hinf parameter for each temperature separately.

3.4.3. Peroxide Value

Peroxides are the primary oxidation products of fats, which are not perceptible organoleptically since they are tasteless and odorless but show high toxicity and promote biological oxidations in the human body. Therefore, the concentration of peroxides is one of the most important indicators of the quality of fats and oils. The maximum acceptable PV was set at 20 meq O2/kg oil [53]. The change in Peroxide Value (PV) of control, 4% SCG-added, and 7% SCG-added cookies as a function of storage time (over a period of 143 days) at three temperatures (25, 35, and 45 °C) is presented in Figure 5a–c. The plots show a characteristic form: initially, the oxidation products increase at a slow rate due to the “resistance” of the oil to oxidation, but then the slope of the resulting curve increases rapidly. The PV of control cookies for all temperatures was under the reported upper limit for the tested period. However, the PV for 4% SCG-added and 7% SCG-added cookies stored at 45 °C exceeded the PV limit at approximately 120 and 75 days, respectively.
With the incorporation of the defatted SCG into the cookie recipe, it was attempted to develop a high-phenol and high-fiber bakery product. The contained polyphenols, together with their functionality for human health, could protect the food from oxidation and thus extend its shelf life. This was not observed, and it might be reasonable since the incorporated phenolics were highly polar, and therefore, their distribution in the lipid phase was unfavorable. The higher the concentration of SCG in the cookies, the faster the increase in PV. This may be attributed to the increase in the concentration of metal ions (e.g., Cu) in the coffee residue, resulting in pro-oxidation phenomena [54]. However, the above behavior was detected under accelerated oxidation conditions at 45 °C. At lower temperatures, all cookies were stable within the frame of 143 days of monitoring.
Koay et al. (2023) [55] incorporated SCG at concentrations between 2 and 10% in shortbread biscuits. They studied the change in PV of the extracted fat from shortbread samples with different SCG contents upon storage for three weeks at room temperature. They noted a gradual decrease in PV with the increasing level of SCG incorporation in shortbread biscuits. The same behavior can be observed in Figure 5, since the PV of control cookies, stored at 25 °C, for 39 days is higher than the respective values of 4% SCG-added and 7% SCG-added cookies. The differences presented by Koay et al. (2023) (t = 21 d, θ = 25 °C; PVcontrol = 9.5, and PVSCG 8% = 3.5) as well as in the current research (t = 39 d, θ = 25 °C; PVcontrol = 7.0, and PVSCG 7% = 5.3) are rather insignificant, compared with the major changes of PVs occurring at higher storage times, as presented in Figure 5. To the best of our knowledge, there is no other published study examining the oxidation of bakery products with incorporated SCG for periods comparable to the current research.

3.4.4. Total Phenolic Content

The variation of Total Phenolic Content (TPC) of the cookies as a function of the storage time was also examined at the three different temperatures, presented in Figure 6a,b. The initial TPCs of the 4% SCG-added and 7% SCG-added cookies were determined to be 588 ppm and 1017 ppm, respectively. For all cookies, it is observed that the phenolic components throughout the storage have an initial tendency to decrease, and then they remain stable.
TPC values are an overall estimate of both free phenolics, which are present in coffee (e.g., 3-CQA and 5-CQA), and bound phenolics, as in the case of melanoidins [56,57,58]. However, the addition of SCG (Figure 6) did not induce antioxidant protection in cookies. If phenolic compounds inhibited the lipid oxidation of the product, we would expect a respective decrease in TPC. Since both categories of phenolics did not act as antioxidants, they remained constant during the storage tests. Nevertheless, the constant TPC values of the product throughout the shelf life experiment indicate that the quality of the product, in terms of phenolic composition, would remain at the same level as in the freshly produced cookies.

3.4.5. Sensory Analysis

The scores (intensity and acceptability) for the sensory characteristics of the cookie samples (control, 4% SCG-added, and 7% SCG-added) on the first day and after 143 days of storage at 25 °C, 35 °C, and 45 °C are presented in Figure 7a–f.
The sensory scores were mainly attributed to the changes in cookie color and texture (at the initial storage time). Defatted SCG incorporation increased the darkness and reduced the surface smoothness of the cookies. As the addition level increased, the hardness and density of the cookies significantly increased (p < 0.05), while the color became darker. Adams et al. (2008) reported that the addition of cereal bran to cookies resulted in darker and harder cookies, leading to a decrease in sensory quality regarding the color and texture [47]. The sensory changes produced by the addition of coffee skin to other baked products and their influence on acceptability have also been reported. For instance, Cantele et al. (2022) produced vegan biscuits by replacing wheat flour with Coffee Silverskin (CS) at 2%, 4%, and 6% [28]. A decrease in the acceptability of the sensory attributes (appearance, smell, taste, flavor, texture, and general acceptance) with the addition of CS was reported. The authors suggest that the low scores obtained in general acceptability could be attributed to the development of unpleasant non-volatile compounds during Maillard reactions and/or the natural presence of certain compounds in CS. These compounds include caffeine (contributing to bitterness), polysaccharides, humic acids, chlorogenic acids (contributing to astringency), and particularly carboxylic acids such as malic, citric, and acetic, which contribute to acidity. Regarding the low acceptability scores of food products enriched with CS [28,59], it is worth exploring strategies to mitigate the undesirable sensory changes that contribute to consumers` rejection related to sensory characteristics induced by the presence of CS (such as dark color, low sweetness, roasted flavor, intense/coffee flavor, burnt/bitter taste). In this study, SCG-added cookies were characterized by a mild and desirable coffee flavor due to the former removal of coffee oil from SCG, which would have caused a very aggressive flavor. The scores for the intensity of coffee flavor were significantly higher for the 7% SCG-added cookies compared to the 4% SCG-added cookies (p < 0.05) (Figure 7a–c). Though the total sensory quality was evaluated as positive, the acceptability scores for all sensory characteristics were more than 7/9 (Figure 7d–f).
The sensory quality loss in cookies results from the increase in hardness, the increase in rancidity, and the development of off-odors and off-flavors [52,60]. The scores for characteristics, appearance, crispiness, taste, aftertaste, and rancidity of the control and SCG-added cookies remained constant (based on the scores given for the intensity on a scale of 1 to 9) during storage (143 days). The scores for odor intensity decreased with an increase in storage time, while the scores for hardness increased with an increase in storage time. The scores for color, odor, hardness, and crispiness of 4% SCG-added cookie samples were significantly increased with storage time and temperature (p < 0.05). The panelists reported that the color remained stable and that the intensity of the odor decreased only for the cookies stored at 25 °C and 35 °C. At 45 °C, an increase in odor intensity was observed due to rancidity. For each temperature, they also noted an increase in hardness and crispiness and a slight decrease in flavor and coffee aroma intensity. The aftertaste remained stable at all three temperatures. The parameter showed a significant increase in rancidity (p < 0.05). The cookie samples stored at 45 °C received the highest scores (Figure 7a–c). Lipid oxidation leads to the rancidity of high-fat/oil-containing products, which may affect their shelf life. Rancidity is related to the development of unpleasant odors and flavors, which contribute to an unacceptable sensory profile of the product. The addition of natural extracts has been extensively studied to increase the oxidative stability of foods in general and particularly of baked goods (with high fat content) [61]. A wide variety of spices, extracts, and agricultural by-products have been tested with different results, always linked to their content of phenols and other natural antioxidants (phytosterols, tocopherols, etc.) [52]. In this study, SCG could not prevent oil oxidation on cookies.
In Figure 7d–f, the scores for the acceptability of all cookies were presented. All parameters remained constant at all storage temperatures. The scores for the 4% SCG-added cookies for the overall impression are high and above the acceptance limit (5) throughout the storage period. For the cookie with 7% SCG incorporation, no significant changes were observed at 25 °C (p > 0.05). Increasing the temperature to 35 °C had a negative effect on odor, flavor, texture, and aftertaste, while appearance, color, and overall impression remained stable and above the acceptance limit. At 45 °C, appearance, color, and texture remained stable, while odor, taste, aftertaste, and overall impression were rated below the limit.
The results of the fitting for the sensory acceptability of cookie samples are presented in Table 6. According to the results, the increase in SCG concentration means a significant increase in the activation energy (p < 0.05) and, therefore, a greater effect of the storage temperature on the degradation of the sensory characteristics of the product, a fact that is also confirmed by the results obtained from the statistical study. This study showed that for the control cookie, the increase in temperature does not affect the ks coefficient (p > 0.05), while for the 4% and 7% SCG-added cookies, the change in temperature has a significant effect on the coefficient (p < 0.05). Similarly, the effect of the concentration of SCG in the cookies was studied for each temperature. For all temperatures, the increase in SCG concentration has a significant effect on the value of the ks factor (p < 0.05).
Based on the results, it was possible to determine the shelf life (Table 6). The shelf life of 0%, 4% SCG-added, and 7% SCG-added cookies at 25 °C was calculated as 359, 435, and 471 days, respectively. The shelf life of 4% and 7% SCG-added cookies at 45 °C was calculated as 144 and 104 days, respectively. According to lipid oxidation results, the 4% and 7% SCG-added cookies were not acceptable at 45 °C for storage times beyond 120 and 75 days, respectively (which exceeded the PV acceptance limit) (Section 3.4.3). This means that, in this case, the sensory evaluation overestimated the shelf life.

4. Conclusions

The utilization of by-products from the food industry has been an important field of research for the scientific community in recent years. The need to find alternative sources of bioactive ingredients makes the coffee extraction by-product (Spent Coffee Ground, SCG) ideal for exploitation. In this study, SGC was obtained from a local coffee shop and subjected to a series of successive extractions to identify the residual phenolics after coffee brewing. Chlorogenic and neochlorogenic acids, the main individual phenolic compounds of SCG, were quantified at 2.43 and 1.00 mg/gdry SCG, respectively. The TPC of SCG was determined to be 21.6 mg GAE/gdry SCG (or 2.16%), the oil content to be 12.2%, and TDF to be 66%. Therefore, approximately 80% of the SCG is composed of materials that could be utilized in various applications. However, SCG is not an easy-to-use material since it possesses a rather aggressive flavor, which might be an obstacle for food applications. In order to produce a tasty bakery product with incorporated SCG, it was decided in the current study to defat the material so as to remove the majority of volatile components. The lipid fraction could be utilized in the food industry as a flavoring agent or in the sector of food supplements. The defatted SCG was incorporated into a bakery product (cookies) at two addition levels, namely, 4% and 7% (baked cookie basis). The TPC values of the formulated cookies amounted to approximately 600 and 1000 mg GAE/kg, while TDF was determined at 2.7 and 4.6%, respectively. The fortification of a very popular product with a combination of phenolic compounds and dietary fibers was achieved, together with desirable sensory characteristics (mild coffee flavor/taste, acceptable color, and texture) and shelf life stability. Therefore, it was proven that SCG is a valorizable material with potential applications in the bakery products industry for the development of foods with functional ingredients.

Author Contributions

Conceptualization, D.T. and P.T.; methodology, E.D. and D.T.; validation, C.P.; formal analysis, C.P.; investigation, C.P. and D.T.; data curation, C.P., D.T. and E.D.; writing—original draft preparation, C.P.; writing—review and editing, E.D. and D.T.; visualization, C.P.; supervision, E.D., D.T. and P.T.; project administration, P.T. All authors have read and agreed to the published version of the manuscript.

Funding

This research received no external funding.

Institutional Review Board Statement

Not applicable.

Informed Consent Statement

Not applicable.

Data Availability Statement

The raw data supporting the conclusions of this article will be made available by the authors on request.

Conflicts of Interest

The authors declare no conflicts of interest.

References

  1. Ballesteros, L.F.; Teixeira, J.A.; Mussatto, S.I. Chemical, Functional, and Structural Properties of Spent Coffee Grounds and Coffee Silverskin. Food Bioproc. Tech. 2014, 7, 3493–5203. [Google Scholar] [CrossRef]
  2. International Coffee Organization. International Coffee Organization—Trade Statistics Table. 2023. Available online: http://www.ico.org/trade_statistics.asp?section=Statistics (accessed on 2 June 2020).
  3. Grassino, A.N.; Jerković, I.; Pedisić, S.; Dent, M. Hydrodistillation fractions of coffee (green and roasted) and coffee by-product (silver skin and spent grounds) as a source of bioactive compounds. Sustain. Chem. Pharm. 2024, 39, 101592. [Google Scholar] [CrossRef]
  4. Cruz, R.; Cardoso, M.M.; Fernandes, L.; Oliveira, M.; Mendes, E.; Baptista, P.; Morais, S.; Casal, S. Espresso coffee residues: A valuable source of unextracted compounds. J. Agric. Food Chem. 2012, 60, 7777–7784. [Google Scholar] [CrossRef] [PubMed]
  5. Zabaniotou, A.; Kamaterou, P. Food waste valorization advocating Circular Bioeconomy—A critical review of potentialities and perspectives of spent coffee grounds biorefinery. J. Clean Prod. 2019, 211, 1553–1566. [Google Scholar] [CrossRef]
  6. Alves, R.C.; Rodrigues, F.; Nunes, M.A.; Vinha, A.F.; Oliveira, M.B.P.P. State of the art in coffee processing by-products. In Handbook of Coffee Processing By-Products. Sustainable Applications; Galanakis, C.A., Ed.; Academic Press: Cambridge, MA, USA, 2017; pp. 1–26. [Google Scholar]
  7. Campos-Vega, R.; Loarca-Piña, G.; Vergara-Castañeda, H.A.; Oomah, B.D. Spent coffee grounds: A review on current research and future prospects. Trends Food Sci. Technol. 2015, 45, 24–36. [Google Scholar] [CrossRef]
  8. Murthy, P.S.; Naidu, M.M. Sustainable management of coffee industry by-products and value addition—A review. Resour. Conserv. Recycl. 2012, 66, 45–58. [Google Scholar] [CrossRef]
  9. Wei, F.; Furihata, K.; Hu, F.; Miyakawa, T.; Tanokura, M. Complex mixture analysis of organic compounds in green coffee bean extract by two-dimensional NMR spectroscopy. Magn. Reson. Chem. 2010, 48, 857–865. [Google Scholar] [CrossRef]
  10. Mussatto, S.I.; Carneiro, L.M.; Silva, J.P.A.; Roberto, I.C.; Teixeira, J.A. A study on chemical constituents and sugars extraction from spent coffee grounds. Carbohydr. Polym. 2011, 83, 368–374. [Google Scholar] [CrossRef]
  11. Panusa, A.; Zuorro, A.; Lavecchia, R.; Marrosu, G.; Petrucci, R. Recovery of natural antioxidants from spent coffee grounds. J. Agric. Food Chem. 2013, 61, 4162–4168. [Google Scholar] [CrossRef]
  12. Tsimogiannis, D.; Oreopoulou, V. Classification of Phenolic Compounds in Plants. In Polyphenols in Plants, 2nd ed.; Elsevier Inc.: Amsterdam, The Netherlands, 2019. [Google Scholar]
  13. Rao, B.D.; Kulkarni, D.B.; Kavitha, C. Study on evaluation of starch, dietary fiber and mineral composition of cookies developed from 12 sorghum cultivars. Food Chem. 2018, 238, 82–86. [Google Scholar] [CrossRef]
  14. Sudha, M.L.; Vetrimani, R.; Leelavathi, K. Influence of fibre from different cereals on the rheological characteristics of wheat flour dough and on biscuit quality. Food Chem. 2007, 100, 1365–1370. [Google Scholar] [CrossRef]
  15. Beltrán-Medina, E.A.; Guatemala-Morales, G.M.; Padilla-Camberos, E.; Corona-González, R.I.; Mondragón-Cortez, P.M.; Arriola-Guevara, E. Evaluation of the use of a coffiee industry by-product in a cereal-based extruded food product. Foods 2020, 9, 1008. [Google Scholar] [CrossRef] [PubMed]
  16. Pourfarzad, A.; Mahdavian-Mehr, H.; Sedaghat, N. Coffee silverskin as a source of dietary fiber in bread-making: Optimization of chemical treatment using response surface methodology. LWT-Food Sci. Technol. 2013, 50, 599–606. [Google Scholar] [CrossRef]
  17. Elleuch, M.; Bedigian, D.; Roiseux, O.; Besbes, S.; Blecker, C.; Attia, H. Dietary fibre and fibre-rich by-products of food processing: Characterisation, technological functionality and commercial applications: A review. Food Chem. 2011, 124, 411–421. [Google Scholar] [CrossRef]
  18. Hoang, N.-H.; Do, H.H.; Dang, T.H.Y.; Ton, M.N.N.; Tran, T.T.T.; Le, V.V.M. Fiber-enriched biscuits prepared with enzyme-treated corncob powder: Nutritional composition, physical properties, and sensory acceptability. J. Food Proces. Preserv. 2022, 46, 16784. [Google Scholar] [CrossRef]
  19. Nicole, T.Z.H.; Nichelle, T.S.; Elizabeth, T.E.; Yuliarti, O. Formulation of functional crackers enriched with fermented soybean (tempeh) paste: Rheological and microstructural properties. Future Foods 2021, 4, 100050. [Google Scholar] [CrossRef]
  20. Ateş, G.; Elmacı, Y. Physical, chemical and sensory characteristics of fiber-enriched cakes prepared with coffee silverskin as wheat flour substitution. J. Food Meas. Charact. 2019, 13, 755–763. [Google Scholar] [CrossRef]
  21. Dauber, C.; Romero, M.; Chaparro, C.; Ureta, C.; Ferrari, C.; Lans, R.; Frugoni, L.; Echeverry, M.V.; Calvo, B.S.; Trostchansky, A.; et al. Cookies enriched with coffee silverskin powder and coffee silverskin ultrasound extract to enhance fiber content and antioxidant properties. Appl. Food Res. 2024, 4, 100373. [Google Scholar] [CrossRef]
  22. Waterhouse, A.L. Determination of Total Phenolics. Curr. Prot. Food Anal. Chem. 2002, 6, 1–8. [Google Scholar]
  23. Bertolino, M.; Barbosa-Pereira, L.; Ghirardello, D.; Botta, C.; Rolle, L.; Guglielmetti, A.; Dalla Vecchia, S.B.; Zeppa, G. Coffee silverskin as nutraceutical ingredient in yogurt: Its effect on functional properties and its bioaccessibility. J. Sci. Food Agric. 2019, 99, 4267–4275. [Google Scholar] [CrossRef]
  24. Nolasco, A.; Squillante, J.; Velotto, S.; D’Auria, G.; Ferranti, P.; Mamone, G.; Errico, M.E.; Avolio, R.; Castaldo, R.; Cirillo, T.; et al. Valorization of coffee industry wastes: Comprehensive physicochemical characterization of coffee silverskin and multipurpose recycling applications. J. Clean. Prod. 2022, 370, 133520. [Google Scholar] [CrossRef]
  25. Martinez-Saez, N.; Ullate, M.; Martin-Cabrejas, M.A.; Martorell, P.; Genovés, S.; Ramon, D.; del Castillo, M.D. A novel antioxidant beverage for body weight control based on coffee silver skin. Food Chem. 2014, 150, 227–234. [Google Scholar] [CrossRef] [PubMed]
  26. Kotsou, K.; Chatzimitakos, T.; Athanasiadis, V.; Bozinou, E.; Athanassiou, C.G.; Lalas, S.I. Utilization of spent coffee grounds as a feed additive for enhancing the nutritional value of Tenebrio molitor Larvae. Sustainability 2023, 15, 16224. [Google Scholar] [CrossRef]
  27. Roslan, Ν.A.; Sukri, S.A.M.; Wei, L.S.; Shahjahan, M.; Rohani, M.F.; Yea, C.S.; Kabir, M.A.; Guru, A.; Goh, K.W.; Kallem, P.; et al. Replacement of fishmeal by fermented spent coffee ground: Effects on growth performance, feed stability, blood biochemistry, liver, and intestinal morphology of African catfish (Clarias gariepinus). Aquac. Res. 2024, 36, 102073. [Google Scholar] [CrossRef]
  28. Cantele, C.; Tedesco, M.; Ghirardello, D.; Zeppa, G.; Bertolino, M. Coffee Silverskin as a Functional Ingredient in Vegan Biscuits: Physicochemical and Sensory Properties and in Vitro Bioaccessibility of Bioactive Compounds. Foods 2022, 11, 717. [Google Scholar] [CrossRef] [PubMed]
  29. Tsevdou, M.; Ntzimani, A.; Katsouli, M.; Dimopoulos, G.; Tsimogiannis, D.; Taoukis, P. Comparative Study of Microwave, Pulsed Electric Fields, and High-Pressure Processing on the Extraction of Antioxidants from Olive Pomace. Molecules 2024, 29, 2303. [Google Scholar] [CrossRef] [PubMed]
  30. AOCS (American Oil Chemists’ Society). Official Method Cd Peroxide Value. Official Methods and Recommended Practices of the American Oil Chemists’ Society, 5th ed.; AOCS: Champaign, IL, USA, 1998; pp. 8–53. [Google Scholar]
  31. AOAC. Method 985.29. Total Dietary Fiber in Foods. Official Methods of Analysis of AOAC International, 18th ed.; AOAC International: Gaithersburg, MD, USA, 2007. [Google Scholar]
  32. Djordjević, M.; Šoronja-Simović, D.; Nikolić, I.; Djordjević, M.; Šereš, Z.; Milašinović-Šeremešić, M. Sugar beet and apple fibres coupled with hydroxypropylmethylcellulose as functional ingredients in gluten-free formulations: Rheological, technological and sensory aspects. Food Chem. 2019, 295, 189–197. [Google Scholar] [CrossRef] [PubMed]
  33. ICC Standard 104/1 Determination of Ash in Cereals and Cereal Products. Available online: https://icc.or.at/icc-standards/standards-overview/104-1-standard-method (accessed on 2 June 2020).
  34. AOAC. Method 979.09. Protein in Grain. Official Methods of Analysis of AOAC International, 15th ed.; AOAC: Washington, DC, USA, 1990. [Google Scholar]
  35. AOAC. Method 23.003. Official Methods of Analysis of AOAC International, 11th ed.; AOAC: Washington, DC, USA, 1999. [Google Scholar]
  36. Wei, F.; Furihata, K.; Koda, M.; Hu, F.; Miyakawa, T.; Tanokura, M. Roasting process of coffee beans as studied by nuclear magnetic resonance: Time course of changes in composition. J. Agric. Food Chem. 2012, 60, 1005–1012. [Google Scholar] [CrossRef]
  37. Rover, M.R.; Brown, R.C. Quantification of total phenols in bio-oil using the Folin–Ciocalteu method. J. Anal. Appl. Pyrolysis. 2013, 104, 366–371. [Google Scholar] [CrossRef]
  38. Ikawa, M.; Dollard, C.A.; Schaper, T.D. Reaction of Folin-Ciocalteau phenol reagent with purines, pyrimidines, and pteridines and its relationship to structure. J. Agric. Food Chem. 1988, 36, 309–311. [Google Scholar] [CrossRef]
  39. Bastola, K.P.; Guragain, Y.N.; Bhadriraju, V.; Vadlani, P.V. Evaluation of standards and interfering compounds in the determination of phenolics by Folin-Ciocalteu assay method for effective bioprocessing of biomass. Am. J. Anal. Chem. 2017, 8, 416–431. [Google Scholar] [CrossRef]
  40. Toledo, P.R.; Pezza, L.; Pezza, H.R.; Toci, A.T. Relationship between the different aspects related to coffee quality and their volatile compounds. Compr. Rev. Food Sci. Food Saf. 2016, 15, 705–719. [Google Scholar] [CrossRef] [PubMed]
  41. Hwang, H.S.; Winkler-Moser, J.K.; Kim, Y.; Liu, S.X. Antioxidant activity of spent coffee ground extracts toward soybean oil and fish oil. Eur. J. Lipid Sci. Technol. 2019, 121, 1800372. [Google Scholar] [CrossRef]
  42. Loyao, A.S., Jr.; Villasica, S.L.G.; Peña, P.L.L.D.; Go, A.W. Extraction of lipids from spent coffee grounds with non-polar renewable solvents as alternative. Ind. Crops Prod. 2018, 119, 152–161. [Google Scholar] [CrossRef]
  43. Al-Hamamre, Z.; Foerster, S.; Hartmann, F.; Kröger, M.; Kaltschmitt, M. Oil extracted from spent coffee grounds as a renewable source for fatty acid methyl ester manufacturing. Fuel 2012, 96, 70–76. [Google Scholar] [CrossRef]
  44. European Union. Regulation (EC) No 1924/2006 of the European Parliament and of the Council on Nutrition and Health Claims Made on Foods; European Parliament, Council of the European Union: Strasbourg, France, 2006. [Google Scholar]
  45. Borrelli, R.C.; Visconti, A.; Mennella, C.; Anese, M.; Fogliano, V. Chemical characterization and antioxidant properties of coffee melanoidins. J. Agric. Food Chem. 2002, 50, 6527–6533. [Google Scholar] [CrossRef]
  46. Zamora, R.; Hidalgo, F.J. Coordinate contribution of lipid oxidation and Maillard reaction to the nonenzymatic food browning. Crit. Rev. Food Sci. Nutr. 2005, 45, 49–59. [Google Scholar] [CrossRef]
  47. Adams, A.; De Kimpe, N.; van Boekel, M.A.J.S. Modification of casein by the lipid oxidation product malondialdehyde. J. Agric. Food Chem. 2008, 56, 1713–1719. [Google Scholar] [CrossRef] [PubMed]
  48. Ngo, H.B.G.; Phu, M.L.; Tran, T.T.T.; Ton, N.M.N.; Nguyen, T.Q.N.; Man Le, V.V. Dietary fiber-and antioxidant-enriched cookies prepared by using jackfruit rind powder and ascorbic acid. Heliyon 2024, 10, e30884. [Google Scholar] [CrossRef]
  49. Dachana, K.B.; Rajiv, J.; Indrani, D.; Prakash, J. Effect of dried moringa (Moringa oleifera lam) leaves on rheological, microstructural, nutritional, textural and organoleptic characteristics of cookies. J. Food Qual. 2010, 33, 660–677. [Google Scholar] [CrossRef]
  50. Iwansyah, A.C.; Melanie, D.; Cahyadi, W.; Indraningsih, A.W.; Khasanah, Y.; Indriati, A.; Andriansyah, R.C.E.; Hamid, H.A.; Yahya, I.H. Shelf-life evaluation of formulated cookies from Hanjeli (Coix lacryma-jobi L.) and Moringa leaf flour (Moringa oleifera). Food Biosci. 2022, 47, 101787. [Google Scholar] [CrossRef]
  51. de Morais, M.P.; Caliari, M.; Nabeshima, E.H.; Batista, J.E.R.; Campos, M.R.H.; Soares Junior, M.S. Storage stability of sweet biscuit elaborated with recovered potato starch from effluent of fries industry. Food Sci. Technol. 2018, 38, 216–222. [Google Scholar] [CrossRef]
  52. Mrabet, A.; Hamdi, A.; Rodríguez-Arcos, R.; Guillen-Bejarano, R.; Jimenez-Araujo, A. Date seed by-products as source of bioactive ingredient for healthy cookies. Food Biosci. 2024, 61, 104543. [Google Scholar] [CrossRef]
  53. Kong, F.; Singh, R.P. Advances in instrumental methods to determine food quality deterioration. In Food and Beverage Stability and Shelf Life. Woodhead Publishing Series in Food Science, Technology and Nutrition; Woodhead Publishing: Sawston, UK, 2011; pp. 381–404. [Google Scholar]
  54. Bee, S.; Brando, C.H.J.; Brumen, G.; Carvalhaes, N.; Kolling-Speer, I.; Speer, K.; Suggi Liverani, F.; Texeira, A.A.; Thomaziello, R.A.; Viani, R.; et al. The Raw Bean. In Espresso Coffee: The Science of Quality, 2nd ed.; Illy, A., Viani, R., Eds.; Elsevier Academic Press: London, UK, 2005; pp. 87–178. [Google Scholar]
  55. Koay, H.Y.; Azman, A.T.; Zin, Z.M.; Portman, K.L.; Rusli, N.D.; Hasmadi, M.; Rusli, N.D.; Aidat, O.; Zainol, M.K. Assessing the impact of spent coffee ground (SCG) concentrations on shortbread: A study of physicochemical attributes and sensory acceptance. Future Foods 2023, 8, 100245. [Google Scholar] [CrossRef]
  56. Bekedam, E.K.; Schols, H.A.; van Boekel, M.A.J.S.; Smit, G. Incorporation of chlorogenic acids in coffee brew melanoidins. J. Agric. Food Chem. 2008, 56, 2055–2063. [Google Scholar] [CrossRef] [PubMed]
  57. Perrone, D.; Farah, A.; Donangelo, C.M. Influence of coffee roasting on the incorporation of phenolic compounds into melanoidins and their relationship with antioxidant activity of the brew. J. Agric. Food Chem. 2012, 60, 4265–4275. [Google Scholar] [CrossRef] [PubMed]
  58. Farah, A.; de Paulis, T.; Trugo, L.C.; Martin, P.R. Effect of roasting on the formation of chlorogenic acid lactones in coffee. J. Agric. Food. Chem. 2005, 53, 1505–1513. [Google Scholar] [CrossRef] [PubMed]
  59. Jaric, A.M.; Pasquino, M.N.; Seremet, D.; Pudic, R.E.; Vojvodic, A.; Komes, D. The assesement of bioactive potential and sensory acceptability of coffee and its byproducts-cascara and silverskin. Croat. J. Food Technol. 2021, 16, 35–40. [Google Scholar]
  60. Sakac, M.; Pestoric, M.; Mandic, A.; Misan, A.; Nedeljkovic, N.; Jambrec, D.; Jovanov, P.; Lazic, V.; Pezo, L.; Sedej, I. Shelf-life prediction of gluten-free rice-buckwheat cookies. J. Cereal Sci. 2016, 69, 336–343. [Google Scholar] [CrossRef]
  61. Gebreselassie, E.; Clifford, H. Oxidative stability and shelf life of crackers, cookies, and biscuits. In Oxidative Stability and Shelf Life of Foods Containing Oils and Fats; Hu, M., Jacobsen, C., Eds.; Academic Press: Cambridge, MA, USA; AOCS Press: Champaign, IL, USA, 2016; Volume 1904, pp. 461–478. [Google Scholar]
Figure 1. Superimposition of aqueous and methanol–water extract chromatograms monitored at 320 nm, with the peaks corresponding to CQAs indicated. The UV-Vis spectrum of 3-CQA (different colored lines) is also presented in the inset figure.
Applsci 14 06863 g001
Figure 2. Browning Index (BI) of cookies vs. storage time for (a) the control cookie, (b) 4% SCG-added cookie, and (c) 7% SCG-added cookie at 25 °C, 35 °C, and 45 °C. The number of replications = 3.
Applsci 14 06863 g002
Figure 3. Color change (ΔΕ) of cookies vs. storage time for (a) the control cookie, (b) the 4% SCG-added cookie, and (c) the 7% SCG-added cookie at 25 °C, 35 °C, and 45 °C. The number of replications = 3. The lines (b,c) represent the fitting of the mathematical model (Equation (5)) to the experimental data.
Applsci 14 06863 g003
Figure 4. Hardness (H) of cookies vs. storage time for (a) the control cookie, (b) the 4% SCG cookie, and (c) the 7% SCG cookie at 25 °C, 35 °C, and 45 °C. The number of replications = 3. The lines represent the fitting of the mathematical model (Equation (6)) to the experimental data.
Applsci 14 06863 g004
Figure 5. Peroxide Value (PV) of oil extracted from cookies vs. storage time for (a) the control cookie, (b) the 4% SCG-added cookie, and (c) the 7% SCG-added cookie at 25 °C, 35 °C, and 45 °C. Red horizontal dashed line: maximum acceptable Peroxide Value (20 meq O2/kg oil). The number of replications = 3.
Applsci 14 06863 g005
Figure 6. Total Phenolic Content (TPC) of (a) 4% SCG-added and (b) 7% SCG-added cookies stored at 25 °C, 35 °C, and 45 °C for 143 days.
Applsci 14 06863 g006
Figure 7. Sensory evaluation test scores: intensity (1–9) scores for appearance, color, odor, hardness, crispiness, flavor, coffee aroma, off-flavors, and rancidity of cookie samples, (a) control, (b) 4% SCG-added, and (c) 7% SCG-added at the first day and after 143 days of storage at temperatures of 25 °C, 35 °C, and 45 °C. Acceptability (hedonic scale 1–9) scores for appearance, color, texture (overall impression), flavor, aftertaste, and overall acceptability of cookie samples, (d) control, (e) 4% SCG-added, and (f) 7% SCG-added at the first day and after 143 days of storage at temperatures of 25 °C, 35 °C, and 45 °C.
Applsci 14 06863 g007
Table 1. Ingredient concentrations of cookie dough (before baking).
Ingredients (%)ControlCookie Formula ACookie Formula B
All-purpose flour47.443.9641.45
Baking powder0.40.40.4
Salt0.20.20.2
Sugar262626
Butter212121
Eggs555
SCG 103.445.95
Total100100100
1 SCG: Spent Coffee Ground.
Table 2. Total Phenolic Content, oil content, and Total Dietary Fiber of dried SCG.
Contents of Dried SCGConcentration
Total Phenolic Content (mg GAE, 1 per g dry SCG)21.6 ± 0.7
  Recovered by H2O11.0 ± 0.6
  Recovered by MeOH:H2O (1:1)5.0 ± 0.2
  Recovered by acetone:H2O (1:1)2.2 ± 0.1
  Recovered by acetone3.3 ± 0.1
Oil Content (% on dry SCG)12.2 ± 0.5
Total Dietary Fiber (% on dry SCG)66 ± 5
Total Kjeldahl Nitrogen (% on dry SCG)2.0 ± 0.1
Ash (% on dry SCG)2.0 ± 0.1
1 GAE: Gallic Acid Equivalents.
Table 3. Characteristics of cookies with and without added SCG.
Control Cookie4% SCG-Added7% SCG-Added
Moisture Content (%)7.00 ± 0.016.5 ± 0.44.0 ± 0.4
ColorLo79 ± 140 ± 146 ± 1
ao−0.70 ± 0.015.0 ± 0.15.0 ± 0.2
bo28 ± 315 ± 0.417 ± 1
Hardness, Ho (N)14.2 ± 0.216.5 ± 0.317.0 ± 0.3
Total Phenolic Content (mgGAE/kgcookies)68 ± 2588 ± 241017 ± 5
Total Dietary Fiber
(g/100 g cookies)
0.87 ± 0.042.65 ± 0.184.64 ± 0.32
Nutritional claimN/AN/ASource of dietary fiber [28]
Table 4. Model parameters for the color change (ΔΕ) of cookies with and without added SCG.
SampleTemperature (°C)ΔΕmaxk
(Days−1)
to
(Days)
R2
Control25 °C----
35 °C----
45 °C----
4% SCG25 °C6.0 ± 0.5 a13 ± 5 a64 ± 8 a0.9729
35 °C6.0 ± 0.2 a16 ± 2 a48 ± 2 b0.9966
45 °C6.4 ± 1.0 a11 ± 9 a53 ± 15 ab0.9279
7% SCG25 °C6.0 ± 0.2 a7 ± 2 a58 ± 5 a0.9957
35 °C7.6 ± 0.1 b13 ± 1 b60 ± 1 a0.9996
45 °C7.0 ± 0.5 b12 ± 4 b57 ± 7 a0.9833
Mean value ± standard error. Model parameters for the color change are calculated by fitting the data in Equation (5). Different superscript letters in the same column indicate significant differences between means as calculated by the Duncan’s multiple range test for a significance level of p = 0.05. (Equation (5)).
Table 5. Model parameters for the hardness (H, N) change in cookies with and without added SCG.
Cookie SampleStorage TempR2Ho (N)a (N)b (Days−1)Hinf (N)
Control25 °C0.953514.3 ± 1.8 aA14.2 ± 2.4 aA0.03 ± 0.013 aA28.47 ± 3.01 aA
35 °C0.894114.0 ± 4.0 bA17 ± 5 bA0.03 ± 0.021 aA31.12 ± 5.66 aA
45 °C0.926514.4 ± 2.5 bA14.8 ± 3.0 aA0.05 ± 0.032 aA29.21 ± 3.95 aA
4% SCG-added25 °C0.986817.0 ± 1.4 aB19.6 ± 2.0 aB0.07 ± 0.028 aB36.35 ± 2.17 aA
35 °C0.995916.7 ± 1.0 aB25 ± 1 bB0.07 ± 0.015 aB41.58 ± 1.53 bB
45 °C0.968816.0 ± 3.7 aB37.8 ± 5.8 cB0.02 ± 0.009 bA53.90 ± 6.87 bB
7% SCG-added25 °C0.988716.7 ± 2.3 aB38.3 ± 3.2 aC0.03 ± 0.006 aA54.99 ± 9.98 aC
35 °C0.998417.0 ± 0.7 aB32.2 ± 1.0 bC0.03 ± 0.003 aA49.28 ± 1.24 bC
45 °C0.977416.6 ± 3.0 aB40.0 ± 5 aB0.02 ± 0.008 aA56.25 ± 5.96 aB
Mean value ± standard error. Model parameters for the hardness change are calculated by fitting the data in Equation (6). Different superscript letters (a, b, and c) in the same column for each sample (control, 4% SCG-added, and 7% SCG-added) indicate significant differences between equation parameter means for the different storage temperatures, and different superscript capital (A, B, and C) letters indicate significant differences between equation parameter means for the samples at each storage temperature, calculated by Duncan’s multiple range test for a significance level of p = 0.05.
Table 6. Rate constants of sensory deterioration (overall sensory acceptance) and the dependence of the rate constants on storage temperature for cookies with and without added SCG and all storage temperatures studied.
Storage Temp. (°C)Control Cookie4% SCG-Added Cookie7% SCG-Added Cookie
Sensory
Deterioration Rate k s ( d 1 )
R2Shelf Life (d) **Sensory
Deterioration Rate k s ( d 1 )
R2Shelf Life (d) **Sensory
Deterioration Rate k s ( d 1 )
R2Shelf Life (d) **
250.010 ± 0.001 aA0.8879359 ± 20.0069 ± 0.0001 aB0.98984350.0068 ± 0.001 aB0.9651471
350.010 ± 0.001 aA0.91940.0103 ± 0.0002 bAB0.95292910.0110 ± 0.001 bB0.8557291
450.010 ± 0.001 aA0.93770.0209 ± 0.0002 cB0.9898(144)0.0307 ± 0.001 cC0.9836(104)
E a   k J m o l __ 43.77 ± 0.210.9806 59.59 ± 0.230.9654
Mean value ± standard deviation. Initial scores for control, 4% SCG-added, and 7% SCG-added cookies: 7.5, 8.0, and 8.2, respectively. Different superscript letters (a, b, and c) in the same column for each sample (control, 4% SCG-added, and 7% SCG-added) indicate significant differences between equation parameter means for the different storage temperatures, and different superscript capital (A, B, and C) in the same row for each storage temperature (25 °C, 35 °C, and 45 °C) indicate significant differences between equation parameter means for the different cookie samples, calculated by Duncan’s multiple range test for a significance level of p = 0.05. ** The shelf life based on sensory deterioration (overall sensory acceptance) for all storage temperatures studied was also given in the last row.
Disclaimer/Publisher’s Note: The statements, opinions and data contained in all publications are solely those of the individual author(s) and contributor(s) and not of MDPI and/or the editor(s). MDPI and/or the editor(s) disclaim responsibility for any injury to people or property resulting from any ideas, methods, instructions or products referred to in the content.

