Article

A Novel Battery-Supplied AFE EEG Circuit Capable of Muscle Movement Artifact Suppression

by
Athanasios Delis
*,
George Tsavdaridis
and
Panayiotis Tsanakas
School of Electrical & Computer Engineering, National Technical University of Athens, 9 Iroon Polytechniou Str., 15772 Athens, Greece
*
Author to whom correspondence should be addressed.
Appl. Sci. 2024, 14(16), 6886; https://doi.org/10.3390/app14166886
Submission received: 29 April 2024 / Revised: 17 July 2024 / Accepted: 30 July 2024 / Published: 6 August 2024
(This article belongs to the Special Issue Brain-Computer Interfaces: Novel Technologies and Applications)

Abstract

:
In this study, the fundamentals of electroencephalography signals, their categorization into frequency sub-bands, the circuitry used for their acquisition, and the impact of noise interference on signal acquisition are examined. Additionally, design specifications for medical-grade and research-grade EEG circuits and a comprehensive analysis of various analog front-end architectures for electroencephalograph (EEG) circuit design are presented. Three distinct selected case studies are examined in terms of comparative evaluation with generic EEG circuit design templates. Moreover, a novel one-channel battery-supplied EEG analog front-end circuit designed to address the requirements of usage protocols containing strong compound muscle movements is introduced. Furthermore, a realistic input signal generator circuit is proposed that models the human body and the electromagnetic interference from its surroundings. Experimental simulations are conducted in 50 Hz and 60 Hz electrical grid environments to evaluate the performance of the novel design. The results demonstrate the efficacy of the proposed system, particularly in terms of bandwidth, portability, Common Mode Rejection Ratio, gain, suppression of muscle movement artifacts, electrostatic discharge and leakage current protection. Conclusively, the novel design is cost-effective and suitable for both commercial and research single-channel EEG applications. It can be easily incorporated in Brain–Computer Interfaces and neurofeedback training systems.

1. Introduction

1.1. Medical Significance of EEG Signal Acquisition

Electroencephalography, a non-invasive signal acquisition technique in Neuroscience [1], is employed for recording the brain’s electrical activity via electrodes placed on the scalp. These captured signals are distinguished by their unique frequency, amplitude, and source location characteristics, playing a pivotal role in the diagnosis and monitoring of neurological disorders such as epilepsy, sleep disturbances, brain tumors, cerebral injuries, etc. The high temporal resolution of the electroencephalograph (in this study, it is denoted by the abbreviation EEG), in contrast with other neuro-imaging modalities such as fMRI, enables the real-time analysis of brain activity, offering valuable insights into cognitive functions and mental states. As a final point, EEG is instrumental in the advancement of Brain–Computer Interfaces (BCIs) [2], contributing significantly to our comprehension of neural dynamics in both healthy and pathological states by enabling the telemonitoring of patients, as well as enabling biomedical engineers to create telekinesis applications and neurofeedback training BCI systems [3,4]. In clinical settings and in research, particularly in the domains of neurology and neurosurgery, the precise signal acquisition needs to be as accurate and noise-free as possible to determine the patterns of brain waves and make diagnostic analyses through EEG [5,6].
The technology that entails EEG is an enormously relevant tool in neurological assessments [7], whereby an evaluation and assessment of the electrical activity taking place within the brain is carried out. It helps to identify some kinds of seizures, which helps develop an accurate protocol of treatment. EEG identifies the patterns of brain waves for different stages of sleep [8]; it is very important in the diagnosis of sleep abnormalities like narcolepsy. In patients with head injury who have fallen into a coma, EEG is of paramount importance in the assessment of brain responsiveness and the quantification of damage [9]. It may be used in the determination of early abnormal loci within the brain, loci that may be reflecting the onset of ailments such as epilepsy, dementia, and Alzheimer’s [10,11].

1.2. EEG Signals into Frequency Sub-Bands: Comprehensive Categorization

The EEG signals are represented as the linear combination of many frequencies’ sub-bands in which each of them bears a unique set of brain activity. Normally, delta waves refer to unconsciousness and deep sleep. Theta waves are associated with meditation, creativity, and insomnia, while alpha waves relate to tranquility, relaxation, and reduced concentration. Beta waves are affixed to anxiety, concentration, and active, busy, or deep-thinking mental activities. Gamma waves are attributed to higher-level mental activities that involve more consciousness or perception [12,13]. This classification induces structure and reproducibility when employed in clinical and research settings, and it enables healthcare providers to analyze brains and diagnose disorders more efficiently. A visualization of each wave type can be seen in Figure 1 [12,13,14].

1.3. Noise Interference in EEG Signal Acquisition

Noise interference presents a considerable challenge in EEG signal acquisition. It creates noise artifacts that are embedded in the raw EEG data that are collected with electrodes and leads to significant challenges in the interpretation of the real brain’s state patterns by practitioners in the fields of Neurology and Neuroscience [15,16]. EEG captures the brain’s electrical activity indirectly through scalp electrodes because electrodes capture the voltage fluctuation in the skin that is caused by the projection of an electromagnetic field, causing internal neural activity [17]. Unfortunately, along with the brain’s lead field projection in the electrode, the signal that the electrodes capture is also corrupted with unwanted noise artifacts, such as compound muscle movement artifacts, electromagnetic interference, etc. [18]. The purpose of the EEG device is to digitize the least amount of possible noise artifacts that are contained within the original raw EEG signal collected from the electrodes while keeping intact the brain-related component of the raw signal [19,20]. As it becomes apparent from the above, obtaining clear and precise EEG signals is often difficult due to numerous sources of noise interference [17,21].

1.4. Design Specifications in Medical-Grade and Research-Grade EEG Generic Circuit Design

In EEG generic circuit design, various subcomponents work together for accurate brain wave signal capturing and denoising. One of the most characteristic examples of these is the filter subcomponents such as notch, anti-aliasing, high-pass, and low-pass filters, which refine signals by eliminating interference and keeping only the frequency bands of interest from the input raw EEG signal [22]. Another example is the circuit subcomponents, including chopper circuits and electrostatic discharge protection (ESD), which minimize low-frequency noise and protect against electrostatic discharge damage. Additionally, the amplifier subcomponents, such as Operational Amplifiers, Programmable Gain Amplifiers, and Instrumentation Amplifiers, amplify signals with high fidelity [23]. Furthermore, the Analog Multiplexers select signals in multi-channel setups, while the Analog to Digital Converter digitizes the collected signals from the electrodes for further analysis [24]. Moreover, the driven-right-leg circuit reduces interference by introducing a feedback loop between the EEG device and the human body [22]. Last but not least, the power supply subcomponents, such as batteries and regulators, ensure a stable power supply for the device. These integrated subcomponents create a prototypical EEG generic circuit design for detailed brain activity analysis. The particular order of the subcomponents and the choice of incorporating some of them in the design, along with their multiplicity, are some of the engineering problems of constructing a functional and appropriate EEG device. As is apparent, each engineering decision has trade-offs that must be well understood for the design to meet its predefined requirements.
In the design of circuits for medical-grade and research-grade EEG applications, several essential specifications are critical, and specific requirements should be met. These circuits may have a bandwidth ranging from 0.01 Hz to 20 kHz (maximum frequency application—identifying Directional Hearing Cues), covering a broad spectrum of brain activity pertinent to diverse research and medical requirements [25,26]. In addition to the aforementioned point, managing noise levels is crucial, particularly during the initial stages before the first amplification. It is essential to keep the 0.1 to 10 Hz noise below 1 μVpp [27], and ideally under 0.4 μVpp, to ensure clear signal quality and a high signal-to-noise ratio (SNR) [28]. Furthermore, it must be stated that the EEG signal of interest always appears as an AC differential voltage signal in the raw input EEG data. Consequently, a high Common Mode Rejection Ratio (CMRR) exceeding 90 dB is deemed crucial for filtering out the common components of the input signals that are the major carriers of the noise artifacts and undesirable DC offsets [29]. It is also important to note that compliance with regulations requires ensuring that no more than 10 μA of current returns to the body, along with mandatory ESD protection [30,31,32]. The sub-circuits analyzed above are instrumental in achieving signal integrity, thereby ensuring the accuracy and reliability of the data collected. Each design must be tailored to its intended use and optimized for the particular sub-audience that it appeals to in the field of Neuroscience and Medical practice.

1.5. Problem Statement and Structure of the Present Study

The central idea of this study arises from the observation that there is currently a shortage of EEG circuits in the recent literature that can simultaneously monitor the theta, alpha, and beta brain wave frequency bands while the user is engaged in usage protocols that involve intense compound muscle movements. As an objective, this study aims to develop a mobile and cost-effective EEG circuit that can accurately acquire the brain signal during usage protocols that require the effective handling of muscle artifacts. The proposed system is powered by a battery, uses simple sub-circuits, and incorporates filters to handle muscle artifacts. The system can potentially be used for neurofeedback training and tele-controlling devices using Brain–Computer Interfaces (BCIs). For the purposes of accurate design and reproducibility of this study, a realistic electronic model of the human brain and body is created to simulate the effects of electromagnetic interference (EMI) from the external environment.
The present manuscript is organized as follows:
  • Section 1 (Introduction) highlights the medical importance of acquiring an EEG signal and its role in patient monitoring. It also discusses the sub-bands of frequencies into which the EEG signal is classified and introduces the challenges that noise brings to an acquired EEG signal.
  • Section 2 (Related Works in EEG Circuit Design Analog Front-End Architectures) discusses design specifications for medical- and research-grade EEG circuits. The selected case studies are elaborated with respect to the comparative analysis of various architectures of EEG AFE.
  • Section 3 (Materials and Methods: Novel Proposed EEG Analog Front-End Circuit System) puts forth a novel methodology for simulating and evaluating the novel EEG AFE circuitry design against practical cases using MATLAB R2023a.
  • Section 4 (Simulation and Results: Comprehensive Analysis) is presented with the objective of comparing the theoretical values with the simulated values in a real-world scenario for the given circuit design, EEG-B3V3S7C1. The circuit’s performance is simulated in two of the commonest EEG measurement scenarios: the 50 Hz and 60 Hz power grid environments that exist outside the shielded lab conditions.
  • Section 5 (Discussion) discusses the practical implications, potential limitations, and future perspectives of the proposed EEG circuit design.
  • Section 6 (Conclusions) summarizes the entire article.
The authors, along with this work, provide an extended Supplementary Materials file with two sections “SA” and “SB” to this manuscript. Those sections contain information that is important mostly for a reader who is a novice to the field and needs more context and clarification in order to follow the flow of ideas in the main text. See Supplementary Materials “SA” for more details:
  • for each wave and its implications at Table SA1.
  • for each noise source and their corresponding frequency ranges at Table SA2.
  • of the various components involved in EEG circuits, along with their respective functions at Table SA3.
  • of the various technical distinctions in design specifications between medical-grade and research-grade EEG circuits at Table SA4.

2. Related Works: EEG Circuit Design Analog Front-End Architectures

Modern CMOS technology has greatly favored the development and advancement of the analog front-end for EEG applications. Ref. [33] designed using the TSMC 90 nm CMOS process a compact EEG-signal amplifier employing 90 nm MOS capacitors that has been reported to attain high CMRR and gain but in an area-saving design. Another design [34] used an LNA and HPF with a 3rd-order Butterworth filter to achieve high power efficiency, which is extremely vital for wearable EEG devices. A 4-channel AFE was created in [35] to be versatile in electrode compatibility and also reduce noise. The design in [36] focused on EEG signal acquisition for epilepsy detection. The AFE in [37] provides mode-selectable gains for local field potential and action potential detection. Wireless multi-channel EEG devices [38,39,40] have not only improved portability and patient comfort but have also shown efficiency and a low power profile through Bluetooth. Some of these innovations include a present-reused DDA AFE [41] and a low-noise chopper instrument amplifier [42]; both designs achieve high CMRR and PSRR, which are important for the acquisition of good EEG signals. Some other works in the field of EEG signal acquisition and monitoring applications include Neonates-Specific EEG System [43], wireless EEG monitoring circuit with compact amplifiers and signal conditioning modules [44], Single-Chip EEG Signal Sampling Circuits [45], and BCI-Specific EEG [46], etc. Following this overview of EEG circuits, a special extended analysis will be conducted on three distinct EEG circuit designs, in particular, Case “1” [47], Case “2” [48] and Case “3” [49], elaborating on their topology and electronic characteristics. These Cases are used by the authors of this work as a basis for comparison with existing designs that have been published in the peer-reviewed bibliography. A more detailed presentation of these circuits is given in the main text. Furthermore, additional information for an in-depth understanding of each Case’s specific requirements and specifications essential for efficient EEG signal acquisition, simulation and experimental results and comparison with the EEG Generic Circuit Design is outlined in Supplementary Materials “SB” (see Sections SB.1–SB.3), in order to validate the efficacy of these circuits, highlighting their potential impact on advancing EEG technology. For further information on [43,44,45,46], see Supplementary Materials Section SB.4.

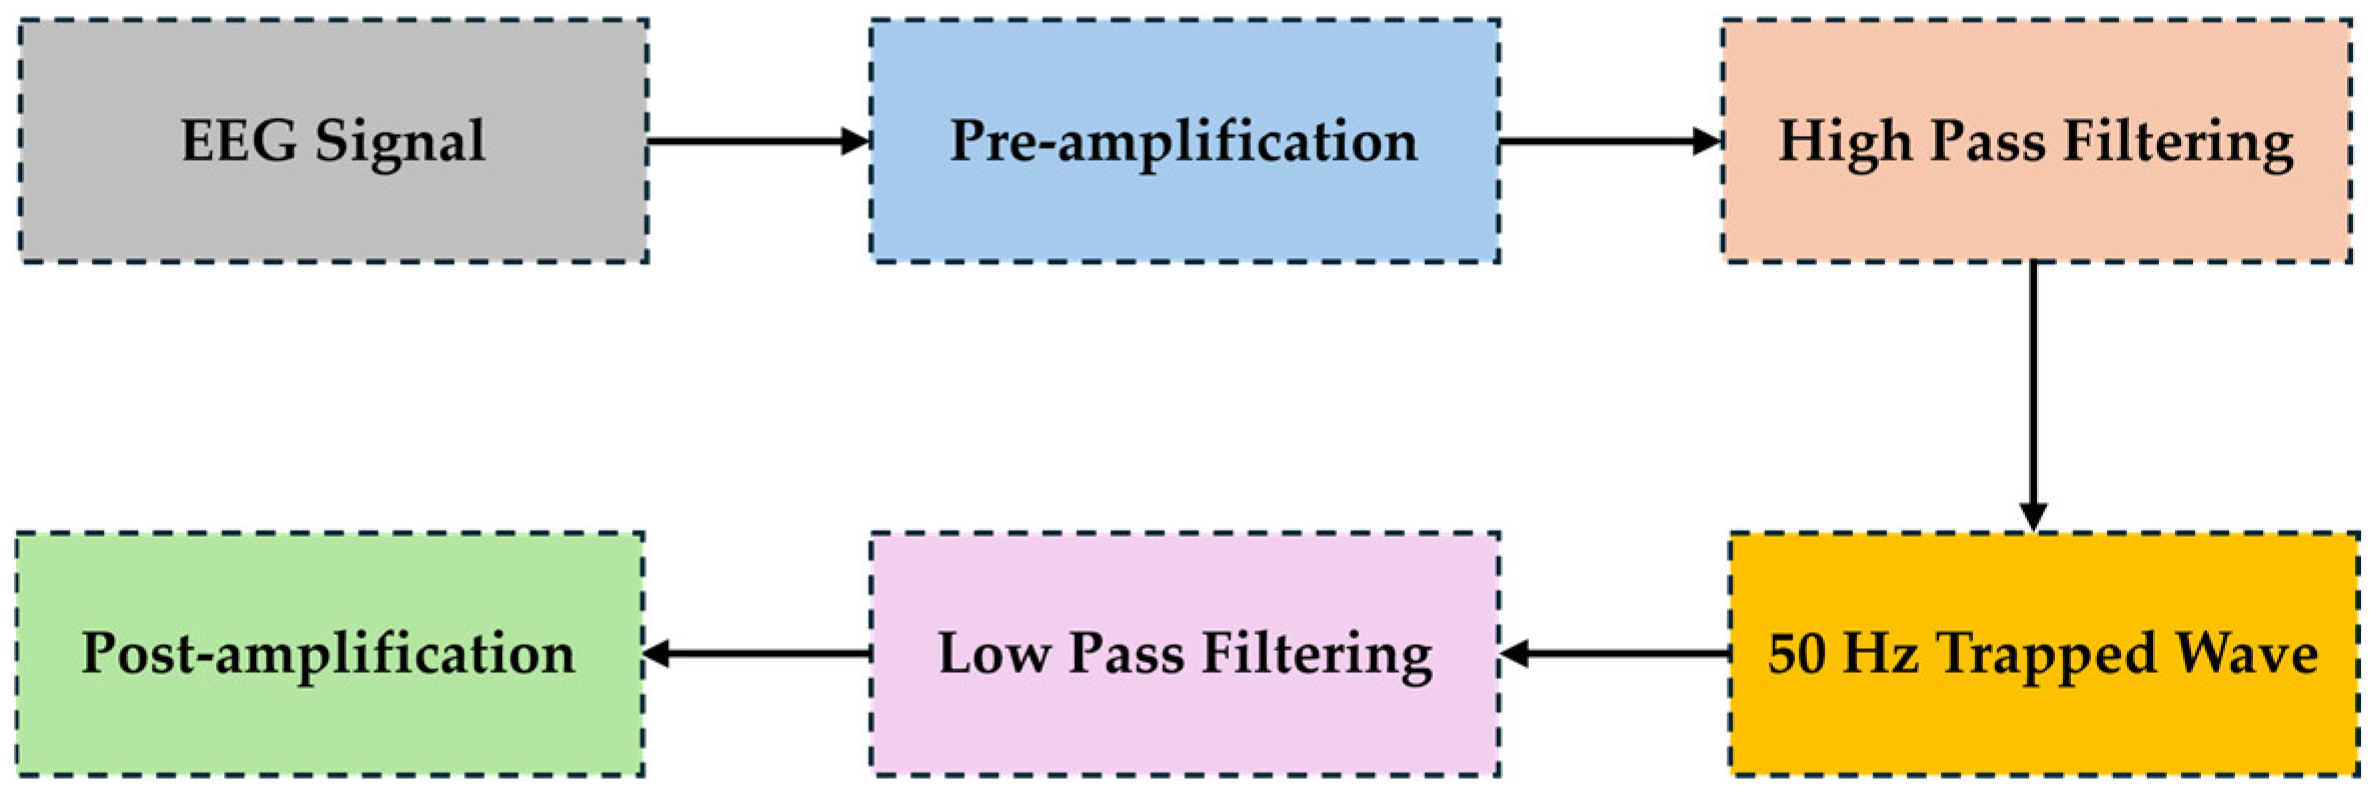
2.1. Low-Cost Circuit Design of EEG Analog Front-Ends: Case “1”

This subsection delineates the topology and connectivity of a cost-effective EEG circuit design, primarily focused on efficient EEG signal amplification and extraction. It incorporates high-definition graphics (block diagrams and circuit schematics) to depict the design’s architecture, offering a clear visual representation of its components and their interconnections. As depicted in Figure 2, the signal is initially boosted in a pre-amplification stage. Subsequently, low-frequency drifts are removed with a high-pass filter. Furthermore, electrical interference at 50 Hz is eliminated by a notch filter, and high-frequency noise is filtered out with a low-pass filter. Finally, a post-amplification step is used to achieve the final results of enhanced signal integrity [47].

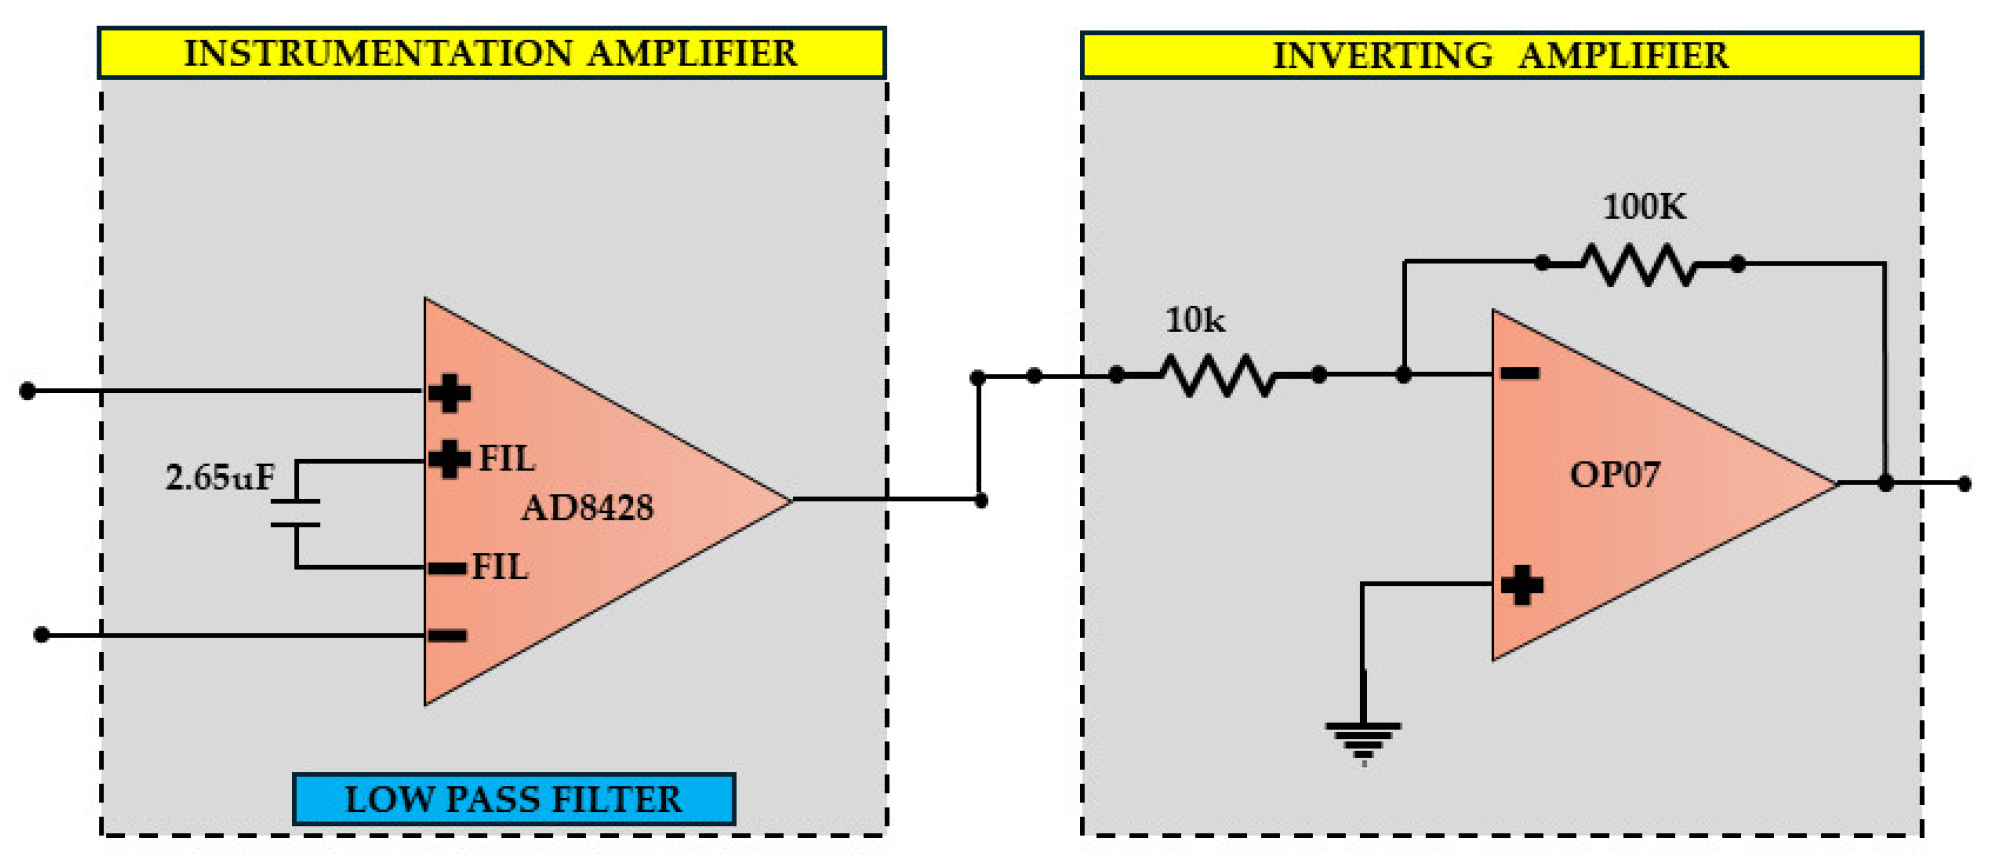
2.2. Battery-Powered, Low-Noise Amplifier Circuit Design of EEG Analog Front-Ends: Case “2”

This section presents the design of a battery-operated low-noise amplifier for an EEG application; it amplifies the signal of the brain wave to some desired value. These designs are tailored toward signal amplification with only two active electrical parts, guaranteeing a high Common Mode Rejection Ratio (CMRR) at a level necessary to properly record the weak and small EEG amplitude signals [48,50]. The system architecture for the active parts contains an inverting amplifier and other passive components, as shown in Figure 3. In the use of the device, a filter instrumentation amplifier is applied for low-passing signals and frequency-dependent gain [48].

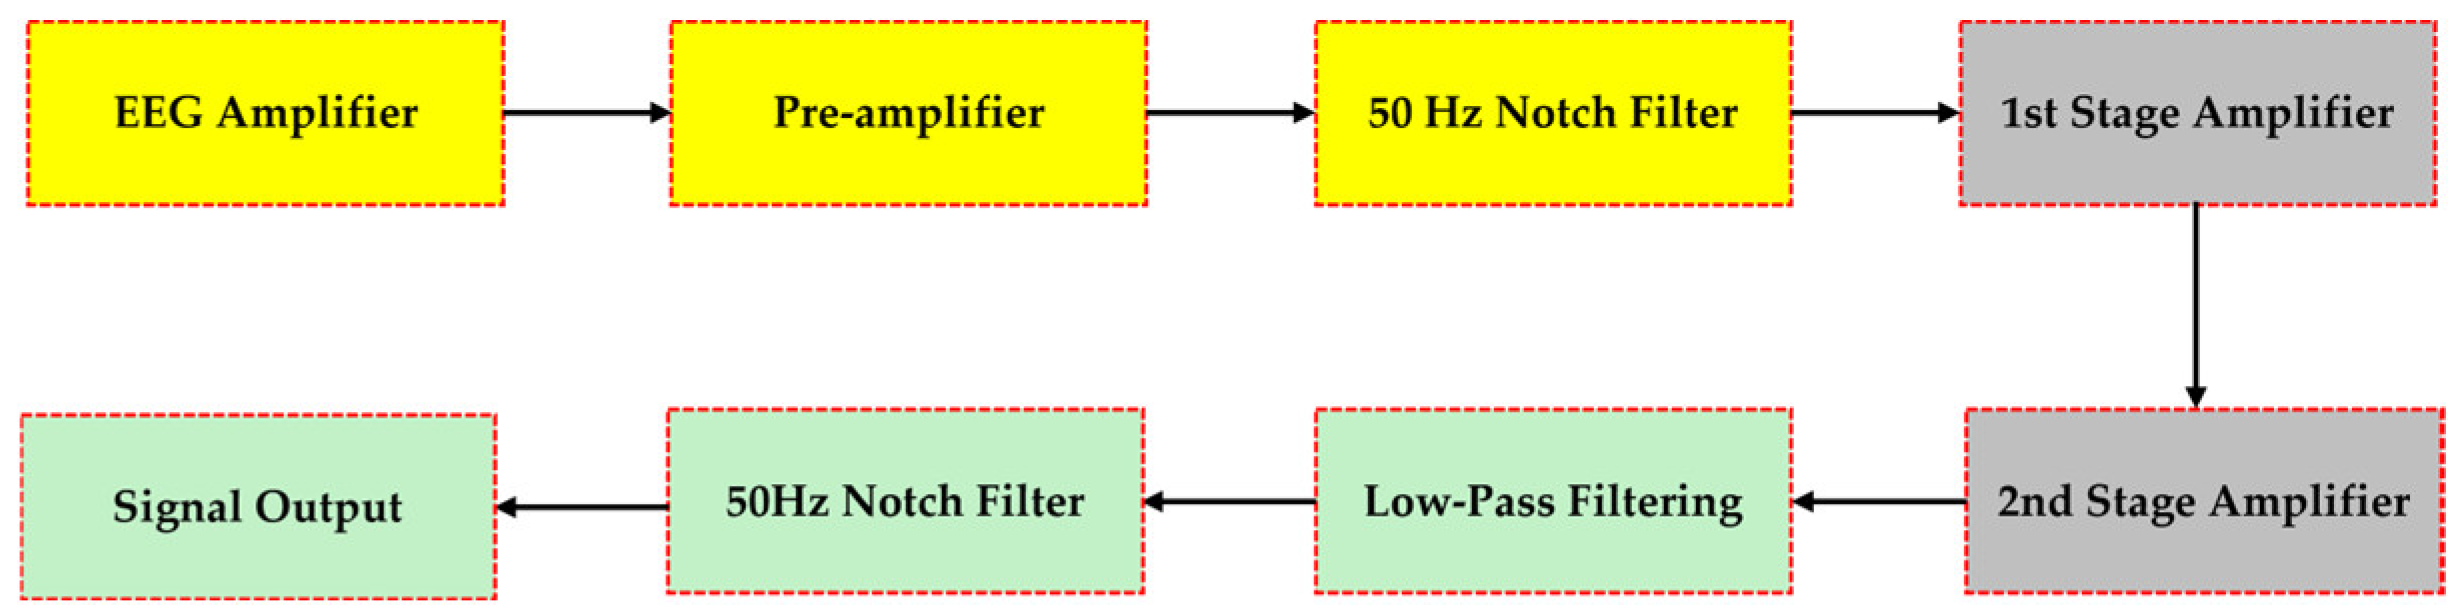
2.3. Double Notch Filter Circuit Design of EEG Analog Front-Ends: Case “3”

This subsection offers an elaborate examination of the structure of a high-performance EEG signal acquisition system. This device integrates a driven-right-leg feedback circuit, differential amplifier circuits, pre-amplification components, and multiple filters. The design incorporates both a pre-amplifier and a two-stage post-amplifier to efficiently amplify the signal. The circuit uses two low-pass filters and two 50 Hz notch filters in order to reduce the occurrence of noise interference present in the raw EEG signal. In the pre-amplification stage, an instrumentation amplifier is used to ensure low levels of noise, minimal changes over time, a high input impedance, and a high CMRR. Moreover, the circuit incorporates a post-amplification stage that employs a high-precision chopper-stabilized operational amplifier. Aside from the post-amplification stage, additional filtration is implemented, namely two notch filters and a low-pass filter, to eradicate high-frequency noise resulting from differential interference [49]. A clarifying overview of this architecture is given in Figure 4 below.

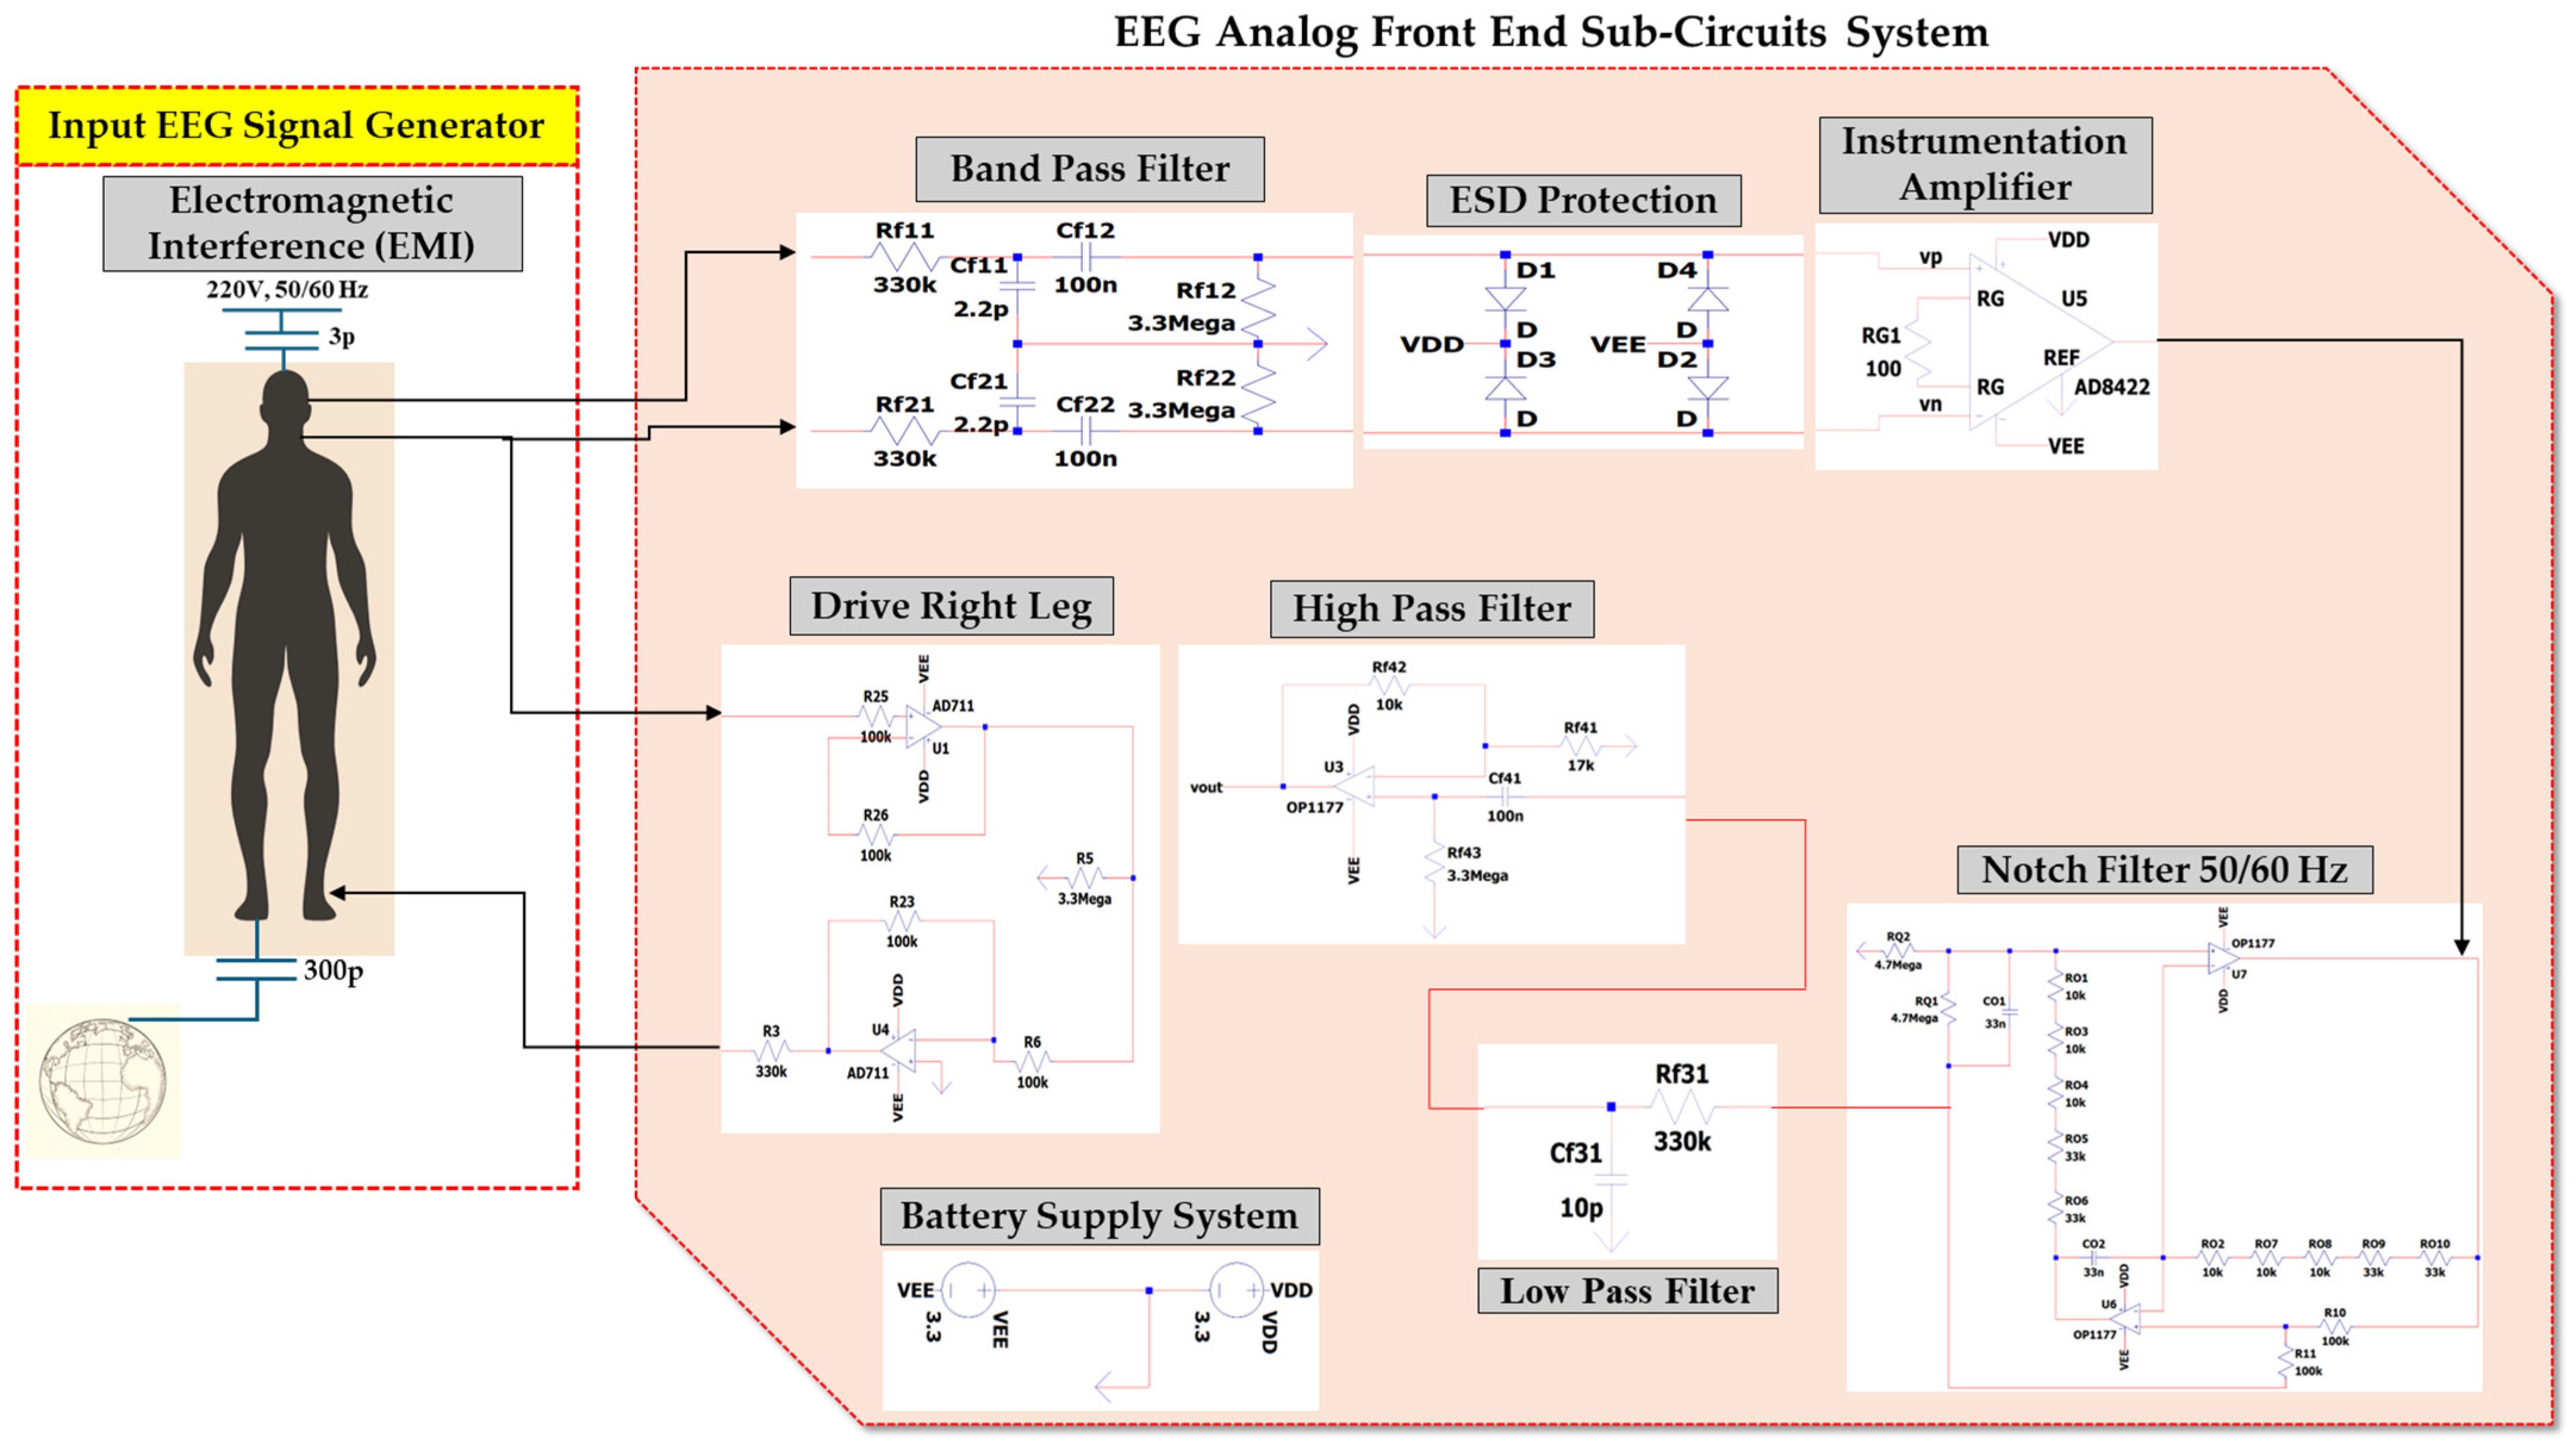
3. Materials and Methods: A Novel Proposed EEG Analog Front-End Circuit System

With respect to the goal of this study, to the best of our knowledge in recent bibliography, there is a lack of EEG circuits that can combine concurrently, on the one hand, the monitoring of the theta, alpha, and beta brain wave frequency bands during usage time in which the user performs strong compound muscle movements (that is, the EEG usage protocol or protocol named for simplicity in this study), and on the other hand, employing an EEG circuit that is mobile, low-cost, and with sufficient muscle artifact handling.
In this study, the design of a novel EEG Analog Front-End Circuit System is proposed that can handle the problem; the aforementioned protocols containing compound muscle movements generate substantial muscular artifacts in the raw EEG data [24]. The electronic equipment requirements of this kind of protocol can be satisfied by the proposed system in this study, which is battery-supplied in order to cover this mobility demand, uses simple and minimal sub-circuits to retain low cost (complex techniques such as chopping are avoided) and employs the necessary filters before and after the amplification stage to handle muscle artifacts sufficiently. The protocols for which the proposed system are designed could apply in neurofeedback training and tele-controlling devices using Brain–Computer Interfaces (BCIs) in which the EEG user performs muscle compound movements [3,4]. Additionally, before implementing the simulation test, in this study, a realistic electronic model of the human brain and body is created that considers the factor of EMI from the external environment, in order to produce an accurate and mainly reproducible input signal to avoid the phenomenon of ‘Garbage In, Garbage Out’ (GIGO) during the evaluation of a system. In contemporary engineering terminology, as presented in [51,52], GIGO is a concept that suggests that the quality of output in a system is determined by the quality of input. Incorrect input, such as incorrect data, can lead to incorrect output. GIGO is commonly used in mathematics and computer science but can also be applied to decision-making systems where precise data are crucial for accurate results. Figure 5 serves as a comprehensive overview of the circuit, providing a visual high-level reference that nonetheless includes all the elements and sub-circuits of the EEG circuit.
The aforementioned proposed EEG circuit design’s requirements are presented. Firstly, a Common Mode Rejection Ratio (CMRR) greater than 90 dB is explained in [53]. Furthermore, the noise within the frequency range of 0.1 to 10 Hz is required to remain below approximately 500 nVpp root mean square noise [28]. The bandwidth of the input signal for this novel EEG is required to be denoised accurately, and it is from 0.5 Hz [53] to 3000 Hz in order to include a wide range of brain activity [54], with a specialized focus on the 4 Hz to 30 Hz frequency region. This special range of frequency is essential for monitoring the theta, alpha, and beta brain wave bands. Additionally, the circuit design demands a careful choice of a high input resistance, traversed by a maximum current of less than 10 µV, for human-user safety reasons. This complies with safety standards for medical or research environments. The selection of component values is made with consideration for future design iterations since the printed circuit board (PCB) layouts need capacitors with a maximum value of 100 nF [46]. Prior to conventional designs, the proposed circuit specifically tackles notable issues; including inadequate filtering, limited bandwidth, and additional noise introduction prior to the amplification phase [47,48,49]. Our cost-effective approach aims to encourage research and commercial use while maintaining the high-quality signal integrity required in medical-grade applications. It does this by keeping the system simple with the minimum number of components necessary to achieve the stated goal of the design. This goal is also achieved by avoiding more expensive component-wise circuits (in terms of components and cost added versus accuracy gained) that implement techniques such as chopping. If accuracy is of importance and the designer of an application using this circuit wants to compromise cost over accuracy, using precision 0.1% resistors is advised, and in that spirit, the theoretical calculations are provided with two decimal point digit precisions. The requirements and specifications for the novel proposed circuit EEG design are detailed in Table 1.
In the next sections, the proposed EEG design will be presented as a series of sub-circuits for clarity and simplicity. With respect to which sub-circuit is dedicated either to the creation of noise or to its reduction with respect to the EEG signal, the following stand true for the sub-circuit of the subsection:
  • 3.1: Simulates the EMI noise,
  • 3.2: Simulates all types of muscle artifacts (noise stemming from either EMG, EOG, or ECG types of signals),
  • 3.5: Provides a feedback loop between the circuit and the body that leads to a reduction in the overall noise and the possible sharp changes that may occur in the noise sources.,
  • 3.6: Achieves an initial reduction in dc-offset and low-frequency and high-frequency noises,
  • 3.7: Significantly reduces both EMI and artifacts that are contained in the common mode part of the input signal,
  • 3.8: Eliminates the remaining EMI noise from the main either at 50 Hz or 60 Hz depending on the region-specific configuration of the circuit that is being used,
  • 3.9: Eliminates the remaining high-frequency noises,
  • 3.10: Eliminates the remaining dc-offset and the low-frequency noises.

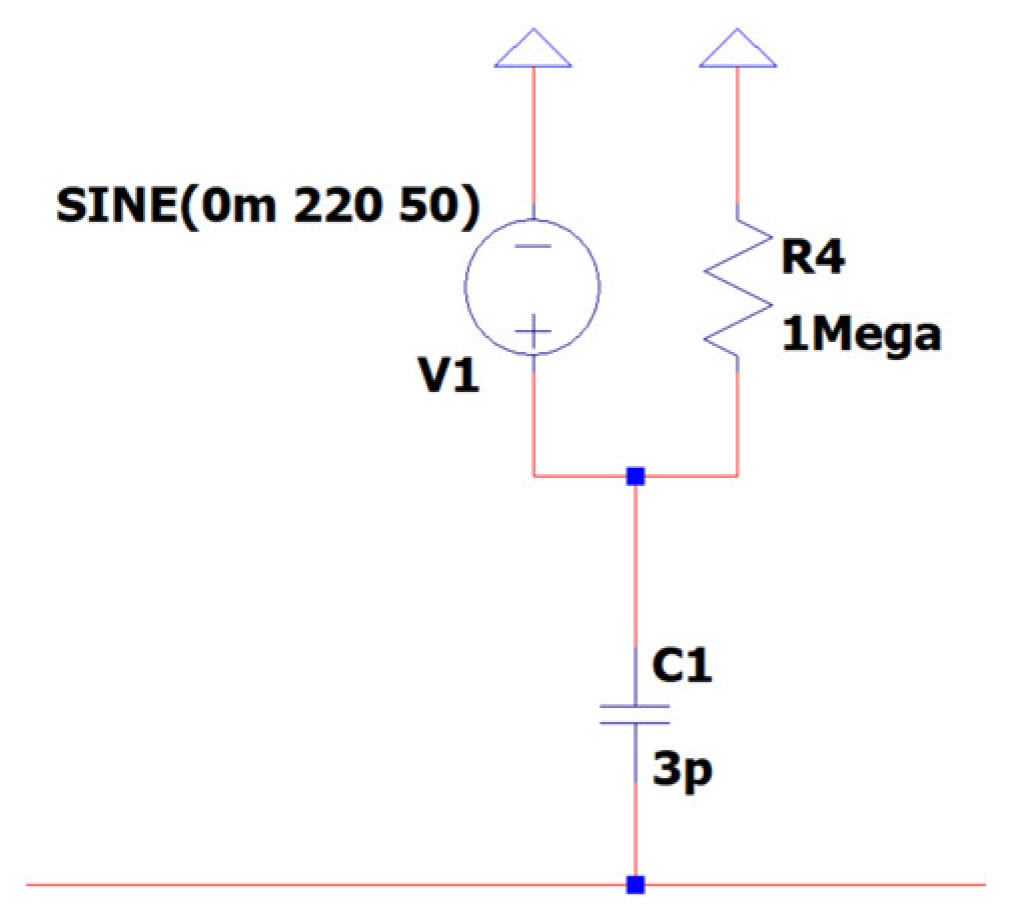
3.1. EEG Sub-Circuit Modeling the Electromagnetic Interference of Electric Grid with the Human Body

This sub-circuit is specifically engineered to replicate the voltage that an individual could encounter due to nearby electrical circuits linked to the power grid. In this model, resistive components symbolize the electrical loads in close proximity to the person, while capacitive components represent the medium of air through which electromagnetic waves propagate towards the human body. This design essentially depicts the network as a source of electromagnetic waves, with the human subject serving as the recipient. The primary purpose of this sub-circuit is to simulate, rather than reduce, electromagnetic interference, hence improving the accuracy of EEG signals by defining patterns of interference. Figure 6 depicts the EEG sub-circuit that models the EMI in a 50 Hz electric grid.

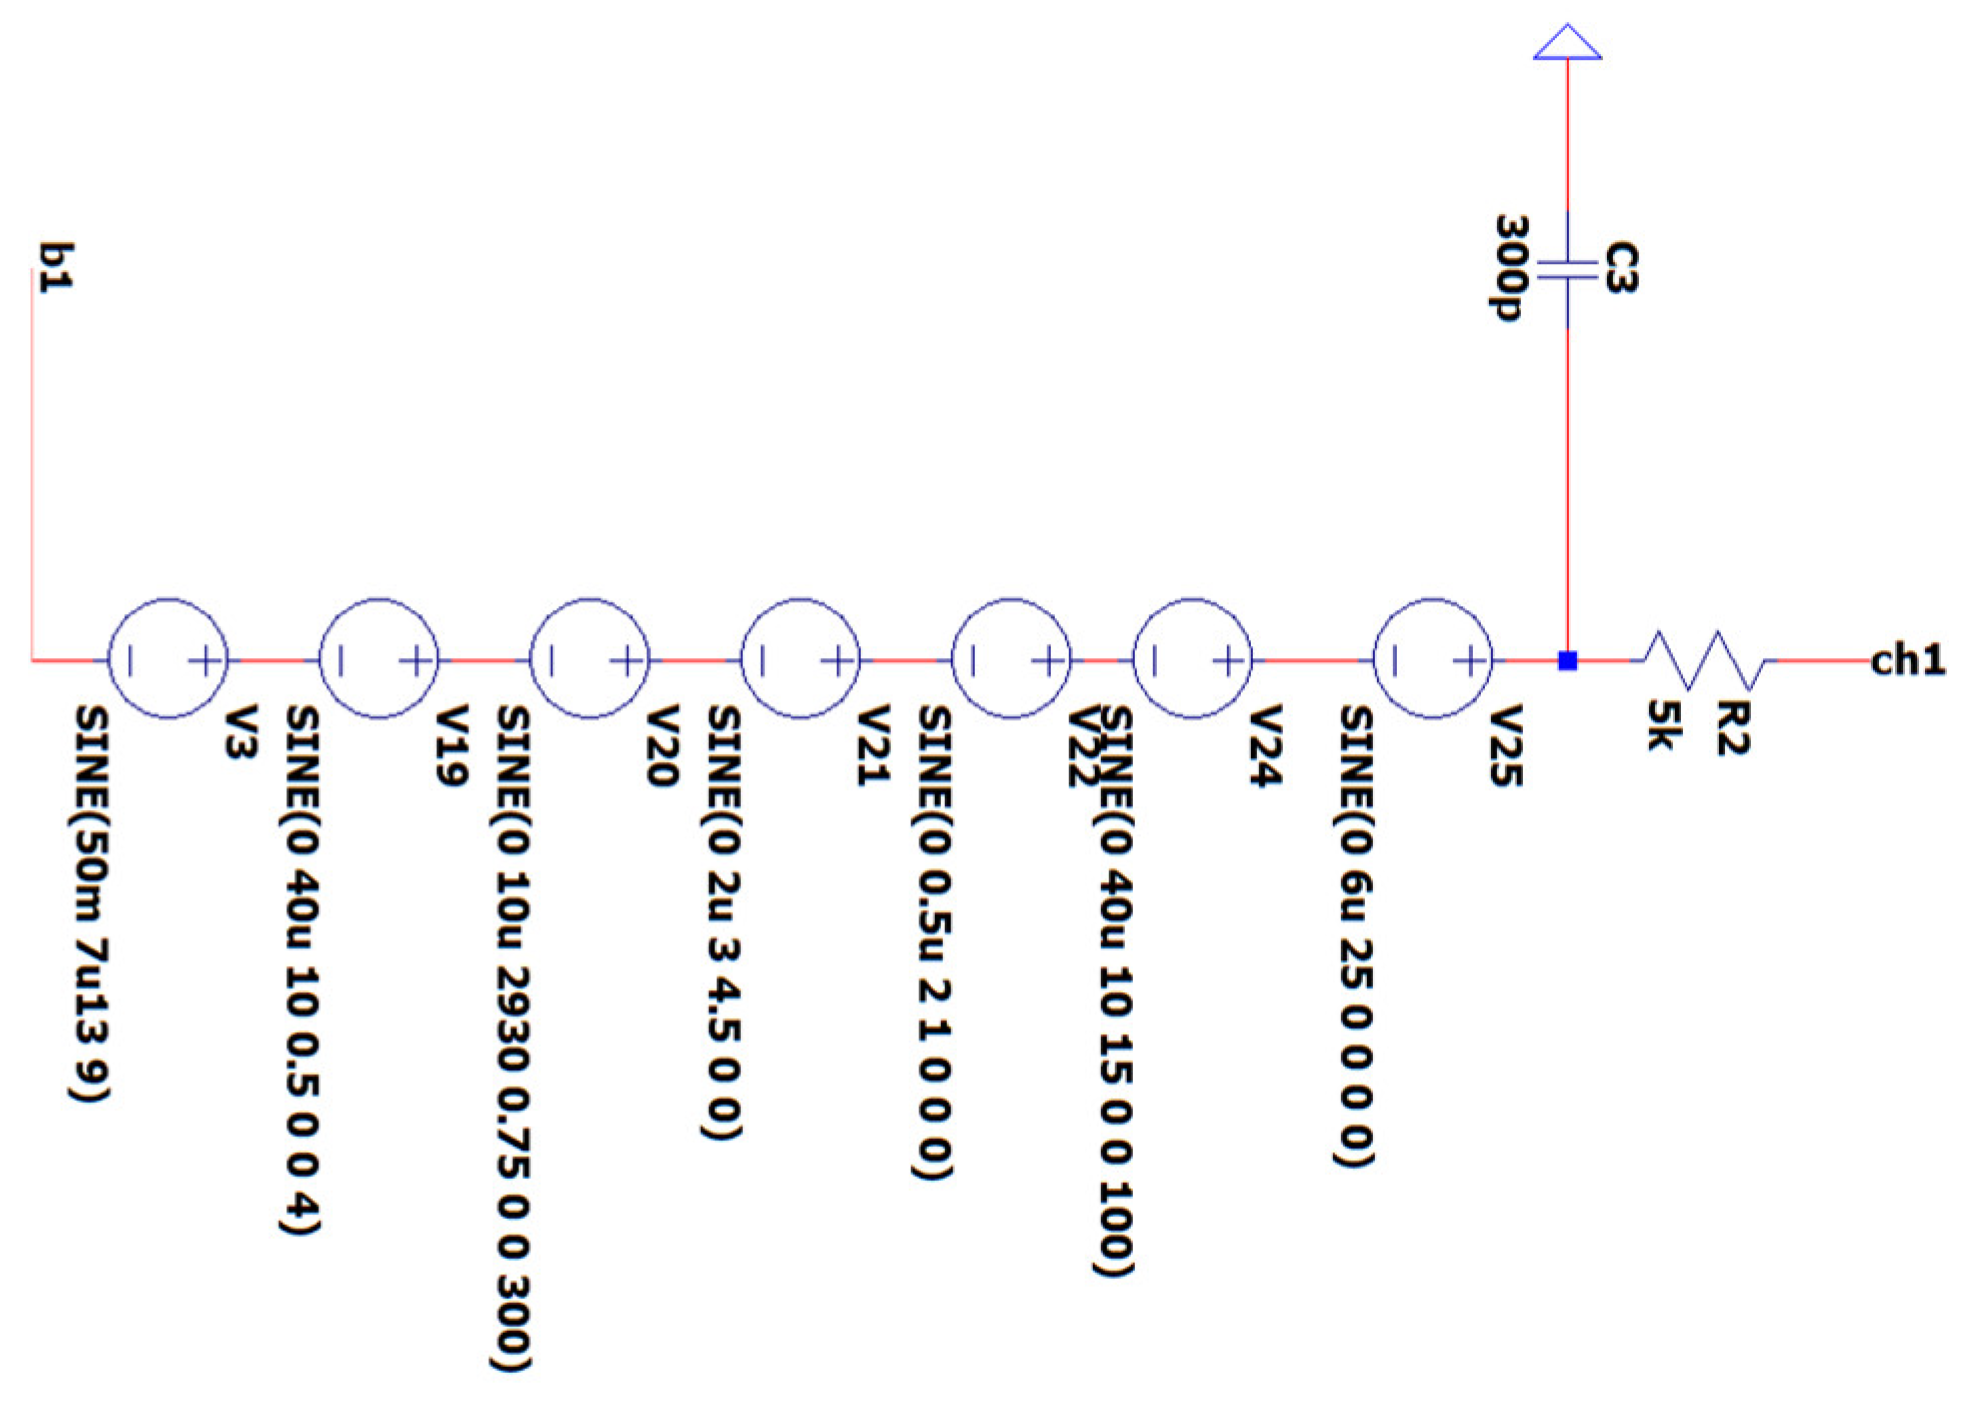
3.2. EEG Sub-Circuit Modeling the Human Body Apart from the Brain and Earth

This sub-circuit models the relationship between the human body and the Earth, including muscle movements and heart activity, which generate electrical interference in the EEG signal. Resistances are crucial for accurately replicating physiological electrical circuits, both between the head and body and between the body, ground and reference electrode. Physiological sounds, namely complicated muscle movement artifacts, are identified as having a frequency range of 1–200 Hz and an amplitude range of 0.1–100 mV, based on empirical data and study results [24].
More precisely, the sub-circuit converts muscle noises into voltage sources that occur at various locations throughout the EEG recording process. This is performed in order to compute the mean intensity of the alpha, beta, and theta signals. It mimics biological tissue by using a series of voltage sources and resistors to reduce electrical thermal noise, a phenomenon that is typical in electronic components but absent in actual tissues. According to the empirical results of the experiments related to electrode’s voltage measurement during protocols with compound muscle movement, performed in the “Biomedical Optics & Applied Biophysics Laboratory’’ of the School of Electrical and Computer Engineering of the National Technical University of Athens, the voltage sources are configured within the range of 1–80 Hz and 1–50 mV. The aim of these experiments was to capture peak-to-peak (Vpp) raw EEG signals by employing wet electrodes during the performance of intricate muscle movements, such as jumping and walking.
Furthermore, to simulate the body’s grounding phenomenon, the modeling incorporates resistances across various anatomical regions and 300 pC capacitors. In particular, these resistances are modeled as noiseless because, in contrast with their electronic counterparts, those in between tissues do not yield thermal noise in the context of our model. The result is a closed-loop system between the Earth and the EMC model of the human body. In Figure 7, the EEG sub-circuit modeling the human body apart from the brain during protocols with strong compound muscle movement is depicted.

3.3. EEG Sub-Circuit Modeling the Brain and the Electrode

The objective of this circuit element is to emulate the voltage signals generated by the human brain. The simulation incorporates voltage sources to represent brain signals across the alpha, beta, delta, and theta wave bands, with amplitudes precisely measured in μV. This method enables the precise depiction of the brain’s electrical activity, including a spontaneous event-related potential (ERP) with a high frequency of 2930 Hz. The investigation of such a high-frequency ERP is often conducted using intracranial electrodes, highlighting the advanced nature of our model in accurately representing a wide range of neuronal activity [54].
The deliberate incorporation of test sources containing an extensive range of signals is a strategic decision made to verify the accuracy of our EEG circuit in extracting the specific bands of interest for the intended protocol. When quantifying the alpha, theta, and beta frequencies during complex muscle movements, it is vital to account for this variable. It is possible to integrate wet electrodes with impedances between 1 and 50 kΩ into the circuit, modeled as a simple resistance. However, wet electrodes exhibiting impedances greater than 50 kΩ are customarily excluded from the system as a result of the compromised signal quality. Furthermore, this EEG circuit can be utilized with dry electrodes, which have impedances between 700 kΩ and 1400 MΩ. It must be noted that the impedance values of the electrodes, either wet or dry, are expected not to be equal. In Figure 8, the EEG sub-circuit modeling the brain and the electrode is depicted.

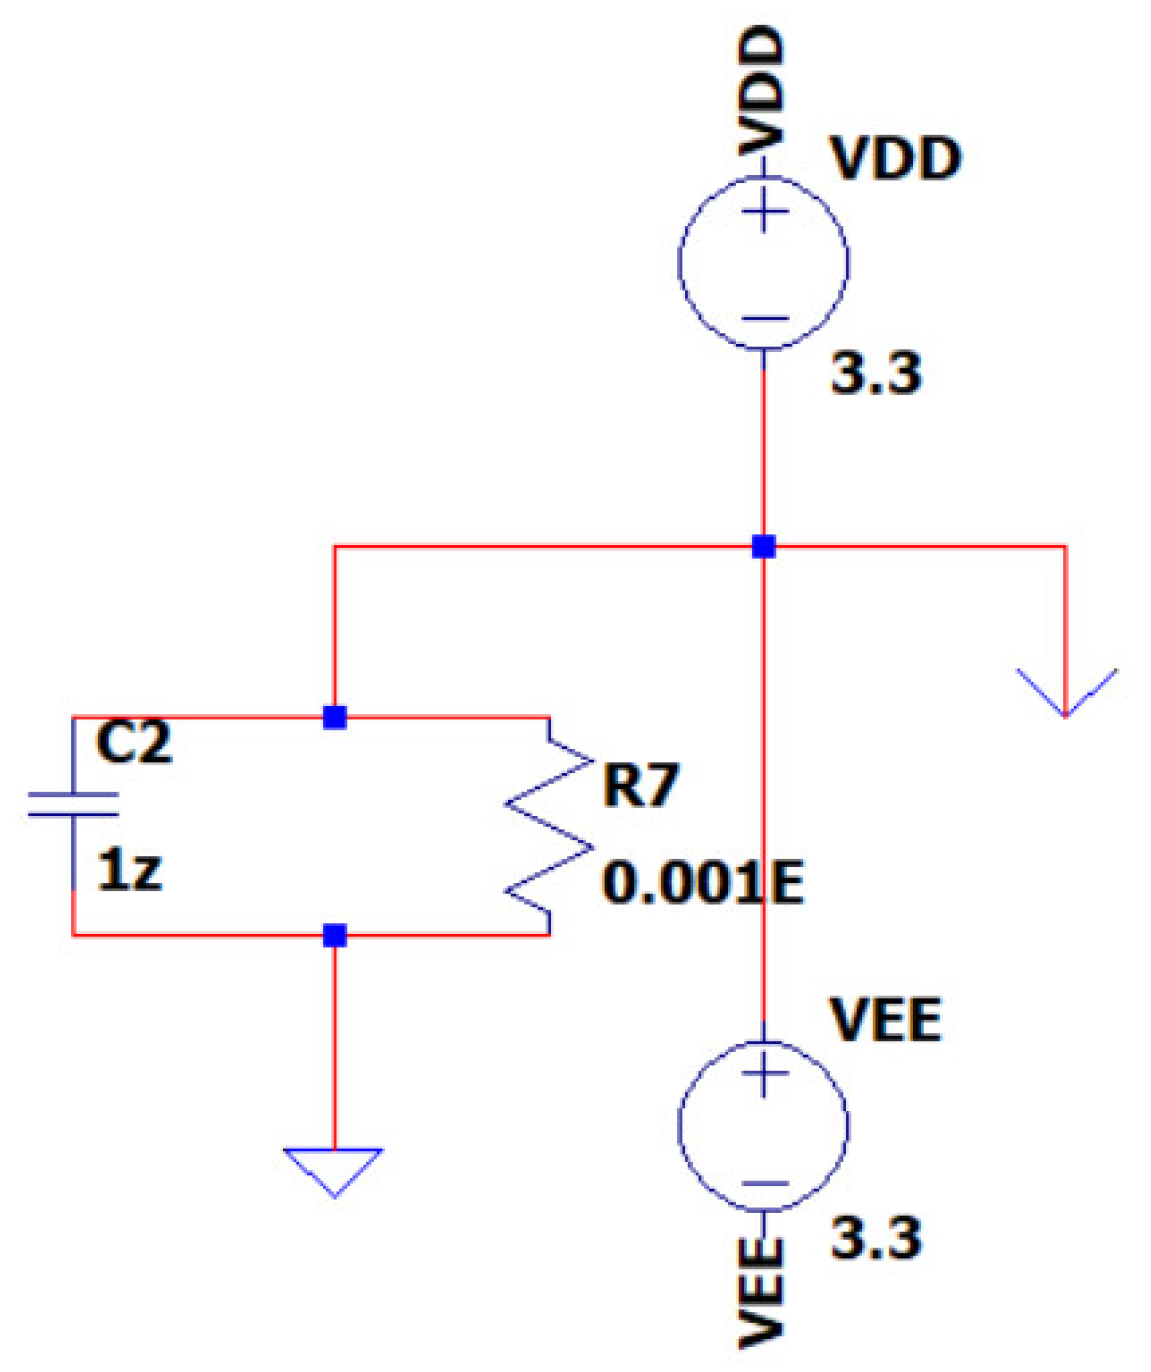
3.4. EEG Sub-Circuit Modeling the Battery Supply of the System

The EEG sub-circuit is designed to model the power supply mechanism of the EEG circuit. This sub-circuit utilizes two 3.3 V rechargeable batteries, similar to other battery systems found in contemporary mobile devices, encompassing this duality. Its battery supply system employs a special grounding symbol for representing the circuit’s ground, depicted as an inverted lambda “Λ” Greek alphabetical symbol. This symbol is connected to a RC network, with R = 0.01 EΩ and C = 1 zF in parallel. This network creates the EEG circuit’s ground by being connected to Earth grounding on one end and the intersection between the two batteries and the circuit’s ground on the other end. The design incorporates a closed triangle to represent the Earth’s ground and an open triangle to represent the circuit’s ground. This configuration is a mandatory design requirement, because of the selected simulation software program’s limitations in supporting two Earth symbols (a symbol with precisely 0 V AC and 0 V DC voltage source references). The circuit’s ground exhibits a DC voltage of 0 V and an AC voltage of 200 pV; thus, it is safely considered for the rest of this study to be a 0 V reference while being independent from the Earth’s ground. In Figure 9, the EEG sub-circuit is depicted, modeling the battery supply of the system.

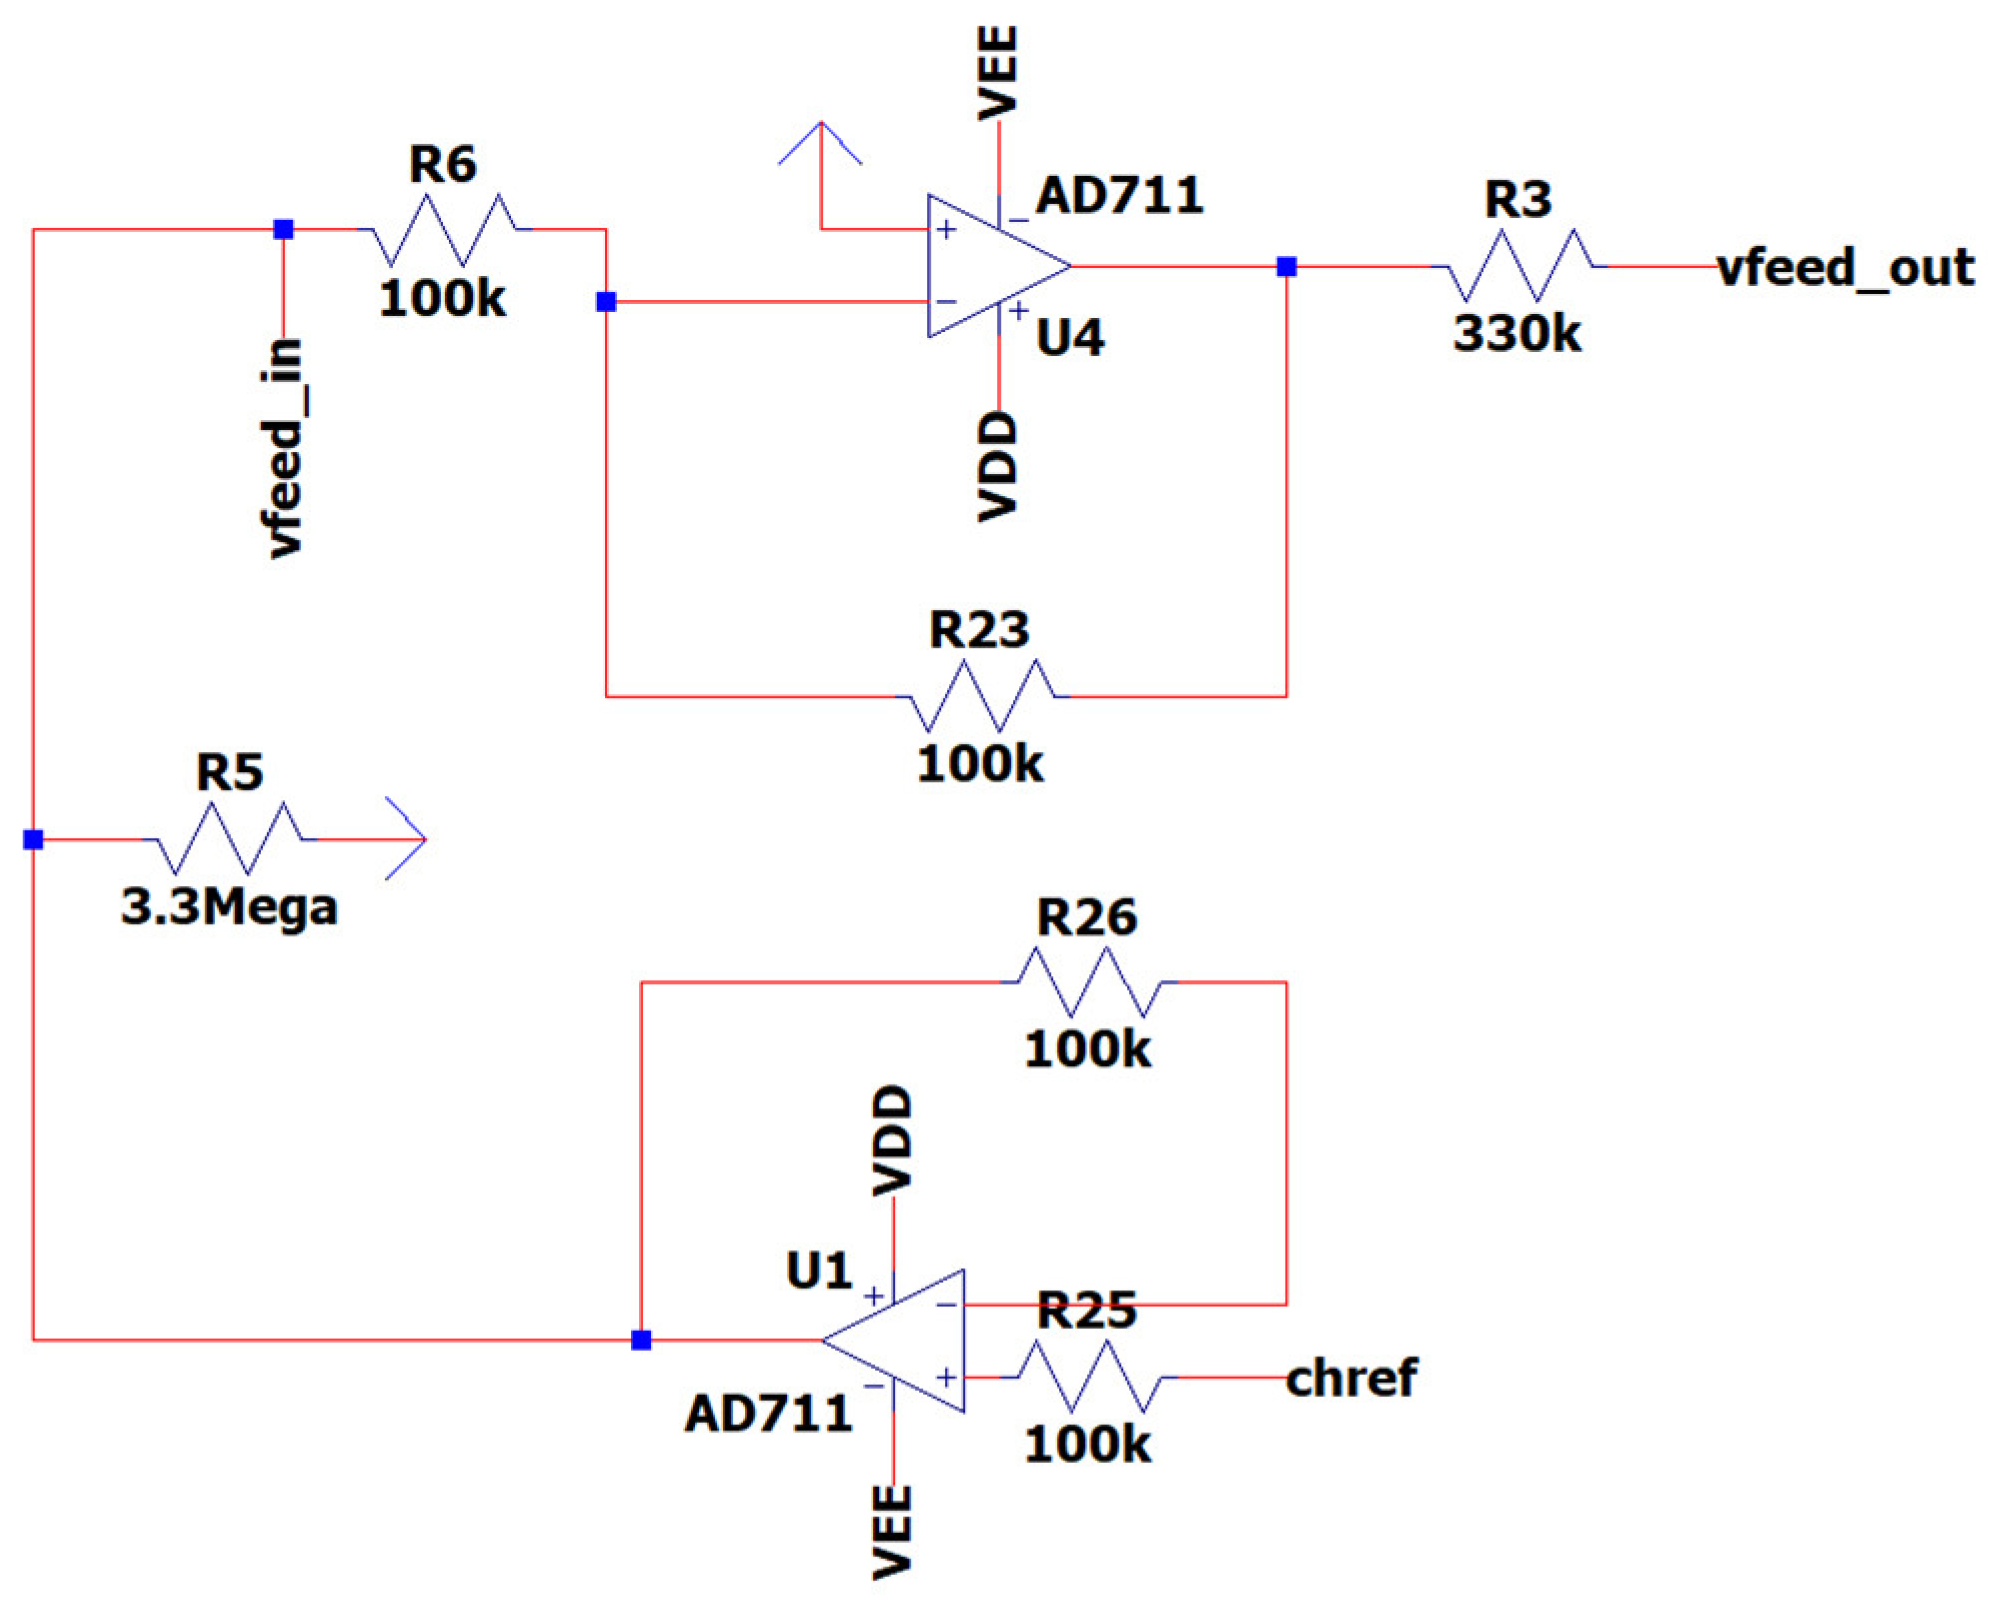
3.5. EEG Sub-Circuit Modeling the Driven Right Leg (DRL) Circuit

The utility of the DRL circuit is the creation of a feedback loop between the reference electrode and the body. This arrangement incorporates meticulously chosen resistors to protect both the electronics and the user. The circuit utilizes signal inversion and redirects it towards the body in order to ensure that the current remains below the safety threshold of 10 μA, as required by some of the safety rules (i.e., IEC-601-1 in [31]) that previous studies have declared that they took into consideration when designing their works [31,32]. This sub-circuit is powered by a battery with a maximum voltage of 3.3 V. A 300 kΩ resistor is used to regulate the maximum current to 10 μA, although typical operational currents fall within the range of several hundred nA. This configuration showcases our commitment to safety by ensuring that the circuit operates smoothly within predefined limits under normal conditions.
Additionally, a 3.3 MΩ resistor serves as a crucial pathway for the movement of leakage current towards the ground in the event of a malfunction. The primary function of this high-resistance component is to operate with a very low level of current, often within the nA range. This guarantees that the EEG signal remains undistorted when it is reintroduced into the body via the dual buffer amplifiers. A 100 kΩ resistor is used to optimize the circuit’s efficiency and minimize power consumption. The choice is made to retain the feedback current usage at around 0.5 μA. This strategy not only maintains the longevity of the battery but also ensures minimal energy consumption from the system. The intentional design strategy is opting for a larger resistor rather than a smaller one to attain an optimal equilibrium between power efficiency and operational effectiveness. In Figure 10 is depicted the EEG sub-circuit modeling the driven right leg circuit.

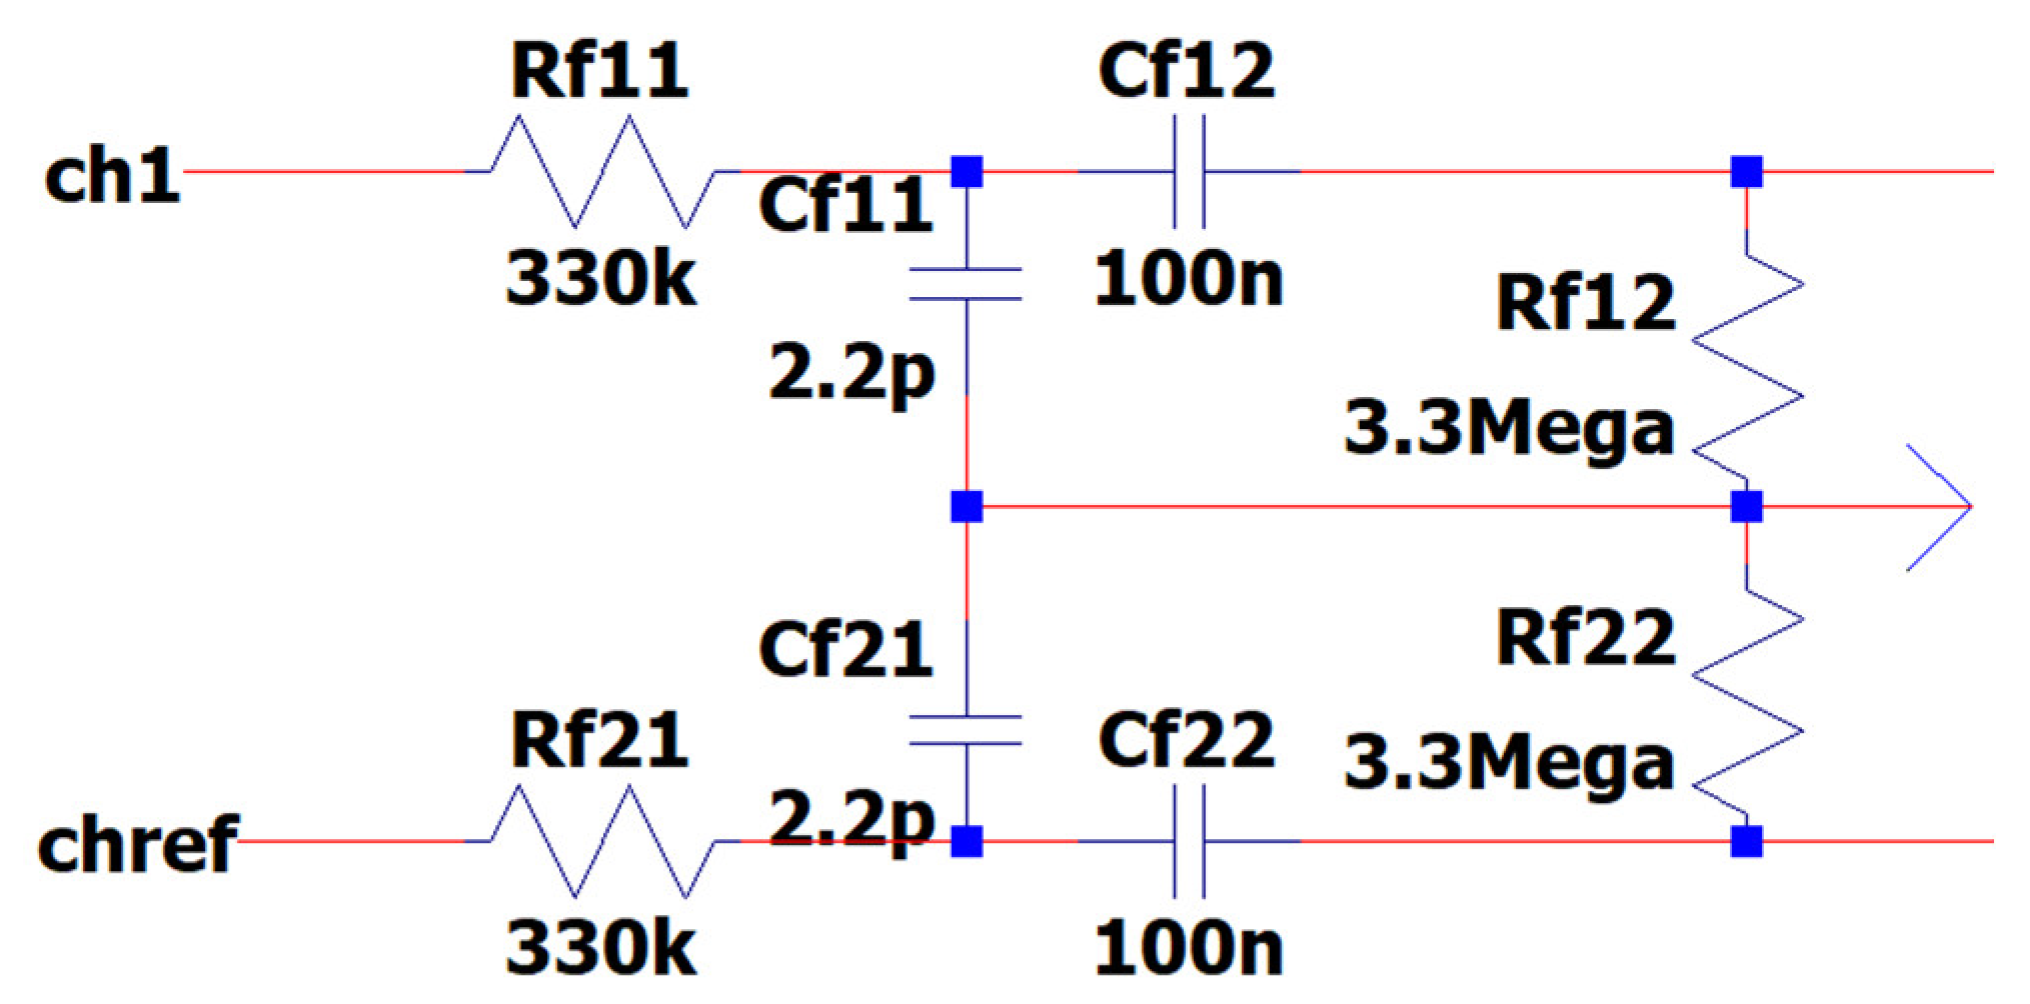
3.6. EEG Sub-Circuit Modeling the First Band-Pass Filter

This sub-circuit is precisely designed to achieve two specific goals: (i) safeguarding the user of the novel EEG circuit, and (ii) simultaneously constructing a traditional RC band-pass filter. The positioning of the high-pass filter at the beginning of the band-pass filter sub-circuit accounts for the fluctuating resistance characteristic of the electrode contact. The high-pass filter has an input resistance of 330 KΩ. The indicated quantity is the minimum requirement to adhere to safety regulations, which restrict the amount of input to the body to a maximum of 10 μA, as specified by IEC-601-1 safety rules.
A 2.2 pF capacitor was used to ensure that, despite the dry electrode’s greatest input resistance of 1.4 MΩ in combination with the 330 KΩ resistor, the filter effectively includes the highest frequency of interest, 20 kHz, inside the pass band’s 0 dB gain range. The exact configuration of electrode resistances yields cut-off frequencies ranging from 41.81 kHz (with an input resistance of 1.73 MΩ) to 218.56 kHz (with an input resistance of 331 KΩ).
Furthermore, a first high-pass filter is used at around 0.4822 Hz to eliminate any variations in DC offset and somewhat reduce muscle interference, while having negligible impact on the signal prior to amplification. While a cut-off frequency of 0.05 Hz or lower would be ideal for preventing signal distortion, implementing such a low frequency would necessitate the use of excessively large capacitors. This is especially true in scenarios where there is substantial muscle noise, such as during physical exertion or when experiencing the revival of embodied psychological trauma. Therefore, making slight adjustments to the EEG signals in the delta wave region is an intentional choice that aims to find a compromise between the accuracy of signal capture and the practical limitations imposed by significant muscle interference.
The first band-pass filter exhibits a Q factor of 0.0014854, a damping ratio of ζ = 336.598, and a center frequency of 324.6667 Hz under the condition that the input resistance is 331 KΩ. The filter exhibits a Q factor of 0.0033969, a damping ratio of ζ = 147.191, and a center frequency of 141.972 Hz under the condition that the input resistance is 1731 KΩ. The considerations described above result in minimal phase distortion within the acceptable frequency range for our amplification needs. The system takes around 30 msec to reach 99.99% of its final value. The equation describing the circuit above is
f 3 d b = s   1 R f 11     C f 11 s 2 + s 1 R f 12     C f 12 + 1 R f 11     C f 12 + 1 R f 11     C f 11 + 1 R f 12     C f 12     R f 12     C f 12
In Figure 11 is depicted the EEG sub-circuit modeling the first band-pass filter.

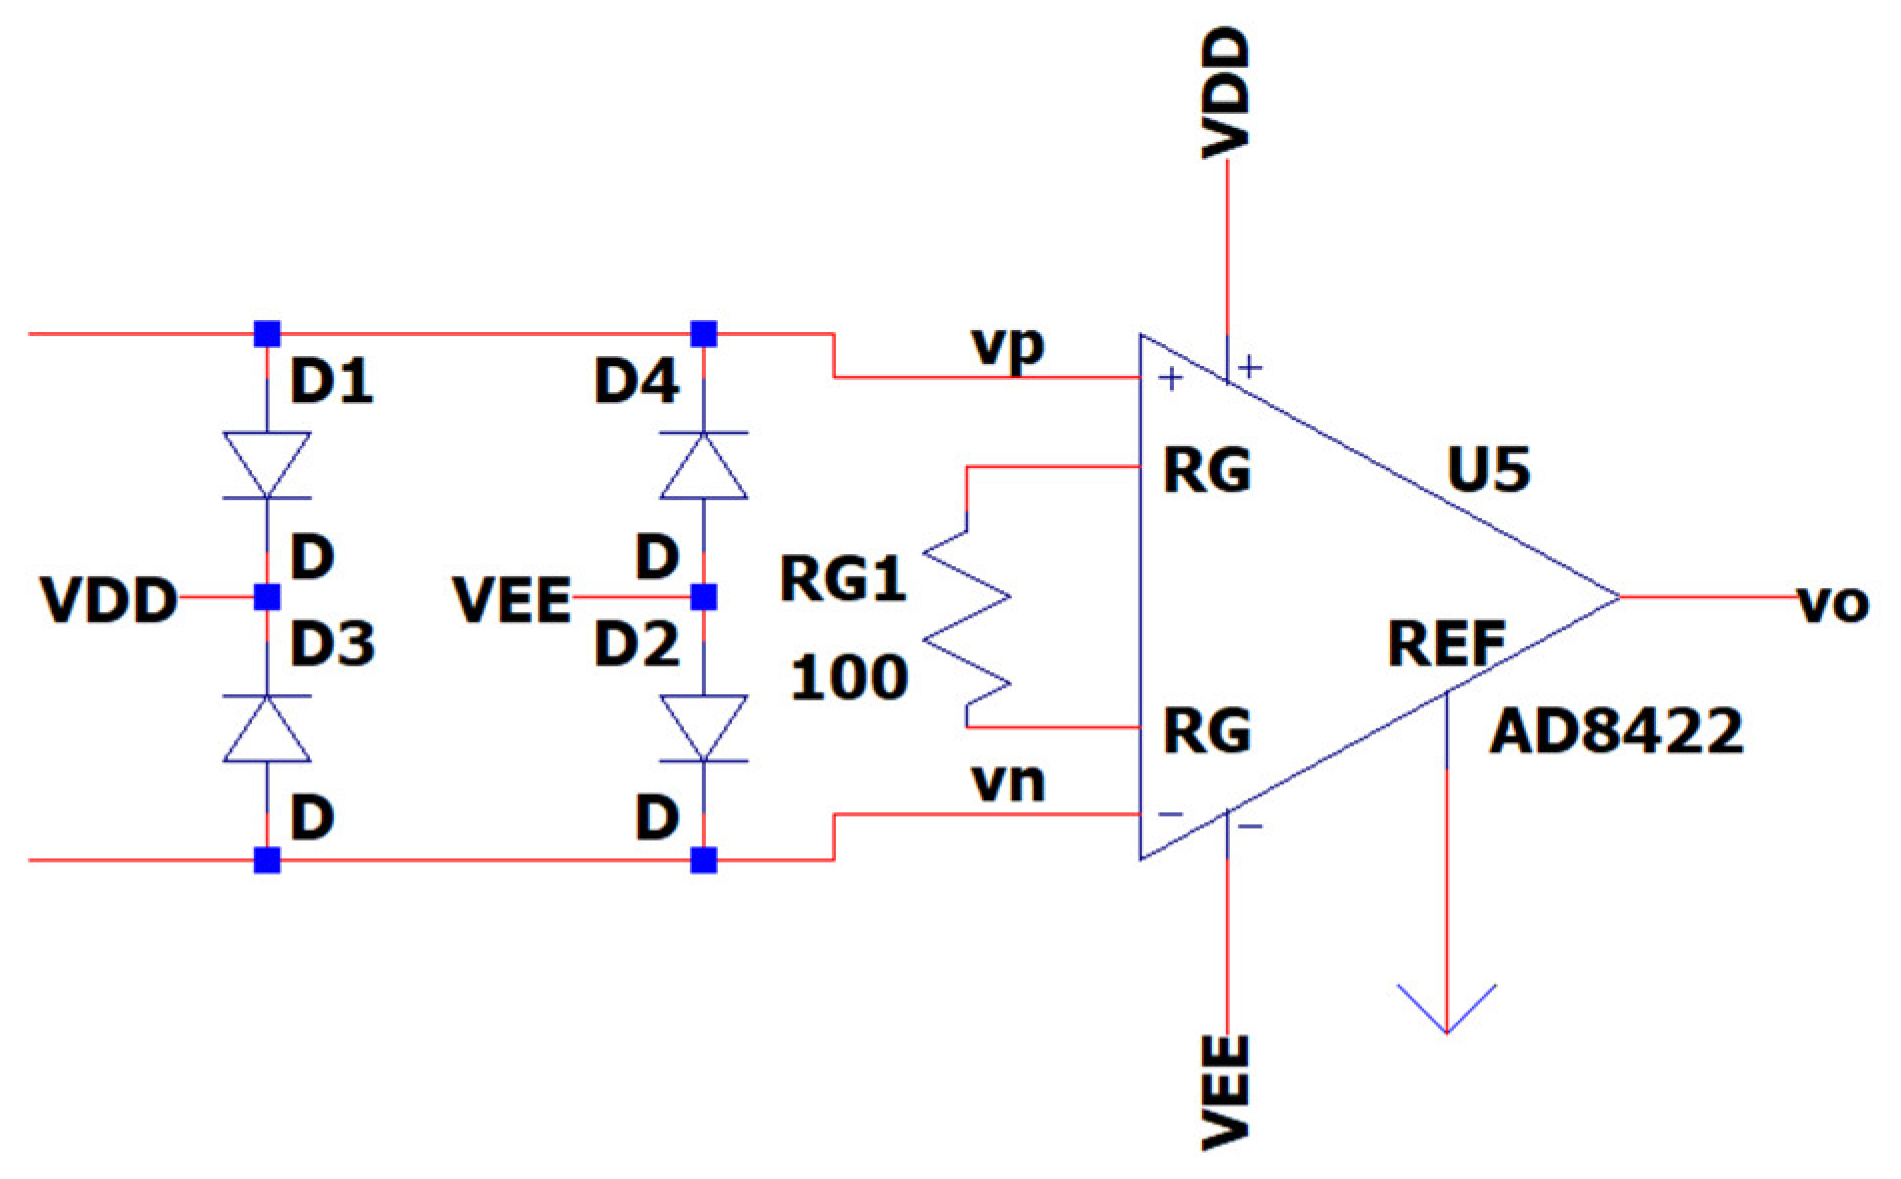
3.7. EEG Sub-Circuit Modeling the ESD Protection and the Instrumentation Amplifier

After the output of the first band-pass filter, the design integrates electrostatic discharge (ESD) protection utilizing the circuit proposed in [55]. This sub-circuit guarantees the safety of the EEG circuit and of its user, by creating a path to the positive and negative supplies for transient electrical currents that may arise from contact between objects with disparate electrical charges, known as the ESD protection circuit.
Consequently, the signal is passed to the instrumentation amplifier, which has, as input, both the channel one electrode and the reference electrode. The amplifier has a gain of 199 V/V and reaches 99.9999% of its maximum value in approximately 15 µsec of settling time. The AD8422 is chosen as an instrumentation amplifier because of its CMR performance. It has a specific CMRR of 110 dB, much over the minimum requirement of 90 dB [29]. The resistance of the gain resistor RG is set to 100 Ω, ensuring a theoretical gain of G = 199 [56].
The equation describing the instrumentation amplifier gain above is as follows:
G = 1 + 19.8   k Ω R G
Figure 12 depicts the EEG sub-circuit modeling the ESD protection and the instrumentation amplifier.

3.8. EEG Sub-Circuit Modeling the Fliedge Notch Filter 50 Hz or 60 Hz

Active notch filters are used to attenuate significant aberrations occurring at 50 and 60 Hz in EEG data. They have shown challenges in terms of adjusting the center frequency, maintaining stability, and achieving repeatability. The maximum goal that the designer could achieve is a noise level reduction of approximately 40 to 50 dB when simulating the circuits by theoretical calculations. Consequently, this design prioritizes center frequency and Q above notch depth. The Q value of a certain notch filter corresponds to the frequency at which the filter’s response is attenuated by −3 dB, not at the point 3 dB above the notch depth.
This is a dual operational amplifier filter that utilizes just four high-precision components: (i) two resistors (Rο) and (ii) two capacitors (CO). These components are responsible for setting the damping factor and center frequency of the filter. RO resistance is shown as an assemblage of resistances that possess a high level of accuracy. Circuits that are used in a 50 Hz grid make use of resistors RO6 and RO10 with a resistance of 33 kΩ as shown in Figure 13. It is necessary to place an extra 33 kΩ resistance in parallel with RO6 and one with RO10, respectively, in order to utilize the EEG in a 60 Hz grid environment.
The Q factor of the filter may be modified separately from the center frequency by using two resistors of equal value that are not sensitive to changes. The center frequency of the filter may be modified within a defined range without significantly reducing the depth of the notch. A greater Q factor results in a smaller stopband, but this comes at the cost of a reduced depth of notch at the desired center frequency. The equations governing the center frequency fo and Quality factor Q are [35]:
f o = 1 2 π R O C O
Q = R Q 2 R O
In the case of the 50 Hz grid, the (3) and (4) yield a center frequency and Quality factor of
f o = 1 2 π R O C O = 1 2 π     3     10 + 2     33 k Ω     33 n F = 1 2 π     96 k Ω     33 n F 50.2383 H z f o 50.24 H z Q = R Q 2 R O = 4.7 M Ω 2     3     10 + 2     33 k Ω = 4.7 M Ω 2     96 k Ω 24.4791 Q 24.48
respectively.
In contrast, we employ the 33 kΩ resistance parallel to RO6 and RO10 for the 60 Hz grid. Equations (3) and (4) yield a center frequency and Quality factor as follows:
f o = 1 2 π R O C O = 1 2 π     3     10 + 33 + 33     33 33 + 33   k Ω     33   n F = 1 2 π     79.5   k Ω     33   n F f o 60.665   H z 60.67   H z Q = R Q 2 R O = 4.7   M Ω 2     3     10 + 33 + 33     33 33 + 33 k Ω = 4.7   M Ω 2     79.5   k Ω 29.5597 Q 29.56
respectively. The proposed notch should theoretically achieve a notch depth of 50 dB at the center frequency calculated above.
In Figure 13, the EEG sub-circuit modeling the Fliedge notch filter at 50 Hz or 60 Hz is depicted.

3.9. EEG Sub-Circuit Modeling the Second Low-Pass Filter

This sub-circuit is a simple RC low-pass filter. The cut-off frequency is calculated using the equation:
f c = 1 2 π R f 31 C f 31
Utilizing (5) in our sub-circuit design, the 3 dB cut-off frequency can be calculated as follows:
f c = 1 2 π     330   k Ω     22   p F 48,228.77   H z = 48.22877   K H z
f c 48.23   K H z
This cut-off frequency is in accordance with our design requirements because the input raw EEG signals of interest have maximum frequency of 20 kHz. Indeed, the 20 kHz frequency resides well within the 0 dB gain part of the passband of our high-pass filter with an upper frequency of 48.2 kHz. The settling time to a steady state value from 0% to 99.99% is achieved after 30.39 ms with this design. Figure 14 depicts the EEG sub-circuit modeling the second low-pass filter.

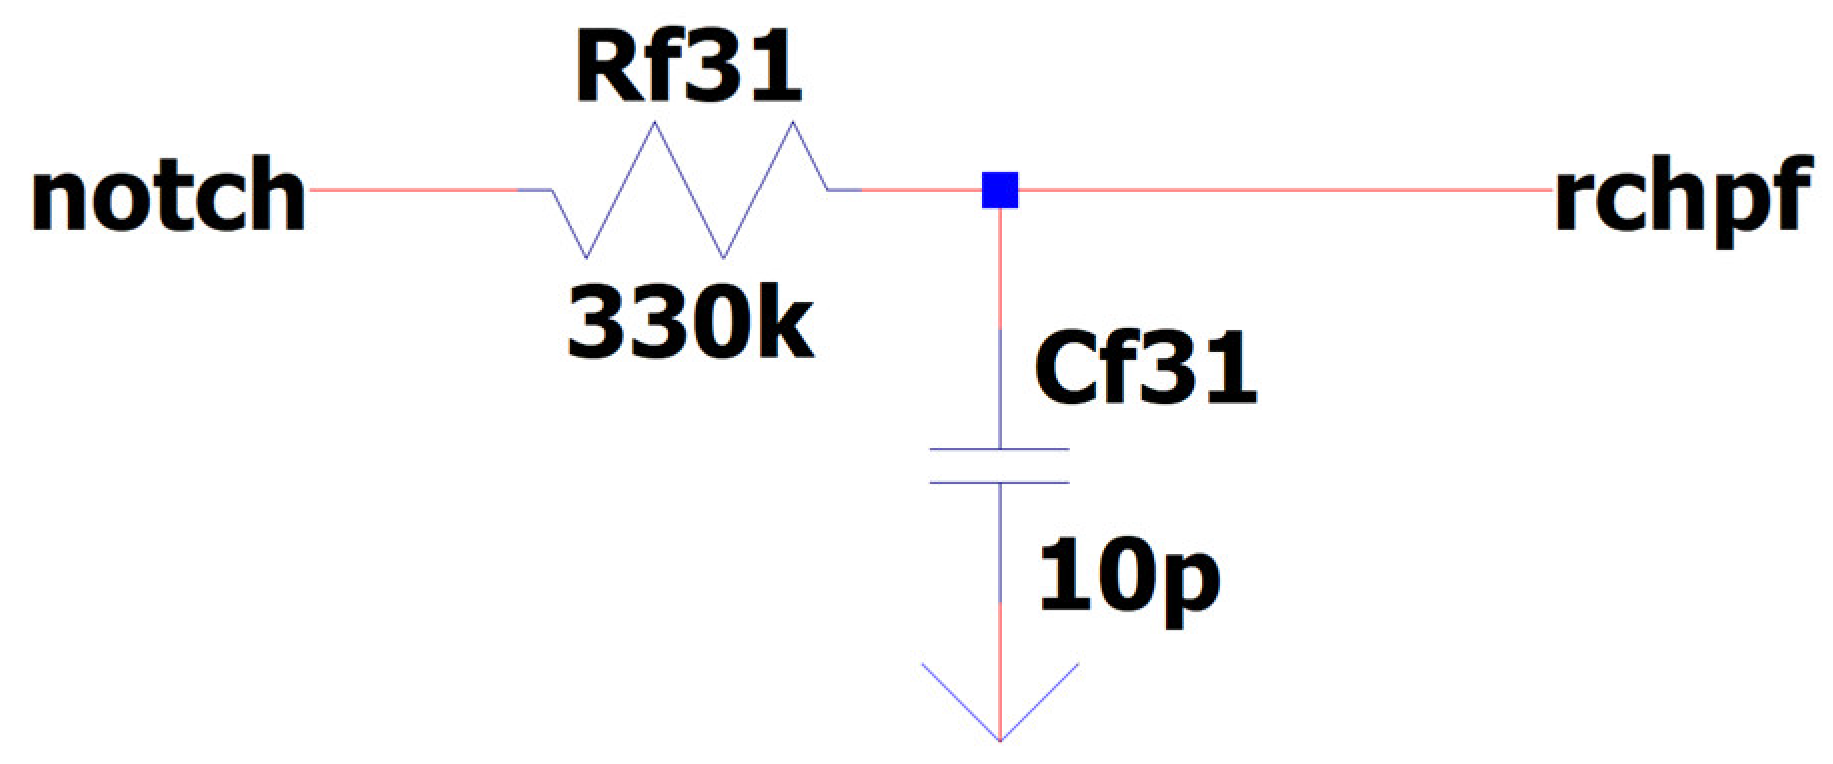
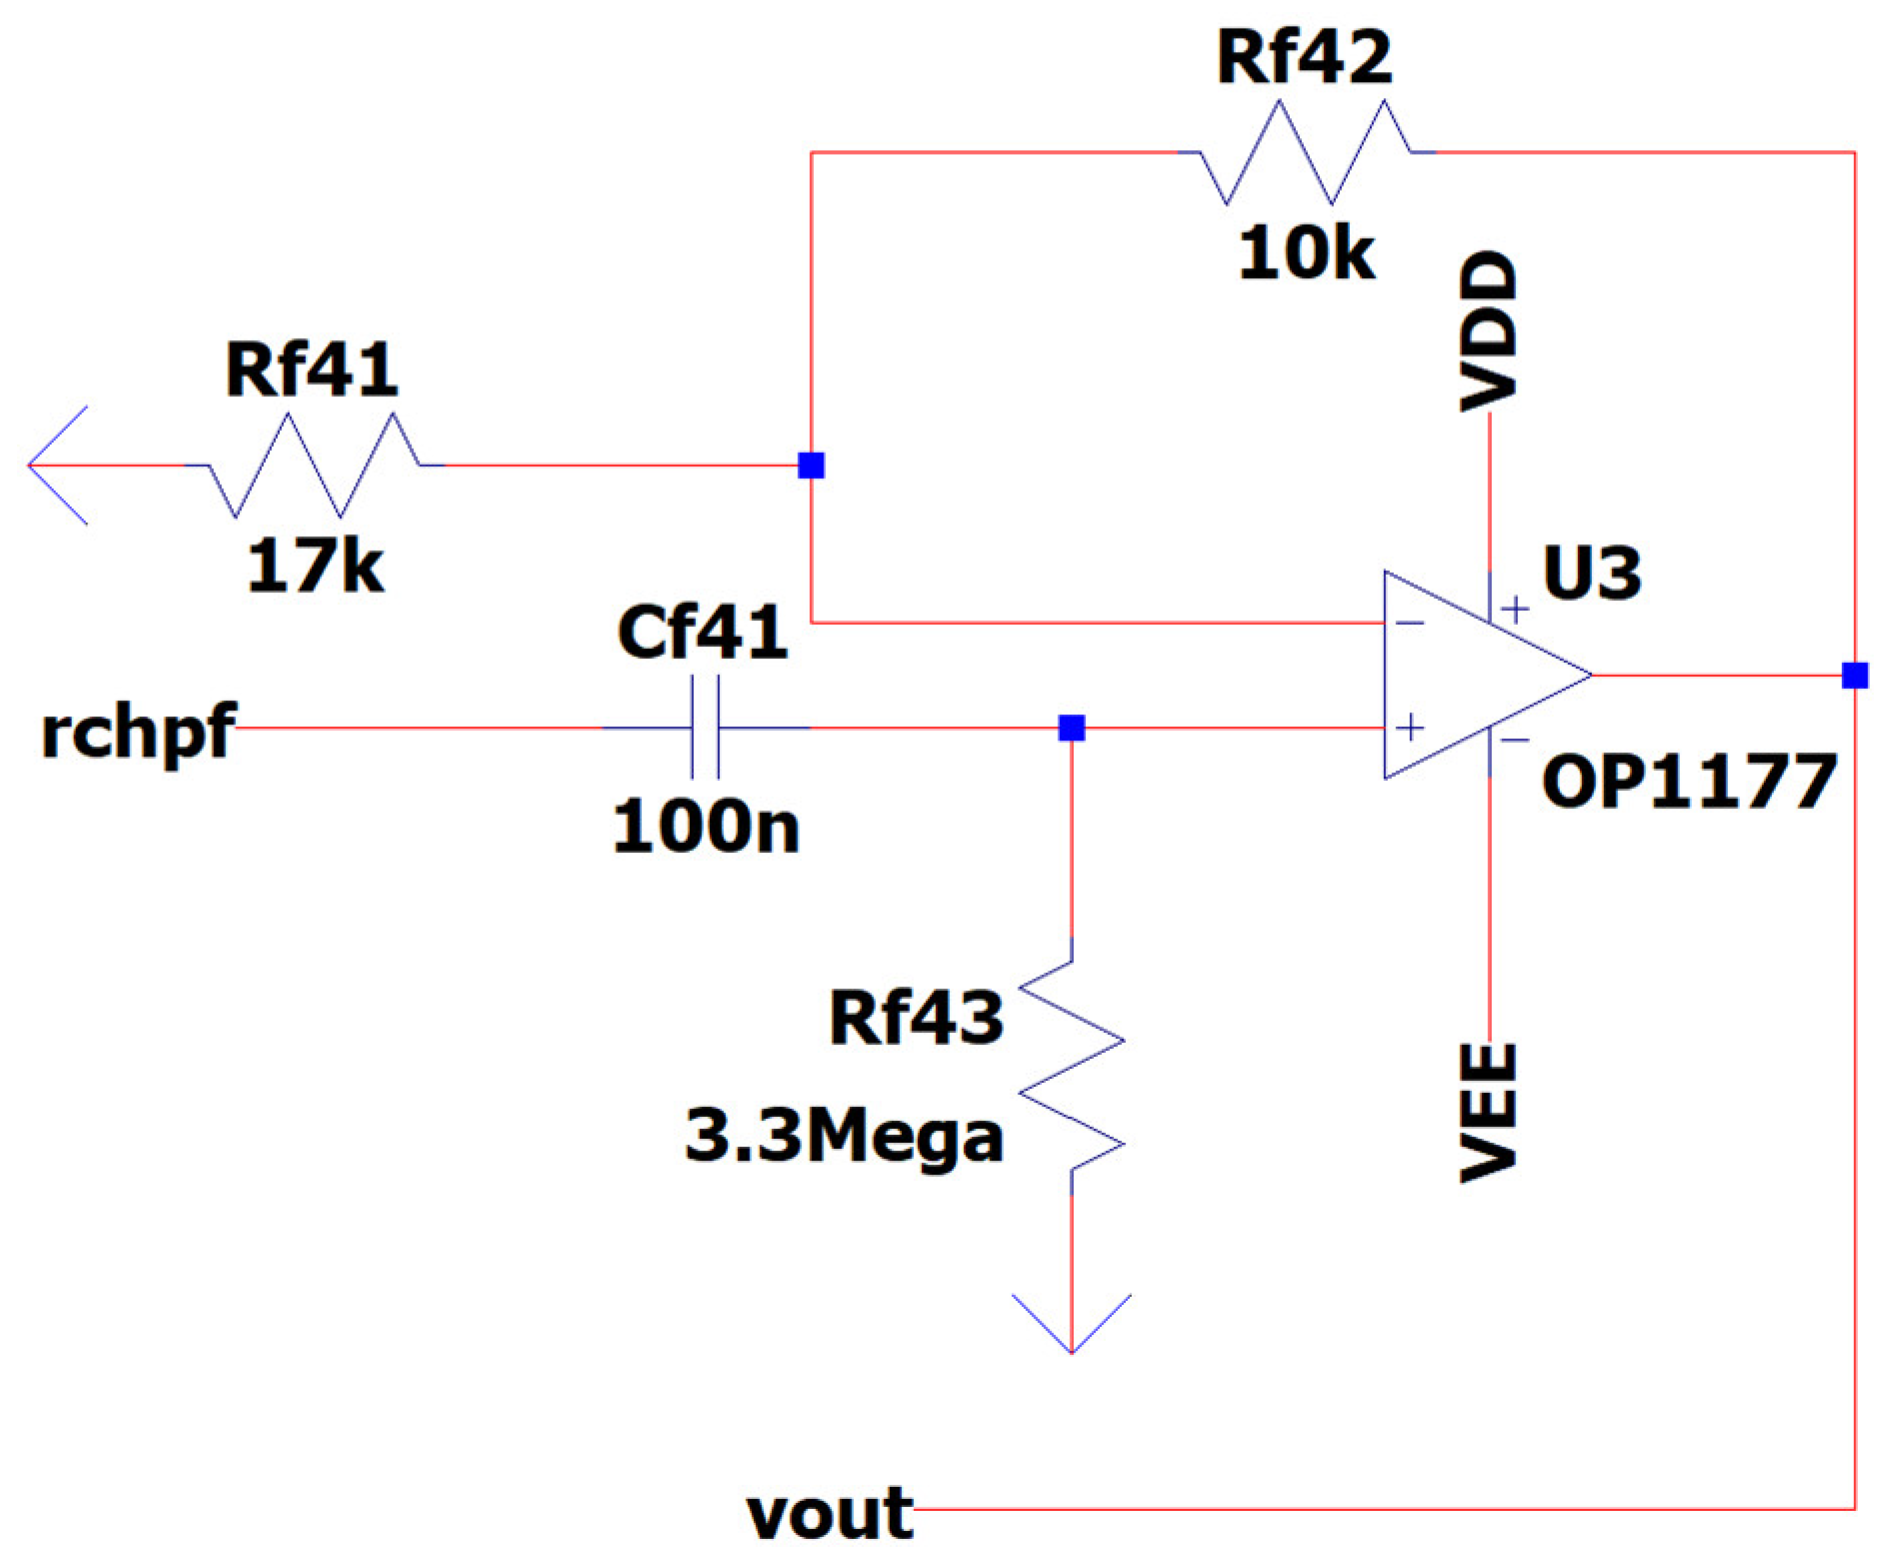
3.10. EEG Sub-Circuit Modeling the Second High-Pass Filter before the Analog to Digital Conversion

In this section, a Butterworth filter is implemented in order to exploit its characteristic of not allowing ripples in the passband while also helping us create a further gain of approximately 1.5 V/V in the wave bands of interest [57]. The two important parameters that characterize the Butterworth filter are AF gain and fl cut-off −3 dB frequency:
A F = 1 + R f 42 R f 41
f l = 1 2 π R f 43 C f 41
Utilizing (6) to our sub-circuit design, the AF gain can be calculated as follows:
A F = 1 + R f 42 R f 41 1.588
Utilizing (7) to our sub-circuit design, the 3 dB cut-off frequency fl can be calculated as follows:
f l = 1 2 π     3.3   M Ω     100   n F 482.287   μ H z
Thus, in the proposed circuit, the values are as follows:
A F 1.59   a n d   f l 0.48   H z
If “f” is the frequency of the input signal the magnitude of the voltage gain is as follows:
V o u t V r c h p f = A F     f f l 1 + f f l 2 = 3.2926     f 1 + f 0.482287 2 3.29     f 1 + f 0.48 2
In Figure 15 is depicted the EEG sub-circuit modeling the second high-pass filter before the Analog to Digital Conversion.

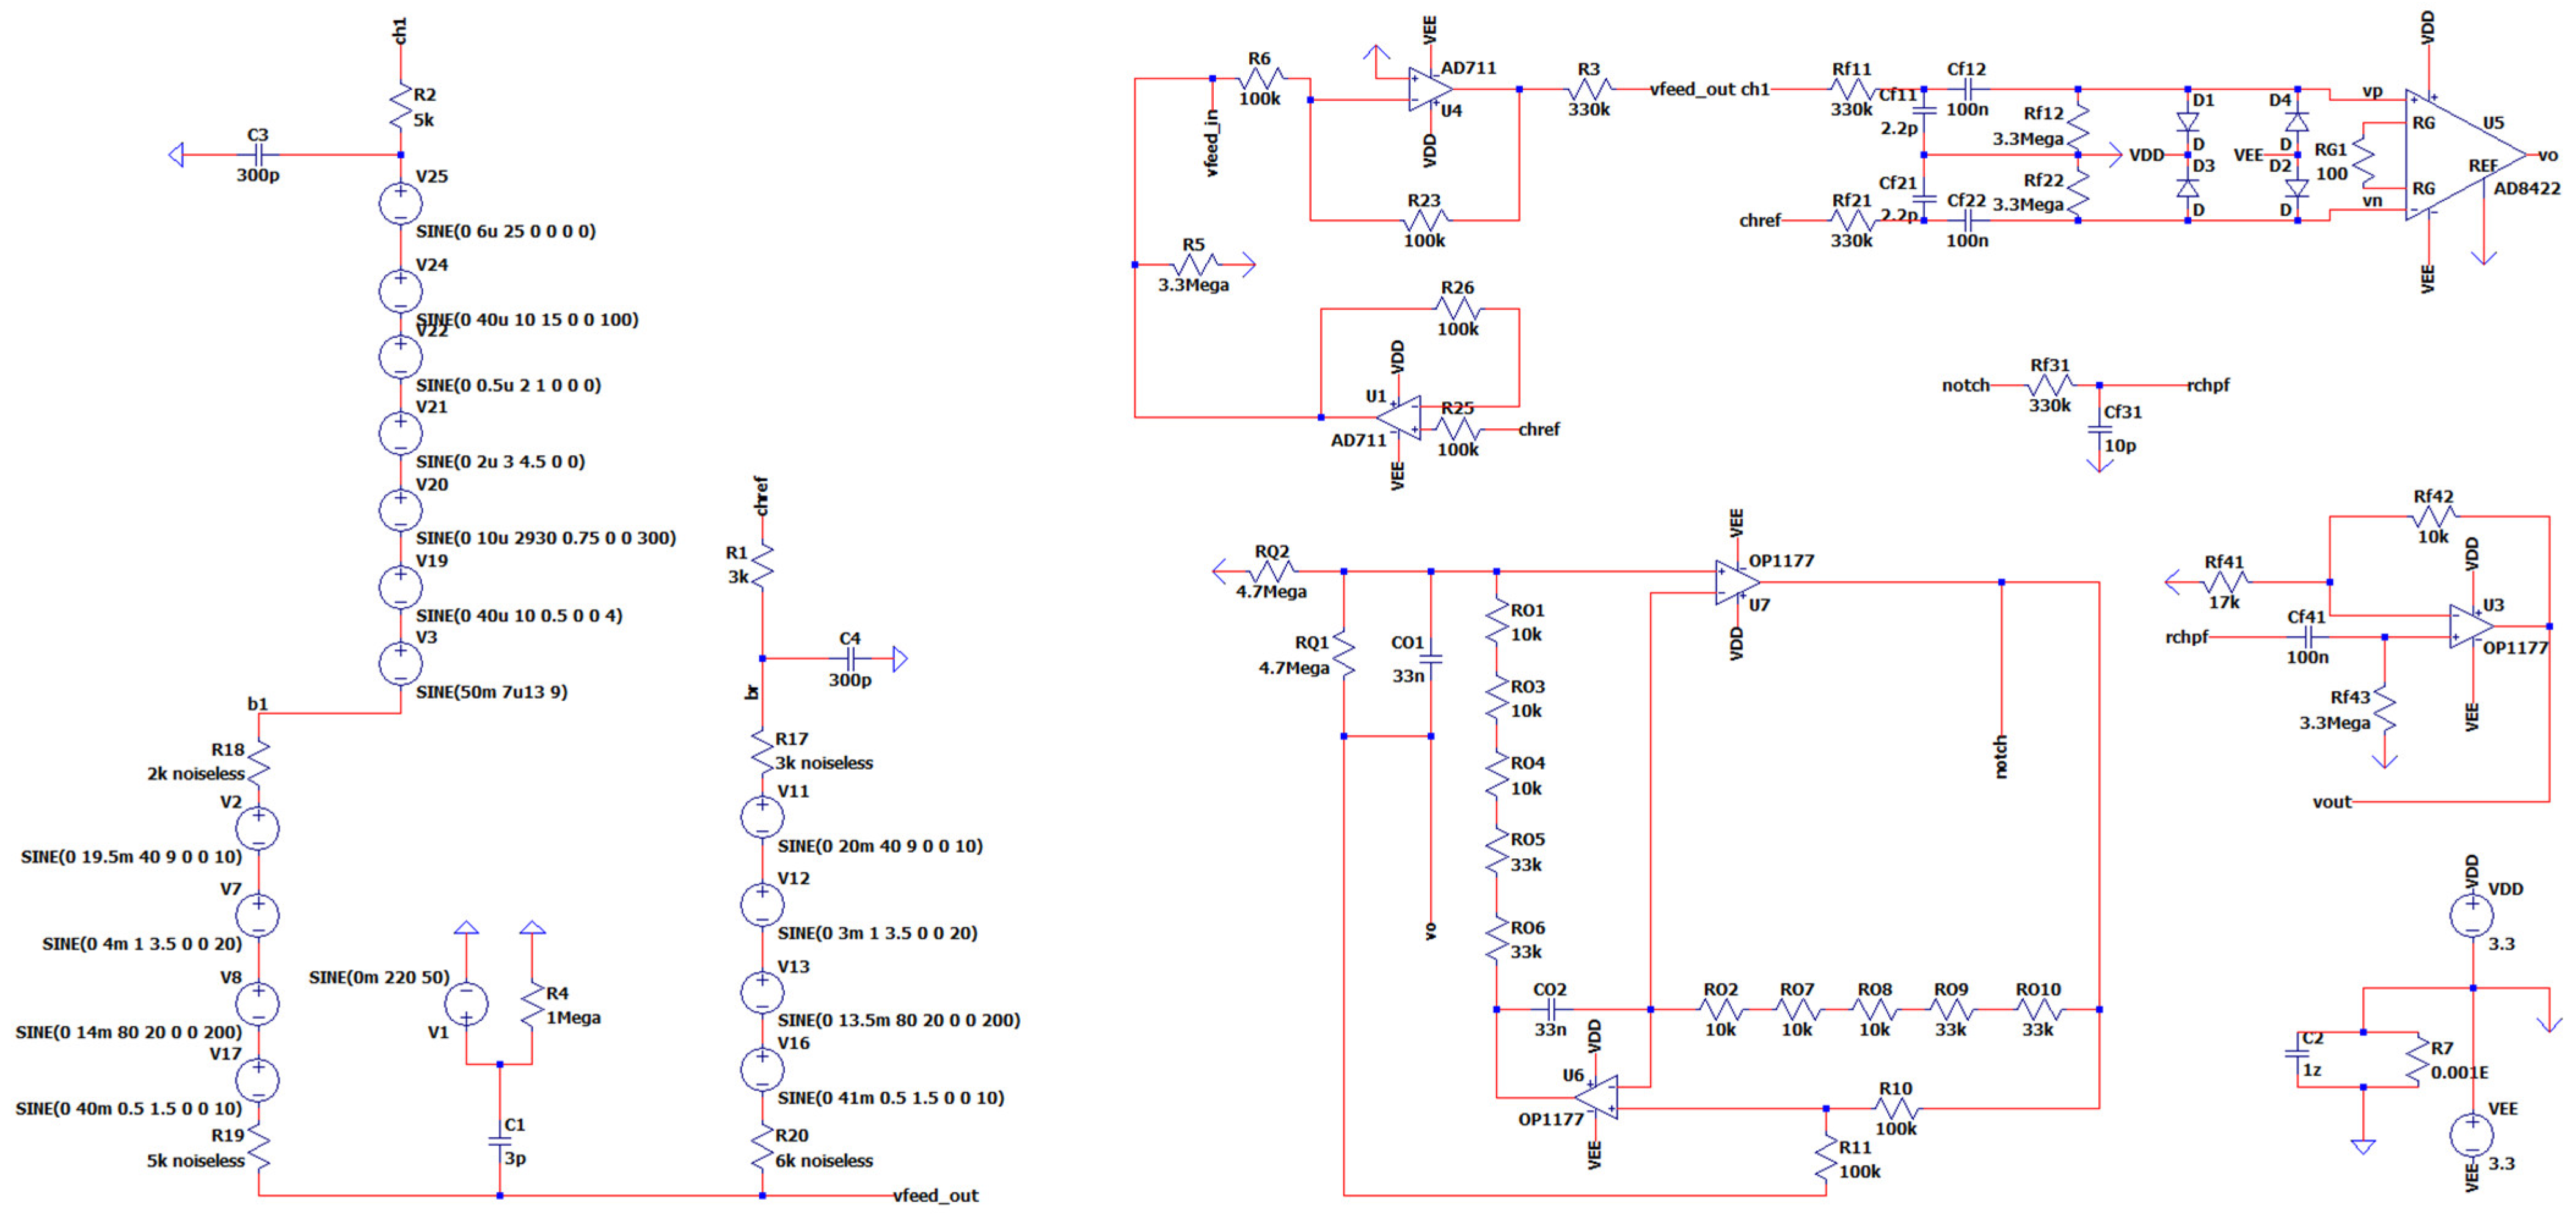
3.11. The Overall Novel EEG-B3V3S7C1 Circuit Design

The overall EEG circuit design has a bandwidth of approximately 0.5 Hz to 10 kHz, an overall gain of 300 V/V in the passband and a theoretical CMRR of 110 dB. The noise of our design before the first amplification will be estimated as the total Vpp noise in the equivalent noise bandwidth range of 0.1 Hz to 10 Hz with a value of ent ≈ 779.32 nV. This is given by the following equation:
e n t = e n     E N B W
e n = 4     k B     T     R 0.13     R
where
  • kB is the Boltzmann’s constant,
  • T is absolute temperature in Kelvin in our case at room temperature (usually 25 °C), and
  • R is the real part of the band-pass filter’s impedance.
From (8) and (9), we calculate the following:
E N B W = 10 0.1 = 9.9   H z e n 1 0.13     3,300,000 236.156   n V / H z e n 2 0.13     330,000 74.679   n V / H z e n t 1 = e n 1     E N B W 236.156     9.9 743.049   n V e n t 2 = e n 2     E N B W 74.679     9.9 234.972   n V e n t = e n t 1 2 + e n t 2 2 779.316   n V 779.32   n V .
The design of this EEG circuit did not include an anti-aliasing filter due to its focus on the analog front-end (AFE) and neglect of the digitization process. An anti-aliasing filter reduces frequencies above the half of the sampling frequency to zero. The design of an anti-aliasing filter must consider the sampling frequency of the ADC, and the low-pass filter of the proposed circuit can be used as an anti-aliasing filter, but only in the special case where the ADC’s sampling frequency is double or greater than the cut-off frequency.
Figure 16 presents a high-level visualization of the topology of the overall EEG circuit design named EEG-B3V3S7C1 (inspired by the characteristic batteries of 3.3 V, 7 sub-circuits and 1 channel).

4. Simulation and Results: Comprehensive Analysis

The initial goal of the simulation is to quantify the difference between theoretical value predictions for the different sub-circuits and real-world simulated implementation values of the proposed novel EEG-B3V3S7C1 circuit design. In particular, this simulation of the circuit’s electronic behavior can assess the design’s efficiency because it provides accurate voltage and current waveform representations, verifying that the authors’ pre-defined requirements for the circuit are met at a satisfactory percentage. Moreover, another goal is to visualize the human body and environment model signal generator’s output, assessing how realistic it is and its alignment with laboratory experiment results. Furthermore, emphasis is given to examining the EEG output in the following ways:
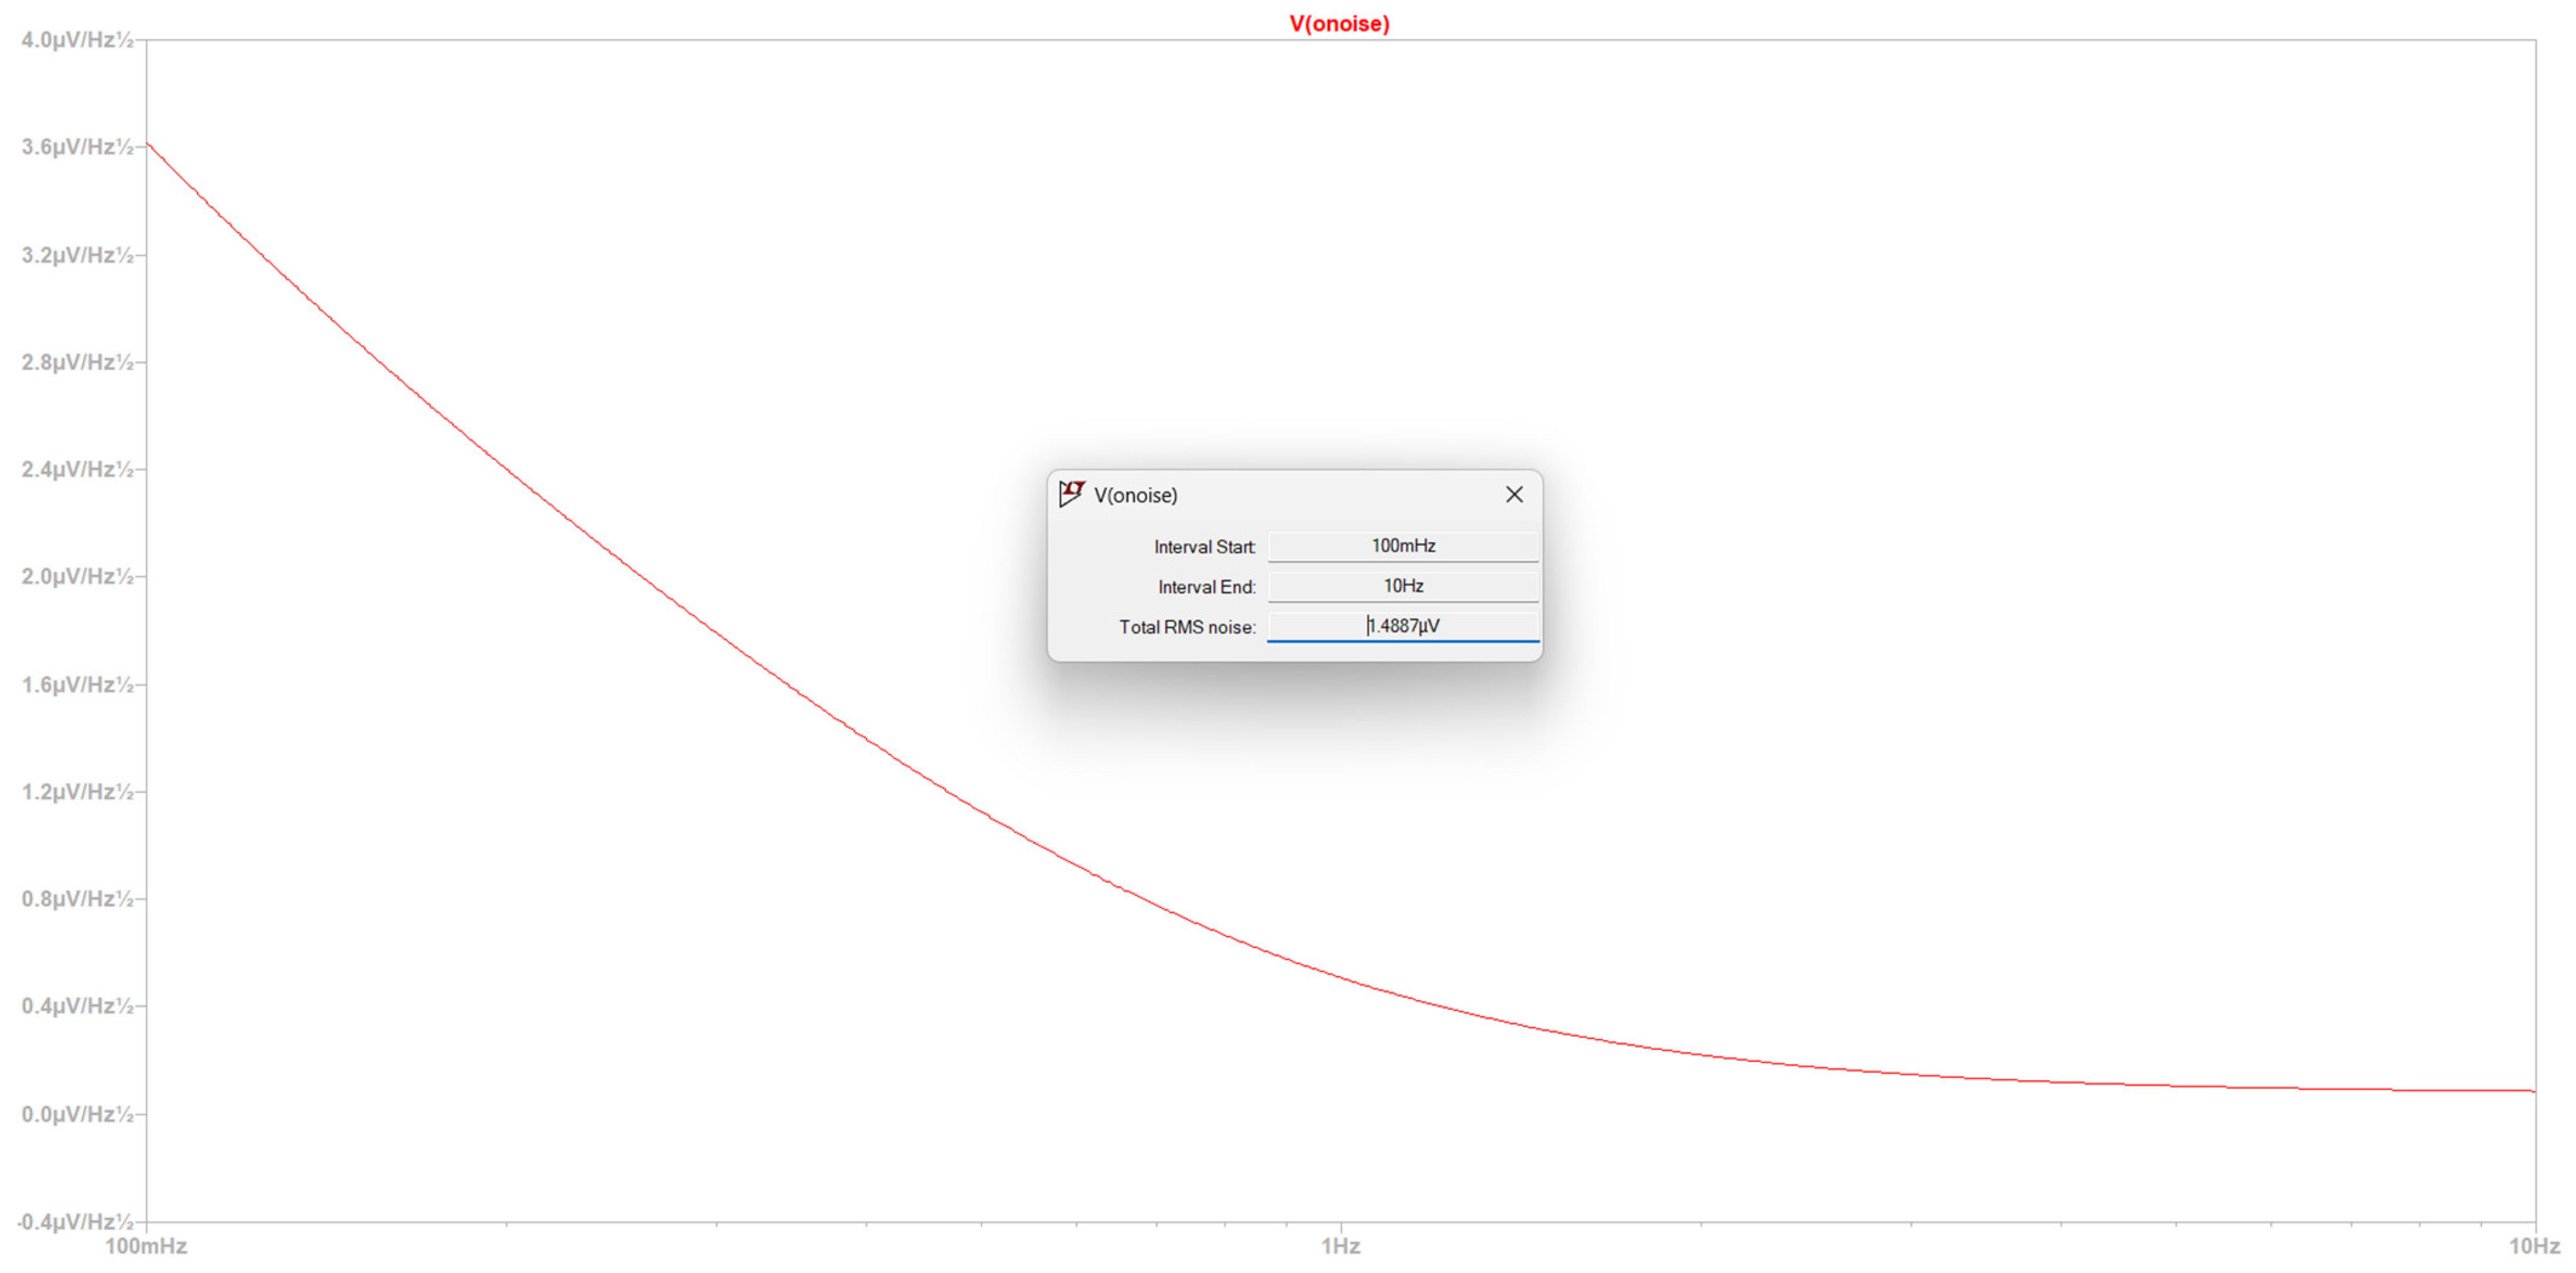
  • Time domain to make a qualitative comment with regard to CMRR, power consumption, gain, and noise level before the first amplification.
  • Fourier frequency spectrum to validate if the information in the alpha, beta and theta wave bands is preserved.
  • Fourier frequency spectrum and time domain to validate that the compound muscle movement artifacts are sufficiently suppressed.
The simulation is carried out both in a 50 Hz and 60 Hz power grid environment, because these frequencies cover the most common EEG signal measurement cases that are not performed in a shielded environment of electromagnetic interference from the power grid [58]. Subsequently, a comprehensive comparison is conducted between the proposed novel EEG-B3V3S7C1 circuit design’s simulated results and those of the Case “1” [47], Case “2” [48] and Case “3” [49] that were presented previously in this work.
This section is divided into two segments: (A) the simulation of the circuit in the time and Fourier analysis frequency domain, and (B) the comparison of the proposed circuit (EEG-B3V3S7C1) with the Case “1” [47], Case “2” [48] and Case “3” [49].

4.1. Simulation of Novel EEG-B3V3S7C1 Circuit Design

As it is known by the circuit design section, our circuit includes the reference electrode for calculating the voltage reference of the collected raw EEG signal as well as the channel 1 electrode for collecting the raw EEG signal. According to their functionality, the first is placed behind the ear, and the other is placed on the Fp1 position (10–20 positioning system) [25]. The main purpose of this test is to simulate the characteristics of the circuit that were deemed important when deciding the requirements of the circuit presented in this study, namely CMRR, bandwidth in the 0.5 Hz to 3 kHz region, and, in particular, in the 4 Hz to 30 Hz alpha, beta and theta wavebands range. Another crucial element that must be examined in this simulation is the notch depth of the notch filter when it is functioning at approximately either 50 Hz or 60 Hz frequencies. Finally, a visual representation of both time and frequency responses will be presented further down to showcase the effectiveness of the circuit. In particular, it examines the circuit’s ability to denoise the artifacts of the raw EEG signal acquisition process in the presence of strong compound muscle movements while preserving the signal integrity of the alpha, beta and theta wavebands.

4.1.1. Simulation in a 50 Hz Electrical Grid Environment

In this part, the simulation in a 50 Hz environment was performed. The CMRR of the circuit was assessed by short-circuiting the two input channels with a voltage source of 0 V DC offset and 1 V AC amplitude across all frequencies. This method of quantifying CMRR was chosen, in order for the measurement to be independent of the differential gain. Otherwise, due to the limitations of the simulation software (Analog Devices’s LTspice version XVII x64), when taking into account the differential gain, it yields an unrealistic result. More precisely, the simulation would have given a CMRR higher than the one of the chosen instrumentation amplifier, when in reality, an equal or worse CMRR is expected. The differential gain was defined as the division of the output of the overall circuit with the differential input at the point where the electrodes contact the circuit. While performing AC analysis, the CMRR yielded a frequency response function dependent on the frequency variable. In the band of interest of alpha, beta and theta waves, CMRR was approximately 97 dB. In frequencies greater than 110.5 Hz, CMRR dropped below 90 dB and at 3 kHz reached 66 dB. Meanwhile, in the area below 1 Hz, CMRR reached levels up to 163 dB at 10 mHz. The simulated notch depth was measured at 48.5 dB, which is a really satisfactory result based on [56], which defines realistic expectations for maximum realizable notch depth between 40 dB and 50 dB. The above statements for CMRR and Notch depth can be assessed visually in Figure 17, in which Differential Gain (Blue) and CMRR (Red) are depicted. Figure 17 also presents an example of how the measurements were performed with the use of cursors (dashed measurement lines). In particular, a measurement with Cursor 2 at the frequency of 17 Hz inside the wavebands of interest and a measurement with Cursor 1 at 110.5 Hz as the point of transition below 90 dB can be seen in the measurement windows contained in Figure 17. This measurement methodology, with the use of cursors, was utilized in all the quantitative assessments that were not performed graphically/indirectly. Apart from the above evaluations, noise analysis was performed on the circuit. The result of 1.4887 µVpp noise in 0.1 Hz to 10 Hz before amplification was identified in a 50 Hz environment, as it can be seen in Figure 18, along with the used measurement cursor methodology. The total power consumption was measured at approximately 20.5 mWatt, measured with similar methods as the ones described above and presented in Figure 17 and Figure 18. More precisely, power consumption was calculated as the integral of the active power consumption integrated upon the time duration of the particular experiment performed in each case (50 Hz and 60 Hz grid).
The simulation at 50 Hz produces results in the time domain by performing a transient analysis (see Figure 19 and Figure 20).
Consequently, with the use of FFT algorithm, the Fourier transform results in the Fourier plane are also generated (see Figure 21, Figure 22, Figure 23, Figure 24 and Figure 25).
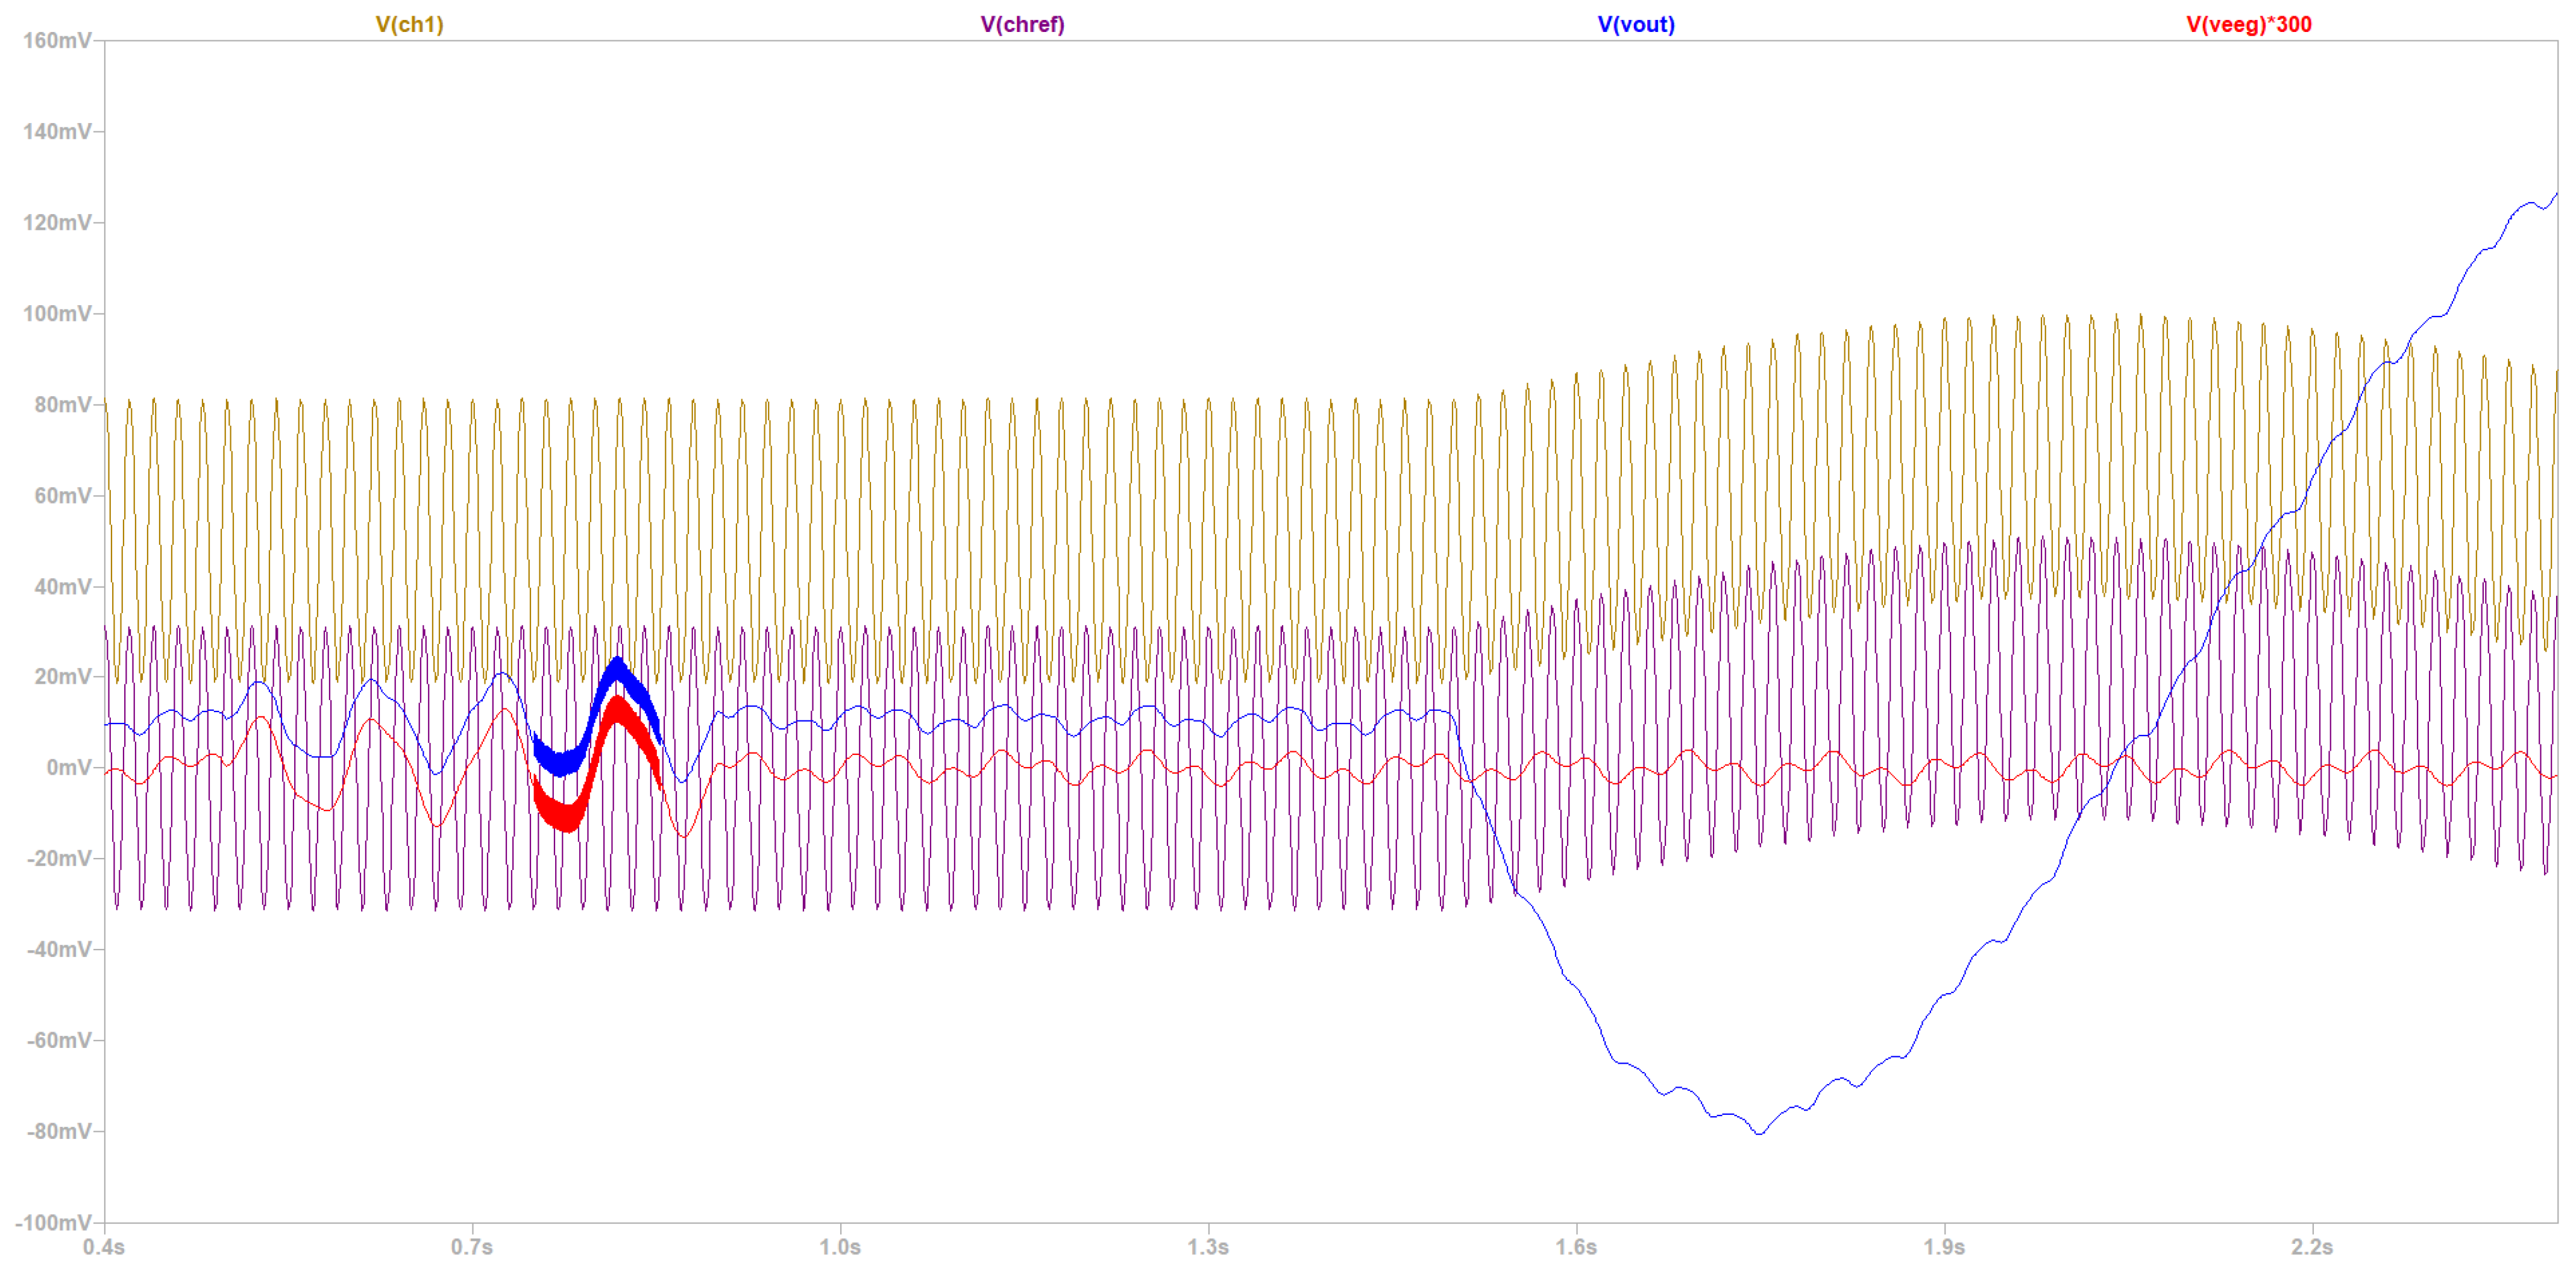
  • Simulation in a 50 Hz Electrical Grid Environment in the Time Domain
Initially, the simulation (at 50 Hz) focused on demonstrating that our design was able to generate realistic electrode signals, similar to the ones measured in the laboratory experiments during the performance of compound muscle movements. As depicted in Figure 19, the raw EEG reference channel signal (Vchref—purple) waveform is the voltage measured at the reference electrode. The raw EEG channel 1 signal (Vch1—gold) waveform is the voltage measured at the channel 1 electrode. The ground truth EEG signal (Veeg—red) waveform is depicted, showing the EEG raw signal contained in channel 1, magnified 300 times for an indirect quantitative measurement of the overall gain of the circuit. The output of the EEG circuit (Vout—blue) waveform is depicted as the output of the EEG-B3V3S7C1 circuit design.
By observing Figure 19, it can be assessed that the output of the EEG circuit (Vout—blue) clearly resembles the ground truth EEG signal (Veeg—red), apart from a 14.5 mV DC offset (indirect quantitative measurement of DC offset) and muscle noise artifacts. The muscle artifacts remaining in the output of the EEG circuit (Vout—blue) produce low frequency sine-like waves like the one shown in Figure 19, which nonetheless still carry all the important information of the ground truth EEG signal (Veeg—red) (it resembles the phenomenon of signal modulation). Indeed, the strong muscle compound movement artifacts are severely suppressed and do not influence the measurement capability of the proposed EEG-B3V3S7C1 circuit, as it will become clear in the following subsection, where it becomes apparent that the remaining noise artifacts do not forbid the detection of alpha and beta wave peaks in the Fourier plane. By looking closer at Figure 20, several facts about the morphology of the EEG signal can be observed. The ground truth EEG signal (Veeg—red) represents the component of the brain signal that is collected by the electrodes of the EEG circuit. In order to visualize it in the image, the raw ground truth EEG signal (Veeg—red) is magnified 300 times, in order to be of the same order of magnitude as the actual raw EEG channel 1 signal (Vch1—gold) that is collected by the electrodes, offering an indirect quantitative measurement of gain derived for the figure. It contains the slower but bigger in amplitude alpha wave component from approximately 0.3 s to 0.8 s, as well as some faster lower amplitude beta and gamma wave components. Noteworthy is the segment in the region of around 0.8 s, where a higher frequency ERP phenomenon of around 3 kHz is depicted.
The raw EEG reference channel signal (Vch1—gold) is the one from the electrode that carries the brain red signal, while the raw EEG reference channel signal (Vchref—purple) is the one from the reference electrode. The morphology of those waveforms validates the proper functionality of the proposed signal generator circuitry, because it accurately depicts EMI noise and muscle artifacts that have contaminated the raw EEG brain signal. More precisely, EMI is the higher frequency component of the purple and gold waveforms at around 60 mVpp and the slower but rather higher amplitude component of the waveforms that carries on top of it. The EMI noise is the one that relates to muscle movement artifacts (i.e., EMG, EKG, EOG) that the electrodes collect.
The output of the EEG circuit (Vout—blue) is the output of the overall EEG circuit. It takes the raw EEG reference channel signal (Vch1—gold) and magnifies it by 300 V/V, as was theoretically expected, validating with a graphical quantitative measurement the accuracy of the design. Moreover, it achieves an extreme reduction in both the EMI noise and the muscle artifacts. Making a quantitative assessment of the noise suppression, instead of being magnified 300 times, the EMI is hardly inspectable in the output signal (Vout—blue), and the muscle artifacts are magnified approximately only 2 times. This ensures that this novel design successfully suppresses EMI and muscle noise artifacts, ensuring satisfactory EEG signal acquisition.
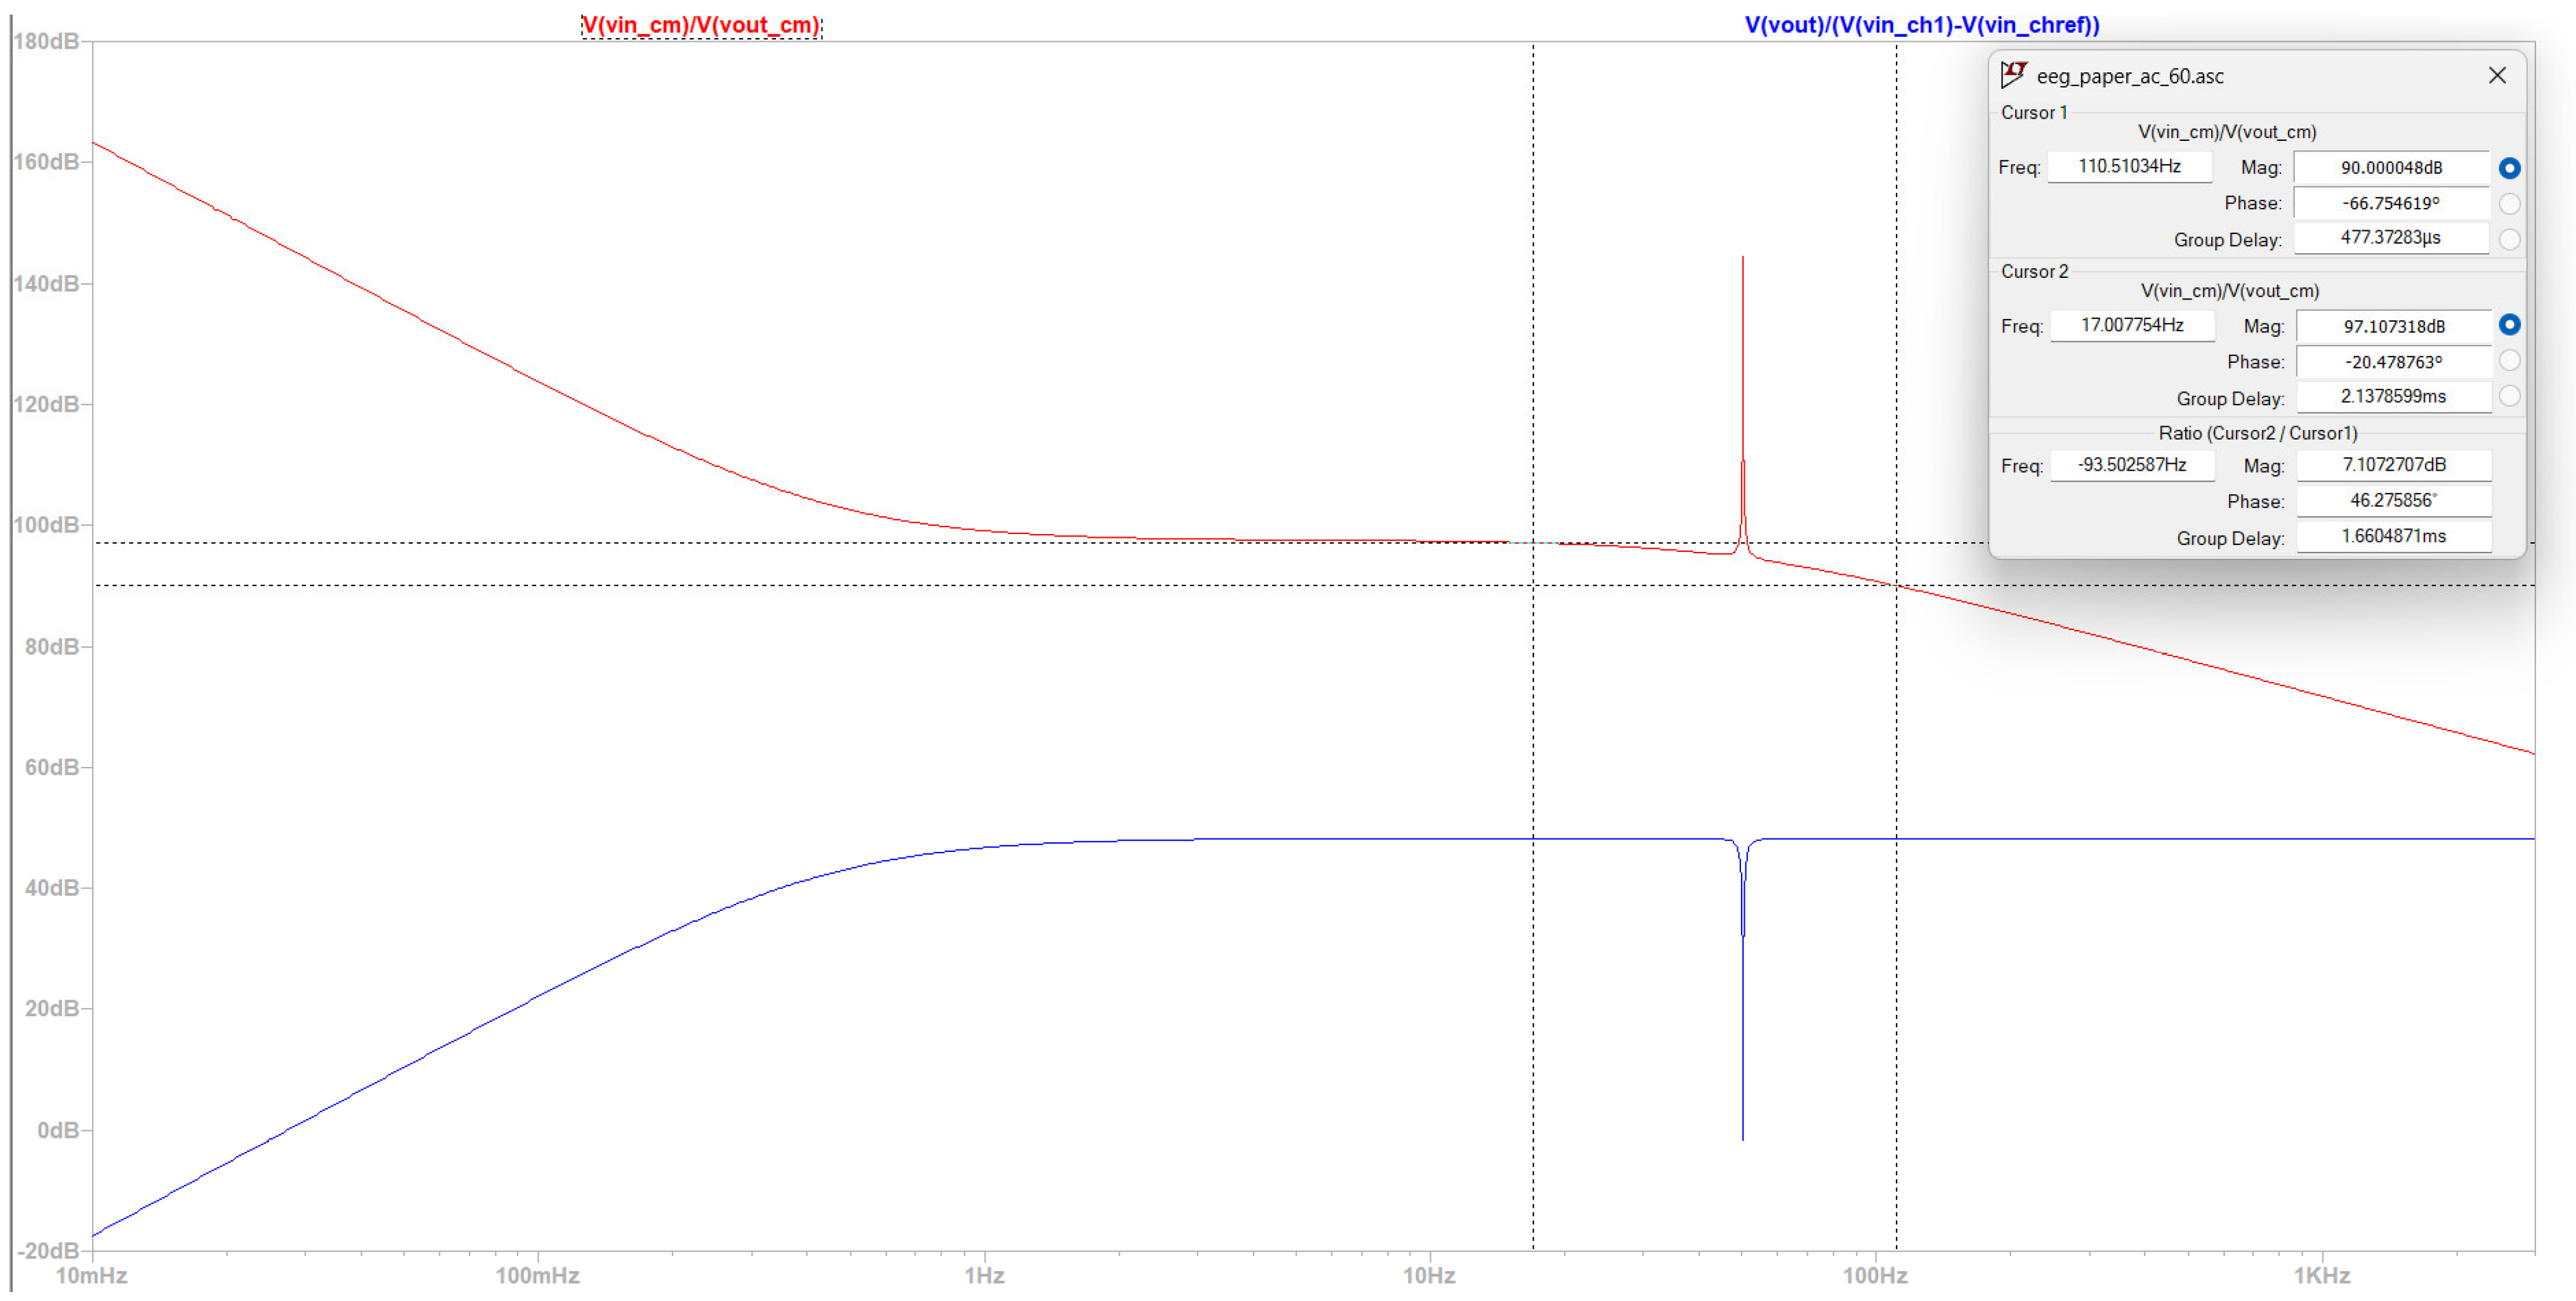
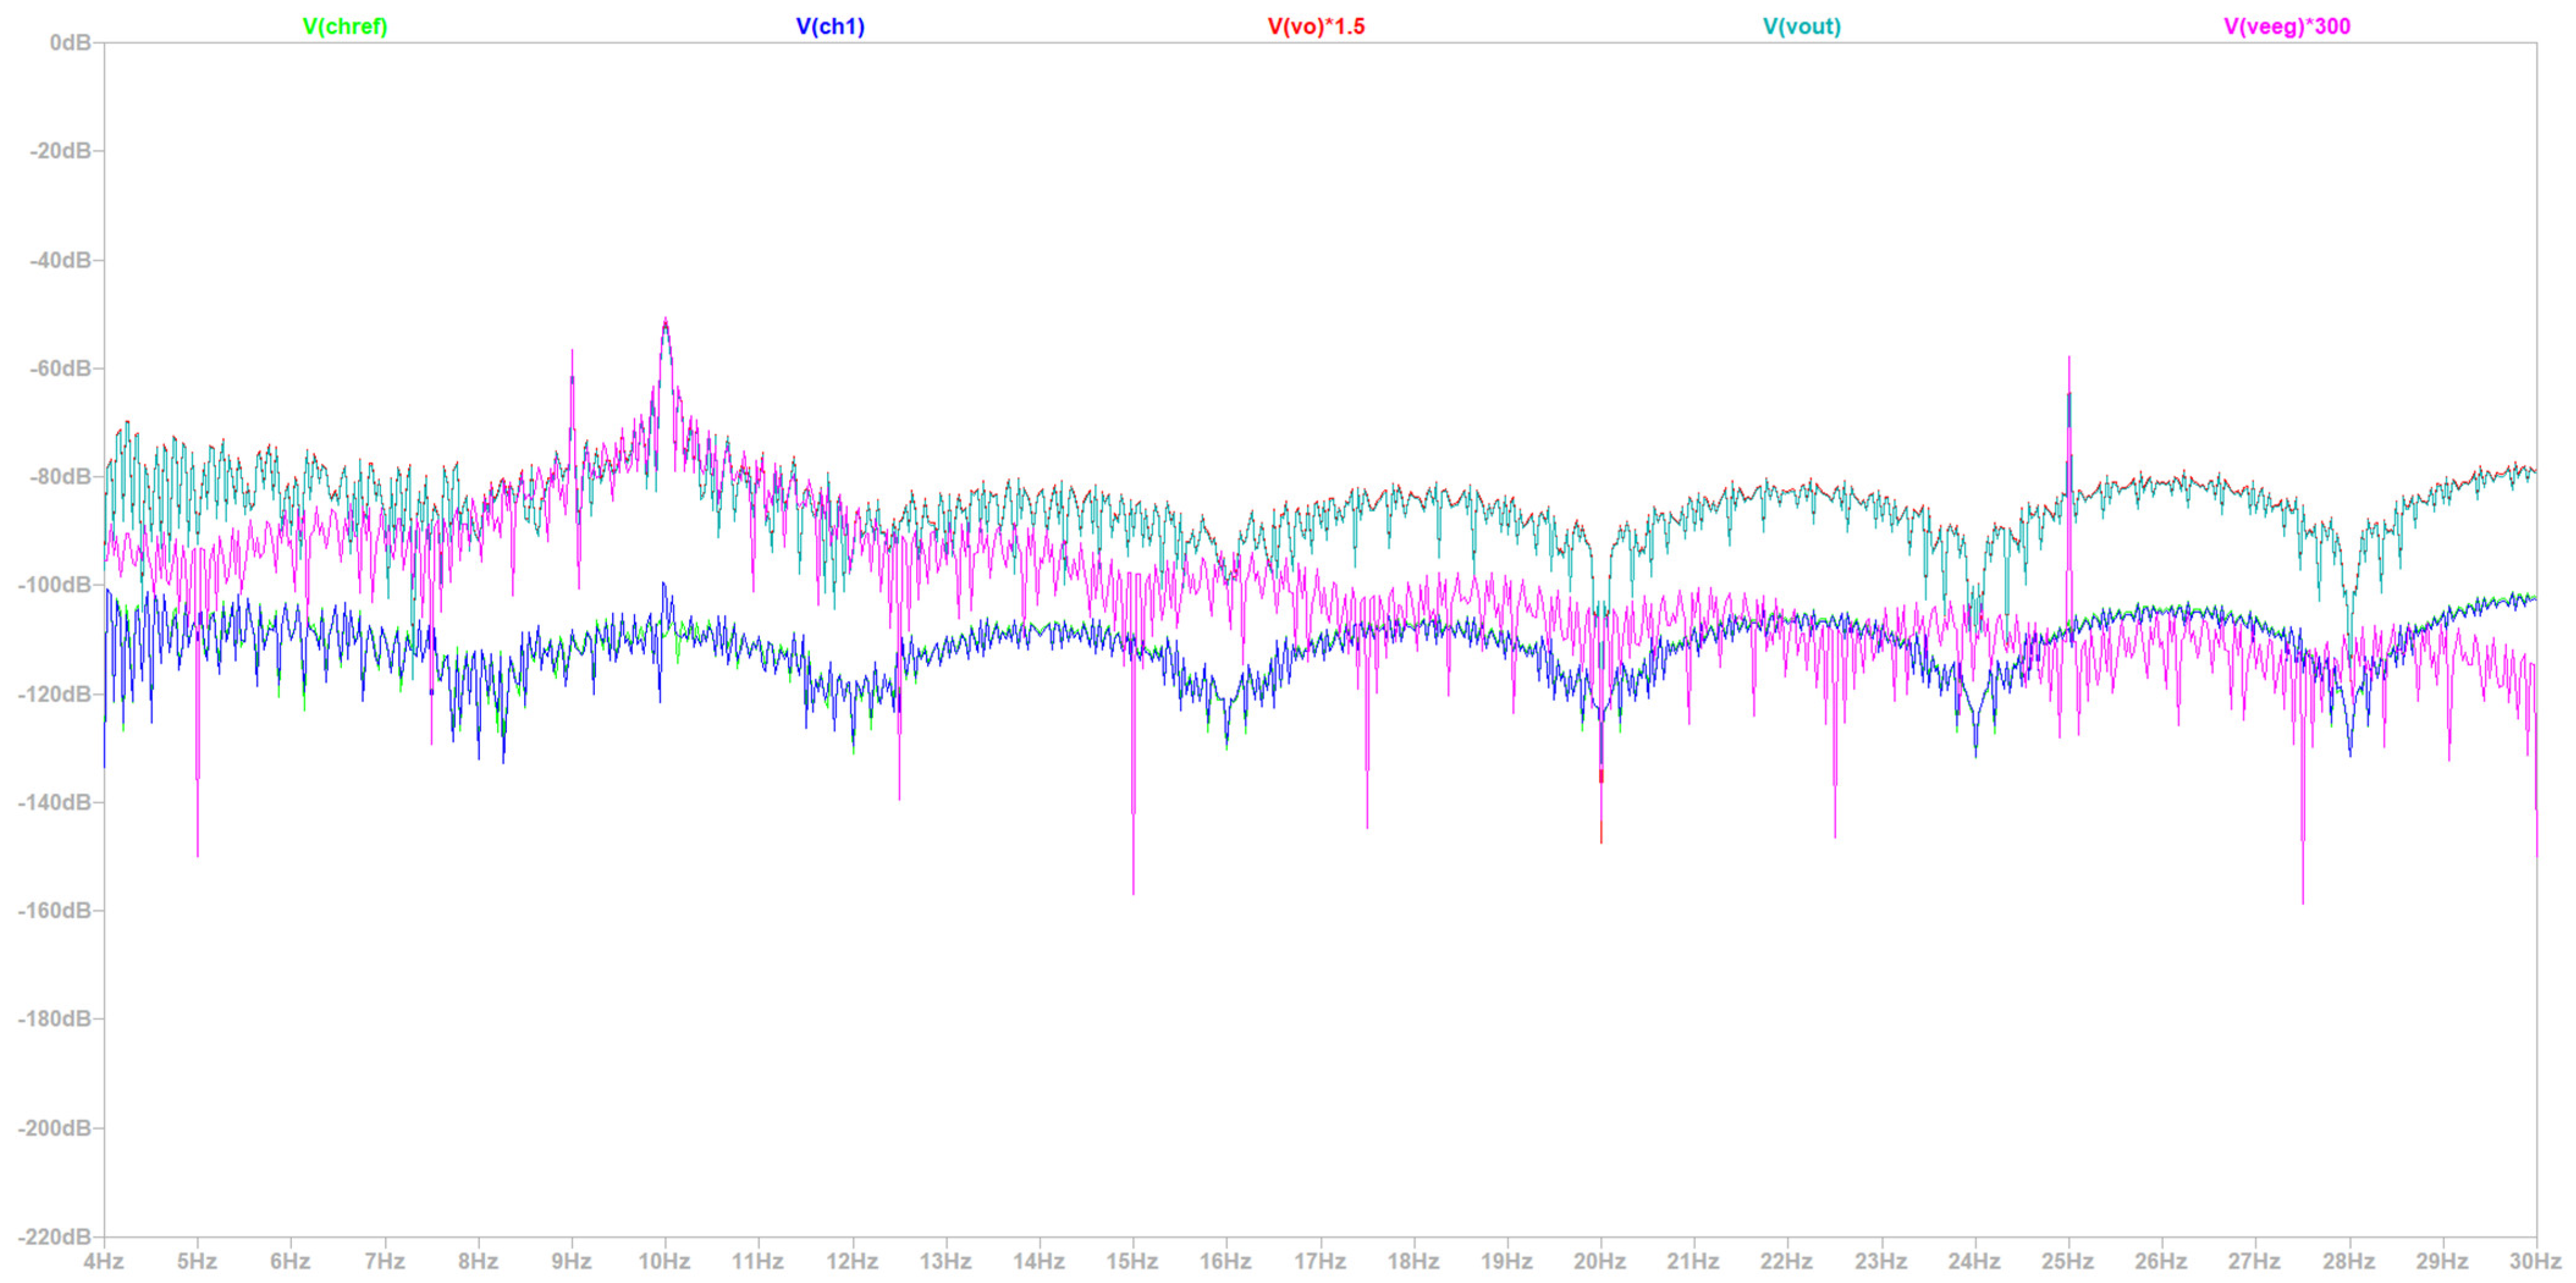
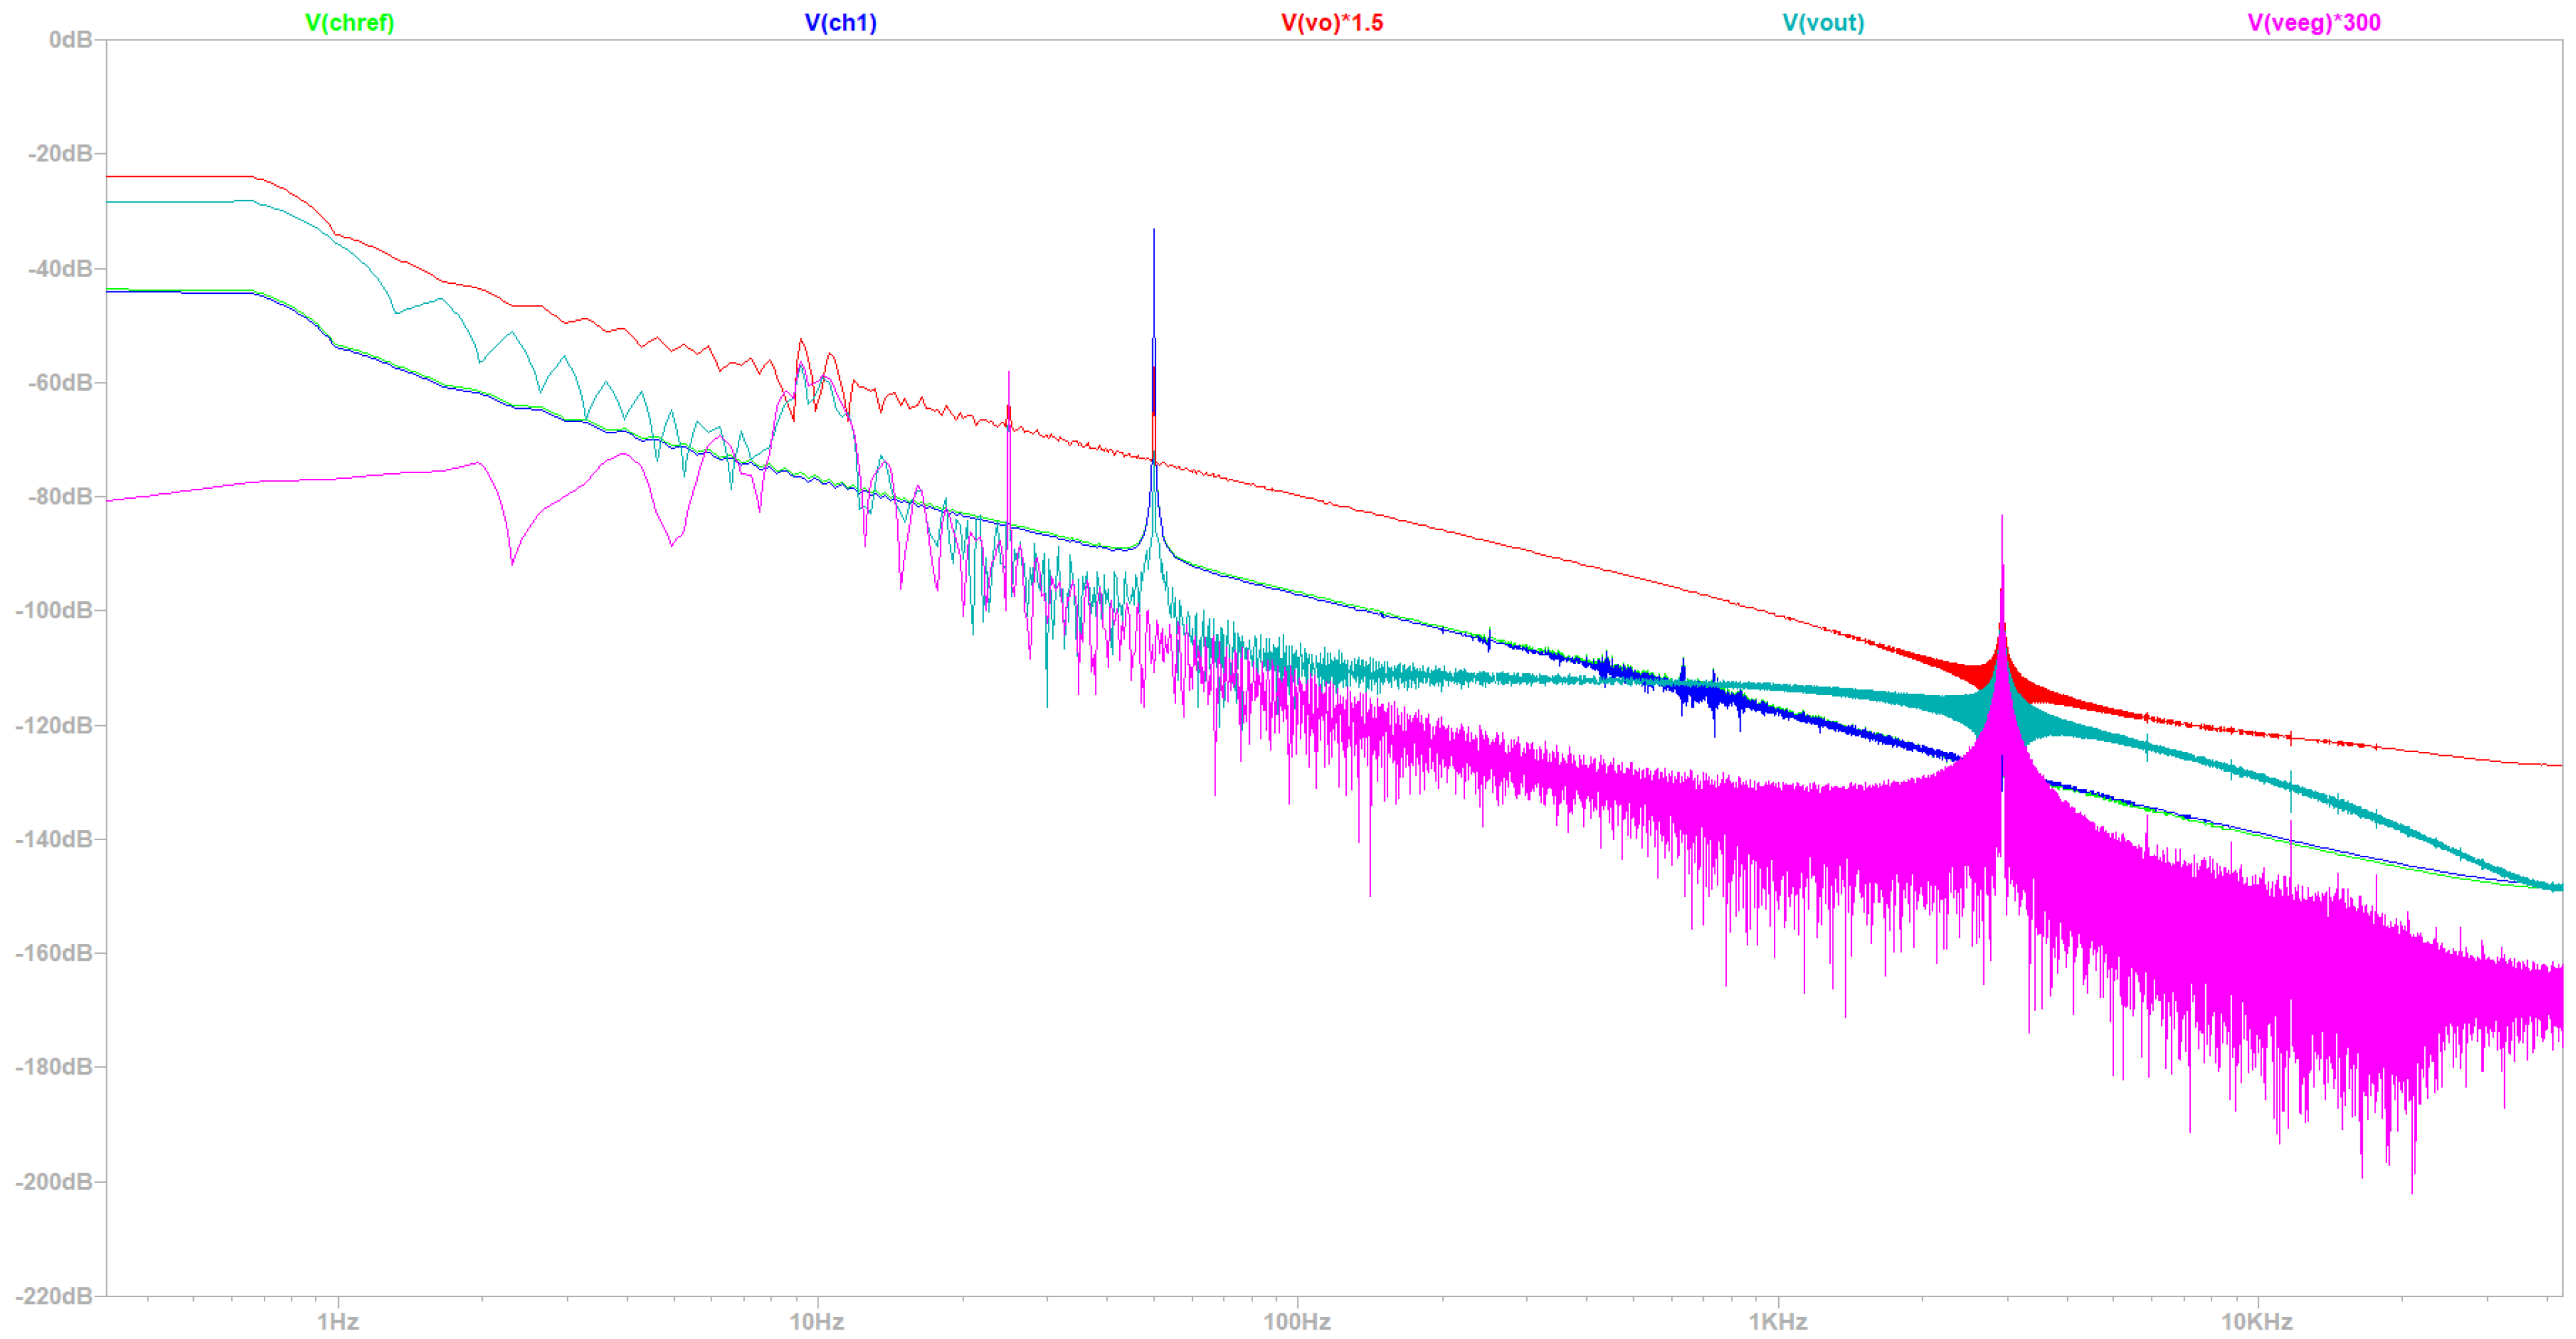
  • Simulation at 50 Hz Electrical Grid Environment at the Fourier’s Spectrum
Subsequently, FFT was performed in the time domain produced by the transient analysis of the simulation (at 50 Hz) to generate the waveforms in the Fourier plane (in a range from 4 Hz to 30 Hz). The frequency response of waveforms in the Fourier plane gives valuable insights into the simulated functionality and performance of the circuit. As depicted in Figure 21, the raw EEG reference channel signal (Vchref—green) waveform is the voltage measured at the reference electrode. The raw EEG channel 1 signal (Vch1—blue) waveform is the voltage measured at the channel 1 electrode. The ground truth EEG signal (Veeg—pink) waveform depicts the EEG ground truth signal contained in channel 1. The output of the EEG circuit (Vout—cyan) waveform is the output of the EEG-B3V3S7C1 circuit design. Lastly, the output of the instrumentation amplifier (Vvo—red) waveform is the voltage at the output of the instrumentation amplifier. This waveform is the Fourier plane of the experiment when the Fourier transform is performed from 0 s to 3 s, and the plane is limited from 4 Hz to 30 Hz in a linear x-axis scale, in order to more closely inspect the integrity of the signal in the wavebands of interest, namely alpha, beta and theta.
First and foremost, by observing Figure 21, it can be clearly assessed that the ground truth EEG signal integrity is preserved. This is apparent because in the picture, the original raw ground truth EEG signal (Veeg—pink) is magnified 300 V/V and matches exactly the output of the EEG circuit (Vout—cyan) waveform of the output in the desired peaks, in the cases at 9 Hz, 10 Hz and 25 Hz, where the beta and alpha wave consecration of power exist. Simultaneously, the noise artifacts do not affect the appearance of the brain signal peaks but affect in a non-detrimental way for the BCI of neurofeedback applications the rest of the EEG frequencies in the wavebands of interest. Thus, it is apparent from the graph that the circuit output (Vout—cyan) gives the magnitude and, after some processing, the energy content for the alpha, beta and theta wave bands in thirty-second intervals, while the user of the EEG circuit participates in protocols with strong compound muscle movements. In Figure 22, where the same 30 s experiment is presented, in which the Fourier transform is performed for only the first 3 s, the same observations as above still hold. So, it can safely be assumed that the circuit performs as intended both at single-digit-second intervals as well as tens-of-seconds intervals, satisfying the requirement for a wide range of neurofeedback and BCI applications. As far as EMI is concerned, by inspecting the raw EEG channel 1 signal (Vch1—blue) and raw EEG reference channel signal (Vchref—green) waveforms that represent the signals collected in the electrodes, in Figure 22, the main noise is at around −27 db (in this case of a 50 Hz grid at 220 V), while in the output, it is suppressed at approximately −74 db, validating the theoretical predictions about the depth of the notch filter. Moreover, it is apparent that the relative amplitude of the weakened EMI signal component in the output is in the order of magnitude of an extremely weak gamma signal, so the majority of gamma signals in the 50 Hz region could be collected by the proposed novel circuit of this study. This observation, of course, is also true for the conditions in Figure 21.
As for Figure 23, it has the same ranges in time scale and Fourier transform as Figure 22, but it is focused on the 3 kHz region. As previously described, there is the region where the frequency component is expected to be of the ERP signal that takes place in the first second of this exemplary protocol presented earlier in the results. Indeed, a closer observation reveals that almost none of the original ground truth EEG signal (Veeg—pink) is detectable in the raw EEG reference channel (Vchref—green) and raw EEG channel 1 signal (Vch1—blue) waveforms that are collected from the electrodes, and the region is significantly contaminated by high frequency noise artifacts. Notably, the circuit can recreate the frequency information and especially the peak in the Fourier plane of the ERP signal, validating that both the filtering and amplification of our proposed circuit work as intended.
Figure 24 represents the spectrum of the Fourier of the same constraints in time that were outlined for Figure 20, Figure 22 and Figure 23. The raw EEG reference channel signal (Vchref—green) waveform is the voltage measured at the reference electrode. The raw EEG channel 1 signal (Vch1−blue) waveform is the voltage measured at the channel 1 electrode. The output of the EEG circuit (Vout—cyan) waveform is the output of the EEG-B3V3S7C1 circuit design. The output of the instrumentation amplifier (Vvo—red) waveform is the voltage at the output of the instrumentation amplifier, magnified 1.5 times. The ground truth EEG signal (Veeg—pink) waveform depicts the EEG ground truth signal contained in channel 1, magnified 300 times. The last two depictions’ magnification serves as a quantitative graphical measurement of the gain of the first amplification stage gain and the overall gain of the circuit.
First and foremost, it is evident that the real gain of the high-pass filter sub-circuit following the instrumentation amplifier is approximately 1.5 V/V, as can be seen from the magnification of the output of the instrumentation amplifier (Vvo—red), which is a value very close to the theoretical prediction of 1.59 V/V, verifying the accuracy of our design. Additionally, the real gain of the output of the EEG circuit (Vout—cyan) is approximately 300 V/V, very close to the theoretical prediction of 316.01 V/V (199 * 1.59 = 316.01), which aligns with the predefined design requirements of the proposed circuit design. As it is depicted in Figure 24, the ERP signal is well preserved and denoised in the output of the signal. Notably, it can be clearly assessed that both the EMI and the muscle noise are significantly reduced. The raw EEG channel 1 signal (Vch1—blue) and raw EEG reference channel signal (Vchref—green) peaks that exist in the vicinity of 50 Hz are reduced to a magnitude that is in the order of magnitude or less than the brain signal. Muscle artifacts are negligibly affecting the output signal.
Afterwards, in the same product of FFT analysis from the previous sub-section, the Fourier spectrum was examined in a bigger range from 10 mHz to 3 kHz, studying the same waveforms in the entire circuit’s output bandwidth, as specified in the requirements of the proposed circuit design (0.5 kHz to 3 kHz). The aim of this approach was to confirm that in any range from 0.5 Hz to 3 kHz, including the frequency range of special interest from 4 Hz to 30 Hz, the ground truth EEG signal integrity is maintained, and at the same time, the noise artifacts do not influence the distinctiveness of the brain signal peaks. In Figure 25, again, it is evident that the peaks in the alpha, beta and theta wave bands and of the ERP signal of the output of the instrumentation amplifier (Vvo—red), the output of the EEG circuit (Vout—cyan) and the ground truth EEG signal (Veeg—pink) brain waves are all aligned. The muscle noise is suppressed and can have a significant presence in the output only in the frequency ranges below 1 Hz, affecting only the delta waveband, and mostly in the region of this band that is more rarely studied.

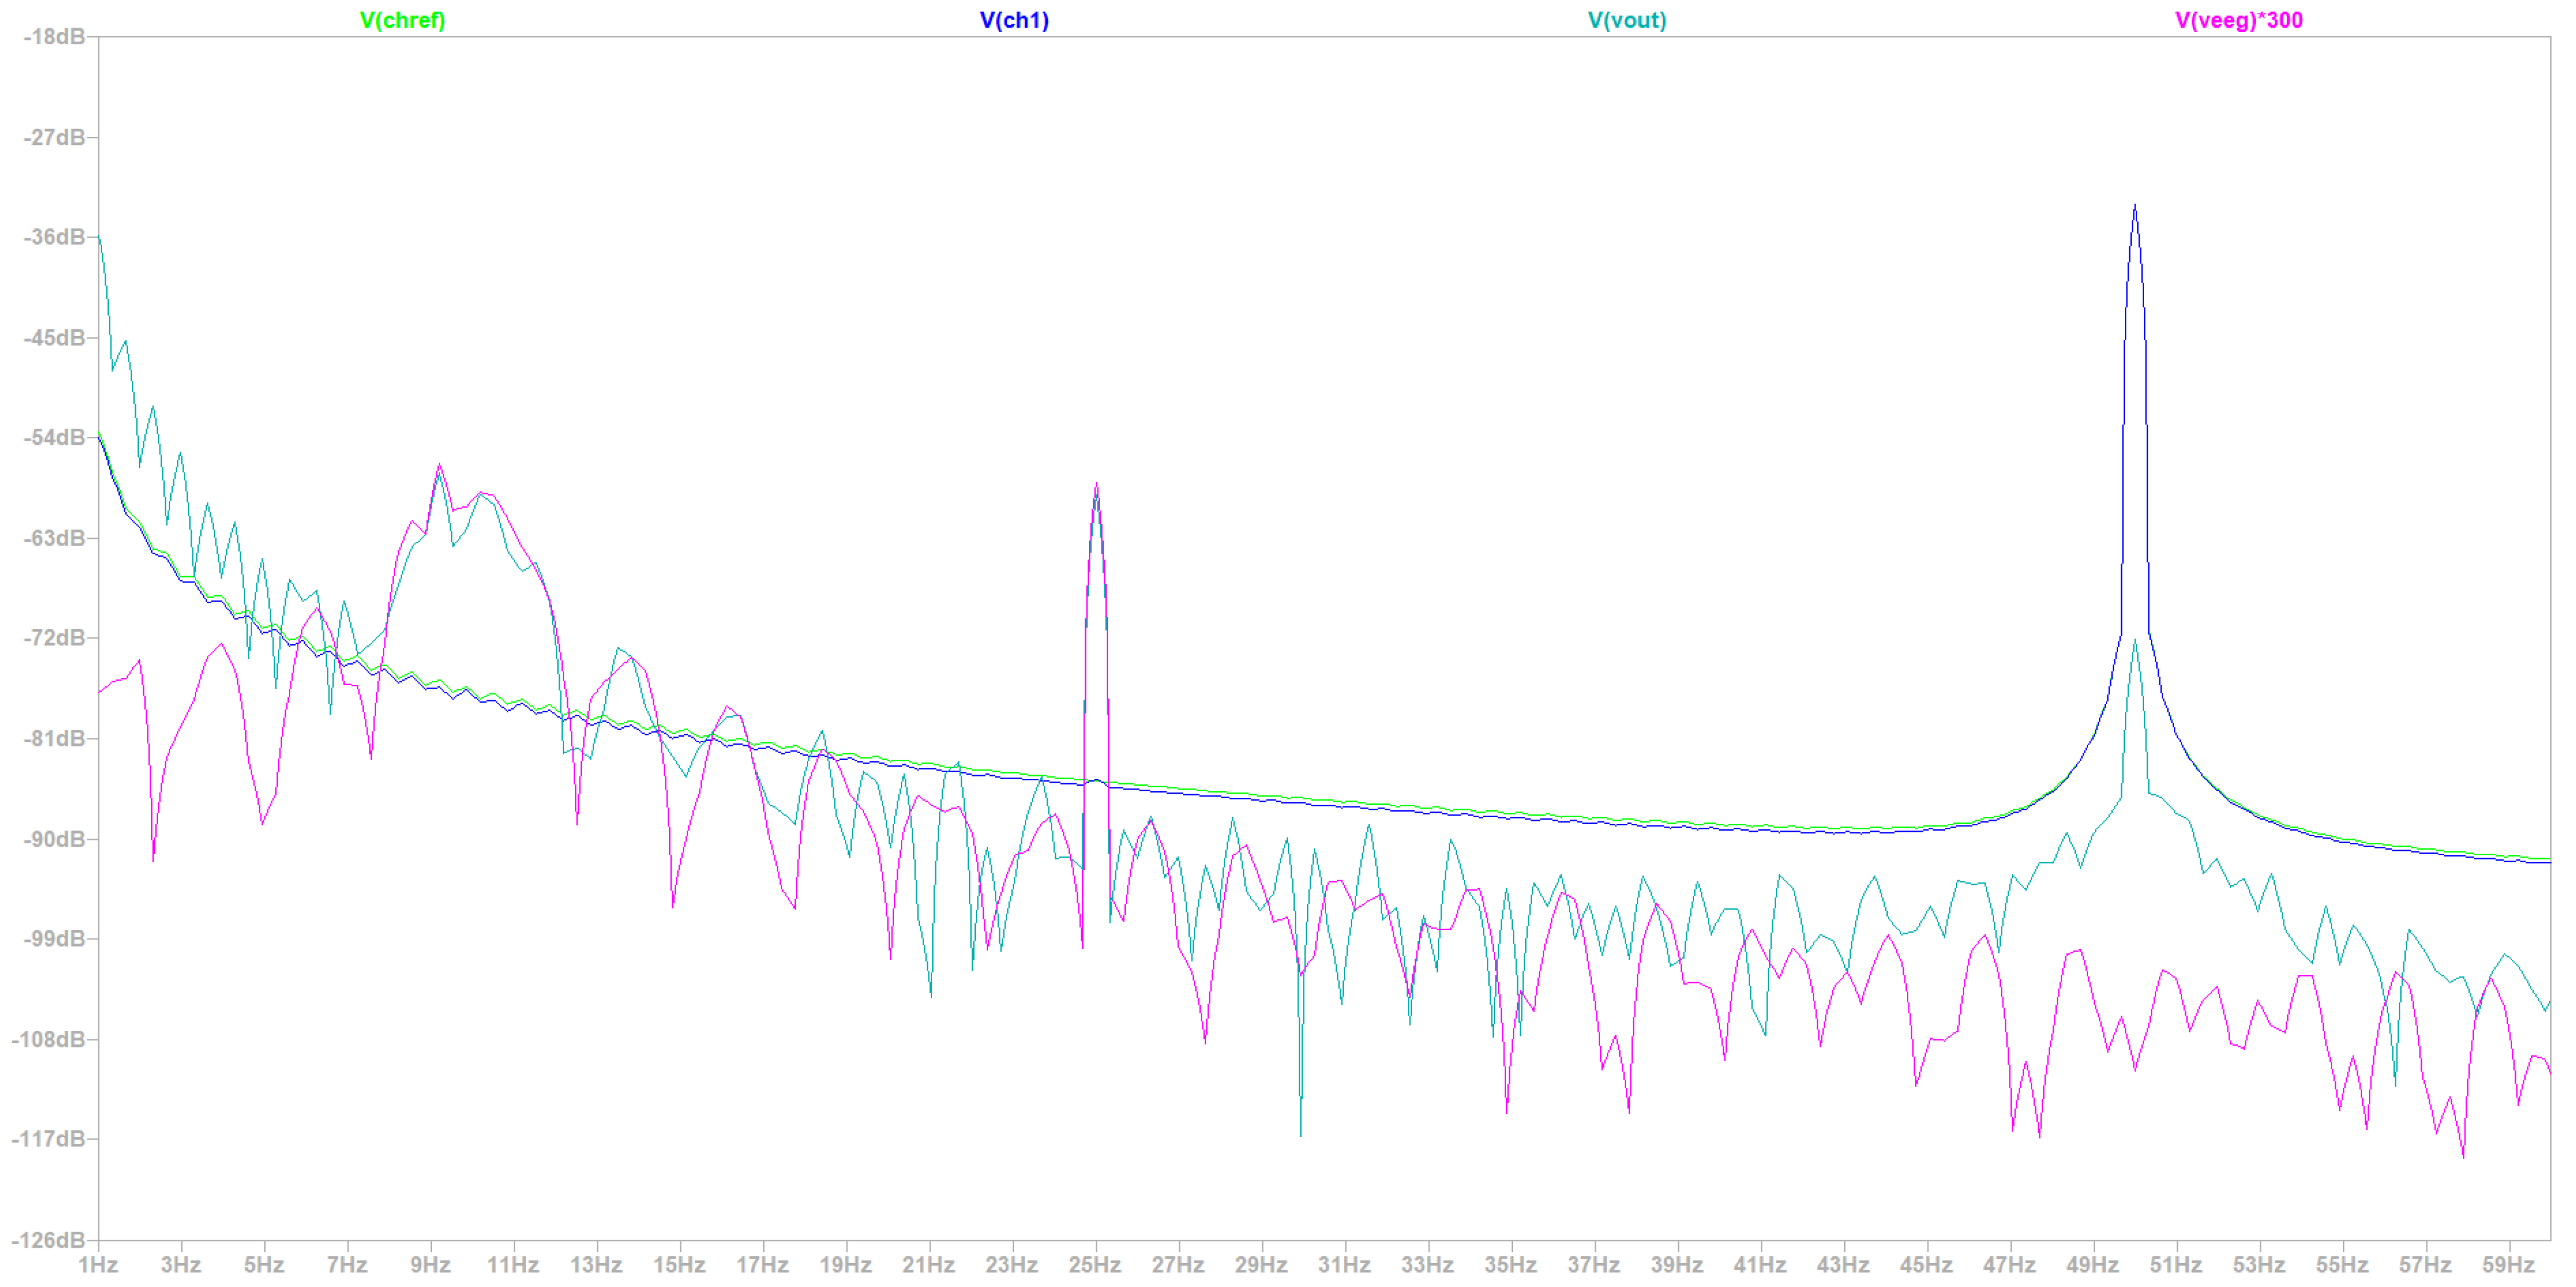
4.1.2. Simulation in an Environment with an Electrical Grid with Frequency 60 Hz

The same simulation, as previously analytically described, was performed in a 60 Hz power grid environment. It is obvious that this simulation produced the corresponding time and frequency domain simulation graphs, which are not presented in this subsection, for reasons of space conservation. The overall results were deemed satisfactory. Specifically, the CMRR of the circuit was assessed by short-circuiting the two input channels with a voltage source of 0 V DC offset and 1 V AC amplitude across all frequencies. While performing AC analysis, the CMRR yielded a frequency response function dependent on the frequency variable. In the band of interest of alpha, beta and theta waves, CMRR was approximately 98 dB, which is a slightly better performance than in the 50 Hz case. In frequencies greater than 110 Hz, CMRR dropped below 90 dB and at 3 kHz reached 62 dB. Meanwhile, in the area below 1 Hz, CMRR reached levels up to 163.5 dB at 10 mHz, similar to the 50 Hz case. The simulated notch depth was measured at 40.05 dB, which is acceptable, based on [56], which defines realistic expectations for maximum realizable notch depth between 40 dB and 50 dB but is not as good as in the 50 Hz scenario.
Noise analysis was performed on the circuit for the 60 Hz configuration. The result of 1.4887 µVpp noise from 0.1 Hz to 10 Hz before amplification was identified in a 50 Hz environment. The total power consumption was measured at approximately 20.5 mWatt. All the measurements were conducted in a similar manner as the one described in Section 4.1.1 for the 50 Hz experiments.

4.2. Comparative Analysis of the Simulated EEG-B3VS7C2 with the Cases 1, 2, 3

As depicted in Table 2, with regard to CMRR, the proposed circuit is in alignment with the specification that demands values greater than 90 in the area of interest of the alpha, beta and theta wavebands. The maximum CMRR in the passband of our output signal is 97 dB and 98 dB at 50 Hz and 60 Hz, respectively.
It must be stated that this proposed circuit has been designed in order to focus on meeting the requirements of protocols with compound muscle movement. The satisfaction of these requirements necessitates a filtering of the noise artifacts before the first amplification in order to protect the amplifier from reaching a state of saturation by amplifying undesired muscle artifacts that are present in the raw EEG signal. The introduction of filters at the initial stage limits the possibility of increasing the CMRR in any EEG analog front-end. The only technical obligation of the proposed circuit with respect to CMRR is to be higher than 90 dB in the frequencies of interest, so any values higher than this lower limit can be considered acceptable. Thus, even though our CMRR is lower than the ones of the other Case “1” [47], Case “2” [48] and Case “3” [49] (110 dB up to 140 dB), this was a deliberate trade-off. The high CMRR of Case “1” [47], Case “2” [48] and Case “3” [49] is practically useless for the case of muscle movement artifact removal, because the aforementioned circuit has neither been tested for this use case nor designed with the accommodation needs of such protocols in mind.
As far as circuit bandwidth is concerned, the proposed circuit design covers all the frequencies from 0.1 Hz to 20 kHz, and the bibliographies state that an EEG signal may appear for performing raw EEG data acquisition and artifact removal. More specifically, the proposed circuit is tested to be more than sufficient to process the EEG signal in the wavebands of particular interest in the zone of 4 Hz to 30 Hz. On the one hand, Cases “1” [47] and “3” [49] are designed to collect signals with frequencies from the alpha, beta, delta and theta wavebands, and they do so efficiently. From the previous two, Case “1” [47] has a greater margin for errors, in terms of the higher cut-off frequency of the low-pass filters. On the other hand, Case “2” [48] has such a large bandwidth that it is of no use for the accurate collection of the EEG signal, thus resulting in the collection of unnecessary high frequency noise that would possibly be present in its output signal (the authors refer to higher frequencies in the output of amplifier that fall within its operation bandwidth, but can be categorized from the perspective of EEG signal acquisition). It must be noted that even though Case “2” [48] is designed only with an amplification and an inverting stage, all real-world amplifiers function as amplifiers only in a certain bandwidth. Beyond this bandwidth, as it is known, they practically work as low-pass filters in higher frequencies (usually MHz order of magnitude), because of the internal junction capacitances. So, the comparison of Case “2” [48] bandwidth with the bandwidths of Case “1” [47] and “3” [49], respectively, is valid and relevant in the context of EEG signal acquisition circuits.
Finally, considering signal quality, all circuits have excellent gains for the respective use cases, with Case “2” [48] having the strong advantage that it possesses the ability for programmable gain. In this work, this was a characteristic that was not a priority to be used in the present study, but programmable gain will be one of the design priorities in the future iterations of this circuit that are being worked upon by the authors. As far as noise is concerned and its effect on signal quality, Case “2” [48] has the best performance, with the proposed circuit design being second but in close proximity with the first in noise performance. In both cases, the noise level is acceptable. Case “3” [49] choose a non-standard format for presenting their result, and accordingly, it cannot be directly compared with the other cases. However, it can be stated that error pre-amplification at a level of around 1% is acceptable for certain types of applications. The use of this circuit should be contained only in those cases that are stated in the respective paper, if the user wants guarantees of accuracy in the signal acquisition process. Case “1” [47] does not provide relevant information for the noise level. Lastly, Case “1” [47] and the proposed novel design of this study achieve the same notch depth, while Case “3” [49] does not state notch depth data, and Case “2” [48] does not perform notch filtering at all. The simulation results and comparison between Case “1” [47], Case “2” [48] and Case “3” [49] with the proposed circuit design are presented in Table 2.
At this point, a comparative analysis of Case “1” [47], Case “2” [48] and Case “3” [49] will be conducted in contrast with the proposed circuit design innovations. Specifically, the proposed circuit EEG design has a series of innovations that overcome the various limitations observed. Starting this analysis with notch filtering, the proposed design has the ability to perform notching either at 50 Hz or 60 Hz, depending on the environment in which the circuit is intended to be used in Case “1” [47] and Case “3” [49] accommodating only 50 Hz EMI noise removal, and Case “2” [48] does not perform any kind of notch filtering at all. Additionally, the protection of sensitive EEG electronics from static electricity is not incorporated in Case “1” [47], Case “2” [48] and Case “3” [49], in contrast with the ESD protection sub-circuit of the proposed design. Moreover, Case “1” [47], Case “2” [48] and Case “3” [49] have not been tested in conditions with the presence of strong muscle artifacts, while the proposed design is meticulously tested for handling artifacts of such nature. It is worth mentioning that Case “1” [47], Case “2” [48] and Case “3” [49] have not been tested for compliance with the current safety standards, making their real-world usage potentially unsafe for human use. On the contrary, the proposed circuit is in accordance with the medical device standards for EEG user patient’s safety with respect to leakage current levels. Last but not least, in Case “1” [47], and Case “3” [49], the input data with which their respective circuits were simulated are unknown, and in Case “2” [48], even though the input data are clearly provided, they are rather ideal non-realistic EEG waveforms and, with certainty, do not contain compound muscle movement artifacts. In this study, a highly detailed circuit model of the human body and of the EMI that affects the body originated from the surrounding environment. Thus, the input data were transparently generated from the aforementioned modeling circuit, making the simulation results reproducible and reusable. Besides creating the previous asset, the proposed circuit model was adjusted to produce input data that contained muscle movement artifacts. Those generated artifacts were used to confirm the proposed circuit is capable of being used to collect raw EEG signals accurately in protocols that contain strong muscle movement. The examination of the limitations of Case “1” [47], Case “2” [48] and Case “3” [49] and the proposed design innovations are thoroughly presented in Table 3.

5. Discussion

5.1. Observed Limitations of the Proposed EEG Circuit Design

The present single-channel arrangement of the EEG circuit presents a limitation, if a complete study of brain activity is desired, as it allows a very limited amount of data to be collected. Even though the design is modular and can be expanded for multi-channel acquisition, this was not performed in this study. This circuit was designed as a proof of concept for efficient modeling of the electronic behavior of the brain, muscle artifacts and EMI, as well as the circuit topology needed for muscle artifacts’ removal during the EEG signal acquisition process. This problem can only be resolved by designing a multi-channel system that would allow simultaneous monitoring in several brain areas, an attribute that is certainly required for carrying out comprehensive neurological studies. Also, the multi-channel approach could give more flexibility in muscle artifact removal, as this type of artifact is mostly a common mode signal, and having a better space sampling of this signal means it can be more effectively filtered with hardware or software solutions.
In addition, the absence of a wireless technology MCU and ADC topology being intergraded with this circuit limits the ability of this study to be a complete proof of concept for effective EMI and muscle artifact removal in potential mobile monitoring applications. Even though the signal generator can be a step towards the verification of the reproducible simulated evaluation of EEG AFE circuits, the utility of such circuits for real time mobile EEG muscle artifacts free signal acquisition can only be assessed with the inclusion of wireless communication modules, ADCs and MCU, in order to produce a complete EEG circuit that can be tested initially in a lab environment and ultimately in real-life scenarios.
There are also concerns over the continued reliance of the circuit on battery power, which could affect the long-term operational stability and long-term efficiency in power management. The integration of resilient material and application-specific battery technologies can prove highly effective in reducing the risk of single points of failure, a critical factor in decreasing the risks to medical safety regulation. To avoid this, the proposed AFE should be subjected to thorough testing within various environmental conditions, such as low, freezing and high temperatures and humidity levels, which was not part of the present study. The present AFE was not simulated to determine if it is durable enough for use in everyday harsh weather conditions, including even a device that is waterproof.
The current study has not entertained the possible hardware choices of more advanced methods for noise reduction, such as adaptive filtering, which may be necessary for effectively responding to environmental noise, particularly from highly interfering environments like hospitals or clinics. The latter could also be addressed by incorporating enhanced electromagnetic interference (EMI) shielding in the design stage of the printed circuit board (PCB). Also, the shielding of the cables, a topic that was not part of this study is of extreme importance when designing the interface between the AFE and the electrodes that acquire the brain signals of the potential users of an EEG or BCI that could potentially use the proposed circuit as an AFE. Additionally, the problems of data encryption or secure data transfer were not part of this study, yet both are paramount to securing the data of patients in medical applications. Nonetheless, this is a problem that is mostly addressed by the circuitry of the MCUs incorporated in the EEG circuits and not by the AFE design. Lastly, the design was not assessed for compliance with all the existing international regulatory norms in the domain of EEG but only with those related to safety and leakage currents. This can limit it from being considered for use in any medical environment, until more studies are conducted.

5.2. Future Perspectives: Possible Updates and Real-World Applications of the Proposed EEG Circuit Design

The proposed novel EEG AFE was designed with the goal of being able to be incorporated into multi-component EEG signal acquisition systems for neurofeedback training and BCI applications. It can ensure the collection of full-brain activity at the site, where the electrode of the single channel is applied, thus facilitating better control accuracy and more efficacious neurofeedback [59].
In a future study, adaptive filtering methods combined with commercially available ADCs and microcontrollers could allow the study of the real-time data collection capabilities of the proposed AFE, as part of a complete system. The transmission of the acquired signal could be materialized with the use of BLE or Wi-Fi to a computer for real-time mobile BCI applications. Extending the design based on the proposed AFE for multi-channel data acquisition is a self-evident next step for research. This will further increase spatial resolution in EEG data and can be combined with the use of highly sensitive dry or wet electrodes and well-shielded cables for minimal noise signal propagation between the electrodes and the AFE. A PCB design with meticulous care for signal integrity and avoidance of EMI is also a valid future perspective of the presented research.
Furthermore, the design of a proof-of-concept BCI application using this AFE could also be a logical next step for extending the results of this research. This BCI could also take into account hardware problems related to the AFE that arise when the designer wants to enable user-specific calibration utilities in the circuit level, such as the use of case specific Programmable Gain Amplifiers for gain adjustment, based on input impedance measurements during usage. Lastly, a study on the choice of material with respect to preserving signal integrity while not minimizing signal accuracy could be a future topic of expansion of the present study.
In recapitulation, the materialization of all the above propositions translates to a more robust AFE design that would allow for cost-effective multi-channel deployments and that could be crafted for compliance with all the legal medical requirement standards for the purpose of ensuring usability in medical settings. Fixing these technological bottlenecks and keeping these suggestions in mind during the design process show that the EEG systems could undergo potential improvements for use in research and therapeutics. This will lead to high usability and effectiveness in real-world applications. Allowing the scientific community access to the proposed ideas and concerns posed by this study could hopefully accelerate the process of reproducible AFE designs that support real-time EMI and muscle artifact removal.

6. Conclusions

This study introduces a novel EEG Analog Front-End Circuit System, distinctively capable of monitoring theta, alpha and beta brain wavebands during challenging complex EEG usage protocols involving strong compound muscle movements. This capability, which is rarely studied in the field to the best of our knowledge, addresses a significant gap in existing EEG technologies.
It is worth noting that by making the system capable of handling significant manipulation of muscle artifacts in raw EEG data, EEG analysis becomes more accurate and reliable. Taking into consideration the effects of environmental electromagnetic interference, our project presents an unprecedented development of a realistic electronic model of the human body and brain, which can handle 50 Hz or 60 Hz power grid EMI. More importantly, the GIGO problem must be minimized when evaluating such systems. Accurate, realistic and coherent input signals are needed for system evaluation, and this requirement can be achieved through advanced input signal modeling. Our approach, which maintains the consistency, accuracy and reliability of our simulation testing, is essential for increasing the credibility and efficiency of the projected EEG.
The suggested circuit’s primary characteristic is its high mobility, which is facilitated by a battery-powered configuration, allowing for application in a variety of scientific and industrial contexts. It covers a broad frequency spectrum, beginning with 0.5 Hz and reaching 48 kHz as the minimum contour’s frequency. The 0 dB passband ensures a comprehensive compilation of all EEG signals, which falls between 0.5 Hz and 21 kHz. With the high amplification factor of 300 V/V, the signal may increase the signal amplitudes of EEG numerous times, and its high amplifications do not result in signal distortion. Furthermore, low levels of noise production, with a value of 1.58871 μVrms, ensure that the noise levels before amplification ranging between 0.1 Hz and 10 Hz are extremely low.
Significantly enhancing the clarity and quality of raw EEG signal readings can be achieved by reducing noise levels and attaining a 48 dB notch depth at the correct frequency. The idea shows its potential for global acceptability by mitigating electromagnetic interference at frequencies of either 50 Hz or 60 Hz, depending on the particular power grid configurations in the region. The circuit follows EEG design principles by achieving a high Common Mode Rejection Ratio above 90 dB when subjected to EEG signals under 110 Hz in 60 Hz EMI environments and under 166 Hz in 50 Hz EMI environments. The design complies with the set requirements for medical equipment with respect to current levels and the leakage of current to ensure patient safety. Furthermore, the integration of a sub-circuit specifically engineered to mitigate the risk of electrostatic discharge amplifies the system’s robustness and durability.
To recapitulate, the aforementioned attributes lead to the production of results that are almost of medical caliber while necessitating a few electrical components. Importantly, the system retains its cost-effectiveness advantage by employing simple and minimal sub-circuits, deliberately avoiding complex and expensive techniques and maintaining the cost close to commercial and research-grade device levels. In summary, the system’s capabilities are extensively validated through carefully crafted simulations, and its potential usage extends to advanced applications such as neurofeedback training and tele-controlling devices via Brain–Computer Interfaces, particularly in usage protocols where the novel device’s users perform strong compound muscle movements.

Supplementary Materials

The following are available online at https://www.mdpi.com/article/10.3390/app14166886/s1, containing Supplementary Materials “SA” [10,11,12,13,14,22] and “SB” [43,44,45,46,47,48,49,50,60] that expand upon information provided in Sections “Introduction” and “Related Works”.

Author Contributions

Conceptualization, A.D.; methodology, A.D.; software, A.D.; validation, A.D., G.T. and P.T.; formal analysis, A.D.; investigation, A.D.; resources, A.D. and P.T.; data curation, A.D. and P.T.; writing—original draft preparation, A.D. and G.T.; writing—review and editing, A.D., G.T. and P.T.; visualization, A.D. and G.T.; supervision, P.T.; project administration, A.D. All authors have read and agreed to the published version of the manuscript.

Funding

This research received no external funding.

Institutional Review Board Statement

Not applicable.

Informed Consent Statement

Not applicable.

Data Availability Statement

The original contributions presented in the study are included in the article.

Acknowledgments

We would like to extend our profound gratitude to ADAMOPOULOU Chryssoula, of English Language, for her invaluable insights, as she has significantly enhanced the lexical richness of this publication.

Conflicts of Interest

The authors declare no conflicts of interest.

References

  1. Biasiucci, A.; Franceschiello, B.; Murray, M.M. Electroencephalography. Curr. Biol. 2019, 29, R80–R85. [Google Scholar] [CrossRef] [PubMed]
  2. Chaudhary, U.; Birbaumer, N.; Ramos-Murguialday, A. Brain–computer interfaces for communication and rehabilitation. Nat. Rev. Neurol. 2016, 12, 513–525. [Google Scholar] [CrossRef] [PubMed]
  3. Sanei, S.; Chambers, J.A. Fundamentals of EEG Signal Processing. In EEG Signal Processing; John Wiley & Sons Ltd.: Hoboken, NJ, USA, 2007; pp. 35–125. [Google Scholar] [CrossRef]
  4. Tatum, W.O. Ambulatory EEG. In Handbook of EEG Interpretation; Springer Publishing Company: Danvers, MA, USA, 2021. [Google Scholar] [CrossRef]
  5. Benbadis, S.R.; Beniczky, S.; Bertram, E.; MacIver, S.; Moshé, S.L. The role of EEG in patients with suspected epilepsy. Epileptic Disord. 2020, 22, 143–155. [Google Scholar] [CrossRef] [PubMed]
  6. Rubiños, C.; Godoy, D.A. Electroencephalographic monitoring in the critically ill patient: What useful information can it contribute? Med. Intensiv. (Engl. Ed.) 2020, 44, 301–309. [Google Scholar] [CrossRef] [PubMed]
  7. Michel, C.M.; Murray, M.M. Towards the utilization of EEG as a brain imaging tool. NeuroImage 2012, 61, 371–385. [Google Scholar] [CrossRef] [PubMed]
  8. Aboalayon, K.; Faezipour, M.; Almuhammadi, W.; Moslehpour, S. Sleep Stage Classification Using EEG Signal Analysis: A Comprehensive Survey and New Investigation. Entropy 2016, 18, 272. [Google Scholar] [CrossRef]
  9. Diykh, M.; Li, Y.; Wen, P. EEG Sleep Stages Classification Based on Time Domain Features and Structural Graph Similarity. IEEE Trans. Neural Syst. Rehabil. Eng. 2016, 24, 1159–1168. [Google Scholar] [CrossRef] [PubMed]
  10. Asadzadeh, S.; Yousefi Rezaii, T.; Beheshti, S.; Delpak, A.; Meshgini, S. A systematic review of EEG source localization techniques and their applications on diagnosis of brain abnormalities. J. Neurosci. Methods 2020, 339, 108740. [Google Scholar] [CrossRef] [PubMed]
  11. Dhar, P.; Garg, V.K. Brain-Related Diseases and Role of Electroencephalography (EEG) in Diagnosing Brain Disorders. In Lecture Notes in Networks and Systems; Springer: Singapore, 2020; pp. 317–326. [Google Scholar] [CrossRef]
  12. Ullah, H.; Mahmud, S.; Chowdhury, R.H. Identification of Brain disorders by Sub-band Decomposition of EEG signals and Measurement of Signal to Noise Ratio. Indones. J. Electr. Eng. Comput. Sci. 2016, 4, 568. [Google Scholar] [CrossRef]
  13. Iscan, Z.; Dokur, Z.; Demiralp, T. Classification of electroencephalogram signals with combined time and frequency features. Expert Syst. Appl. 2011, 38, 10499–10505. [Google Scholar] [CrossRef]
  14. Siuly, S.; Li, Y.; Zhang, Y. Electroencephalogram (EEG) and Its Background. In EEG Signal Analysis and Classification; Springer: Cham, Switzerland, 2016; pp. 3–21. [Google Scholar] [CrossRef]
  15. Puce, A.; Hämäläinen, M. A Review of Issues Related to Data Acquisition and Analysis in EEG/MEG Studies. Brain Sci. 2017, 7, 58. [Google Scholar] [CrossRef] [PubMed]
  16. Mumtaz, W.; Rasheed, S.; Irfan, A. Review of challenges associated with the EEG artifact removal methods. Biomed. Signal Process. Control 2021, 68, 102741. [Google Scholar] [CrossRef]
  17. Botti Benevides, A.; Silva da Paz Floriano, A.; Sarcinelli-Filho, M.; Freire Bastos-Filho, T. Introduction to Non-Invasive EEG-Based Brain–Computer Interfaces for Assistive Technologies, 1st ed.; Review of the Human Brain and EEG Signals; CRC Press: Boca Raton, FL, USA, 2020; pp. 1–49. [Google Scholar] [CrossRef]
  18. Chen, X.; Xu, X.; Liu, A.; Lee, S.; Chen, X.; Zhang, X.; McKeown, M.J.; Wang, Z.J. Removal of Muscle Artifacts From the EEG: A Review and Recommendations. IEEE Sens. J. 2019, 19, 5353–5368. [Google Scholar] [CrossRef]
  19. Sanei, S. Adaptive Processing of Brain Signals; Wiley: Hoboken, NJ, USA, 2013; ISBN 9781118622162. [Google Scholar] [CrossRef]
  20. Lebedev, M.A.; Nicolelis, M.A.L. Brain-Machine Interfaces: From Basic Science to Neuroprostheses and Neurorehabilitation. Physiol. Rev. 2017, 97, 767–837. [Google Scholar] [CrossRef] [PubMed]
  21. Elsayed, N.; Saad, Z.; Bayoumi, M. Brain Computer Interface: EEG Signal Preprocessing Issues and Solutions. Int. J. Comput. Appl. 2017, 169, 12–16. [Google Scholar] [CrossRef]
  22. Alkhorshid, D.R.; Molaeezadeh, S.F.; Alkhorshid, M.R. Analysis: Electroencephalography Acquisition System: Analog Design. Biomed. Instrum. Technol. 2020, 54, 346–351. [Google Scholar] [CrossRef] [PubMed]
  23. Cohen, M.X. Where Does EEG Come from and What Does It Mean? Trends Neurosci. 2017, 40, 208–218. [Google Scholar] [CrossRef] [PubMed]
  24. Tankisi, H.; Burke, D.; Cui, L.; de Carvalho, M.; Kuwabara, S.; Nandedkar, S.D.; Rutkove, S.; Stålberg, E.; van Putten, M.J.A.M.; Fuglsang-Frederiksen, A. Standards of instrumentation of EMG. Clin. Neurophysiol. 2020, 131, 243–258. [Google Scholar] [CrossRef] [PubMed]
  25. Vanhatalo, S.; Voipio, J.; Kaila, K. Full-band EEG (FbEEG): An emerging standard in electroencephalography. Clin. Neurophysiol. 2005, 116, 1–8. [Google Scholar] [CrossRef] [PubMed]
  26. Hari, R.; Parkkonen, L.; Nangini, C. The brain in time: Insights from neuromagnetic recordings. Ann. N. Y. Acad. Sci. 2010, 1191, 89–109. [Google Scholar] [CrossRef] [PubMed]
  27. Sullivan, T.J.; Deiss, S.R.; Cauwenberghs, G. A Low-Noise, Non-Contact EEG/ECG Sensor. In Proceedings of the IEEE Biomedical Circuits and Systems Conference, Montreal, QC, Canada, 27–30 November 2007. [Google Scholar] [CrossRef]
  28. Scheer, H.J.; Sander, T.; Trahms, L. The influence of amplifier, interface and biological noise on signal quality in high-resolution EEG recordings. Physiol. Meas. 2005, 27, 109–117. [Google Scholar] [CrossRef] [PubMed]
  29. Nagulapalli, R. Low Power and High Signal to Noise Ratio Bio-Medical AFE Design Techniques. Ph.D. Thesis, Faculty of Technology, Design & Environment Department of Mechanical Engineering & Mathematical Sciences, Oxford Brookes University, Oxford, UK, January 2023. Available online: https://radar.brookes.ac.uk/radar/file/74e88470-f109-4f23-a355-db01028f36a1/1/Nagulapalli2023AFEdesign.pdf (accessed on 30 July 2024).
  30. Wasade, V.S.; Spanaki, M.V. Understanding Epilepsy; Cambridge University Press: Cambridge, UK, 2019. [Google Scholar] [CrossRef]
  31. Usakli, A.B. Improvement of EEG Signal Acquisition: An Electrical Aspect for State of the Art of Front End. In Computational Intelligence and Neuroscience; John Wiley & Sons, Inc.: Hoboken, NJ, USA, 2010; Volume 630649, pp. 1–7. [Google Scholar] [CrossRef]
  32. Gardella, P.J.; Baez, E.; Cesaretti, J.M. Design of ESD protections for ECG applications. In Proceedings of the Conference on Electronics (CAE), Buenos Aires, Argentina, 27–28 February 2020. [Google Scholar] [CrossRef]
  33. Kuo, K.-C.; Chen, C.-T.; Liao, H.-Y. An Area Efficient Analog Front-End for Sensing EEG Signals with MOS Capacitors in 90 nm Process. In Proceedings of the International Conference on Consumer Electronics—Taiwan (ICCE-Taiwan), PingTung, China, 17–19 July 2023. [Google Scholar] [CrossRef]
  34. Cornelio, Z.U.; Resurreccion, P.; de Leon, M.T.; Rosales, M.; Hizon, J.R. An EEG Analog Front-End Unit for Wearable Applications Implemented in 28nm FD-SOI. In Proceeding of 20th International SoC Design Conference (ISOCC) 2023, Jeju, Republic of Korea, 25–28 October 2023. [Google Scholar] [CrossRef]
  35. Le, D.H.; Pham, T.-H.; Pham, C.-K. Design of a Configurable 4-Channel Analog Front-End for EEG Signal Acquisition on 180nm CMOS Process. REV J. Electron. Commun. 2023, 14, 10–19. [Google Scholar] [CrossRef]
  36. Pham, T.-H.; Huynh, H.-A.; Pham, C.-K.; Le, D.-H. Design of a Configurable Low-Noise 1-Channel Analog Front-End for EEG Signal Recording on 180 nm CMOS Process. In Proceedings of the International Conference on Advanced Technologies for Communications (ATC) 2023, Da Nang, Vietnam, 19–21 October 2023. [Google Scholar] [CrossRef]
  37. Li, X.; Ren, S.; Li, X.; Zhao, T.; Deng, X.; Zheng, W. An LFP/AP Mode Reconfigurable Analog Front-End Combining an Electrical EEEG-iEEG Model for the Closed-Loop VNS. IEEE Trans. Biomed. Circuits Syst. 2024, 18, 408–422. [Google Scholar] [CrossRef] [PubMed]
  38. Hu, H.-Y.; Wang, L.-H.; Kuo, I.-C.; Wang, M.-H.; Wang, S.-F.; Huang, P.-C. A Multi-Channel EEG Acquisition Device Based on BT Microcontroller. In Proceedings of the International Conference on Consumer Electronics—Taiwan (ICCE-Taiwan) 2023, PingTung, China, 17–19 July 2023. [Google Scholar] [CrossRef]
  39. Han, Y.; Zhao, L.; Stephany, R.G.; Hsieh, J.-C.; Wang, H.; Jia, Y. A Scattered Wireless EEG Recording System. In Proceedings of the IEEE Biomedical Circuits and Systems Conference (BioCAS) 2023, Toronto, ON, Canada, 19–21 October 2023. [Google Scholar] [CrossRef]
  40. Chen, W. Multi-channel EEG signal acquisition system based on nRF52832. In Proceedings of the 5th International Conference on Communications, Information System and Computer Engineering (CISCE) 2023, Guangzhou, China, 14–16 April 2023. [Google Scholar] [CrossRef]
  41. Liu, L.; Xu, J.; Yin, J.; Liao, X.; Tian, Y. A Low-Power and Constant-Bandwidth Analog Front End Based on Current-Reused DDA for Multibiosignal Acquisition. IEEE Sens. J. 2023, 23, 24711–24720. [Google Scholar] [CrossRef]
  42. Ge, T.; Li, P.; Duan, Q.; Yu, G. A low-noise, high-precision chopper instrument amplifier for EEG signal amplification. In Proceedings of the 5th International Conference on Circuits and Systems (ICCS) 2023, Huzhou, China, 27–30 October 2023. [Google Scholar] [CrossRef]
  43. Kumar, S.C.P.; Chandrasekar, A.; Nagaraj, A.; Gupta, P.; Sekhar, S. Design of an ElectroEncephaloGram (EEG) amplification circuit for neonates. In Proceedings of the International Conference on Communication and Signal Processing (ICCSP), Melmaruvathur, India, 6–8 April 2016. [Google Scholar] [CrossRef]
  44. Whitchurch, A.K.; Abraham, J.K.; Lonkar, M.A.; Varadan, V.K. Design of a Compact Amplifier and Signal Conditioning Module for Wireless EEG Monitoring. In Proceedings of the IEEE Region 5 Technical Conference, Fayetteville, AR, USA, 20–22 April 2007. [Google Scholar] [CrossRef]
  45. Zhang, X.; Zhang, Z. Design on Sampling Circuit of EEG Signal Based on AT89C2051 Single-Chip. In Proceedings of the Fourth International Conference on Innovative Computing, Information and Control (ICICIC), Kaohsiung, China, 7–9 December 2009. [Google Scholar] [CrossRef]
  46. Salahuddin Morsalin, S.M.; Lai, S.-C. Front-end circuit design for electroencephalography (EEG) signal. In Proceedings of the 2nd International Conference on Computing, Analytics and Networks (ICAN), Indo—Taiwan, Rajpura, India, 7–15 February 2020. [Google Scholar] [CrossRef]
  47. Xu, X.; Wang, P. Low-Cost Circuit Design for EEG Signal Amplification and Extraction. In Proceedings of the IEEE Asia-Pacific Conference on Image Processing, Electronics and Computers (IPEC), Dalian, China, 14–16 April 2021. [Google Scholar] [CrossRef]
  48. Choudhary, S.K.; Bera, T.K. Designing of Battery-Based Low Noise Electroencephalography (EEG) Amplifier for Brain Signal Monitoring: A Simulation Study. In Proceedings of the IEEE 6th International Conference on Condition Assessment Techniques in Electrical Systems (CATCON), Durgapur, India, 17–19 December 2022; pp. 422–426. [Google Scholar] [CrossRef]
  49. Yuge, S.; Ning, Y.; Feng, P. A novel design of EEG signal amplifier. In Proceeding of 24th Chinese Control and Decision Conference (CCDC), Taiyuan, China, 23–25 May 2012. [Google Scholar] [CrossRef]
  50. Analog Devices, Inc. AD8428: High Gain, High Voltage Instrumentation Amplifier. Data Sheet. Available online: https://www.analog.com/media/en/technical-documentation/data-sheets/ad8428.pdf (accessed on 10 February 2024).
  51. Tsavdaridis, G.; Papaodysseus, C.; Karadimas, N.V.; Papazafeiropoulos, G.; Delis, A. Methodologies and Handling Techniques of Large-Scale Information in Decision Support Systems for Complex Missions. Appl. Sci. 2024, 14, 1995. [Google Scholar] [CrossRef]
  52. Tsavdaridis, G. Adjustable and Adaptable Systems for Crisis Management Support, Monitoring, and Control of Operational Processes. Ph.D. Thesis, School of Electrical and Computer Engineering, National Technical University of Athens, Athens, Greece, March 2024. Available online: https://www.didaktorika.gr/eadd/handle/10442/56130 (accessed on 30 July 2024).
  53. Jobert, M.; Wilson, F.J.; Ruigt, G.S.F.; Brunovsky, M.; Prichep, L.S.; Drinkenburg, W.H.I.M. Guidelines for the Recording and Evaluation of Pharmaco-EEG Data in Man: The International Pharmaco-EEG Society (IPEG). Neuropsychobiology 2012, 66, 201–220. [Google Scholar] [CrossRef] [PubMed]
  54. Alizadeh-Taheri, B.; Smith, R.L.; Knight, R.T. An Active, Microfabricated, Scalp Electrode-array For EEG Recording. In Proceedings of the International Solid-State Sensors and Actuators Conference—TRANSDUCERS ’95, Stockholm, Sweden, 25–29 June 1995. [Google Scholar] [CrossRef]
  55. Zhang, L.; Guo, X.; Wu, X.; Zhou, B. Low-cost circuit design of EEG signal acquisition for the brain-computer interface system. In Proceedings of the 6th International Conference on Biomedical Engineering and Informatics, Hangzhou, China, 16–18 December 2013. [Google Scholar] [CrossRef]
  56. Analog Devices, Inc. AD8422: 1.8 nV/√Hz, Rail-to-Rail, Low Power Instrumentation Amplifier. Data Sheet. Available online: https://www.analog.com/media/en/technical-documentation/data-sheets/ad8422.pdf (accessed on 10 February 2024).
  57. Zumbahlen, H. (Ed.) Analog Filters. In Linear Circuit Design Handbook; Newnes: Burlington, NJ, USA, 2008; pp. 581–679. [Google Scholar] [CrossRef]
  58. Wang, J.; Tang, L.; E Bronlund, J. Surface EMG Signal Amplification and Filtering. Int. J. Comput. Appl. 2013, 82, 15–22. [Google Scholar] [CrossRef]
  59. Hsueh, J.-J.; Chen, T.-S.; Chen, J.-J.; Shaw, F.-Z. Neurofeedback training of EEG alpha rhythm enhances episodic and working memory. Hum. Brain Mapp. 2016, 37, 2662–2675. [Google Scholar] [CrossRef]
  60. Texas Instruments. INA333 Low-Power, Precision Instrumentation Amplifier. Available online: https://www.ti.com/lit/ds/symlink/ina333.pdf (accessed on 12 February 2024).
Figure 1. EEG signal categorization by frequency sub-bands.
Applsci 14 06886 g001
Figure 2. Overall structure of low-cost EEG circuit design.
Applsci 14 06886 g002
Figure 3. Battery-based EEG signal acquisition system (BB-ESAS).
Applsci 14 06886 g003
Figure 4. Double notch filter circuit design of EEG.
Applsci 14 06886 g004
Figure 5. High-level visualization of the proposed EEG circuit.
Applsci 14 06886 g005
Figure 6. EEG sub-circuit modeling the EMI in 50 Hz electric grid.
Applsci 14 06886 g006
Figure 7. EEG sub-circuit modeling the human body apart from the brain.
Applsci 14 06886 g007
Figure 8. EEG sub-circuit modeling the brain and the electrode.
Applsci 14 06886 g008
Figure 9. EEG sub-circuit modeling 3.3 V battery supply.
Applsci 14 06886 g009
Figure 10. EEG sub-circuit modeling the DRL circuit.
Applsci 14 06886 g010
Figure 11. EEG sub-circuit modeling the first band-pass filter.
Applsci 14 06886 g011
Figure 12. EEG sub-circuit modeling the ESD protection and the instrumentation amplifier.
Applsci 14 06886 g012
Figure 13. EEG sub-circuit modeling the Fliedge notch filter at 50 Hz or 60 Hz.
Applsci 14 06886 g013
Figure 14. EEG sub-circuit modeling the second low-pass filter.
Applsci 14 06886 g014
Figure 15. EEG sub-circuit modeling the second high-pass filter.
Applsci 14 06886 g015
Figure 16. The overall novel EEG-B3V3S7C1 circuit design.
Applsci 14 06886 g016
Figure 17. AC analysis of the proposed circuit at a 50 Hz environment. Waveforms: Differential Gain—Blue, CMRR as defined in the text—Red.
Applsci 14 06886 g017
Figure 18. Input noise in 0.1 Hz to 10 Hz before amplification at a 50 Hz environment.
Applsci 14 06886 g018
Figure 19. Time response of the simulation. Waveforms: Raw EEG channel 1 signal (Vch1—gold), Raw EEG reference channel signal (Vchref—purple), Ground truth EEG signal magnified 300 times (Veeg—red), Output of the EEG circuit (Vout—blue).
Applsci 14 06886 g019
Figure 20. Time response of the simulation. Waveforms: Raw EEG channel 1 signal (Vch1—gold), Raw EEG reference channel signal (Vchref—purple), Ground truth EEG signal magnified 300 times (Veeg—red), Output of the EEG circuit (Vout—blue). This picture presents the same experiment as Figure 19, but time course of the experiment is limited from 0.4 to 3 s.
Applsci 14 06886 g020
Figure 21. Frequency response of the simulation (in a range from 4 Hz to 30 Hz). Waveforms: Raw EEG channel 1 signal (Vch1—blue), Raw EEG reference channel signal (Vchref—green), Ground truth EEG signal magnified 300 times (Veeg—pink), Output of the EEG circuit (Vout—cyan), Output of the instrumentation amplifier (Vvo—red). This picture presents the same experiment as Figure 19.
Applsci 14 06886 g021
Figure 22. Frequency response of the simulation (in a range from 4 Hz to 30 Hz). Waveforms: Raw EEG channel 1 signal (Vch1—blue), Raw EEG reference channel signal (Vchref—green), Ground truth EEG signal magnified 300 times (Veeg—pink), Output of the EEG circuit (Vout—cyan), Output of the instrumentation amplifier (Vvo—red). This picture presents the same experiment segment limited from 0.4 to 3 s as Figure 20.
Applsci 14 06886 g022
Figure 23. Frequency response of the simulation (in a range from 2.85 kHz to 3 kHz). Waveforms: Raw EEG channel 1 signal (Vch1—blue), Raw EEG reference channel signal (Vchref—green), Ground truth EEG signal signal magnified 300 times (Veeg—pink), Output of the EEG circuit (Vout—cyan), Output of the instrumentation amplifier (Vvo—red). This picture presents the same experiment segment limited from 0.4 to 3 s as Figure 20.
Applsci 14 06886 g023
Figure 24. Frequency response of the simulation (in a range from 10 mHz to 3 kHz). Waveforms: Raw EEG channel 1 signal (Vch1—blue), Raw EEG reference channel signal (Vchref—green), Ground truth EEG signal magnified 300 times (Veeg—pink), Output of the EEG circuit (Vout—cyan), Output of the instrumentation amplifier (Vvo—red). This picture presents the same experiment segment limited from 0.4 to 3 s as Figure 20.
Applsci 14 06886 g024
Figure 25. Frequency response of the simulation (in a range from 10 mHz to 3 kHz). Waveforms: Raw EEG channel 1 signal (Vch1—blue), Raw EEG reference channel signal (Vchref—green), Ground truth EEG signal magnified 300 times (Veeg—pink), Output of the EEG circuit (Vout—cyan), Output of the instrumentation amplifier (Vvo—red).
Applsci 14 06886 g025
Table 1. Requirements and specifications in the novel proposed EEG.
Common Mode Rejection Ratio (CMRR)Circuit BandwidthSignal QualityCommon Mode Rejection Ratio (CMRR)
Greater than 90 dB0.5 Hz to 20 kHz
Noise within 0.1 to 10 Hz: Below 500 nVpp root mean square noise
Specialized Focus: 4 Hz to 30 Hz
High Input Resistance: Max current < 10 µV
Cost-effective.
Encourages research and home use.
Maintains high-quality signal integrity.
Simplifies system without complicated techniques such as chopping.
Table 2. Comparison of requirements and specifications of the performed simulations.
Requirements/SpecificationsCase “1” [47]Case “2” [48]Case “3” [49]Proposed Circuit EEG Design
Common Mode Rejection Ratio (CMRR)>120 dB140 dBEstimated at 110 dBGreater than 90 dB below 110 Hz
Circuit Bandwidth0.3 to 40 Hz3.5 MHz0.5 to 33.86 Hz0.5 Hz to 48 kHz min
(0.5 Hz to 21 kHz min 0 dB passband)
Signal Quality (Gain and Noise)
Gain: 25,000 V/V
Noise: absence of noise data
Notch depth: 48 dB at 50 Hz
Gain: variable 40.9 K to 10,580 K V/V
Noise: Vpp noise in 0.1 Hz to 10 Hz is 50 nV before amplification
Notch depth: -
Gain: 64,000 V/V
Noise: pre-amplification error: 0.74%
post-amplification error: 1.75%
Notch depth: absence of depth data
Gain: 300 V/V
Noise: Vpp noise in 0.1 Hz to 10 Hz is 1.4887 µVrms before amplification
Notch depth: 48 dB at 50 Hz
Table 3. Examination of case limitations and proposed design innovations.
Circuits
Comparison
Case “1” [47]
Limitation
Case “2” [48]
Limitation
Case “3” [49]
Limitation
Proposed Circuit EEG Design Innovation
Point of interest
Notch only at 50 Hz not 60 Hz
No notch at 50 Hz or 60 Hz
Notch only at 50 Hz not 60 Hz
Notch either at 50 Hz or 60 Hz, depending on the environment
No test for strong muscle artifacts
Sufficient muscle artifacts handling
No ESD protection
No ESD protection
No ESD protection
ESD protection
Not tested for compliance with the safety standards for current
Compliance with the safety standards for current
No input test data provided
Input test data provided but no data with compound muscle movement artifacts
No input test data provided
Complete human body and EMI simulation
Test with data with compound muscle movement artifacts
Disclaimer/Publisher’s Note: The statements, opinions and data contained in all publications are solely those of the individual author(s) and contributor(s) and not of MDPI and/or the editor(s). MDPI and/or the editor(s) disclaim responsibility for any injury to people or property resulting from any ideas, methods, instructions or products referred to in the content.

