
Use of Geomatic Techniques to Determine the Influence of Climate Change on the Evolution of the Doñana Salt Marshes’ Flooded Area between 2009 and 2020


Abstract
1. Introduction
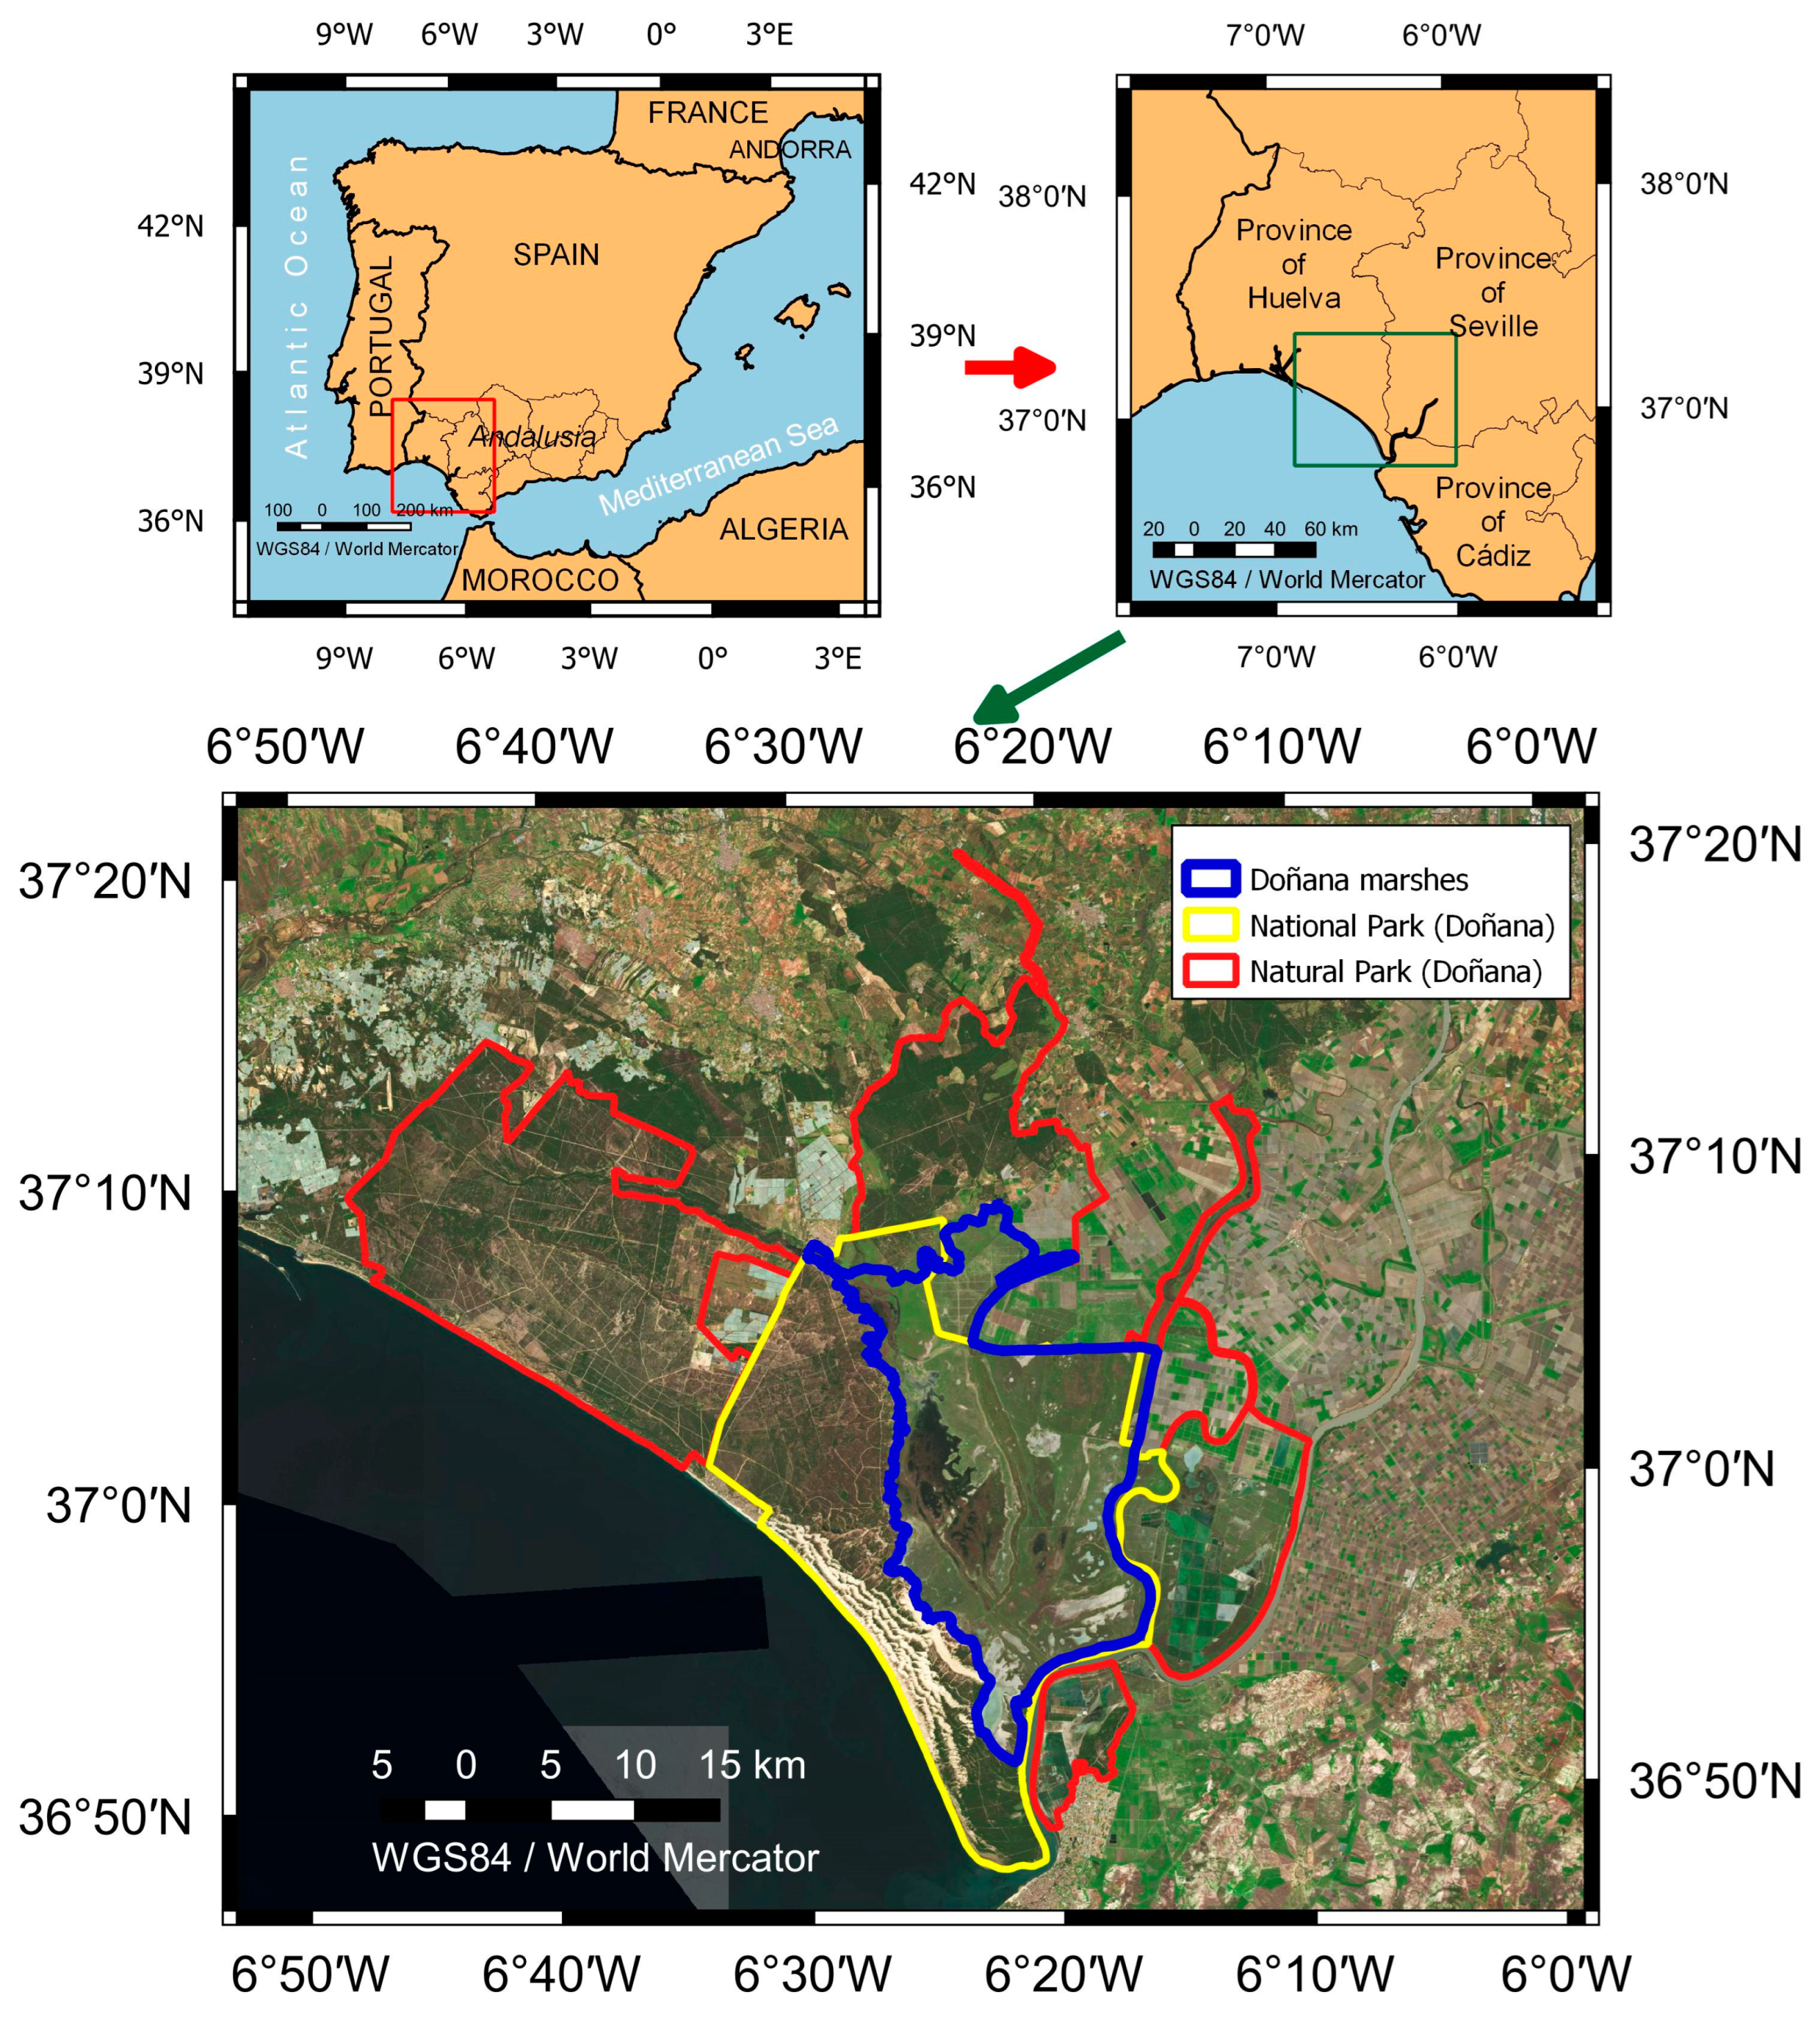
2. Study Area
2.1. Study Area and General Characteristics
2.2. The Development and Evolution of the Doñana Salt Marshes
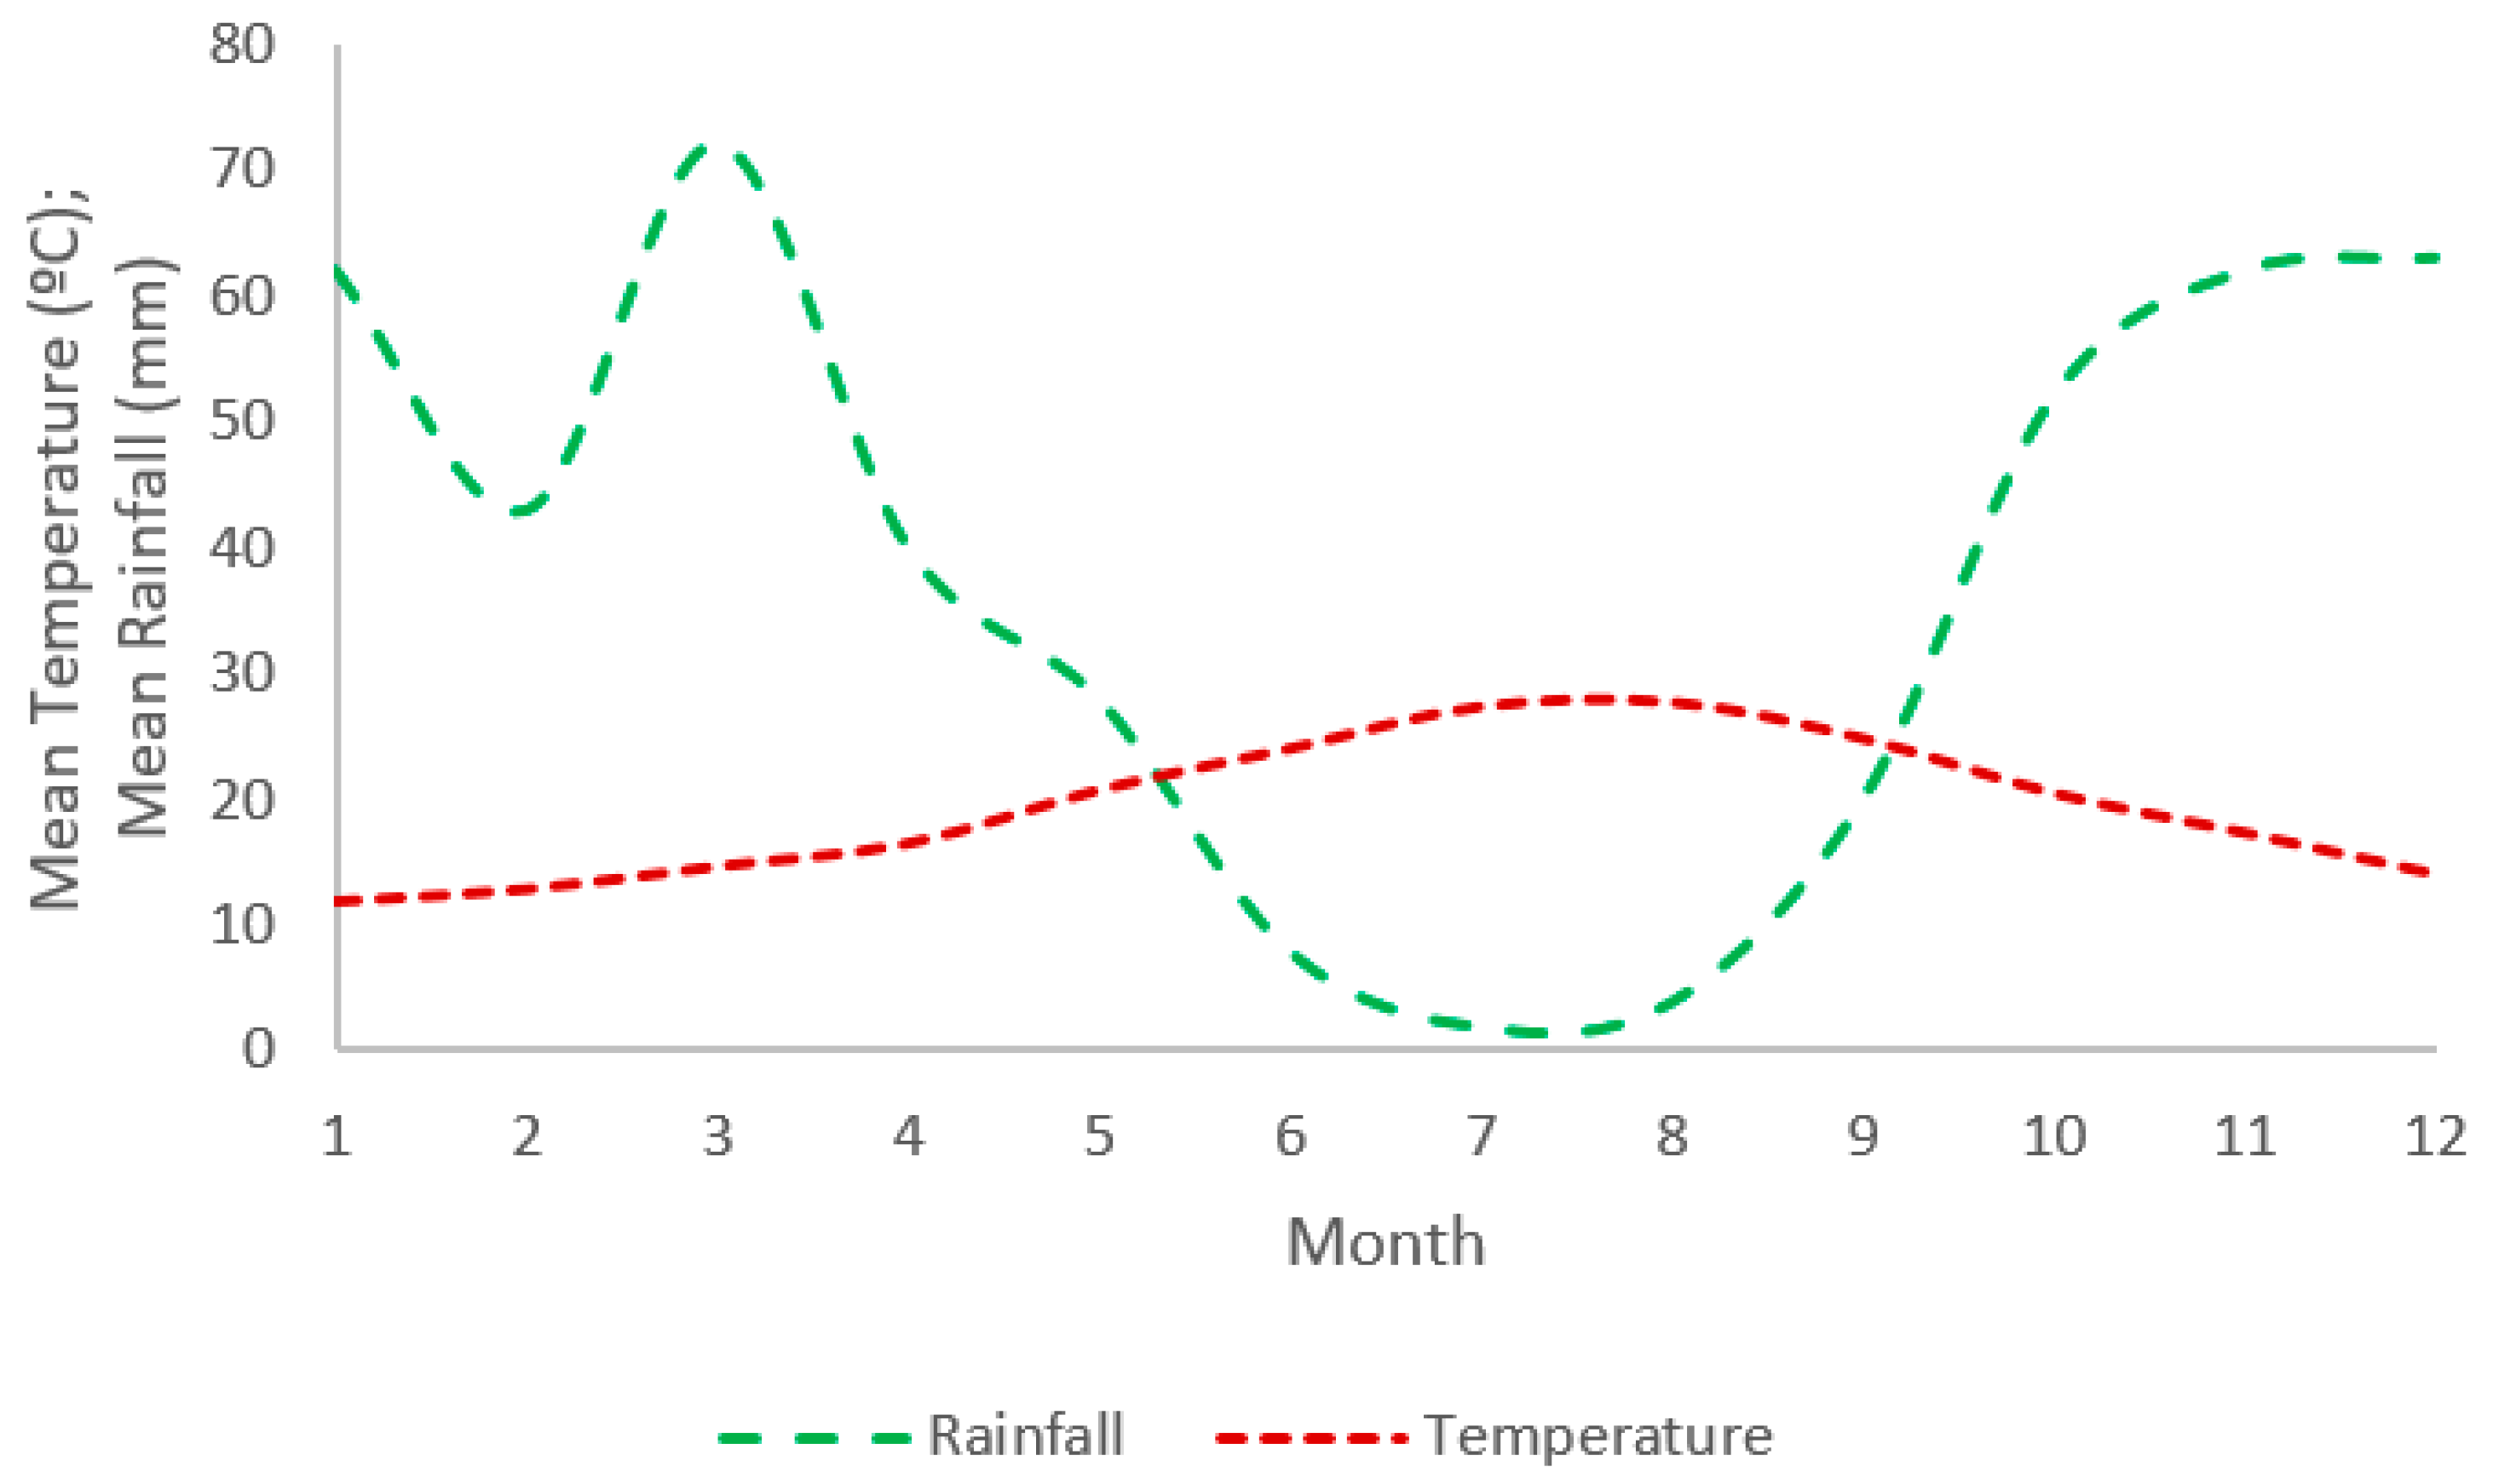
2.3. The Climatic Importance of the Doñana Salt Marshes
2.4. The Geological and Hydrogeological Importance of the Doñana Salt Marshes
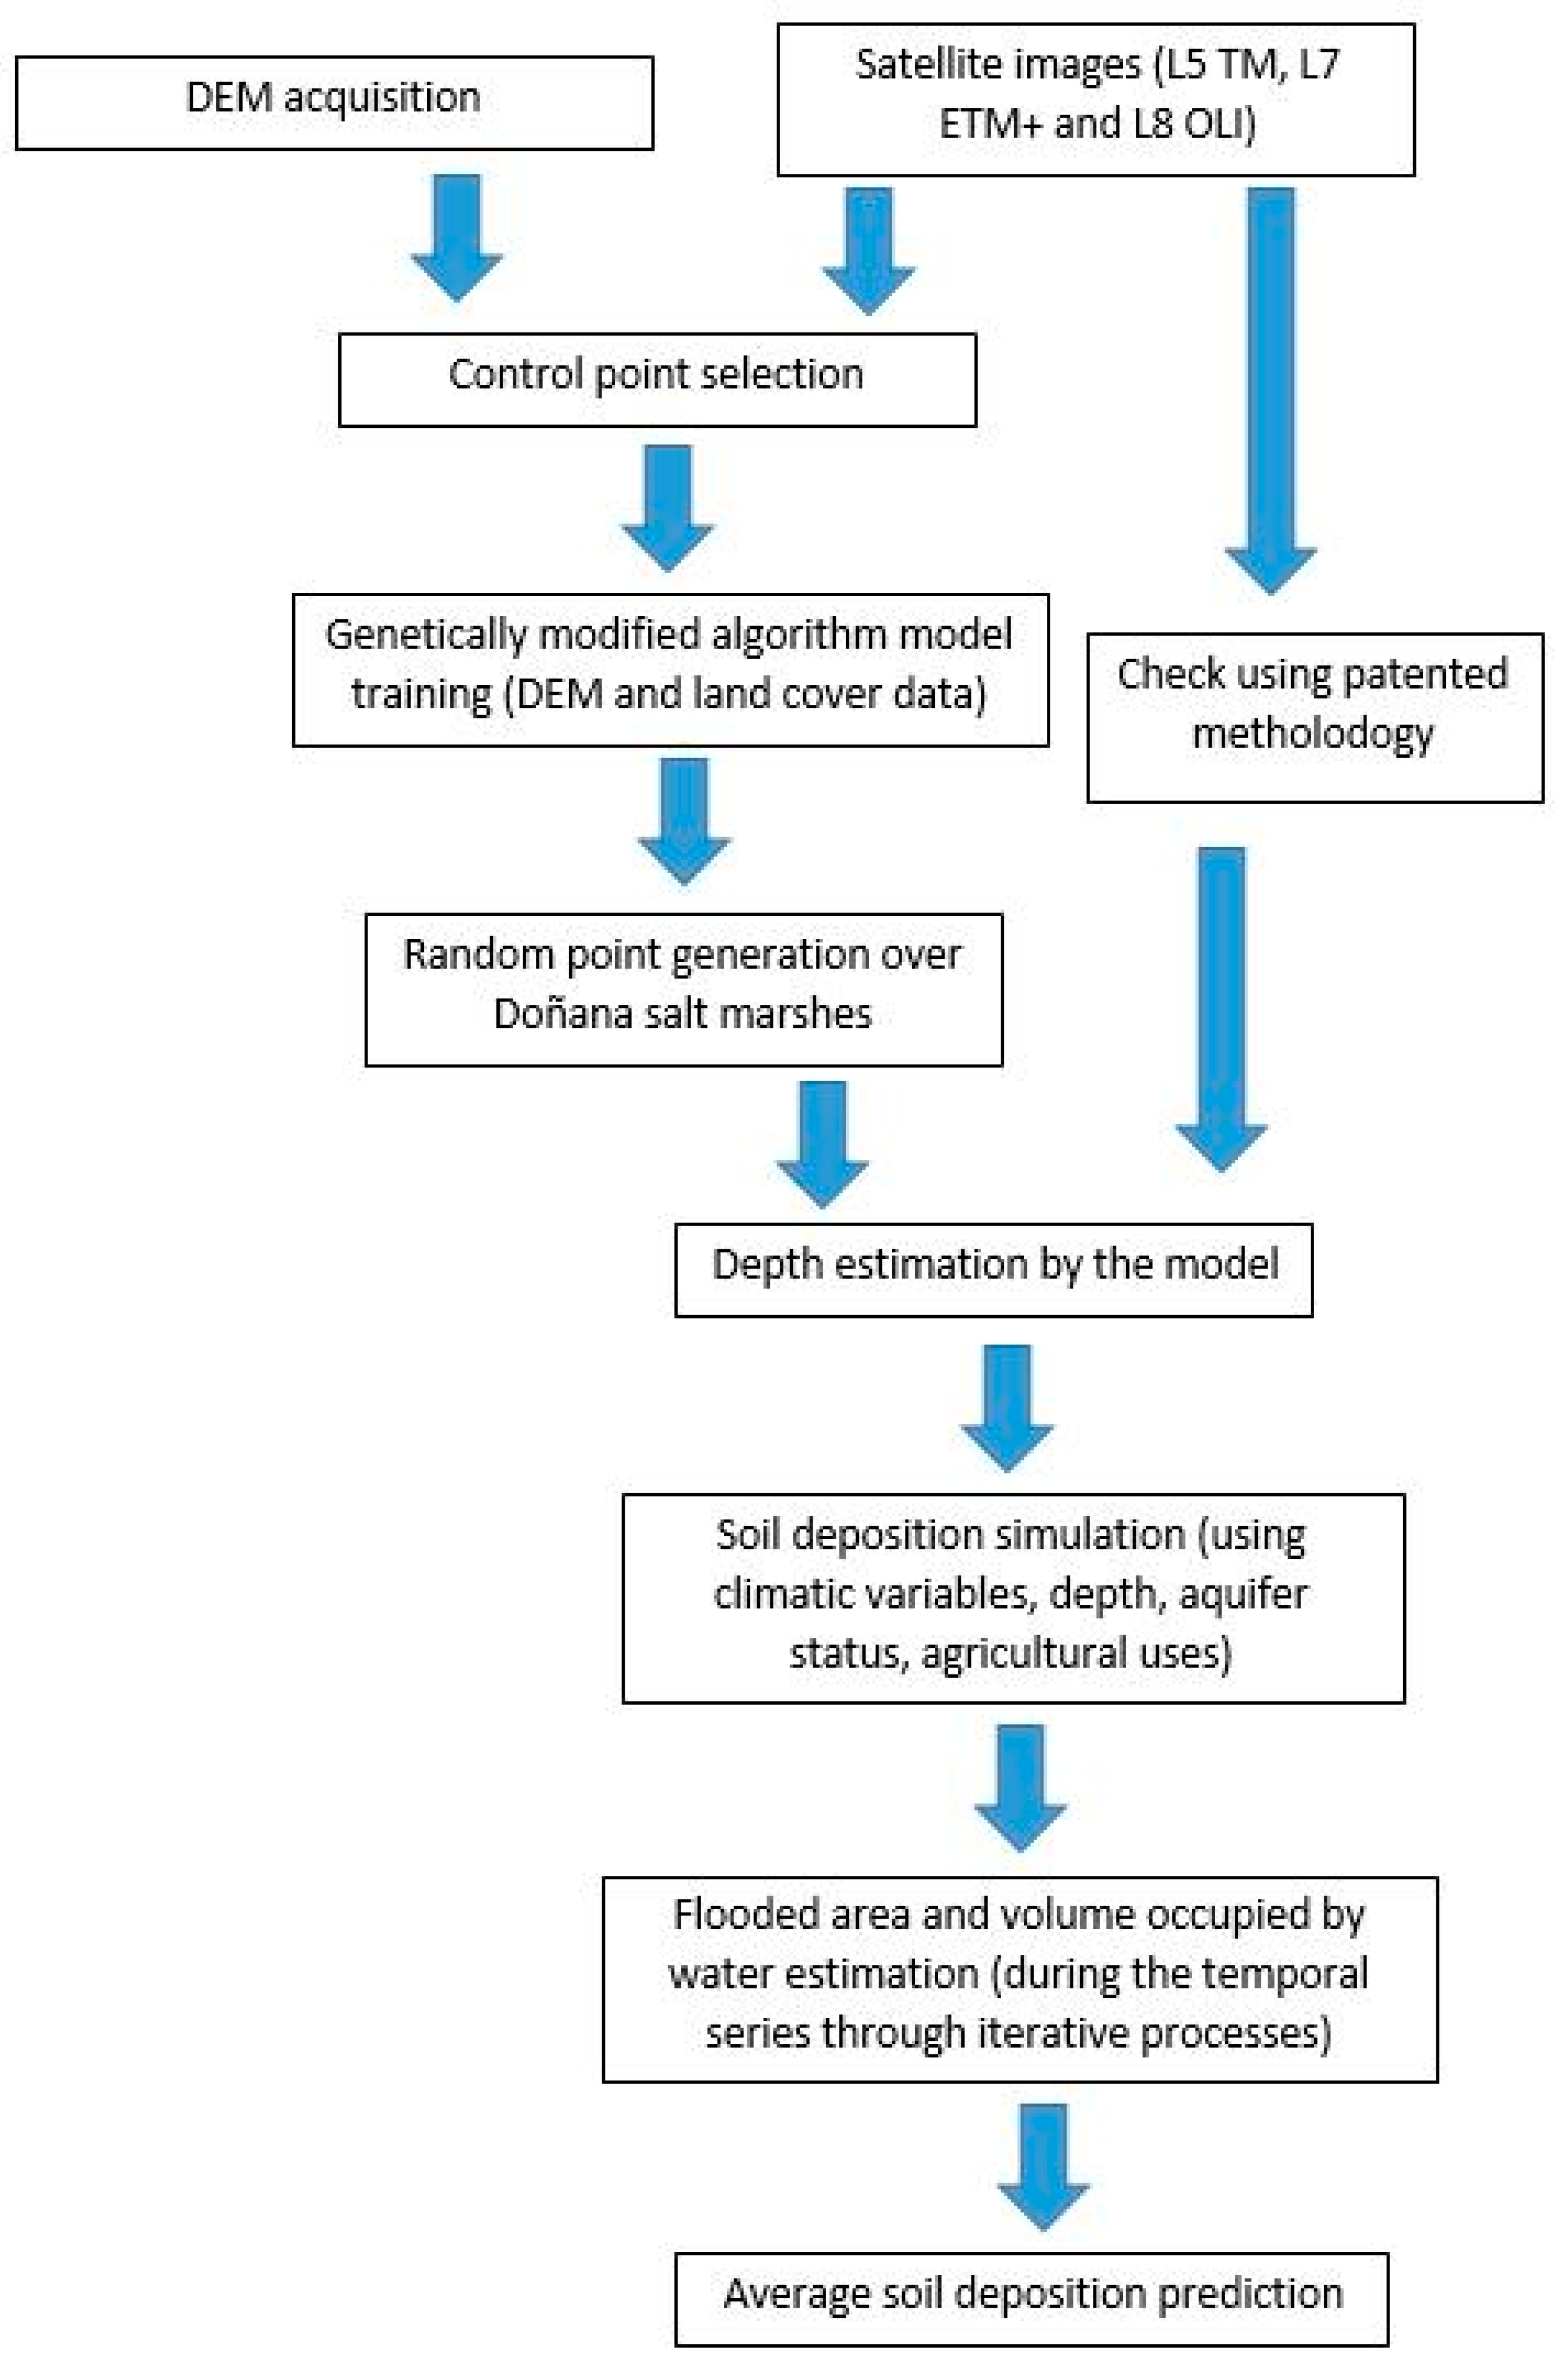
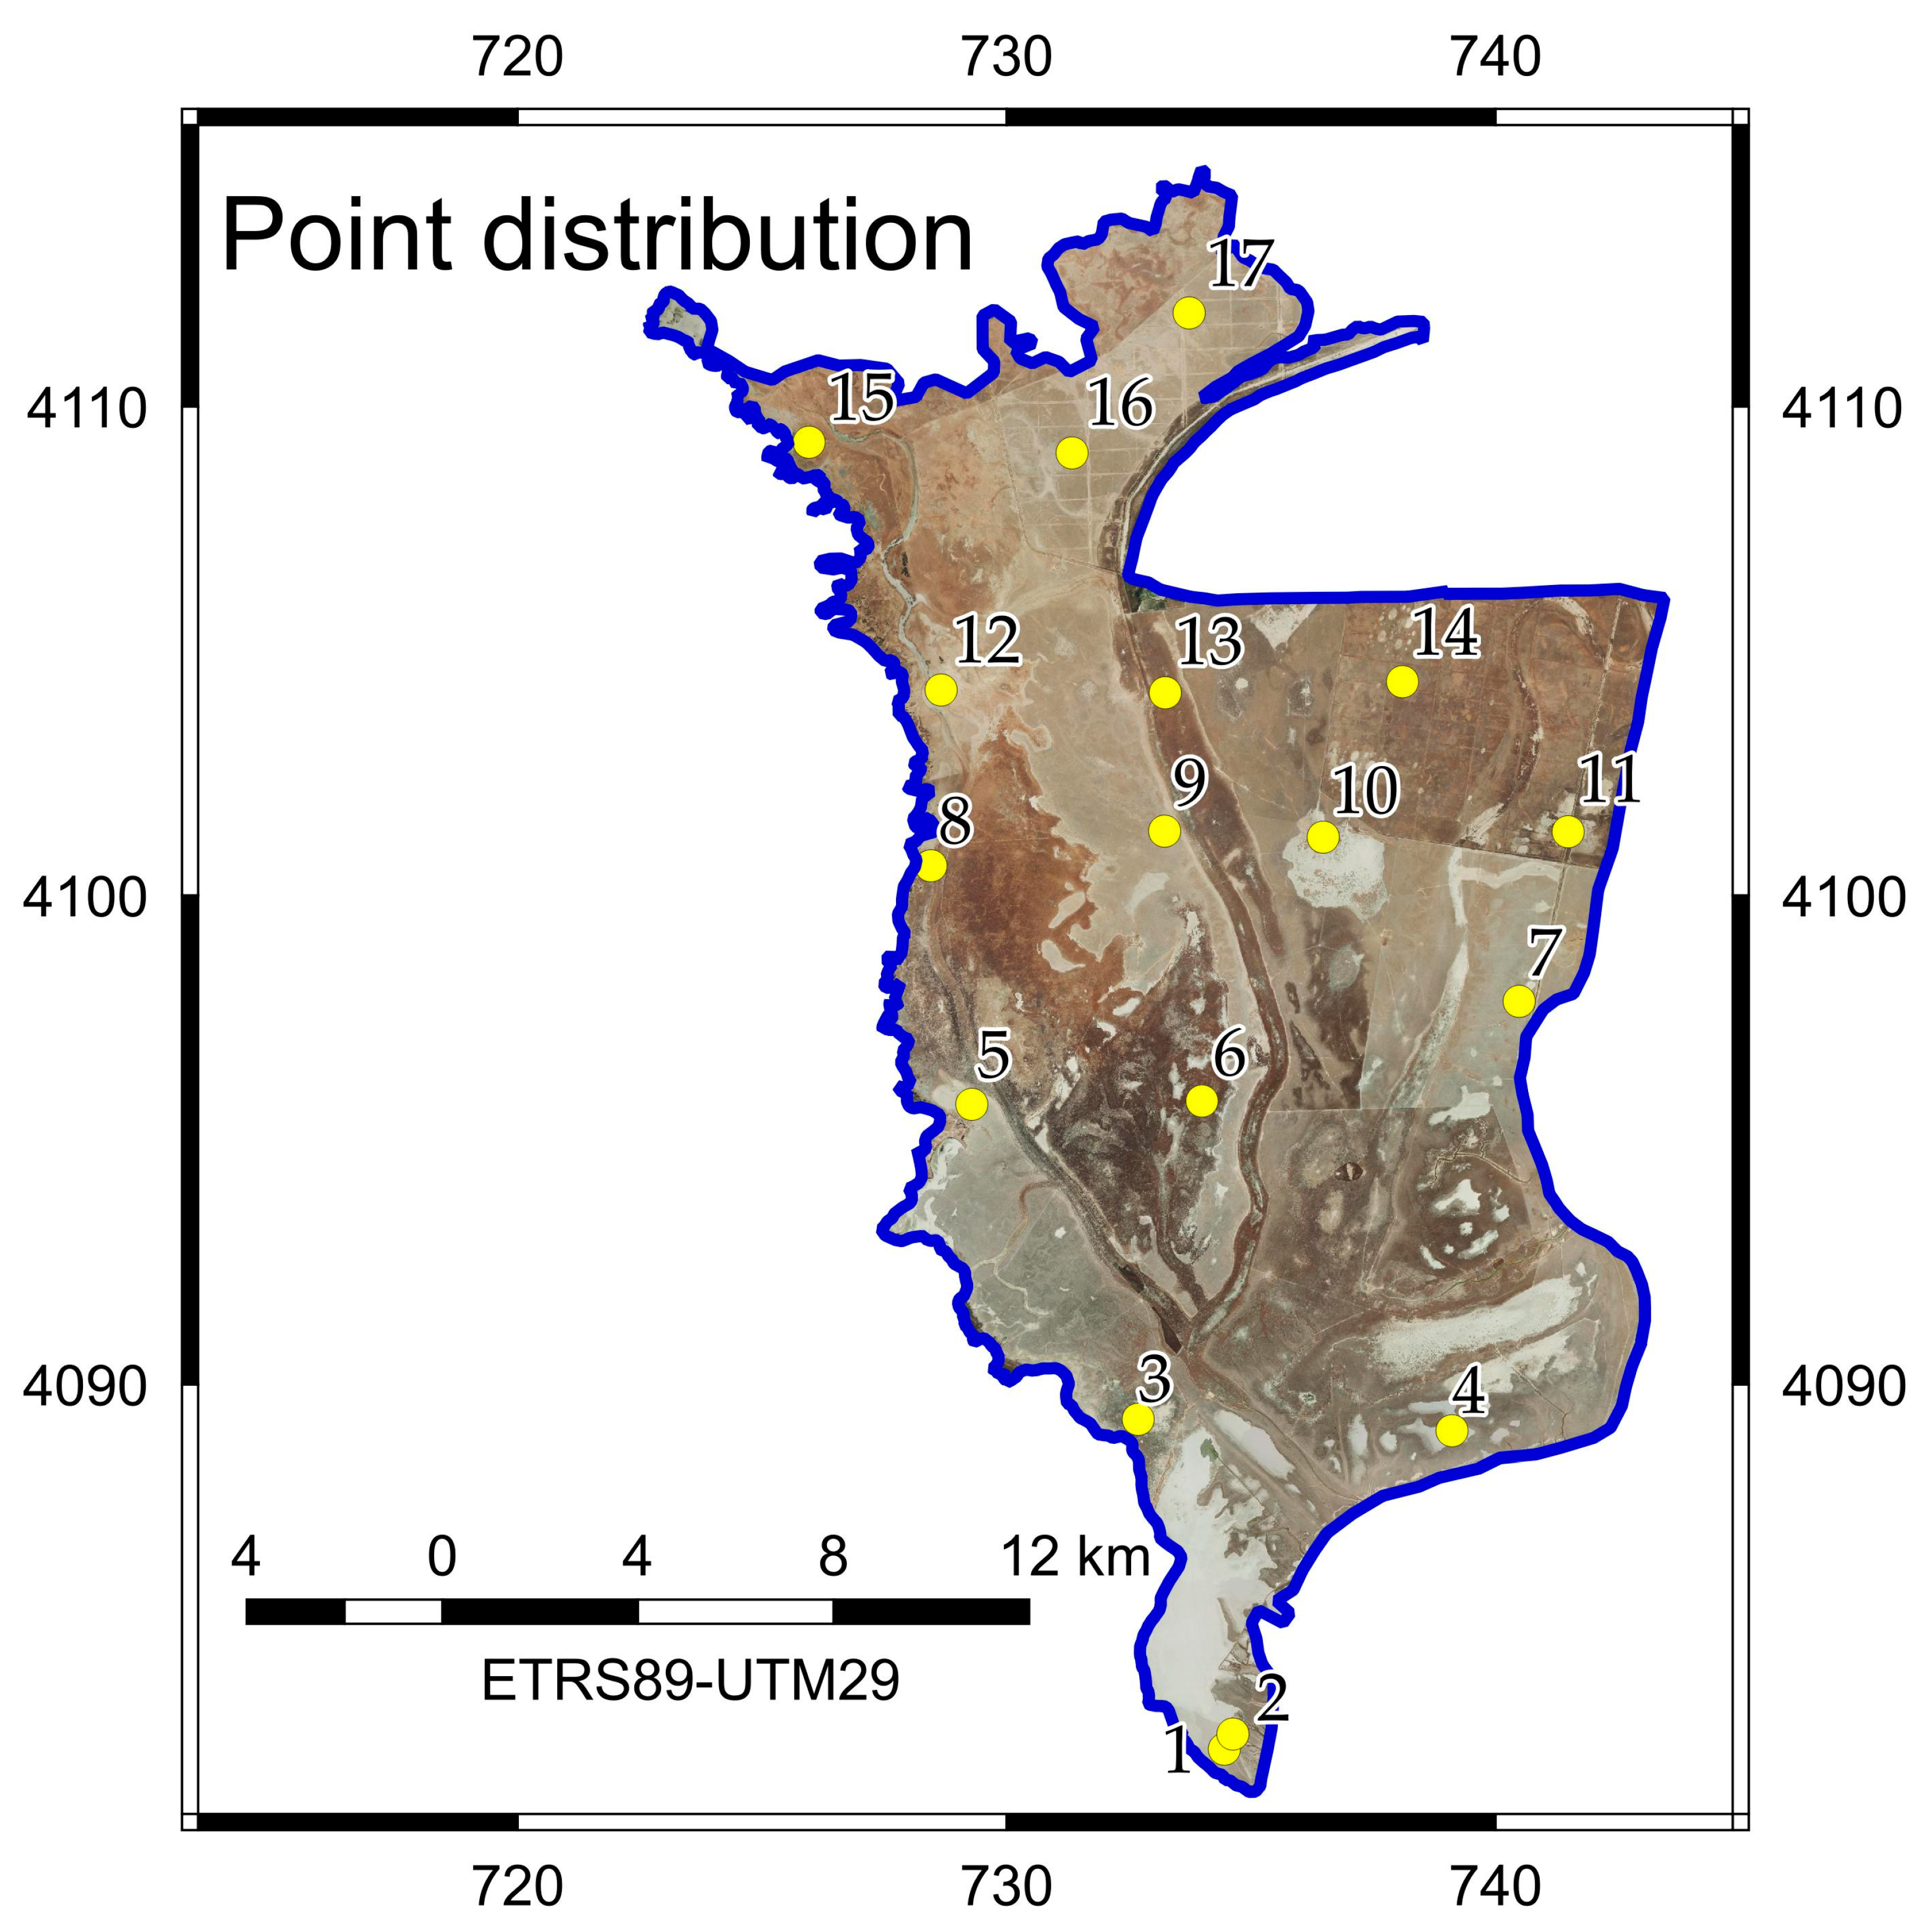
3. Methodology
Data Source Description
4. Results
4.1. DEM Usage and Land Use Changes
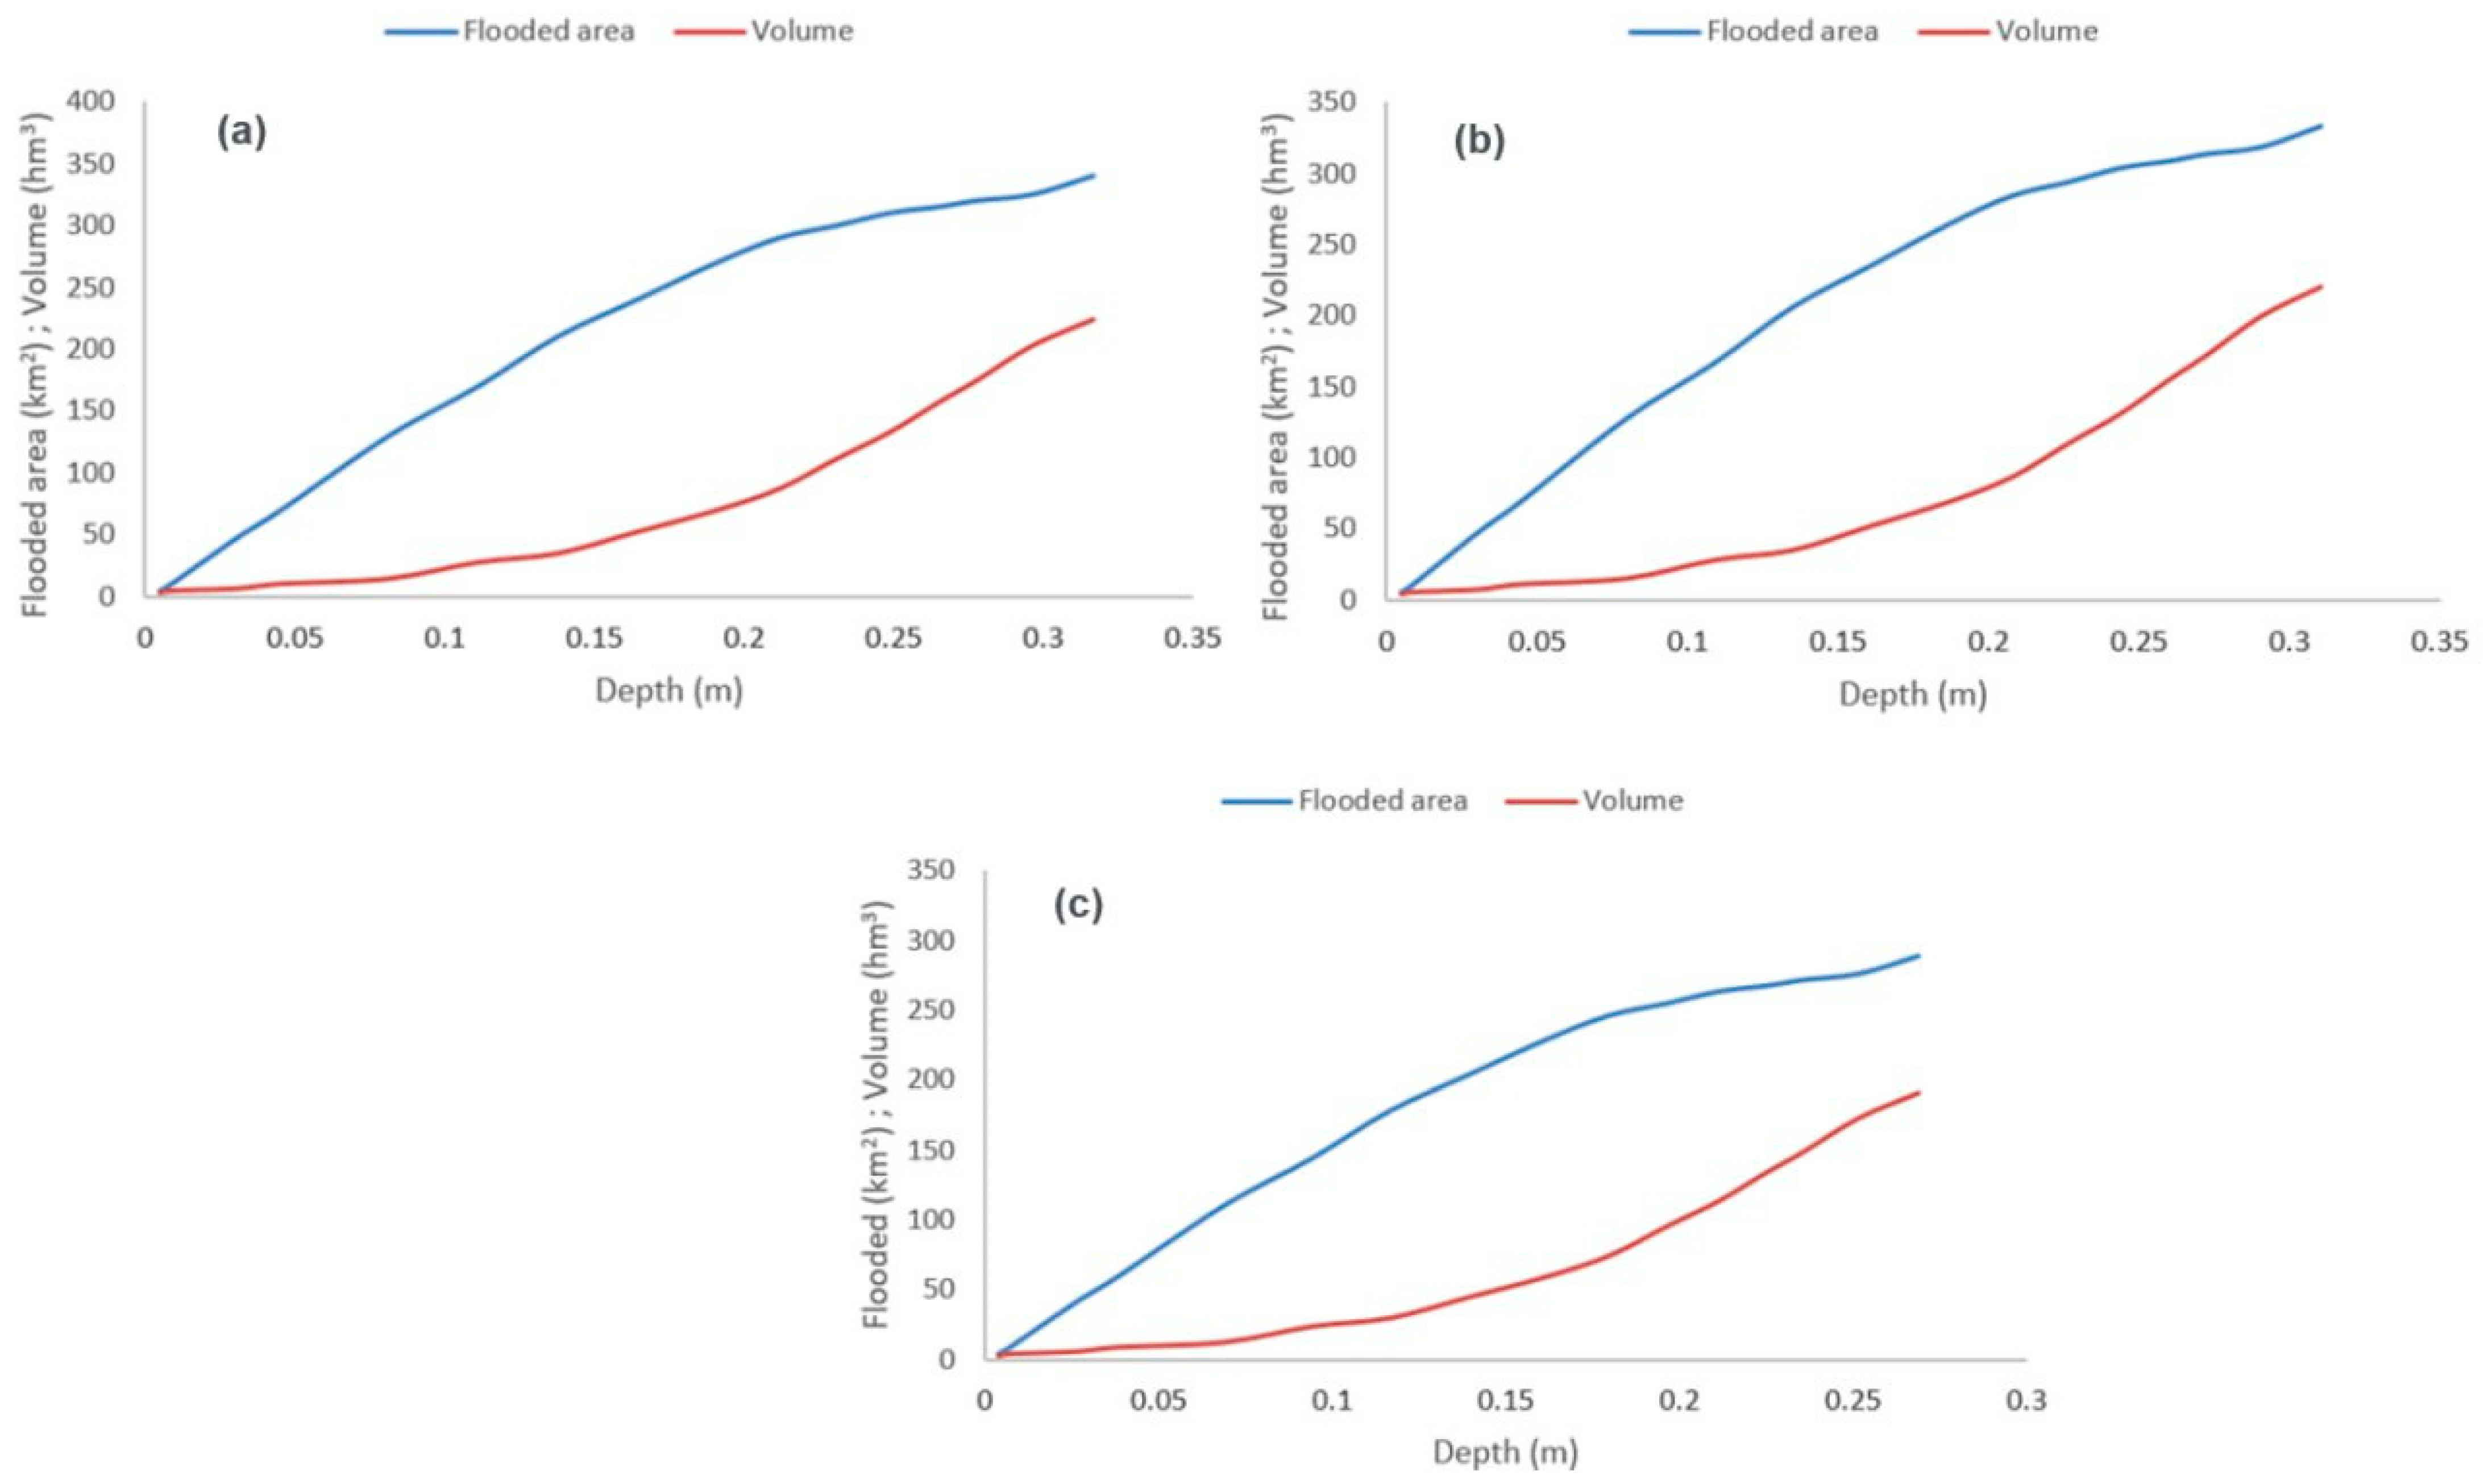
4.2. Prediction of Flooded Area and Volume
5. Discussion
Comparison with Existing Methods
6. Conclusions
Author Contributions
Funding
Institutional Review Board Statement
Informed Consent Statement
Data Availability Statement
Conflicts of Interest
References
- Quintero-Uribe, L.C.; Navarro, L.M.; Pereira, H.M.; Fernández, N. Participatory scenarios for restoring European landscapes show a plurality of nature values. Ecography 2022, 2022, e06292. [Google Scholar] [CrossRef]
- Meacham, M.; Norström, A.V.; Peterson, G.D.; Andersson, E.; Bennett, E.M.; Biggs, R.; Crouzat, E.; Cord, A.F.; Enfors, E.; Felipe-Lucia, M.R.; et al. Advancing research on ecosystem service bundles for comparative assessments and synthesis. Ecosyst. People 2022, 18, 99–111. [Google Scholar] [CrossRef]
- Ronkin, V.; Tokarsky, V.; Polchaninova, N.; Atemasov, A.; Koshkina, A.; Savchenko, G. Comparative Assessment of Ecological Plasticity of the Steppe Marmot Between Ukrainian and Kazakhstan Populations: Challenges of the Man-Induced Environmental Changes. Front. Ecol. Evol. 2020, 8, 219. [Google Scholar] [CrossRef]
- Umgiesser, G. The impact of operating the mobile barriers in Venice (MOSE) under climate change. J. Nat. Conserv. 2020, 54, 125783. [Google Scholar] [CrossRef]
- McMichael, C.; Kothari, U.; McNamara, K.E.; Arnall, A. Spatial and temporal ways of knowing sea level rise: Bringing together multiple perspectives. WIREs Clim. Chang. 2021, 12, e703. [Google Scholar] [CrossRef]
- Paredes, I.; Ramírez, F.; Aragonés, D.; Bravo, M.Á.; Forero, M.G.; Green, A.J. Ongoing anthropogenic eutrophication of the catchment area threatens the Doñana World Heritage Site (South-west Spain). Wetl. Ecol. Manag. 2021, 29, 41–65. [Google Scholar] [CrossRef]
- Camacho, C.; Negro, J.J.; Elmberg, J.; Fox, A.D.; Nagy, S.; Pain, D.J.; Green, A.J. Groundwater extraction poses extreme threat to Doñana World Heritage Site. Nat. Ecol. Evol. 2022, 6, 654–655. [Google Scholar] [CrossRef]
- Adeli, S.; Salehi, B.; Mahdianpari, M.; Quackenbush, L.J.; Brisco, B.; Tamiminia, H.; Shaw, S. Wetland Monitoring Using SAR Data: A Meta-Analysis and Comprehensive Review. Remote Sens. 2020, 12, 2190. [Google Scholar] [CrossRef]
- Zhang, W.; Liu, Y.; Tang, W.; Wang, W.; Liu, Z. Assessment of the effects of natural and anthropogenic drivers on extreme flood events in coastal regions. Stoch. Environ. Res. Risk Assess. 2023, 37, 697–715. [Google Scholar] [CrossRef]
- Ramos-Fuertes, A.; Prats, J.; Dolz, J. Balances de agua y calor en la marisma de Doñana. Ing. Agua 2016, 20, 169. [Google Scholar] [CrossRef]
- León-Palmero, E. Understanding the fluxes of greenhouse gases in reservoirs under the inspiration of Margalef. Limnetica 2023, 42, 302–328. [Google Scholar] [CrossRef]
- Rashid, I.; Aneaus, S.; Dar, S.A.; Javed, O.; Khanday, S.A.; Bhat, S.U. A novel GIS-based multicriteria analysis approach for ascertaining the catchment-scale degradation of a Himalayan wetland. Environ. Res. 2023, 229, 115967. [Google Scholar] [CrossRef] [PubMed]
- Varughese, A.R.; Mathew, V. Climate change, flooding woes and mass exodus of inhabitants: An analysis of Kuttanad wetland ecosystem in Kerala, India. GeoJournal 2023, 88, 6317–6338. [Google Scholar] [CrossRef]
- García-Barrón, L.; Aguilar-Alba, M.; Morales, J.; Sousa, A. Classification of the flood severity of the Guadalquivir River in the Southwest of the Iberian Peninsula during the 13th to 19th centuries. Atmósfera 2022, 36, 1–21. [Google Scholar] [CrossRef]
- Ramírez-Juidías, E.; Villavicencio-Valero, K.; Borja, A. Sedimentation and Proposed Algorithms to Detect the Possible Existence of Vegetation and Humidity in the Landing Area of the Mars Exploration Rover-B (Opportunity). In Solar System Planets and Exoplanets; IntechOpen: London, UK, 2021. [Google Scholar]
- Tiengo, R.; Palácios-Orueta, A.; Uchôa, J.; Gil, A. Remote sensing approaches for land use/land cover change in coastal areas and oceanic islands: An open science-based systematic review. Rev. Gestão Costeira Integr. 2023, 23, 155–177. [Google Scholar] [CrossRef]
- Sulaiman, M.; Finnesand, E.; Farmanbar, M.; Belbachir, A.N.; Rong, C. Building Precision: Efficient Encoder–Decoder Networks for Remote Sensing Based on Aerial RGB and LiDAR Data. IEEE Access 2024, 12, 60329–60346. [Google Scholar] [CrossRef]
- Mack, S.K.; Lane, R.R.; Deng, J.; Morris, J.T.; Bauer, J.J. Wetland carbon models: Applications for wetland carbon commercialization. Ecol. Model. 2023, 476, 110228. [Google Scholar] [CrossRef]
- Martins, D.; Alves da Silva, A.; Duarte, J.; Canário, J.; Vieira, G. Changes in Vessel Traffic Disrupt Tidal Flats and Saltmarshes in the Tagus Estuary, Portugal. Estuaries Coasts 2023, 46, 1141–1156. [Google Scholar] [CrossRef]
- Zhao, K.; Coco, G.; Gong, Z.; Darby, S.E.; Lanzoni, S.; Xu, F.; Zhang, K.; Townend, I. A Review on Bank Retreat: Mechanisms, Observations, and Modeling. Rev. Geophys. 2022, 60, e2021RG000761. [Google Scholar] [CrossRef]
- Ramírez-Juidías, E. Sedimentation Processes in the Tinto and Odiel Salt Marshes in Huelva, Spain. In Sedimentation Engineering; InTech: London, UK, 2018. [Google Scholar]
- Ramírez-Juidias, E.; Amaro-Mellado, J.-L. Prediction of Erosive Processes in the Río Piedras and Flecha de El Rompido Salt Marsh (Huelva, Spain) Using Iterative Models and GIS. Limnol. Rev. 2023, 23, 190–202. [Google Scholar] [CrossRef]
- García-López, S.; Vélez-Nicolás, M.; Martínez-López, J.; Sánchez-Bellón, A.; Pacheco-Orellana, M.J.; Ruiz-Ortiz, V.; Muñoz-Pérez, J.J.; Barbero, L. Using UAV Photogrammetry and Automated Sensors to Assess Aquifer Recharge from a Coastal Wetland. Remote Sens. 2022, 14, 6185. [Google Scholar] [CrossRef]
- Ramírez-Juidías, E. Uso de imágenes satélites para el estudio de los procesos de erosión en las marismas de Isla Cristina (Huelva). South Fla. J. Dev. 2021, 2, 4828–4836. [Google Scholar] [CrossRef]
- Mitchell, M.; Herman, J.; Hershner, C. Evolution of Tidal Marsh Distribution under Accelerating Sea Level Rise. Wetlands 2020, 40, 1789–1800. [Google Scholar] [CrossRef]
- Flor-Blanco, G.; Alcántara-Carrió, J.; Jackson, D.W.T.; Flor, G.; Flores-Soriano, C. Coastal erosion in NW Spain: Recent patterns under extreme storm wave events. Geomorphology 2021, 387, 107767. [Google Scholar] [CrossRef]
- Rios, N.N.; Ginesta Torcivia, C.; Onorato, M.R.; Cortez Taillant, V.; Esper Angillieri, M.Y. Morphometry of a Central Andean basin, San Juan, Argentina: Assessment of conditional factors to the occurrence of flash floods. Andean Geol. 2024, 51, 194. [Google Scholar] [CrossRef]
- Geremew, B.; Tadesse, T.; Bedadi, B.; Gollany, H.T.; Tesfaye, K.; Aschalew, A. Impact of land use/cover change and slope gradient on soil organic carbon stock in Anjeni watershed, Northwest Ethiopia. Environ. Monit. Assess. 2023, 195, 971. [Google Scholar] [CrossRef] [PubMed]
- Zhang, X.; Fang, C.; Wang, Y.; Lou, X.; Su, Y.; Huang, D. Review of Effects of Dam Construction on the Ecosystems of River Estuary and Nearby Marine Areas. Sustainability 2022, 14, 5974. [Google Scholar] [CrossRef]
- Ramírez-Juidias, E.; Pozo-Morales, L.; Galán-Ortiz, L. Procedimiento para la Obtención de una Imagen Teledetectada a Partir de Fotografía. Spanish Patent ES2537783B2, 12 June 2015. [Google Scholar]
- EarthData (NASA) Shuttle Radar Topography Mission (SRTM). Available online: https://www.earthdata.nasa.gov/sensors/srtm (accessed on 15 April 2024).
- Ramírez-Juidías, E.; Víquez-Urraco, F.; Noguero-Hernández, D. Sedimentary processes in the Isla Cristina salt-marshes: Geomorphological changes of landscape. Ocean Coast. Manag. 2017, 143, 148–153. [Google Scholar] [CrossRef]
- Feagin, R.A.; Chang, K.-A.; Huff, T.P.; Rodriguez-Iturbe, I.; Kim, J.-Y.; Kaihatu, J.; Leonardi, N.; Fagherazzi, S. An asymmetry in wave scaling drives outsized quantities of coastal wetland erosion. Sci. Adv. 2023, 9, eadj2602. [Google Scholar] [CrossRef]
- Centro Nacional de Información Geográfica Download Center. Available online: http://centrodedescargas.cnig.es/CentroDescargas/locale?request_locale=en (accessed on 15 May 2024).
- Green, A.J.; Guardiola-Albert, C.; Bravo-Utrera, M.Á.; Bustamante, J.; Camacho, A.; Camacho, C.; Contreras-Arribas, E.; Espinar, J.L.; Gil-Gil, T.; Gomez-Mestre, I.; et al. Groundwater Abstraction has Caused Extensive Ecological Damage to the Doñana World Heritage Site, Spain. Wetlands 2024, 44, 20. [Google Scholar] [CrossRef]
- Mayoral, E.; Díaz-Martínez, I.; Duveau, J.; Santos, A.; Ramírez, A.R.; Morales, J.A.; Morales, L.A.; Díaz-Delgado, R. Tracking late Pleistocene Neandertals on the Iberian coast. Sci. Rep. 2021, 11, 4103. [Google Scholar] [CrossRef] [PubMed]
- Recio, J.M.; Díaz-delOlmo, F.; Borja, C.; Cámara, R.; Borja, F. Soil formation and hydrological evolution of Navazo del Toro small-lake ecosystem, Doñana National Park, Andalusia, Spain. Ecol. Noospherol. 2023, 34, 3–13. [Google Scholar] [CrossRef] [PubMed]
- Rodríguez Ramírez, A.; Yáñez Camacho, C.; Gascó, C.; Clemente Salas, L.; Antón, M.P. Natural and antropic sedimentation rates in the salt marsh of the Doñana National Park: Implications for their handling and conservation. Cuaternario Geomorfol. 2005, 19, 37–48. [Google Scholar]
- Junta de Andalucía. Análisis de la Evolución Futura Bajo Escenarios de Cambio Climático de las Variables Climáticas y de las Variables Derivadas; Junta de Andalucía: Seville, Spain, 2022.
- Confederación Hidrográfica del Guadalquivir; Ministerio para la Transmisión Ecológica y el Reto Demográfico (Gobierno de España). Informe de Estado de los Acuíferos del Entorno de Doñana. Año Hidrológico 2022–2023; Ministerio para la Transición Ecológica y el Reto Demográfico: Seville, Spain, 2024.
- Abril, J.-M.; Periáñez, R.; Escacena, J.-L. Modeling tides and tsunami propagation in the former Gulf of Tartessos, as a tool for Archaeological Science. J. Archaeol. Sci. 2013, 40, 4499–4508. [Google Scholar] [CrossRef]
- Instituto Geográfico Nacional PNOA-LiDAR. Available online: https://pnoa.ign.es/web/portal/pnoa-lidar/presentacion (accessed on 10 June 2023).
- Matgen, P.; Schumann, G.; Henry, J.-B.; Hoffmann, L.; Pfister, L. Integration of SAR-derived river inundation areas, high-precision topographic data and a river flow model toward near real-time flood management. Int. J. Appl. Earth Obs. Geoinf. 2007, 9, 247–263. [Google Scholar] [CrossRef]
- Ramírez-Juidias, E.; Madueño-Luna, A.; Madueño-Luna, J.M.; López-Gordillo, M.C.; Leiva-Piedra, J.L. Applying Remote Sensing Methods to Estimate Alterations in Land Cover Change and Degradation in the Desert Regions of the Southeast Iberian Peninsula. Remote Sens. 2023, 15, 3984. [Google Scholar] [CrossRef]
- Climate Research Group (University of Seville, S. Global Climate Monitor). Available online: http://www.globalclimatemonitor.org/# (accessed on 1 May 2024).
- Phinzi, K.; Ngetar, N.S. The assessment of water-borne erosion at catchment level using GIS-based RUSLE and remote sensing: A review. Int. Soil Water Conserv. Res. 2019, 7, 27–46. [Google Scholar] [CrossRef]
- Romero Pichardo, F. GIS applied to the evaluation of the influence of changes in vegetable coverage on the erosive processes in the basins of the Rocina and Partido streams (Huelva-Spain). Mapping 2019, 195, 44–54. [Google Scholar]
- Ojeda Rivera, J.F.; del Moral Ituarte, L. Water perceptions and management patterns over the different stages of Doñana’s conformation. Investig. Geográficas 2004, 35, 25–44. [Google Scholar] [CrossRef]
- The European Space Agency. Available online: www.esa.int (accessed on 19 July 2024).
- Sousa, A.; García-Murillo, P.; Sahin, S.; Morales, J.; García-Barrón, L. Wetland place names as indicators of manifestations of recent climate change in SW Spain (Doñana Natural Park). Clim. Chang. 2010, 100, 525–557. [Google Scholar] [CrossRef]
- EOS Data Analytics LandViewer. Available online: https://eos.com/landviewer/ (accessed on 23 June 2024).
- EOS Data Analytics Index Stack (NDVI, NDWI, NDSI). Available online: https://eos.com/make-an-analysis/index-stack/ (accessed on 23 June 2024).
- WWF. Doñana, un Acuífero en Alerta Roja. Análisis del “Informe del Estado de los Acuíferos del Entorno de Doñana. Año Hidrológico 2017–2018” de la Confederación Hidrográfica del Guadalquivir; WWF: Seville, Spain, 2019. [Google Scholar]


| Control Point | Water Depth (m) (2009) | Water Depth (m) (2013) | Water Depth (m) (2020) |
|---|---|---|---|
| 1 | 0.005 | 0.005 | 0.004 |
| 2 | 0.008 | 0.008 | 0.007 |
| 3 | 0.017 | 0.017 | 0.015 |
| 4 | 0.032 | 0.031 | 0.027 |
| 5 | 0.045 | 0.044 | 0.038 |
| 6 | 0.081 | 0.080 | 0.069 |
| 7 | 0.111 | 0.109 | 0.094 |
| 8 | 0.137 | 0.135 | 0.117 |
| 9 | 0.164 | 0.161 | 0.139 |
| 10 | 0.191 | 0.187 | 0.162 |
| 11 | 0.212 | 0.208 | 0.180 |
| 12 | 0.231 | 0.227 | 0.196 |
| 13 | 0.249 | 0.244 | 0.211 |
| 14 | 0.265 | 0.260 | 0.225 |
| 15 | 0.278 | 0.272 | 0.236 |
| 16 | 0.296 | 0.290 | 0.252 |
| 17 | 0.316 | 0.310 | 0.269 |
| Mean value (m) | 0.155 | 0.152 | 0.132 |
| SS | df | MS | F | p | |
|---|---|---|---|---|---|
| Treatment (between groups) | 0.005434 | 2 | 0.002717 | 0.26 | >0.05 |
| Error | 0.510406 | ||||
| Total | 0.515840 |
| Year 2009 | Year 2013 | Year 2020 | |
|---|---|---|---|
| Mean depth (m) | 0.155 | 0.152 | 0.132 |
| Time period | 2009–2013 | 2009–2020 | 2013–2020 |
| Length (years) | 4 | 11 | 7 |
| Average depth decrease (m) | 0.003 | 0.023 | 0.020 |
| ACR (mm/year) | 0.75 | 2.10 | 2.86 |
| Year | Rainfall (mm) | MMR (mm) | MT (°C) | MMR/MT |
|---|---|---|---|---|
| 2009 | 609 | 51 | 18.7 | 2.72 |
| 2013 | 558 | 46 | 18.3 | 2.51 |
| 2020 | 420 | 33 | 18.8 | 1.86 |
| Year 2009 | Year 2013 | Year 2020 | |
|---|---|---|---|
| Mean depth (m) | 0.155 | 0.152 | 0.132 |
| Mean depth by control points (m) | 0.0133 | 0.0131 | 0.012 |
| Mean net depth | 0.1417 | 0.1389 | 0.1200 |
| Year 2009 | Year 2013 | Year 2020 | |
|---|---|---|---|
| Mean net depth (m) | 0.1417 | 0.1389 | 0.1200 |
| Favorable ACR (m/year) | 0.00075 | ||
| Years (Mean net depth/Favorable ACR) | 188.93 | 185.20 | 160.00 |
| Neutral ACR (m/year) | 0.00210 | ||
| Years (Mean net depth/Neutral ACR) | 67.48 | 66.14 | 57.14 |
| Unfavorable ACR (m/year) | 0.00286 | ||
| Years (Mean net depth/Unfavorable ACR) | 49.55 | 48.57 | 41.96 |
Disclaimer/Publisher’s Note: The statements, opinions and data contained in all publications are solely those of the individual author(s) and contributor(s) and not of MDPI and/or the editor(s). MDPI and/or the editor(s) disclaim responsibility for any injury to people or property resulting from any ideas, methods, instructions or products referred to in the content. |
© 2024 by the authors. Licensee MDPI, Basel, Switzerland. This article is an open access article distributed under the terms and conditions of the Creative Commons Attribution (CC BY) license (https://creativecommons.org/licenses/by/4.0/).
Share and Cite
Leiva-Piedra, J.L.; Ramírez-Juidias, E.; Amaro-Mellado, J.-L. Use of Geomatic Techniques to Determine the Influence of Climate Change on the Evolution of the Doñana Salt Marshes’ Flooded Area between 2009 and 2020. Appl. Sci. 2024, 14, 6919. https://doi.org/10.3390/app14166919
Leiva-Piedra JL, Ramírez-Juidias E, Amaro-Mellado J-L. Use of Geomatic Techniques to Determine the Influence of Climate Change on the Evolution of the Doñana Salt Marshes’ Flooded Area between 2009 and 2020. Applied Sciences. 2024; 14(16):6919. https://doi.org/10.3390/app14166919
Chicago/Turabian StyleLeiva-Piedra, Jorge Luis, Emilio Ramírez-Juidias, and José-Lázaro Amaro-Mellado. 2024. "Use of Geomatic Techniques to Determine the Influence of Climate Change on the Evolution of the Doñana Salt Marshes’ Flooded Area between 2009 and 2020" Applied Sciences 14, no. 16: 6919. https://doi.org/10.3390/app14166919
APA StyleLeiva-Piedra, J. L., Ramírez-Juidias, E., & Amaro-Mellado, J.-L. (2024). Use of Geomatic Techniques to Determine the Influence of Climate Change on the Evolution of the Doñana Salt Marshes’ Flooded Area between 2009 and 2020. Applied Sciences, 14(16), 6919. https://doi.org/10.3390/app14166919