Article

Analysis of Solid Backfilling Effects on Strata and Ground Subsidence in a Longwall Coal Mine Beneath a City

by
Makavelo Germain Deon
1,2,*,
Qiang Zhang
1,2,*,
Meng Li
1,2,
Peng Huang
1,2,
Zhongya Wu
1,2 and
Chano Simao Francisco
1,2,3
1
State Key Laboratory for Fine Exploration and Intelligent Development of Coal Resources, China University of Mining & Technology, Xuzhou 221116, China
2
School of Mines, China University of Mining and Technology, Xuzhou 221116, China
3
Faculty of Geosciences and Environment, Púnguè University, Manica 2202, Mozambique
*
Authors to whom correspondence should be addressed.
Appl. Sci. 2024, 14(16), 6924; https://doi.org/10.3390/app14166924
Submission received: 26 June 2024 / Revised: 31 July 2024 / Accepted: 6 August 2024 / Published: 7 August 2024
(This article belongs to the Special Issue Advanced Backfilling Technologies in Coal Mining)

Abstract

:
The solid backfilling mining method is one of the methods used to solve problems arising from strata and ground subsidence in underground mines. Through 2D physical analog modeling, 3D numerical simulation, and field measurement, the effects of the solid backfilling method were analyzed, providing a better insight into optimizing the configurations of a working face beneath a city for safety, environmental problems, and its use in production. In the physical modeling, MatchID software was employed to capture the movement characteristics of overlying strata and ground subsidence during mining and backfilling. Key parameters such as vertical displacement, subsidence characteristics, and rock mass stress variations were monitored and analyzed. In the numerical simulation, FLAC3D was used to simulate and analyze the effect of the backfill body on strata and ground subsidence above the backfill working face. For the field measurements, the Continuously Operating Reference Station (CORS) system was used to confirm the effective control of ground subsidence. With a filling ratio of 80%, the three methods are consistent and show a maximum subsidence value of 0.46 mm (physical simulation), 50.4 mm (numerical simulation), and 47 mm (experienced), significantly lower than the predicted subsidence, which is 281 mm. Therefore, this study demonstrates the reliability and scientific validity of both the physical analog modeling method and the field measurement method in measuring the efficiency of solid backfilling, providing valuable insights into strata and ground subsidence control in longwall coal mining.

1. Introduction

Over the last century, underground coal mining has progressed from using manual labor methods to more mechanized and advanced techniques. However, underground coal mining disturbs the mechanical balance of the strata, causing ground subsidence and environmental problems. Also, mining engineers in many different countries face complex and severe challenges not only because of the depth of the coal seams [1,2,3], but also due to gangue disposal, which significantly limits the development of coal resource exploitation and environmental protection in mining areas [4,5]. In the past, coal mines adopted caving methods for coal extraction because the surface of coal mining areas was sparsely populated and the disasters caused by ground subsidence did not attract sufficient attention. Currently, many coal mines have residential areas or buildings above them. Therefore, many scholars have achieved significant advancements through backfill mining technology, aiming to address challenges like strata and ground control and environmental conservation and improve ore recovery [4,5,6,7,8]. They have conducted numerous studies on strata and ground subsidence during extraction and backfill mining through theoretical analyses, numerical simulations, and field monitoring [9]. For instance, Jahanbakhshzadeh et al. have studied the interaction between the backfill body and rock mass through a comparison between theoretical calculations and a numerical simulation [10]. Geldmacher et al. presented a planning approach to numerical models in mining and highlighted their advantages through several global case studies. They also described the development of an empirical method to visualize the impact of backfilling on subsidence predictions in deep mines [11]. Yue et al. evaluated the effects of the ground subsidence damage risk caused by fly ash through dynamic subsidence calculation models [12]. Li et al. also proposed a calculation method to measure stress distribution in the backfill stops based on the relationship between the stress and strain of gangue backfill materials [13]. Mohammadali et al. proposed a prediction method for surface-induced ground movement through a dimensional elastoplastic finite element model [14]. Numerical analyses have been commonly used to investigate the behavior of strata and ground subsidence in backfill mines; this is an important approach to evaluating the reaction of underground openings. Yadav et al. developed a stronger elastic model to simulate the strain-hardening properties of broken rocks in the goaf area. They then implemented the model in FLAC3D software to evaluate the stress distribution in the goaf area [15]. Through a physical simulation method using non-contact full-field displacement and a strain measuring system, Zhu et al. studied strata movement characteristics, calculated the stress in the goaf area, and investigated the arched caving zone, an undulate bending zone, and a synchronous bending zone for strip backfill mining [16]. Zhao et al. monitored and evaluated the displacement, fracture development, and stress changes in strata in a solid backfill panel using peepholes, displacement sensors, and stress sensors [17]. Sroka et al. developed a theoretical prediction method for calculating the deformation coefficients of any point situated in the overlying rock mass or on the ground surface [18]. Gu et al. also developed a reliable object-oriented method combined with a probability integration method, which is used to predict mining subsidence. Skrzypkowski et al. conducted a physical simulation of a comparative analysis of empty models with cribs filled with a gangue. Their results indicated that wooden cribs filled with gangue are an effective waste management method for creating wooden mining supports [19]. As the depth of a mine increases, so does the pressure on the backfill materials, resulting in increased compressibility, i.e., deeper mines require stronger backfill in terms of its resistance to pressure. In addition, the backfilling time is slower in deep mines compared to shallow mines due to higher compressibility and the need for the gangue filling material to settle and compact completely [20].
Backfilling mining is important for the safety and stability of coal mines, and each method has its own set of applications and advantages based on the mining conditions and the sort of support required. However, solid waste backfilling, compared to other methods, can be produced in situ alongside coal mining activities and does not need to transport the gangue to the ground. This method is called “mining-separating-backfilling + X”. It is a great technique for achieving safe and efficient mining and integrated environmental development, is the most effective and economical way to backfill the goaf, and has been used in numerous underground coal mines [21,22,23]. Advanced equipment such as a coal–gangue separation robot system for the intelligent separation of coal and gangue has been studied by some scholars, such as Tripathy et al. [24]. In China, this technology has been applied in many coal mines, including the Tangshan Mine of the Kailuan Group.
Based on the geological and mining conditions of the Tangshan coal mine, the efficiency of solid backfilling on strata and ground subsidence is systematically analyzed and presented in this paper. In addition, this research adopts the methods of physical analog modeling, numerical simulation, and field measurement in correlation with a theoretical analysis. First, a non-contact full-field displacement and strain measuring system, MatchID-2D software (v.2021.1), was implemented to analyze the displacement and deformation, as well as the stress changes, in the overlying strata during mining and backfilling in the physical analog model. Second, for the 3D numerical modeling, FLAC3D software (v.5.00) was adopted to investigate the mechanical mechanisms of strata and ground subsidence and the backfill body movement induced by underground mining. Through these simulations, the whole process of overlying strata movement, ground subsidence, and the stress changes induced by underground mining can be reproduced, and the effect of solid backfill on strata and ground subsidence can be revealed. However, field measurements are still the most effective way to study strata and ground subsidence because the data from field measurements are accurate, provide direction for mining operations, and support their design. Attention has been given to the solid backfill method used to date, and the research results have important practical significance for future prospects and theoretical guidelines for engineering designs in solid backfilling mining.

2. Research Background

2.1. Geological Conditions of Tangshan Coal Mine

The Tangshan Mine is located at the southwestern end of the northwestern wing of the Kaiping Coalfield, North China deposits, in Lu’nan District, Tangshan City, Hebei Province, China. It is a shaft mine with seven vertical shafts that are split it into ten production regions, and its production capacity reaches up to 4.2 million tons per year. The Tangshan Mine’s primary coal resources are composed of five main coal seams, including the 5th seam, which is located beneath the city. Table 1 lists the roof and floor conditions of the backfill working face.

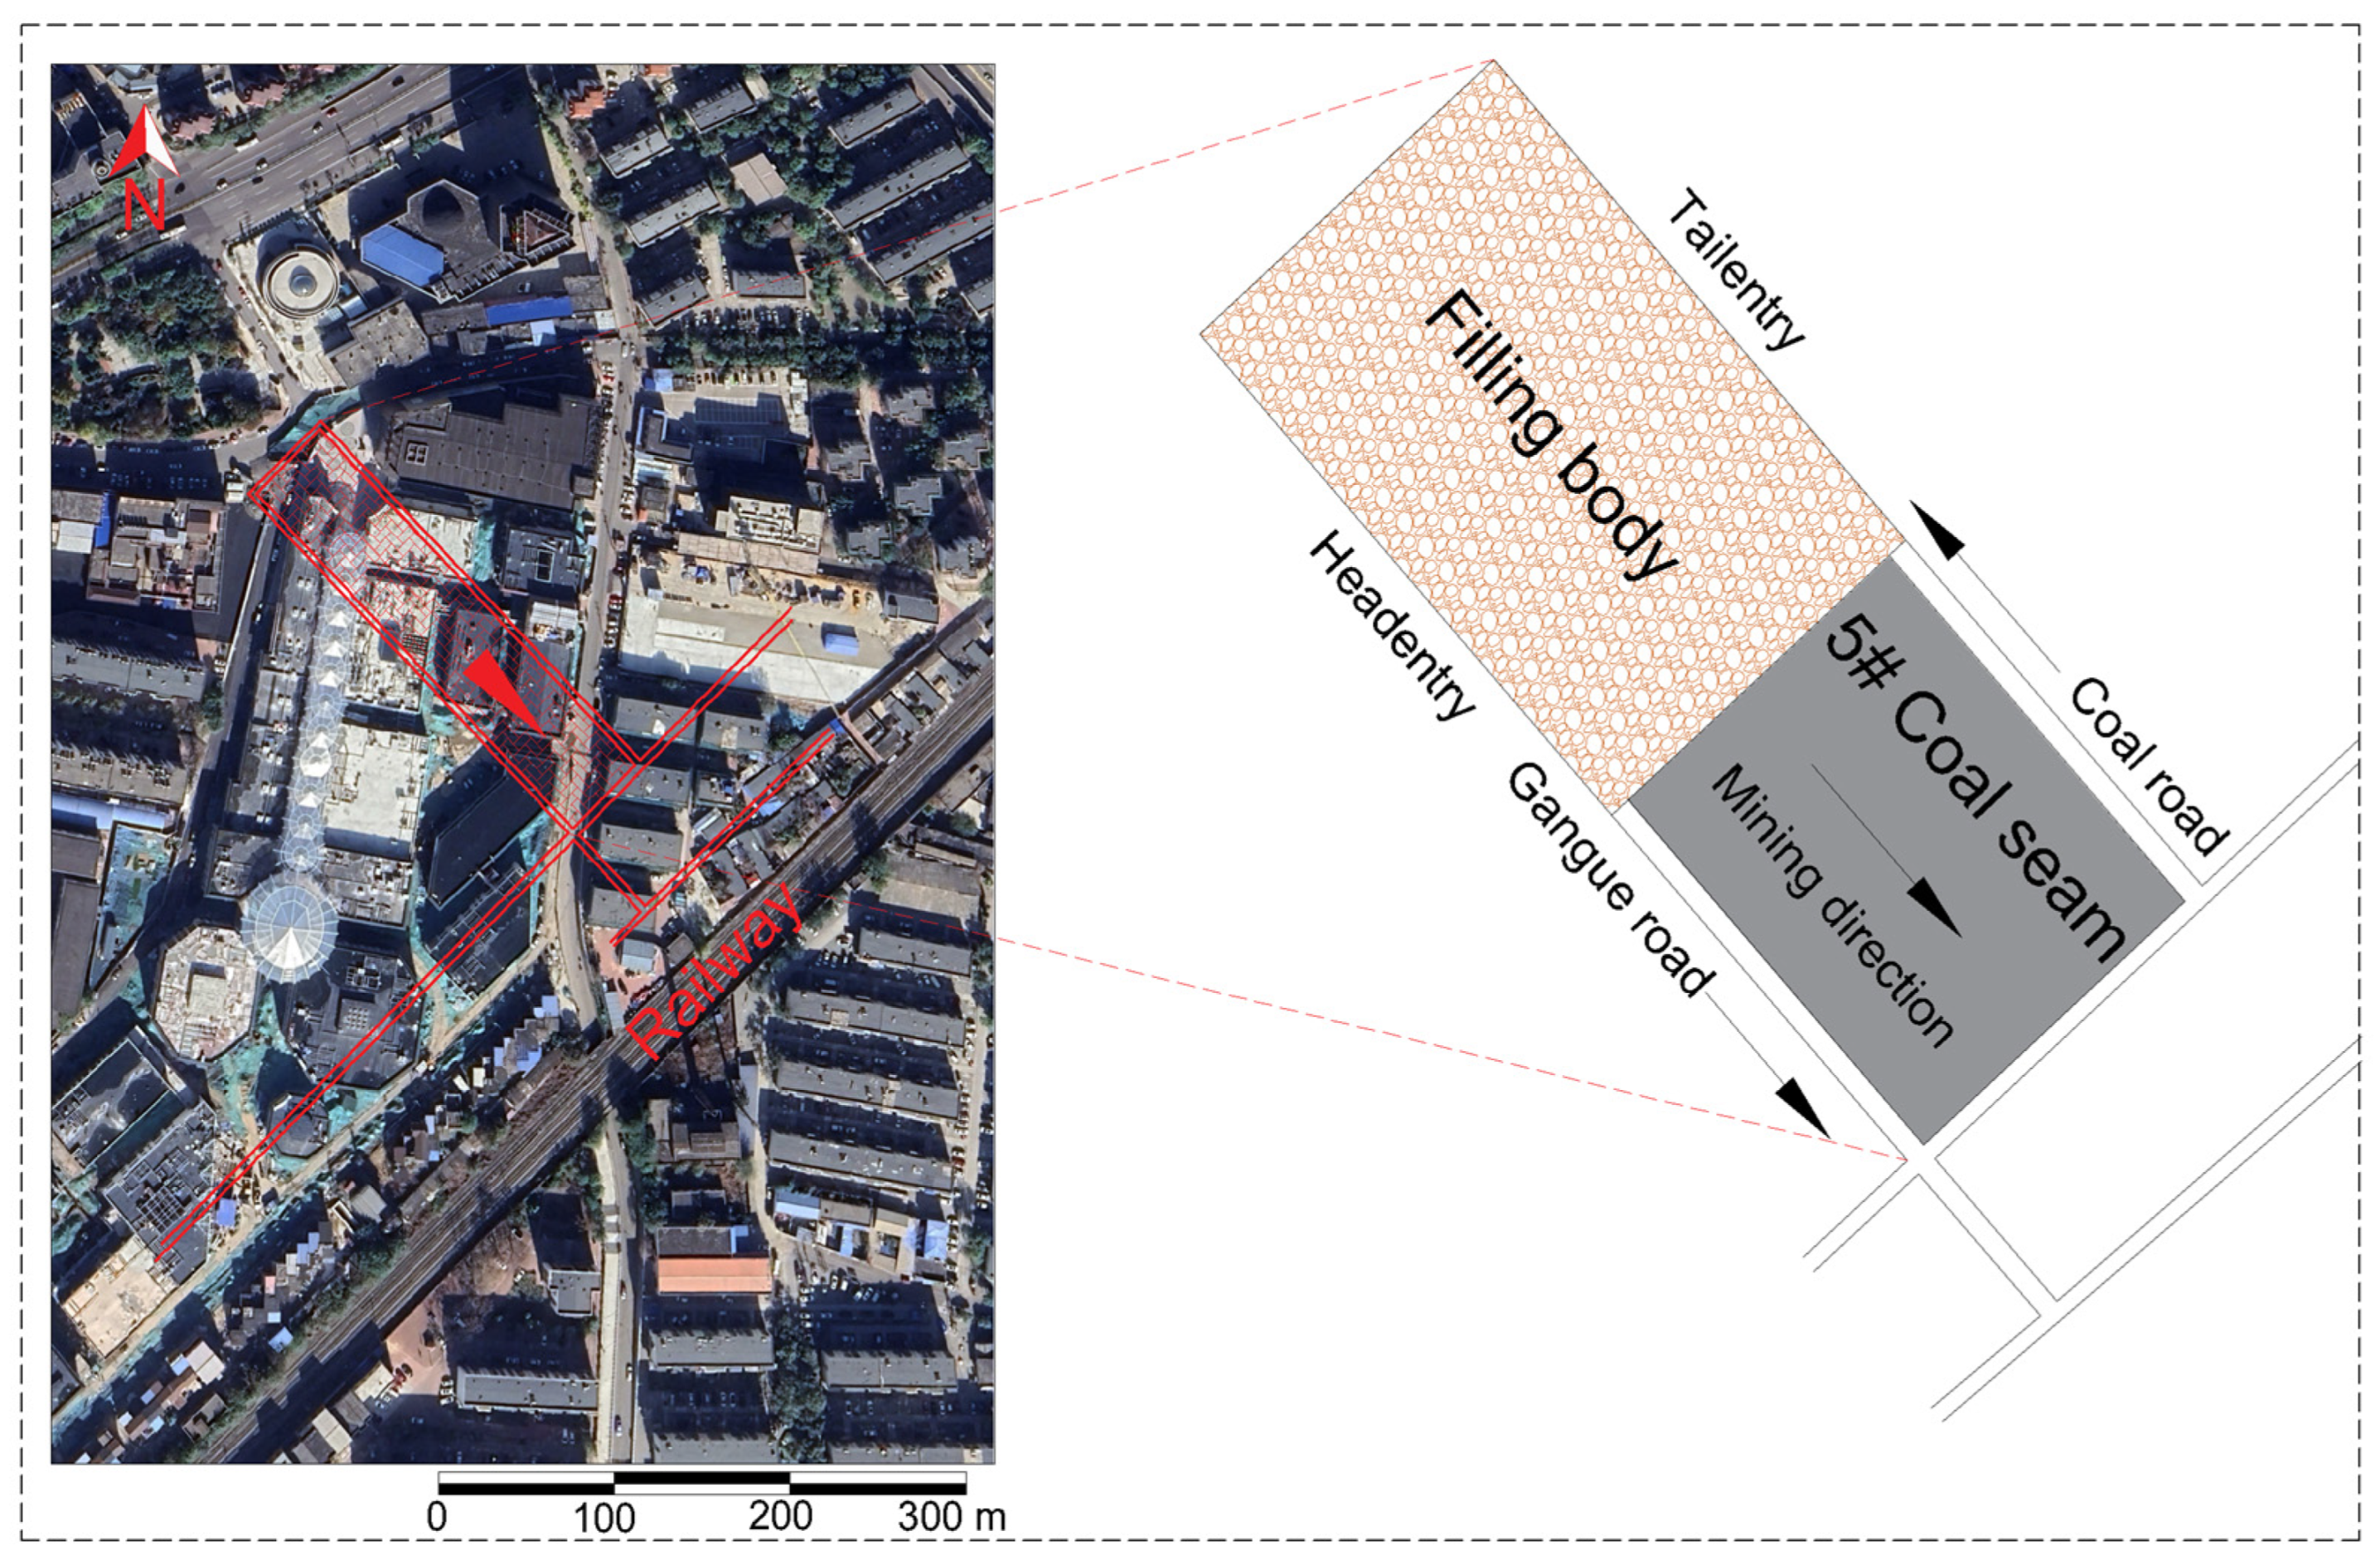
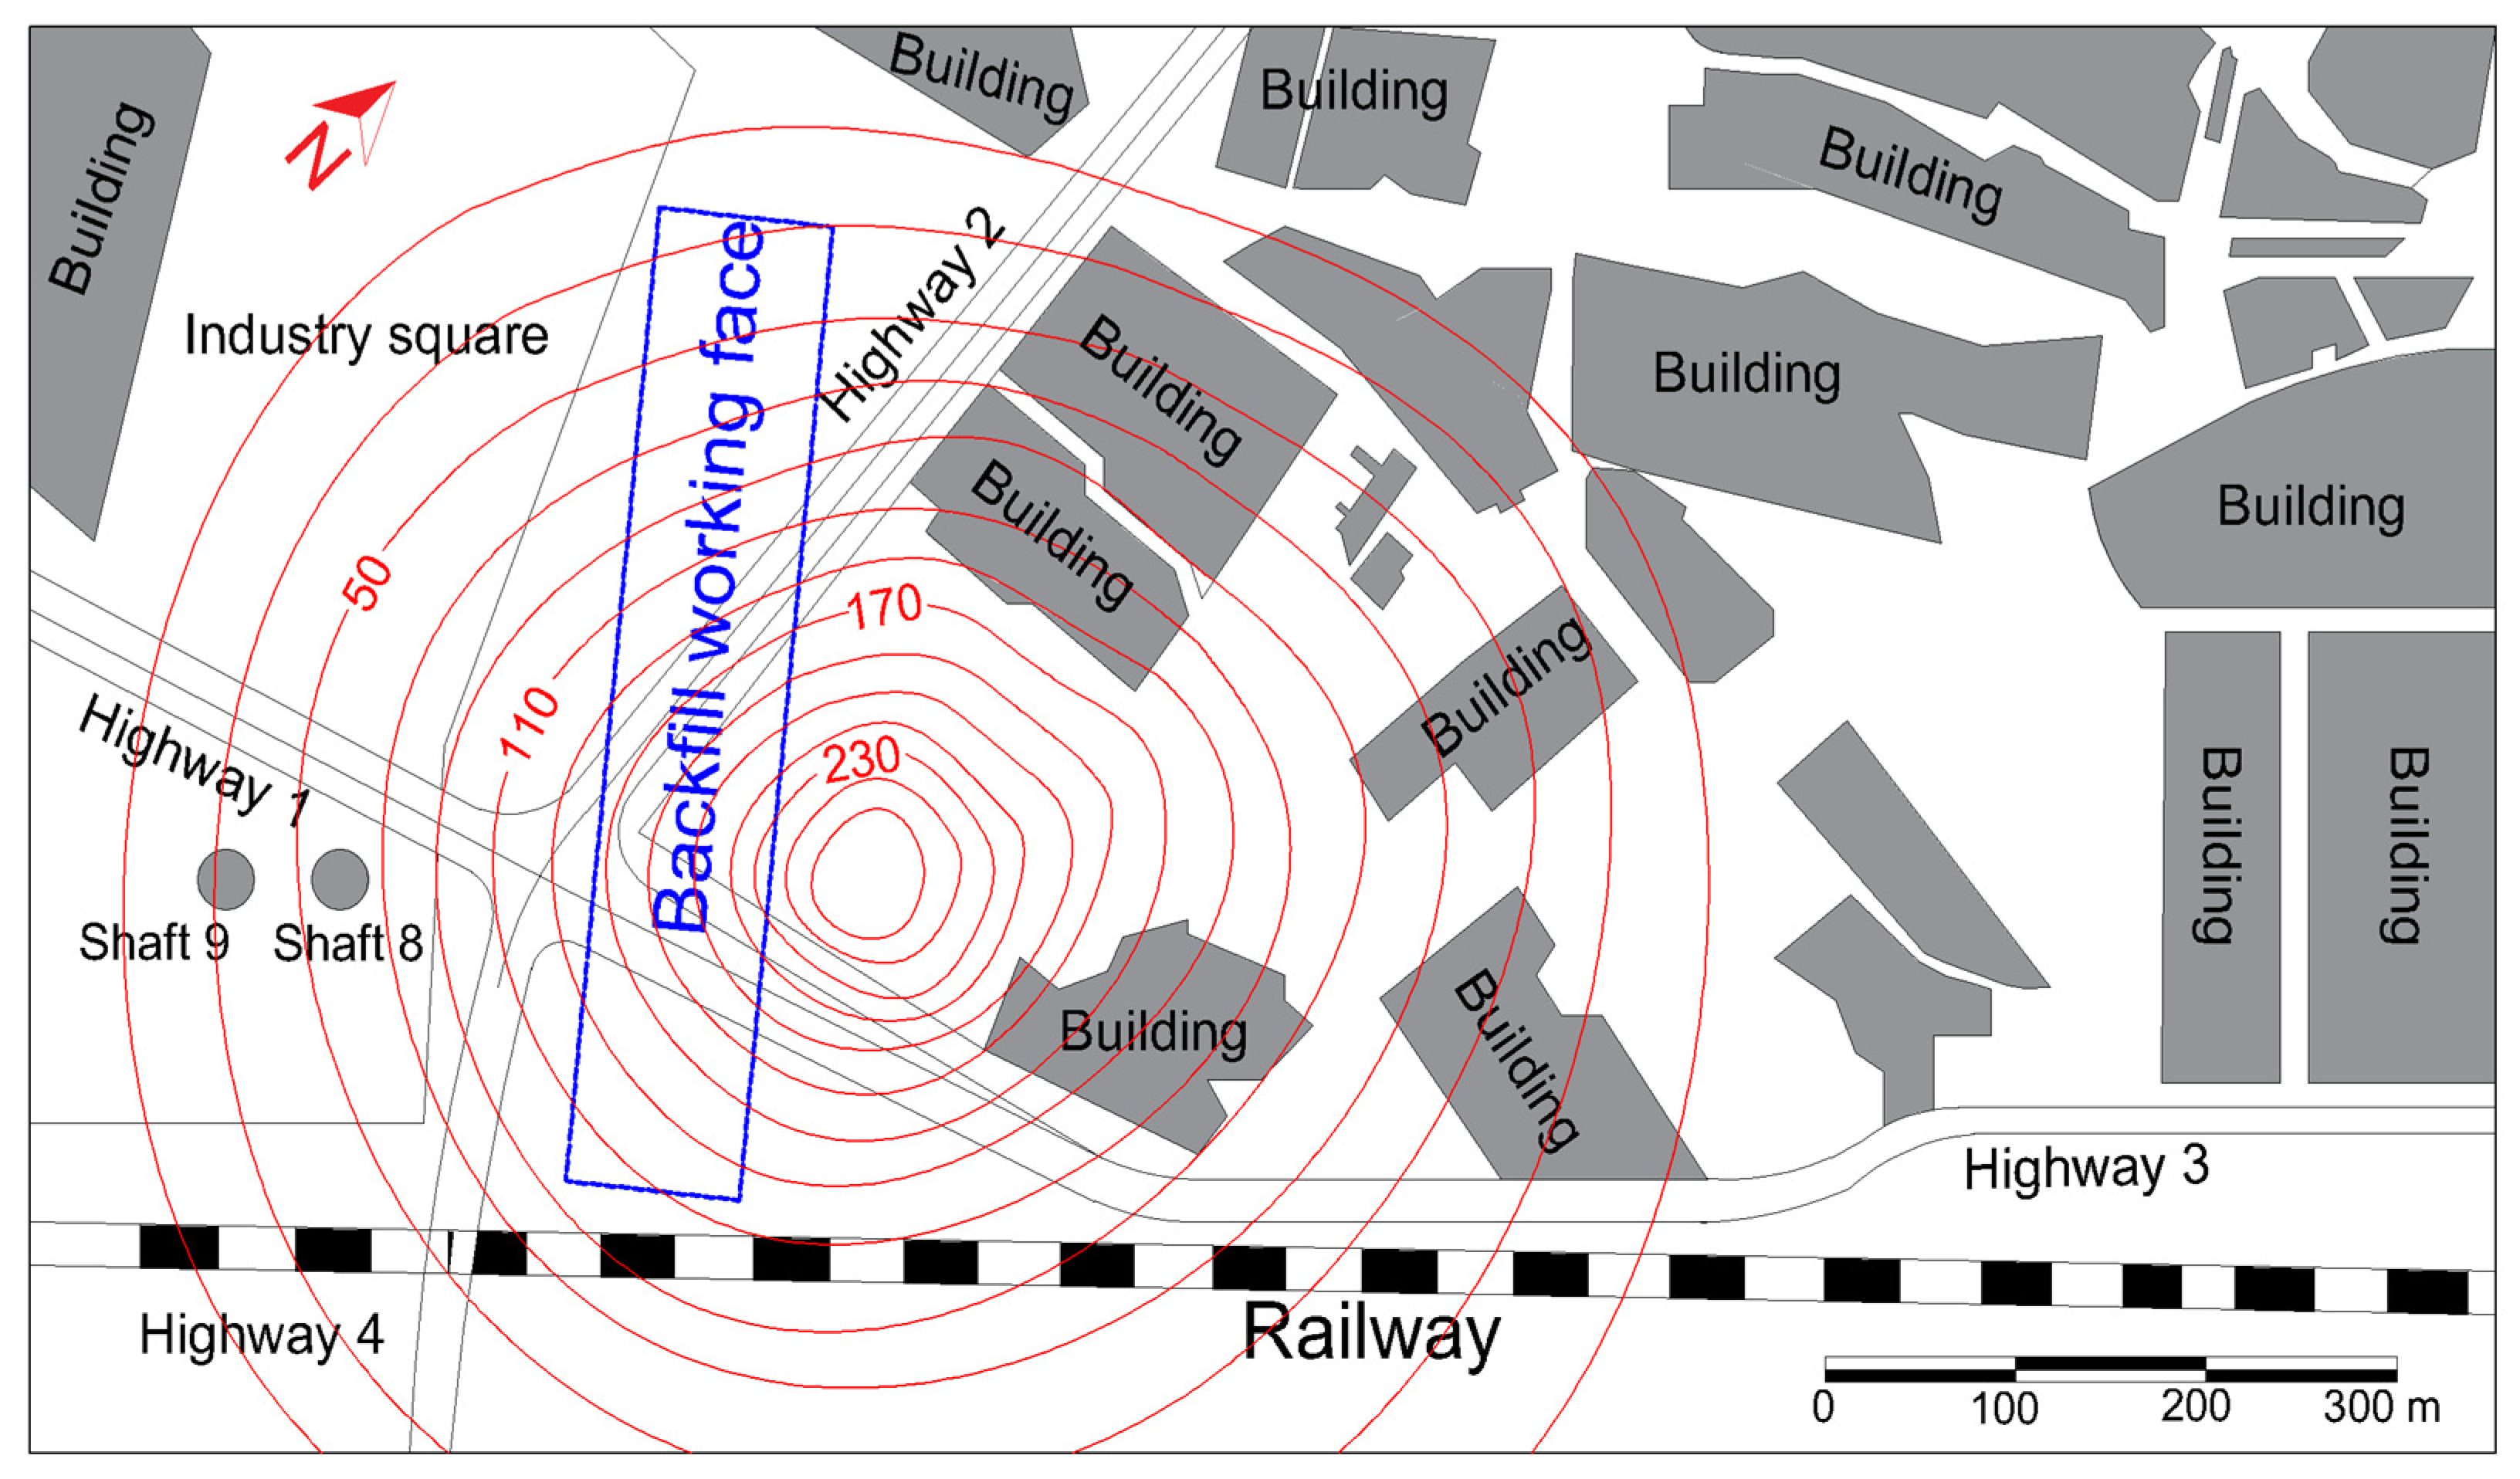
2.2. Mining Area Overview
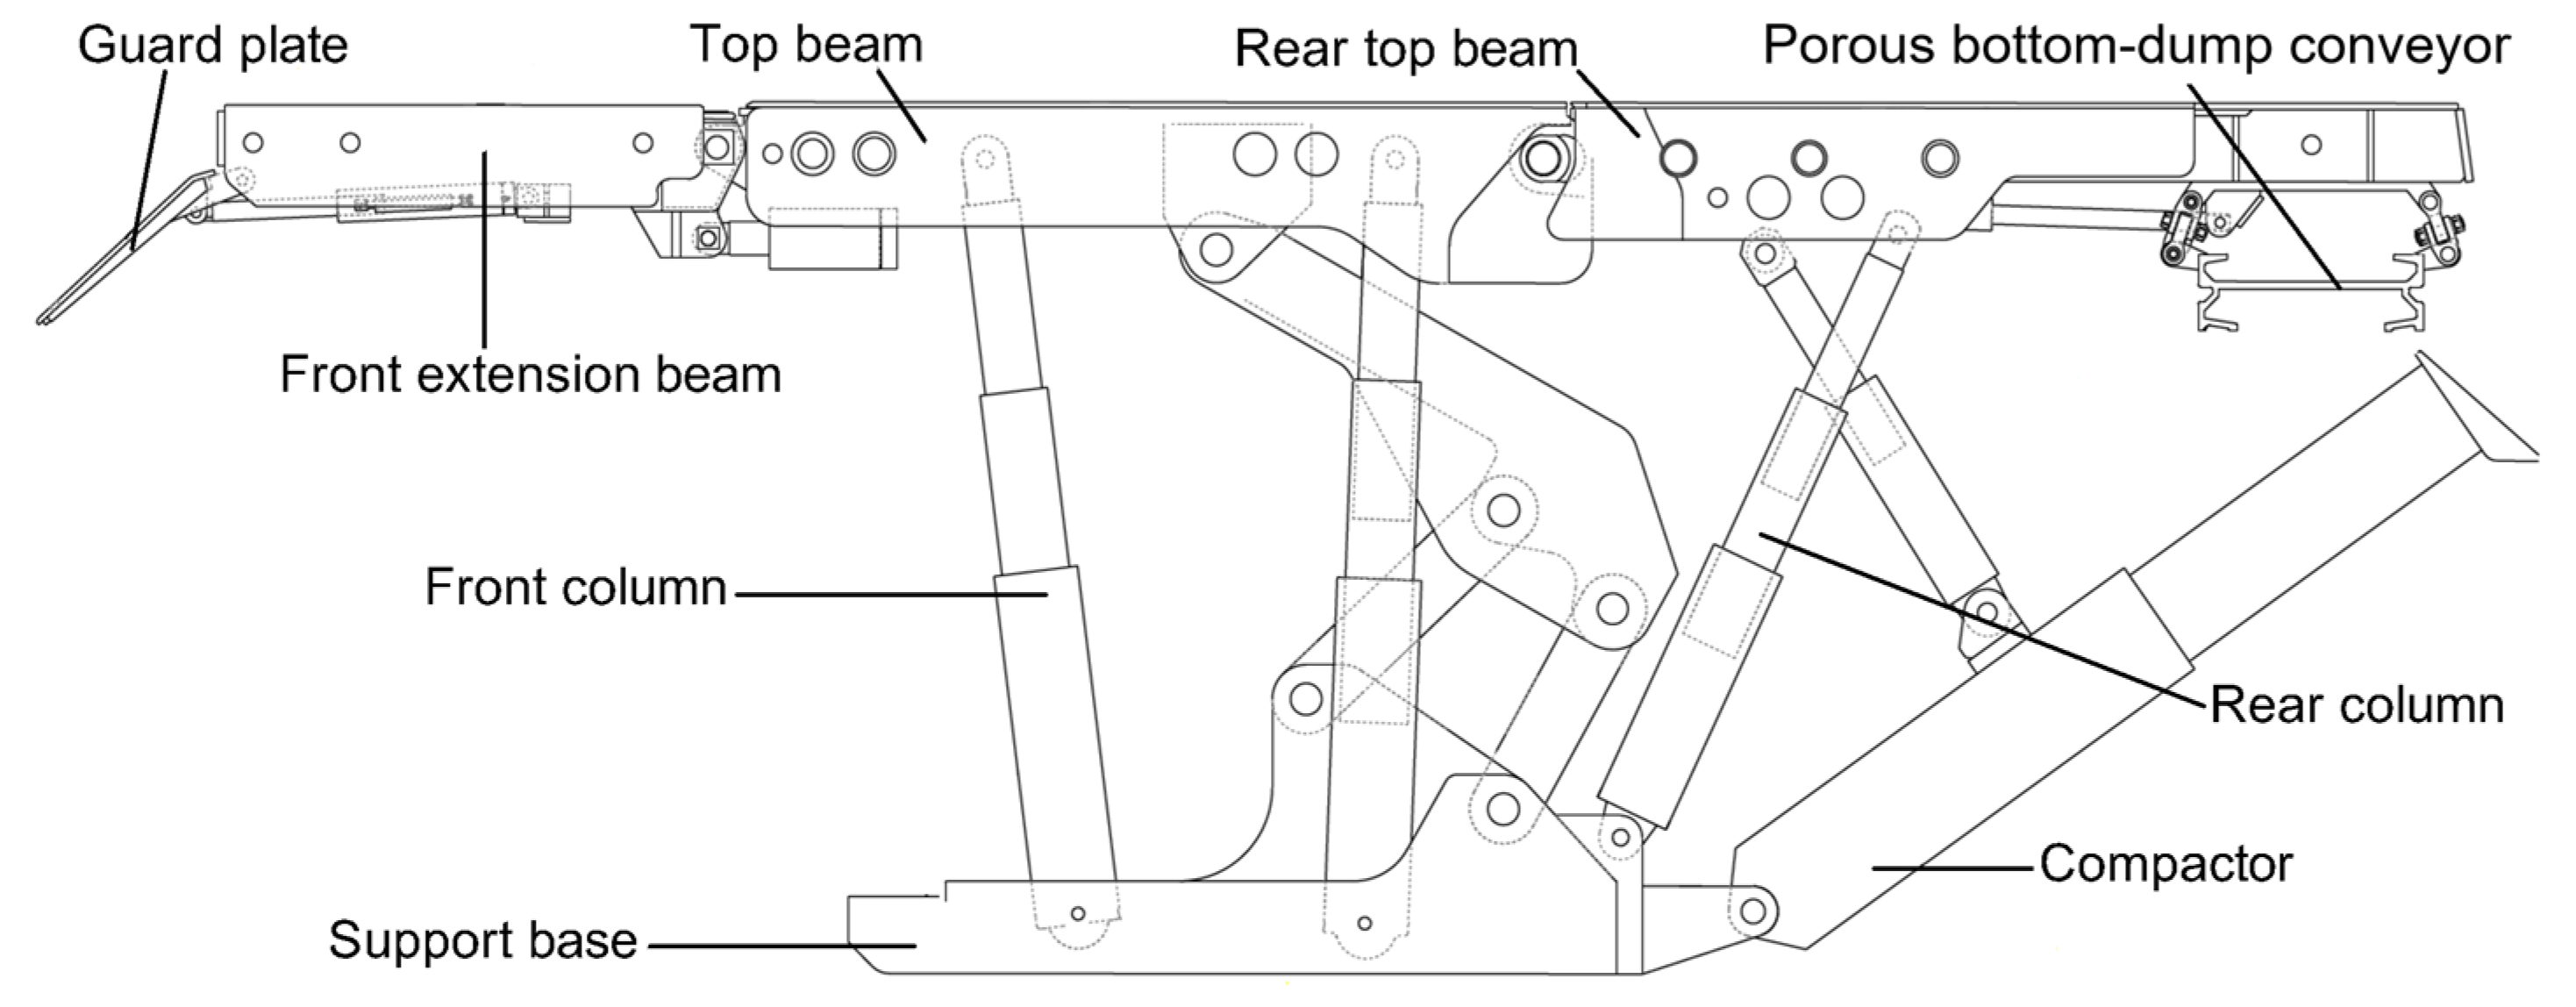
The main coal area of the 5th coal seam is zone F, which includes the backfill working face under consideration in this study. At a ground elevation of +17 m and an underground elevation ranging from −582 to −709 m, the working face is characterized by an average coal seam thickness of 2.5 m and an inclination angle of 13°. It extends over an inclination length of 65 m and an impressive strike length of 652 m. The backfill work face adopts an inclined filling mining face using the upward-mining method. The mining requirements of the backfill working face are to protect the buildings and railway tracks on the surface of the mine. Figure 1 depicts the location and layout of the backfill working face beneath Tangshan City. An overview of the layout parameters of the backfill working face is presented in Table 1.

2.3. Key Equipment

The backfilling system is mainly composed of backfilling hydraulic supports, a compacting mechanism, a scraper conveyor, and a porous bottom-dump conveyor. The hydraulic support selected by the coal mine was the ZC4800/16/30 six-leg backfilling hydraulic support, as shown in Figure 2. Hydraulic support ensures the continuity of the mining and backfilling processes in parallel. Table 2 provides a comprehensive overview of the key equipment employed on the backfill working face [25].

3. Materials and Methodology

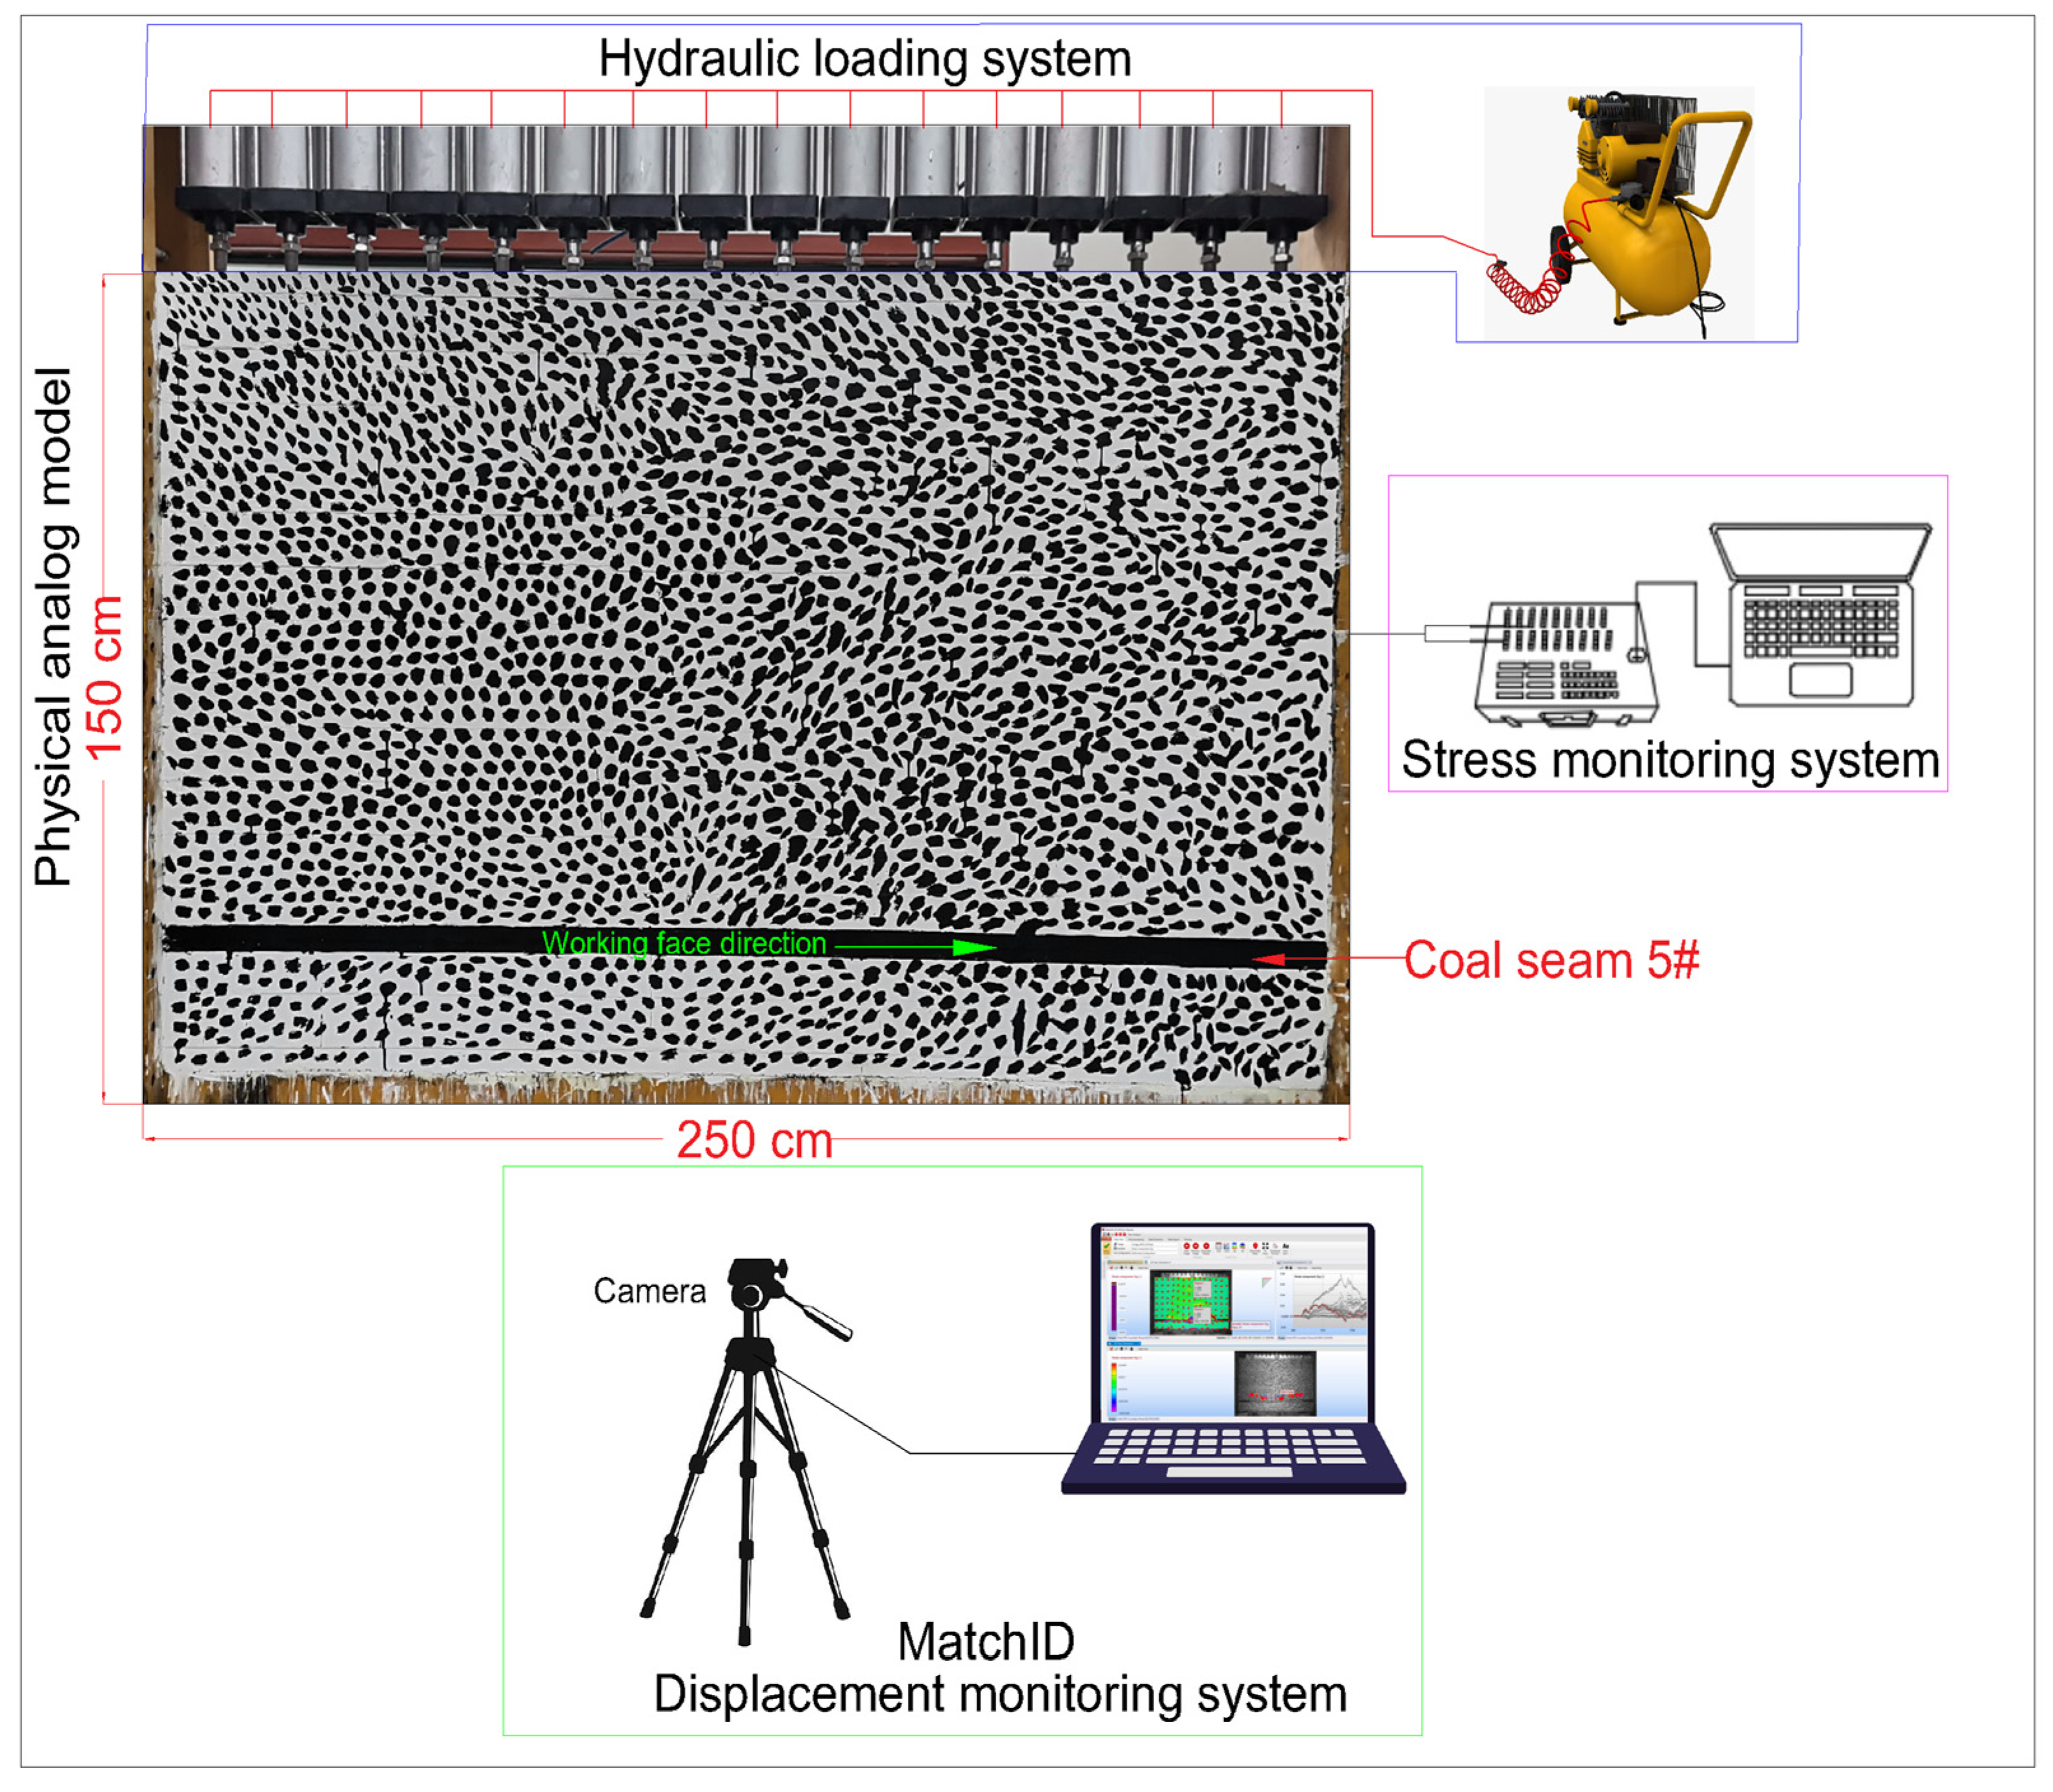
3.1. Construction of the Physical Analog Model

The backfill working face belongs to the coal seam 5th and has a strike length of 652 m. A physical analog model was built according to the geological and mining conditions of the backfill working face, with dimensions of 2.5 m × 0.3 m × 1.5 m (length × width × height). The monitoring system’s layout and its multiple mechanical parameters are shown in Figure 3. The backfill working face contains a total of 23 strata. The floor stratum is 13 m thick; the coal seam is 2.5 m thick; and the overburden strata are 134.5 m thick. The thickness of each layer in the model was determined based on rock sample tests and simple measurements of the corresponding actual geological layers. The model’s geometric similarity ratio (Cl) was adjusted to 100:1, the movement similarity ratio to 10:1, the stress similarity ratio to 166.7:1, the volumetric weight similarity ratio (Cr) to 1.667:1, and the mass similarity ratio to 1.667 × 10⁶:1. The model’s stress compression was calculated to be 0.10 MPa based on the stress-to-overlying strata height similarity ratio under simulation. In the physical analog model, stress compression refers to the use of a pneumatic cylinder to apply a stress similarity ratio to the top of the model to compress for insufficient stress when the strata model is below ground level. The mechanical properties and the proportions of the materials used for the physical similarity model are shown in Table 3 and Table 4. On site, the daily advancement of mining is 5 m, with two shifts of 8 h for coal mining and 8 h for maintenance. Since the similarity ratio of movement in the physical analog model was determined to be 10:1 and the advanced distance of the working face in the model was 190 cm, the excavation step of the working face in the model was 5 cm every 96 min. After taking 38 steps, about 3648 min in total, the model was completely mined.

3.1.1. Displacement Monitoring Design

To monitor the displacement of the entire model, MatchID-2D was used, which is a non-contact full-field displacement and strain measurement device. This system consists of a MatchID image capture setup, a 12-megapixel high-resolution camera that measures, in a 2D field of view, the displacement and strain, with a measuring range of 0.01 pixels and 0.001% accurate. To provide a clear background for monitoring, the model’s surface was colored white. Afterward, many black spots were drawn on the model’s surface to track displacement, as illustrated in Figure 3. MatchID tracked these spots across multiple images to calculate displacements. By analyzing images from the high-resolution camera, MatchID determined the displacements between these marked points. When these spots are too close or connected to each other, it can confuse the software, reduce resolution, and affect the accuracy of the results. Excessive rotation can complicate the tracking and indicate of out-of-plane motion. The spots’ deformation can have an impact, emphasizing the importance of accurate calibration, strain measurement, and pattern application.

3.1.2. Stress Monitoring Design

Five pressure gauges with a 1 cm diameter were embedded in the model where stresses were to be determined. The pressure gauges were installed horizontally. The pressure gauges were installed at the following designated positions in the physical simulation model: two pressure gauges were buried above the two boundary coal pillars, namely 1# and 5#, positioned 25 cm from the edge of the model, and three pressure gauges were buried in the main roof for data measurements, namely 2#, 3#, and 4#, and successively positioned from the open-cutting face left to right at 45 cm, 95 cm, and 145 cm. Afterward, each pressure gauge was connected to a monitor via a wire for data acquisition. In order to study the additional mining pressure caused by mining and to avoid the influence of original rock stress, the micro-strain of the pressure gauges was set to zero before mining. Figure 4 depicts the photos of the pressure gauge monitoring layout. The monitoring indicators were as follows: (i) the stress change characteristics of the overburden strata during mining and filling above the goaf area of the backfill working face; (ii) the stress change characteristics above the two boundary coal pillars.

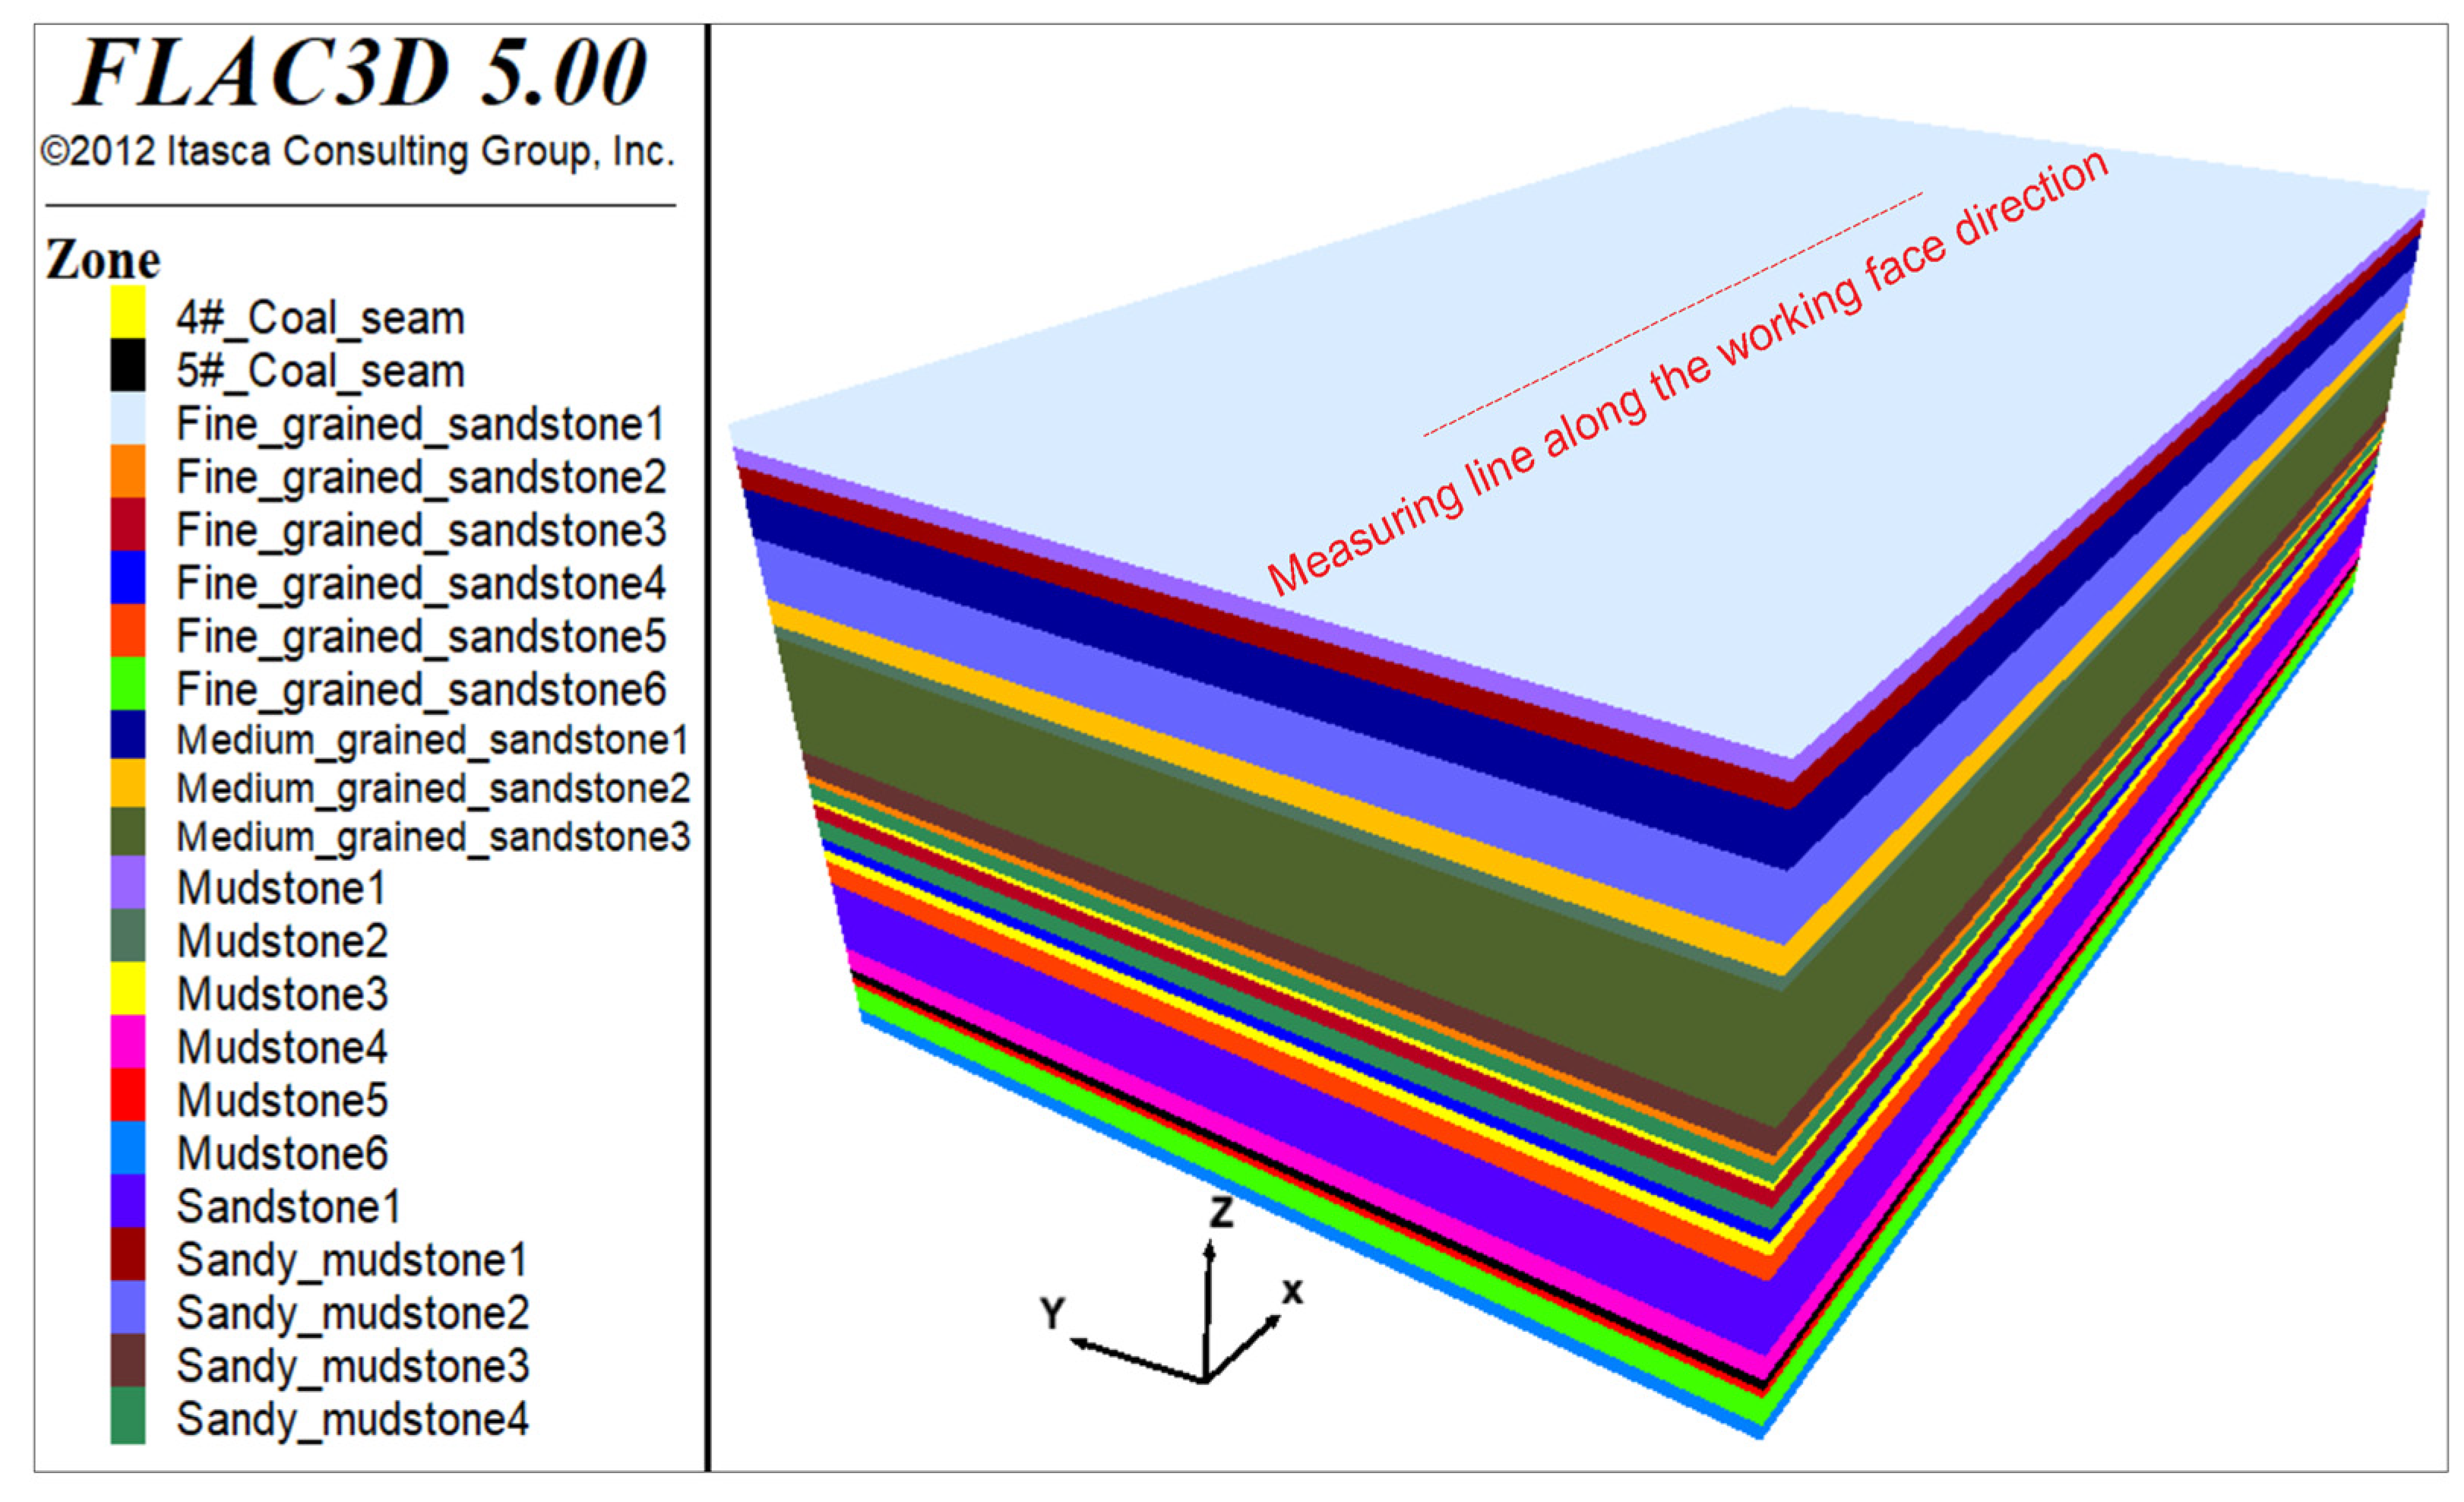
3.2. Construction of the Numerical Simulation Model

To study the effect of solid backfilling on strata and ground subsidence beneath a city, a model measuring 500 m × 265 m × 150 m (length × width × height), with 23 layers of strata from top to bottom, was established in FLAC3D based on the actual geological conditions of the 5th coal seam of the Tangshan coal mine, as shown in Figure 5. In the model, a Mohr–Coulomb model was adopted to analyze the rock mass; horizontal constraints were applied to its four sides; horizontal and vertical constraints were applied to its bottom boundary; and no constraint and load of 17 MPa was applied to the top boundary. The mechanical parameters of each layer are listed in Table 5. In the model, the 2.5 m thick 5th coal seam was mined at a strike length of 300 m from the open-cutting face, a dip length of 65 m, and backfilled with a filling rate of 80%. A schematic diagram of the 3D numerical model is shown in Figure 5.

3.3. Field Measurement

A Continuously Operating Reference Station (CORS) system was used to monitor the ground’s deformation. Based on GPS navigation and positioning technology, several GPS reference stations were fixed at a certain distance above the working face and connected with a data center, a computer, data communication, and the internet to form a network. The backfill working face entered into production in November 2017 and was fully stopped in December 2018. Four surface movement and deformation measuring lines related to the backfill working face were set up, adhering to the “Coal Mine Survey Regulations”, ensuring reliable data. The arrangement of the ground deformation measuring lines E, N, S and W is illustrated in Figure 6.

3.4. Surface Subsidence Prediction and Impact Analysis

3.4.1. Probability Integral Method (PIM)

Due to its superior accuracy and simplicity, the PIM stands out as one of the most commonly employed techniques for predicting mining subsidence in China, and one requiring fewer parameters compared to other methods [26]. This theory is used in both caving mining and backfilling mining for subsidence prediction. According to the principle of the PIM, the subsidence of any surface point in a rectangle of mining whose coordinates are (x, y) caused by the whole backfilling working face can be calculated as follows [1,23,24,25]:
  • The surface subsidence value at any point A(x, y) on the surface is as shown in Equation (1):
W ( x , y ) = W c m C x C y { W c m = m q cos α C x = 1 π π x r 0 e λ 2 d λ + 0 π l x r e λ 2 d λ C y = 1 π π y r 1 0 e λ 2 d λ + 0 π L y r 2 e λ 2 d λ
where Wcm is the full mining maximum subsidence value; Cx′ and Cy′ are the subsidence distribution coefficients of point A(x, y) in the main strike and dip sections; m is the thickness of the coal seam; q is the surface subsidence coefficient; α is the dip angle of the coal seam; q is the subsidence coefficient; r1 is the major influence radius of the dip direction in the downhill area; r2 is the major influence radius of the dip direction in the uphill area; l and L are the calculated mining widths in the strike and dip directions after considering the inflection point offset; and x and y are the coordinates of any surface point to be found.
  • The tilt deformation value T(x, y)j of any point A(x, y) on the surface in the φ direction is shown in Equation (2):
T ( x , y ) j = T x C y cos φ + T y C x sin φ T ( x , y ) j + 90 = T x C y cos φ T y C x sin φ T ( x , y ) m = T x C y cos φ T + T y C x sin φ T
where φ T = a r c t g ( T y C x / T x C y ) ; T(x,y)m is the maximum tilt value of the point to be determined, mm/m; φT is the angle between the direction of the maximum tilt value and the OX axis (rotating in the counterclockwise direction), degrees; and Tx and Ty are the tilt deformation values superimposed at the projection points on the main section along the strike and dip of the point to be determined, mm/m.
  • The curvature deformation value K(x, y)j of any point A(x, y) on the surface in the φ direction is shown in Equation (3):
K ( x , y ) j = K x C y cos 2 φ + K y C x sin 2 φ + T x T y / W 0 sin 2 φ K ( x , y ) j + 90 = K x C y cos 2 φ + K y C x sin 2 φ + T x T y / W 0 sin 2 φ K ( x , y ) m a x = K x C y cos 2 φ + K y C x sin 2 φ + T x T y / W c m sin 2 φ k K ( x , y ) m i n = K ( x , y ) j + K ( x , y ) j + 90 K ( x , y ) m a x
where K(x, y)max and K(x, y)min are the maximum and minimum curvature deformation values of the point to be determined and Kx and Ky are the curvature values of the point to be determined after its superposition along the strike and dip at the projection of the main section.
  • The horizontal displacement value U(x, y) of any point A(x, y) on the surface in the φ direction is shown in Equation (4):
U ( x , y ) j = U x C u cos φ + U y C x sin φ U ( x , y ) j + 90 = U x C y cos φ + U y C x sin φ U ( x , y ) c m = U x C y sin φ u + U y C x cos φ u
where φu is the angle between the maximum horizontal movement direction and the OX axis, φu = arctg(UyCx′/UxCy′), and Ux and Uy are the horizontal movement values of the point to be determined along the strike and dip at the projection point of the main section, mm. For the tilt direction, add Cy.Wcm.ctg θ.
  • The horizontal deformation ε(x, y)j value of any point A(x, y) on the surface in the φ direction is shown in Equation (5):
ε ( x , y ) j = ε x C y cos 2 φ + ε y C x sin 2 φ + U x T y + U y T x / W c m sin φ cos φ ε ( x , y ) j + 90 = ε x C y sin 2 φ + ε y C x cos 2 φ U x T y + U y T x / W c m sin φ cos φ ε ( x , y ) m a x = ε x C y cos 2 φ e + ε y C x sin 2 φ e + U x T y + U y T x / W c m sin φ e cos φ e ε ( x , y ) m i n = ε ( x , y ) j + ε ( x , y ) j + 90 ε ( x , y ) m a x
where φ e = 1 2 a r c t g U x T y + U y T x W c m ε x C y ε y C x ; ε(x,y)max and ε(x,y)min are the maximum and minimum horizontal deformation values of the point to be determined; and εx and εy are the horizontal deformation values of the point to be determined after its superposition along the strike and dip at the projection of the main section.

3.4.2. Equivalent Mining Height (EMH)

The EMH theory is a useful tool for analyzing the influence of rock movement control on solid backfilling mining. In solid backfilling mining, the gangue fills the goaf, reducing the subsidence gap of the overlying strata. It can also be explained another way; the equivalent mining height is the mining height of the filling working face minus the height of filling material after compaction. Equation (6) can be used to determine the equivalent mining height [1,26,27,28,29,30]:
m e = m 1 ρ
where me refers to the EMH, influenced by such factors as the backfill body’s compression ratio; m is the mining height; and ρ is the filling ratio.
When using the probability integral method based on the equivalent mining height to predict the subsidence of gangue filling mining, the subsidence prediction parameters can be taken as the corresponding parameters of the longwall caving method used for thin coal seams in the mining area. The subsidence prediction parameters used in this subsidence prediction process are listed in Table 6.

3.4.3. Prediction and Impact Analysis of Ground Subsidence with 80% Filling Ratio

Compared to caving mining, backfill mining does not cause mining damage above level I to the buildings above the working face. The surface movement and deformation damage level, according to the defense standards of the 2017 “Regulations on Coal Pillar Retention and Coal Mining for Buildings, Water Bodies, Railways, and Main Wells and Lanes” in China, are shown in Table 7.
According to the equivalent mining height calculation method based on the probability integral method, the surface subsidence extreme value of backfill under an 80% filling rate was predicted, and the results are shown in Table 8. An analysis of the extreme values of the data in the table shows that the horizontal deformation and other subsidence indicators at the surface of the backfill working face are within the subsidence indicators specified for level I building damage. The curvature deformation is relatively small, less than 0.01 mm/m2, and is not listed in the table. Due to the space limitations of this paper, only a contour map of the ground subsidence seen at an 80% filling ratio was developed, as illustrated in Figure 7.

4. Results and Analysis

4.1. Physical Analog Model’s Results and Analysis

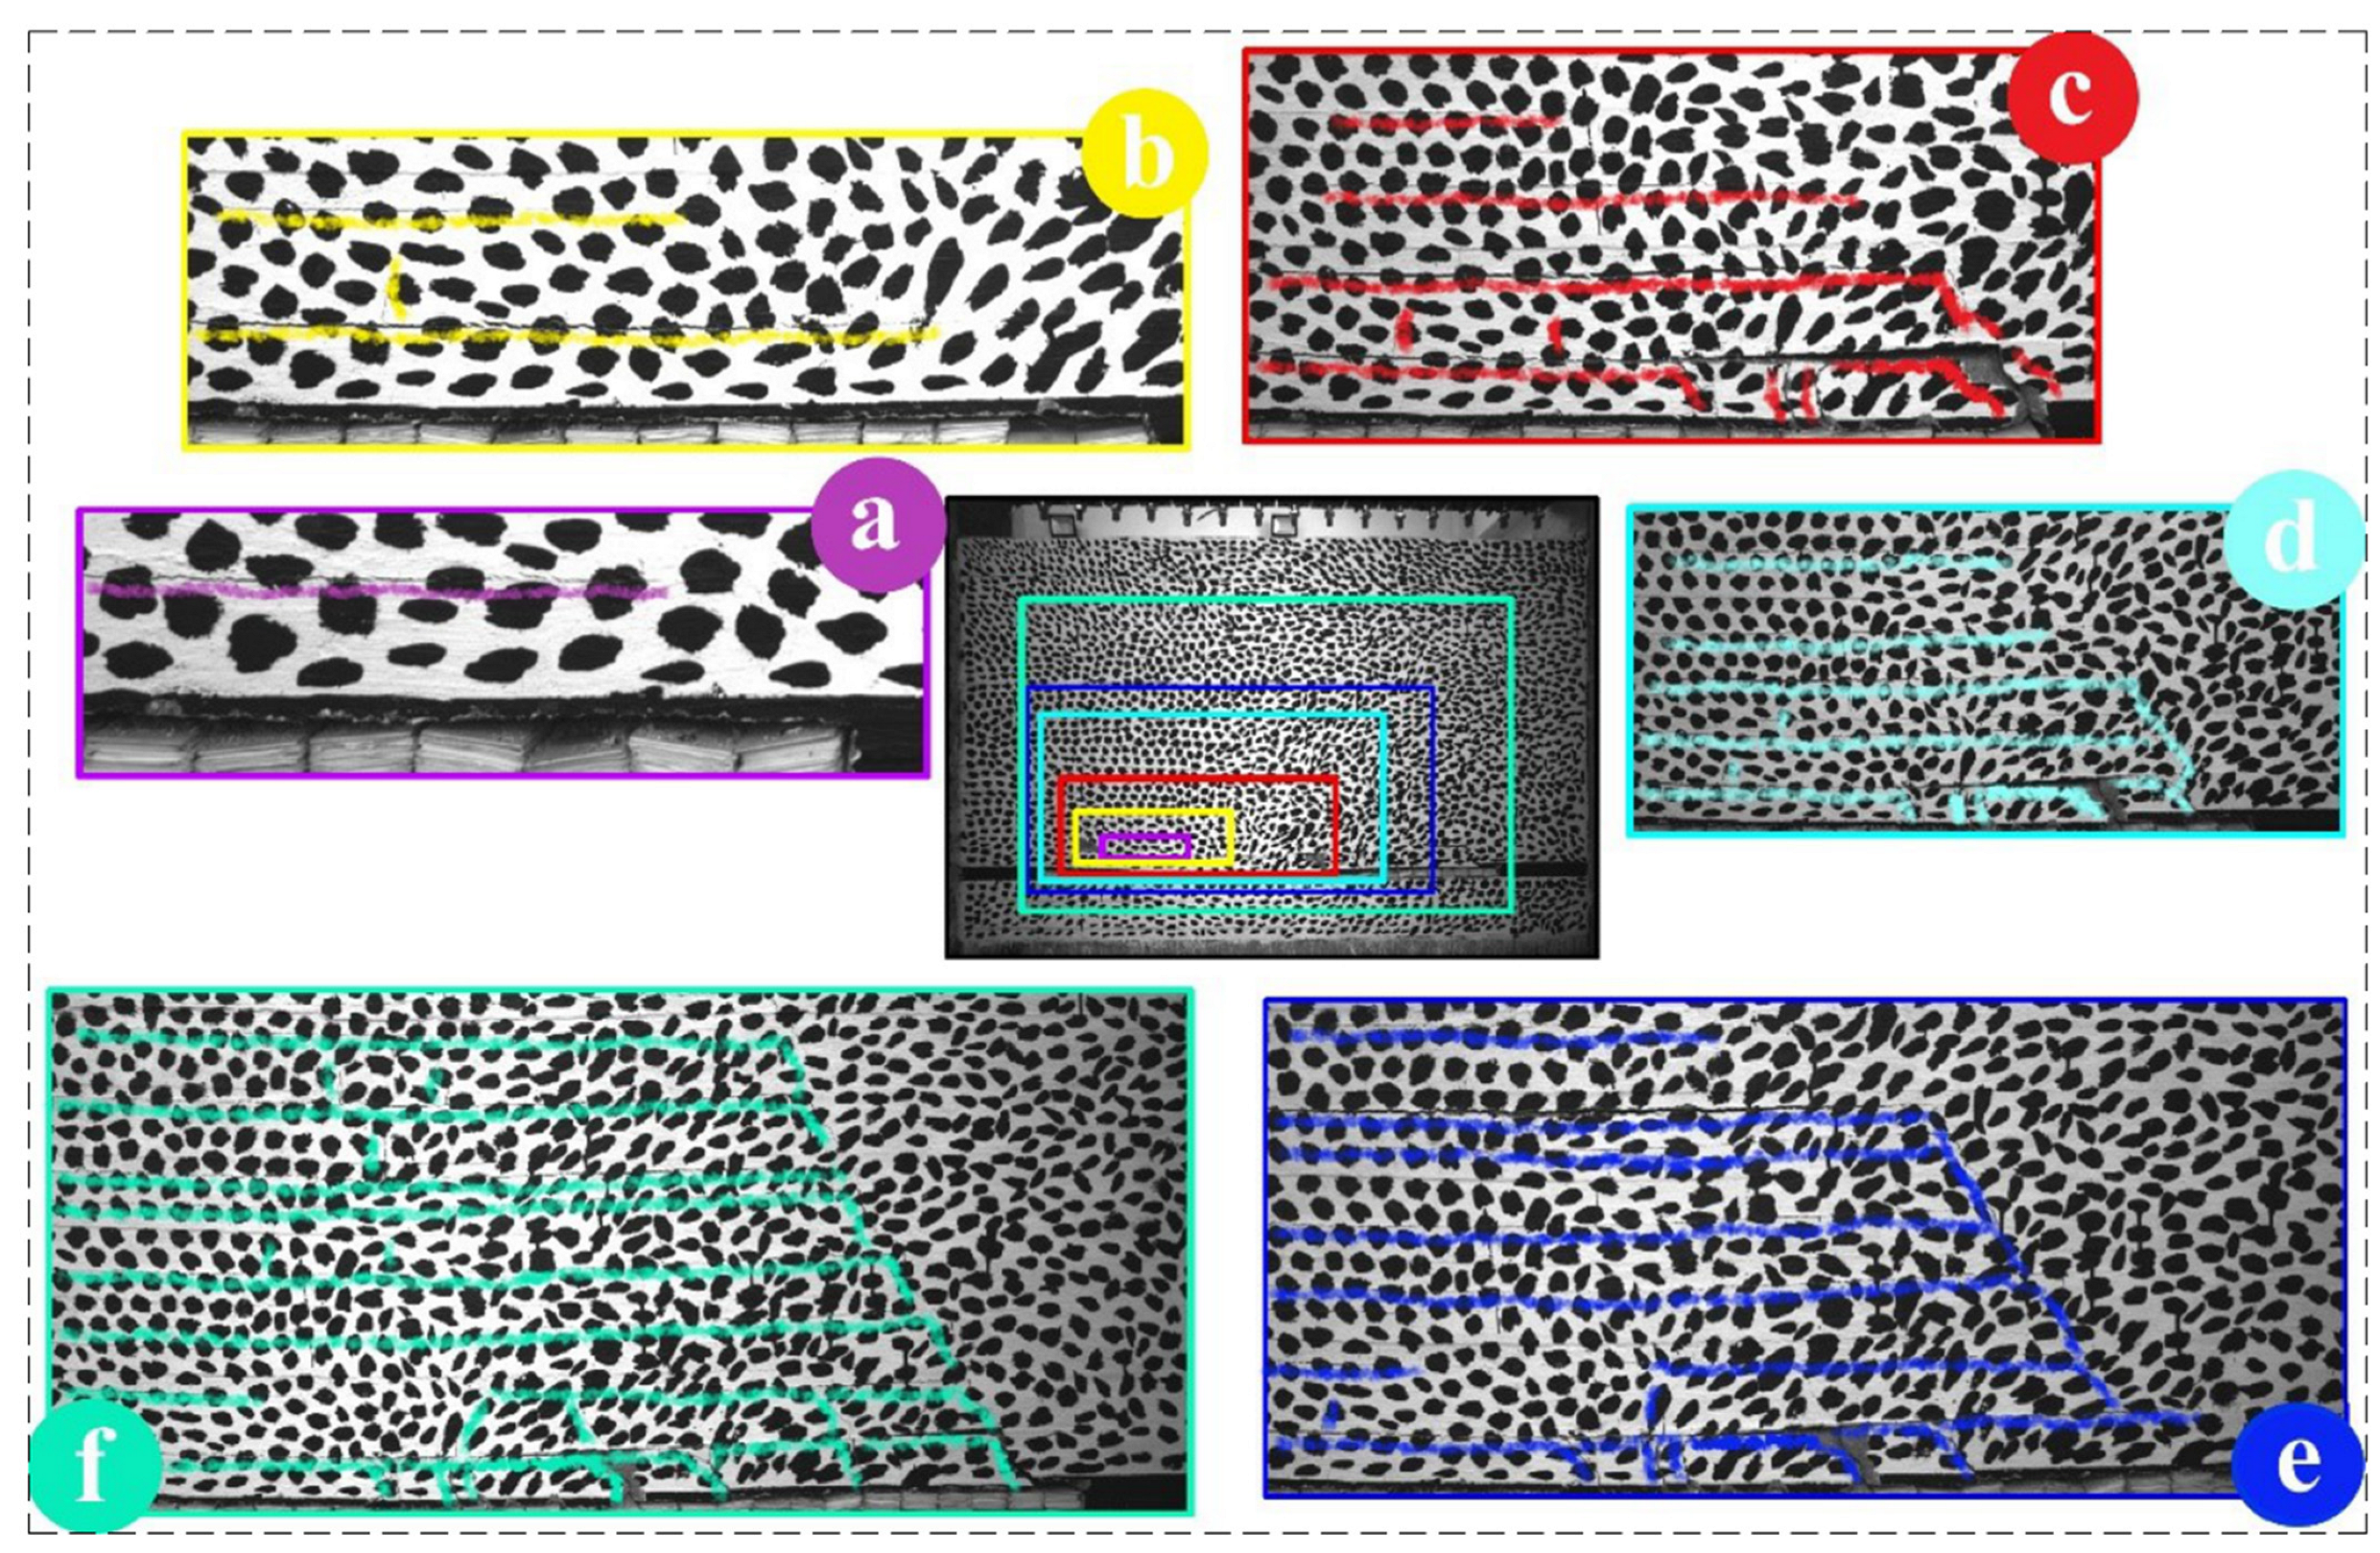
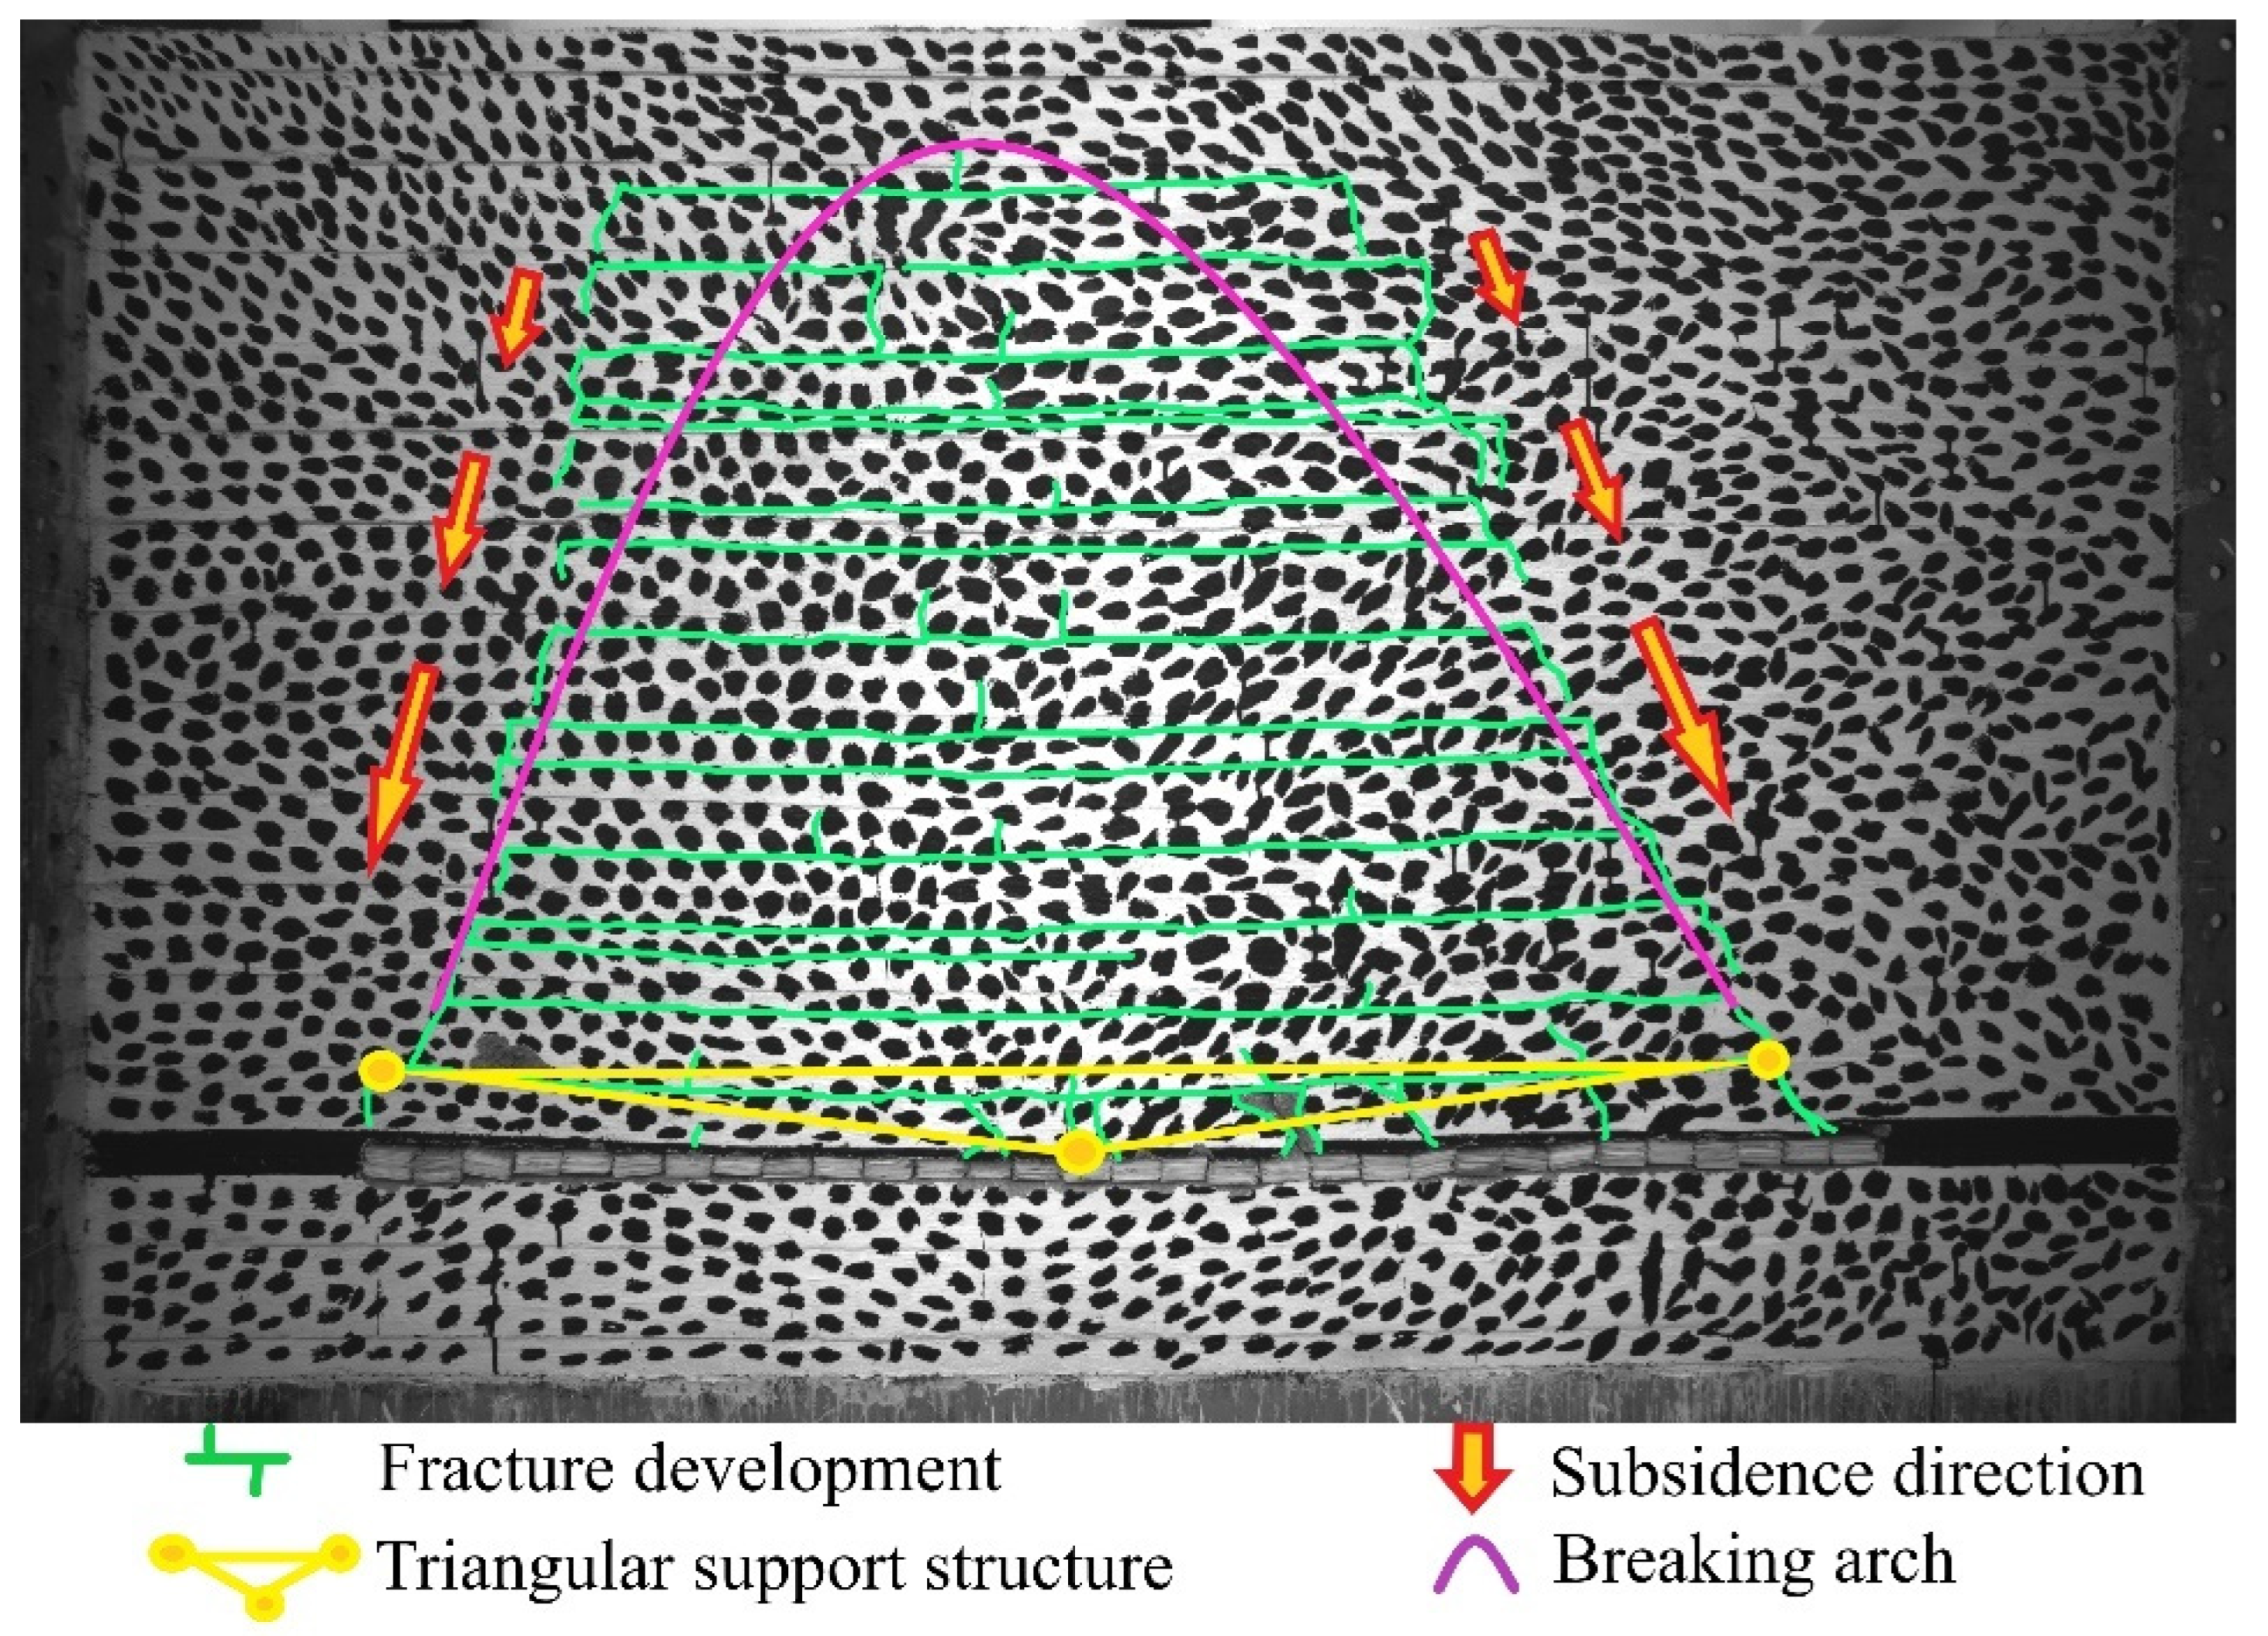
4.1.1. Movement Characterization of the Overlying Strata

The working face has a strike length of 190 cm. Therefore, the coal seam was mined 5 cm at each step in the physical model. During the advancement process of the working face, the whole movement progression of the overburden was photographed with a high-performance digital camera for MatchID. The periodic cracks and collapse of the overburden strata experienced six major deformation stages, as shown in Figure 8. However, the deformation stages of the entire simulation are smaller compared to those in caving mining due to the filling body’s support. Figure 8 and Figure 9 show the strata and ground subsidence evolution characteristics of the overlying strata.
  • First deformation stage (advancement of mining to 55 cm)
The first major crack occurred when the working face advanced to 55 cm and was a horizontal separation fracture about 1 mm in height between the immediate and main roofs (Figure 8a). This indicates the failure of the immediate roof and the beginning of subsidence due to the advancement of mining.
  • Second deformation stage (advancement of mining to 85 cm)
Due to the sufficiently long advance of the working face at 85 cm, a second major crack occurred, which was a horizontal separation fracture above both the immediate and main roofs (Figure 8b). However, the one above the main roof was much smaller than the one above the immediate roof, which was 2 mm in height at this stage. A small vertical crack appeared as well. This is due to the influence of the first deformation stage of the immediate roof and the high strength and stiffness of the main roof layer of the model, which was still in its start-up stage. The horizontal fracture of the overlying strata above the first deformation stage indicates shear and tensile failure.
  • Third deformation stage (advancement of mining to 95 cm)
When the working face reached the halfway point of its advancement, at 95 cm, the additional stress caused by mining increased rapidly, and the deformation of the main roof of the model changed from the start-up stage to the rapid deformation stage (Figure 8c). The underlying rock mass of the immediate roof layer of the structure bent and sank due to the pressure the overburden strata exerted on the model. The immediate roof deformation damage reached about 5 mm in height, and the movement range of the deformation of the model was significantly expanded.
  • Forth deformation stage (advancement of mining to 115 cm)
When the working face advanced to 115 cm, the strata movement curve of the immediate roof gradually changed from an asymmetric scoop shape to an approximately symmetrical parabolic shape (Figure 8d). The immediate roof underwent severe damage. The sinking of the main roof slightly increased; however, it continued to maintain and synchronize the movement of the overburden strata of the model.
  • Fifth deformation stage (advancement of mining to 140 cm)
When the working face advanced to 140 cm, the main roof bent and sank, but without major damage. Several layers above the main roof lost their support and bent slightly as well, causing about a 3 mm dip in height (Figure 8e). However, the separation fracture was slightly smaller due to the efficiency of the filling body’s support.
  • Sixth deformation stage (advancement of mining to 190 cm)
When the working face reached the final advancement distance of 190 cm, the immediate roof underwent its final fracture (Figure 8f). However, the immediate roof’s damage was smaller compared to that in the middle of the goaf. Each layer below the main key layer of the model bent and sank before entering a stable state.

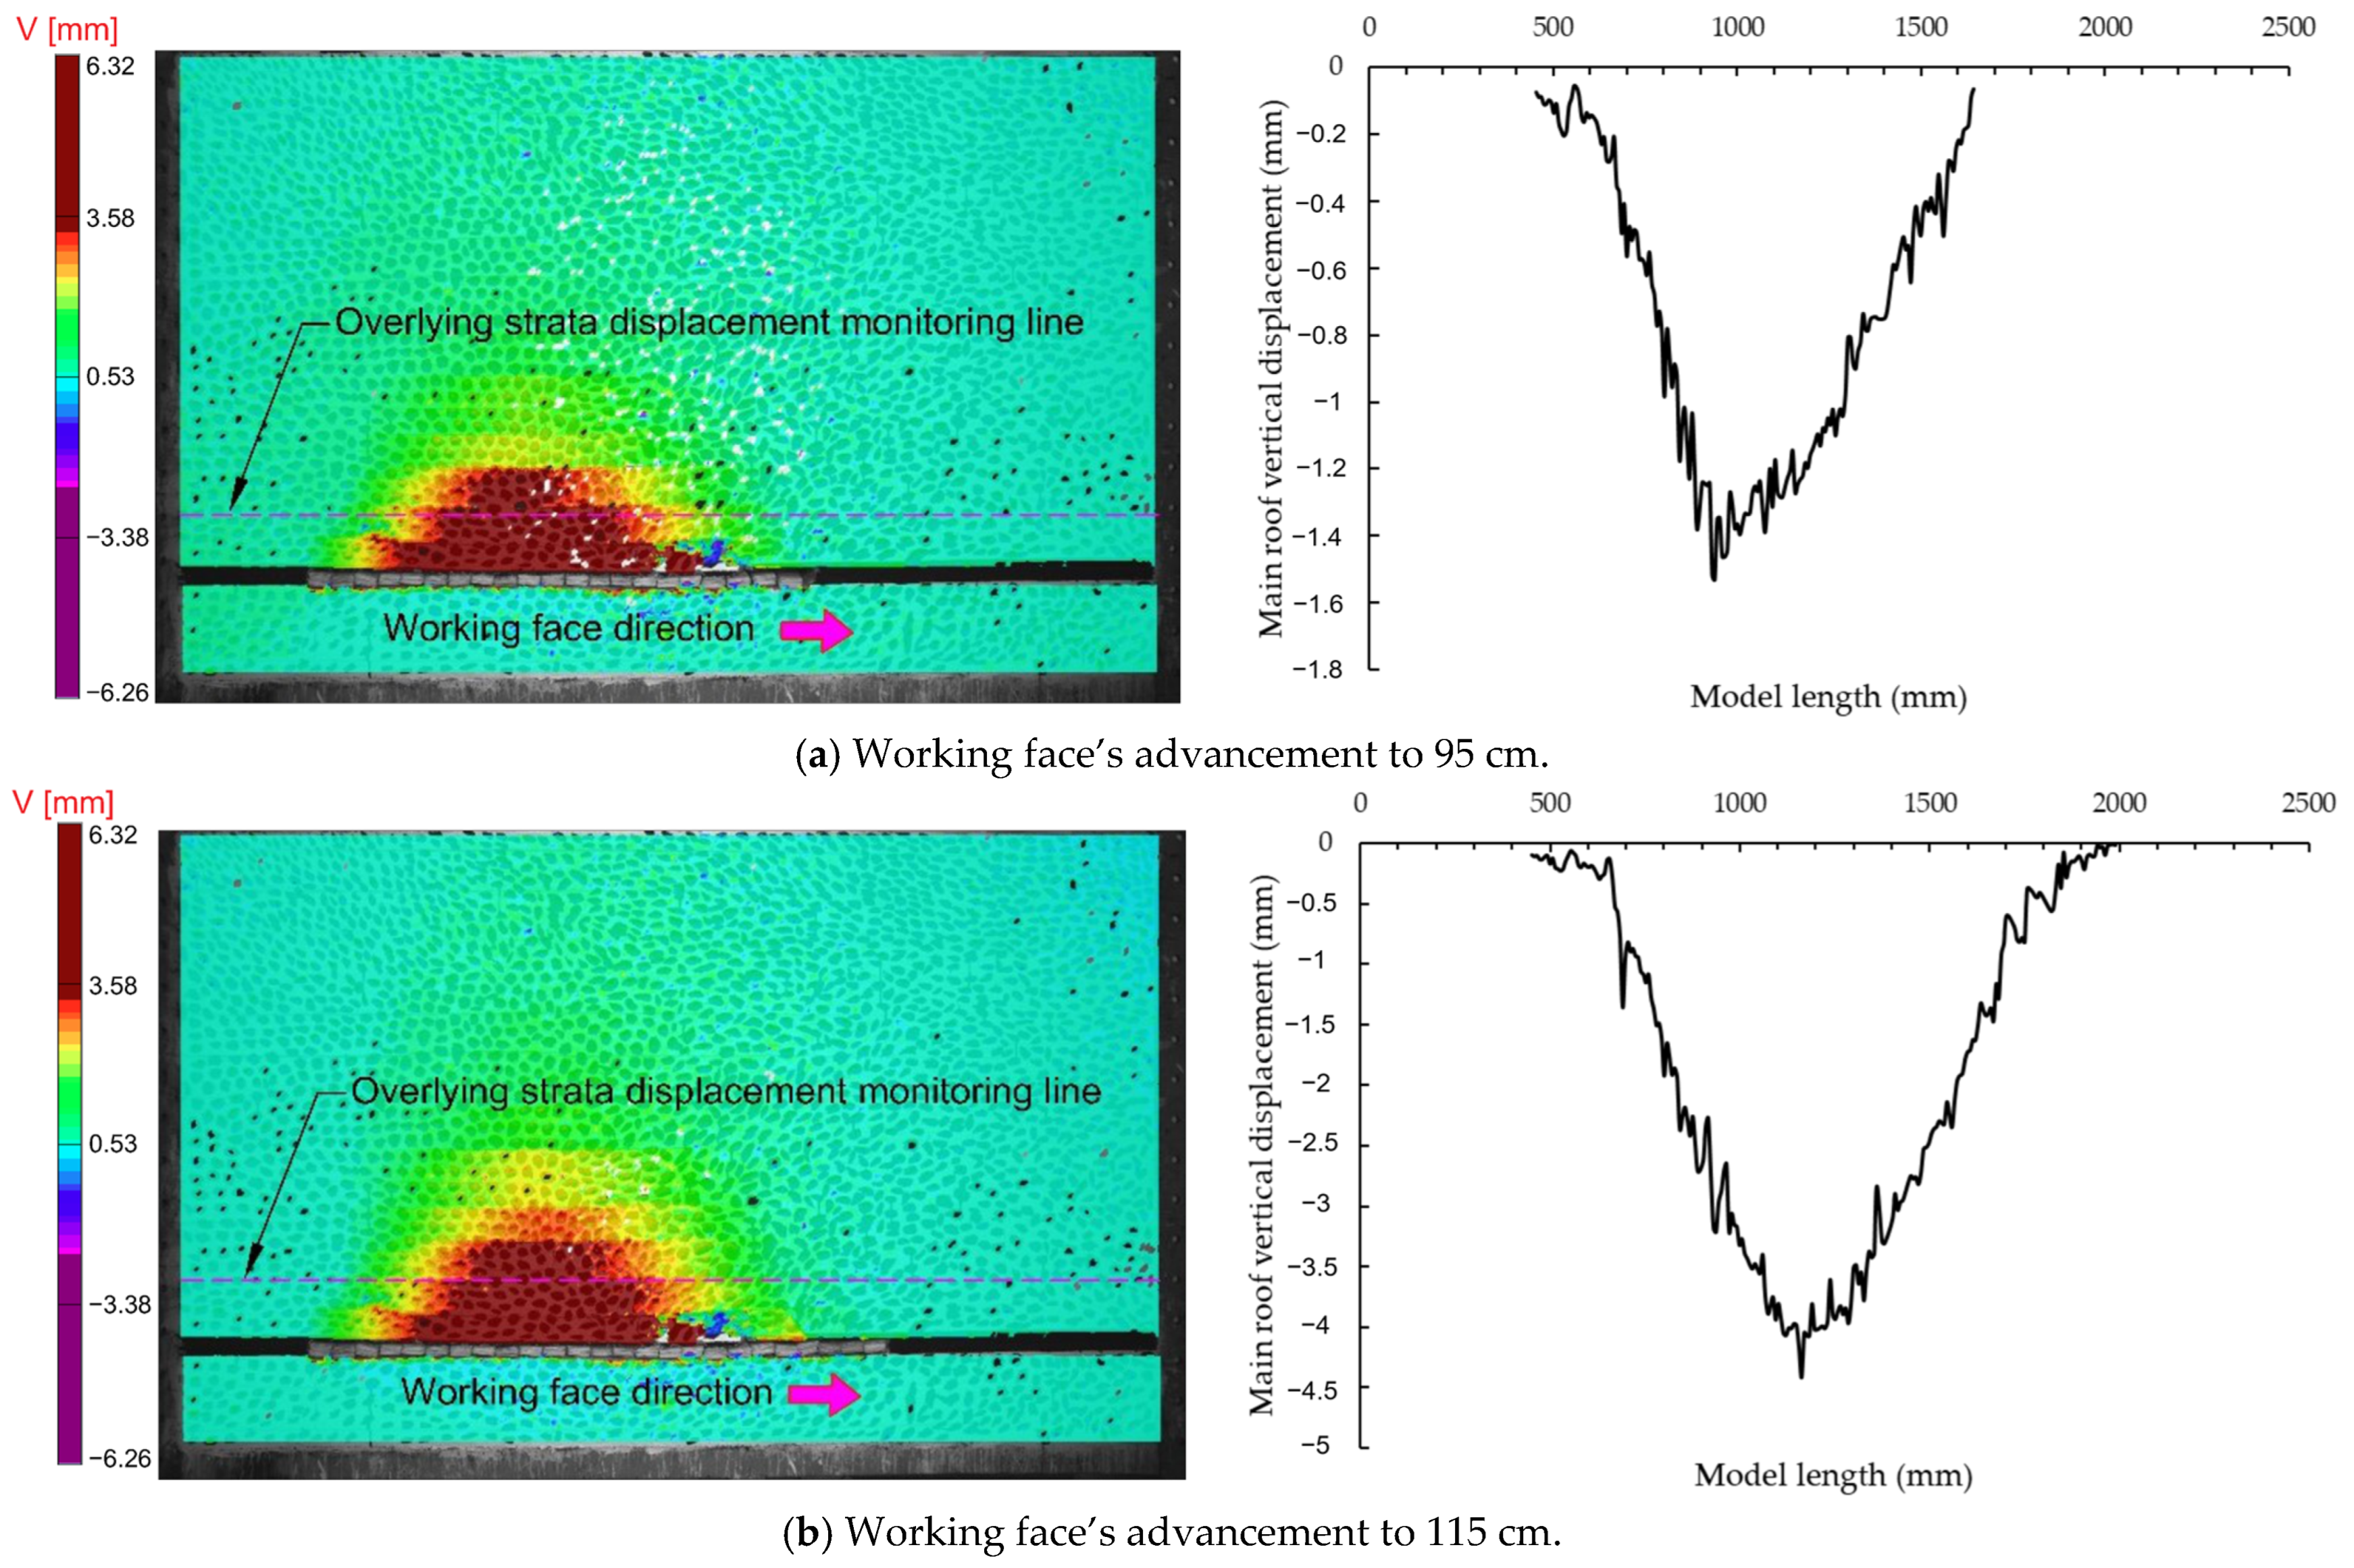
4.1.2. Vertical Displacement of the Main Roof

The results show that as the working face advances, the dynamic change in the main roof’s vertical displacement can be divided into four stages:
  • The slow deformation stage (0–95 cm from working face’s open-cutting)
The overlying strata load was borne by the left boundary coal pillar and the filling body. Because the advancement of the working face was still short, the left boundary coal pillar bore most of the overlying strata load, which slowed down and reduced the vertical displacement. The maximum vertical displacement of the main roof was 1.2 mm (Figure 10a).
  • The rapid deformation stage (95–115 cm from the working face’s open-cutting)
Due to the sufficiently long advancement of the working face, the left boundary coal pillar cannot offer enough force to support most of the overlying strata load. Therefore, the main roof’s vertical displacement increased rapidly, started to bend, and subsided, with a maximum vertical displacement value of 3.35 mm (Figure 10b).
  • The stable deformation stage (115–140 cm from the working face’s open-cutting)
As the working panel continued to advance, the filling body, with an 80% filling ratio, became the main body of support for the overlying strata load. Consequently, the vertical displacement of the main roof stabilized at a maximum value of 5.53 mm (Figure 10c).
  • The completely stable deformation stage (140–190 cm)
When the working face reached its final advancement, the filling body was fully compacted and bore the overlying strata load above the goaf area. At this stage, the maximum vertical displacement of the main roof was 5.68 mm, for which the dynamic change compared to the previous stage was quite small (Figure 10d).

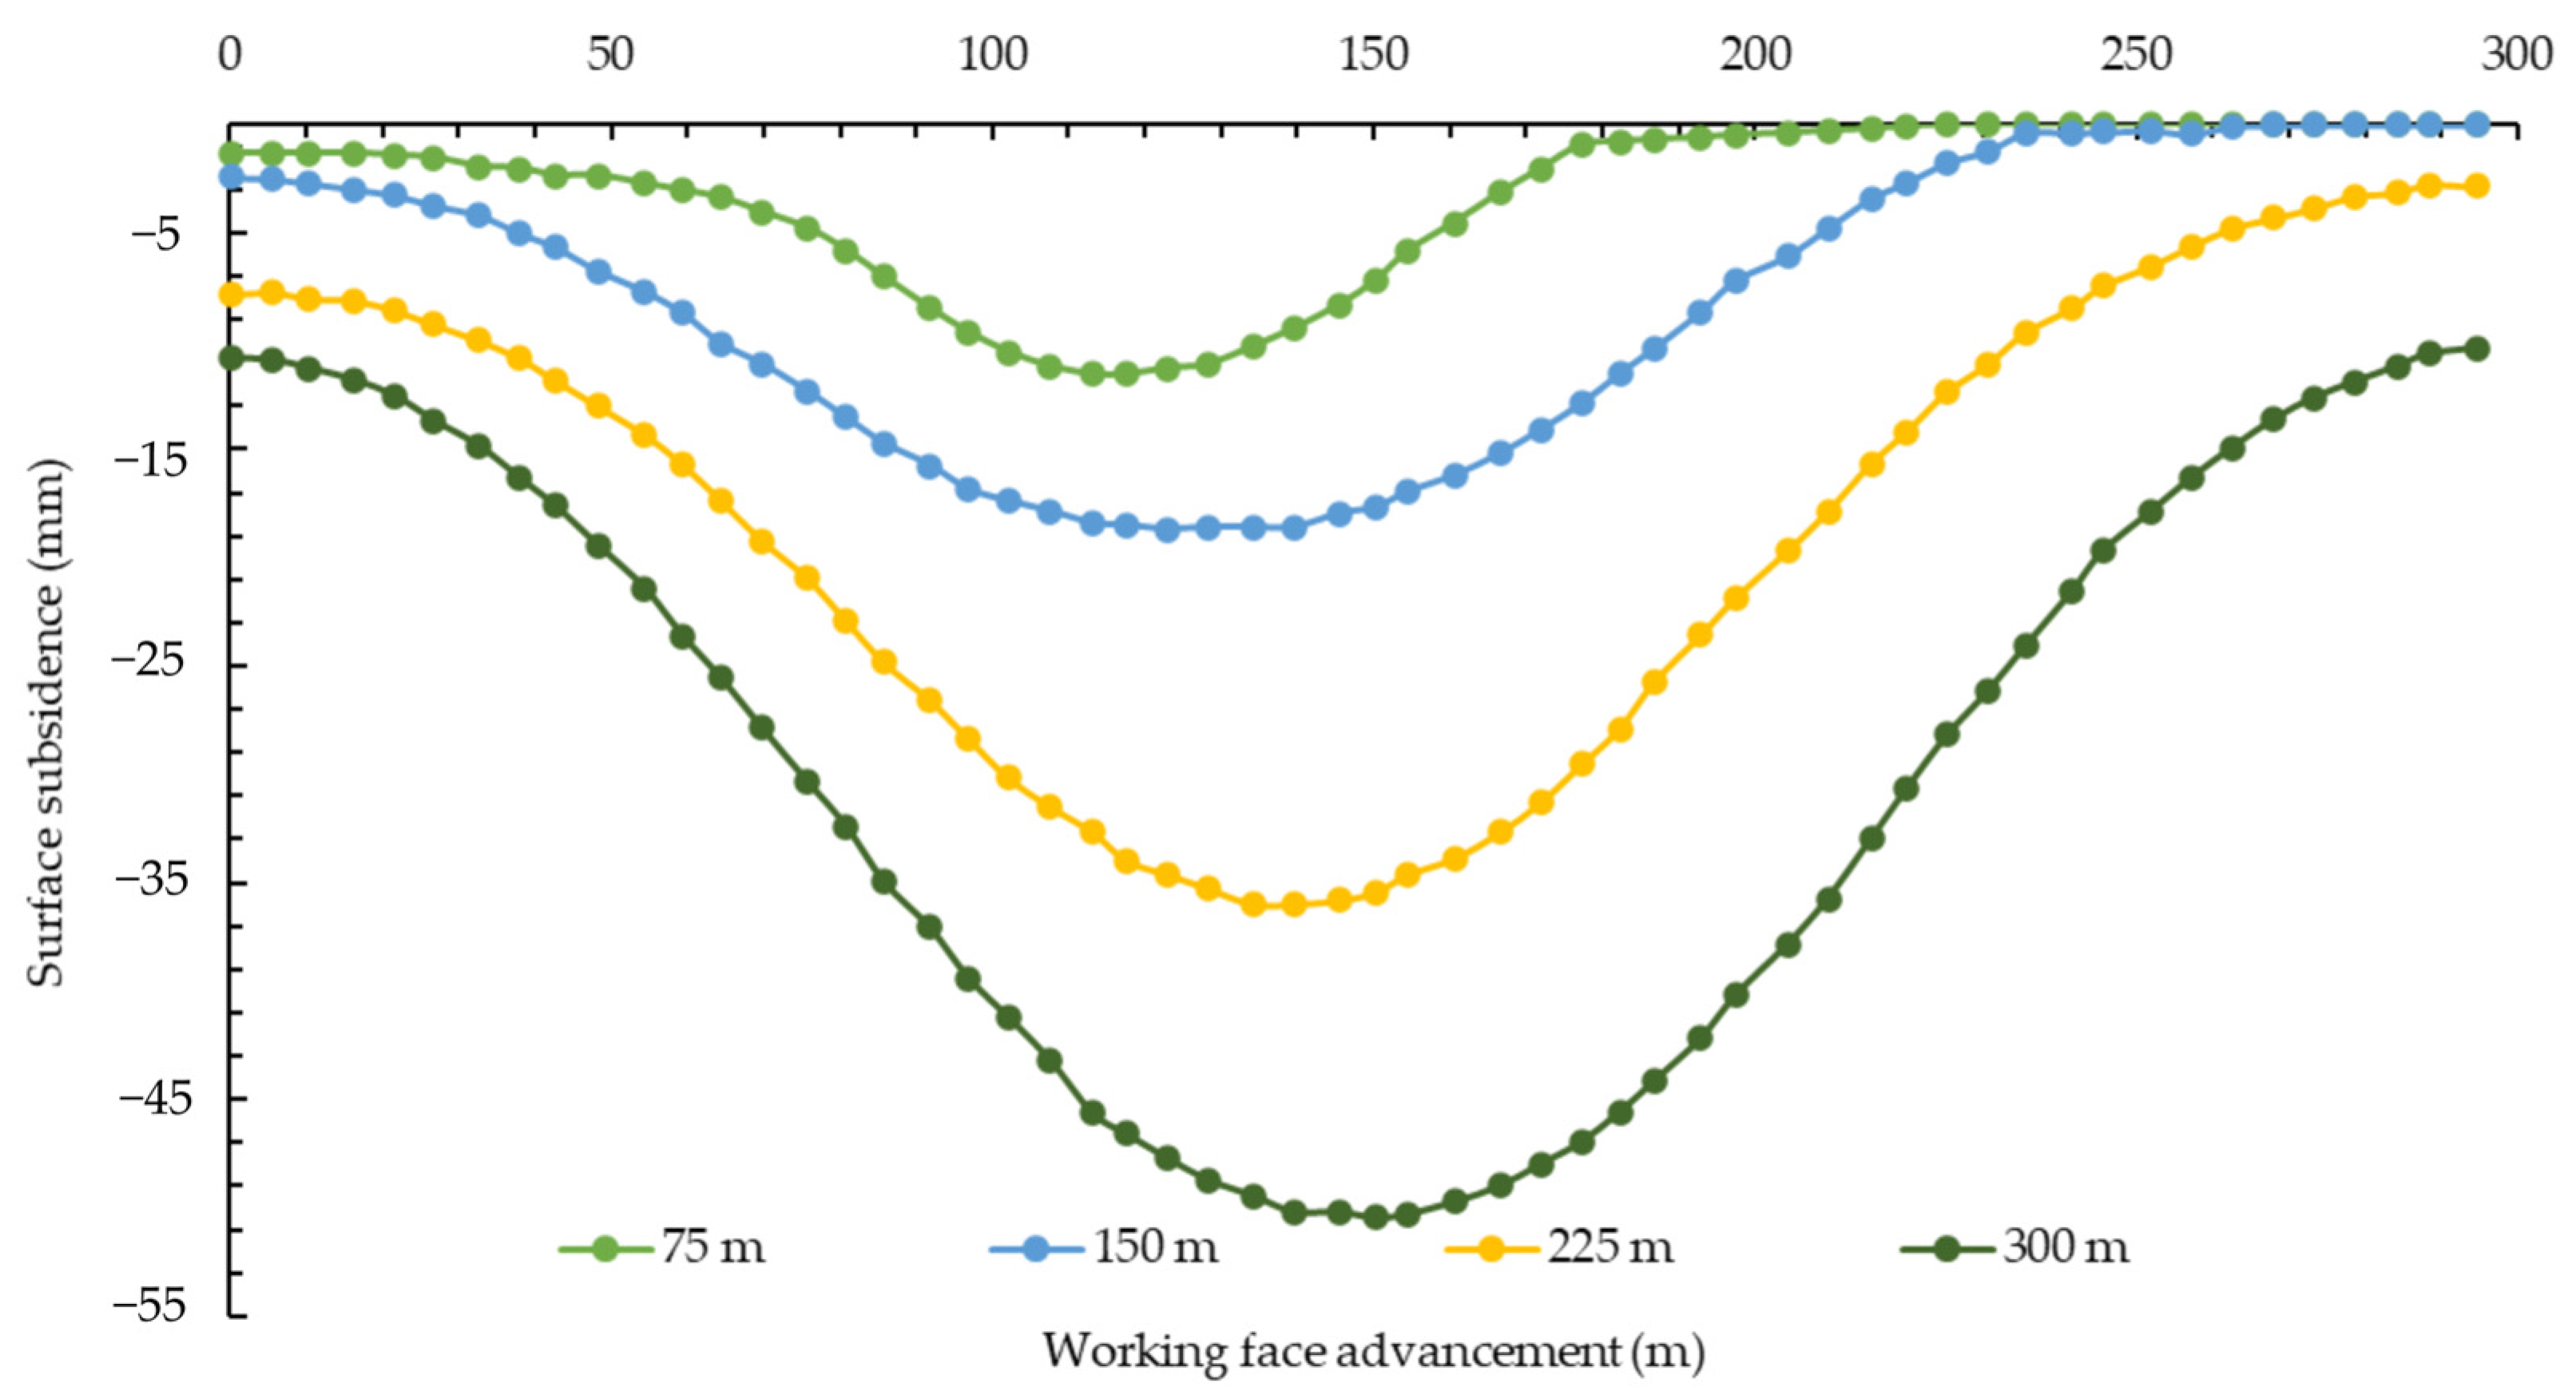
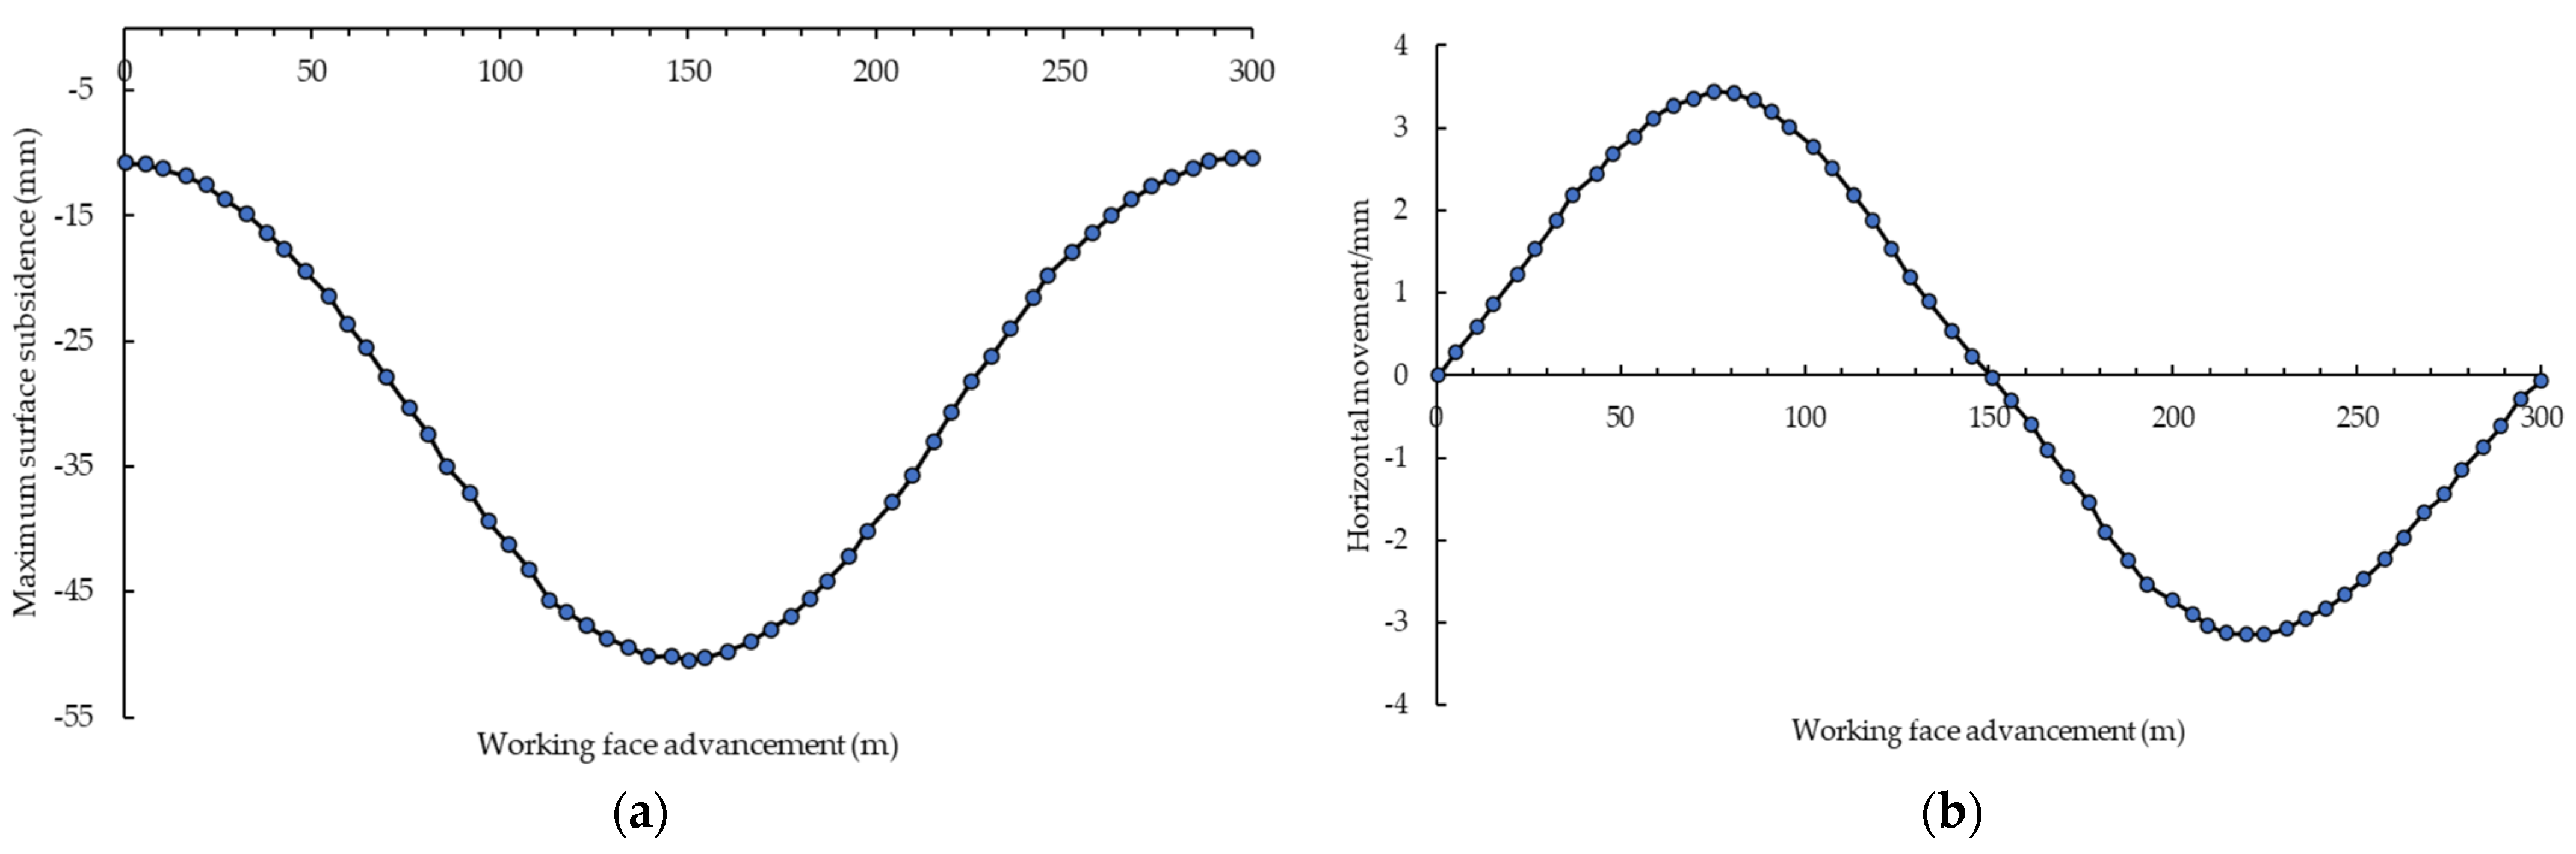
4.1.3. Surface Subsidence Characteristics

Surface subsidence and horizontal deformation are the main factors that characterize strata and ground subsidence. The results reveal that the backfill body can successfully bear the overlaying strata’s load. The surface’s subsidence and horizontal deformation are significantly improved compared to those created with the caving mining method. Consequently, the maximum surface subsidence in the middle of the model’s surface was 0.46 mm, and the maximum horizontal deformation was −0.009 to 0.0085 mm/mm. This demonstrates that solid filling can effectively regulate the strata and ground subsidence of overlaying strata by reducing surface sinking. Figure 11a,b successively show the surface subsidence and horizontal deformation results.

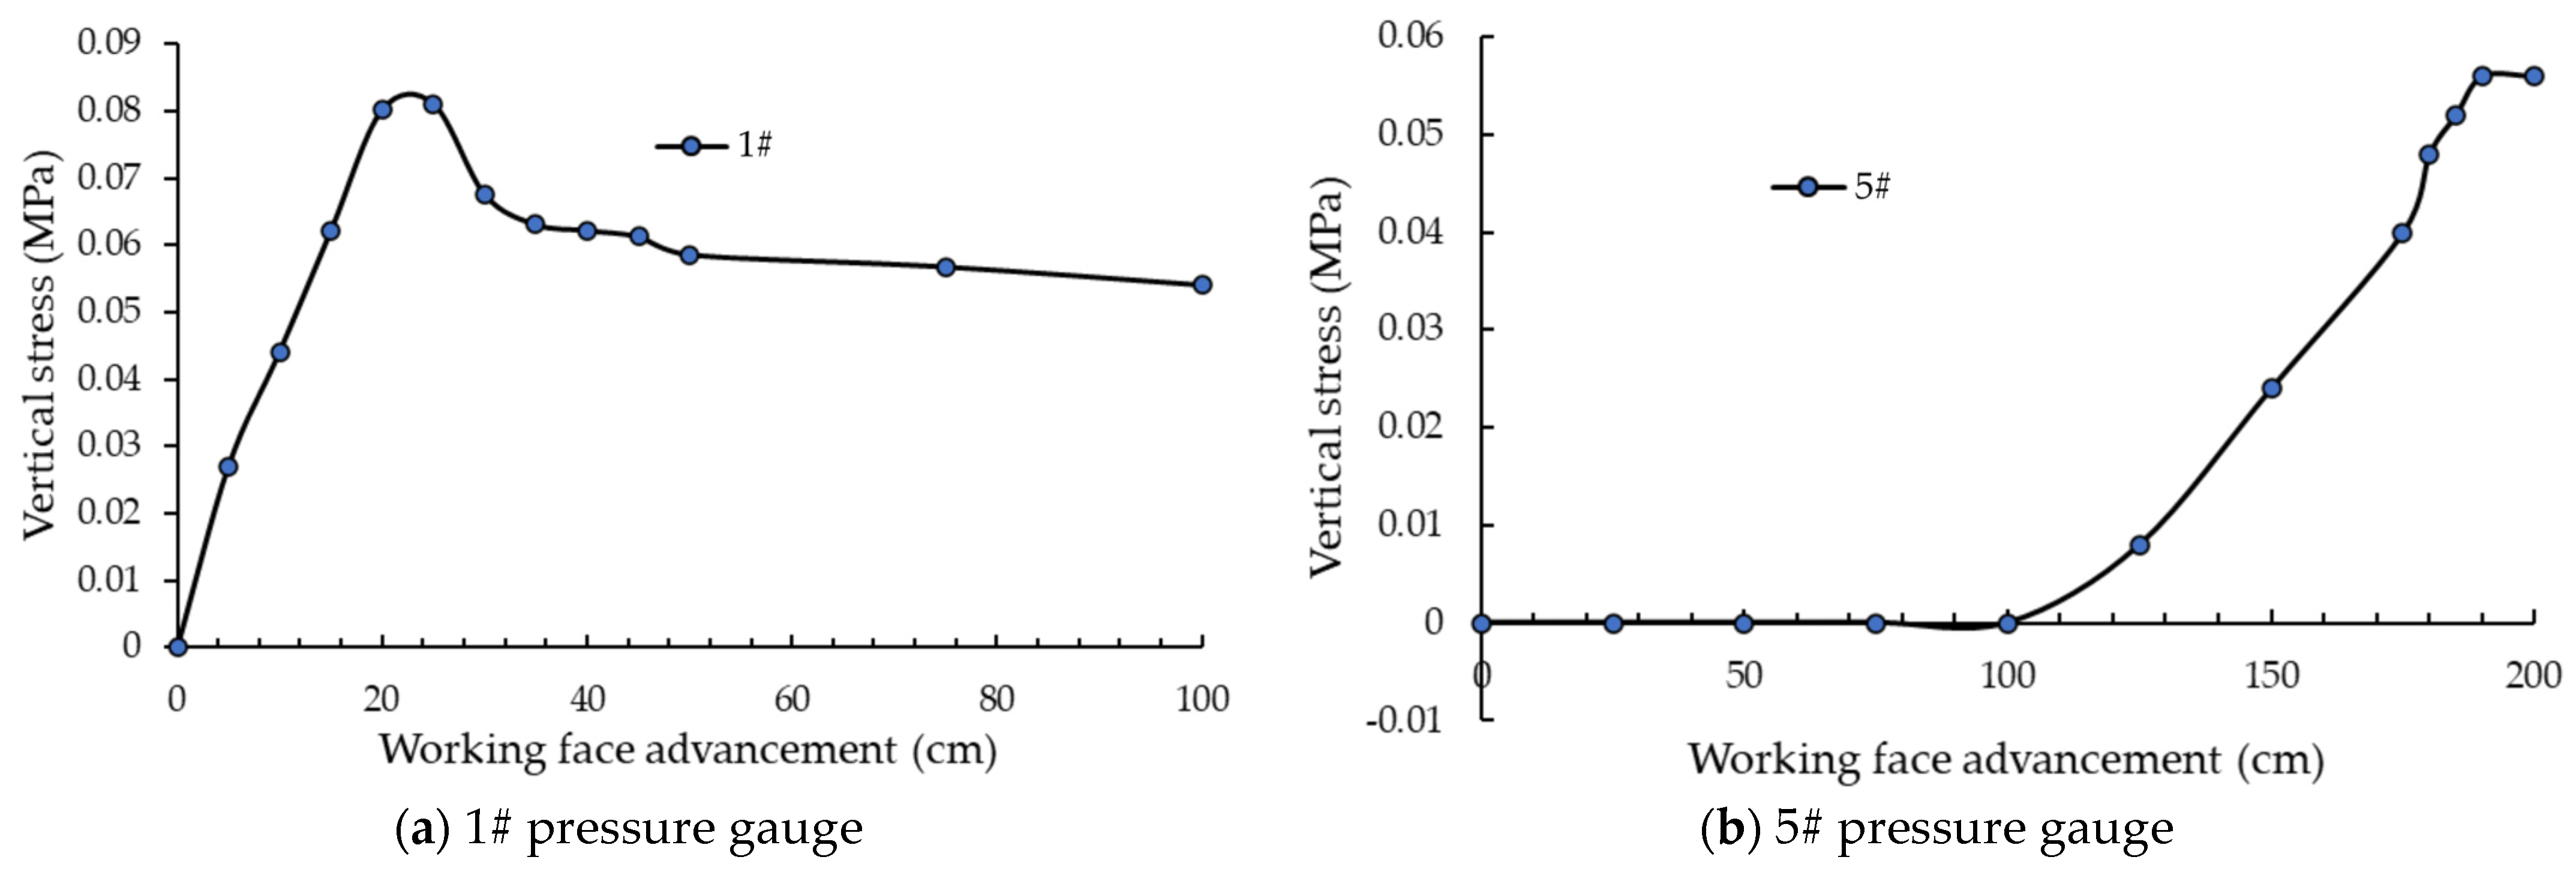
4.1.4. Variation Characteristics of Rock Mass Stress above the Boundary Coal Pillars

While advancing, the backfill working face was subject to disturbances from both the rock mass pressure above the boundary coal pillars and the ground pressure behavior of the overlying strata in the adjacent goaf due to the mining and its advancement. These disturbances influenced the variation characteristics of the vertical stress concentration factors from pressure gauges 1# and 5# above the boundary coal pillars, as shown in Figure 12.
The pressure gauges were set to zero before mining. However, due to mining disturbances, the degree of stress concentration generated at the 1# pressure gauge gradually increased as the working face advanced. When the working face advanced about 25 m from the open-cutting, the vertical stress reached its maximum peak of about 0.081 MPa, before starting to stabilize at 0.058 MPa for the rest of the mining process. On the other hand, the degree of stress concentration generated at the 5# pressure gauge shows that the pressure gradually increased when the working face reached 125 m from the open-cutting; until it reached its maximum peak at 0.056 MPa at 190 m from the open-cutting and remained stable until the end of the mining process.

4.1.5. Variation Characteristics of Overlying Strata Stress above the Goaf Area

The 2#, 3#, and 4# pressure gauges were precisely installed above the goaf area in the main roof to monitor the vertical stress’s variations with the advancement of the working face. The vertical stress variation characteristics of the 2#, 3#, and 4# pressure gauges from the beginning to the end of the mining process are shown in Figure 13.
The pressure gauges were set to zero before mining. However, the overlying pressure gradually increased when the working face started to advance and stabilized after the overlying strata transferred its pressure to the filling body. The vertical stress above the backfill area increased progressively until it became stable. The maximum vertical stress values measured by the 2#, 3#, and 4# pressure gauges were, successively, 0.07, 0.1, and 0.05 MPa, and they stabilized. This indicates that the filling body has an adequate capacity to support the overlying strata.

4.2. Numerical Simulation Model Results and Analysis

According to the simulation results for strata and ground subsidence above the backfill working face, before the open-cut operation began, the minimum vertical stress around the working face was about 17 MPa. As the excavation started and backfilling took place, this minimum stress value gradually increased near the roof and floor, leading to strata and ground subsidence (Figure 14). The maximum vertical stress during excavation reached about 22.33 MPa, indicating that the roof lost its support after coal cutting, leading to increased stress around the working face edges and backfill body. Yet, after the coal’s extraction, the vertical stress within the backfilled areas ranged from 13.7 to 16.62 MPa, approximately the same as the original stress (Figure 15). The compacted backfill body helps stabilize the vertical stress of the surrounding rock mass, enabling it to bear most of the roof pressure, reduce overall vertical stress levels, and control the overlying strata’s movement. The maximum stress value is about 22.33 MPa, and the average stress concentration coefficient is 1.86.
According to the analysis of Figure 16 and Figure 17, the maximum values of surface subsidence, horizontal movement, horizontal deformation, and inclination from the measuring line were 50.4 mm, −0.27 to 0.26 mm/m, −3.13 to 3.44 mm, and −0.07 to 0.08 m, respectively. The maximum surface subsidence and horizontal deformation meet the fortification requirements of the buildings on the surface above the backfill working face. Therefore, the backfill body has a great effect on controlling strata and ground subsidence.

4.3. Field Measurement Results and Analysis

In this paper, only the results from measuring the S-line are presented due to the accuracy of these measurement results. According to the monitoring results, the S-Line shows that the ground subsidence increased slowly as the working face advanced. When the working face was fully mined and had reached its full mining impact, the maximum subsidence reached its peak, at 47 mm at the S8 measuring point for the 4th measurement, due to the presence of a railway on the surface above this measuring point. Based on the predictions of the numerical simulation, the maximum surface inclination deformation value from the S-line ground subsidence value at the end of mining and with the backfill of the working face was 0.18 mm/m, which occurred at the S5 measuring point; the maximum curvature deformation value was 0.009 mm/m2, which can be basically ignored; the maximum horizontal movement deformation value was 38.9 mm; and the maximum horizontal deformation value was 1.32 mm/m, which also occurred at the S5 measuring point. These deformation values meet the defense standards of the 2017 “Regulations on Coal Pillar Retention and Compressed Coal Mining for Buildings, Water Bodies, Railways, and Main Shafts and Lanes.” The cumulative subsidence value of the S-Line measuring points is shown in Figure 18.

5. Discussion

The ground subsidence values above the backfilled area from the physical simulation and numerical simulation, and those measured on site, were analyzed to determine the ultimate ground subsidence and evaluate the effect of solid backfill mining on ground-surface infrastructure. It was found that the 80% filling ratio was able to control the strata and ground subsidence in the two simulated experiments and those measured on site. The maximum ground subsidence value of the field measurement is 47 mm, the maximum ground subsidence value of the physical simulation is 0.46 mm, and the maximum ground subsidence value of the numerical simulation is 50.4. These three values are much smaller than the extreme surface subsidence value expected from the prediction calculation, which was 281 mm. Moreover, due to their stress similarity, the vertical stress results from the physical analog modeling show consistency with the field measurements as well as the numerical simulation. The vertical stress of the physical simulation above the goaf ranges from 0.05 to 0.1 MPa, and the peak values of the vertical stress above the left and right boundary coal pillars are, respectively, 0.081 and 0.056 MPa. These results indicate that the backfill body effectively distributed the vertical stress above the goaf area, reducing the stress concentration, the vertical movement of the overlaying strata above the goaf area, and ground subsidence. This was one and the same for the numerical simulation’s vertical stress; above the goaf it ranges from 13.7 to 16.62 MPa, and the peak value of the vertical stress around the working face edges and backfill body is 22.33 MPa. The physical and numerical simulations are consistent with the field measurement results. Furthermore, the damage level of the buildings on the ground is level I and consistent with the predicted results, without the need for repair or reinforcement. This means that the backfill body greatly reduces and controls ground subsidence and ensures the safety of ground-surface infrastructure. Contrary to the caving method, no obvious damage or cracks were detected in the ground-surface infrastructure above the working face. Therefore, a solid backfill method with an 80% filling ratio is effective and should be used for ground control in similar mining operations. This method has been shown to efficiently prevent ground subsidence and distribute vertical stress, reducing the risk of damage to surface infrastructure. To maintain a steady workflow and meet the mine’s objectives, backfilling efficiency is very important. When the backfilling process is inefficient, it can affect subsequent activities and overall project schedules. The method’s performance in the Tangshan coal mine implies that it can be used reliably in other coal mines to improve ground stability and assure the safety of surface buildings. Further study and continual monitoring, especially in different mining layouts and at different sizes, should be carried out to optimize the filling ratio and improve the backfill materials for even better results.

6. Conclusions

In this paper, a detailed, thorough, and comprehensive case study of strata and ground subsidence in a longwall coal mine is presented through three research methods: 2D physical analog modeling, a 3D numerical simulation, and field measurements based on the geological conditions of a backfill working face in the Tangshan coal mine.
In the physical analog model, which had a geometric similarity ratio of 100:1, movement similarity ratio to 10:1, and stress similarity ratio to 166.7:1, MatchID software was used to capture the variation characteristics of the overlying strata’s movement and the ground subsidence in the model during the mining and backfill of the working face when using a filling ratio of 80% and according to the theoretical analysis and the field measurement results.
In the numerical simulation, a model was built using FLAC3D software to simulate and analyze strata and ground subsidence above the backfill working face during the mining and backfilling process, also under filling ratio of 80%.
In the field measurements, the CORS system was used to monitor the ground subsidence. The monitoring results show the great control effect of the backfill body on ground subsidence and that it met damage level I for the buildings on the ground, with slight damage seen compared to caving mining.
The maximum ground subsidence seen with the physical analog modeling, numerical simulation, and field measurement was, respectively, 0.46 mm, 50.4 mm, and 47 mm; much smaller than the extreme surface subsidence value predicted, which was 281 mm. These results demonstrate that these two different simulation methods are consistent, which validates the efficiency of the solid backfilling method in controlling strata and ground subsidence. It is hoped that this present research can offer some information regarding strata and ground subsidence control in longwall coal mines.

Author Contributions

Conceptualization and methodology, M.G.D., Q.Z., M.L. and P.H.; software, M.G.D., Z.W. and C.S.F.; Validation, M.G.D., M.L. and Q.Z.; writing—original draft preparation, M.G.D., Z.W. and Q.Z.; writing—review and editing, M.G.D. and Z.W.; supervision and funding acquisition, Q.Z. All authors have read and agreed to the published version of the manuscript.

Funding

This work was supported by the National Natural Science Foundation of China [52130402, 52274142] and the Natural Science Foundation of Jiangsu Province [BK20231498].

Institutional Review Board Statement

Not applicable.

Informed Consent Statement

Not applicable.

Data Availability Statement

The original contributions presented in the study are included in the article, further inquiries can be directed to the corresponding authors.

Acknowledgments

The authors would like to extend their gratitude to their research team for their collaborative efforts in the collection and analysis of these data. Furthermore, the authors are thankful to the anonymous academic community for their guidance, feedback, and encouragement.

Conflicts of Interest

The authors declare no conflicts of interest.

References

  1. Li, B.; Zhou, N.; Qi, W.; Li, A.; Cui, Z. Surface Subsidence Control during Deep Backfill Coal Mining: A Case Study. Adv. Civ. Eng. 2020, 2020, 6876453. [Google Scholar] [CrossRef]
  2. Zhang, J.; Sun, Q.; Fourie, A.; Ju, F.; Dong, X. Risk assessment and prevention of surface subsidence in deep multiple coal seam mining under dense above-ground buildings: Case study. Hum. Ecol. Risk Assess. Int. J. 2018, 25, 1579–1593. [Google Scholar] [CrossRef]
  3. Guo, K.; Guo, G.; Li, H.; Wang, C.; Gong, Y. Environmental Effects Strata movement and surface subsidence prediction model of deep backfilling mining. Energy Sources Part A Recover. Util. Environ. Eff. 2020, 1–15. [Google Scholar] [CrossRef]
  4. Jahanbakhshzadeh, A.; Aubertin, M.; Li, L. Analysis of the Stress Distribution in Inclined Backfilled Stopes Using Closed-form Solutions and Numerical Simulations. Geotech. Geol. Eng. 2017, 36, 1011–1036. [Google Scholar] [CrossRef]
  5. Li, M.; Peng, Y.; Zhang, J.; Zhu, C.; Ma, D.; Huang, P. Effects of compressive deformation of backfill materials on strata movement and stress evolution in deep gangue backfill mining. Bull. Eng. Geol. Environ. 2022, 81, 361. [Google Scholar] [CrossRef]
  6. Benzaazoua, M.; Bussière, B.; Demers, I.; Aubertin, M.; Fried, É.; Blier, A. Integrated mine tailings management by combining environmental desulphurization and cemented paste backfill: Application to mine Doyon, Quebec, Canada. Miner. Eng. 2008, 21, 330–340. [Google Scholar] [CrossRef]
  7. Solismaa, S.; Torppa, A.; Kuva, J.; Heikkilä, P.; Hyvönen, S.; Juntunen, P.; Benzaazoua, M.; Kauppila, T. Substitution of cement with granulated blast furnace slag in cemented paste backfill: Evaluation of technical and chemical properties. Minerals 2021, 11, 1068. [Google Scholar] [CrossRef]
  8. Zhang, J.; Zhang, Q.; Sun, Q.; Gao, R.; Germain, D.; Abro, S. Surface subsidence control theory and application to backfill coal mining technology. Environ. Earth Sci. 2015, 74, 1439–1448. [Google Scholar] [CrossRef]
  9. Kostecki, T.; Spearing, A. Influence of backfill on coal pillar strength and floor bearing capacity in weak floor conditions in the Illinois Basin. Int. J. Rock Mech. Min. Sci. 2015, 76, 55–67. [Google Scholar] [CrossRef]
  10. Jahanbakhshzadeh, A.; Aubertin, M.; Li, L. A New Analytical Solution for the Stress State in Inclined Backfilled Mine Stopes. Geotech. Geol. Eng. 2017, 35, 1151–1167. [Google Scholar] [CrossRef]
  11. Geldmacher, T.; Studeny, A.; Al Heib, M. Numerical Modelling and Empirical Tool for Subsidence Prediction by the Use of Backfill. 6th Int Symp “High Perform Mining” (AIMS 2014). (Aachen, Germany. ineris-01855561). Available online: https://ineris.hal.science/ineris-01855561/document (accessed on 5 August 2024).
  12. Jiang, Y.; Misa, R.; Sroka, A.; Jiang, Y. Mitigating land subsidence damage risk by fly ash backfilling technology: An injection case in overburden of coal mining. Pol. J. Environ. Stud. 2021, 30, 655–661. [Google Scholar] [CrossRef]
  13. Li, B.; Yan, H.; Zhang, J.; Zhou, N. Compaction property prediction of mixed gangue backfill materials using hybrid intelligence models: A new approach. Constr. Build. Mater. 2020, 247, 118633. [Google Scholar] [CrossRef]
  14. Sepehri, M.; Apel, D.B.; Hall, R.A. Prediction of mining-induced surface subsidence and ground movements at a Canadian diamond mine using an elastoplastic finite element model. Int. J. Rock Mech. Min. Sci. 2017, 100, 73–82. [Google Scholar] [CrossRef]
  15. Yadav, A.; Behera, B.; Sahoo, S.K.; Singh, G.S.P.; Sharma, S.K. Numerical Analysis of the Gob Stress Distribution Using a Modified Elastic Model as the Gob Constitutive Model. J. Inst. Eng. Ser. D 2020, 101, 127–139. [Google Scholar] [CrossRef]
  16. Zhu, C.; Zhang, J.; Li, M.; He, Z.; Wang, Y.; Lan, Y. Effect mechanism of strata breakage evolution on stope deformation in extra-thick coal seams. Alex. Eng. J. 2022, 61, 5003–5020. [Google Scholar] [CrossRef]
  17. Zhao, T.-B.; Fu, Z.-Y.; Li, G. In situ investigation into fracture and subsidence of overburden strata for solid backfill mining. Arab. J. Geosci. 2018, 11, 398. [Google Scholar] [CrossRef]
  18. Sroka, A.; Misa, R.; Tajdus, K.; Klaus, M.; Meyer, S.; Feldhaus, B. Forecast of rock mass and ground surface movements caused by the convergence of salt caverns for storage of liquid and gaseous energy carriers. Geo Kinematischer Tag. 2017, 1, 34–51. [Google Scholar]
  19. Skrzypkowski, K. Comparative analysis of the mining cribs models filled with gangue. Energies 2020, 13, 5290. [Google Scholar] [CrossRef]
  20. Li, Z.; Yang, K.; Wei, T.; Liu, C.; Zhou, P.; Miao, J. Strata pressure behavior and overlying strata movement characteristics of slicing backfill mining in thick coal seams. Energy Explor. Exploit. 2023, 41, 1015–1032. [Google Scholar] [CrossRef]
  21. Zhang, Q.; Zhang, J.; Wu, Z.; Chen, Y. Overview of Solid Backfilling Technology Based on Coal-Waste Underground Separation in China. Sustainability 2019, 11, 2118. [Google Scholar] [CrossRef]
  22. Qiang, Z.; Yang, K.; Zhang, J.; Wei, Y.; Liu, X.; Wu, Z.; Song, W.; Xiling, X. Monitoring and measurement analysis of key indexes for the implementation of mining, dressing, backfilling, and controlling technology in coal resources—A case study of Tangshan Mine. Energy Sci. Eng. 2022, 10, 680–693. [Google Scholar] [CrossRef]
  23. Jiang, Z.; He, K.; Zhang, D. A review of intelligent coal gangue separation technology and equipment development. Int. J. Coal Prep. Util. 2023, 1–17. [Google Scholar] [CrossRef]
  24. Tripathy, D.P.; Reddy, K.G.R. Novel Methods for Separation of Gangue from Limestone and Coal using Multispectral and Joint Color-Texture Features. J. Inst. Eng. Ser. D 2017, 98, 109–117. [Google Scholar] [CrossRef]
  25. Zhang, Q.; Shi, P.; Li, M.; Zong, T.; Song, W. A Design Method and Application of Backfilling Hydraulic Supports in Reforming Top-Coal Caving Hydraulic Supports. Appl. Sci. 2023, 13, 987. [Google Scholar] [CrossRef]
  26. Gu, Z.; Zhao, Y.; Gao, R.; Wu, L. Research on the Prediction Model of Mine Subsidence Based on Object-Oriented and Probability Integration Method. Geofluids 2022, 2022, 8107024. [Google Scholar] [CrossRef]
  27. Li, J.; Yu, X.; Liang, Y. A prediction model of mining subsidence in thick loose layer based on probability integral model. Earth Sci. Res. J. 2020, 24, 367–372. [Google Scholar] [CrossRef]
  28. Wei, T.; Guo, G.; Li, H.; Wang, L.; Jiang, Q.; Jiang, C. A novel probability integral method segmental modified model for subsidence prediction applicable to thick loose layer mining areas. Environ. Sci. Pollut. Res. 2023, 30, 52049–52061. [Google Scholar] [CrossRef]
  29. Huo, W.; Li, H.; Guo, G.; Wang, Y.; Yuan, Y. Surface Subsidence Prediction Method for Backfill Mining in Shallow Coal Seams with Hard Roofs for Building Protection. Sustainability 2023, 15, 15791. [Google Scholar] [CrossRef]
  30. Lifeng, L.; Pengliang, L.; Wenhua, Z. Study on equivalent mining height of filling mining based on the optimal particle size gradation of gangue solid. China Min. Mag. 2023, 32, 103–107. [Google Scholar]
Figure 1. The locations and layout of the backfill working face beneath Tangshan City.
Applsci 14 06924 g001
Figure 2. ZC4800/16/30 backfill hydraulic support structure.
Applsci 14 06924 g002
Figure 3. Monitoring system’s layout and its multiple mechanical parameters.
Applsci 14 06924 g003
Figure 4. Pressure gauges’ layout.
Applsci 14 06924 g004
Figure 5. Schematic diagram of the 3D numerical model.
Applsci 14 06924 g005
Figure 6. Arrangement of ground deformation measuring lines S and E.
Applsci 14 06924 g006
Figure 7. Contour map of ground subsidence, in mm, seen with a filling ratio of 80%.
Applsci 14 06924 g007
Figure 8. Structural evolution of the overlying strata as the working face advanced.
Applsci 14 06924 g008
Figure 9. Displacement variation of overlying strata at the end of the mining process.
Applsci 14 06924 g009
Figure 10. Vertical displacement evolution characteristics of the main roof.
Applsci 14 06924 g010aApplsci 14 06924 g010b
Figure 11. Surface subsidence and horizontal deformation curve of fully mined coal seam.
Applsci 14 06924 g011
Figure 12. The vertical stress variation characteristics seen above the boundary coal pillars.
Applsci 14 06924 g012
Figure 13. The vertical stress variation characteristics of the main roof above the goaf area.
Applsci 14 06924 g013
Figure 14. Surface subsidence at different advancement distances.
Applsci 14 06924 g014
Figure 15. Vertical stress distribution at different advancement distances.
Applsci 14 06924 g015
Figure 16. (a) Maximum surface subsidence and (b) horizontal movement.
Applsci 14 06924 g016
Figure 17. (a) Horizontal deformation and (b) inclination deformation.
Applsci 14 06924 g017
Figure 18. Cumulative subsidence values of S-line measuring points.
Applsci 14 06924 g018
Table 1. Overview of the backfill working face’s layout parameters.
ParametersConditions
Production time November 2017–December 2018
Coal seam conditionUnder wellbore and surface structures
Ground elevation+17 m
Depth−582 to −709 m
Inclination angle13°, inclined upward mining
Coal seam height2.0–2.5 m
Coal seam structure and stabilitySimple and complex
Backfilling system Full mining and full backfilling
Face length 65 m
Strike length652 m
Coal production/ton178,524
Gangue filling/ton231,416
Filling ratio1:1.30
Control effect of stop pressure and surface subsidenceHigher
Mine pressure control requirementsCompacting rate > 80%
Mining and backfilling step/day 5 m
Backfilling efficiency ton/hour64.35
Table 2. Key equipment used on the backfill working face.
Device NameModelQuantity
1Coal shearerMG200/500-QWD1
2Front scraper chain conveyorSGZ730/4001
3LoaderSZZ730/2001
4Hydraulic supportZC4800/16/3044
5CrusherPCM-1101
6Belt conveyorSDJ8001
7Belt conveyorSDJ-1501
8Porous bottom-dump conveyorSGZ630/2641
Table 3. Mechanical parameters of the physical simulation model.
StratumCompressive Stress (MPa)Simulate Stress (KPa)
Medium-grained sandstone2193
Fine-grained sandstone54162
Sandy mudstone2575
Mudstone20.2760.87
Sandstone1751
5th coal seam9.7329.22
Fine sandstone38.91116.85
Table 4. The proportions of the materials used for the physical similarity model.
LithologyThicknessTotal Dry Weight/kgm1m2m3m4
Real (m)Model (m)
1Fine-grained sandstone5567.5257.866.762.907.50
2Mudstone445447.244.722.046.3
3Sandy mudstone5567.5257.866.762.907.50
4Medium-grained sandstone1111162.04129.622.79.7418
5Sandy mudstone1414189.04151.226.4811.3621.02
6Medium-grained sandstone6681.0264.8011.354.879.00
7Mudstone3340.535.443.541.524.75
8Medium-grained sandstone2828378.08302.452.9622.7242.04
9Sandy mudstone6681.0264.8011.354.879.00
10Fine-grained sandstone222723.622.361.023.15
11Sandy mudstone445447.254.722.035.20
124th coal seam1.51.520.2517.721.770.762.38
13Fine-grained sandstone445447.254.722.035.20
14Sandy mudstone5567.5257.866.762.907.50
15Fine-grained sandstone3340.535.443.541.524.75
16Mudstone3340.535.443.541.524.75
17Fine-grained sandstone6681.0264.8011.354.879.00
18Sandstone1818242.98208.224.3410.4427
19Mudstone6681.0264.8011.354.879.00
205th coal seam2.52.533.7628.933.381.453.75
21Mudstone222723.622.361.023.15
22Fine-grained sandstone7794.5275.6013.245.6810.51
23Mudstone445447.244.722.046.3
NB: m1 represents the mass of river sand, m2 the mass of calcium carbonate, m3 the mass of gypsum, and m4 the mass of water.
Table 5. Mechanical parameters of each layer in the model.
LithologyDensity t/m3Bulk
Modulus/GPa
Shear
Modulus/GPa
Cohesion
/MPa
Internal Friction Angle/°Tensile Strength/MPa
1Fine-grained sandstone12.542.71.63.2421.29
2Mudstone12.558.84.32.082.0
3Sandy mudstone12.605.13.31.0282.0
4Medium-grained sandstone12.564.22.95.0341.3
5Sandy mudstone22.605.13.31.0282.0
6Medium-grained sandstone22.564.22.95.0341.3
7Mudstone22.558.84.32.082.0
8Medium-grained sandstone32.564.22.95.0341.3
9Sandy mudstone32.605.13.31.0282.0
10Fine-grained sandstone22.542.71.63.2421.29
11Sandy mudstone42.605.13.31.0282.0
124th coal seam1.411.730.820.18200.2
13Fine-grained sandstone32.542.71.63.2421.29
14Sandy mudstone52.605.13.31.0282.0
15Fine-grained sandstone42.542.71.63.2421.29
16Mudstone32.558.84.32.082.0
17Fine-grained sandstone52.542.71.63.2421.29
18Sandstone12.5223.313.28.3323.1
19Mudstone42.558.84.32.082.0
205th coal1.411.730.820.18200.2
21Mudstone52.558.84.32.082.0
22Fine-grained sandstone62.542.71.63.2421.29
23Mudstone62.558.84.32.082.0
Table 6. Parameters of the probability integral method used for determining surface subsidence.
Mining DepthFilling RatioSubsidence
Coefficient
Horizontal Movement CoefficientTangent of Main Influence AngleInflection Point
Displacement
700 m80%q = 0.74b = 0.371.8°0
Table 7. China Coal Association’s brick–concrete structure damage grade system.
Damage LevelDamage ClassificationSurface Deformation Value
Horizontal (mm/m)Curvature (×10−3/m)Tilt (mm/m)
ISlight damage≤2≤0.2≤3
IIMild damage≤4≤0.4≤6
IIIModerate damage≤6≤0.6≤10
IVSevere damage>6>0.6>10
Table 8. Extreme values of movement and deformation of surface buildings and structures after mining and backfilling.
Subsidence (mm)Horizontal Movement (mm)Horizontal Deformation (mm/m)Inclined Deformation (mm/m)
Vertical
Direction
Horizontal
Direction
Vertical
Direction
Horizontal
Direction
Vertical
Direction
Horizontal
Direction
−281−110/122−86/122−1.19/0.56−0.89/0.53−1.2/0.6−0.9/0.55
Disclaimer/Publisher’s Note: The statements, opinions and data contained in all publications are solely those of the individual author(s) and contributor(s) and not of MDPI and/or the editor(s). MDPI and/or the editor(s) disclaim responsibility for any injury to people or property resulting from any ideas, methods, instructions or products referred to in the content.

