Article

Behavior and Reliable Design Methods of Axial Compressed Dune Sand Concrete-Filled Circular Steel Tube Columns

1
School of Civil Engineering, Central South University, Changsha 410075, China
2
China Energy Technology & Economics Research Institute, Beijing 102211, China
3
China Construction Third Engineering Bureau Group Co., Ltd., Wuhan 430064, China
*
Author to whom correspondence should be addressed.
Appl. Sci. 2024, 14(16), 6939; https://doi.org/10.3390/app14166939
Submission received: 14 July 2024 / Revised: 30 July 2024 / Accepted: 1 August 2024 / Published: 8 August 2024
(This article belongs to the Section Civil Engineering)

Abstract

:
An innovative composite structural element, the dune sand concrete-filled circular steel tube (DS-CFCST) column combines the mechanical performance of concrete-filled steel tube (CFST) columns with the environmental and economic benefits of dune sand (DS) concrete. However, current experimental investigations into DS-CFCST columns’ axial compressive behavior are limited. This study conducts a numerical analysis to examine the effects of varying DS replacement ratios and the influence of confinement on DS-CFCST stub columns. Finite element (FE) analysis reveals that DS-CFCST stub columns exhibit reduced ultimate bearing capacity compared to CFST columns, primarily due to weakened confinement effects at higher DS replacement ratios. A parametric study investigated the impacts of various design parameters on the ultimate axial bearing capacity of DS-CFCST stub columns. A practical design formula, based on equilibrium principles and the FE model, was developed. This formula simplifies the prediction of the ultimate load-bearing capacity of DS-CFCST stub columns using the superposition method. Its accuracy was validated by comparing it with experimental data and FE results. Lastly, a reliability analysis was performed, showing the DS-CFCST columns’ reliability index sensitivity to variations in concrete strength, steel yield strength, steel content ratio, load effect ratio, load combination factor, and DS replacement ratio.

1. Introduction

The rapid growth in global construction and urbanization has led to a substantial increase in sand consumption in recent years [1]. Astonishingly, estimates reveal annual global consumption ranging from 32 to 50 billion tons of sand [2]. This soaring demand has triggered a depletion of sand resources, accompanied by severe environmental challenges like landslides, earthquakes, and island erosion. A recent study highlights the threefold increase in sand costs in India since 2007 [3]. Consequently, several nations are actively seeking alternative materials to alleviate natural sand dependence. In this context, the adoption of dune sand (DS) emerges as a viable strategy, offering suitable material for this endeavor. The use of DS as a partial replacement for traditional construction sand can yield concrete specific to engineering applications. This approach not only reduces engineering expenses but also safeguards the local environment, fostering the rational development and utilization of natural resources. Prudent utilization of desert resources can ease the pressures of river sand supply and demand while fully harnessing local desert resources. Furthermore, projecting ahead, the utilization of DS holds the potential to be more cost-effective and competitive than the reliance on river sand.
In recent decades, a substantial amount of experimental research has focused on the mechanical properties of DS concrete [4,5,6,7,8,9,10,11,12,13,14,15,16,17,18,19]. These studies consistently demonstrate that DS concrete, compared to ordinary concrete, exhibits lower compressive strength, tensile strength, and elastic modulus. These are attributed to the smaller size, smoother texture, and suboptimal grading of DS particles, predominantly composed of ultrafine and uniform particles. Extensive exploration into the workability of DS concrete reveals that incorporating DS as a partial substitute for fine aggregate enhances workability [4,6,7,8,10,11,14,20], with the majority of researchers reporting favorable conclusions.
In contrast, the exploration of structural components made from DS concrete remains limited. The mechanical characteristics of concrete-filled steel tubular (CFST) stub columns using DS concrete were investigated by Wang et al. [21] and Ren et al. [22], which indicated no negative impacts on mechanical performance. Li et al. [23,24] examined the shear and flexural behavior of reinforced concrete beams with DS concrete, finding minimal impact on failure modes. Li and Gan [25] assessed the strength and cyclic behavior of DS-reinforced concrete (DS-RC) columns, demonstrating stable performance up to 60% replacement ratios. Li et al. [26] also investigated the seismic performance of DS concrete beam-column joints, concluding that DS replacement ratio did not significantly affect failure modes or stiffness degradation. Guo et al. [27] studied the shear behavior of DS-RC deep beams, noting improvements in load capacity and ductility at a 30% replacement level, although a 50% replacement level resulted in reduced load capacity and ductility.
Concrete-filled steel tubes (CFSTs) are known for their exceptional structural performance due to the effective interaction between the steel tube and the infilled concrete, fostering robust composite action. This makes them highly applicable to various engineering applications [28,29]. Recent studies have focused on the axial load-bearing capacity and the effects of confinement on CFST columns, particularly CFST stub columns, to determine their ultimate load-bearing capacity. These studies often explore local buckling in the steel tube and concrete failure under compression [30,31]. In axial compression, the concrete infill can delay or prevent steel tube buckling, and the steel tube’s confinement significantly enhances concrete’s mechanical properties. Circular CFST columns, in particular, distribute confinement uniformly, resulting in higher strength and ductility compared to rectangular tubes [32,33,34]. Han et al. [35] extensively studied CFST columns with circular and square sections, confirming substantial alignment between predicted and actual results. Tao et al. [36] conducted a numerical exploration into the axial behavior of CFST stub columns, verifying the model’s accuracy. Similarly, Ding et al. [37] examined the axial capacity of square and circular CFST stub columns under partial axial loading, effectively simulating their behavior.
In general, prior research has focused on experimental investigations into the mechanical characteristics of DS-CFCST columns. However, there is a noticeable deficiency in theoretical and numerical analysis of the composite behaviors of DS-CFCST stub columns under axial compression. Due to technological limitations in testing, a comprehensive Finite Element (FE) modeling analysis is necessary to examine interactions among CFST column components during loading. Unlike the numerous advanced numerical analyses for CFST columns, FE analysis has not been applied to DS-CFCST. Understanding the difference in confinement effectiveness between DS-CFCST and concrete-filled circular steel tubular (CFCST) stub columns is crucial for informed adjustments to existing design formulas for CFCST columns.
This study aims to fill the gap in theoretical and numerical analysis of the composite behavior of DS-CFCST stub columns under axial compression. Given the limitations of current testing methods, a comprehensive Finite Element (FE) modeling analysis is essential to understand the interactions among CFST column components during loading. Unlike the numerous advanced numerical analyses available for CFST columns, FE analysis has not yet been applied to DS-CFCST columns. This study seeks to elucidate the differences in confinement effectiveness between DS-CFCST and conventional concrete-filled circular steel tubular (CFCST) stub columns, which is critical for adapting existing design formulas for CFCST columns. The primary goal is to develop a numerical model and design formula through a detailed FE model for DS-CFCST stub columns. This model will incorporate an elastoplastic steel constitutive model and a plastic-damage constitutive model for DS concrete, validated against experimental data including ultimate bearing capacity, loading-axial strain curves, and stress response. A parametric study will explore the effects of DS concrete strength, steel tube strength, steel ratio, DS replacement ratio, and confinement efficiency on axial compressive behavior. This study will also compare the confinement effects between CFCST and DS-CFCST stub columns. Finally, a practical design formula incorporating an enhancement factor will be proposed and validated against existing design codes and experimental data, with a reliability analysis to calibrate the formula.

2. Finite Element Modeling

Within this study, a numerical model is developed employing ABAQUS (2021) software to replicate the structural reactions of DS-CFCST columns when subjected to axial compression. The model effectively represents both the steel tube and the infill concrete, encompassing interface properties to capture their dynamic interactions. The fundamental objectives of the FE modeling approach encompass emulating the testing methodology, generating supplementary findings to explore composite behaviors, and conducting parametric analyses. This approach endeavors to provide valuable insights into the response characteristics of DS-CFCST columns under axial compression, thus advancing knowledge within this realm of research.

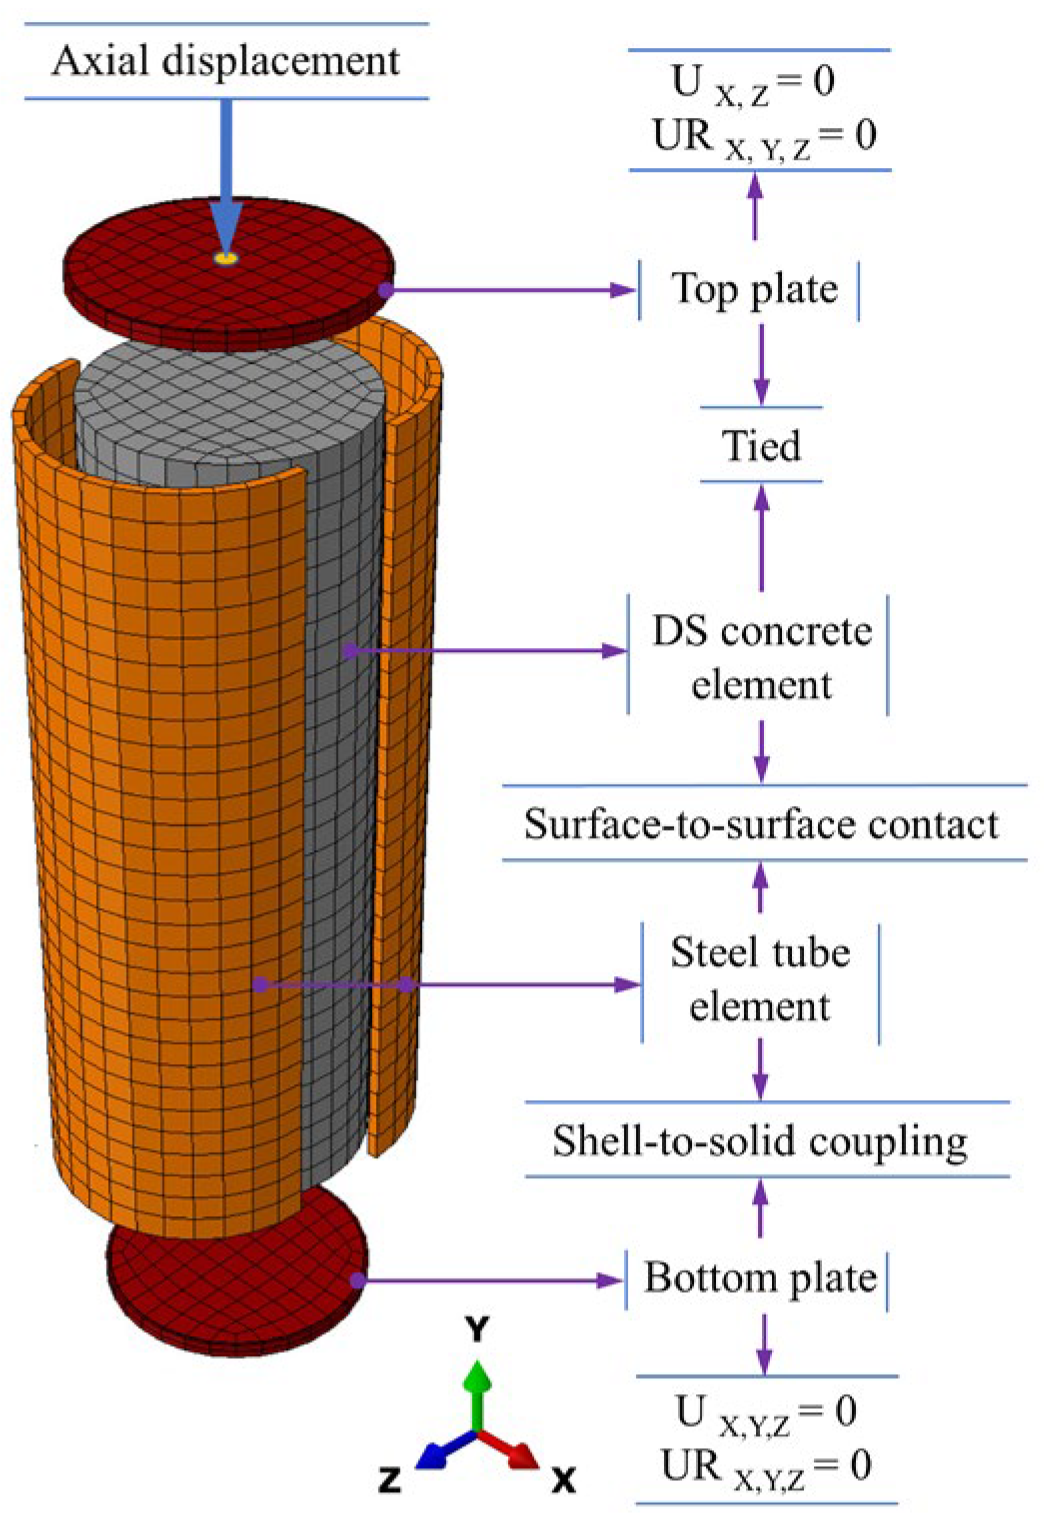
2.1. Element Type, Interaction, Boundary Conditions, and Mesh

In modeling DS-CFCST columns, where the wall thickness of the tube is significantly smaller than its other dimensions, we used 4-node reduced integration shell elements (S4R) for the steel tube and 8-node reduced integration solid elements (C3D8R) for the DS concrete and endplates. The interaction between the concrete and steel tube was captured using a ‘surface-to-surface contact’ method, while the connection between the concrete and endplates was implemented using a ‘Tie constraint’. The inner surface of the steel tube and the surfaces of the endplates were designated as master surfaces, with the outer concrete surface set as the slave surface. Normal contact was handled using a hard contact formulation, and tangential contact was managed with Coulomb friction, employing a coefficient of 0.5. For the interaction between the endplates and the steel tube, a ‘Shell-to-solid coupling’ mechanism was employed. Rigid plates, which lack mass properties, were primarily used to simulate axial displacement. Axial loading was centrally applied to the top surface of the upper plate via displacement control, replicating the axial loading process. The bottom plate of the stub columns was fixed, while the top plate was allowed to move axially, as illustrated in Figure 1, with the displacement specified as Uy = 0.04 L. Structured meshing techniques were used for model development. To balance accuracy and computational efficiency, a mesh size of D/10 was chosen, as suggested by Ding et al. [38]. The mesh configuration for the model is illustrated in Figure 1.

2.2. The Steel Constitutive Model

The steel constitutive behavior was defined using elastoplastic models incorporating Von Mises yield criteria, Prandtl–Reuss flow rules, and isotropic strain hardening. According to Ding et al. [38], the stress–strain relationship for steel is as follows:
σ = { E s ε ε ε y f y ε y < ε ε s t f y + E s t ( ε ε s t )   ε s t < ε ε u   f u ε > ε u
where σ and ε represent the stress and strain, respectively; fy and fu denote the yield and ultimate strengths of the steel, respectively; εy is the yield strain, εst is the strain at the start of strengthening, εu represents the strain at ultimate strength; Es is the elastic modulus of the steel, assumed to be 2.06 × 10⁵ MPa; and Est is the modulus at the strengthened stage, calculated as (fufy)/(εuεst). The following equations are used: εst = 0.02, fu/235 = 0.85 fy/235 + 0.72; εu/εu,235 = 1/1 + 0.15 (fy/235 − 1)1.85. Figure 2 provides a schematic view of the stress–strain relationship adopted for the steel tubes.

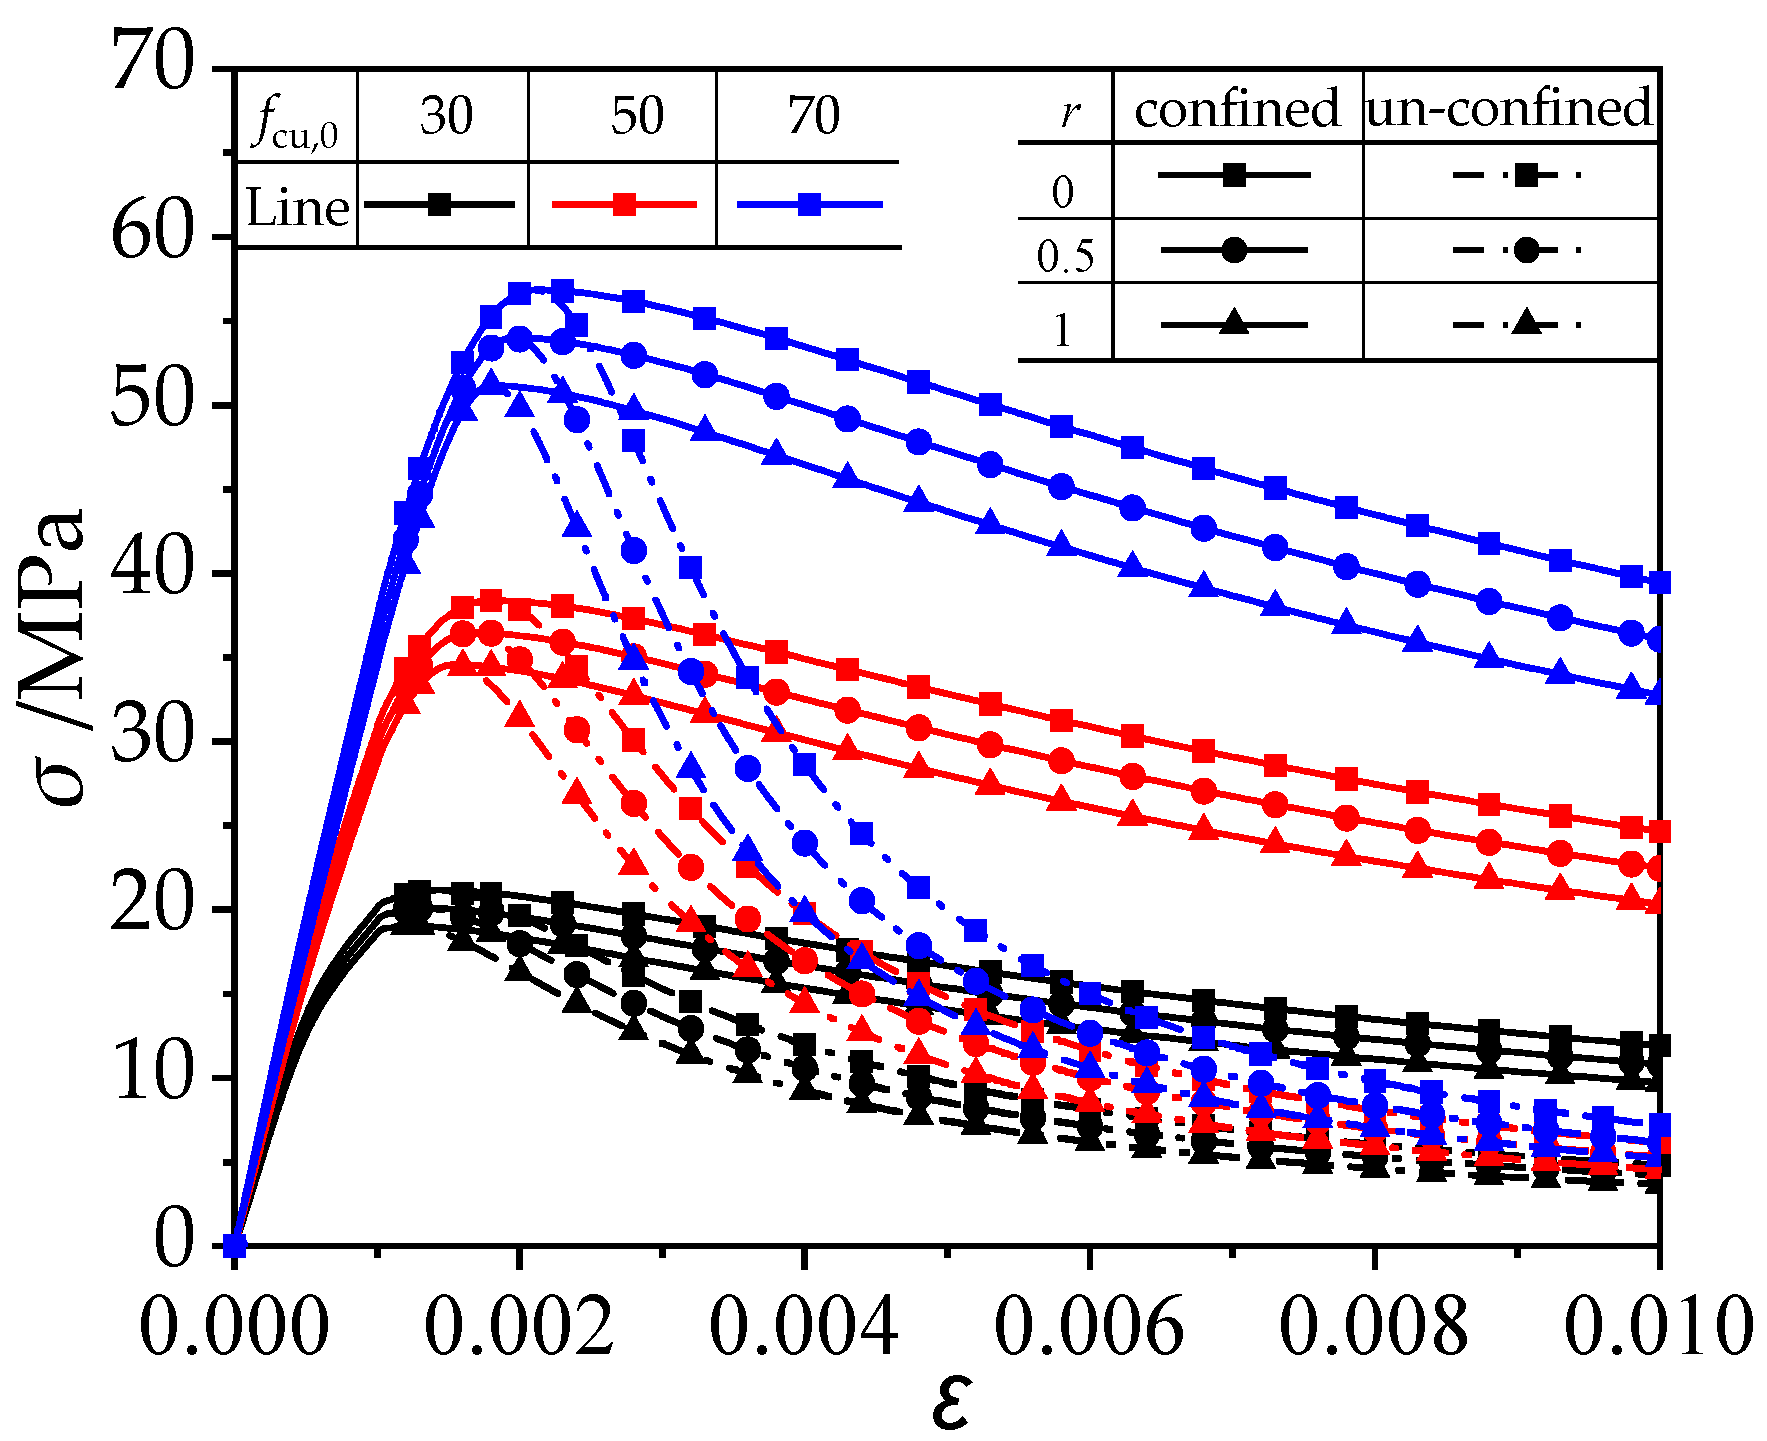
2.3. The Dune Sand Concrete Constitutive Model

The concrete damage plasticity (CDP) module in ABAQUS is used to model the plastic behavior of infill concrete under triaxial compression. This module employs an equivalent stress–strain model to accurately capture the plastic response of confined dune sand concrete within CFST columns. The dune sand, sourced from Fujian [21], Liaoning [22], and Xinjiang [39] Provinces in China. Although the referenced studies provided data on the behavior of DS-CFST columns, they did not include specific tests on the mechanical properties of the DS concrete. The model developed by Sadat et al. [40] has been used in this study to effectively replicate the stress–strain behavior of DS concrete, as expressed in the following equations.
y = { A n ( r ) x + ( B n ( r ) 1 ) x 2 1 + ( A n ( r ) 2 ) x + B n ( r ) x 2 x 1 x α n ( r ) ( x 1 ) 2 + x x > 1
Parameter expressions:
{ Under   compression   y = σ / f c ( r ) ,   x = ε / ε c ( r ) ; A 1 ( r ) = 6.9 f c u 11 / 30 ( 1 0.15 η r ) ;   B 1 ( r ) = 1.67 ( A 1 ( r ) 1 ) 2 ,   C o n f i n e d   α 1 = 0.15 ;   U n c o n f i n e d   α 1 = 4 × 10 3 f c u 1.5 ;   f c u ( r ) = ( 1 0.12 η r ) f c u ,   f c ( r ) = ( 1 0.1 η r ) × 0.4 f c u 7 / 6 ; E c ( r ) = ( 1 0.1 η r ) × 9500 f c u 1 / 3 ,   ε c ( r ) = ( 1 0.15 η r ) × 291 f c u 7 / 15 × 10 6 { Under   tension y = σ / f t ( r ) ,   x = ε / ε t ( r ) ; A 2 ( r ) = 1.306 ( 1 + 0.1 η r ) ;   B 2 ( r ) = 1.67 ( A 2 ( r ) 1 ) 2   α 2 = 1 + 3.0 f c u 2 × 10 4 ;   f c u ( r ) = ( 1 0.12 η r ) f c u ,   f t ( r ) = ( 1 0.1 η r ) × 0.24 f c u 2 / 3 ; ε t ( r ) = ( 1 + 0.1 η r ) × 33 f c u 1 / 3 × 10 6
where An(r) is the ratio of the elastic modulus of the concrete to its peak secant modulus. Bn(r) is the parameter that determines the decrease in elastic modulus throughout the ascending part of the axial stress–strain curve. σ and ε represent the stress and strain values of DS concrete. fc and εc represent the compressive peak stress and corresponding strain of DS concrete, respectively. Figure 3 depicts the stress–strain curves of DS concrete under uniaxial conditions, comparing the confined and unconfined samples with varying replacement ratios.
The triaxial plastic-damage model for DS concrete combines uniaxial stress–strain behavior with multi-axial strength criteria. Furthermore, essential parameters are outlined in Table 1, as suggested in previous studies [41,42,43].

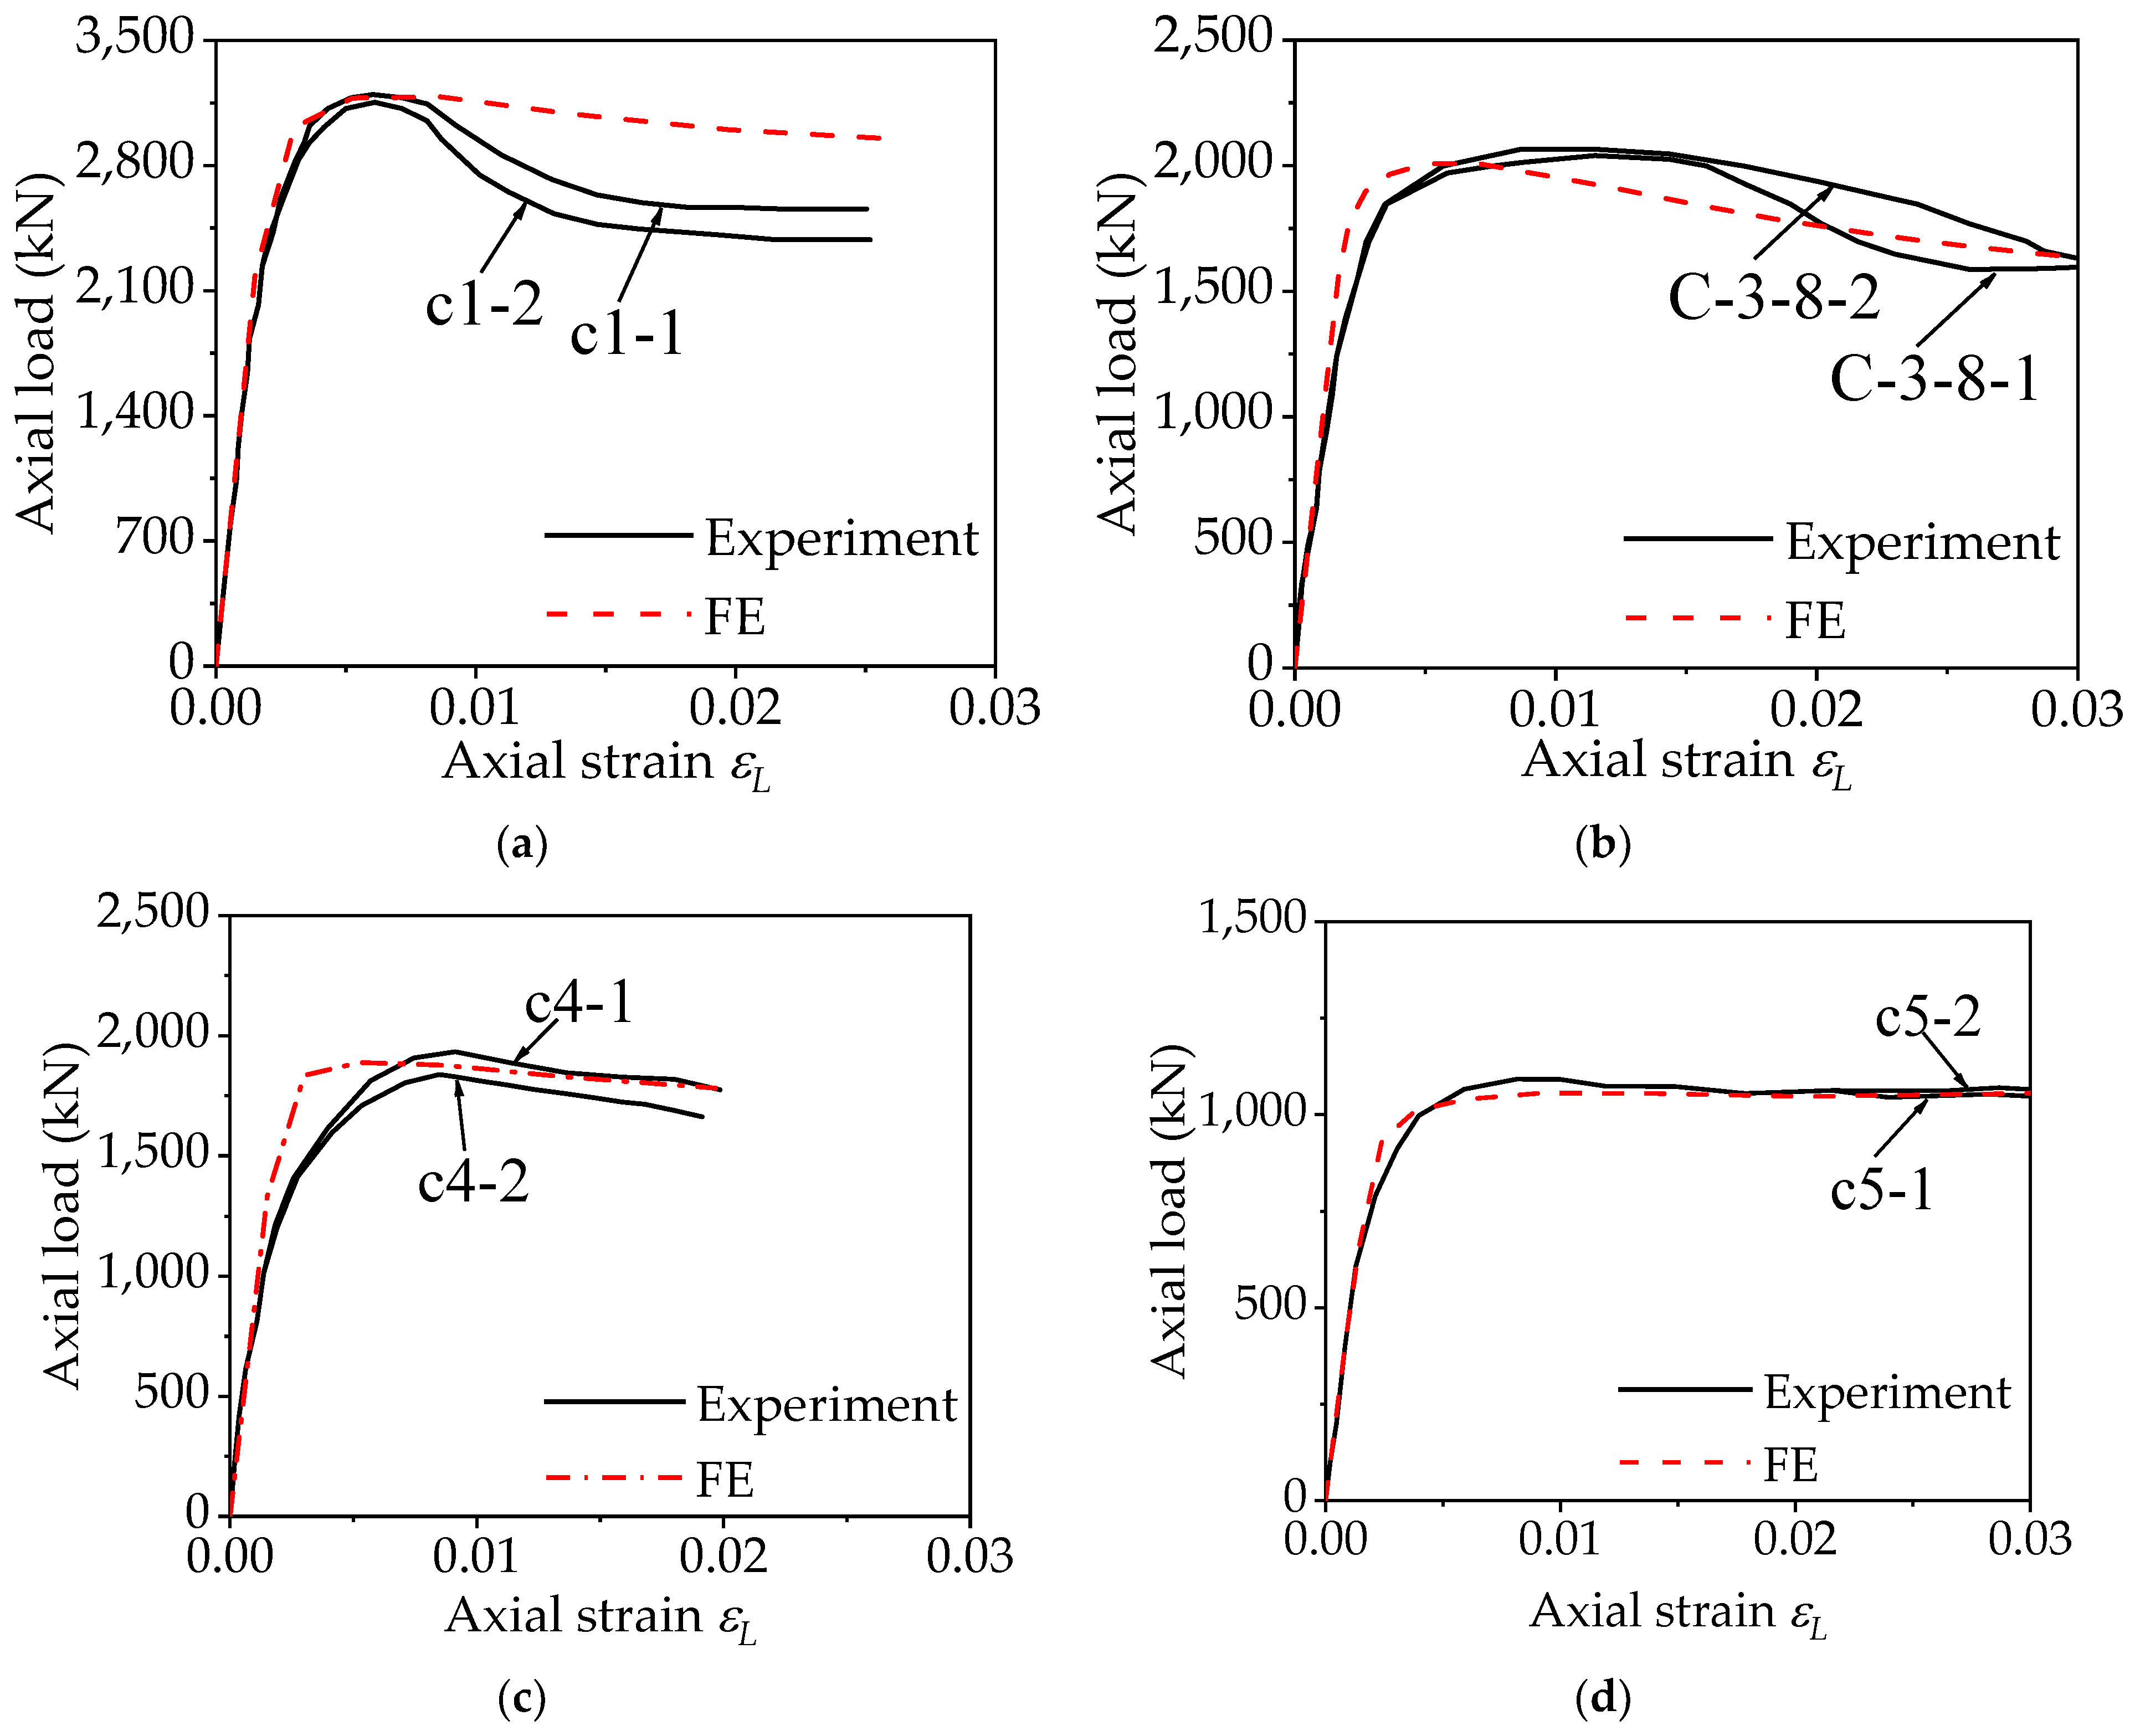
2.4. Model Validation

The accuracy of the FE model was evaluated by comparing its predictions of ultimate bearing capacity with experimental results from previous studies [21,22,39]. The ratio of experimental results (Nu,Exp) to FE predictions (Nu,FE), represented as Nu,Exp/Nu,FE, is presented in Table 2. The mean ratio was found to be 1.009 with a coefficient of variation (CV) of 0.040, showing a strong correlation between the FE model and experimental results. Figure 4 shows the comparison of load–axial strain curves from FE analysis with experimental data. The FE model’s predictions of ultimate bearing capacity and initial stiffness align closely with experimental outcomes, especially up to the peak load. Beyond this point, minor discrepancies occur, possibly due to concrete crushing or local buckling, causing slight reductions in the experimental curves compared to FE predictions, as depicted in Figure 4a for specimens c1-1 and c1-2. These evaluations confirm the FE model’s accuracy in predicting ultimate bearing capacity, validating its effectiveness for further numerical investigations of DS-CFCST stub columns under axial compression.

3. Finite Element Analysis

3.1. Parametric Analysis

The mechanical behavior of DS-CFCST stub columns under axial compression was investigated by developing full-scale FE models using a validated FE modeling technique. The analysis included many factors, such as a constant column diameter (D = 500 mm) and length (L = 1500 mm), along with varying degrees of infilled DS concrete strength (fcu,r), steel yield strength (fy), steel ratio (ρ), and DS replacement ratio (r). One hundred models were generated in total, and the variations in the parameters used are described in Table 3.
Figure 5 shows the load–axial strain curves obtained from the numerical investigation. The graphs clearly demonstrate that the axial compression response of DS-CFCST stub columns is significantly influenced by the strength of DS concrete, steel, steel ratio, and DS replacement ratio. The ultimate bearing capacity of DS-CFCST columns, similar to CFCST columns, is greatly affected by the concrete strength, steel strength, and steel ratio, particularly when considering different DS replacement ratios. Increasing the yield strength of the steel from 235 MPa to 345 MPa results in an approximate 20% increase in the ultimate bearing capacity. By increasing the strength of the infilled DS concrete from 50 MPa to 70 MPa, there is a projected 20% improvement in its ultimate bearing capacity. Furthermore, when the steel ratio is raised from 0.02 to 0.04, 0.06, and 0.08, the axial compressive ultimate bearing capacity experiences an approximate rise of 12%, 33%, and 54% accordingly. However, the DS replacement ratio has a little effect on the elastic stiffness and ultimate bearing capacity of the columns, with effects being less than 10% in comparison to other significant parameters.

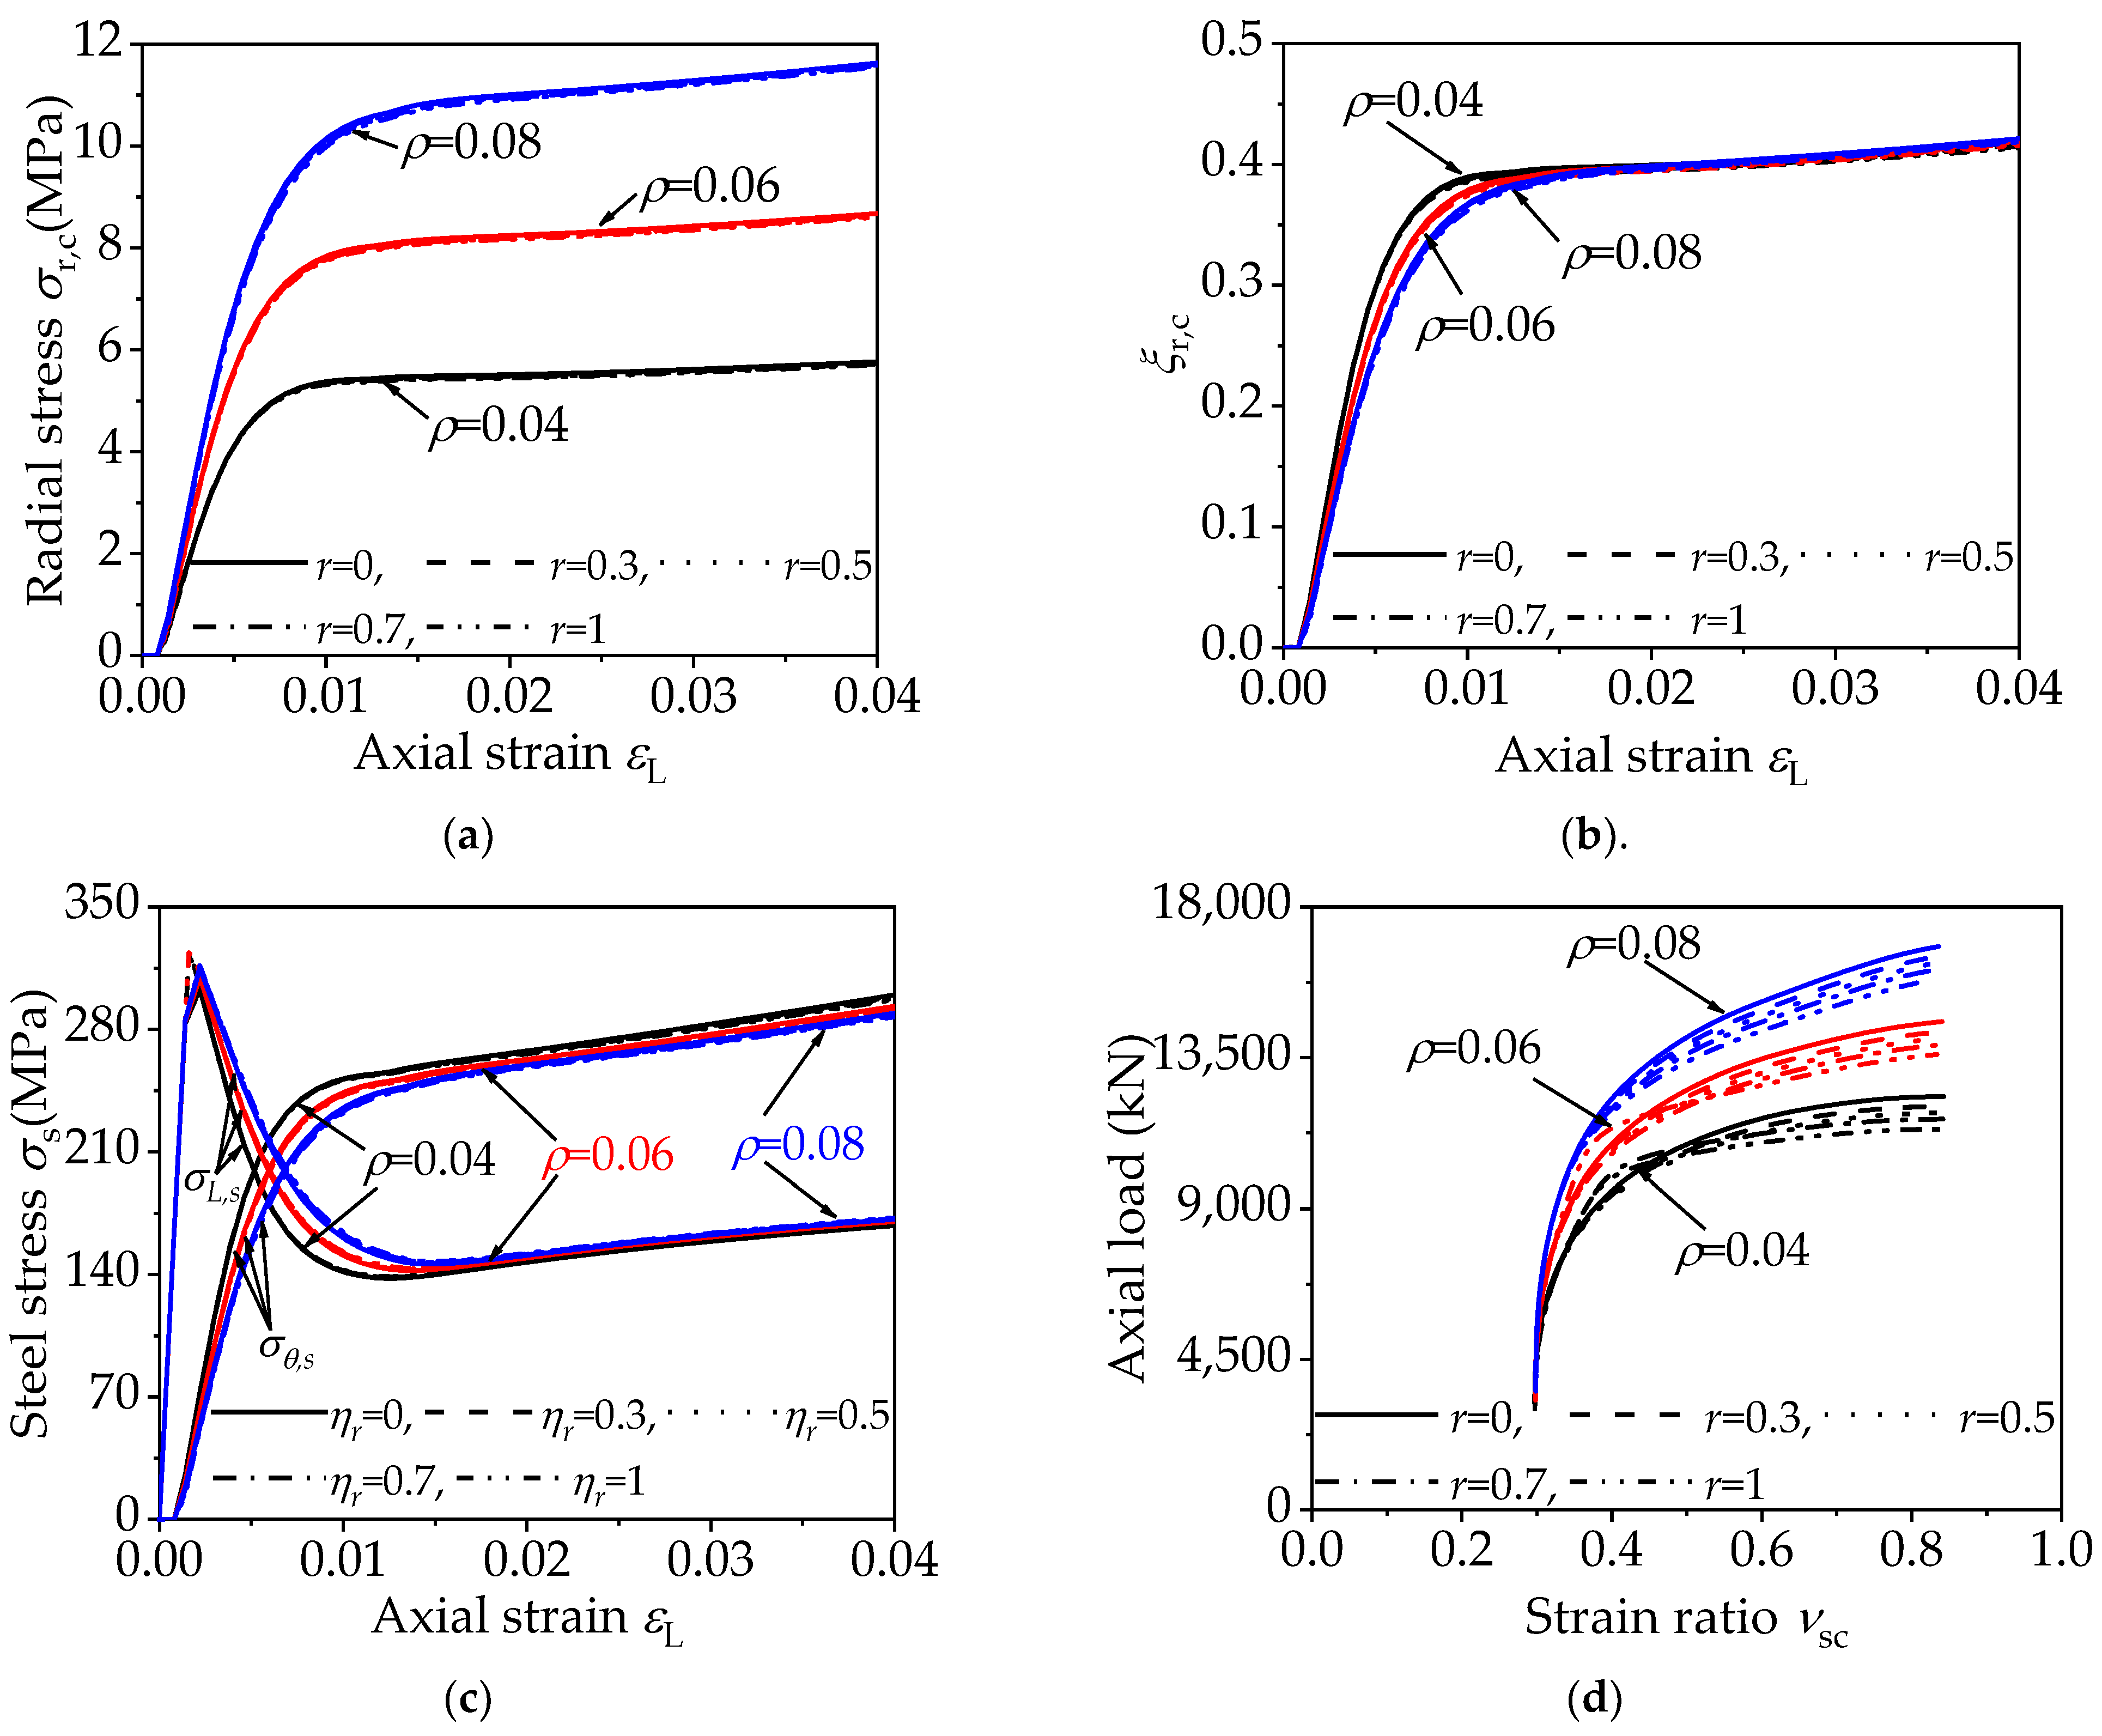
3.2. Confinement Analysis and Effectiveness Evaluation

The influence of steel tubes on infilled DS concrete is assessed by analyzing radial stress (σr,c). A stronger external steel tube enhances mechanical performance, particularly reflected in higher core radial stress; however, relying solely on radial stress becomes insufficient as the DS-CFST stub column nears its ultimate bearing capacity. Therefore, to evaluate confinement efficacy, we use the radial confinement coefficient [ξr,c = σr,c/(ρfy)] for infilled DS concrete, where a higher coefficient signifies better confinement by the steel tube. The interaction between the steel tube and DS concrete is examined by looking at the intersection between longitudinal stress (σL,s)—strain (εL) and transverse stress (σθ,s)—strain (εL) curves of the steel tube. Additionally, the lateral deformation coefficient (νsc = εp/εa) at ultimate bearing capacity, where εp and εa represent transverse and longitudinal strains of the steel tube, respectively. An earlier intersection and a larger lateral deformation coefficient indicate better confinement efficiency. These four indicators comprehensively assess confinement effects as design parameters vary within this study.

3.2.1. Infilled DS Concrete Strength

The effect of infilled DS concrete strength (fcu,r) on the confinement and efficiency of the stub column model is illustrated in Figure 6. Initially, higher fcu,r values correlate with lower radial stress and a reduced radial stress confinement coefficient within the infilled DS concrete. However, this trend reverses at later loading stages. As fcu,r increases, there is a more pronounced reduction in longitudinal stress and a rise in transverse stress within the steel tube, causing the intersection of the σL,s-εL curve and the σθ,s-εL curve to occur earlier. Additionally, the lateral deformation coefficient at ultimate bearing capacity increases with higher fcu,r, enhancing the confinement effect and efficiency of the steel tube on the infilled DS concrete.

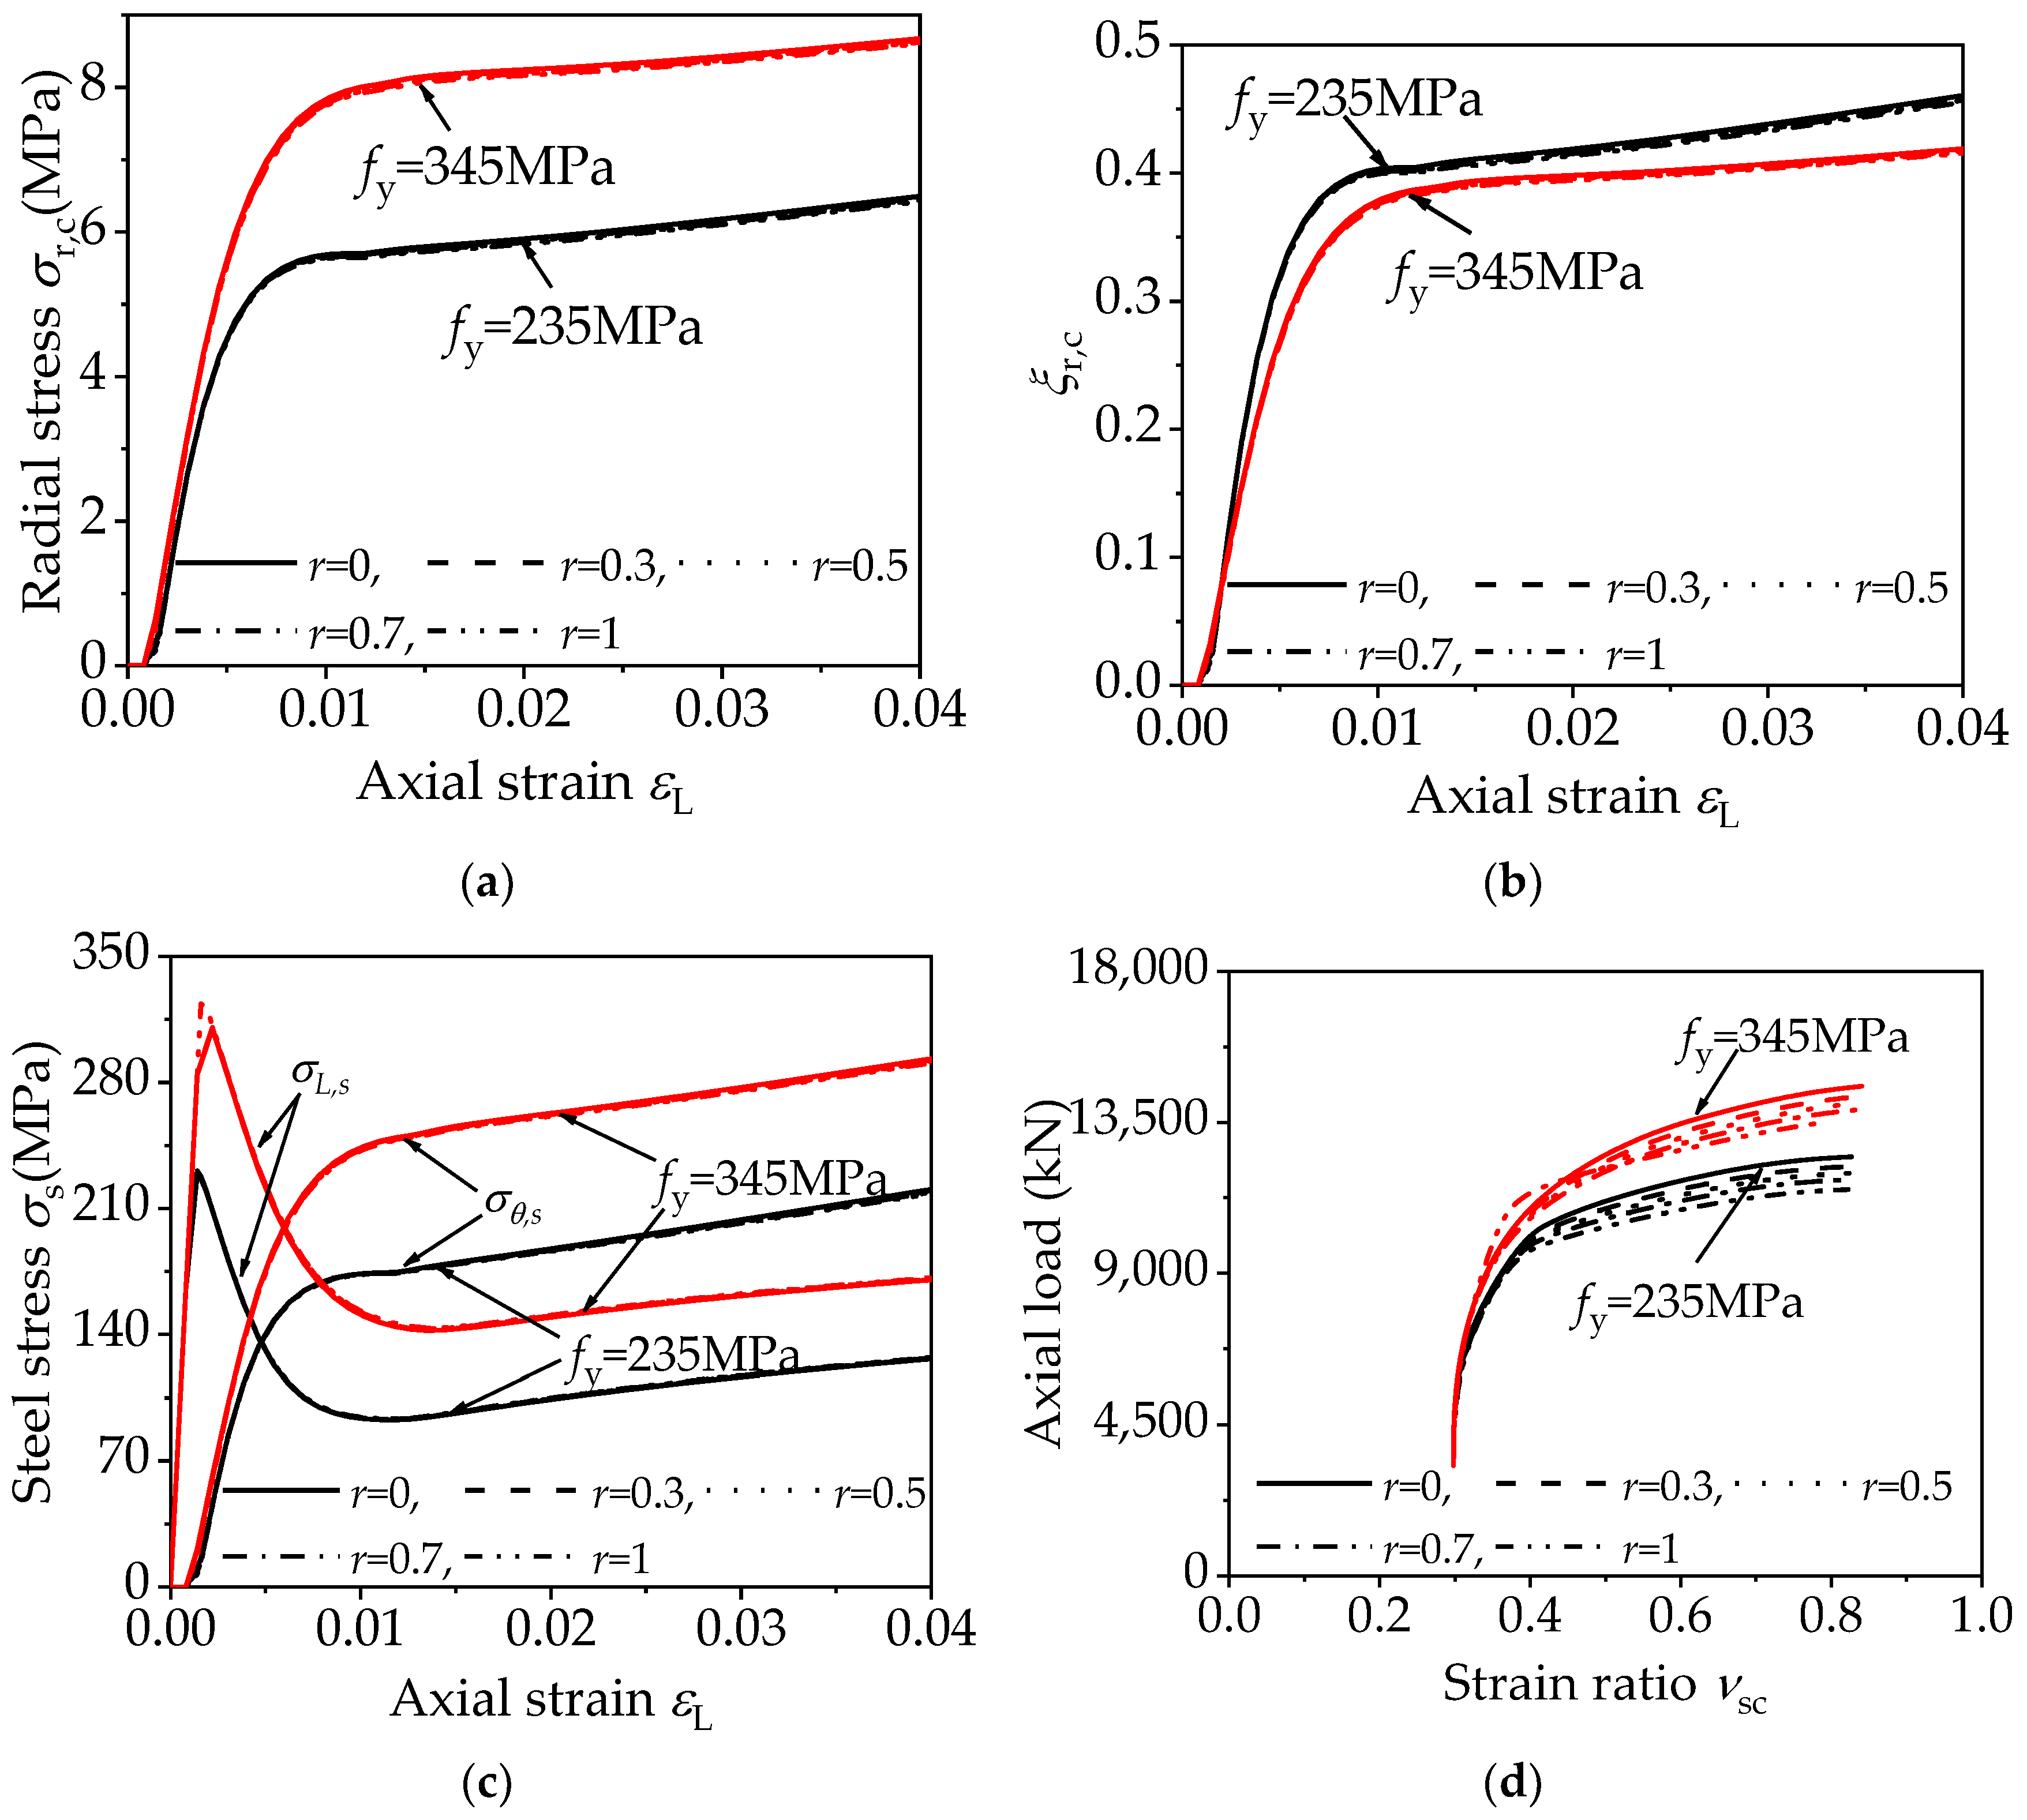
3.2.2. Steel Strength

Figure 7 shows the influence of steel strength (fy) on the confinement effect and efficiency within the stub column model. As fy increases, the radial stress within the infilled DS concrete increases, indicating an improved confinement effect by the steel tube. However, the radial stress confinement coefficient within the infilled DS concrete decreases with increasing fy. Additionally, the intersection point of the σL,s-εL curve and the σθ,s-εL curve for the outer steel tube is delayed with increasing fy. The lateral deformation coefficient at ultimate bearing capacity decreases with higher fy, suggesting that the confinement efficiency of the steel tube on the infilled DS concrete decreases as fy increases.

3.2.3. Cross-Sectional Steel Ratio

Figure 8 depicts the effect of the steel ratio (ρ) on the confinement effect and efficiency within the stub column model. As ρ increases, the radial stress within the infilled DS concrete rises, indicating an enhanced confinement effect by the steel tube on the infilled concrete. However, the radial stress confinement coefficient within the infilled DS concrete decreases with increasing ρ. Additionally, the intersection point of the σL,s-εL curve and the σθ,s-εL curve for the outer steel tube is delayed with increasing ρ. As the value of ρ increases, the lateral deformation coefficient at ultimate bearing capacity drops, indicating a reduction in the effectiveness of the steel tube in confining the infilled DS concrete.

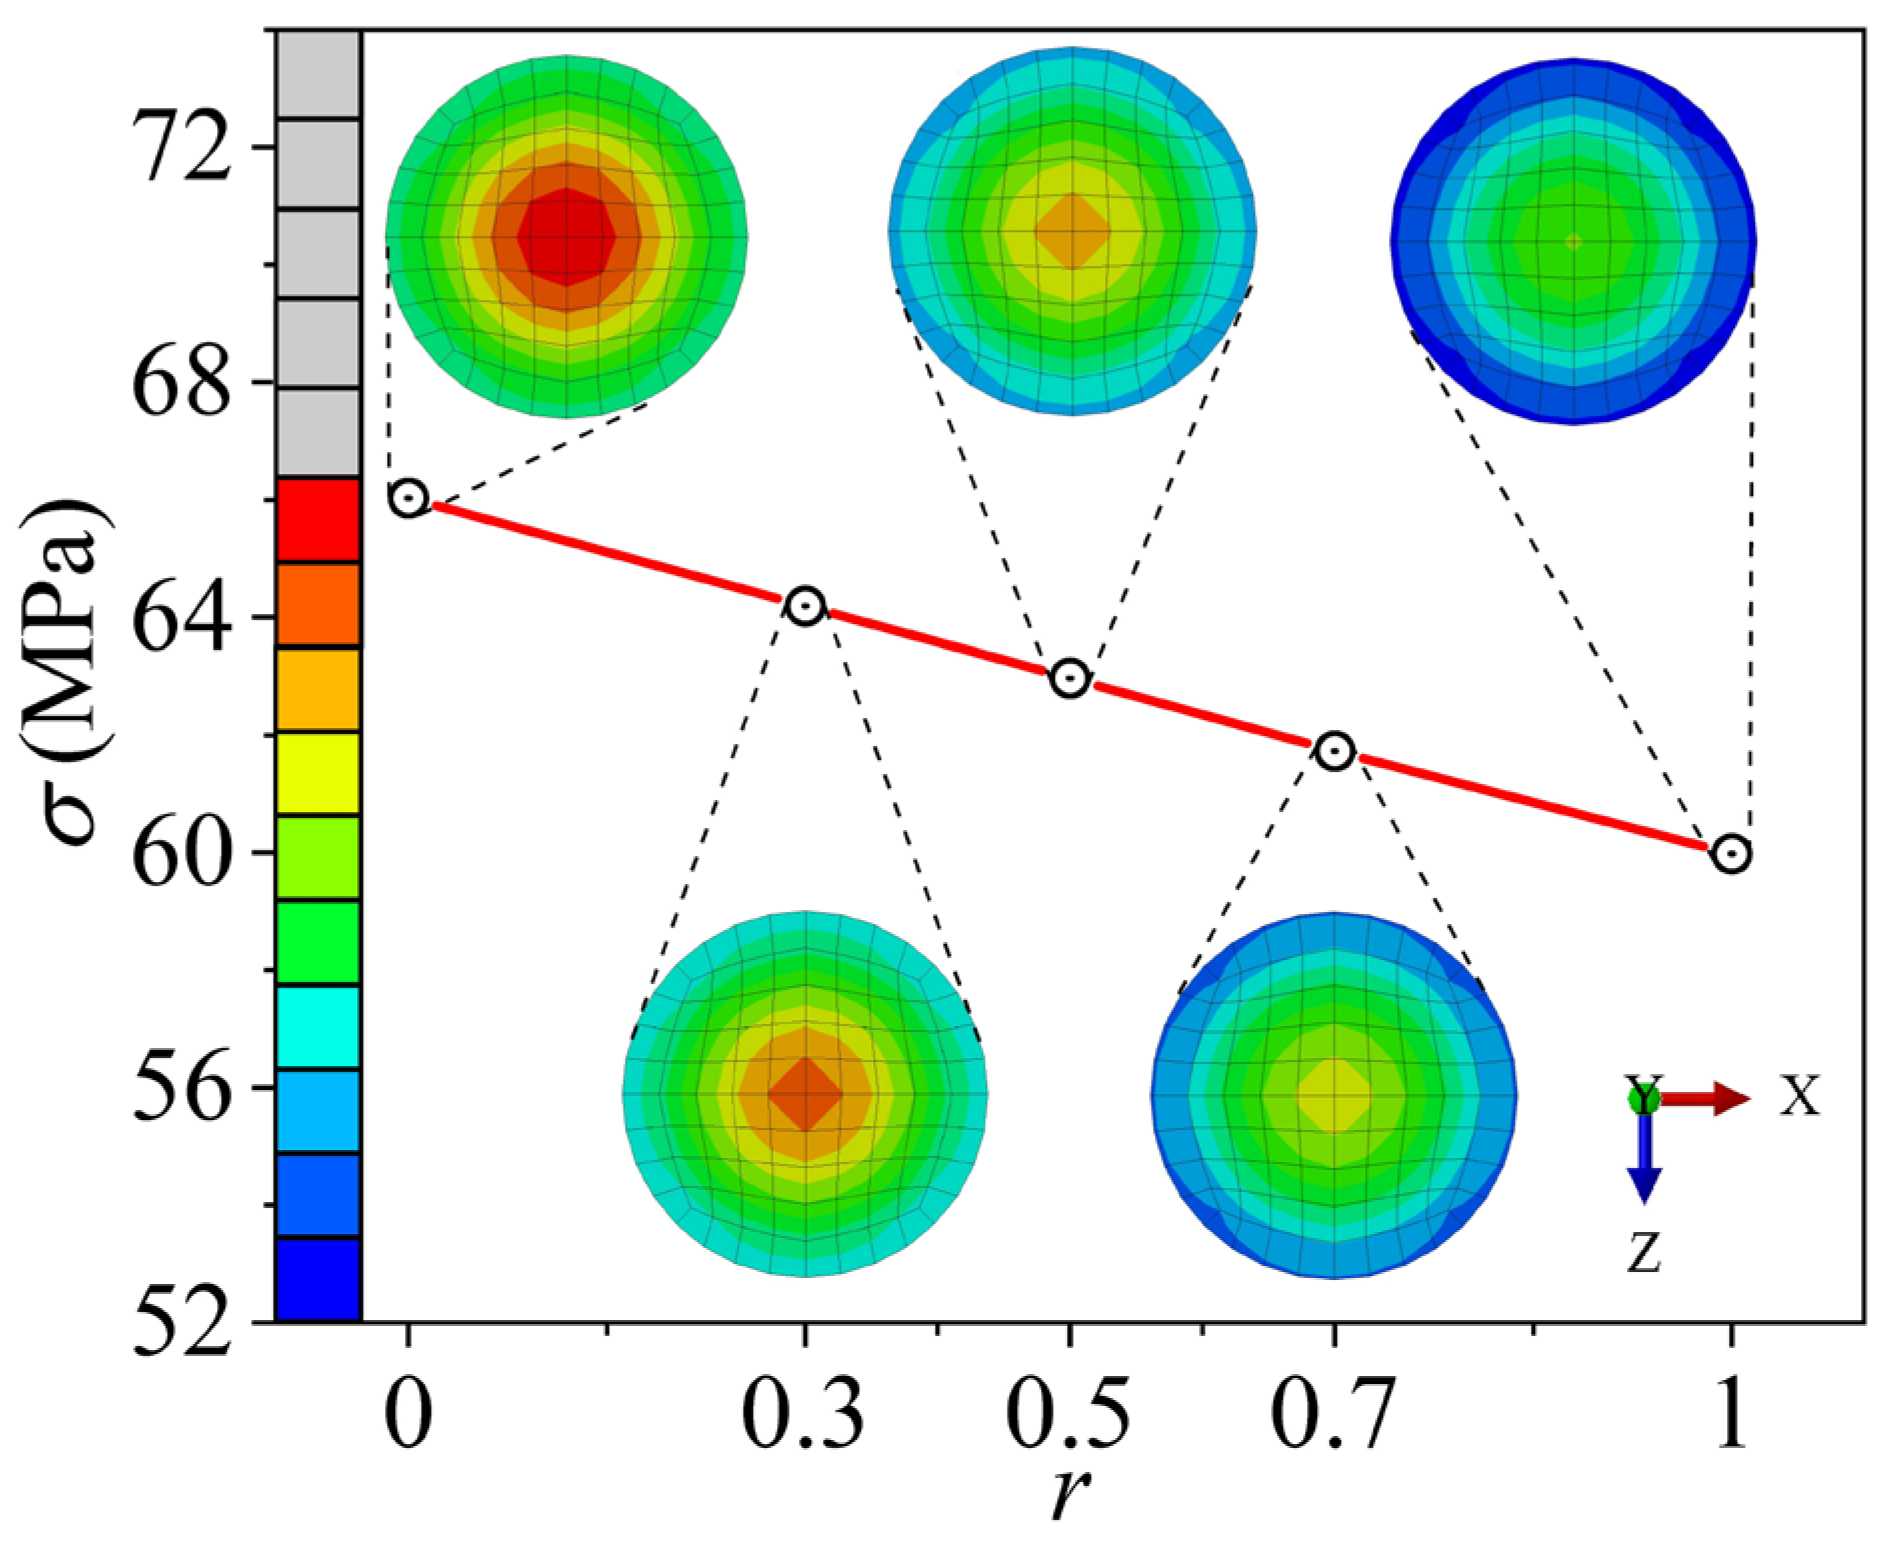
3.2.4. DS Replacement Ratio

Figure 6, Figure 7 and Figure 8 show the effect of the DS replacement ratio on the confinement effect and efficiency within the stub column model. It is observed that both the radial stress and the radial stress confinement coefficient within the infilled DS concrete decrease slightly with an increasing DS replacement ratio. Additionally, as the DS replacement ratio increases, there is a minor delay in the intersection point of the σL,s-εL curve and the σθ,s-εL curve for the outer steel tube. During the initial loading phase, the lateral deformation coefficient of the stub column model increases with axial load growth. Upon reaching ultimate bearing capacity, the differences in the lateral deformation coefficient among different DS replacement ratios become negligible and can be disregarded when other parameters remain constant. These results suggest that as the DS replacement ratio increases, the elastic modulus and axial compressive strength of the DS concrete decrease, weakening the steel tube’s confinement effect on the infilled concrete. However, compared to other design parameters (fcu,r, fy, and, ρ), the DS replacement ratio has a minor impact on the confinement effect and efficiency of the steel tube on the infilled DS concrete.

3.3. Axial Compression Comparison of CFCST and DS-CFCST Stub Columns

Figure 9 illustrates the stress nephograms of the infilled DS concrete at the midsection of DS-CFCST columns with varying DS replacement ratios, while keeping parameters constant ((D = 500 mm, L = 1500 mm, ρ = 0.06, fy = 345 MPa, fcu,0 = 50 MPa). The visualization shows the steel tube’s confinement effect on both ordinary concrete and DS concrete. As the DS replacement ratio increases, the confinement effect of the steel tube on the DS concrete stub column slightly weakens, though the difference remains relatively minor.

4. Practical Formula for Bearing Capacity and Reliability Analysis

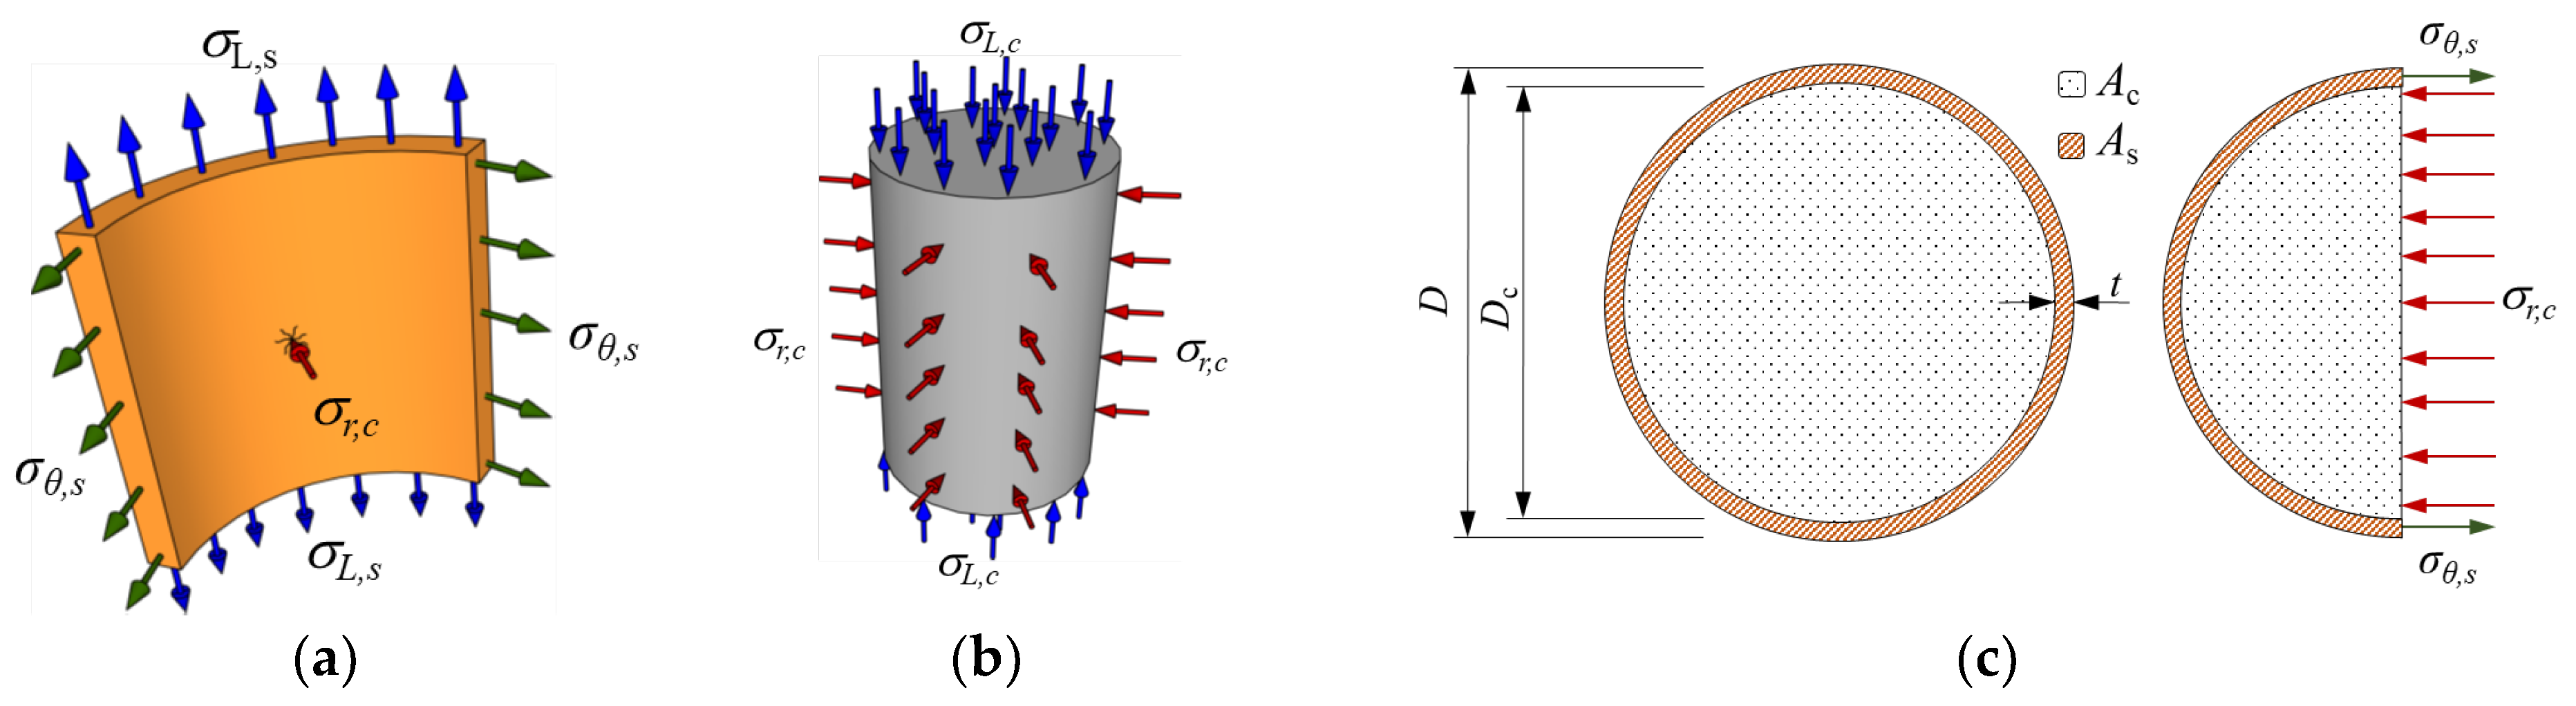
4.1. Model Simplification

To theoretically evaluate the confinement effect in DS-CFCST short columns, reasonable simplifications based on stress distribution and force superposition principles are applied. Figure 10 shows the simplified calculation model, where Ac denotes the cross-sectional area of the infilled DS concrete and As represents the cross-sectional area of the outer steel tube. The parameters D and Dc refer to the diameters of the steel tube and the infilled DS concrete, respectively, while t is the thickness of the steel tube. These areas Ac and As are calculated as described in Equation (3).
{ A c = π D c 2 4 A s = π ( D 2 D c 2 ) 4

4.2. Formulation

The following represents the relationship between the transverse stress (σθ,s) in the steel tube and the radial stress (σsr,c) in the strengthening region of infilled concrete:
σ r , c = ρ 2 ( 1 ρ ) σ θ , s
ρ = D 2 D c 2 D 2
As illustrated in Figure 11, the ratio of axial stress (σL,s) and transverse stress (σθ,s) to yield strength (fy) at ultimate strength changes with the ultimate strength of the FE models (fsc = Nu/Asc, Asc = Ac + As).
Figure 11 illustrates that, at ultimate strength, the axial to transverse stress ratio in the steel tube can be described by the following average values:
σ L , s = 0.63 f y
σ θ , s = 0.51 f y
In the infilled concrete, the relationship between axial and radial stresses is as follows:
σ L , c = f c + k σ r , c
Here, k is the lateral pressure coefficient, with k = 3.4 for circular sections (Ding et al. [44]).
Using static equilibrium principles, the ultimate bearing capacity (Nu) of axially loaded DS-CFCST stub columns is:
N u = σ L , c A c + σ L , s A s
Substituting Equations (4)–(8) into Equation (9), the ultimate bearing capacity (Nu,r) of DS-CFCST stub columns is expressed as:
N u , r = f c A c + k r f y A s
In Equation (10), the steel tube confinement factor kr for DS-CFCST stub columns is approximately 1.58, compared to a factor k1 of 1.7 for CFCST stub columns (Ding et al. [44]), indicating a slightly reduced confinement effect for the steel tube on DS concrete.

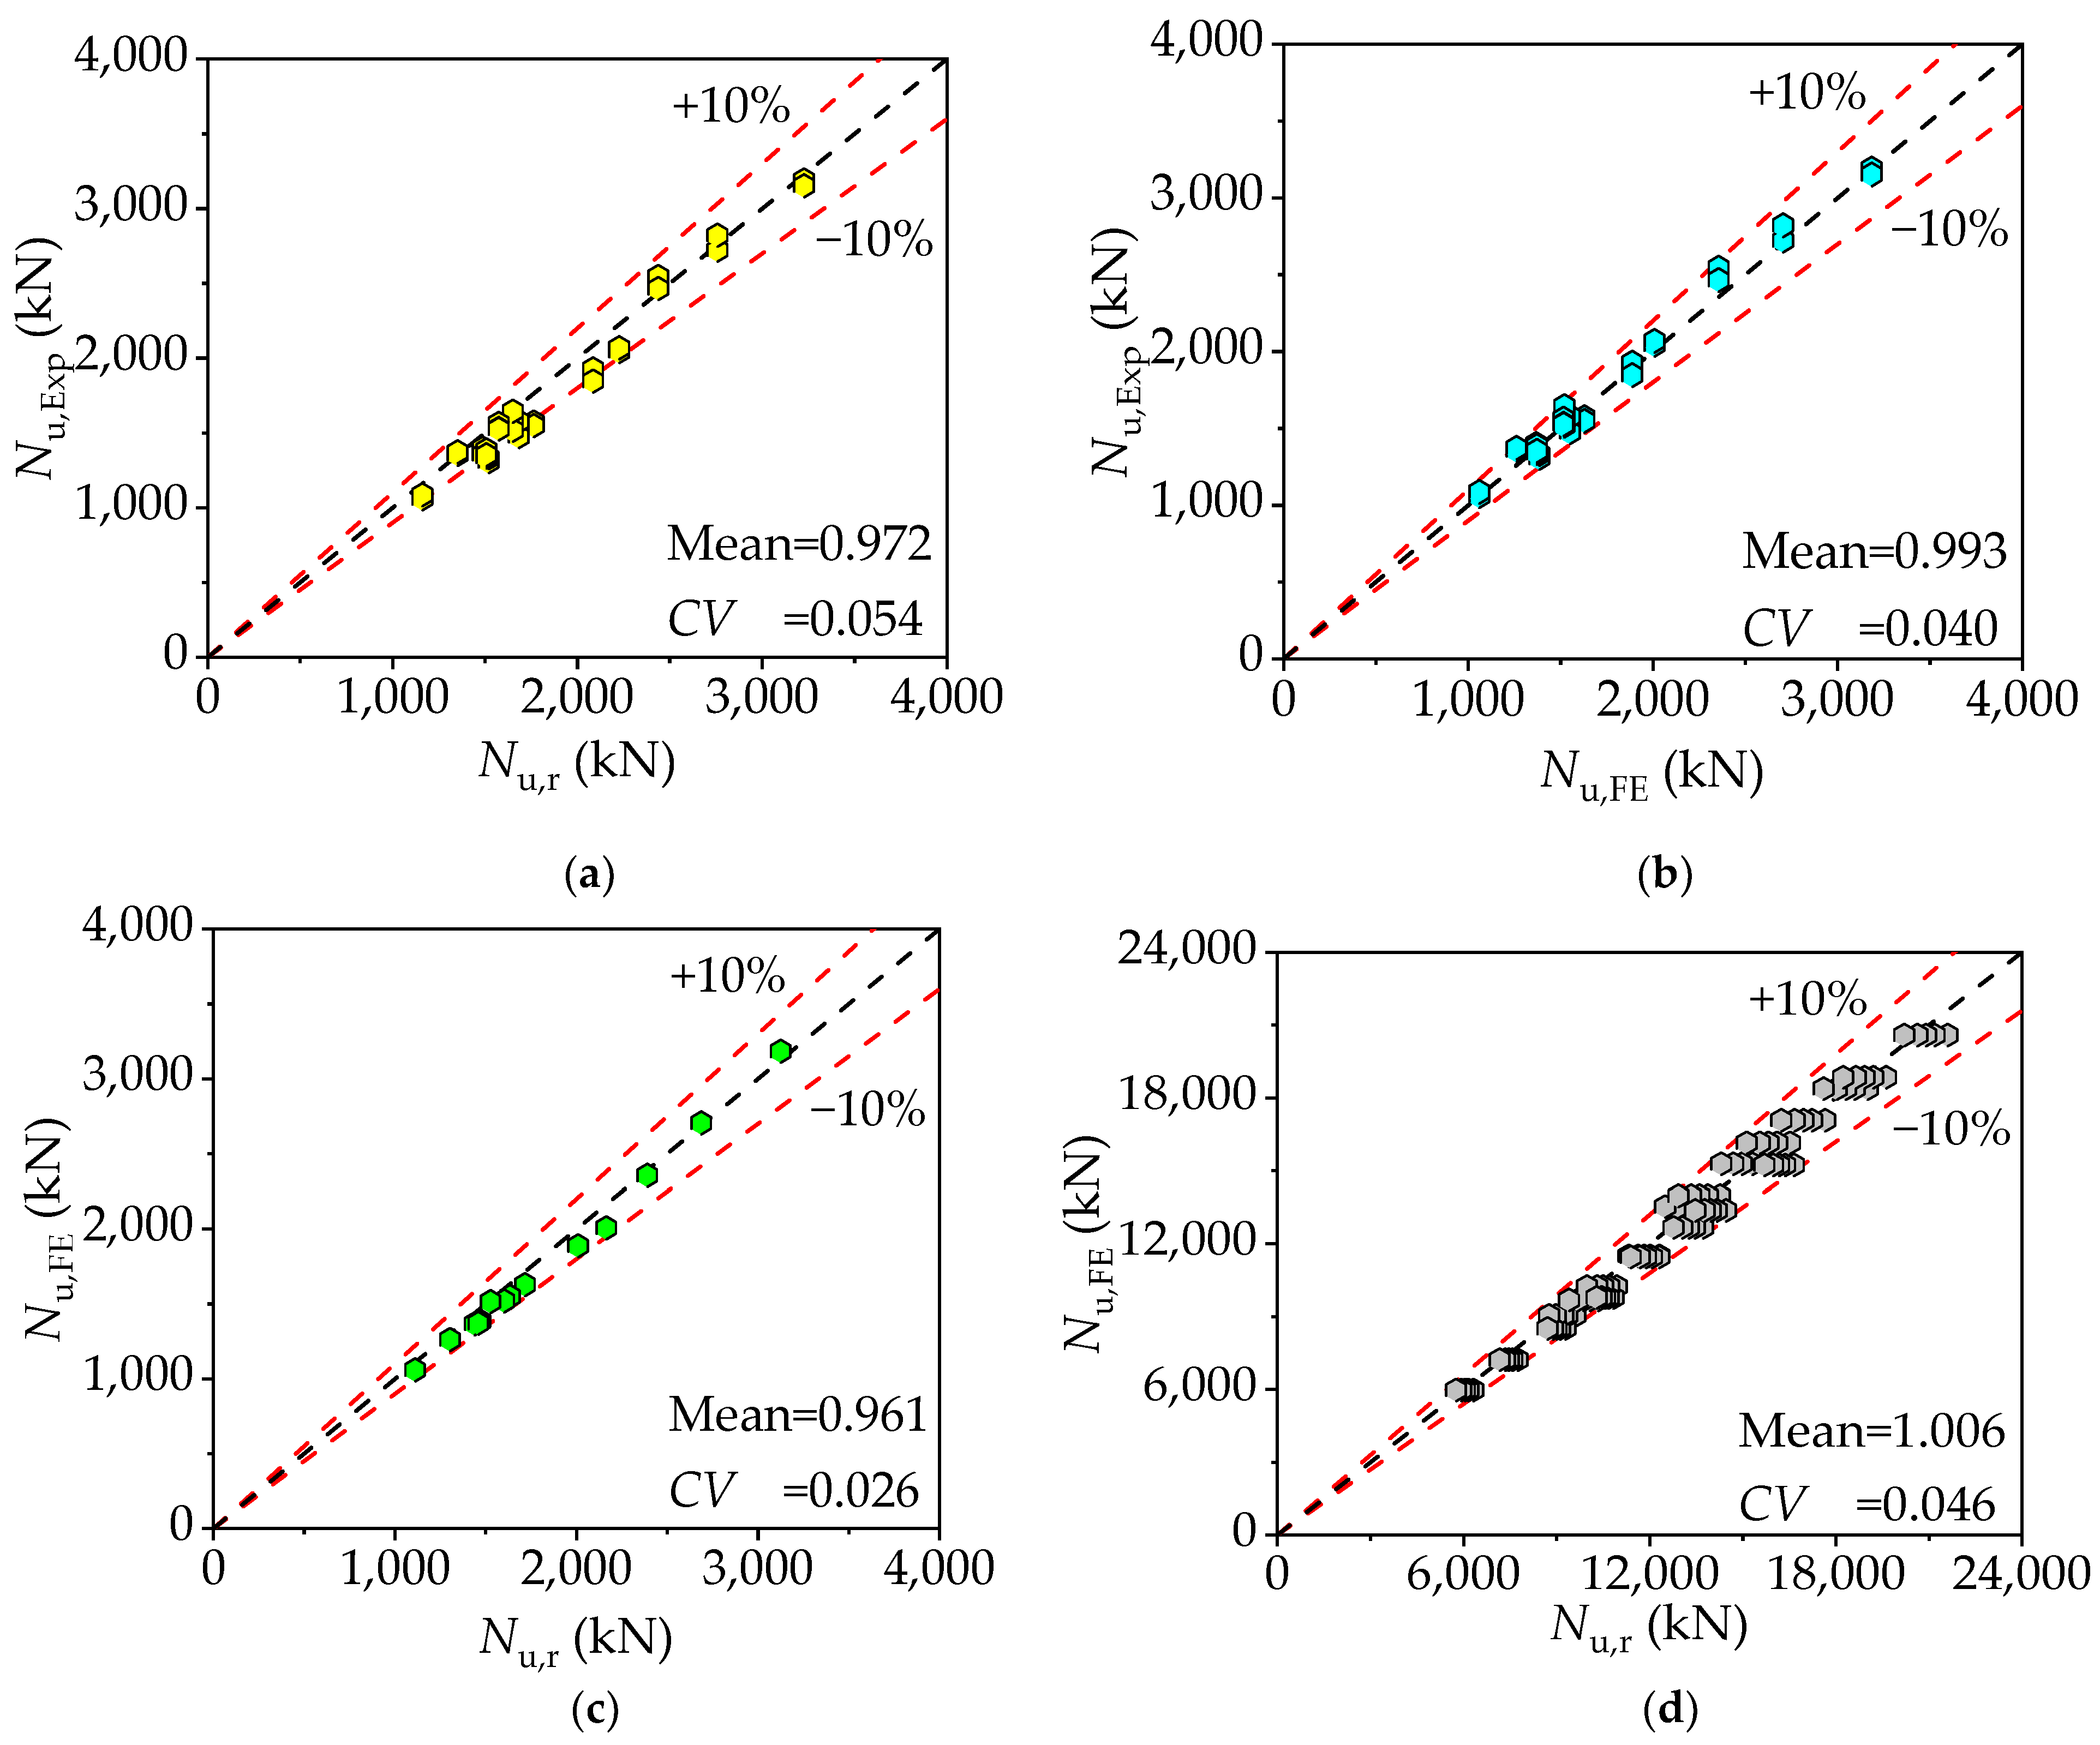
4.3. Formula Validation

Figure 12a–c present a comparison between the collected experimental results Nu,Exp, the FE results Nu,FE, and calculations based on Equation (10) Nu,r. The average ratios of actual ultimate bearing capacity Nu,Exp to Nu,r, Nu,FE, and Nu,FE to Nu,r are 0.972, 0.993, and 0.961, respectively, with CV of 0.054, 0.040, and 0.026, respectively. Additionally, Figure 12d illustrates a comparison between FE analysis results from parametric analysis and calculations based on Equation (10). The mean ratio of Nu,FE to Nu,r is 1.006, with a CV of 0.046. The evidence clearly indicates that calculated values from Equation (10) align well with experimental results and closely correspond to FE analysis outcomes, thereby affirming the accuracy of Equation (10). Consequently, the proposed equation offers an accurate estimation of the ultimate bearing capacity of DS-CFCST stub columns.

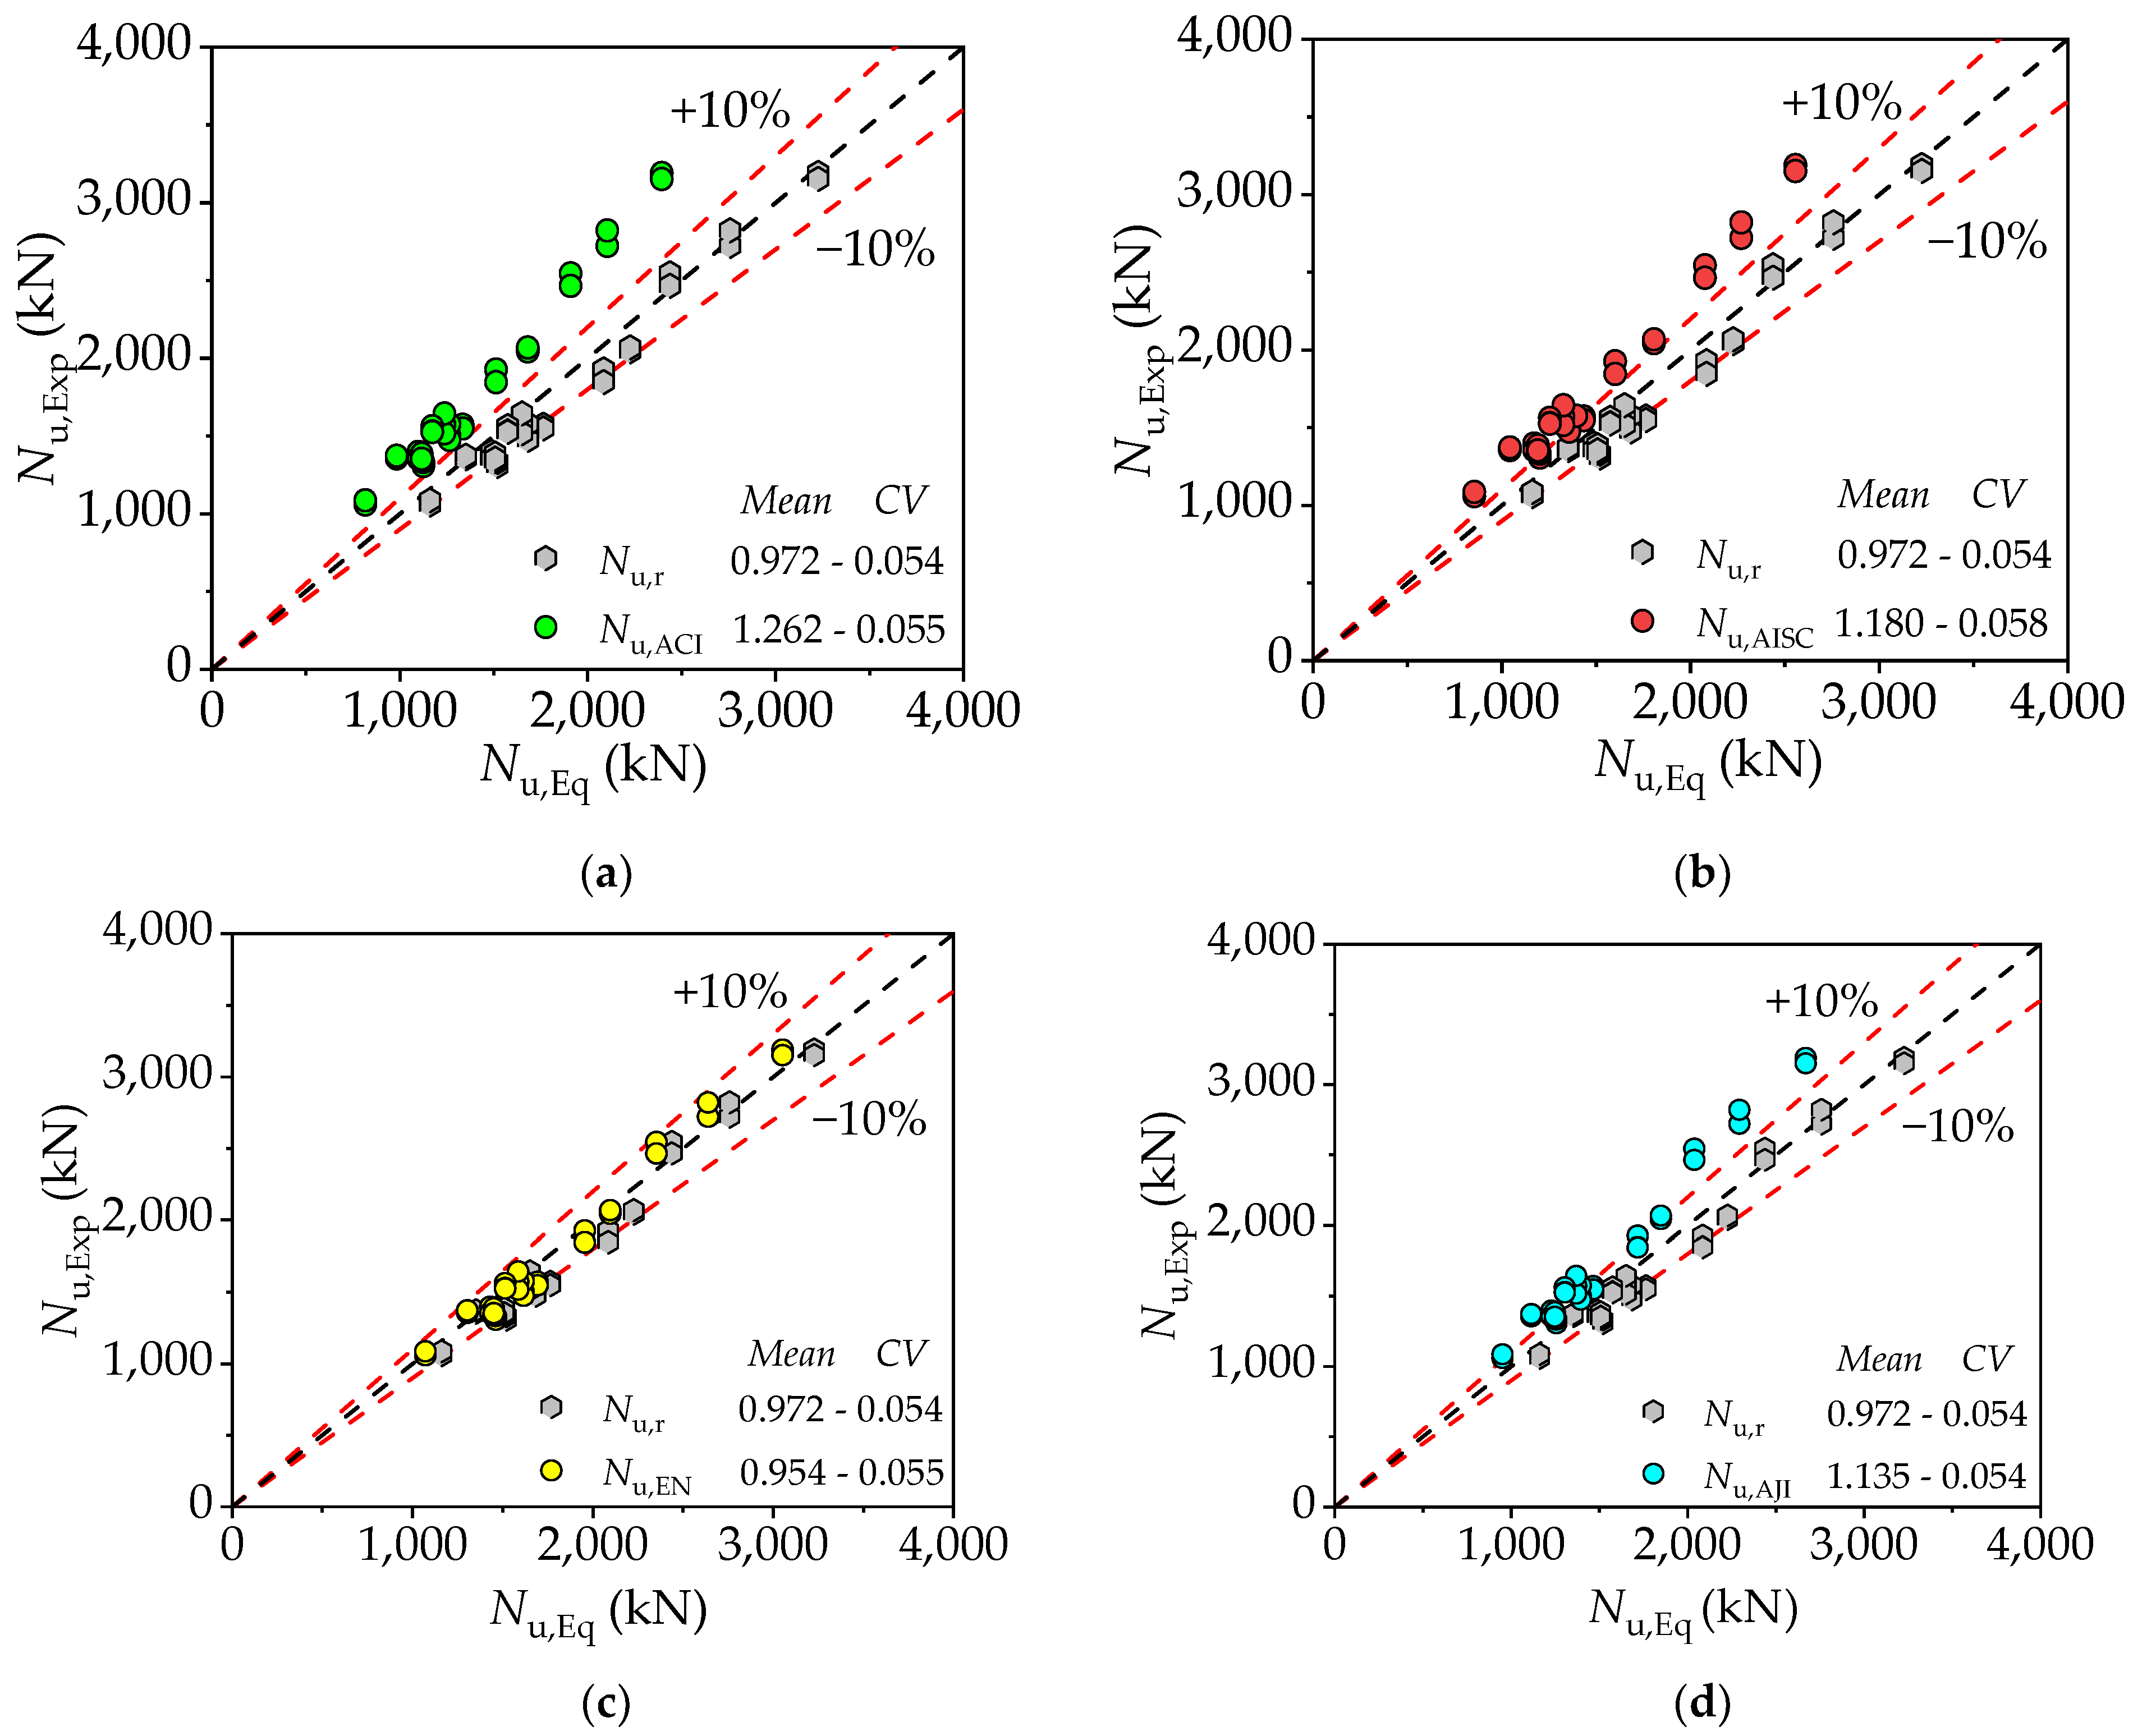
4.4. Comparison of Formulas

In order to effectively demonstrate the advantages of the proposed equations and compare them with existing design code formulas, an assessment of their accuracy in predicting the ultimate load-bearing capacity of components was undertaken. Table 4 outlines the limitations and scope of application of these design codes. Meanwhile, Table 5 displays the formulas and expressions of the design codes, along with the “Mean” and “CV” columns, depicting the average ratio Nu,Exp to Nu,Eq of the observed ultimate load capacity value Nu,Exp to the computed values Nu,Eq based on the reference codes and formulas.
The comparison between the calculated results obtained using design code formulas Nu,Eq and the experimental results Nu,Exp is provided in Table 5, while the corresponding scatter plot is depicted in Figure 13. It is evident that the majority of design codes notably underestimate the ultimate load-carrying capacity of components, with the exception of the BS EN4 design code. Conversely, the proposed formula features a simpler structure and exhibits superior calculation accuracy. As a result, in comparison to the existing design codes, the proposed Equation (10) offers enhanced accuracy and a broader scope of applicability.

4.5. Reliability Analysis

This study employed reliability analysis to calibrate the proposed calculation formula. The analysis utilized data from the database presented in Table 5 and the outcomes of parametric analysis conducted with the FE model. In total, 136 cases were analyzed. Monte Carlo Simulation (MCS), as elaborated by Ding et al. [49], was the chosen method for this reliability analysis.

4.5.1. Reliability Analysis Method

In CFST structures’ reliability calculations, distributions such as normal, log-normal, and Type I extreme value are typically employed. These distributions are characterized by a coefficient of variation (δ) and a mean (μ). Their respective random number generation in MATLAB (R2018a) is as follows:
  • Normal variable:
X i = n o r m r n d ( μ , δ , N , 1 )
2.
Log-normal variable:
μ 1 = log ( μ 1 + δ 2 ) ; δ 1 = log ( 1 + δ 2 ) ; X i = lognrnd ( μ 1 , δ 1 , N , 1 )
3.
Type I extreme value distribution:
α = 6 μ δ π = 0.78 μ δ ; m = psi ( 1 ) α μ = 0.58 α μ ; X i = evrnd ( α , m , N , 1 )
According to the Chinese standard “Unified Standard for Reliability Design of Building Structures” (GB50068-2018) [50], the load effect S expression is as follows:
S = γ G S G k + γ Q S Q k = 1.3 S G k + 1.5 S Q k
Integrating Equations (10) and (14), the equation for the ultimate axial compression state Z of DS-CFCST can be obtained as
Z = k p ( f c A c + k r f y A s ) S G S Q
where kp represents the uncertainty in the axial compression resistance model.
MCS is a method based on principles of mathematical statistics and computer technology. The principle of using MCS to calculate the probability of failure is:
Identification of Variables: Determining the types and distributions of random variables Xi impacting reliability.
Random Sampling in MATLAB: Executing extensive random samplings (minimum samples N ≥ 100/pf) to generate variable values.
Function Definition: Z = g(x1, x2,…,xn)
Failure Probability Calculation: Substituting random values into the function and counting instances where Z < 0 (nf). The failure probability is then calculated using
p f = n f / N
Reliability Index Determination:
β M C   = Φ 1   ( p f )
Here, according to Equation (17), when the target reliability index is 3.2, the maximum failure probability pf is 6.87 × 10⁻⁴.
Error Analysis:
β ε = [ 2 ( 1 p f ) / N p f ] 1 2

4.5.2. Reliability Analysis Steps

  • Variable Identification for Reliability Index: This includes cross-sectional dimensions (D), tube wall thickness (t), load effects (SGk, SQk), model uncertainty (kp), concrete strength (fc), and steel strength (fy). Statistical analysis of kp is performed.
  • Resistance Calculation (Nu,r): Varying material strength values are substituted into Equation (10) to determine Nu,r.
  • Load Effect Determination: Based on the formula Nu,rS = γGSGk + γQSQk and the load effect ratio ρL = SQk/SGk, calculate the standard value of the dead load effect SGk = Nu,r/(γG + ρLγQ) and the standard value of the live load effect SQk = ρLSGk.
  • MATLAB Random Sampling: Random sampling of D, t, SGk, SQk, kp, fc, fy, and Nu,r is performed N times (N ≥ 100/pf) in MATLAB. These values are then used into limit state Equation (15).
  • Reliability Index Calculation ): The number of instances where Z < 0 is counted, and β is calculated using Equation (17). Error estimation is carried out with Equation (18).

4.5.3. Statistical Parameters of Basic Random Variables

The resistance of the function functions is influenced by basic random variables such as fc, D, t, and fy. This resistance typically follows a log-normal distribution.
  • Statistical parameters of load
For reliability analysis, two primary load combinations are taken into account: dead loads combined with office and residential live loads. Dead loads, which represent the structure’s self-weight, are assumed to follow a normal distribution because of their constancy. Live loads, which are both permanent (e.g., building facilities) and temporary, are represented using an Extreme Value Type I distribution. The statistical characteristics for various combinations of loads are shown in Table 6.
2.
Statistical parameters of geometric dimensions
The geometric dimensions for DS-CFCST, including wall thickness (t) and diameter (D), are assumed to follow a normal distribution with a mean coefficient of 1.00 and a coefficient of variation of 0.05, based on Ding et al. [49].
3.
Statistical Parameters of Material Properties
Statistical parameters for concrete properties are derived from the Chinese standard GB 50010 [51], focusing on the characteristic compressive strength (fck) of concrete. Due to the lack of specific data for DS concrete, parameters for normal concrete are provisionally used. Steel material property parameters are sourced from existing literature [49]. Table 7 and Table 8 summarizes the statistical parameters for the mechanical properties of steel and concrete.
4.
Calculation models’ statistical uncertainty parameters
The uncertainty in the computation model is represented by the random variable kp, which shows the discrepancy between the components’ estimated and real resistance. The term is defined in the following manner:
k p = N u / N u , r
Using experimental data and FE parametric analysis results, Nu,r is computed with Equation (10), and kp is obtained with the equation above. The uncertainty coefficient kp for DS-CFCST has a mean value of 1.139 and a coefficient of variation of 0.063. A Jarque-Bera test confirms that kp follows a normal distribution.

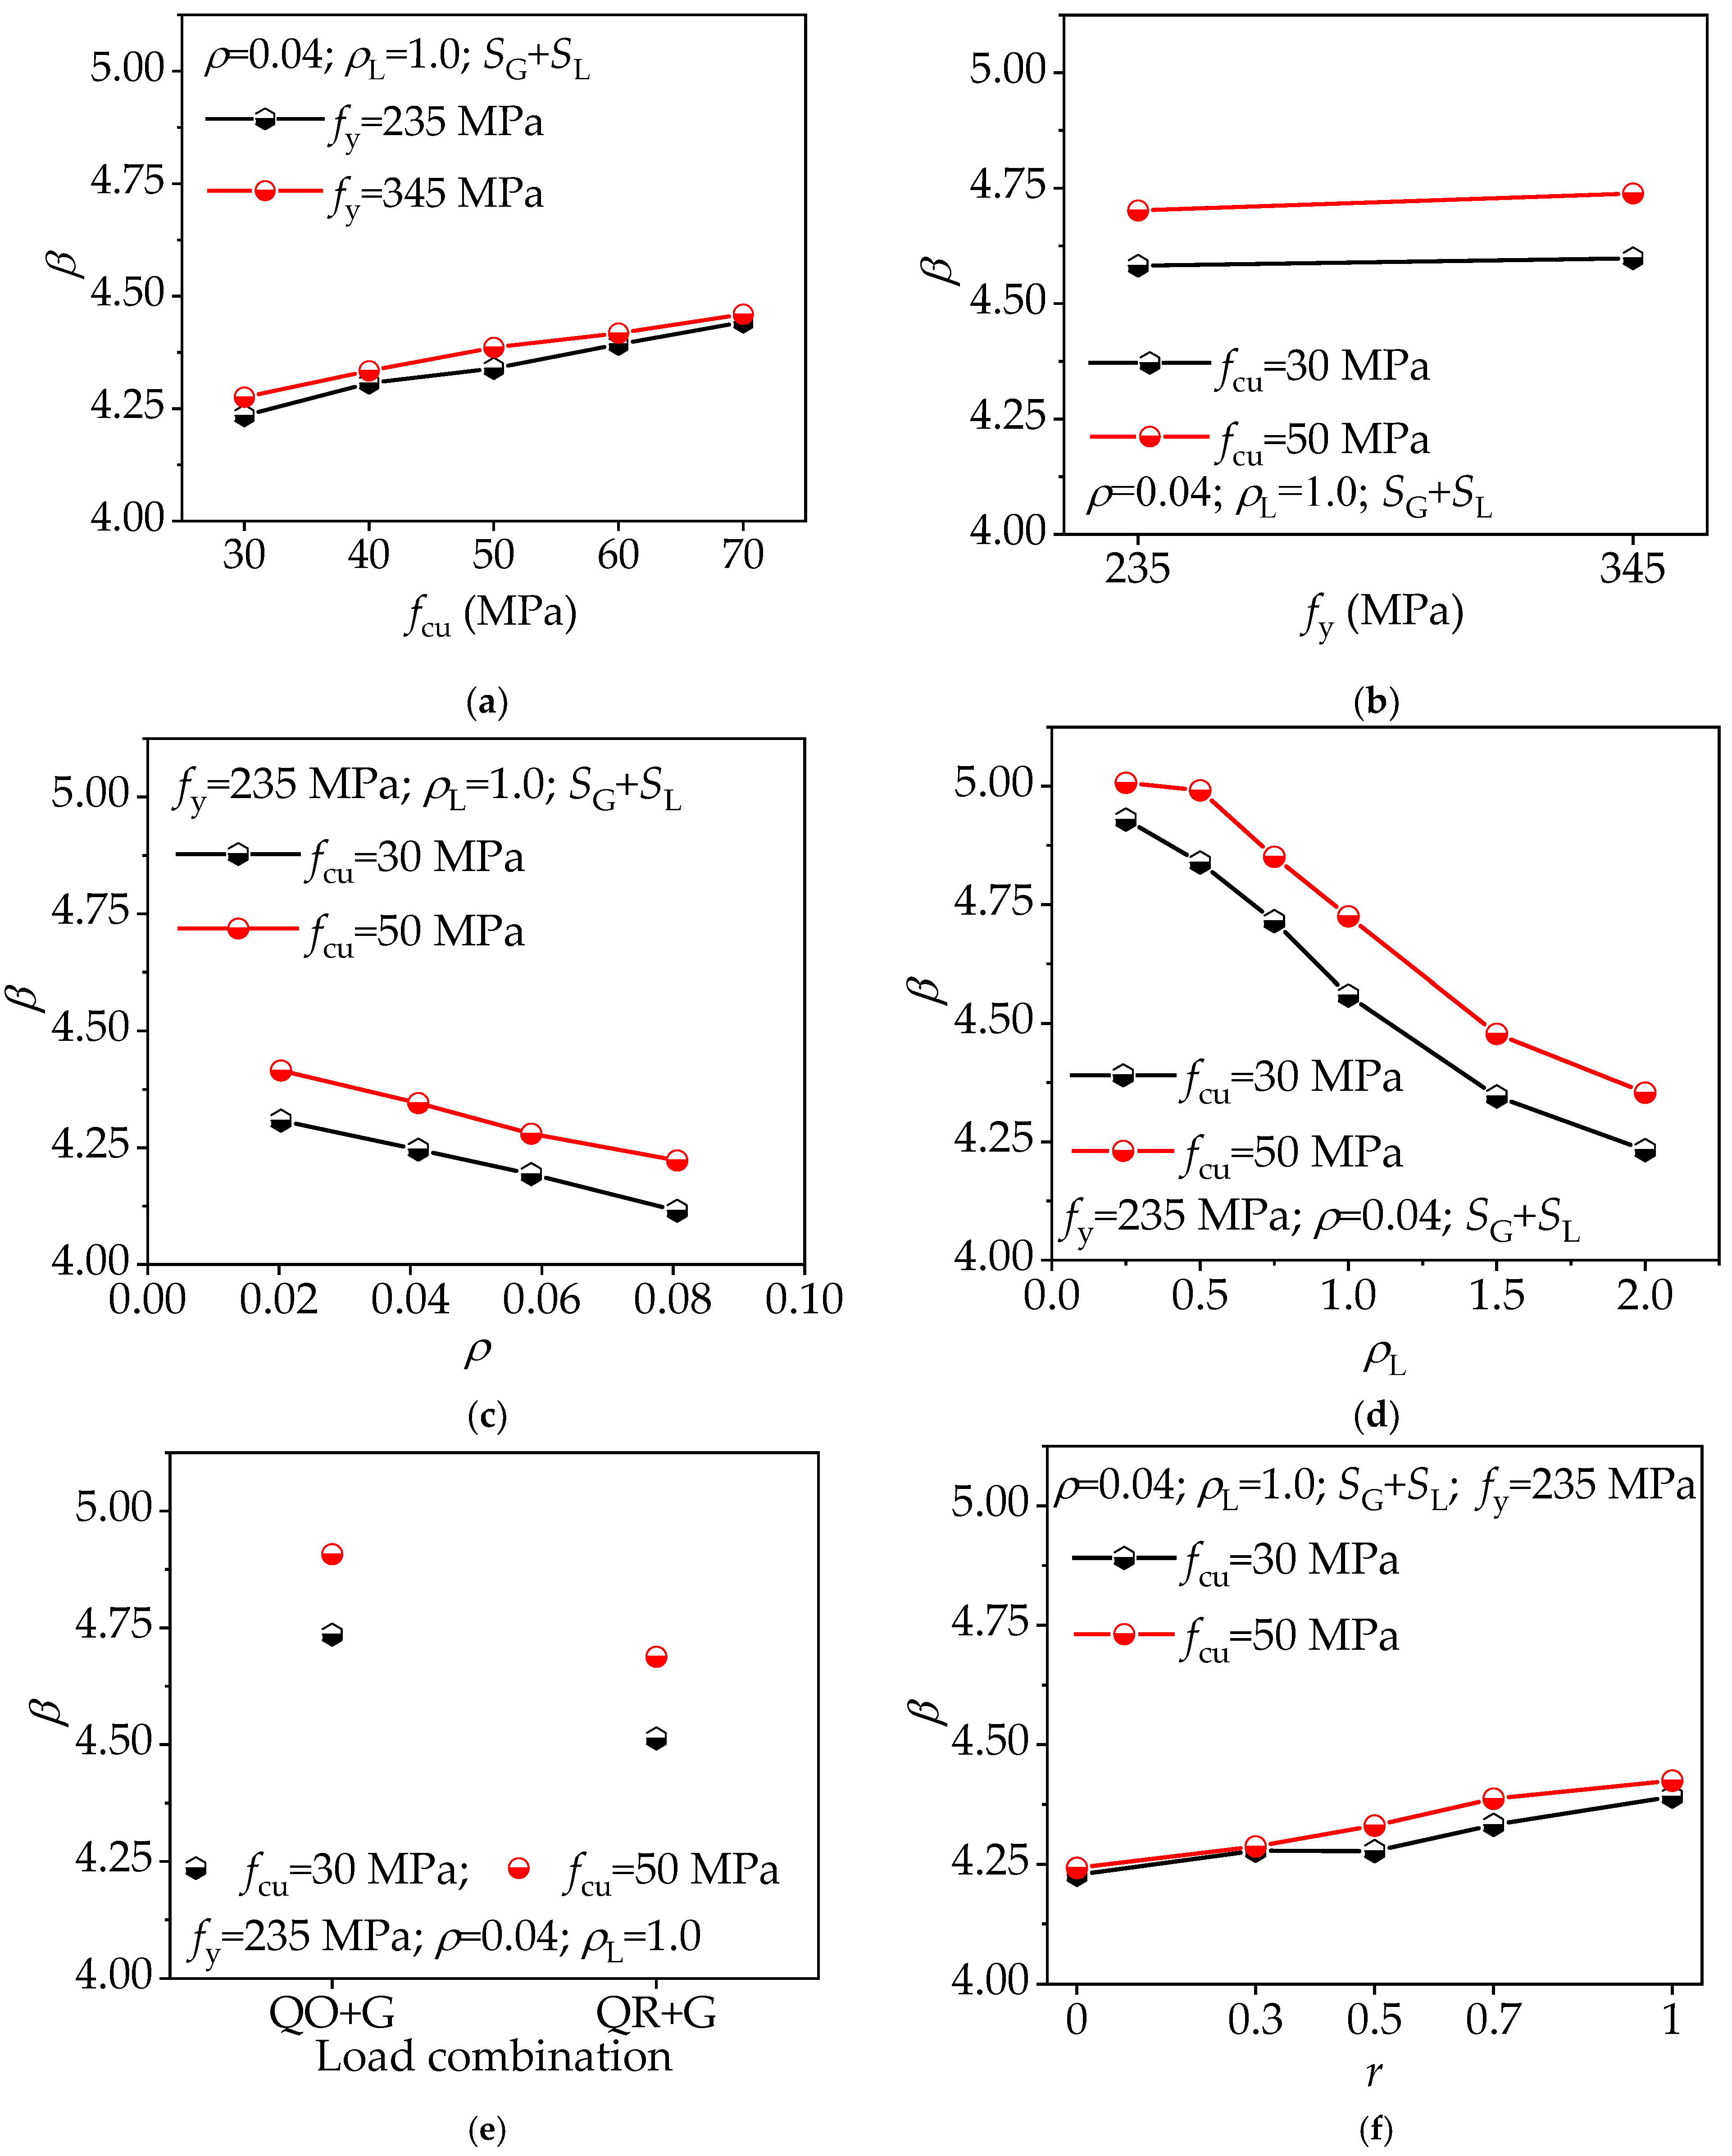
4.5.4. Reliability Analysis Results

The reliability analysis, illustrated in Figure 14, assesses the sensitivity of the reliability index (β) to various factors including concrete strength (fcu), steel yield strength (fy), steel ratio (ρ), load effect ratio (ρL), load combinations, and DS replacement ratio (r). The target reliability index of 3.2 serves as a benchmark for acceptable structural performance.
Concrete Strength (fcu): The reliability index (β) displays an incremental trend with the increase in fcu. This indicates a positive relationship, where higher-strength concrete enhances the structural reliability, with more pronounced improvements at increased steel yield strengths (Figure 14a).
Steel Yield Strength (fy): Variations in fy exhibited a relatively minor effect on the reliability index across the analyzed fcu. This suggests the dominant influence of fcu over steel strength in the context of reliability within the examined parameters (Figure 14b).
Steel Ratio (ρ): An inverse relationship is evident between the ρ and the β. Higher ρ values lead to a reduction in β, signaling a potential over-reliance on steel reinforcement that may not proportionately increase structural reliability, especially at lower concrete strengths (Figure 14c).
Load Effect Ratio (ρL): The analysis indicates a negative correlation between the ρL and β. An increase in ρL adversely affects the β, underscoring the criticality of adept load management to maintain structural reliability above the target index (Figure 14d).
Load Combination: Different load combinations affect the β differently. For instance, the combination QO+G results in a higher β compared to QR+G, suggesting that the latter may be more challenging for the structural system, potentially reducing the reliability index below the acceptable threshold (Figure 14d).
DS Replacement Ratio (r): Figure 14f indicates a gradual increase in the β with an increase in the r for concrete strengths of 30 MPa and 50 MPa. The trend suggests that incorporating DS components positively influences structural reliability. However, the effect is less significant at higher concrete strengths, illustrating a complex relationship between DS replacements and material properties.
In order to reach the desired reliability index of 3.2, our findings emphasize the need for a well-balanced design strategy that takes into account the interaction between material strengths, steel ratios, and loading circumstances. This research corroborates the reliability requirements specified in the Chinese standard GB50068-2018 [50] and underscores the need to consider all elements that contribute to guaranteeing sufficient safety margins against failure.

5. Conclusions

This paper provides a thorough numerical analysis and reliability assessment of DS-CFCST stub columns. The FE model developed accurately predicts the ultimate bearing capacity and confinement behavior under axial compression, validated against experimental results. Key findings include:
  • FE model results show good agreement with experimental data, evidenced by a mean value of Nu,Exp/Nu,FE at 1.008 and a CV of 0.040. Load–axial strain curves from the FE analysis align closely with experimental observations, confirming the model’s validity.
  • The strength of the infilled DS concrete, steel yield strength, and steel ratio significantly influence the ultimate bearing capacity of DS-CFCST stub columns. Conversely, the DS replacement ratio has a minor impact on load-bearing capacity.
  • This study highlights the diminishing effect of DS replacement ratio on steel tube confinement efficacy. However, the relative influence of this factor is minimal compared to other design parameters.
  • A simplified, straightforward formula for predicting the axial load-bearing capacity of DS-CFCST columns is proposed. This formula, incorporating a steel tube shape confinement factor, aligns well with experimental and FE-derived results, offering a more accurate and simpler alternative to existing design code formulas.
  • Reliability analysis supports balanced design approaches, considering material strengths, reinforcement ratios, loading conditions, and DS replacement ratio. This ensures adherence to the target reliability index, emphasizing the necessity of adequate safety margins against failure in structural systems.

Author Contributions

S.I.S., investigation, methodology, formal analysis, writing—original draft preparation, visualization, validation. F.-X.D., conceptualization, supervision, writing—review and editing, project administration, funding acquisition, and resources. M.W., supervision, writing—review and editing, project administration, funding acquisition, and resources. F.L., supervision, writing—review and editing, project administration, funding acquisition, data curation, and resources. K.A., visualization, validation, data curation, and resources. H.X., validation, data curation, and resources. B.H., validation, data curation, and resources. All authors have read and agreed to the published version of the manuscript.

Funding

The research work was financially supported by the National Natural Science Foundation of China (Grant No. 52008400) and the Natural Science Foundation of Hunan (Grant No. 2019JJ20029). Additionally, this work received support from the High-Performance Computing Center of Central South University.

Data Availability Statement

All data that support the findings of this study are available from the corresponding author upon reasonable request.

Conflicts of Interest

Authors Hongchang Xu and Baoye Hui were employed by the company China Construction Third Engineering Bureau Group Co., Ltd. The remaining authors declare that the research was conducted in the absence of any commercial or financial relationships that could be construed as a potential conflict of interest.

References

  1. Goldberg, S. Demand for Frac Sand and Concrete Drives Scarcity. Available online: https://www.investopedia.com/investing/demand-frac-sand-and-concrete-drives-scarcity/ (accessed on 13 July 2024).
  2. Bendixen, M.; Best, J.; Hackney, C.; Iversen, L.L. Time Is Running out for Sand. Nature 2019, 571, 29–31. [Google Scholar] [CrossRef] [PubMed]
  3. Goyal, S. Soaring Sand Prices Adversely Impact Residential Projects. Available online: https://www.99acres.com/articles/soaring-sand-prices-adversely-impact-residential-projects.html (accessed on 13 July 2024).
  4. Al-Harthy, A.S.; Halim, M.A.; Taha, R.; Al-Jabri, K.S. The Properties of Concrete Made with Fine Dune Sand. Constr. Build. Mater. 2007, 21, 1803–1808. [Google Scholar] [CrossRef]
  5. Alhozaimy, A.; Jaafar, M.S.; Al-Negheimish, A.; Abdullah, A.; Taufiq-Yap, Y.H.; Noorzaei, J.; Alawad, O.A. Properties of High Strength Concrete Using White and Dune Sands under Normal and Autoclaved Curing. Constr. Build. Mater. 2012, 27, 218–222. [Google Scholar] [CrossRef]
  6. Seif, E.S.S.A. Assessing the Engineering Properties of Concrete Made with Fine Dune Sands: An Experimental Study. Arab. J. Geosci. 2013, 6, 857–863. [Google Scholar] [CrossRef]
  7. Luo, F.J.; He, L.; Pan, Z.; Duan, W.H.; Zhao, X.L.; Collins, F. Effect of Very Fine Particles on Workability and Strength of Concrete Made with Dune Sand. Constr. Build. Mater. 2013, 47, 131–137. [Google Scholar] [CrossRef]
  8. Zaitri, R.; Bederina, M.; Bouziani, T.; Makhloufi, Z.; Hadjoudja, M. Development of High Performances Concrete Based on the Addition of Grinded Dune Sand and Limestone Rock Using the Mixture Design Modelling Approach. Constr. Build. Mater. 2014, 60, 8–16. [Google Scholar] [CrossRef]
  9. Liu, H.-F.; Chen, Q.-L.; Fu, J. Mechanical Properties of Desert Sand High Strength Concrete with Different Desert Sand Replacement Ratio and Fly Ash Dosage. Adv. Mater. Technol. Appl. 2016, 203–208. [Google Scholar] [CrossRef]
  10. Li, Y.; Zhang, H.; Liu, G.; Hu, D.; Ma, X. Multi-Scale Study on Mechanical Property and Strength Prediction of Aeolian Sand Concrete. Constr. Build. Mater. 2020, 247, 118538. [Google Scholar] [CrossRef]
  11. Lynda Amel, C.; Kadri, E.H.; Sebaibi, Y.; Soualhi, H. Dune Sand and Pumice Impact on Mechanical and Thermal Lightweight Concrete Properties. Constr. Build. Mater. 2017, 133, 209–218. [Google Scholar] [CrossRef]
  12. Liu, H.; Chen, X.; Che, J.; Liu, N.; Zhang, M. Mechanical Performances of Concrete Produced with Desert Sand after Elevated Temperature. Int. J. Concr. Struct. Mater. 2020, 14, 26. [Google Scholar] [CrossRef]
  13. Damene, Z.; Goual, M.S.; Houessou, J.; Dheilly, R.M.; Goullieux, A.; Quéneudec, M. The Use of Southern Algeria Dune Sand in Cellular Lightweight Concrete Manufacturing: Effect of Lime and Aluminium Content on Porosity, Compressive Strength and Thermal Conductivity of Elaborated Materials. Eur. J. Environ. Civ. Eng. 2018, 22, 1273–1289. [Google Scholar] [CrossRef]
  14. Yan, W.; Wu, G.; Dong, Z. Optimization of the Mix Proportion for Desert Sand Concrete Based on a Statistical Model. Constr. Build. Mater. 2019, 226, 469–482. [Google Scholar] [CrossRef]
  15. Li, Y.; Zhang, H.; Liu, X.; Liu, G.; Hu, D.; Meng, X. Time-Varying Compressive Strength Model of Aeolian Sand Concrete Considering the Harmful Pore Ratio Variation and Heterogeneous Nucleation Effect. Adv. Civ. Eng. 2019, 2019, 5485630. [Google Scholar] [CrossRef]
  16. Zhang, G.; Song, J.; Yang, J.; Liu, X. Performance of Mortar and Concrete Made with a Fine Aggregate of Desert Sand. Build. Environ. 2006, 41, 1478–1481. [Google Scholar] [CrossRef]
  17. Benabed, B.; Kadri, E.H.; Azzouz, L.; Kenai, S. Properties of Self-Compacting Mortar Made with Various Types of Sand. Cem. Concr. Compos. 2012, 34, 1167–1173. [Google Scholar] [CrossRef]
  18. Zhu, L.; Zheng, M.; Zhang, S.; Zhang, W.; Chen, W.; Ou, Z. Modification and Mechanism of Polymer in High-Performance Concrete with Full Aeolian Sand: An Integrated Macro-to-Micro Perspective. J. Build. Eng. 2023, 75, 106969. [Google Scholar] [CrossRef]
  19. Hamada, H.M.; Abed, F.; Al-Sadoon, Z.A.; Elnassar, Z.; Hassan, A. The Use of Treated Desert Sand in Sustainable Concrete: A Mechanical and Microstructure Study. J. Build. Eng. 2023, 79, 107843. [Google Scholar] [CrossRef]
  20. Park, S.; Lee, E.; Ko, J.; Yoo, J.; Kim, Y. Rheological Properties of Concrete Using Dune Sand. Constr. Build. Mater. 2018, 172, 685–695. [Google Scholar] [CrossRef]
  21. Wang, W.H.; Han, L.H.; Li, W.; Jia, Y.H. Behavior of Concrete-Filled Steel Tubular Stub Columns and Beams Using Dune Sand as Part of Fine Aggregate. Constr. Build. Mater. 2014, 51, 352–363. [Google Scholar] [CrossRef]
  22. Ren, Q.X.; Zhou, K.; Hou, C.; Tao, Z.; Han, L.H. Dune Sand Concrete-Filled Steel Tubular (CFST) Stub Columns under Axial Compression: Experiments. Thin-Walled Struct. 2018, 124, 291–302. [Google Scholar] [CrossRef]
  23. Li, Z.; Ma, R.; Li, G. Experimental Study on the Shear Strength of Dune Sand Concrete Beams. Adv. Civ. Eng. 2020, 2020, 8062691. [Google Scholar] [CrossRef]
  24. Li, Z.; Yang, S.; Luo, Y. Experimental Evaluation of the Effort of Dune Sand Replacement Levels on Flexural Behaviour of Reinforced Beam. J. Asian Archit. Build. Eng. 2020, 19, 480–489. [Google Scholar] [CrossRef]
  25. Li, Z.; Gan, D. Cyclic Behavior and Strength Evaluation of RC Columns with Dune Sand. J. Build. Eng. 2022, 47, 103801. [Google Scholar] [CrossRef]
  26. Li, Z.; Zhai, D.; Li, J. Seismic Behavior of the Dune Sand Concrete Beam-Column Joints under Cyclic Loading. Structures 2022, 40, 1014–1024. [Google Scholar] [CrossRef]
  27. Guo, Z.; Qin, Y.; Zhang, Y.; Li, X. Experimental Investigation on Shear Behavior of Dune Sand Reinforced Concrete Deep Beams. Appl. Sci. 2023, 13, 3466. [Google Scholar] [CrossRef]
  28. Han, L.H.; Li, W.; Bjorhovde, R. Developments and Advanced Applications of Concrete-Filled Steel Tubular (CFST) Structures: Members. J. Constr. Steel Res. 2014, 100, 211–228. [Google Scholar] [CrossRef]
  29. Han, L.H.; Tao, Z.; Huang, H.; Zhao, X.L. Concrete-Filled Double Skin (SHS Outer and CHS Inner) Steel Tubular Beam-Columns. Thin-Walled Struct. 2004, 42, 1329–1355. [Google Scholar] [CrossRef]
  30. Chen, Z.; Xu, J.; Chen, Y.; Lui, E.M. Recycling and Reuse of Construction and Demolition Waste in Concrete-Filled Steel Tubes: A Review. Constr. Build. Mater. 2016, 126, 641–660. [Google Scholar] [CrossRef]
  31. De Nardin, S.; El Debs, A.L.H.C. Axial Load Behaviour of Concrete-Filled Steel Tubular Columns. Struct. Build. 2007, 160, 13–22. [Google Scholar] [CrossRef]
  32. Patel, V.I. Analysis of Uniaxially Loaded Short Round-Ended Concrete-Filled Steel Tubular Beam-Columns. Eng. Struct. 2020, 205, 110098. [Google Scholar] [CrossRef]
  33. Ci, J.; Ahmed, M.; Liang, Q.Q.; Chen, S.; Chen, W.; Sennah, K.; Hamoda, A. Experimental and Numerical Investigations into the Behavior of Circular Concrete-Filled Double Steel Tubular Slender Columns. Eng. Struct. 2022, 267, 114644. [Google Scholar] [CrossRef]
  34. Ahmed, M.; Sheikh, M.N.; Hadi, M.N.S.; Liang, Q.Q. Nonlinear Analysis of Square Spiral-Confined Reinforced Concrete-Filled Steel Tubular Short Columns Incorporating Novel Confinement Model and Interaction Local Buckling. Eng. Struct. 2023, 274, 115168. [Google Scholar] [CrossRef]
  35. Han, L.H.; Yao, G.H.; Zhao, X.L. Tests and Calculations for Hollow Structural Steel (HSS) Stub Columns Filled with Self-Consolidating Concrete (SCC). J. Constr. Steel Res. 2005, 61, 1241–1269. [Google Scholar] [CrossRef]
  36. Tao, Z.; Wang, Z.-B.; Yu, Q. Finite Element Modelling of Concrete-Filled Steel Stub Columns under Axial Compression. J. Constr. Steel Res. 2013, 89, 121–131. [Google Scholar] [CrossRef]
  37. Ding, F.X.; Liu, J.; Liu, X.M.; Yu, Z.W.; Li, D.W. Mechanical Behavior of Circular and Square Concrete Filled Steel Tube Stub Columns under Local Compression. Thin-Walled Struct. 2015, 94, 155–166. [Google Scholar] [CrossRef]
  38. Ding, F.; Cao, Z.; Lyu, F.; Huang, S.; Hu, M.; Lin, Q. Practical Design Equations of the Axial Compressive Capacity of Circular CFST Stub Columns Based on Finite Element Model Analysis Incorporating Constitutive Models for High-Strength Materials. Case Stud. Constr. Mater. 2022, 16, e01115. [Google Scholar] [CrossRef]
  39. Bahati, M. Experimental Study on Axial Compression Mechanical Properties of Desert Sand Concrete Filled Steel Tubular Short Columns. Master’s Thesis, Xinjiang University, Urumqi, China, 2019. [Google Scholar]
  40. Sadat, S.I.; Ding, F.; Lyu, F.; Lessani, N.; Liu, X.; Yang, J. Unified Prediction Models for Mechanical Properties and Stress-Strain Relationship of Dune Sand Concrete. Comput. Concr. 2023, 32, 595–606. [Google Scholar] [CrossRef]
  41. Ding, F.; Wu, X.; Xiang, P.; Yu, Z. New Damage Ratio Strength Criterion for Concrete and Lightweight Aggregate Concrete. Struct. J. 2021, 118, 165–178. [Google Scholar] [CrossRef]
  42. Ding, F.; Sadat, S.I.; Lyu, F.; Yin, Y. Flexural Performance of Rectangular CFST Composite T-Beams: Experimental, Numerical, and Theoretical Investigation. J. Constr. Steel Res. 2024, 213, 108356. [Google Scholar] [CrossRef]
  43. Sadat, S.I.; Ding, F.; Lyu, F.; Wang, E.; Sun, H.; Akhunzada, K.; Lessani, N. Axial Compression Behavior and Reliable Design Approach of Rectangular Dune Sand Concrete-Filled Steel Tube Stub Columns. Dev. Built Environ. 2024, 18, 100437. [Google Scholar] [CrossRef]
  44. Ding, F.X.; Yu, Z.W.; Bai, Y.; Gong, Y.Z. Elasto-Plastic Analysis of Circular Concrete-Filled Steel Tube Stub Columns. J. Constr. Steel Res. 2011, 67, 1567–1577. [Google Scholar] [CrossRef]
  45. ACI 318-11; American Concrete Institute Committee, Building Code Requirements for Structural Concrete and Commentary. American Concrete Institute: Farmington Hills, MI, USA, 2011; ISBN 9780870317453.
  46. AISC 360-16; Specification for Structural Steel Buildings. American Institute of Steel Construction: Chicago, IL, USA, 2016.
  47. BS EN 1994-1-1; Design of Steel Composite Steel and Concrete Structures, Part 1-1, General Rules and Rules for Building. British Standards Institution: London, UK, 2004.
  48. AIJ. Recommendations for Design and Construction of Concrete Filled Steel Tubular Structures; Architectural Institute of Japan: Tokyo, Japan, 1997. [Google Scholar]
  49. Ding, F.; Xiong, S.; Zhang, H.; Li, G.; Zhao, P.; Xiang, P. Reliability Analysis of Axial Bearing Capacity of Concrete Filled Steel Tubular Stub Columns with Different Cross Sections. Structures 2021, 33, 4193–4202. [Google Scholar] [CrossRef]
  50. GB50068-2018; Unified Standard for Reliability Design of Building Structures. Ministry of Construction of the People’s Republic of China: Beijing, China, 2018.
  51. GB50010-2010; Code for Design of Concrete Structures. Ministry of Construction of the People’s Republic of China: Beijing, China, 2010.
Figure 1. Interaction, boundary conditions, and mesh.
Applsci 14 06939 g001
Figure 2. Uniaxial stress–strain curve of steel tube.
Applsci 14 06939 g002
Figure 3. Stress–strain curves for uniaxial compression of DS concrete under confinement and un- confinement conditions and varying replacement ratios.
Applsci 14 06939 g003
Figure 4. Comparative analysis of load–axial strain curves between FE simulations and experimental data. (a) Ren et al. [22]; (b) Wang et al. [21]; (c) and (d) Ren et al. [22].
Applsci 14 06939 g004
Figure 5. Influence of various parameters on DS-CFCST stub columns. (a) Concrete strength; (b) steel strength; (c) steel ratio.
Applsci 14 06939 g005
Figure 6. Effect of concrete strength (D = 500 mm, L = 1500 mm, ρ = 0.06, fy = 345 MPa). (a) Infilled DS concrete σr,c-εL curves; (b) infilled DS concrete ξr,c-εL curves; (c) steel tube σs-εL curves; (d) steel tube load–strain ratio curves.
Applsci 14 06939 g006
Figure 7. Effect of steel strength (D = 500 mm, L = 1500 mm, ρ = 0.06, fcu,0 = 50 MPa). (a) Infilled DS concrete σr,c-εL curves; (b) infilled DS concrete ξr,c-εL curves; (c) steel tube σs-εL curves; (d) steel tube load–strain ratio curves.
Applsci 14 06939 g007
Figure 8. Effect of steel ratio (D = 500 mm, L = 1500 mm, ρ = 0.06, fcu,0 = 50 MPa). (a) Infilled DS concrete σr,c-εL curves; (b) infilled DS concrete ξr,c-εL curves; (c) steel tube σs-εL curves; (d) Steel tube load–strain ratio curves.
Applsci 14 06939 g008
Figure 9. Stress nephogram comparison for stub columns with varying DS replacement ratios at mid-height sections.
Applsci 14 06939 g009
Figure 10. Simplified model for calculating the bearing capacity of DS-CFST short columns under axial compression. (a) Stress distribution in the external steel tube; (b) Stress distribution in the infilled DS concrete; (c) Overall simplified model.
Applsci 14 06939 g010
Figure 11. Relationship between the FE models’ ultimate strength and the steel tube stress ratio. (a) Longitudinal stress in the steel tube; (b) Lateral stress in the steel tube.
Applsci 14 06939 g011
Figure 12. Comparison of ultimate bearing capacity from experimental results and FE analysis using Equation (10). (a) Calculated values of Equation (10) versus experimental results; (b) Calculated values of Equation (10) versus FE results; (c) Calculated values of Equation (10) versus FE results (based on test data parameters); (d) Calculated values of Equation (10) versus FE results (based on FE parametric analysis).
Applsci 14 06939 g012
Figure 13. Comparisons between experimental data and the results derived from design codes and Equation (10). (a) ACI-318-11; (b) AISC 360-16; (c) BS EN 1994; (d) AIJ.
Applsci 14 06939 g013
Figure 14. Influence of different parameters on the reliability index (β). (a) Concrete strength; (b) steel yield strength; (c) steel ratio; (d) load effect ratio; (e) load combination; (f) DS replacement ratio.
Applsci 14 06939 g014
Table 1. Concrete damage plasticity model parameters.
EcrPoisson’s RatioDilation Angleefb0/fc0Kμ
(1 − 0.1r) 9500fcu1/30.240°0.11.2772/30.0005
Table 2. Comparison of DS-CFCST column FE analysis findings with axial compression bearing capacity test results.
Specimen LabelRef.D × t × L/mmrfcu,r (MPa)fy (MPa)Nu,Exp (kN)Nu,FE (kN)Nu,Exp/Nu,FE
C-3-8-1[21]160 × 3.46 × 5200.17836320442008.361.018
C-3-8-2160 × 3.46 × 5200.17836320692008.361.030
c1-1[22]200 × 3.82 × 600165.843231913184.421.002
c1-2200 × 3.82 × 600165.843231523184.420.990
c2-1200 × 2.90 × 600165.839027222705.061.006
c2-2200 × 2.90 × 600165.839028222705.061.043
c3-1200 × 1.98 × 600165.838825462355.521.081
c3-2200 × 1.98 × 600165.838824652355.521.046
c4-1150 × 3.82 × 450165.843219271887.801.021
c4-2150 × 3.82 × 450165.843218461887.800.978
c5-1100 × 3.82 × 300165.843210971059.501.035
c5-2100 × 3.82 × 300165.843210871059.501.026
DCFT3020-1[39]165 × 2.75 × 4950.236.9344.101362.081261.591.080
DCFT3020-2165 × 2.75 × 4950.236.9344.101355.951261.591.075
DCFT3020-3165 × 2.75 × 4950.236.9344.101373.261261.591.089
DCFT3040-1165 × 2.75 × 4950.445.4344.101397.421367.021.022
DCFT3040-2165 × 2.75 × 4950.445.4344.101354.691367.020.991
DCFT3040-3165 × 2.75 × 4950.445.4344.101355.521367.020.992
DCFT3060-1165 × 2.75 × 4950.647.4344.101326.131384.660.958
DCFT3060-2165 × 2.75 × 4950.647.4344.101307.631384.660.944
DCFT3060-3165 × 2.75 × 4950.647.4344.101333.711384.660.963
DCFT30100-1165 × 2.75 × 495146.7344.101386.471371.711.011
DCFT30100-2165 × 2.75 × 495146.7344.101339.311371.710.977
DCFT30100-3165 × 2.75 × 495146.7344.101353.741371.710.987
DCFT5020-1[39]165 × 2.75 × 4950.260.2344.101554.741628.950.954
DCFT5020-2165 × 2.75 × 4950.260.2344.101572.321628.950.965
DCFT5020-3165 × 2.75 × 4950.260.2344.101547.991628.950.950
DCFT5040-1165 × 2.75 × 4950.456.1344.101501.401551.120.968
DCFT5040-2165 × 2.75 × 4950.456.1344.101475.201551.120.951
DCFT5040-3165 × 2.75 × 4950.456.1344.101576.201551.121.016
DCFT5060-1165 × 2.75 × 4950.654.5344.101573.621520.291.035
DCFT5060-2165 × 2.75 × 4950.654.5344.101517.901520.290.998
DCFT5060-3165 × 2.75 × 4950.654.5344.101645.061520.291.082
DCFT50100-1165 × 2.75 × 495150.7344.101562.551515.541.031
DCFT50100-2165 × 2.75 × 495150.7344.101529.581515.541.009
DCFT50100-3165 × 2.75 × 495150.7344.101525.501515.541.007
Mean1.008
CV0.040
Note: L is the specimen’s length, D is the steel tube’s outer diameter, t is its wall thickness, and r is the DS replacement ratio.
Table 3. Material and geometric characteristics of the specimen for FE parametric analysis.
D (mm)L (mm)ρRfcu,0 (MPa)fy (MPa)
50015000.02, 0.04, 0.06, 0.080, 0.3, 0.5, 0.7, 130, 50235
50, 70345
70420
Table 4. Limitations in the design code for CFST columns.
Design CodesACI-318AISC 360–16EC 4AIJ
fc, fcu (MPa)fc ≥ 17.221 ≤ fc ≤ 6920 ≤ fc ≤ 50
25 ≤ fcu ≤ 60
fc ≤ 58.8
fy (MPa)-≤525235–460235 ≤ fy ≤ 355
D/t 8 E s / f y 0.31 E s f y 90   235 f y 90   23 , 500 F
Table 5. Circular CFST stub column design code formulas.
Ref.FormulaNu,Eq/Nu,Exp
MeanCV
This paper N u , r = f c A c + k r f y A s , k r = 1.58 0.9720.054
ACI-318 [45] N u , A C I = A s f y + 0.85 f c A c 1.2620.055
AISC 360–16 [46] N u , A I S C = A s f y + 0.95 f c A c 1.1800.058
BS EN 1994 [47] N u , E C 4 = η a A s f y + A c f c ( 1 + η c t D f y f c ) η a = 0.25 ( 3 + 2 λ ¯ ) 1.0 , η c = 4.9 18.5 λ ¯ + 17 λ ¯ 2 1.0 ; λ ¯ = N p l , R k N c r , N p l , R k = A s f y + A c f c N c r = π 2 ( E s I s + 0.6 E c I c ) L 2 0.9540.055
AIJ [48] N u , AIJ = γ c f c A c + ( 1 + η ) f y A s η = 0.27 , γ c = 0.85 1.1350.054
Table 6. Statistical parameters of load combinations.
ParameterDead Load (G)Office Live Load (QO)Residential Live Load (QR)
Mean Value (μ)1.0600.6980.859
Coefficient of Variation (δ)0.0700.2880.233
Distribution TypeNormalExtreme Value Type IExtreme Value Type I distribution
Table 7. Statistical parameters for steel tubes.
ParameterQ235 (t ≤ 16 mm)Q235 (t > 16 mm)Q345 (t ≤ 16 mm)Q345 (t > 16 mm)
Standard strength (fyk/MPa)235225345335
Design strength (fyd/MPa)215205305295
Mean value (μ)1.0801.0801.0901.090
Coefficient of variation (δ)0.0800.0800.0700.070
Distribution typeNormal distribution
Table 8. Statistical parameters for concrete.
ParameterC30C40C50C60C70
Standard strength (fck/MPa)20.126.832.438.544.5
Design strength (fcd/MPa)14.319.123.127.531.8
Mean value (μ)1.3741.3421.3371.3321.292
Coefficient of variation (δ)0.1720.1560.1490.1410.121
Distribution typeNormal distribution
Disclaimer/Publisher’s Note: The statements, opinions and data contained in all publications are solely those of the individual author(s) and contributor(s) and not of MDPI and/or the editor(s). MDPI and/or the editor(s) disclaim responsibility for any injury to people or property resulting from any ideas, methods, instructions or products referred to in the content.

