Abstract
Public open spaces make crucial contributions to the livability of communities and promote physical and mental health. Soundscapes play an important role in the overall physical comfort of public open spaces. However, owing to insufficient studies of high-density situations, soundscapes are ignored in public open spaces in high-density residential areas. This paper presents a case study of a soundscape in the overseas Chinese town (OCT) of Shenzhen, China. Through in situ observation, four distinct soundscapes were easily identified by performing soundscape conceptualization according to the ISO. In terms of the four identified soundscape areas, subjective evaluations of acoustic comfort and annoyance and their influencing factors were thoroughly explored. The results reveal that the natural soundscape had the best evaluations, whereas the artificial one did not have the worst result. It is interesting to note that acoustic factors do not always significantly influence a soundscape’s evaluation. A non-acoustic factor such as the spatial function may play a role as it is related to the context of an individual perceiving an acoustic environment. This study provides first-hand empirical evidence for understanding soundscapes and the influencing factors present in high-density residential public open spaces. The results provide useful knowledge for enhancing soundscape quality in such spaces.
1. Introduction
Urbanization leads to many environmental problems, among which noise is a major one [1]. In European Union countries, about 20% of the population suffers from noise levels above 65 dB [2] and this is more serious in developing countries. Recently, with the rapid increase in automobiles, noise has become the top environmental complaint in China’s metropolises (e.g., Shenzhen) [3]. In comparison to other environmental problems, the effect of noise is greater in high-density cities. However, when alleviating noise nuisance, the conventional approach of reducing ambient sound levels has been proven to not always be effective. According to the International Organization for Standardization (ISO), a soundscape is defined as an “acoustic environment as perceived or experienced and/or understood by a person or people, in context” [4]. It emphasizes a perceptual structure concentrated on individuals and this is influenced by the context [5,6]. Many studies have confirmed that soundscapes have a vital impact on the perceived quality of urban environments [7]. The findings of a study on community noise showed that better availability of nearby green areas in noise-exposed sites can mitigate noise’s effects as they can deliver the required improvements in aural perception and mitigate feelings of annoyance [8]. In a large survey conducted by the Greater London Council, it was found that the presence of parks and green spaces lowered traffic noise’s impact on neighborhoods and improved the quality of life in communities [9]. Given the multitude of factors influencing noise perception, the soundscape approach concerning satisfaction with the whole environment via aural perception is considered more useful than purely controlling the equivalent sound pressure level [10,11,12,13]. In residential areas, the concept of a soundscape has been emphasized for its role in enhancing public health [14,15,16]. Hence, soundscapes are studied within high-density residential sites in particular and are discussed in this paper.
A soundscape makes vital contributions to individuals’ aural perceptions of a certain place (e.g., an urban public open space). According to the definition of a soundscape [4], a soundscape pays more attention to noise annoyance evaluations, in which aural perception is strengthened. In a study on public open spaces, the sound source was found to be more important in noise annoyance evaluations than the sound level when it was below a certain value [17]. For residential areas, the Guidelines for Community Noise suggest that open spaces provide recreational functions to inhabitants [2] while the accessibility of nearby green areas provides important benefits for social health [8]. A study on sustainable communities indicated that well-designed public open spaces can enhance resident satisfaction and promote place attachment [18]. Undoubtedly, public open spaces play an underlying role in promoting a sustainable environment in which acoustic comfort, defined as one of the essential feelings toward an acoustic environment, is required [19].
Factors from either acoustic or non-acoustic facets can influence soundscape evaluations [20]. A soundscape is a perceived acoustic environment [4] in which not only acoustic indices but also non-acoustic factors related to the audience’s perception and social attributes may have impacts. Soundscape studies have indicated that sound levels, frequency, and psychoacoustic parameters are important for determining soundscape evaluations [21]. The findings of a study on soundscapes in public open spaces show that sound sources are essential for determining annoyance perceptions [22]. Natural sounds have been proven to be delightful and they can reduce noise nuisance, while exercise sounds from open-space events can be either pleasant or noisy, depending on the roles that people assume in a scenario [23]. In addition, visual factors have also been proven to be important in determining noise annoyance. Good landscapes can influence auditory perception and mitigate noise annoyance [24,25,26]. A study on the effects of visual factors on noise suggested that the architectural styles of ancient religious buildings and good landscapes can induce quietness [27]. Green open spaces in residential areas were found to largely influence soundscape evaluations, acting as moderators that released noise-related stress [28]. In public open spaces, some works found that human activity was one of the main determinants [29,30]. In summary, landscapes, and sound sources are of critical importance to a soundscape’s quality, although the behavior status of a person can have an impact.
To evaluate soundscapes, many descriptors have been studied and evaluations of annoyance and comfort have been emphasized the most [31,32]. According to ISO 12913-2, a soundscape can be assessed by an individual through the perceived affective quality of the present surrounding acoustic environment, which includes eight affective attributes: pleasant, vibrant, eventful, chaotic, annoying, monotonous, uneventful, and calm. Although annoyance evaluation is included in ISO/TS 12913-2 [33], acoustic comfort evaluation is excluded. However, in this ISO, an overall evaluation of the surrounding sound environment is also required, which is much closer to an acoustic comfort evaluation, as studies on public open spaces indicated that both are highly correlated [34]. In addition, acoustic comfort is one of the descriptors used to evaluate soundscape quality [35] and it has been found that it can be categorized as a component of the pleasant descriptor. Soundscape evaluation can be influenced by multiple factors, such as acoustic and psychoacoustic factors, perception attributes, cultural backgrounds, and features of the physical environment [36]. In addition, the sound source has an essential influence on a soundscape’s evaluation, and the spectrum and semantic meanings play a role. Moreover, the landscape and the events occurring at a site cannot be ignored when studying soundscape evaluations.
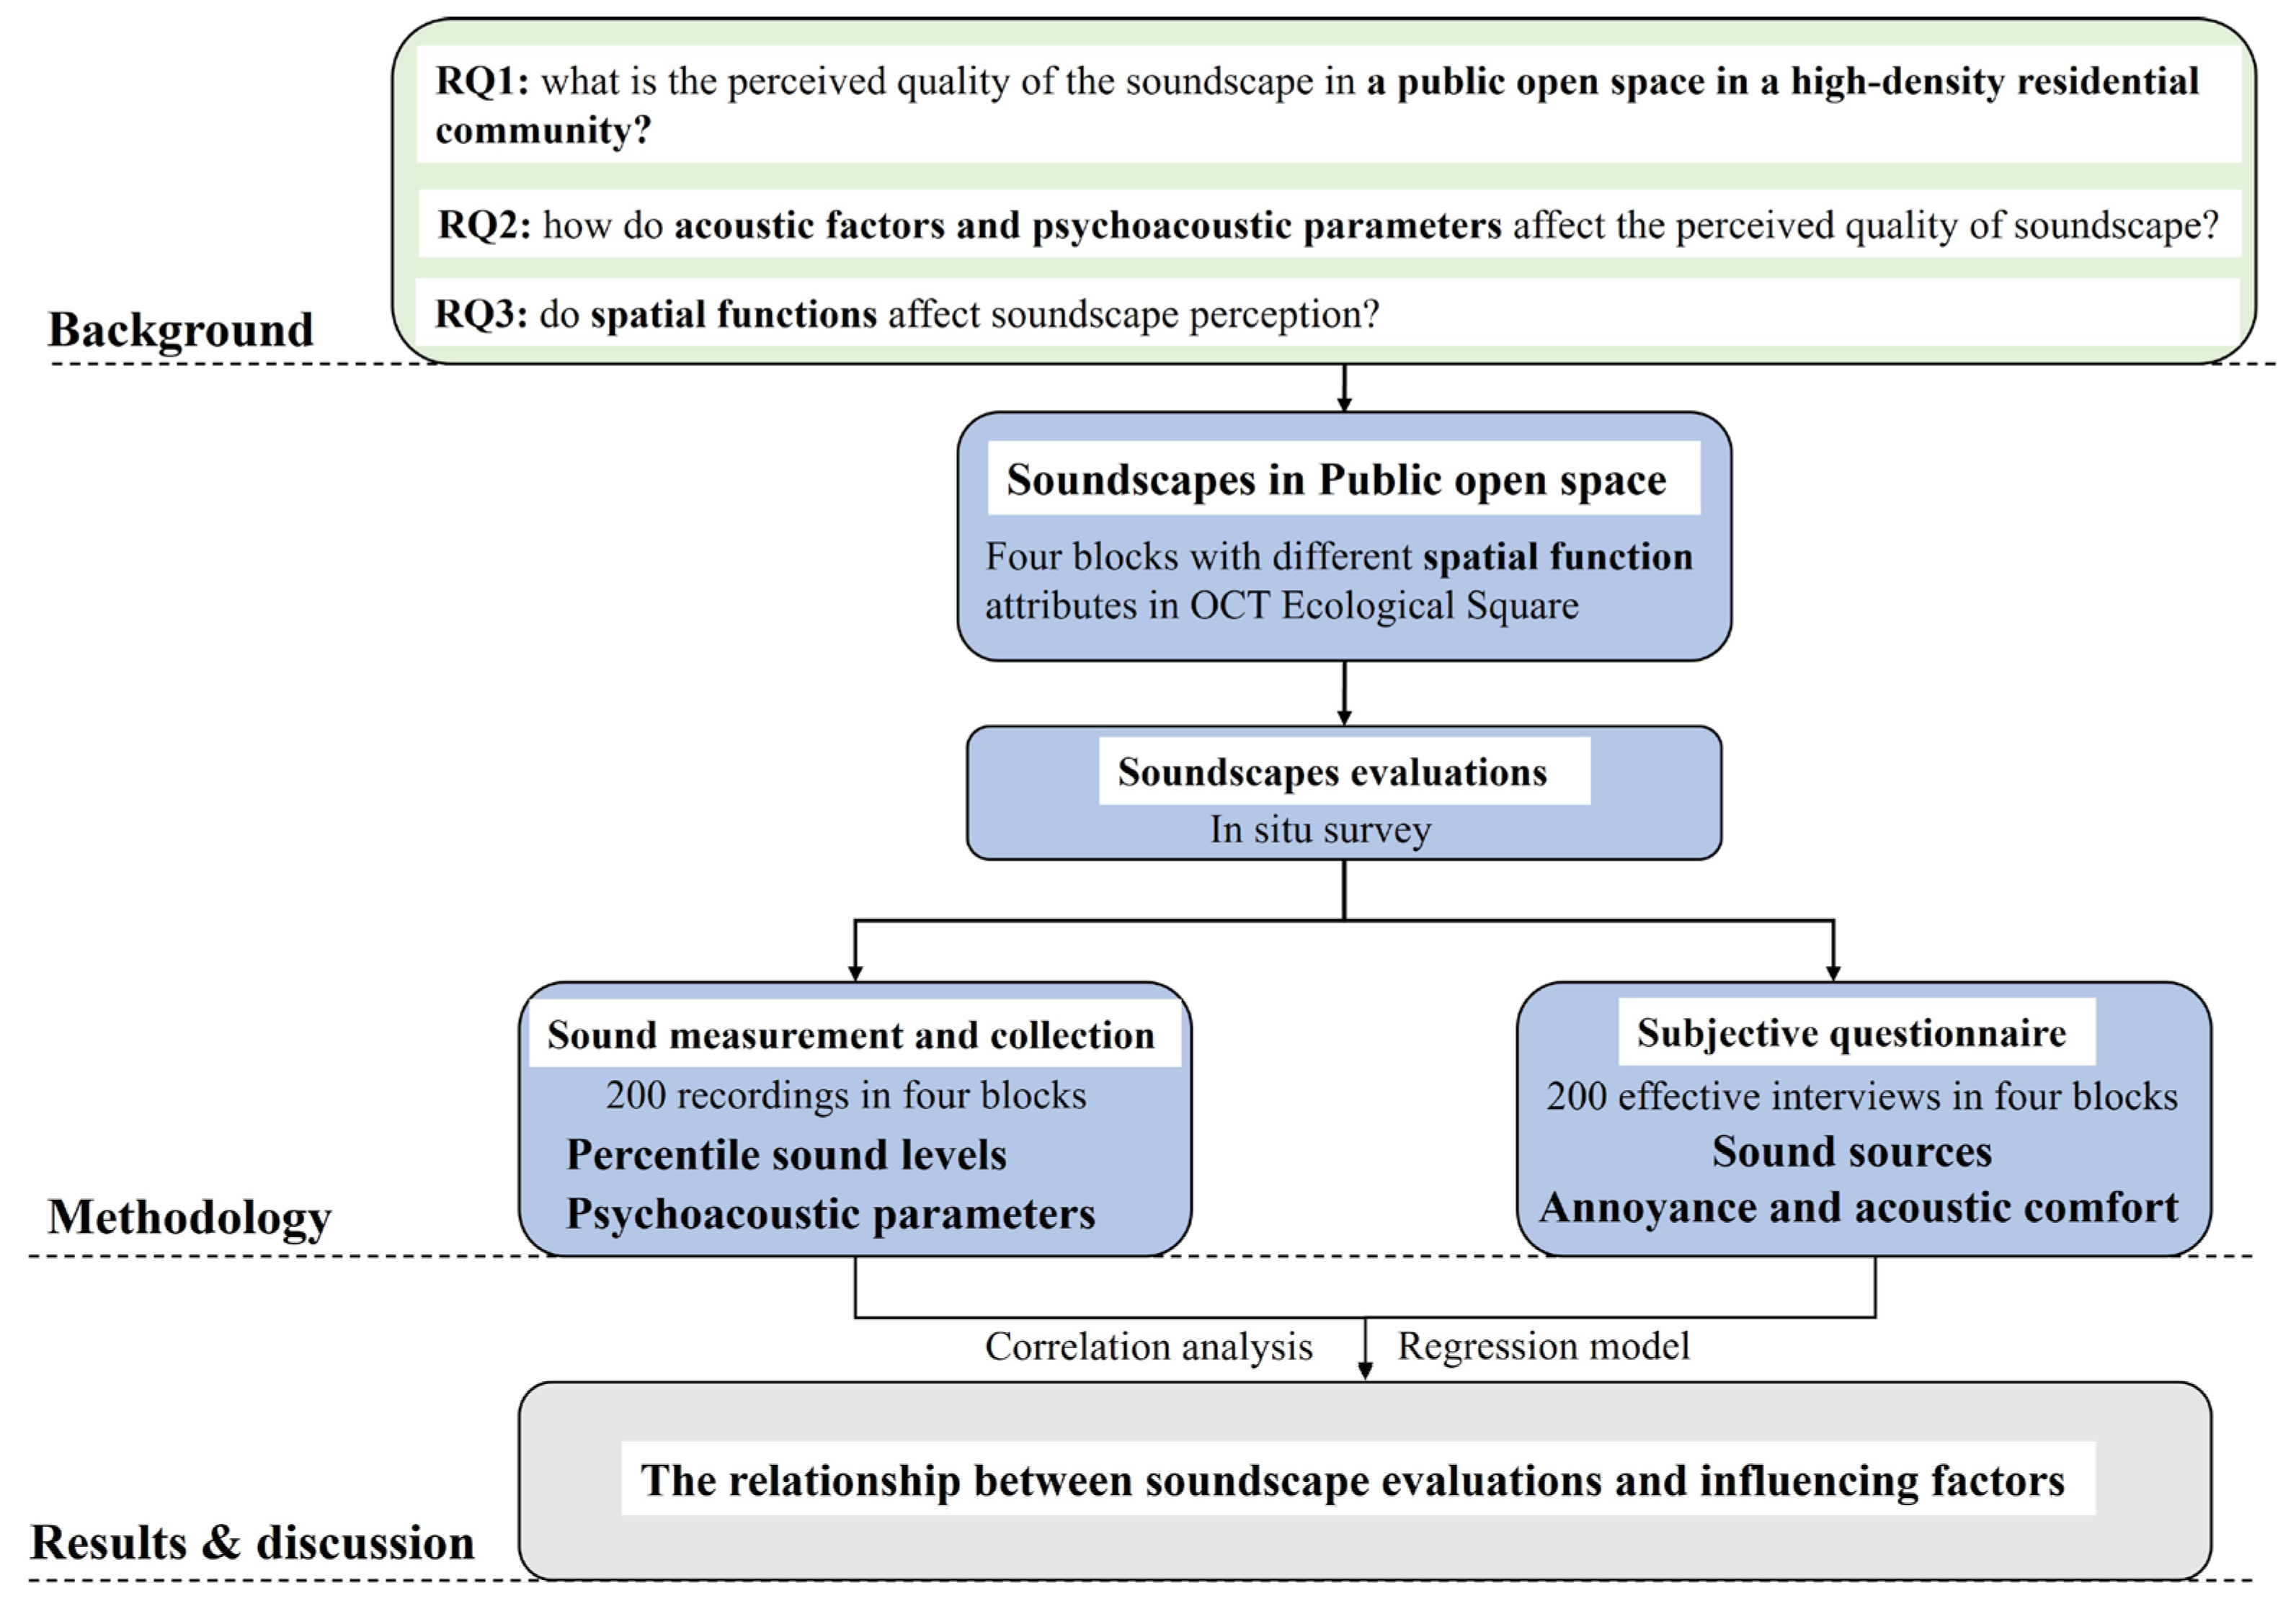
There is increasing acknowledgment that soundscapes have a significant impact on the quality of public open spaces, which is even more important in high-density cities, such as Chinese metropolises. Although extensive soundscape evaluations have been carried out in public open spaces [13,17,22,28,34,37], there is still a research gap in evaluating soundscapes and influencing factors in high-density residential areas. Previous works have studied soundscapes in urban high-density residential communities and indicated that the dimensions of relaxation, communication, and quietness were significantly positively correlated with soundscape quality. Broad research is needed as additional factors have not been investigated. In this study, three research questions were evaluated:
RQ1.
What is the perceived quality of the soundscape in a public open space in a high-density residential community?
RQ2.
How do acoustic factors and psychoacoustic parameters affect the perceived quality of the soundscape?
RQ3.
Do spatial functions affect soundscape perception?
This paper thus explores the soundscape types, subjective evaluations, and influencing factors of an open space in a high-density residential area. A typical residential open space, the overseas Chinese town (OCT) ecological square, Shenzhen, China, was selected as the study site to represent a high-density residential area. It was selected because it is often used by inhabitants of the OCT community and is open to the public. In this study, the soundscape descriptors of annoyance and acoustic comfort were applied and evaluated to reflect soundscape quality. These two descriptors were chosen because they are significant indicators that are often used to describe soundscape quality in public open spaces. Furthermore, they are crucial descriptors that predict the value of a soundscape [38,39].
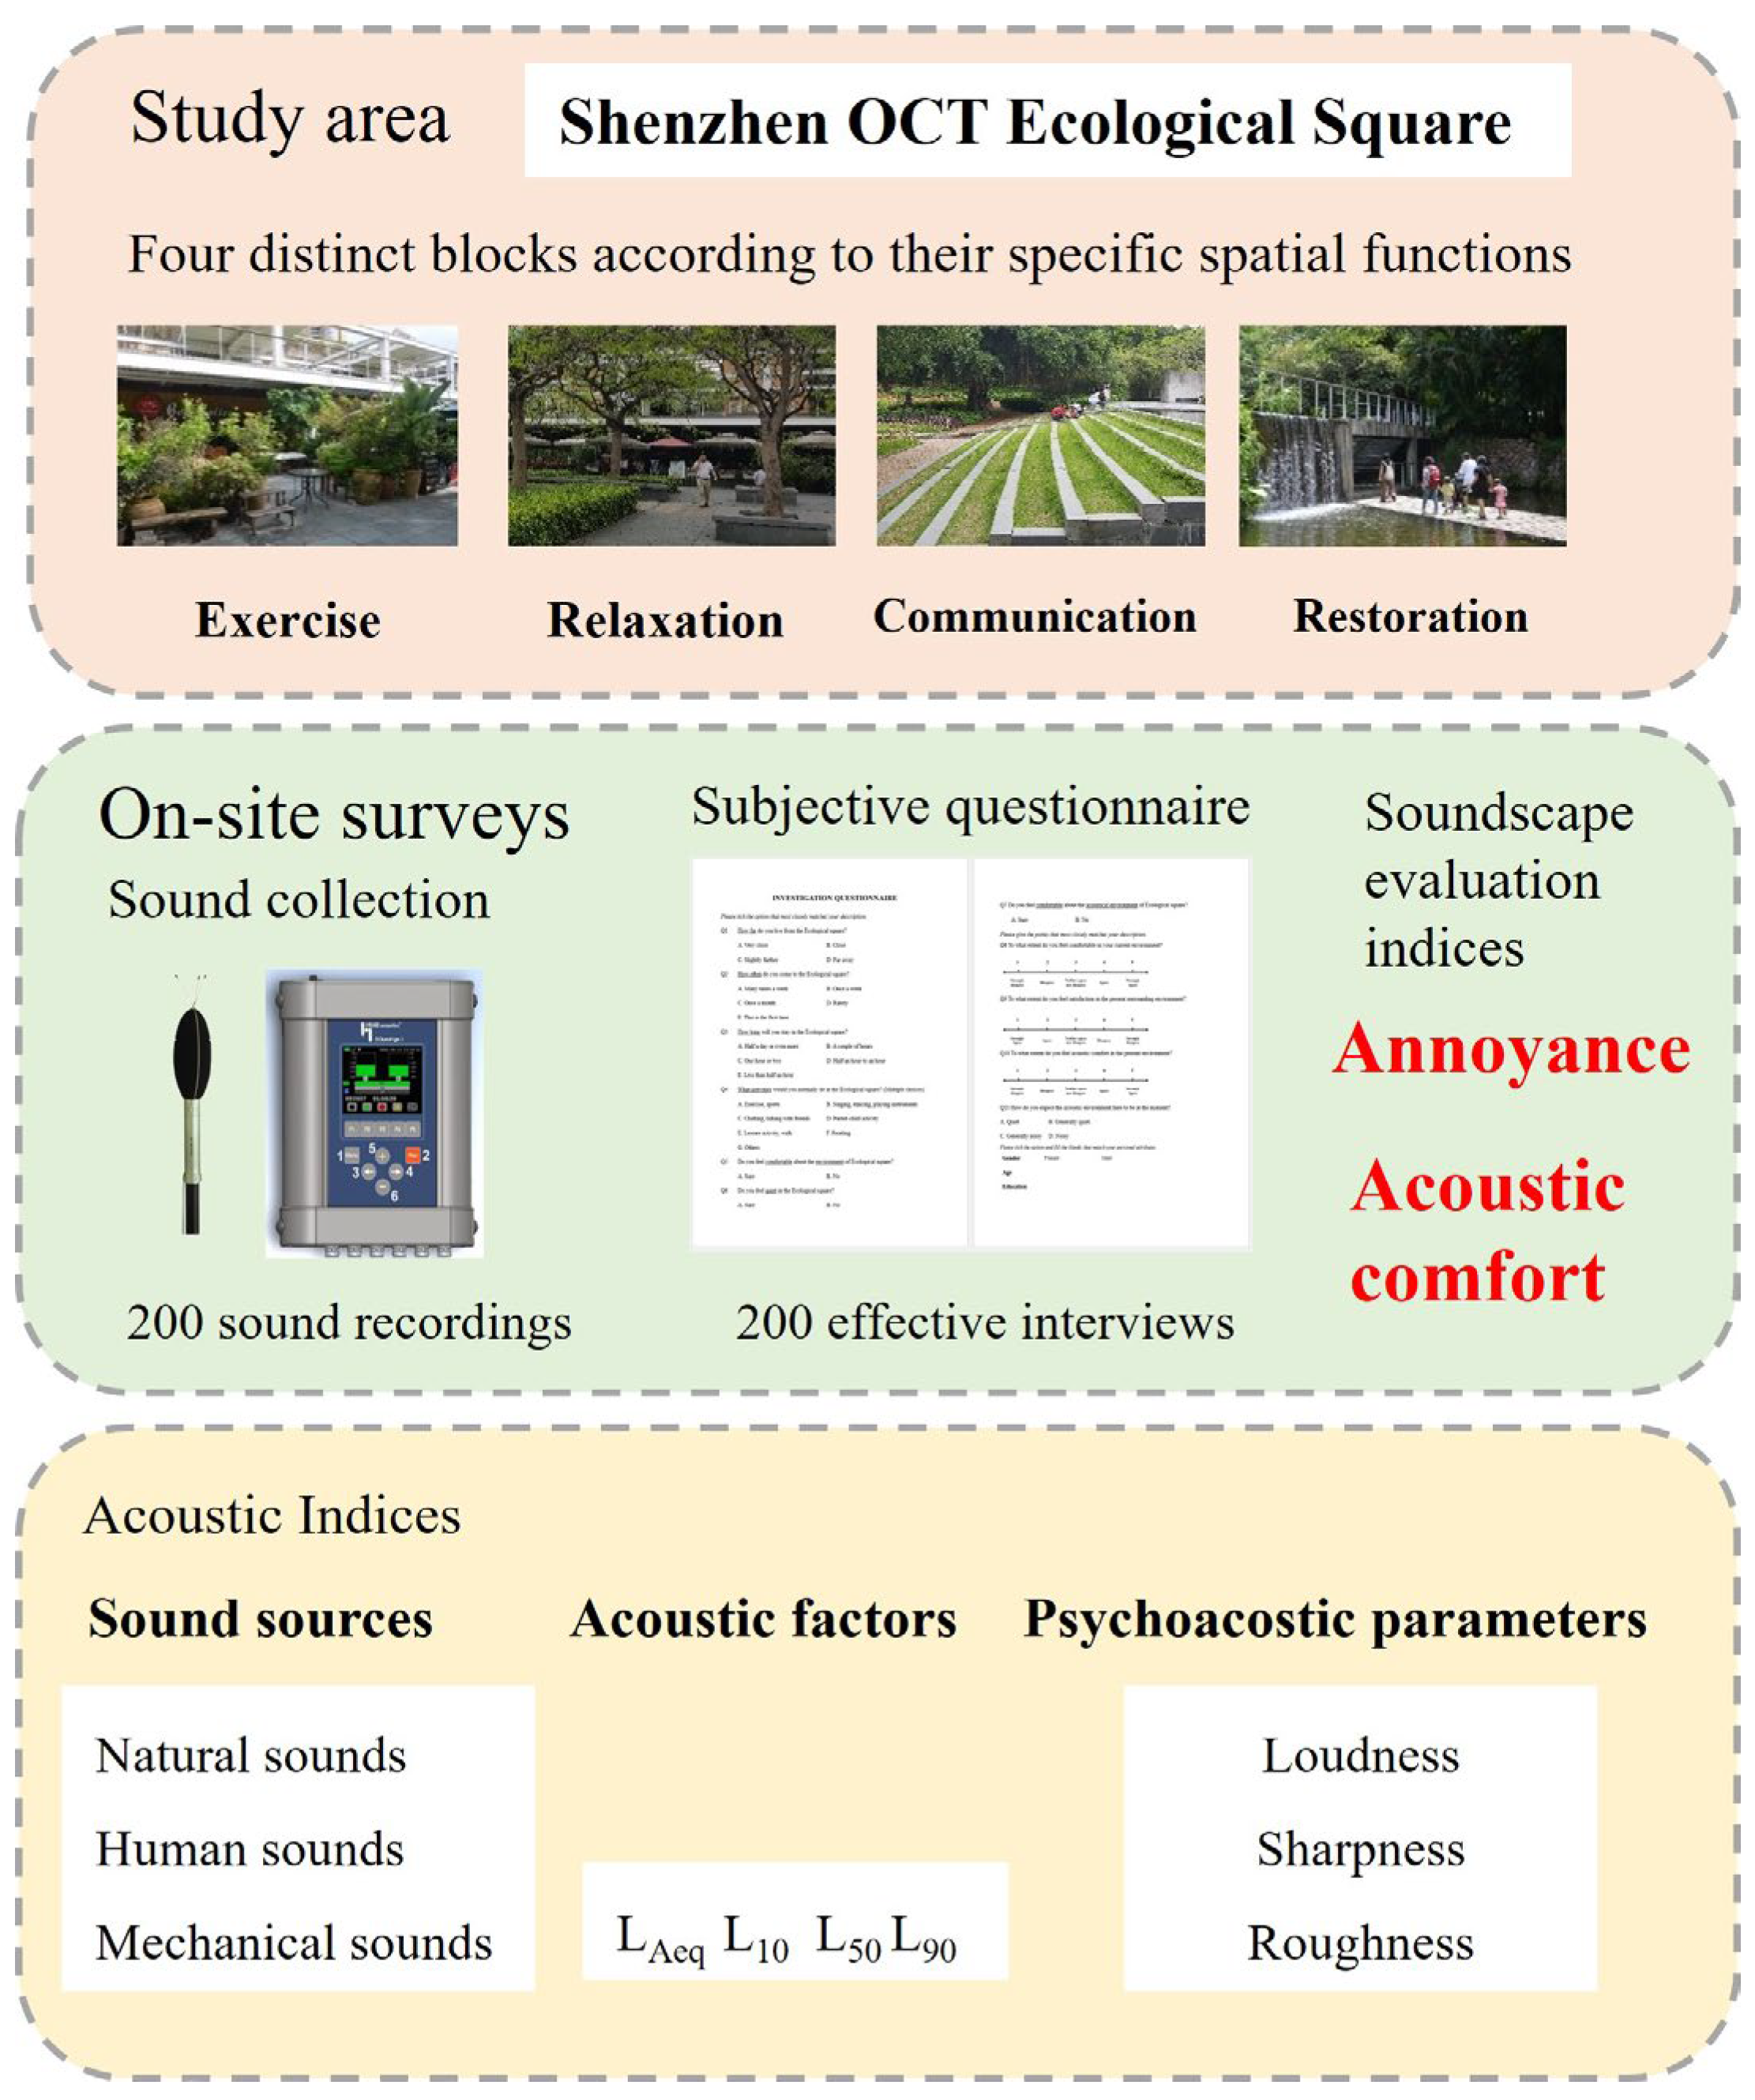
In this study, in situ observation was first conducted to collect site information, followed by in situ surveys and simultaneous sound measurements, as described in Section 2. After obtaining first-hand data, analyses of subjective evaluations of annoyance and acoustic comfort were carried out, as illustrated in Section 3 and Section 4. This study was structured as follows: (1) data collection; (2) analyzing sound level and sound source data; (3) analyzing soundscape evaluations; and (4) revealing important factors affecting the soundscape evaluations to provide design guidelines for reaching the goal of sustainable development. The framework of this study is shown in Figure 1.
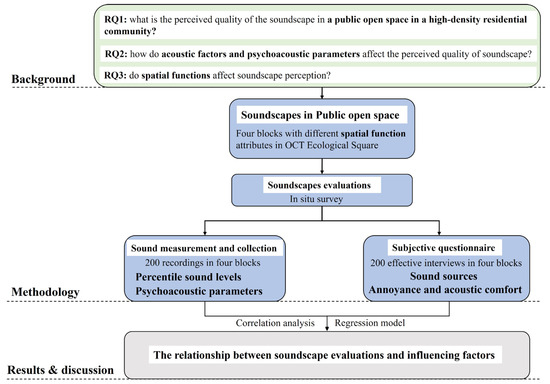
Figure 1.
The research framework of the present study.
After this step-by-step research, key factors influencing the soundscape of a high-density residential open space were determined. These factors were emphasized when designing the requirements for sustainable development.
2. Materials and Methods
2.1. Location, Views, and Activities of the Study Site
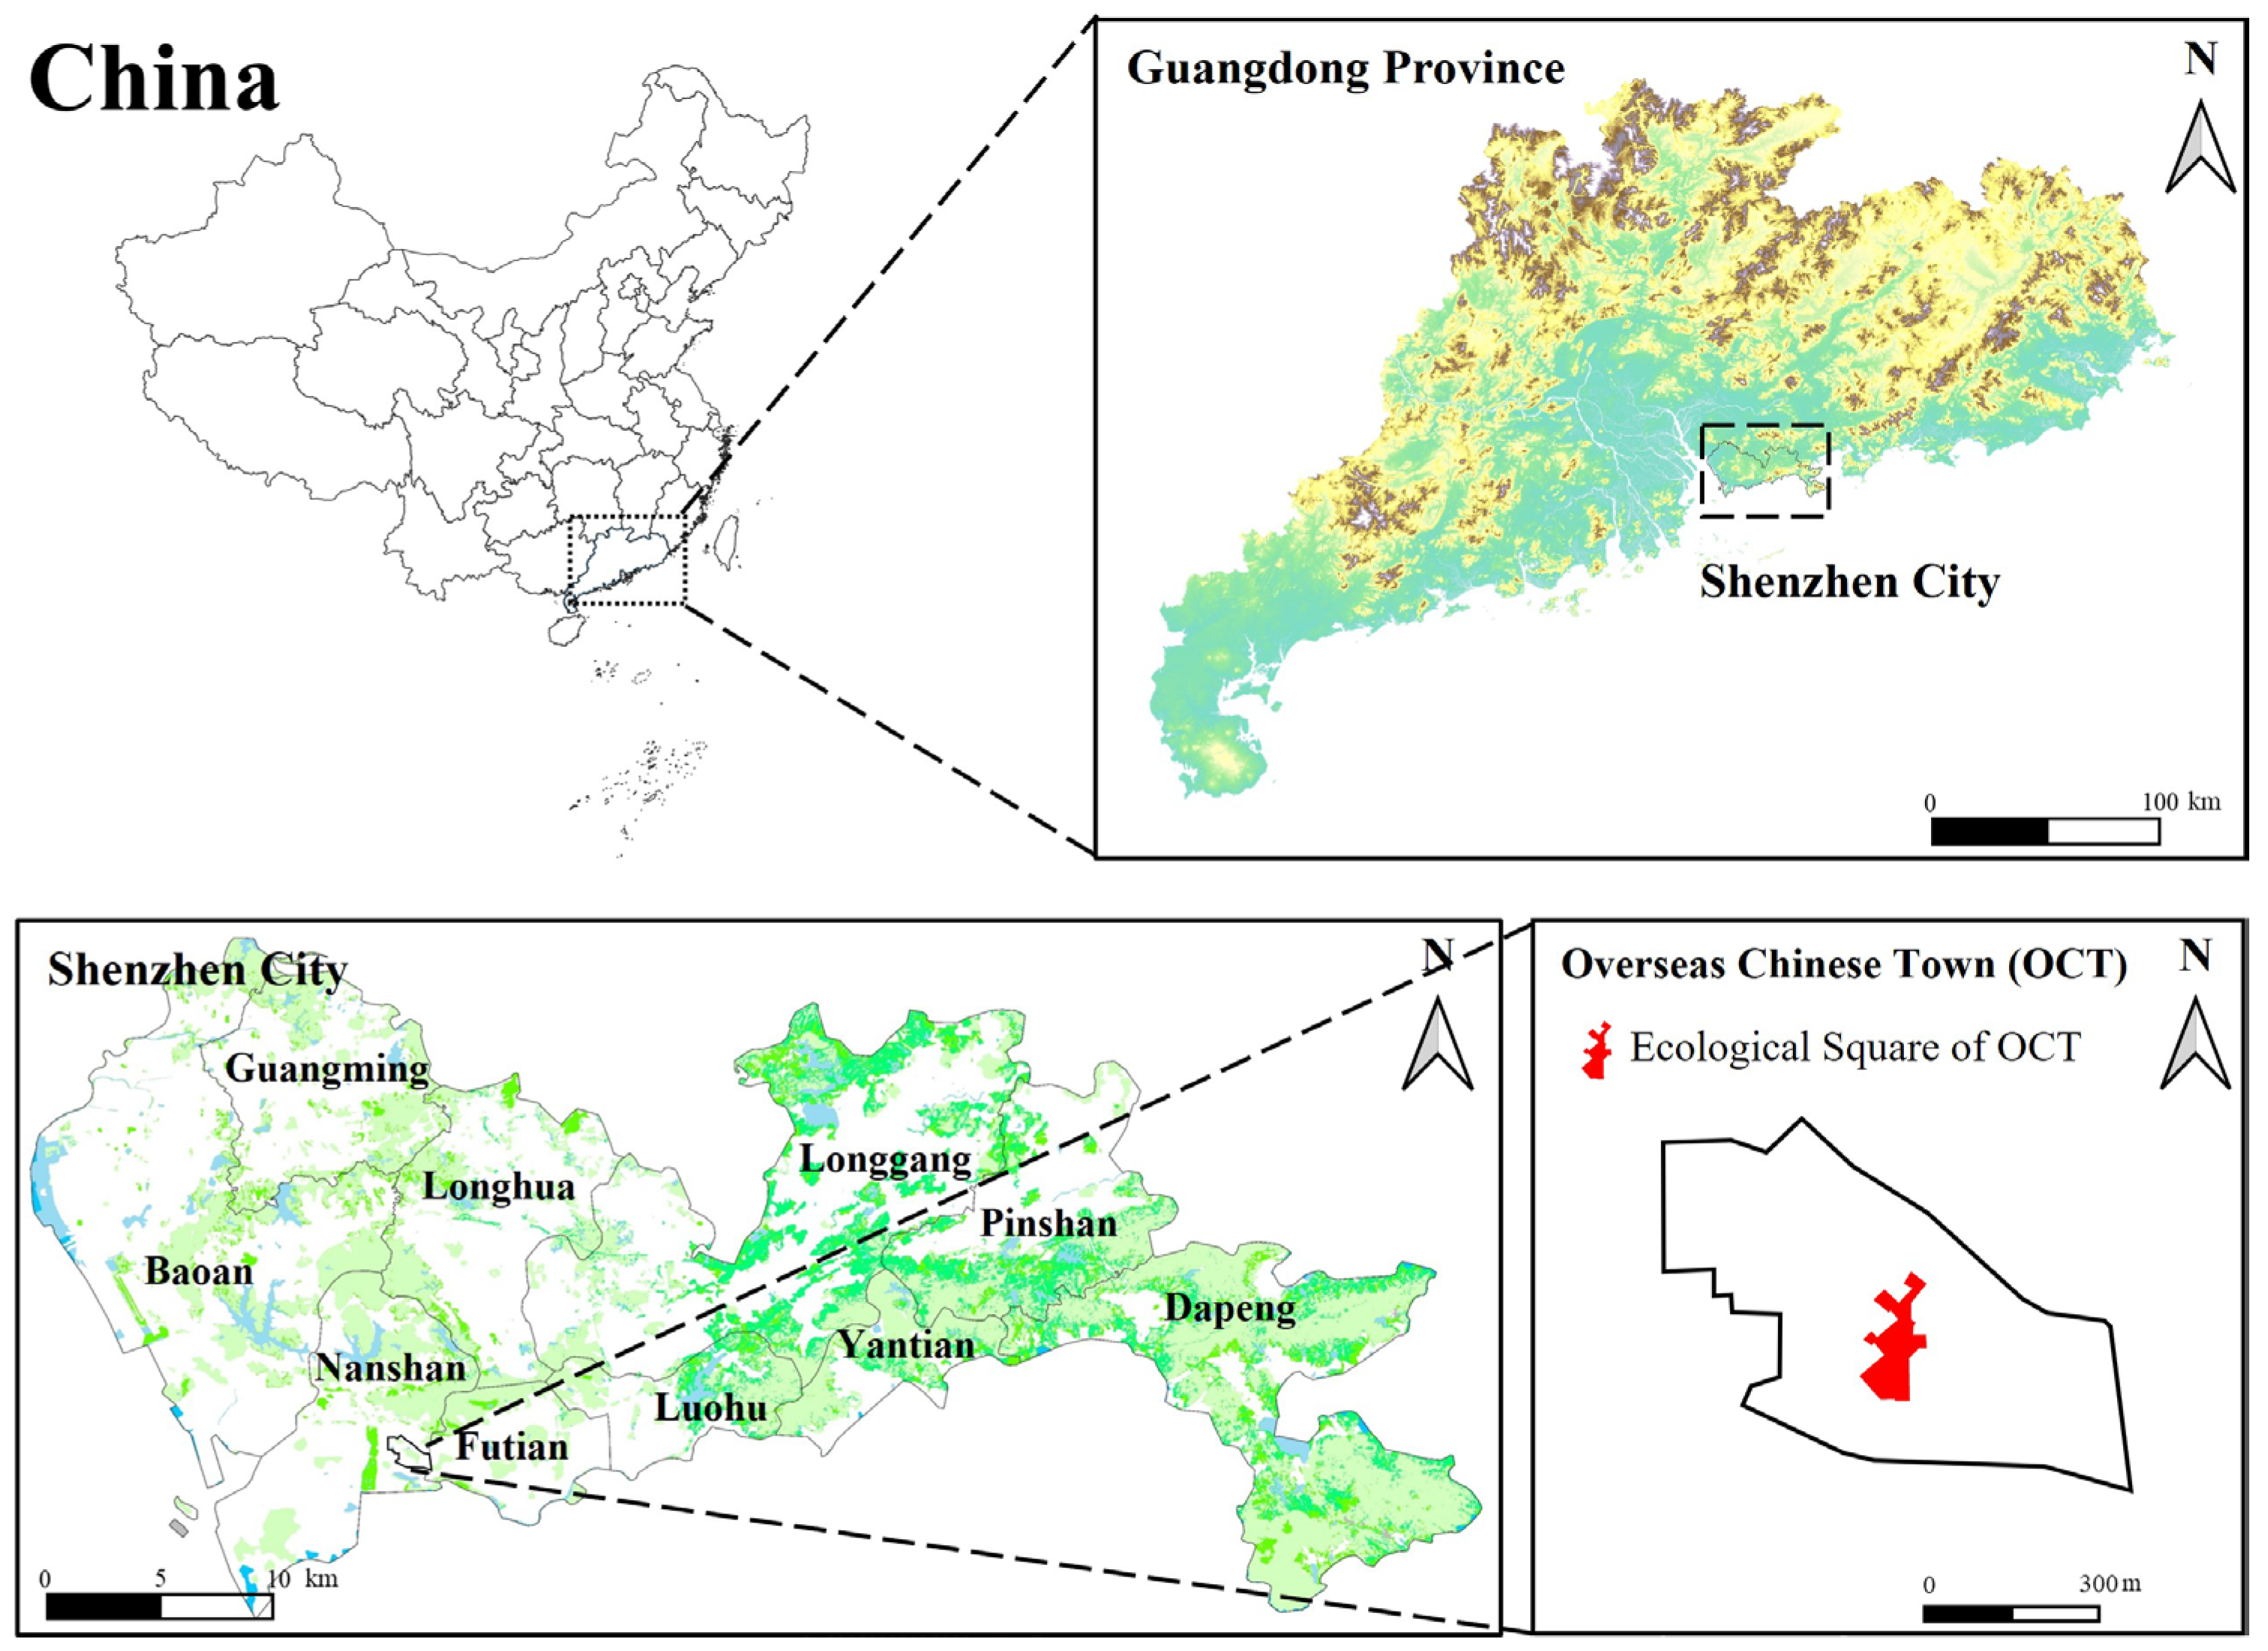
Given the importance of open space to a residential area, as shown in Figure 2, the Shenzhen OCT ecological square was selected as the study site for this research due to its representation of life in a Chinese metropolis. Shenzhen is a typical Chinese metropolis with nearly 18 million people. However, it was once a sparsely populated territory occupied by several scattered villages. The city has been steadily developing since it was designated as one of the first Chinese special economic zones and as the window of the National Economic Reform that started in 1979. Since the 1980s, the city has experienced a tremendous transformation from a fishing village to a bustling metropolis in just over 30 years. In this urbanization process, the population has grown from thousands to nearly twenty million [40].
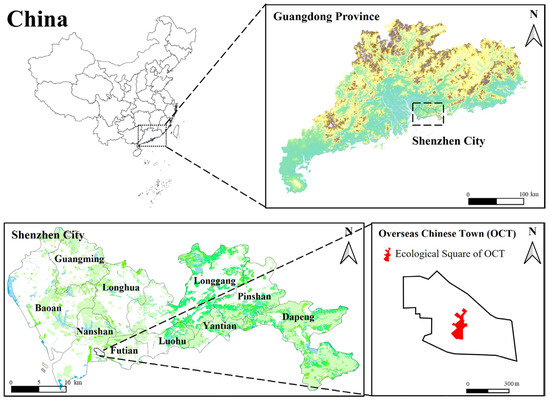
Figure 2.
Location of the Shenzhen OCT ecological square.
Amidst rapid urbanization, hundreds of residential areas have been developed in Shenzhen, one of which is the Shenzhen OCT. After nearly 40 years of development, the OCT has been forged as a high-density residential area comprising several communities with approximately 80,000 inhabitants and an area of 0.57 km2. The OCT ecological square is the main public open space in the residential area. It is open not only to the OCT inhabitants but also to the public outside the residential area. The square provides a wide range of functions to support holding various activities and events for the inhabitants. The OCT spans an area of 4.6 hectares [41]. The age range of the residential buildings in this area spans from the 1980s to the 2020s. Currently, the inhabitants of the OCT cover a broad social group, including estate property owners and tenants with a variety of social/demographic backgrounds.
As a representative of China’s fast-paced urbanization, studying the soundscape of the OCT ecological square can provide valuable insights and useful guidelines for the sustainable development of urban residential areas in the design stage. The location of the study site, the Shenzhen OCT ecological square, is illustrated in Figure 2, which was mapped with ArcGIS (Ver. 10.2, ESRI, Redlands, CA, USA). In Figure 2, some territorial features and the locations of Shenzhen and the study site can be seen. It also shows that Shenzhen is a coastal city in Southern China near the South China Sea.
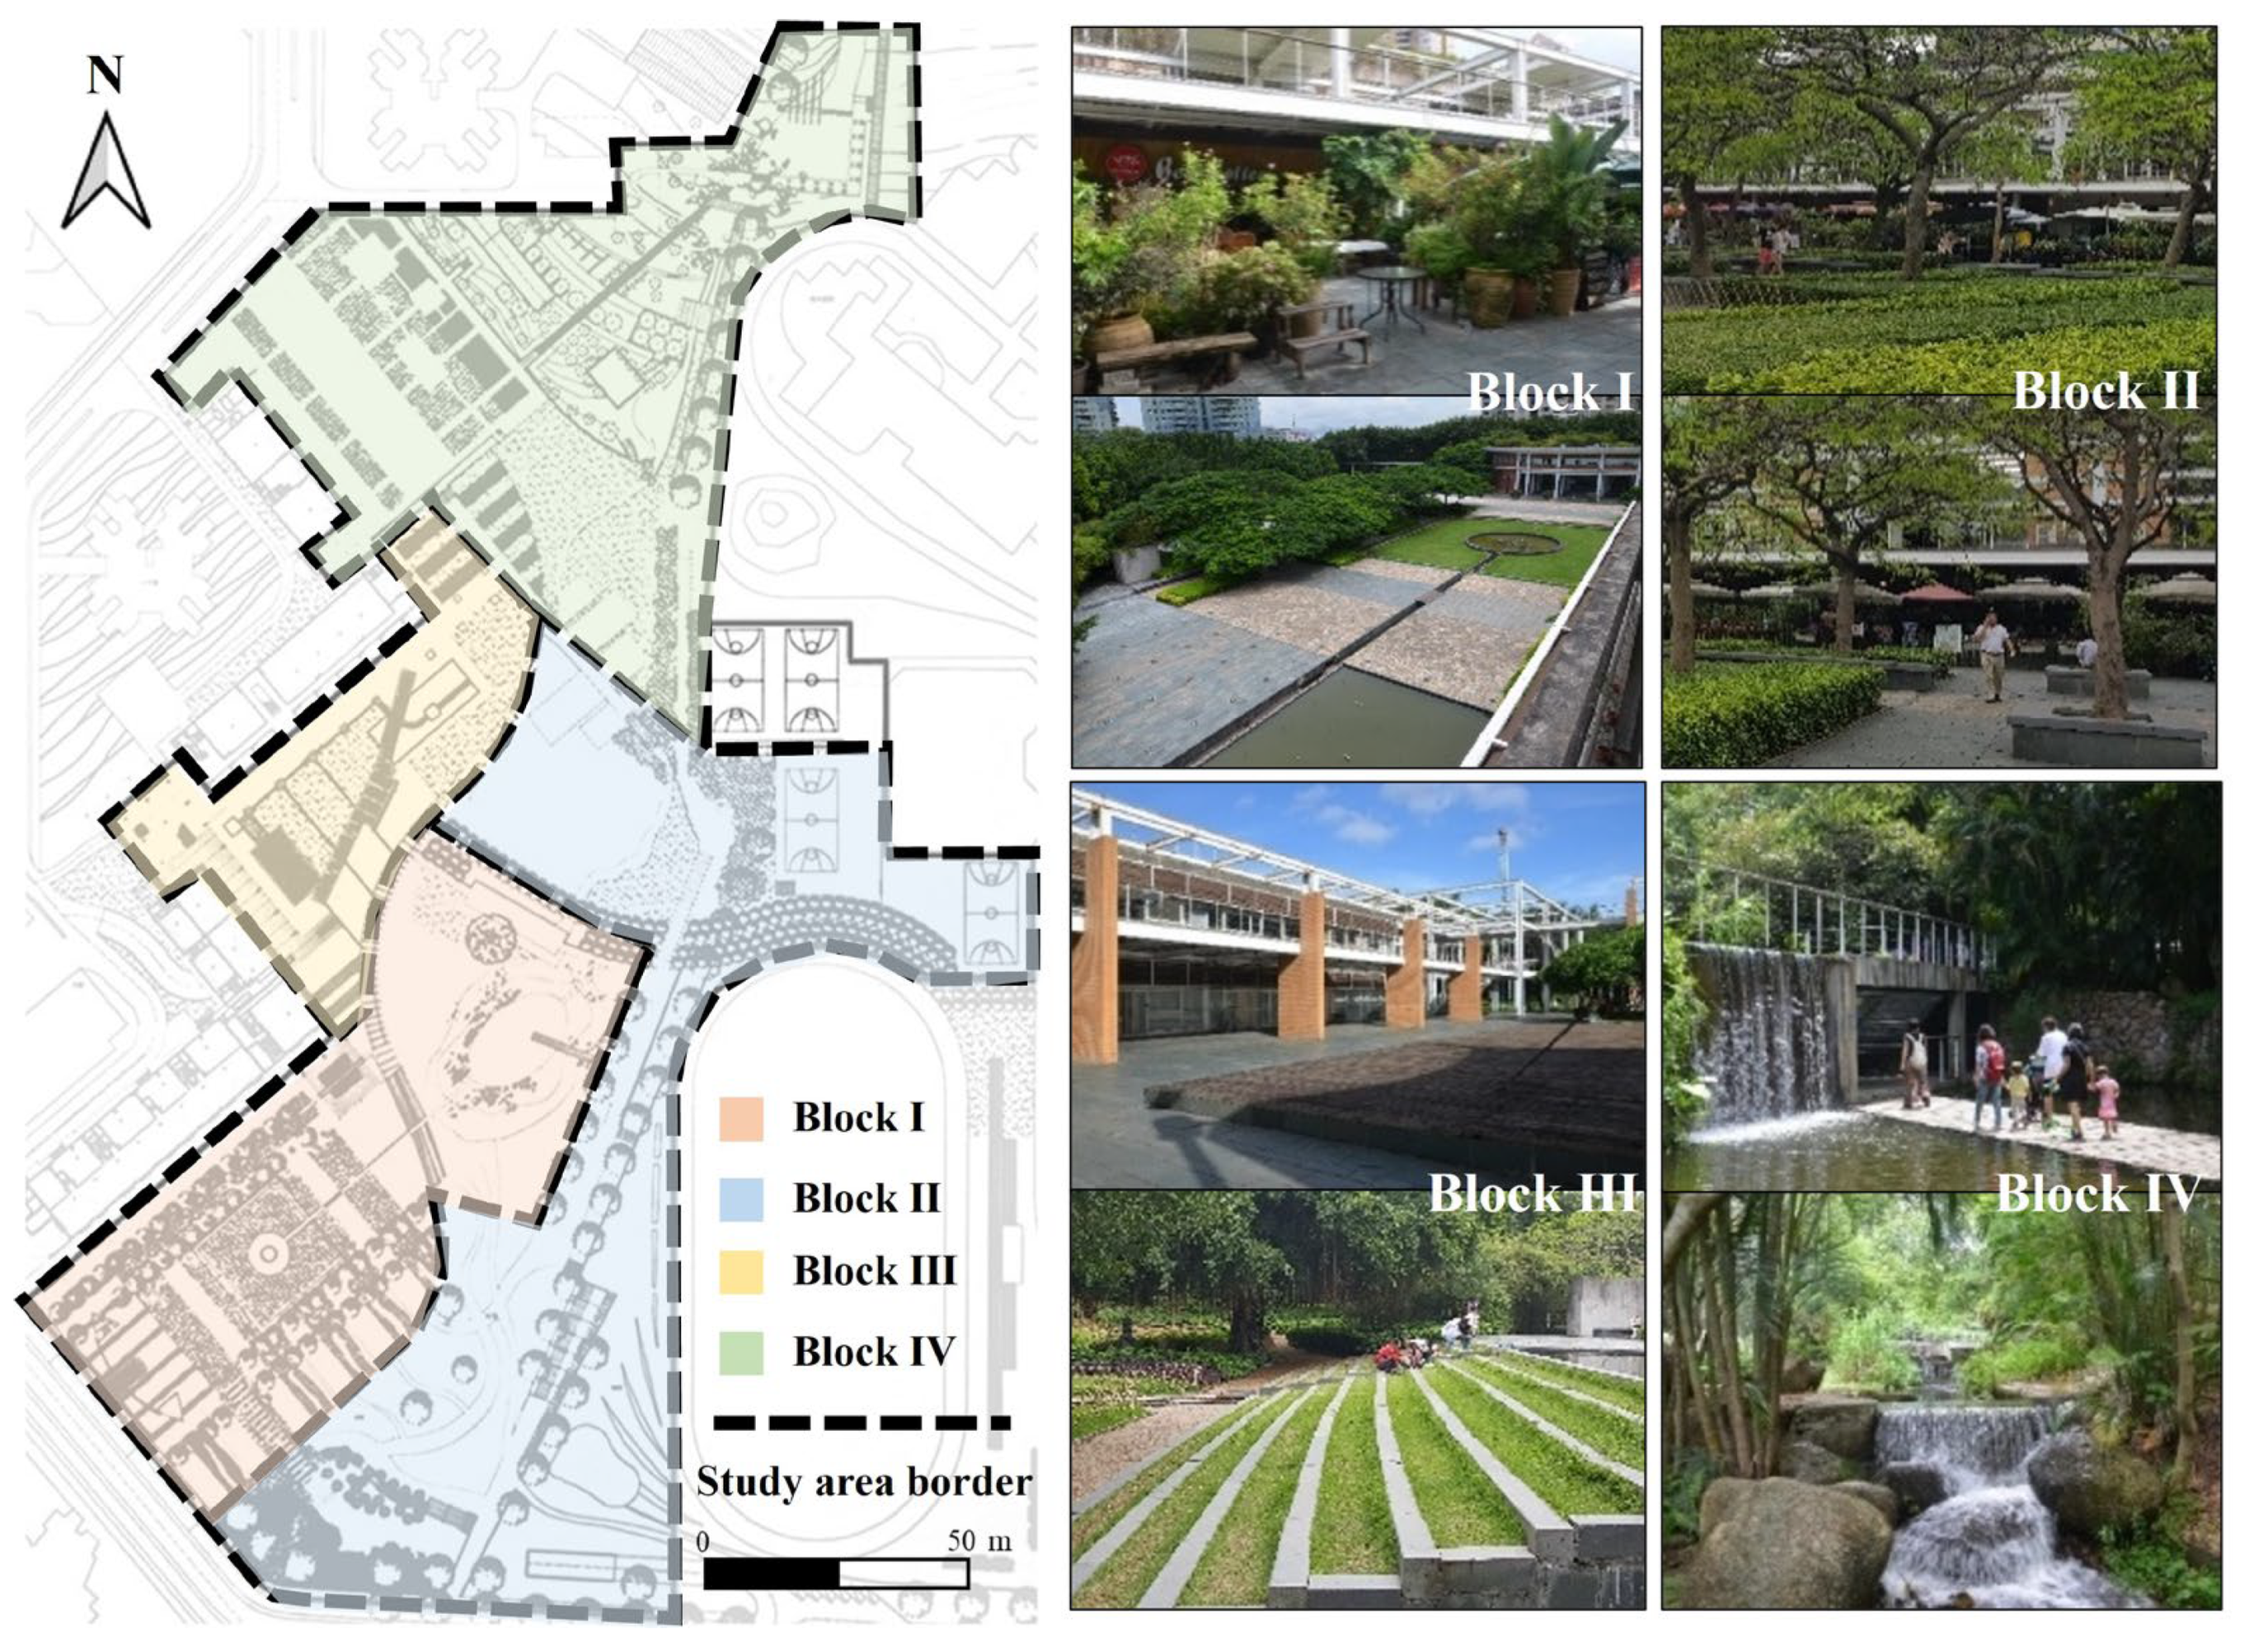
Figure 3 shows the divisions of the square with images. As sounds, landscape features, and related perceptual factors are important in the definition of a soundscape [42], the study site was specifically visited and observed in terms of sound sources, landscape elements, and the behaviors of the users. It was found that the square contained four different blocks due to their various sounds, landscapes, and spatial functions. According to in situ observations, the site could be roughly divided into four blocks, namely BLK-I, BLK-II, BLK-III, and BLK-IV, as shown in Figure 3.

Figure 3.
The four blocks of the Shenzhen OCT ecological square.
The distance from a block to the square’s entry and neighborhood attributes are shown in Table S1. Based on the distance from a block to the square’s entry, the blocks were consequently named Block I (BLK-I, with the spatial function of exercise), Block II (BLK-II, with the spatial function of relaxation), Block III (BLK-III, with the spatial function of communication), and Block IV (BLK-IV, with the spatial function of restoration), where BLK-I was nearest to the entry while BLK-IV was furthest.
2.2. Sound Collection
Following the initial in situ observation, on-site surveys and sound recordings were simultaneously conducted across the four blocks. People using the square were randomly selected for interviews after obtaining their oral consent. During each interview, the operator recorded sound using an SQuadriga II manufactured by HEAD acoustics GmbH, Herzogenrath, Germany [43]. A structural framework map is shown in Figure 4.

Figure 4.
A structural framework map of sound collection and surveys.
Based on 200 sound recordings collected during the on-site interviews, the equivalent continuous A-weighted sound pressure level (LAeq) and the statistical sound levels L10, L50, and L90 of each block were calculated via the level vs. time method using ArtemiS software Ver. 12.05 (HEAD acoustics GmbH, Herzogenrath, Germany) [44]. Before the analysis, each recording segment was edited to remove the initial and final seconds of the interviewer talking with the interviewee.
Sound collection was conducted during weekdays and weekends and was evenly distributed in each block. For the recordings, we utilized an outdoor microphone kit (UA-1404, B&K, Virum, Denmark) with a sample rate of 44.1 kHz and a bit rate of 24 bits. The microphone was mounted on a tripod positioned at least 1.5 m away from the ground and walls to minimize reflections. The recording sessions were scheduled on nonrainy days. During sound recording, the operator’s head orientation was fixed, facing the same direction as the interviewee. Each interview generally lasted 3 to 5 min and sound was simultaneously recorded. Each block had more than 50 participants, resulting in a total of 200 sound samples and 200 effective interviews.
2.3. Survey Instrument
Researchers have established various soundscape indicators as assessment standards. A large proportion of soundscape assessment research is primarily based on semantic, sociological, and psychological methods [45,46]. In the ISO standards of collection methods, questionnaire-based soundscape assessment (ISO 12913-2, Method A) is currently the recommended tool. Different descriptors have been widely considered and employed in soundscape evaluations [35,38].
The soundscape evaluation method used in this work was inspired by the ISO protocol. The questionnaire was designed according to pioneer studies of soundscape evaluations in public open spaces and ISO 12913-2 [15,33,45]. It covered the interviewee’s social/demographic background, noticed sounds, and evaluations of annoyance and acoustic comfort. The questions about the interviewee’s social/demographic background included age, gender, education, occupation, residency status (whether a resident of the OCT), and visit frequency. The noticed sounds were selected from a list of various sound sources by answering the question “which sounds have you noticed here?”. The list of sound sources, created by the researchers through in situ observation, included natural sounds (wind, water, rain, insects, frogs, and birds), human sounds (talking, peddling, children playing, singing, walking, stepping, running, music, and dancing), and mechanical sounds (road traffic, air conditioners, construction, radio broadcasts, loud-speakers, and helicopters). Subjective evaluations of annoyance and acoustic comfort used a 5-point ordinal category scale that agreed with ISO 12913-2: 2018. The response alternatives for annoyance and acoustic comfort were “strongly agree” (1), “agree” (2), “neither agree nor disagree” (3), “disagree” (4), and “strongly disagree” (5).
2.4. Indicator Processing Procedure
Through field study, acoustic and non-acoustic data were collected. For acoustic data, on-site sound sources, sound levels, the acoustic characteristic of frequency, and psychoacoustic parameters were collected. For non-acoustic data, the occurrence of sounds related to landscape features, the spatial functions of activities and sound incidents, and subjects’ social/demographic backgrounds were collected. According to the soundscape identification, the subjective evaluations of annoyance and acoustic comfort were analyzed and the influence of soundscape identification and relevant factors on soundscape evaluations were intensively explored.
2.4.1. Sound Levels and Psychoacoustic Parameters
Depicted by physical acoustic and psychoacoustic parameters, an acoustic environment is predominantly determined by the compositional relationships and characteristics of sound sources [17,47]. The A-weighted equivalent sound pressure level (LAeq) and percentile sound pressure levels, including L10, L50, and L90, were calculated to describe sound strength and employed as acoustic factors in this work. The LAeq is the A-weighted equivalent noise level but it obscures extreme values. L10 is the level that exceeded 10% of the time. This higher sound pressure level is probably due to sporadic or intermittent events. L50 is the level exceeded 50% of the time, representing the median of the fluctuating noise levels. L90 is the level exceeded 90% of the time [48]. It is generally considered to represent the background or ambient level.
Three commonly used psychoacoustic parameters, loudness, sharpness, and roughness, were employed in this study. Loudness quantifies the perceived intensity of a sound and is measured in sone. Sharpness quantifies the timbre of a sound and especially focuses on high-frequency components. The unit of sharpness is acum. Roughness quantifies the perceived amplitude modulation of a sound for high modulation frequencies and is measured in asper. Acoustic analyses of LAeq, L10, L50, L90, and psychoacoustic parameters were conducted in ArtemiS SUITE Basic Analyses Ver. 12.05. Calculations were performed using ArtemiS SUITE software via the “level vs. time” method and were statistically generated using Microsoft Excel 2019 (Microsoft Inc., Redmond, Washington, DC, USA) [44]. Each parameter was based on the arithmetic mean of the two channels according to the soundscape standard ISO/TS 12913-3 [49].
2.4.2. Statistical Approach
The evaluation data were standardized with z-scores in SPSS (Ver. 25.0, IBM Inc., Armonk, NY, USA). Before starting the correlation analyses, the normality of the distribution of the collected data was checked using the D’Agostino and Pearson test. The results showed that the majority of the variables passed the test with p-values of more than 0.05. Hence, the Pearson method was applied when analyzing the correlations between soundscape evaluations and influencing factors. After the correlation analysis, a regression model was developed using influencing factors and evaluations to investigate their quantitative relations.
ANOVA (analysis of variance) is a collection of statistical models and their associated estimation procedures are used to analyze the differences among means. This method provides a statistical test for determining whether two or more indices’ means are equal. To investigate the soundscape evaluations among the four blocks, ANOVA was applied to characterize the variance in the soundscape evaluations. The null hypothesis of this study was that the means of the variables in the four groups were equal.
Before the statistical analysis, the data from the acoustic comfort and annoyance evaluations passed the Kolmogorov–Smirnov test and obeyed a normal distribution. In this study, statistical analyses were carried out with SPSS (Ver. 25.0, IBM Inc., Chicago, IL, USA) and Microsoft Excel 2019 (Microsoft Inc., Washington, DC, USA).
2.5. Soundscape Identification
BLK-I was at the entrance of the square. The low-rise buildings on the upper northern side of this block offered catering services. This area was frequently used for physical exercise and its main spatial function was centered on exercise. As shown in Figure 3, BLK-I featured potted trees, restaurants, and artificial hard grounds. Based on observation, the noticeable sounds in this area included traffic noise, dining, ground dancing, and occasional pet dog barking. BLK-II was situated adjacent to BLK-I and BLK-III and this area provided a space for leisurely strolling and sitting and was primarily used for relaxation. Compared to BLK-I, BLK-II had more natural landscape components and its noticeable sounds included activities, people walking, and birds twittering. BLK-III included commercial buildings such as piano shops, bookstores, and a dental clinic and was decorated with physical features for social interactions. It was an area where people could engage in walking and talking and its core spatial function was communication. BLK-III had natural landscape components in a well-designed form. Its noticeable sounds included birds twittering as well as people walking and talking. BLK-IV, situated slightly farther from the entrance, offered a serene setting that allowed for resting and closeness to nature. This area was popular among nearby office staff and served as a sanctuary for mind emptying, with its main function being restoration. BLK-VI had a water landscape bordered by a row of office buildings on one side. Its noticeable sounds included children playing, people talking, and birds twittering.
According to previous studies [50], identifying a soundscape based on sound sources and visual factors is useful for presenting its physical characteristics. For the four blocks of the square, each block was easily identified with a soundscape type according to the observed sound sources and landscapes. The three major soundscape types of the four blocks were identified, which were natural, neutral, and artificial. BLK-I was characterized by artificial sounds and landscape elements and was identified as a place with an artificial soundscape. BLK-IV, on the other hand, was observed to have natural sounds and landscape elements, making it a place with a natural soundscape. BLK-II and BLK-III were observed to have moderate natural sounds (fewer than BLK-IV but more than BLK-I). Mixed natural and artificial landscape elements identified them as places with neutral soundscapes. Based on further comparison of the two blocks, BLK-II was further identified as a place with a neutral-to-natural soundscape, while BLK-III was identified as a place with a neutral-to-artificial soundscape.
3. Results
Based on data obtained from in situ observation and field study, the acoustic characteristics of each block of the square were analyzed. First, soundscape identification was performed based on the observed sound sources and landscape features. Second, the noise percentile levels were analyzed, followed by spectrum and psychoacoustic parameter analyses. The acoustic and psychoacoustic factors of the square’s four blocks were thoroughly analyzed, which provided data for analyzing the factors influencing the soundscape evaluations.
3.1. Interviewees
The interviewees’ social/demographic backgrounds were statistically analyzed, as shown in Table 1.

Table 1.
Features of the interviewees’ social and demographic backgrounds.
According to the summary of the interviewees in Table 1, the major users of the square had a high education level, were mostly residents of the OCT, were white-collar working professionals, and frequently visited the square. This indicates that the square was mainly used by the neighbors inside the OCT, although it was open to others outside the residential area. According to studies of community parks, such squares are important for promoting neighborhood attachment and healthy communities [51,52]. Therefore, understanding the influencing factors of the square’s soundscape would facilitate the proposal of vital guidelines for improving the square’s environmental quality with respect to aural feelings, which would lead to more satisfaction in the community.
3.2. Sound Sources
The sound sources present in each block were analyzed based on the participants’ answers to the question regarding noticed sounds and are shown in Table 2. The majority of the sounds noticed in BLK-I were human or mechanical. The sounds in BLK-II were primarily natural or human. Compared to BLK-II, BLK-III featured more mechanical sounds, and, notably, BLK-IV contained a significantly higher proportion of natural sounds than the other blocks. That is, BLK-I, BLK-II, and BLK-III had the most human sounds, whereas BLK-IV had the most natural sounds. By comparing the differences in the sound types noticed in each block, it was found that BLK-II and BLK-III had similar percentages of natural and human sounds, with differences of only 3% or 5%. The sound source results were found to be consistent with the soundscape identification in Section 2.5.
Table 2.
Frequencies of the types of sounds noticed in the four blocks.
Moreover, as shown in Section 3.3 and Section 3.4, further exploration of the sound spectrum and psychoacoustic parameters using the on-site sound recordings verified the accuracy of the initial soundscape identification.
3.3. Sound Levels
The acoustic environment of each block is shown in Table 3 in terms of the LAeq, L50, and L90 values. BLK-I had the highest LAeq, while the other blocks had similar values around 64 dBA. The same result was obtained for L50 and L90. Regarding L50, BLK-I had the highest value, while the others had similar values around 58 dBA. Regarding L90, BLK-I also had the highest value, while the others had similar values around 53 dBA. Regarding L10, there were slightly greater differences among BLK-II, BLK-III, and BLK-IV, although BLK-I still had the highest value. It is interesting to note that outside the place with an artificial soundscape (BLK-I), the soundscapes of the other places (BLK-II, BLK-III, and BLK-IV) did not vary much with regard to the sound level index. Based on ANOVA analyses of the four blocks, there was a significant difference (p < 0.05, two-tailed), which may have been due to BLK-I. To confirm this, further t-test analyses were conducted between BLK-I and the other blocks. The results showed significant differences (p < 0.05, two-tailed) between BLK-I and the other blocks, except with regard to sharpness. No significant difference (p = 0.35, two-tailed) was found between BLK-I and BLK-II for sharpness. This was also proven via further ANOVA analyses involving only BLK-II, BLK-III, and BLK-IV. The results showed that there were no significant differences in the sound level indices among these three blocks (p > 0.05, two-tailed).
Table 3.
Acoustic environments of the four blocks.
3.4. Spectrum
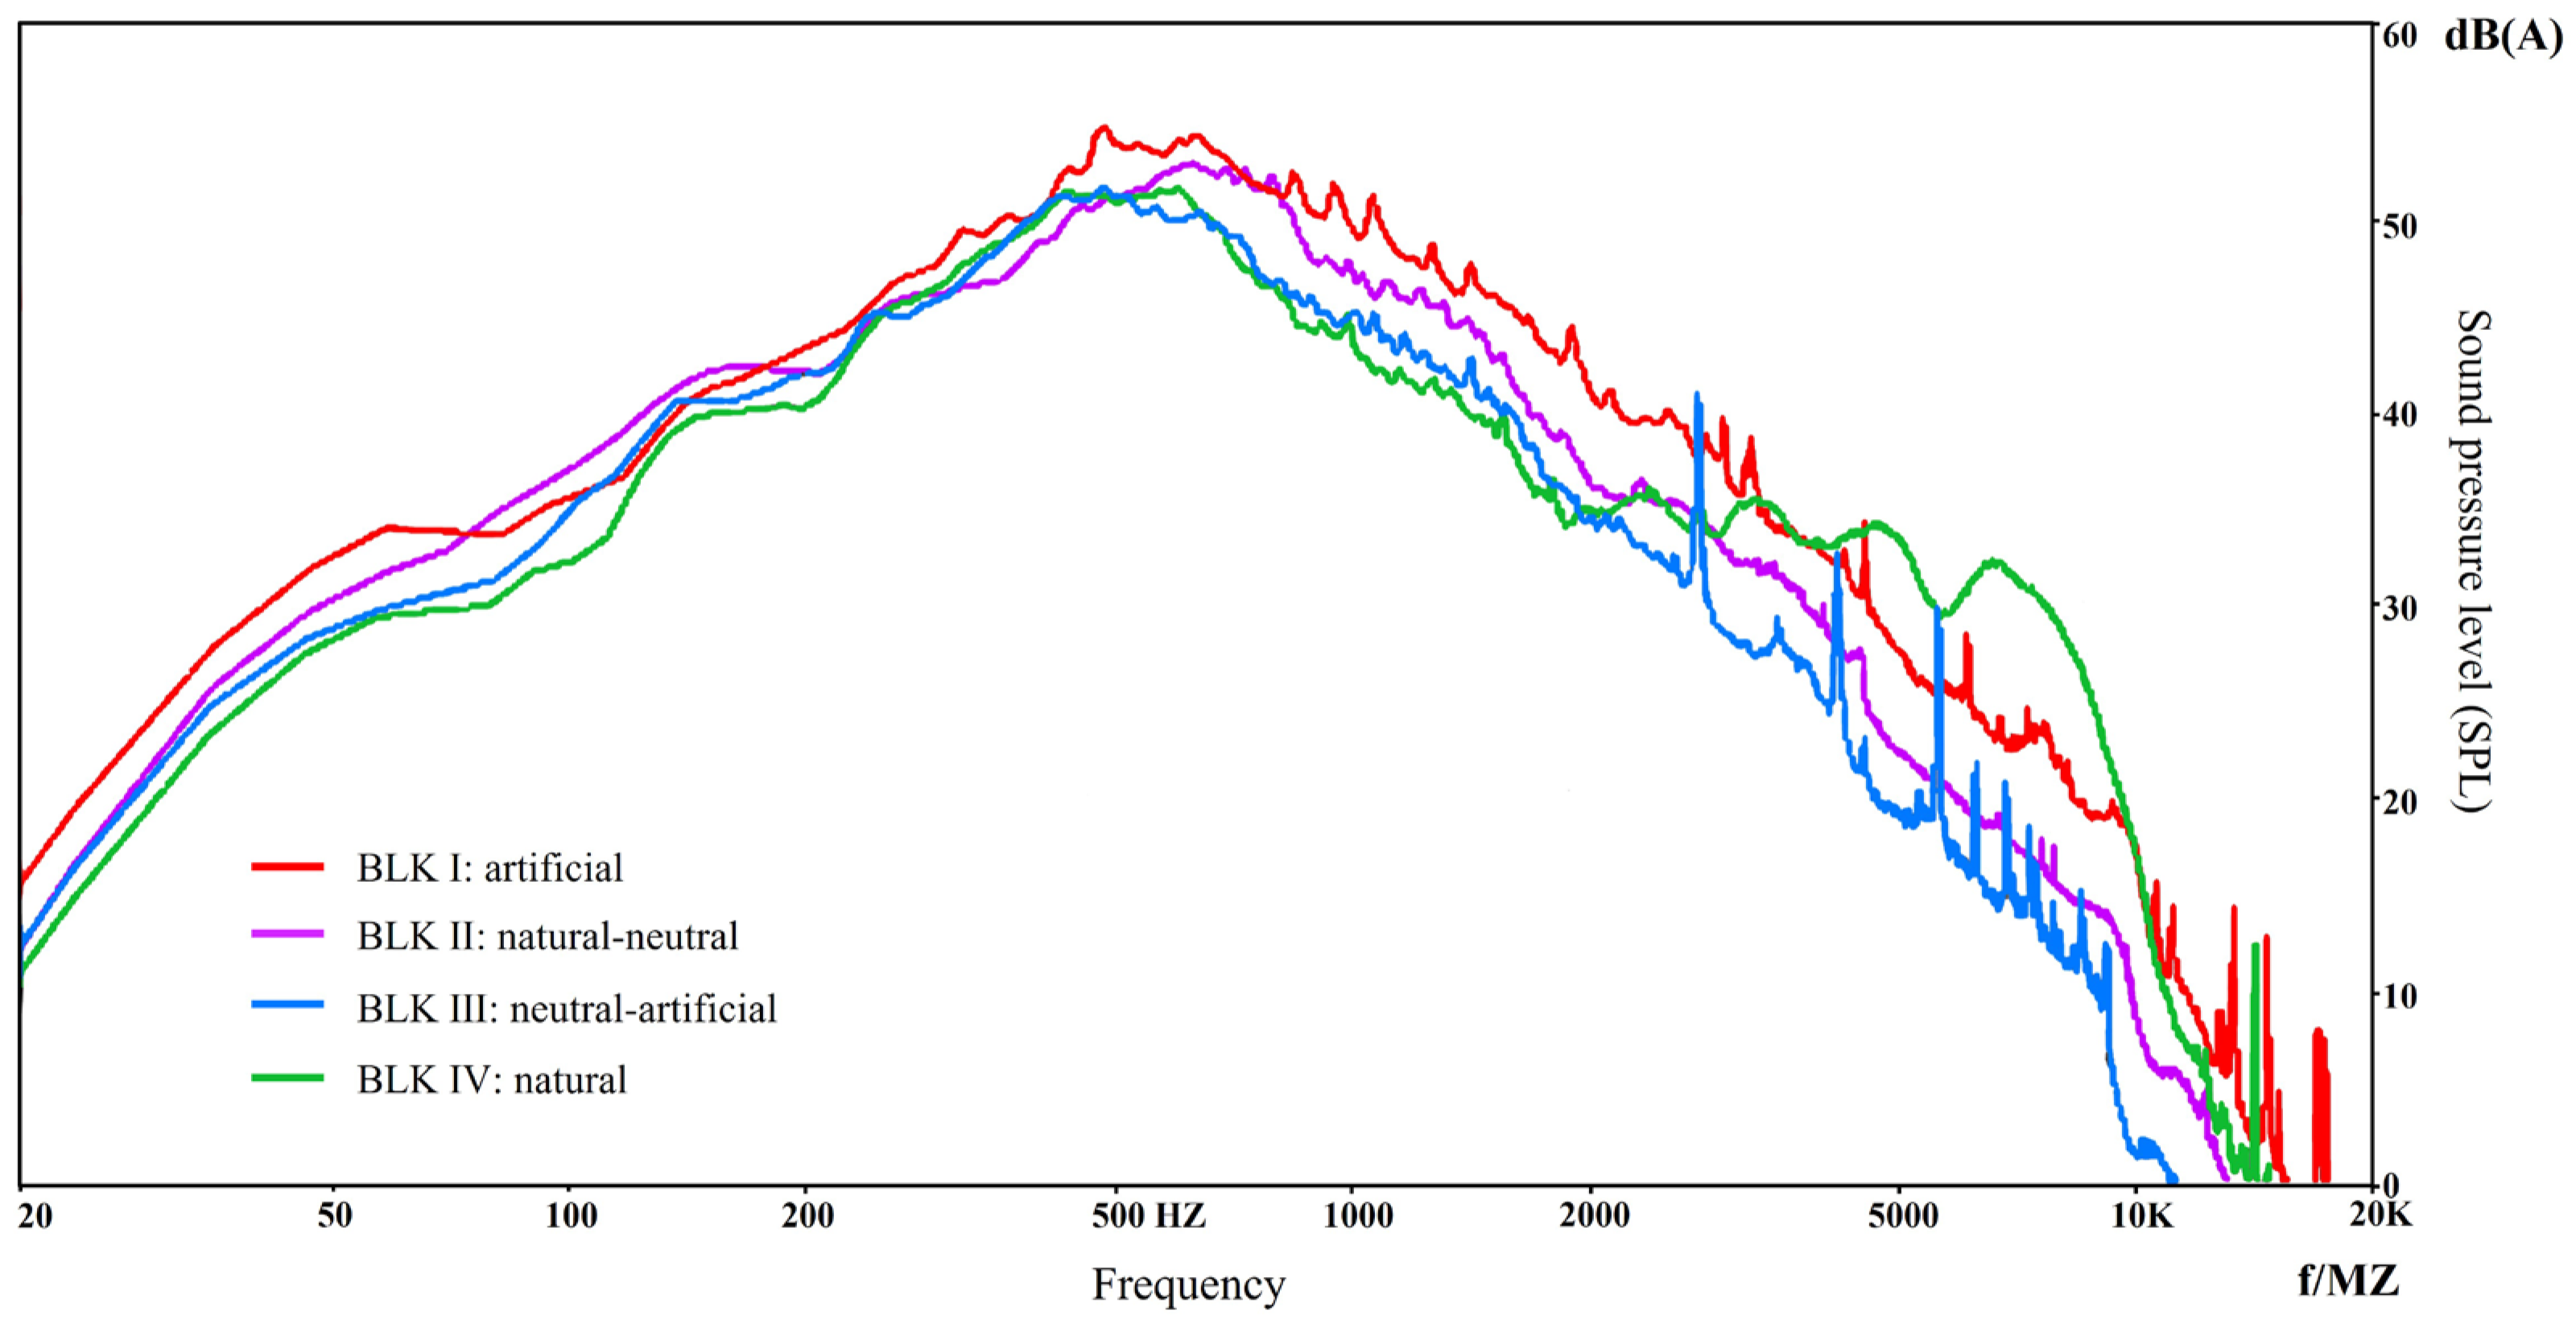
Furthermore, sound frequency characteristics were analyzed for each block based on typical recordings, as shown in Figure 5. The sound of each block had a distinct characteristic in the middle-to-high frequency range (>500 Hz). The sound of BLK-I dropped to 0 dB at the frequency of 20 kHz, while that of BLK-III dropped to 0 dB at 10 kHz. In the other two blocks, the sound dropped to 0 dB at 15 kHz. Unlike the other blocks, BLK-IV contained dominant sounds between 2 kHz and 5 kHz, which are typically bird sounds [53,54], consistent with the in situ observations. In terms of soundscape identification, the place with a natural soundscape, BLK-IV, contained some high-frequency sounds; the place with an artificial soundscape, BLK-I, contained sounds with a broad frequency range; and the place with a neutral-to-natural soundscape, BLK-II, had sounds in a wider frequency range than the place with a neutral-to-artificial soundscape, BLK-III.

Figure 5.
Typical sound spectra in the four blocks.
The above results showed the consistency of the sound spectrum and in situ sound observations. They also verified the accuracy of soundscape identification, which is based on the sound source and its bonding landscape observations.
3.5. Psychoacoustic Parameters
As psychoacoustic parameters are important facets that describe soundscapes, the psychoacoustic parameters of the sounds in the four blocks were also explored. They were calculated for the 200 recordings using ArtemiS software [44], which was applied in relevant studies on these parameters [55,56,57]. The results are also presented in Table 3. BLK-I had the highest loudness, whereas BLK-III had the lowest, although the latter was only 0.5 sone lower than the former. BLK-IV had a loudness of 11.6 sone, which was slightly higher than those of BLK-II and BLK-III but lower than that of BLK-I.
In terms of sharpness, BLK-IV had the highest value of 2.6 acum, while BLK-III had the lowest value of 2.1 acum. The sharpness values of the four blocks were quite similar. In terms of roughness, BLK-I had the highest roughness at 1.9 asper, and BLK-IV had the lowest at 1.6 asper. BLK-II and BLK-III both had roughness values of 1.7 asper, which were only 0.1 asper higher than that of BLK-IV. The roughness values of the four blocks were very close.
In Table 3, it can be seen that while BLK-II, BLK-III, and BLK-IV had similar sound levels, their psychoacoustic properties were quite different, which determined their soundscape identification. Furthermore, ANOVA analyses of these parameters (Table 3) showed that there were significant differences among the four blocks, indicating that each block had particular sound characteristics regarding the psychoacoustic properties.
In summary, BLK-I, identified as having an artificial soundscape, had the highest sound level, loudness, and roughness, meaning that this place had more man-made sounds [22]. BLK-IV, identified as having a natural soundscape, had the lowest roughness and the highest sharpness, indicating that this place had more natural sounds such as bird twittering [22]. BLK-II and BLK-III, both identified as having neutral soundscapes, had similar loudness and roughness but were a little different with regard to sharpness. This difference may have led to differences in existing sound sources and the different soundscape identification results of BLK-II and BLK-III, as one was identified as having a neutral-to-natural soundscape, and the other was identified as having a neutral-to-artificial soundscape.
4. Soundscape Evaluations and Influencing Factors
In the above section, objective soundscape research was performed in each block in terms of the sound environment. It showed that identifying a soundscape is useful, as it reflects the sound properties of a place. This indicates that soundscape identification is useful to describe the acoustic environment in addition to acoustic indices, such as sound levels, spectra, and psychoacoustic parameters. Based on the above research, this section presents the subjective evaluations of annoyance and acoustic comfort, the influencing factors of the evaluations in the four blocks, and a comparison of their differences.
4.1. Subjective Evaluations
The results of the subjective evaluations in terms of soundscape descriptors of annoyance and acoustic comfort from the in situ surveys were analyzed. The average values of the evaluations of each block are shown in Table 4, indicating that the square had a good soundscape, as all blocks received evaluation values greater than three (neither agree nor disagree). Considering the participants’ social and demographic backgrounds (white-collar working people with higher education, as shown in Table 1), the soundscape evaluations could be even better as previous studies have suggested these individuals are more sensitive to noisy environments [58].
Table 4.
Soundscape identification and evaluation of the four blocks.
Table 4 shows that the soundscape evaluations of the four blocks did not vary much, with the values ranging from 3.42 to 3.80 for the annoyance evaluations and from 3.54 to 3.92 for the acoustic comfort evaluations. The ANOVA analyses of the subjective evaluations of the four blocks are shown in Table 4. They indicate that the differences in the annoyance and acoustic comfort evaluations among the four blocks were not significant. However, the differences in the sound levels and psychoacoustic parameters among the four blocks were significant, as illustrated in Table 3. Such results imply that factors other than the acoustic and psychoacoustic parameters may have influenced the subjective evaluations of the soundscape.
Nevertheless, BLK-IV, identified as having a natural soundscape, was the block with the lowest annoyance and highest acoustic comfort, with values of 3.80 and 3.92, respectively. BLK-III had the lowest annoyance evaluation value and BLK-I had a slightly higher value, indicating that both blocks had poor annoyance evaluations. In addition, BLK-III also had the lowest acoustic comfort evaluation value but BLK-I had a higher value that was only lower than that of BLK-IV.
The results of the acoustic comfort evaluation analyses reveal that BLK-IV had the best acoustic comfort evaluation, followed by BLK-I. It is worth noting that BLK-II and BLK-III had worse evaluations than BLK-I. As shown in Table 4, it is noteworthy that BLK-III had a worse annoyance evaluation than BLK-I, although the former was identified as having a neutral-to-artificial soundscape, whereas the latter was identified as having an artificial soundscape. These results indicate that soundscape identification based solely on sounds and landscape features may be a reliable but imprecise method for determining a soundscape. In addition, the difference between BLK-I and BLK-III is noteworthy, as they had different spatial functions. The former was used for physical exercise while the latter was used for communication and needed to be quieter. This implies that the spatial functions may have influenced the subjective evaluations.
4.2. Influencing Factors
Although sound identification could reliably describe the soundscape, it was still beneficial to investigate the relationships between the acoustic factors and the soundscape evaluations based on annoyance and acoustic comfort. Using Pearson correlations, the correlations between various factors and the subjective evaluations were analyzed, as shown in Table 5.
Table 5.
Correlations between factors and soundscape evaluations in the four blocks.
As shown in Table 5, although many factors were not significantly correlated with the annoyance and acoustic comfort evaluations, the most significant correlations involved the sound levels and annoyance evaluations in some blocks. It can be seen that in the block with an artificial soundscape (BLK-II), the percentage of natural sound showed a significant positive correlation with acoustic comfort. However, in the block with a natural soundscape (BLK-IV), higher sound levels could contribute significantly to higher annoyance perceptions. In addition, it was noted that negative correlations were broadly observed between many factors and the subjective evaluations of both annoyance and acoustic comfort. Nevertheless, the correlations between these factors and the soundscape evaluations were different in the different blocks. Therefore, a comparison of the soundscape evaluations and influencing factors was made among the four blocks.
Based on the above results, this study employed a linear regression method to develop a regression model of the influencing factors and soundscape evaluations, as shown in Table S2. The model verified the findings of the previous correlation analyses, indicating that excessive sound levels in natural soundscapes may lead to increases in annoyance. However, the model can only explain nearly 10 percent of the total variance.
4.3. A Comparison among the Four Blocks
BLK-IV had a significant negative correlation between the sound levels and the annoyance evaluations, indicating that when this place had a higher sound level it was perceived to be noisier. In contrast, BLK-III had a significant positive correlation between most sound levels and the annoyance evaluations, indicating that when this place had a higher sound level, more annoyance was perceived. BLK-I and BLK-II had weak negative correlations in this regard. BLK-I and BLK-III had positive correlations between their sound levels and acoustic comfort, whereas BLK-II and BLK-IV had negative correlations. These results indicate that in places with more artificial soundscapes, acoustic comfort increases when the sound level increases, whereas in places with more natural soundscapes, acoustic comfort decreases when the sound level increases. Furthermore, similar results were obtained for correlations between loudness and the acoustic comfort evaluations. One possible explanation for these results could be tied to the spatial function of the space. A place with a more natural soundscape, like BLK-IV in the OCT ecological square, is usually used for restoration. Quietness is absolutely required and a higher sound level is rejected. In contrast, a place with a more artificial soundscape, like BLK-I, is usually used for exercise. Quietness is not emphasized, as recreation through events is paid more attention. This is in agreement with previous studies in spaces with high amounts of human activity and the evaluations confirmed increased acoustic comfort when sound energy increased [30,59,60].
This result implies that the spatial function of a place may play a role in determining soundscape evaluations. According to the affective attributes stated in ISO 12913-2 [33], eventful perception is an attribute used to evaluate soundscapes. For factors influencing eventful perception, the spatial function is important [11]. Even in the absence of enough formal research, some architectural designs have used soundscape approaches to meet different functional needs [61].
It is interesting to note that all blocks except BLK-IV (identified as a natural soundscape) showed positive correlations between their percentages of natural sounds and annoyance evaluations, which means that blocks with more natural sounds were perceived to be more annoying. For the exception, BLK-IV, the majority of the on-site sounds were natural sounds and more natural sounds meant a higher sound level that caused noisier perception because the users needed to lower the sound level for restoration in an open space.
In summary, most of the acoustic and psychoacoustic factors were not significantly correlated with either the annoyance or acoustic comfort evaluations. Nevertheless, soundscape identification primarily related to sound sources influenced the annoyance and acoustic comfort evaluations. Although they did not reach a significant level, it is still useful to know that the blocks identified as having more natural soundscapes (BLK-IV and BLK-II) had negative correlations between the sound levels and loudness and the acoustic comfort evaluations, whereas the blocks identified as having more artificial soundscapes (BLK-I and BLK-III) had positive correlations between the sound levels and loudness and the acoustic comfort evaluations. These results suggest that a place tends to be more tolerant of high-level sounds if it is identified as having an artificial soundscape, whereas the opposite is true if a place is identified as having a natural soundscape. These results imply that a soundscape is not only determined by acoustic factors but also by other factors such as the spatial function. According to previous studies, the spatial function can influence a soundscape as an attribute related to the context of perceiving an acoustic environment [11,36,62]. In a place with a more natural soundscape (BLK-II and BLK-IV), the spatial function is relaxation or restoration (shown in Table 3) and a quiet circumstance may be required to satisfy a user’s purpose, while in a place with a more artificial soundscape (BLK-I and BLK-III), the spatial function is exercise or communication (also seen in Table 3) and a quiet atmosphere may not be necessary to satisfy a user. These results demonstrate that the spatial function of a place could lead to different evaluations of a soundscape.
5. Conclusions and Perspectives
Understanding the soundscapes of open spaces is essential for promoting good soundscapes in residential areas. However, due to a lack of relevant studies, soundscape issues are ignored in high-density residential areas. This study provides empirical insights into soundscape research through a case study in the Shenzhen OCT ecological square. Using in situ observations, measurements, and surveys, the characteristics of the acoustic environment were explored. According to the sound sources and landscape features, the soundscapes were easily identified in the four blocks of the study site in which different activities were observed. In this study, soundscape evaluations of annoyance and acoustic comfort and their influencing factors were intensively investigated. The results are summarized as follows:
- (1)
- Soundscape identification is useful to preliminarily determine subjective evaluations of annoyance and acoustic comfort. Generally speaking, a place with a more natural soundscape is usually perceived to be less noisy and to provide more acoustic comfort but a place with a more artificial soundscape is not perceived to be noisier or to provide acoustic discomfort. This might be related to the spatial function, which has some influence.
- (2)
- For the acoustic comfort evaluations, it is interesting to note that the block with an artificial soundscape (BLK-I) was perceived to provide more acoustic comfort than the block with a neutral-to-natural soundscape (BLK-II), although the former was perceived to be noisier than the latter. This result implies that identifying a soundscape based solely on the in situ sound source and landscape observations may be reliable but imprecise.
- (3)
- For the blocks with more artificial soundscapes, higher sound levels resulted in better soundscape evaluations, whereas in the blocks with more natural soundscapes, higher sound levels resulted in worse soundscape evaluations. Such a conflict might be related to the place’s spatial function.
- (4)
- It is noteworthy that although acoustic factors have some influence on subjective evaluations, a non-acoustic factor, the spatial function, may have an influence that should be considered in a future study.
- (5)
- By researching soundscape identification, evaluations, and influencing factors, this study suggests that sound sources and landscapes are essential for determining the soundscapes in high-density residential open spaces. However, understanding the relationships between soundscapes and spatial functions is useful when evaluating a soundscape. In this study, analysis of the effects of spatial functions on soundscapes was performed qualitatively but not quantitatively. Therefore, further works will be required to investigate the spatial function and its relationships with other factors.
Supplementary Materials
The following supporting information can be downloaded at https://www.mdpi.com/article/10.3390/app14166946/s1, Investigation questionnaire; Table S1: Characteristics and attributes of four blocks in OCT ecological square; Table S2: A regression analysis of influencing factors and soundscape evaluations.
Author Contributions
Conceptualization, M.Y. and L.Y.; Data curation, Z.X.; Formal analysis, Z.X.; Funding acquisition, L.Y.; Investigation, Z.X.; Methodology, Z.X., M.Y. and L.Y.; Project administration, L.Y.; Resources, M.Y.; Supervision, L.Y.; Validation, M.Y. and L.Y.; Visualization, Z.X.; Writing—original draft, L.Y.; Writing—review and editing, Z.X. All authors have read and agreed to the published version of the manuscript.
Funding
This research was funded by the National Natural Science Foundation of China (NSFC) (grant number 7137106). This research was also funded by the Shenzhen Science and Technology Innovation Committee (grants JCYJ20140430142951405 and JCYJ20160531191427098).
Institutional Review Board Statement
This study was conducted in accordance with the Declaration of Helsinki and was approved by the Ethics Committee of Harbin Institute of Technology Shenzhen (10 August 2019).
Informed Consent Statement
Informed consent was obtained from all subjects involved in this study.
Data Availability Statement
The raw data supporting the conclusions of this article will be made available by the authors on request.
Acknowledgments
The authors are grateful for financial support from the State Key Laboratory of Subtropical Building Science and the Shenzhen Science and Technology Innovation Committee.
Conflicts of Interest
Author Ming Yang was employed by the company Boxwood A.D.R. Ltd. The remaining authors declare that the research was conducted in the absence of any commercial or financial relationships that could be construed as a potential conflict of interest.
References
- Liu, F.; Jiang, S.; Kang, J.; Wu, Y.; Yang, D.; Meng, Q.; Wang, C. On the Definition of Noise. Humanit. Soc. Sci. Commun. 2022, 9, 406. [Google Scholar] [CrossRef] [PubMed]
- Berglund, B.; Lindvall, T.; Schwela, D.H. Guidelines for Community Noise; World Health Organization: Geneva, Switzerland, 1999. [Google Scholar]
- Ecology Environment Bureau of Shenzhen Municipality. Report on the State of Shenzhen Ecology and Environment; Ecology Environment Bureau of Shenzhen Municipality: Shenzhen, China, 2023. [Google Scholar]
- ISO 12913-1: 2014; Acoustics-Soundscape-Part 1: Definition and Conceptual Framework. International Organization for Standardization: Geneva, Switzerland, 2014.
- Jo, H.I.; Jeon, J.Y. Urban Soundscape Categorization Based on Individual Recognition, Perception, and Assessment of Sound Environments. Landsc. Urban Plan. 2021, 216, 104241. [Google Scholar] [CrossRef]
- Li, M.; Han, R.; Xie, H.; Zhang, R.; Guo, H.; Zhang, Y.; Kang, J. Mandarin Chinese Translation of the ISO-12913 Soundscape Attributes to Investigate the Mechanism of Soundscape Perception in Urban Open Spaces. Appl. Acoust. 2023, 215, 109728. [Google Scholar] [CrossRef]
- Kang, J. Soundscape in City and Built Environment: Current Developments and Design Potentials. City Built Environ. 2023, 1, 1. [Google Scholar] [CrossRef]
- Gidlöf-Gunnarsson, A.; Öhrström, E. Noise and Well-Being in Urban Residential Environments: The Potential Role of Perceived Availability to Nearby Green Areas. Landsc. Urban Plan. 2007, 83, 115–126. [Google Scholar] [CrossRef]
- Langdon, F. Noise Nuisance Caused by Road Traffic in Residential Areas: Part I. J. Sound Vib. 1976, 47, 243–263. [Google Scholar] [CrossRef]
- Raimbault, M.; Dubois, D. Urban Soundscapes: Experiences and Knowledge. Cities 2005, 22, 339–350. [Google Scholar] [CrossRef]
- Hong, J.Y.; Jeon, J.Y. Influence of Urban Contexts on Soundscape Perceptions: A Structural Equation Modeling Approach. Landsc. Urban Plan. 2015, 141, 78–87. [Google Scholar] [CrossRef]
- Schulte-Fortkamp, B. The Meaning of Annoyance in Relation to the Quality of Acoustic Environments. Noise Health 2002, 4, 13–18. [Google Scholar] [PubMed]
- Nilsson, M.E.; Berglund, B. Soundscape Quality in Suburban Green Areas and City Parks. Acta Acust. United Acust. 2006, 92, 903–911. [Google Scholar]
- Schulte-Fortkamp, B.; Brooks, B.M.; Bray, W.R. Soundscape: An Approach to Rely on Human Perception and Expertise in the Post-Modern Community Noise Era. Acoust. Today 2007, 3, 7–15. [Google Scholar] [CrossRef]
- Schulte-Fortkamp, B.; Fiebig, A. Soundscape Analysis in a Residential Area: An Evaluation of Noise and People’s Mind. Acta Acust. United Acust. 2006, 92, 875–880. [Google Scholar]
- Niessen, M.E.; Van de Cruys, T.; Cance, C.; Dubois, D. Sound and Noise in Sonic Environmental Studies: Comparing Word Meaning in Discourses of Community Noise and Soundscape Research. Acta Acust. United Acust. 2013, 99, 853–862. [Google Scholar] [CrossRef]
- Yang, W.; Kang, J. Acoustic Comfort Evaluation in Urban Open Public Spaces. Appl. Acoust. 2005, 66, 211–229. [Google Scholar] [CrossRef]
- Yang, C.; Shi, S.; Runeson, G. Towards Sustainable Urban Communities: Investigating the Associations between Community Parks and Place Attachment in Master-Planned Estates in Sydney. Sustain. Cities Soc. 2023, 96, 104659. [Google Scholar] [CrossRef]
- Zhang, X.; Ba, M.; Kang, J.; Meng, Q. Effect of Soundscape Dimensions on Acoustic Comfort in Urban Open Public Spaces. Appl. Acoust. 2018, 133, 73–81. [Google Scholar] [CrossRef]
- Calleri, C.; Astolfi, A.; Armando, A.; Shtrepi, L. On the Ability to Correlate Perceived Sound to Urban Space Geometries. Sustain. Cities Soc. 2016, 27, 346–355. [Google Scholar] [CrossRef]
- Yong Jeon, J.; Jik Lee, P.; Young Hong, J.; Cabrera, D. Non-Auditory Factors Affecting Urban Soundscape Evaluation. J. Acoust. Soc. Am. 2011, 130, 3761–3770. [Google Scholar] [CrossRef] [PubMed]
- Yu, L.; Kang, J. Factors Influencing the Sound Preference in Urban Open Spaces. Appl. Acoust. 2010, 71, 622–633. [Google Scholar] [CrossRef]
- Yang, M.; Masullo, M. Combining Binaural Psychoacoustic Characteristics for Emotional Evaluations of Acoustic Environments. Appl. Acoust. 2023, 210, 109433. [Google Scholar] [CrossRef]
- Liu, J.; Kang, J.; Behm, H.; Luo, T. Effects of Landscape on Soundscape Perception: Soundwalks in City Parks. Landsc. Urban Plan. 2014, 123, 30–40. [Google Scholar] [CrossRef]
- Viollon, S.; Lavandier, C.; Drake, C. Influence of Visual Setting on Sound Ratings in an Urban Environment. Appl. Acoust. 2002, 63, 493–511. [Google Scholar] [CrossRef]
- Preis, A.; Kociński, J.; Hafke-Dys, H.; Wrzosek, M. Audio-Visual Interactions in Environment Assessment. Sci. Total Environ. 2015, 523, 191–200. [Google Scholar] [CrossRef] [PubMed]
- Brambilla, G.; Maffei, L. Perspective of the Soundscape Approach as a Tool for Urban Space Design. Noise Control Eng. J. 2010, 58, 532–539. [Google Scholar] [CrossRef]
- De Ridder, K.; Bruse, M.; Weber, C. BUGS—Benefits of Urban Green Spaces; EU Project 2001–2004: Final RESEARCHBRIEF. In Key Action City of Tomorrow and Cultural Heritage; Vito: Genk, Belgium, 2004. [Google Scholar]
- Nasution, A.D.; Zahrah, W. Quality of Life: Public Open Space Effects. Asian J. Environ.-Behav. Stud. 2018, 3, 124–132. [Google Scholar] [CrossRef]
- Lu, X.; Xie, Z.; Zhu, P.; Dai, X.; Zhang, Y.; Tao, W.; Wang, S. Comparative Evaluation of Soundscapes in Human Activities Spatial Contexts of Pedestrian Spaces Adjacent to Arterial Roads. Sci. Total Environ. 2024, 928, 172198. [Google Scholar] [CrossRef]
- Yang, W.; Kang, J. Soundscape and Sound Preferences in Urban Squares: A Case Study in Sheffield. J. Urban Des. 2005, 10, 61–80. [Google Scholar] [CrossRef]
- Meng, Q.; Kang, J. Effect of Sound-Related Activities on Human Behaviours and Acoustic Comfort in Urban Open Spaces. Sci. Total Environ. 2016, 573, 481–493. [Google Scholar] [CrossRef]
- ISO 12913-2: 2018; Acoustics-Soundscape Part 2: Data Collection and Reporting Requirements. International Organization for Standardization: Geneva, Switzerland, 2018.
- Kang, J.; Yang, W.; Zhang, M. Sound Environment and Acoustic Comfort in Urban Spaces. In Designing Open Spaces in the Urban Environment: A Bioclimatic Approach. Rediscovering the Urban Realm and Open Spaces-RUROS; Centre for Renewable Energy Sources, EESD, FP5: Athens, Greece, 2004; pp. 32–36. [Google Scholar]
- Axelsson, Ö.; Nilsson, M.E.; Berglund, B. A Principal Components Model of Soundscape Perception. J. Acoust. Soc. Am. 2010, 128, 2836–2846. [Google Scholar] [CrossRef]
- Cao, J.; Kang, J. The Influence of Companion Factors on Soundscape Evaluations in Urban Public Spaces. Sustain. Cities Soc. 2021, 69, 102860. [Google Scholar] [CrossRef]
- Jeon, J.Y.; Hong, J.Y. Classification of Urban Park Soundscapes through Perceptions of the Acoustical Environments. Landsc. Urban Plan. 2015, 141, 100–111. [Google Scholar] [CrossRef]
- Aletta, F.; Kang, J.; Axelsson, Ö. Soundscape Descriptors and a Conceptual Framework for Developing Predictive Soundscape Models. Landsc. Urban Plan. 2016, 149, 65–74. [Google Scholar] [CrossRef]
- Torresin, S.; Albatici, R.; Aletta, F.; Babich, F.; Oberman, T.; Stawinoga, A.E.; Kang, J. Indoor Soundscapes at Home during the COVID-19 Lockdown in London–Part I: Associations between the Perception of the Acoustic Environment, Occupantś Activity and Well-Being. Appl. Acoust. 2021, 183, 108305. [Google Scholar] [CrossRef]
- Cheng, J.; Chen, M.; Tang, S. Shenzhen–A Typical Benchmark of Chinese Rapid Urbanization Miracle. Cities 2023, 140, 104421. [Google Scholar] [CrossRef]
- Chen, Y.; Liu, T.; Xie, X.; Marušić, B.G. What Attracts People to Visit Community Open Spaces? A Case Study of the Overseas Chinese Town Community in Shenzhen, China. Int. J. Environ. Res. Public Health 2016, 13, 644. [Google Scholar] [CrossRef] [PubMed]
- Grinfeder, E.; Lorenzi, C.; Haupert, S.; Sueur, J. What Do We Mean by “Soundscape”? A Functional Description. Front. Ecol. Evol. 2022, 10, 894232. [Google Scholar] [CrossRef]
- HEAD Acoustics GmbH. Data Sheets for SQuadriga II. Available online: https://global.head-acoustics.com/downloads/eng/squadriga/D3320_SQuadriga_II_e.pdf (accessed on 11 November 2022).
- HEAD Acoustics GmbH. Psychoacoustic Analyses in ArtmiS II. Available online: https://www.head-acoustics.com/products/analysis-software (accessed on 11 November 2022).
- Kang, J.; Zhang, M. Semantic Differential Analysis of the Soundscape in Urban Open Public Spaces. Build. Environ. 2010, 45, 150–157. [Google Scholar] [CrossRef]
- Torija, A.J.; Ruiz, D.P.; Ramos-Ridao, A. Application of a Methodology for Categorizing and Differentiating Urban Soundscapes Using Acoustical Descriptors and Semantic-Differential Attributes. J. Acoust. Soc. Am. 2013, 134, 791–802. [Google Scholar] [CrossRef]
- Liu, J.; Kang, J. Soundscape Design in City Parks: Exploring the Relationships between Soundscape Composition Parameters and Physical and Psychoacoustic Parameters. J. Environ. Eng. Landsc. Manag. 2015, 23, 102–112. [Google Scholar] [CrossRef]
- Chen, H.-L.; Chen, C.-H.; Wu, C.-C.; Huang, H.-J.; Wang, T.-M.; Hsu, C.-C. The Influence of Neonatal Intensive Care Unit Design on Sound Level. Pediatr. Neonatol. 2009, 50, 270–274. [Google Scholar] [CrossRef]
- ISO 12913-3: 2019; Acoustics-Soundscape-Part 3: Data Analysis. International Organization for Standardization: Geneva, Switzerland, 2019.
- Sun, K.; De Coensel, B.; Filipan, K.; Aletta, F.; Van Renterghem, T.; De Pessemier, T.; Joseph, W.; Botteldooren, D. Classification of Soundscapes of Urban Public Open Spaces. Landsc. Urban Plan. 2019, 189, 139–155. [Google Scholar] [CrossRef]
- Abass, Z.; Tucker, R. White Picket Fences & Other Features of the Suburban Physical Environment: Correlates of Neighbourhood Attachment in 3 Australian Low-Density Suburbs. Landsc. Urban Plan. 2018, 170, 231–240. [Google Scholar]
- Lestari, W.; Sumabrata, J. The Influencing Factors on Place Attachment in Neighborhood of Kampung Melayu. In Proceedings of the IOP Conference Series: Earth and Environmental Science, Medan, Indonesia, 11–12 October 2017; IOP Publishing: Bristol, UK, 2018; Volume 126, p. 012190. [Google Scholar]
- Nemeth, E.; Pieretti, N.; Zollinger, S.A.; Geberzahn, N.; Partecke, J.; Miranda, A.C.; Brumm, H. Bird Song and Anthropogenic Noise: Vocal Constraints May Explain Why Birds Sing Higher-Frequency Songs in Cities. Proc. R. Soc. B Biol. Sci. 2013, 280, 20122798. [Google Scholar] [CrossRef] [PubMed]
- Halfwerk, W.; Slabbekoorn, H. A Behavioural Mechanism Explaining Noise-Dependent Frequency Use in Urban Birdsong. Anim. Behav. 2009, 78, 1301–1307. [Google Scholar] [CrossRef]
- ISO 532-1; Acoustics-Methods for Calculating Loudness-Part 1: Zwicker Method. International Organization for Standardization: Geneva, Switzerland, 2017.
- Aures, W. Berechnungsverfahren Für Den Sensorischen Wohlklang Beliebiger Schallsignale. Acta Acust. United Acust. 1985, 59, 130–141. [Google Scholar]
- Becker, J.; Sottek, R.; Lobato, T. Progress in Tonality Calculation. In Proceedings of the 23rd International Congress on Acoustics, Aachen, Germany, 9–13 September 2019; Universitätsbibliothek der RWTH Aachen: Aachen, Germany, 2019. [Google Scholar]
- Yu, L.; Kang, J. Effects of Social, Demographical and Behavioral Factors on the Sound Level Evaluation in Urban Open Spaces. J. Acoust. Soc. Am. 2008, 123, 772–783. [Google Scholar] [CrossRef] [PubMed]
- Aletta, F.; Lepore, F.; Kostara-Konstantinou, E.; Kang, J.; Astolfi, A. An Experimental Study on the Influence of Soundscapes on People’s Behaviour in an Open Public Space. Appl. Sci. 2016, 6, 276. [Google Scholar] [CrossRef]
- De Coensel, B.; Botteldooren, D.; De Muer, T.; Berglund, B.; Nilsson, M.E.; Lercher, P. A Model for the Perception of Environmental Sound Based on Notice-Events. J. Acoust. Soc. Am. 2009, 126, 656–665. [Google Scholar] [CrossRef] [PubMed]
- Hong, J.-Y.; Chong, K.H. Designing Public Soundscapes through Social Architecture and Soundscape Approaches: Reflective Review of Architectural Design Studio. Sustainability 2023, 15, 12399. [Google Scholar] [CrossRef]
- Deng, L.; Kang, J.; Zhao, W.; Jambrošić, K. Cross-National Comparison of Soundscape in Urban Public Open Spaces between China and Croatia. Appl. Sci. 2020, 10, 960. [Google Scholar] [CrossRef]
Disclaimer/Publisher’s Note: The statements, opinions and data contained in all publications are solely those of the individual author(s) and contributor(s) and not of MDPI and/or the editor(s). MDPI and/or the editor(s) disclaim responsibility for any injury to people or property resulting from any ideas, methods, instructions or products referred to in the content. |
© 2024 by the authors. Licensee MDPI, Basel, Switzerland. This article is an open access article distributed under the terms and conditions of the Creative Commons Attribution (CC BY) license (https://creativecommons.org/licenses/by/4.0/).