1. Introduction
Rainfall simulators have been widely used to investigate runoff and infiltration processes and for soil erosion assessments [
1,
2,
3,
4]. They allow the replication of varying rainfall characteristics in a faster, efficient, and controlled way in the laboratory and/or in the field [
5,
6,
7,
8,
9]. Generally, rainfall simulators are classified as dripping or spraying simulators, depending on the drop formation method. Rainfall simulators generating water drops by dripping (DRS) are among the most used for soil research and include different types of drippers, such as plastic and glass tubes, drippers in the form of holes, irrigation drippers, and hanging yarn [
10,
11]. Within the group of DRS, two groups of simulators can be distinguished, one group that has more than one dripper (DRS
>1) [
12,
13,
14,
15] and a specific group of simulators that has only one dripper (DRS
=1) [
16,
17,
18]. In the hydraulic system of DRS, the water is under relatively low pressure compared to the hydraulic system of the spraying rainfall simulators [
19]. Since the liquid flow is relatively low, the drop on a dripper initially grows relatively slowly, establishing a quasi-static equilibrium between the force of gravity and the surface tension. However, at the moment when the volume of the drop reaches a critical value, the balance of forces is disturbed and the evolution of the drop is accelerated, leading to its elongation and eventual breaking off [
20,
21,
22] with the establishment of a relatively low initial falling speed [
23].
Metal capillary tubes are one of the most commonly used drippers, especially in the form of hypodermic needles [
11]. Hypodermic needles are primarily used as medical tools and are usually relatively thin, hollow, stainless-steel tubes with a sharp tip on one end and a colored plastic adapter on the other end that connects the needle to a syringe. The size of the needles, i.e., the dimensions of their inner and outer diameters, is standardized according to the main system for measuring the diameter of hypodermic needles called Birmingham measurements [
24]. Each needle is marked with a G mark and a number from 7 to 33, which corresponds to the size of the needle. Additionally, the needle adapters are made in different colors according to international standards ISO 6009:2016 [
25] and ISO 9626:2014(E) [
26] to facilitate the identification of the needle size [
27].
Up to now, many soil studies with rainfall simulations have used hypodermic needles as drippers [
6,
7,
28]. Hypodermic needles used in the function of rainfall simulator drippers are very suitable for soil research [
1,
2,
29]. They generate water drops that match the size of natural raindrops [
30], have standardized dimensions, can generate a wide range of drop sizes, are easy to use, are easily accessible on the market, have a relatively low price, have high durability, do not rust, and can be easily replaced.
Ref. [
31] conducted detailed research regarding the measurement of drop sizes generated by the metal tubes inserted telescopically in each other. He provided drop diameters for different metal tube diameters and their relations to discharge, and reported a relation between the water head and dripping speed water pressures. However, ref. [
31] did not use needles of standard lengths. Ref. [
5] also conducted similar research, providing drop diameters of blunted metal tubes at different water head and water flow values. However, although those data are of great significance, the metal tubes used in both studies were blunted and had slightly different diameters than hypodermic needles following the international standards, providing an innovative approach to the research.
Scientific papers that use dripping rainfall simulators are often incomplete in terms of data for needle orifice diameters, lengths, and types of hypodermic needles used as a dripper, as well as data on the drop size that needles can generate [
19,
32,
33,
34,
35]. Therefore, it is needed to conduct calibration research of hypodermic needles, which would facilitate the future use, research, and construction of rainfall simulators for soil research, providing a part of solution and step closer in the process of harmonization of rain simulators among scientists. The aim of our research was to determine the size and dripping speed as a function of water pressure for hypodermic needles that are produced according to the international standards ISO 6009:2016 and ISO 9626:2014(E). For the purposes of the research, a DRS
=1 was developed and constructed to control the generation of drops. The size of the water drops was measured under the given conditions.
2. Materials and Methods
2.1. Development of the DRS System
For the development of the DRS=1 simulator, we used the following criteria:
It must have one dripper in the form of a hypodermic needle;
It must be relatively cheap:
It must be simple to use;
It must have a precise water flow-regulating system and must endure a hydraulic pressure in the system lower than 0.5 bar.
A DRS=1 system is made up of several elements:
- -
Structural support:
- -
Water tank;
- -
Water-moving mechanism;
- -
Mechanism for water flow regulation and simulator operation;
- -
Water tank with a dripper;
- -
Dripper.
The structural support of the simulator consists of a wooden platform on which almost all elements are fixed (
Figure 1a,c). The water supply is provided from a water tank filled with distilled water. Distilled water is used to avoid the possible formation of scale inside the hydraulic system, especially the dripper. At the bottom of the tank, there is a submersible electric water pump that is supplied with electricity directly from the power grid (
Figure 1b). The water pump moves water to the water tank with a dripper through a series of different diameter rubber hoses, syringes, and fittings. They are transparent to enable a visual inspection of the circulation of water and air in the hydraulic system. Water flow is regulated primarily by a switch that is connected directly to the pump. At low power, the pump tends to oscillate, causing an oscillating water flow. Therefore, a secondary flow regulator is added, which compensates for any oscillations and ensures a regular water flow.
The simulator elements are mostly taken from a basic medical infusion kit. Therefore, secondary flow regulation is performed by a medical infusion flow regulator. The flow direction is regulated by a series of three-pronged taps. Plastic syringes are used to create an air release chamber and water tank with dripper. There is also a filter that prevents the intrusion of potential water impurities from the water tank. Pressure in the hydraulic system is measured by a pressure gauge (
Figure 1c). The dripper is a standard hypodermic needle. We use 11 needles of different diameters and lengths, ranging from 16G to 32G, which were manufactured in accordance with ISO 6009:2016 and ISO 9626:2014(E) and are currently available on the market (
Table 1). The dripper is connected to the hydraulic system by a Luer lock fitting (
Figure 1c). When the simulations are finished, the hydraulic system is washed and the water pump is turned off and removed from the water tank to prevent rust. Additionally, water is completely pulled out of the system. A detailed description of the simulator design (
Figure S1) and function is provided in the
Supplementary Material.
2.2. Drop Size Measurement
After adjustment and starting the DRS=1, plastic cups are positioned under the dripper and dripping is established. A NeuLog Drop Counter Logger Sensor NUL-223 (DCLS) fixed on a mobile stand is positioned under the dripper to register dripping. Since small drops are unable to completely interrupt the infrared beam, the DCLS is adjusted to reduce the diameter of the infrared beam by installing a piece of insulating tape with a reduced diameter opening placed at the end of the sensor that emits the beam. With this adjustment, even the smallest drops could interrupt the beam completely and get registered. The DCLS is connected to a laptop via a USB cable, and the NeuLog module USB 200 (NLU) from the NeuLog software application (ver. 7.311.149) is used to record. The NeuLog software provides dripping speed data. Multiple test measurements of dripping speed are performed for a period of 30 s or 60 s until the required dripping speed and pressure equilibrium in the hydraulic system of the simulator are established. The overall water drops are measured together on a precise laboratory scale (readability of 0.001 g). The mass of a single drop is calculated as the ratio of the mass difference between the plastic cup and plastic cup with collected drops, and recorded number of drops in a given unit of time. The volume of single drops is estimated from the mass value and its density, assuming a perfectly spherical shape of the drops.
The duration of dripping per measurement lasted for 1, 2, 5 or 10 min, increasing with decreasing dripping speed and smaller drop sizes. The minimum dripping speed is determined by the capabilities of simulator to keep a constant dripping speed. For drops generated by needles with a relatively large diameter, the maximum dripping speed is determined by the proposed limit of the DCLS, whereas for relatively small drops, the maximum dripping speed is determined by the ability of the water pump to generate sufficient water pressure in the hydraulic system to increase the flow and dripping speed. Measurements are conducted starting with the minimum dripping speed and gradual increments of dripping speed for every new measurement. At least 40 measurements for all different dripping speeds were conducted for every hypodermic needle. The possible effect of evaporation on the measurement results is not taken into account.
During the experiments, measurements of water pressure in the DRS=1 system are performed for the corresponding drop sizes and dripping speed. The establishment of pressure equilibrium within the system is established by recording two identical measurements of water pressure with 1 min apart, and is ensured before starting the experiments. Given that the use of a pressure gauge usually consumes a relatively large amount of time until the establishment of water pressure equilibrium in a system, pressure measurements are performed only once for a dripping speeds of 10, 60, 120, 180, 240, and 360 drops·min−1.
2.3. Assessment of the Kinetic Energy of Drops
Given the relevance of the kinetic energy of drops to soil erosivity, this parameter is only calculated for the DRS based on measured values of drop sizes, dripping speeds and drops velocities estimated using the model [
23] for terminal and lower falling heights of a drops (Equation (1)). The initial drop falling velocity is adopted as 0 m·s
−1. Calculations are performed for adopted values of the water and air density of 1000 kg·m
−3 and 1.2 kg·m
−3, respectively, and an air temperature of 20 °C as follows:
where
KE—kinetic energy of a falling drop (J);
m—mass of a water drop (kg);
ν—water drop velocity (m·s−1).
2.4. Data Analysis
This research analyzes the drop size relation to the dripping speed for the market-available hypodermic needle sizes, i.e., opening diameters. However, the needle opening diameter is determined with a nominal outer diameter (OD Nom), according to ISO 9626:2014(E) international standards. Those deviations are constrained with the maximal outer diameter (OD Max) and needle wall maximum and minimum thickness values (
Table 1). Given that the drop diameter is a function of the needle diameter, some deviation is also possible. Drop diameters are used for the determination of the relation between drop and needle diameters, and consider the drop diameter at a dripping speed of 10 drop·min
−1 (d 10) and maximal drop diameter at a certain dripping speed (d Max) as border values. Due to the simplification of analyses, we also use the mean value (d Avr) of d 10 and d Max. The opening diameters of the needles used in this study are OD Nom, OD Min, and OD Max. Water pressure for a corresponding dripping speed of different needle sizes is analyzed. Water pressure at d 10 (h 10) and d Max (h Max) are singled out.
Regression lines were calculated for the relation between the outer diameter of the needle and the drop size. Since, in the literature, both logarithmic curves and exponential curves are used, we fitted both. Data from [
5,
30] are used. Ref. [
30] used needles with diameters of 0.23 mm to 1.6 mm, which produced drop sizes of 1.6 to 3.6 mm. To produce larger drops, one would have to use thicker needles (10G to 15G; see
Table 1), but these were not tested by [
30]. To also have information on the larger drop sizes, we added data from [
5], who used drippers with outer diameters of 3.97, 4.76, and 6.35 mm, which produced drop sizes of 4.85 mm to 5.80 mm.
Based on [
23], we determined 50, 75, 90, 95, and 99% of the terminal fall velocity for all drop diameters, as well as the height necessary to achieve it and the attained kinetic energy.
The relationship between the variables is analyzed through distribution equations and coefficients of determination (R2). Data analysis is conjoined and the results are compiles in nomographs. The NeuLog software application (ver. 7.311.149), LibreOffice Calc, and IBM SPSS Statistics (ver. 27.0.1.0) are used as software packages in this research.
3. Results
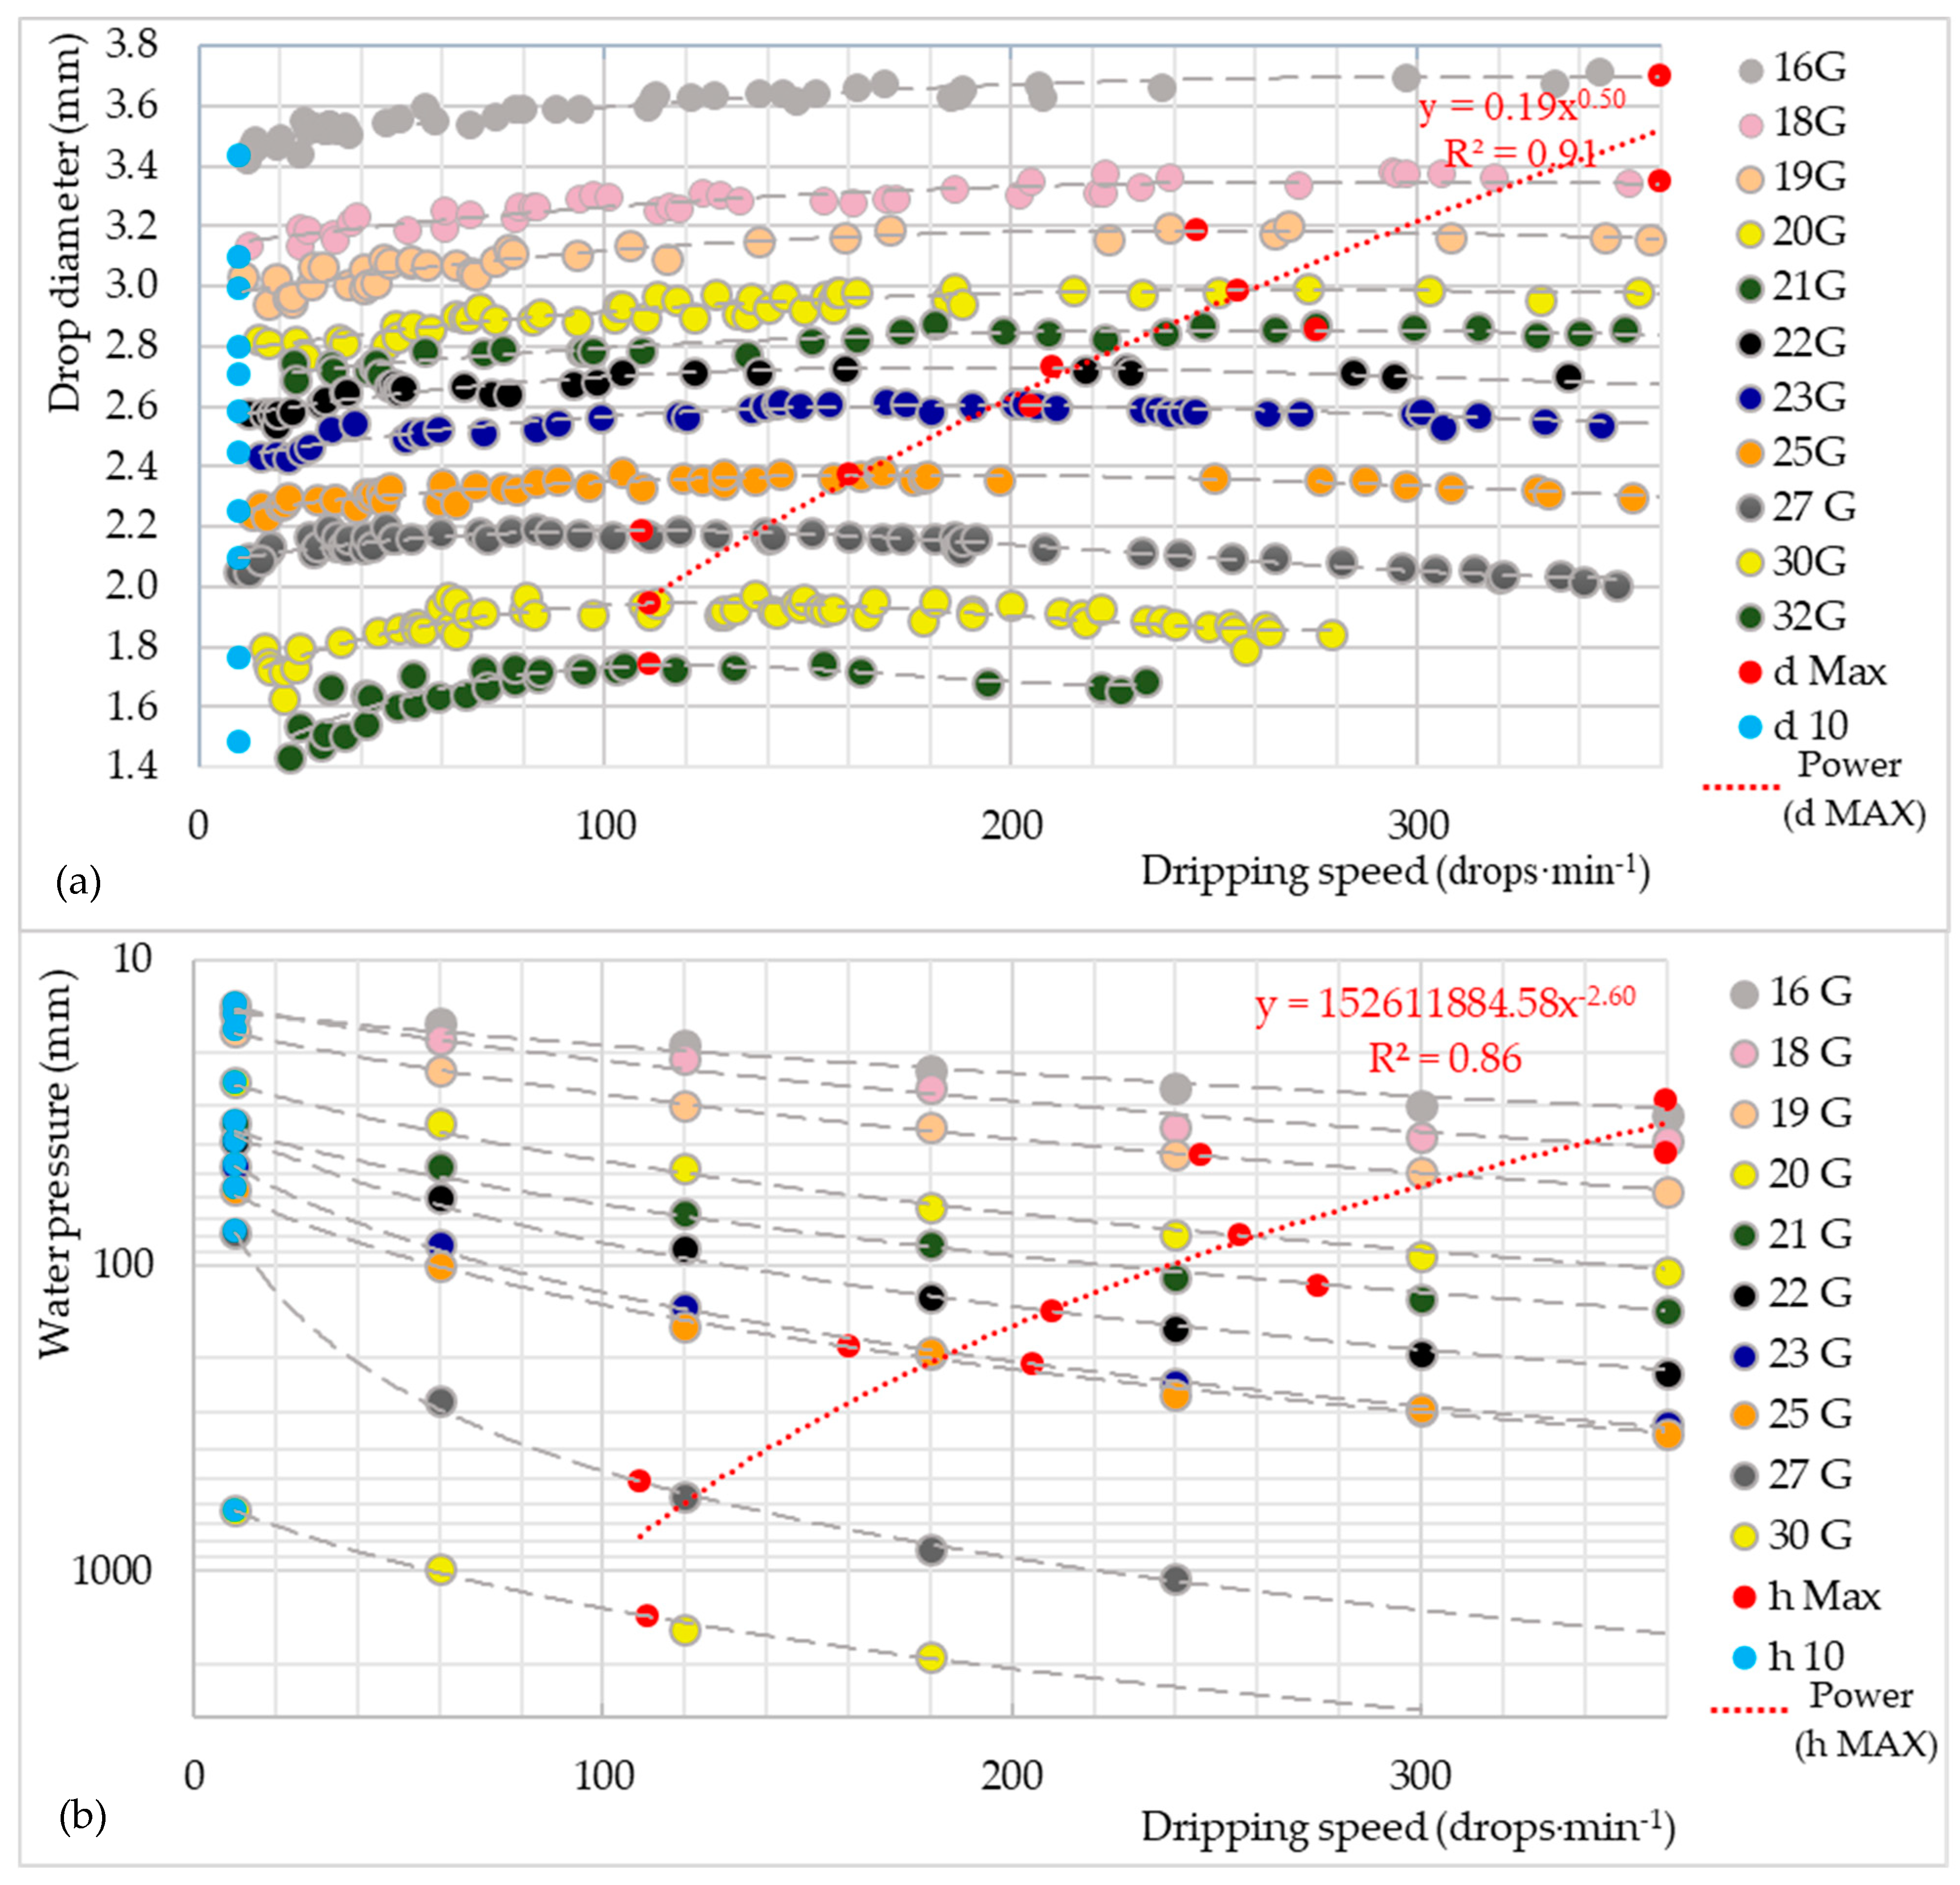
When the dripping speed is adjusted to less than 10 drops/min, the dripping speed is not constant and drops of considerably different sizes are produced. This problem is not observed at dripping speeds of 10 drops/min or more. Therefore, experiments are developed with dripping speeds of at least 10 drops·min
−1. The dripping speed of drop sizes increases until a certain critical value is reached, after which the drops become smaller as the dripping speed increases until a water jet is formed. The maximum dripping speed is determined only for drops generated using 16–25G needles due to the manufacturer’s proposed limitation for a DCLS to count drops at a speed over 360 drops·min
−1. The maximum dripping speed for drops generated by 27G, 30G, and 32G needles is limited by the ability of the water pump to generate sufficient water pressure in the hydraulic system, with limitation values of 349, 279, and 233 drops·min
−1, respectively (
Figure 2a). Water pressure in the hydraulic system of the simulator is determined by measuring the difference in the water level on the left and right sides of the pressure gauge (
Figure 1c).
The relation between the drop diameter and dripping speed for different needles is described by a polynomial distribution of 3rd degree and coefficient of determination (R
2) ranging from 0.74 to 0.90 (
Table 2), which indicates strong relations. With a reduction in needle diameter, the dripping speed at which d Max is reached decreases with a trend described by the equation y = 0.185x
0.50 and R
2 = 0.91 (
Figure 2a).
The relation between the water pressure and dripping speed for different needle diameters is described by a linear distribution (
Table 3). Decreasing the diameter of needles leads to a less sensitive water pressure change due to increasing flow resistance when water passes through the needle with a trend described by the power equation y = 152611884.58x
−2.60 and R
2 = 0.86 (
Figure 2b).
The relations between drop diameters d Avr to OD Nom are determined by power and logarithmic regression equations and corresponding coefficients of determination. These relations can also be used for the needles excluded from the measurement (10–15G, 17G, 24G, 26G, 28G, 29G, 31G, 33G, and 34G) (
Figure 3). The values for the coefficients of determination indicate a very strong relation for all drop diameter-to-dripper diameter relations (
Table 2). The relation of d Avr vs. ODNom All is strong for both the power and logarithmic regression equations (
Figure 3).
Based on known values of drop sizes, falling heights, and achieved velocities, it is possible to estimate the achieved kinetic energy, an important factor for the drop erosivity of rainfall simulators (Equation (1)). Drop velocities are estimated using the [
23] model for heights where the drops have achieved 50%, 75%, 90%, 95%, or 99% of their terminal velocity of fall. For the drop diameters ranging between 1.00 and 4.99 mm, highly related polynomial distributions are established for different percentages of their terminal velocities (
Figure 4b), the height necessary to achieve them (
Figure 4a), and their KE (
Figure 4c). The drop velocity, falling height, and kinetic energy relations to the drop diameters are described by polynomial equations of 3rd, 4th, and 5th degrees and R
2 values.
When planning rainfall simulation experiments, researchers have to choose the drop size, which largely determines the needle to be used, and rainfall intensity, which is the product of the drop size, dripping frequency, and the number of drippers per unit area. The spacing between drippers should provide a uniform rainfall. Several dripper distribution patterns have been applied, such as rectangular [
36], triangular [
37], and circular [
38]. For the accurate placement of drippers when designing a dripping rainfall simulator, a paper scheme with the position of the drippers is typically used. However, if the location of drippers is determined by measuring with a tape, it is possible to achieve a maximum precision of 1 mm (
Figure S3).
For dripping simulators with more than one dripper, it is necessary to include the total amount of drippers and dripping speed in the calculation to determine total achieved kinetic energy of simulated rainfall. Based on the number and distance of drippers, as well as the desired rainfall intensity, it is possible to estimate the amount of water required, the volume of the drops, the velocity of the drops, and given the relation between pressure and dripping speed, it is possible to determine the required pressure. To facilitate calculations, nomographs representing indirect combinations of physical drop properties are prepared from our results (
Figure S2a,b). Nomographs are used to adjust dripping simulators or as a starting point for the construction of a new rainfall simulator. An example on how to use nomograph to design a rainfall simulation experiment is provided in the
Supplementary Material.
In order to make the simulated precipitation spatially uniform, rectangular [
36], triangular [
37], or circular [
38] dripper distribution patterns are primarily applied when designing simulators with drippers. Accordingly, there are limitations regarding the total number of drops used (
Figure S1).
4. Discussion
Changes in needle diameters and dripping speeds affect the diameter of generated drops. Generally, a reduction in the needle diameter leads to decreasing drop diameters. Drop diameters d 10 and d Max are important as lower and upper drop diameter limits for every needle. The largest measured d Max of 3.69 mm is generated using a 16G needle at a dripping speed of 360 drops·min−1, while the lowest d 10 of 1.42 mm is generated using a 32G needle at a dripping speed of 10 drops·min−1. In the case of 16G and 18G needles, d Max is determined by the proposed speed limit for counting drops of the DCLS, 360 drops/min. In the case of smaller drops (19–32G needles), d Max is achieved at a lower dripping speed, after which the dripping diameter gradually decreases with the increase in the dripping speed.
The measurement of water pressure shows that to start dripping requires some pressure in the hydraulic system. The lowest observed pressure h 10 is 14 mm of a water head for a 16G needle and was recorded at a dripping speed of 10 drops·min
−1. A gradually rising water pressure increases the dripping frequency too. The water pressure h 10 is drastically enlarged in a 30G needle compared to 16–27G needles. However, since the maximum pressure allowed on a pressure gauge is 1970 mm (
Figure 2b), we conducted measurements of pressure for a 30G needle until reaching the pressure gauge maximum scale reading and estimate further pressure by assuming linear relation. For a 32G needle, measurements of water pressure are not possible because the PG exceeds the upper scale limit of 1970 mm in the pressure gauge. We can clearly observe that with the rising water pressure, the dripping speed in the hydraulic system also increases, following a linear regression curve (
Table 3). However, it is important to note that, given the non-uniform length of all needles, the length will affect water flow resistance too. Therefore, the drop diameter and water pressure relations to dripping speed could also be affected, especially for 27G to 34G needles (for an OD Nom of 0.40 mm to 0.18 mm)
Both power and logarithmic regressions provided excellent relations of d Avr vs. OD Nom All (
Figure 3). However, it is necessary to emphasize that there are possibly slight deviations in those relations due to different needle OD and wall thickness deviations within proposed tolerance values (
Table 1). Based on the d vs. OD Nom All distribution, we can observe that the power regression would potentially overestimate the drop diameters generated by needles. On the other hand, logarithmic regression would potentially underestimate the drop diameters (
Figure 3). However, drippers from [
30] represent metal needles and tubes (with sharp and obsolete tips, respectively), which may not necessarily correspond to the dripper diameters proposed by the ISO 9626:2014(E) international standard. Nonetheless, all regressions are in accordance with findings from [
39], which report that an increasing dripper diameter impacts the detached drop weight, i.e., drop diameter, and becomes less dependent on the dripper diameter.
The size of natural raindrops ranges from 0.12 to 7.00 mm [
40], although it rarely exceeds 4 mm [
41,
42,
43,
44]. Therefore, it is possible to generate these drops using needles as drippers (
Figure 3). As [
31] suggested, the significance of being able to produce 5 mm drops under controlled conditions becomes apparent when the criteria proposed by [
45] are considered. They suggested that rainfall effects on soil loss are based on one-hundredth of the product of rainfall energy for a given storm and the maximum 30 min intensity of the storm. Using this criteria, it is more important to simulate storms based on the EI value (product of total storm energy E and its maximum 30 min intensity I), rather than the intensity or amount of water. Additionally, the availability of large drops is essential when the height of fall is limited. The additional mass of large drops is needed to compensate for the failure of the falling drops to reach terminal velocity, considering that the greatest number of rainfall simulations were conducted with drop diameters larger than 2.0 mm [
11]. On the other hand, for natural rainfall, the maximal median volume diameter (D
0) usually does not exceed 2.5 mm [
46] and it is inherent for relatively heavy rains, while for frequent relatively light rains, the D
0 is significantly smaller [
47]. Regarding that, it is necessary to emphasize the ability of needles to produce drops smaller than 2 mm.
The generation of drops by 32G, 33G, and 34G needles would require the establishment of a significantly higher hydraulic pressure in the hydraulic system of the rainfall simulator (
Figure 2b). Such requirements could potentially lead to technical difficulties in developing the simulator due to the possibility to generating too much pressure and possible leakage [
3]. On the other hand, with an enlargement of the needle diameter, the pressure would not increase significantly, but the dripping speed may become more sensitive to changes in hydraulic pressure (
Figure 2b). Considering that pressure regulation is the primarily way to regulate the dripping speed [
11], such an issue could impair the rainfall simulator use. These claims may explain the large number of simulators using 27G needles (0.40 mm OD Nom) [
11,
30]. Besides being easily available on the market (due to their medical use), hypodermic needles generate drops whose diameters correspond to the size of drops that can be found in natural rainfall of almost any intensity [
48]. Furthermore, needles require very low or no pressure to prevent dripping at the lowest dripping speed. Additionally, their sensitivity to a change in dripping speed with pressure allows reasonably good dripping speed regulation.
The terminal velocity of drops increases with drop diameters up to 9 m·s
−1 for drops larger than 4 mm (
Figure 4b). The falling height necessary to achieve the terminal velocity of drops increases with the increment of the drop diameter, reaching almost 11.5 m to reach 99% of the terminal velocity for drop diameters between 3 and 4 mm, after which the needed height decreases slightly for larger drops (
Figure 4a). Reaching 95 and 90% of the terminal velocity requires a significantly shorter falling height with a relatively low decrease in the achieved kinetic energy compared to the 99% height. Drops with a diameter less than 1.0 mm require around 2.0 m to reach 95% of the terminal velocity, while larger drops require significantly more than 2 m. For example, drops with a diameter of 2 mm require a falling height of more than 5.6 m to obtain 95% of their terminal velocity, which corresponds to 90% of their kinetic energy at terminal velocity (
Figure 4c).
Comparing the attained results with those from [
31], there is an obvious similarity regarding the relation between the drop diameter and discharge, and the relations between water pressure in the system and dripping speed and discharge. However, there are slight deviations between those relations. Possible reasons for them vary, such as the wall thickness of larger drippers and a difference in the tip geometry. Moreover, a slight difference in the kinetic energy of falling drops is possible due to differences between models that are used for the calculation of the falling drop velocity.
In future research, we will investigate the potential impacts of other parameters (e.g., evaporation, water and air temperatures, atmospheric pressure, and water chemical characteristics) on the drop sizes of simulated rainfall. Although the drop weight method for the measurement of drop size is widely adopted [
49], it would be much easier to conduct a calibration of needles’ performances using some type of disdrometer. In that way, it would be possible to complete the calibration much faster, although the precision and relevance of the results probably would not be better due to oscillations in measurements [
50].
Nomographs are developed in this study to provide improved insights regarding the interconnection of simulated rainfall variables and facilitate experimental research and rainfall simulator design. Those are results that have a role in providing us approximate values for assessments of drop sizes at different dripping speeds and water pressures.
5. Conclusions
The research successfully established a relation between the drop sizes generated by hypodermic needles and the dripping speed at a corresponding water pressure. This research facilitates the future use of hypodermic needles as drippers and the construction of rainfall simulators. The rainfall simulator for this research was constructed to be simple and easily adaptable for various purposes in soil research. The rainfall simulator is described in detail so that its replication would be easy.
By using a wide range of needle sizes, it is possible to simulate most natural rainfall drop sizes. Changes in needle diameters and dripping speeds, i.e., water pressures, affect the diameters of the generated drops. Generally, a reduction in the needle diameter leads to decreasing drop diameters. The largest measured diameter is 3.69 mm and is generated using a 16G needle at a dripping speed of 360 drops·min−1, while the lowest diameter of 1.42 mm is generated using a 32G needle at a dripping speed of 10 drops·min−1. The availability of large drops is essential when the height of fall is limited, while, on the other hand, for the natural rainfall with a maximal median volume diameter (D0) usually under 2.5 mm, it is necessary to emphasize the ability of needles to produce drops smaller than 2 mm.
This paper provides data on the required falling height of drops and corresponding terminal velocity of fall and, more importantly, the achieved velocity. These can be used to estimate the kinetic energy of the drops, which is very important for the construction of rainfall simulators for soil erosion and conservation research. The obtained results show similarity with those from [
31] regarding the relation between the drop diameter and discharge, and the relations between the water pressure in a system and dripping speed and discharge. However, although this study provides relevant information on drop sizes at different dripping speeds and water pressures using distinct standard hypodermic needles, drop size calibration should not be neglected during simulation experiments.

 ,
, 


