Article

Vortex Characterization and Parametric Study of Miniature Vortex Generators and Their Near-Field Boundary Layer Effects

1
Department of Mechanical Engineering, KU Leuven, B-3001 Leuven, Belgium
2
Department of Hydrodynamic Systems, Budapest University of Technology and Economics, H-1111 Budapest, Hungary
3
Material Science, Innovation and Modelling (MaSIM), North-West University, Mmabatho 2745, South Africa
*
Author to whom correspondence should be addressed.
Appl. Sci. 2024, 14(16), 6966; https://doi.org/10.3390/app14166966
Submission received: 30 June 2024 / Revised: 4 August 2024 / Accepted: 6 August 2024 / Published: 8 August 2024
(This article belongs to the Special Issue Advances in Active and Passive Techniques for Fluid Flow Manipulation)

Abstract

:
Delaying the onset of laminar-turbulent transition is an attractive method in reducing skin friction drag, especially on streamlined bodies where Tollmien–Schlichting instabilities are the dominating mechanism for transition. Miniature Vortex Generators (MVGs) offer an effective approach to attenuate these instabilities by generating counter-rotating vortex pairs. They are placed in pairs within an array and resemble small-winglet-type elements. The conventional methodology involves adjusting the MVG parameters and conducting computationally expensive DNS and/or downstream stability analyses to assess their effectiveness. However, analyzing the vortex parameters of MVG-generated vortices can potentially guide a more targeted approach to modifying the MVG parameters and identifying the critical factors for transition delay. Therefore, this study investigates the changes in three primary MVG parameters, namely inner distance, periodicity, and height, and utilizes computational fluid dynamics (CFDs) analysis to create a dataset that examines the characteristics of the generated counter-rotating vortex pairs and their potential in drag reduction. The objective is to establish correlations among these parameters and their influence on delaying transition. The results show that there is an optimal ratio between the MVG height and boundary layer thickness. Higher MVGs cause a decrease in the vortex radius and an increase in the amount of circulation, raising the likeliness of bypass transition. The derived correlations between the different MVG parameters show that the vortex radius is the most critical one and is hence an important parameter in the drag reduction potential.

1. Introduction

Efficient energy use is a key aspect in our efforts to reduce the greenhouse gas emissions and increase the powertrain efficiencies around the world. A substantial portion of the global energy consumption is dedicated to transportation. Here, aerodynamic drag plays a critical role, significantly impacting the energy consumption in this sector, which is still largely dominated by fossil fuels. Reducing drag forces involves overcoming two main types of drag: pressure drag and skin friction drag. For streamlined objects, skin friction forces typically outweigh pressure forces, making the reduction in skin friction drag the most appealing. However, skin friction, inherently tied to the boundary layer flow of a fluid over a surface, is particularly challenging to reduce. A closer examination reveals that laminar boundary layers have significantly lower skin friction than turbulent boundary layers. As the Reynolds number (Re) increases, there is a rapid rise in the skin friction coefficient ( C f ), further complicating the effort to minimize drag. Delaying the transition from laminar to turbulent flow results in a net lower skin friction drag, but the mechanisms governing this transition are complex and depend on the type of flow and ambient conditions, as is often the case in fluid control problems [1].
These transition mechanisms, first described by Reynolds at the end of the 19th century, have since been thoroughly studied. In the case of boundary layer flow, two main classes of transition are described: one describing a natural transition and the other one describing a bypass approach [2,3]. When there is no modal growth observed during the transition, it can be categorized as a “bypass” transition. This type is most often due to the growth of an initial perturbation, e.g., free stream disturbances or surface roughness. Its nonmodal method bypasses the modal growth, as observed in the former category, the natural transition. This transition is found when there are no or only very small environmental disturbances. This modal approach is distinguished by the exponential amplification (or decay) of the disturbances within a certain range of forcing frequencies and Re numbers. The initial unstable eigenmode is characterized by exponentially growing traveling waves referred to as Tollmien–Schlichting (TS) waves [4,5]. This research primarily concentrates on natural transition as this boundary layer instability transition type is understood much better and is much more suitable for flow control. It is also more fundamentally and practically significant for addressing the challenges related to real-life applications, such as moving vehicles in cruise conditions. A significant body of research is devoted to active methods of attenuating these TS waves, such as suction systems, wall motion, or surface heating [6]. However, a passive method proves to be more attractive as this mitigates the need for additional energy-consuming parts such as sensors or actuators, making it much easier to practically implement. In this field, pioneering work by Fransson et al. [7] showed that creating streamwise elongated streaks can effectively dampen the growth of these TS waves in such a way that postponing the transition is possible. This streak generation, however, is an intricate mechanism that, if not carefully controlled, could create the opposite effect, i.e., advancing the transition location. The fundamental process behind transition delay is the “lift-up” mechanism, as described in Landahl [8]. Streaks are created by a relatively weak pair of streamwise vortices that are counter-rotating. The resulting low- and high-speed spanwise velocity variations are created by the alternating effect of lifting up the low-speed fluid from the near-wall boundary region and the down-pulling of the higher-speed velocity region of the upper boundary layer. This interchange in momentum leads to the formation of streaks. These varying slow–fast regions create spanwise shear in the boundary layer, which is the main mechanism in decreasing the disturbance energy growth, essentially dampening the TS waves and postponing the transition location [9,10]. The increase in (pressure) drag caused by the placement of the MVGs in the flow field is consistently surpassed by the reduction in drag observed downstream, resulting from the delayed onset of the turbulent boundary layer. Although MVGs inherently add drag compared to a smooth flat plate, the overall drag reduction achieved through their influence on the boundary layer transition justifies their implementation [9,11]. Both experimental work [12] and numerical simulations [9] have shown that appropriate streak generation has the capability of attenuating the TS wave growth, with the main factor that influences the effectiveness of this attenuation being the streak amplitude [13]. A high amplitude is sought after for its stabilizing effect; however, there is a balance to maintain: when this amplitude crosses a critical threshold, the streaks can cause secondary instabilities, effectively advancing the transition location. Different methods exist for creating this streaky boundary layer pattern. Initially, circular and rectangular roughness elements have been investigated, both proving effective [12,14,15,16]. However, currently, the most promising method of streak generation involves small-winglet-type elements that create these counter-rotating vortices. These are called Miniature Vortex Generators or MVGs. They differ from “classical” vortex generators, which are used to delay separation as they are smaller and present in the laminar region of the boundary layer. The main body of work showing the effectiveness of these MVGs includes the experiments of Fransson and Shahinfar [17,18]. The experimental work of Weingaertner et al. [19] also proves several key practical findings of this technology, mainly stressing the importance of the streamwise location of the MVGs.
Previous works have conducted limited parametric studies investigating the influence of certain MVG parameters on the effects of the streak generation downstream. Although idealized vortices, such as those proposed by Siconolfi et al. [20], offer the most control and adjustability over the initial flow field that induces the streaky boundary layer, they do not represent a realistic configuration. On the other hand, analyzing the effect of the MVG geometry on the streak amplitude provides valuable insights into the effectiveness of an MVG setup, yet it fails to demonstrate how the distinct characteristics of the vortex itself play a role. A knowledge gap persists: until now, physical MVG parameters have been altered to analyze streak generation, but no investigation has focused on the vortices themselves. While the numerical studies of Siconolfi et al. [20] examined the introduction of an idealized Batchelor vortex and its effect on downstream drag reduction, no vortex analysis has been performed on the vortices generated by the MVG pairs. This study aims to bridge that gap. By analyzing the vortex parameters, it is possible to gain insight into which characteristics influence drag reduction and how these parameters of realistic vortices compare to well-defined idealized ones [21]. While some studies described relationships between the MVG parameters and streak amplitude, the limited range of configurations restricts the applicability of these findings. Building on the collaborative study conducted by Szabó et al. [11], further analyses are undertaken to extend the findings obtained in that research. This study will therefore perform a large-parameter study, focusing on two key aspects: expanding the current parametric investigation of MVGs and characterizing the vortices generated by different MVG setups and their effect on drag reduction.

2. Materials and Methods

2.1. Governing Equations and Numerical Setup

The analysis of the vortices generated by MVGs was completed by first solving the steady-state 3D Navier–Stokes equations for incompressible Newtonian fluids, which are based on the conservation of mass and momentum. These equations are represented as
· u = 0 , ( u · ) u = 1 ρ p + ν 2 u ,
where u [m/s] denotes the velocity vector, p [Pa] represents pressure, ρ [ kg / m 3 ] is density, and ν [ m 2 / s ] stands for kinematic viscosity. Ansys Fluent 2020 R1 was used to solve these equations. The Reynolds number based on boundary layer thickness ( R e δ ) is defined as
R e δ = u δ ν ,
where u is the velocity in [m/s], δ is the boundary layer thickness in [m], and ν [ m 2 / s ] is the kinematic viscosity. This Reynolds number is around 300 at the end of the domain. The Reynolds number based on distance from leading edge R e x = u x ν is around 1.5 × 10 5 [22].
The computational meshes used for the various configurations are consistent with those reported by Siconolfi et al. [10], maintaining a uniform height of 13 mm in all cases. Research by Camarri et al. [23] indicated that, provided the computational domain is adequately large, altering its size does not significantly impact the results. Figure 1 shows a schematic of the computational domain. The domain starts at X 0 , with X M V G indicating the center of the MVG relative to the domain’s beginning. To optimize computational efficiency, simulations were conducted for only half of the domain, corresponding to a single MVG from each pair. A symmetry condition, as described by Camarri et al. [23], was applied in both sides of the domain for these simulations. A fully developed Blasius profile is implemented at the inlet in the wall-normal coordinate (y) while ensuring uniformity in the spanwise direction (z). The boundary layer thickness at the MVG location is δ 99 , M V G = 3.610 mm . At the outlet, a pressure boundary condition is set with a gauge pressure of 0 Pa, which was also applied at the top boundary, with no velocity gradient perpendicular to the boundary. To maintain consistency across different cases, careful attention was paid to avoid significant variations in mesh size or quality. The mesh is finest near the MVG and becomes progressively coarser further away. Typically, the mesh consists of approximately 3 to 5 million elements. It was verified that changes in mesh resolution have a negligible effect on the results, with a discretization error around 0.5%. Mesh independence was analogous to the study of Vanierschot et al. [24], where the Grid Convergence Index method of Roache [25] is employed. Grids of three different sizes were tested, with the resulting investigated parameters (such as the location of the vortex center or circulation value) all falling between the 95% confidence intervals of the fitting parameters discussed in Section 2.3. The QUICK (Quadratic Upstream Interpolation for Convective Kinematics) scheme is used for discretizing momentum, while the PRESTO! scheme is employed for pressure discretization. The pressure–velocity coupling uses the segregated SIMPLEC (Semi-Implicit Method for Pressure Linked Equations-Consistent) method. Each simulation continues until the residuals achieve double-precision machine accuracy before concluding. For analyzing the downstream drag reduction abilities, a BiGlobal stability analysis is performed, detailed in Szabó et al. [11].

2.2. MVG Parameters and Flow Configuration

The same setup as Sattarzadeh and Fransson’s second case serves as the base configuration for this study [26]. The flow parameters are defined by a free-stream velocity of U = 6 m / s and a kinematic viscosity of ν = 1.4607 × 10 5 m 2 / s , making comparison possible between the experimental results from the base case and the simulations in this work. The flow direction is along the x-axis, while y and z denote the wall-normal and spanwise directions, respectively.
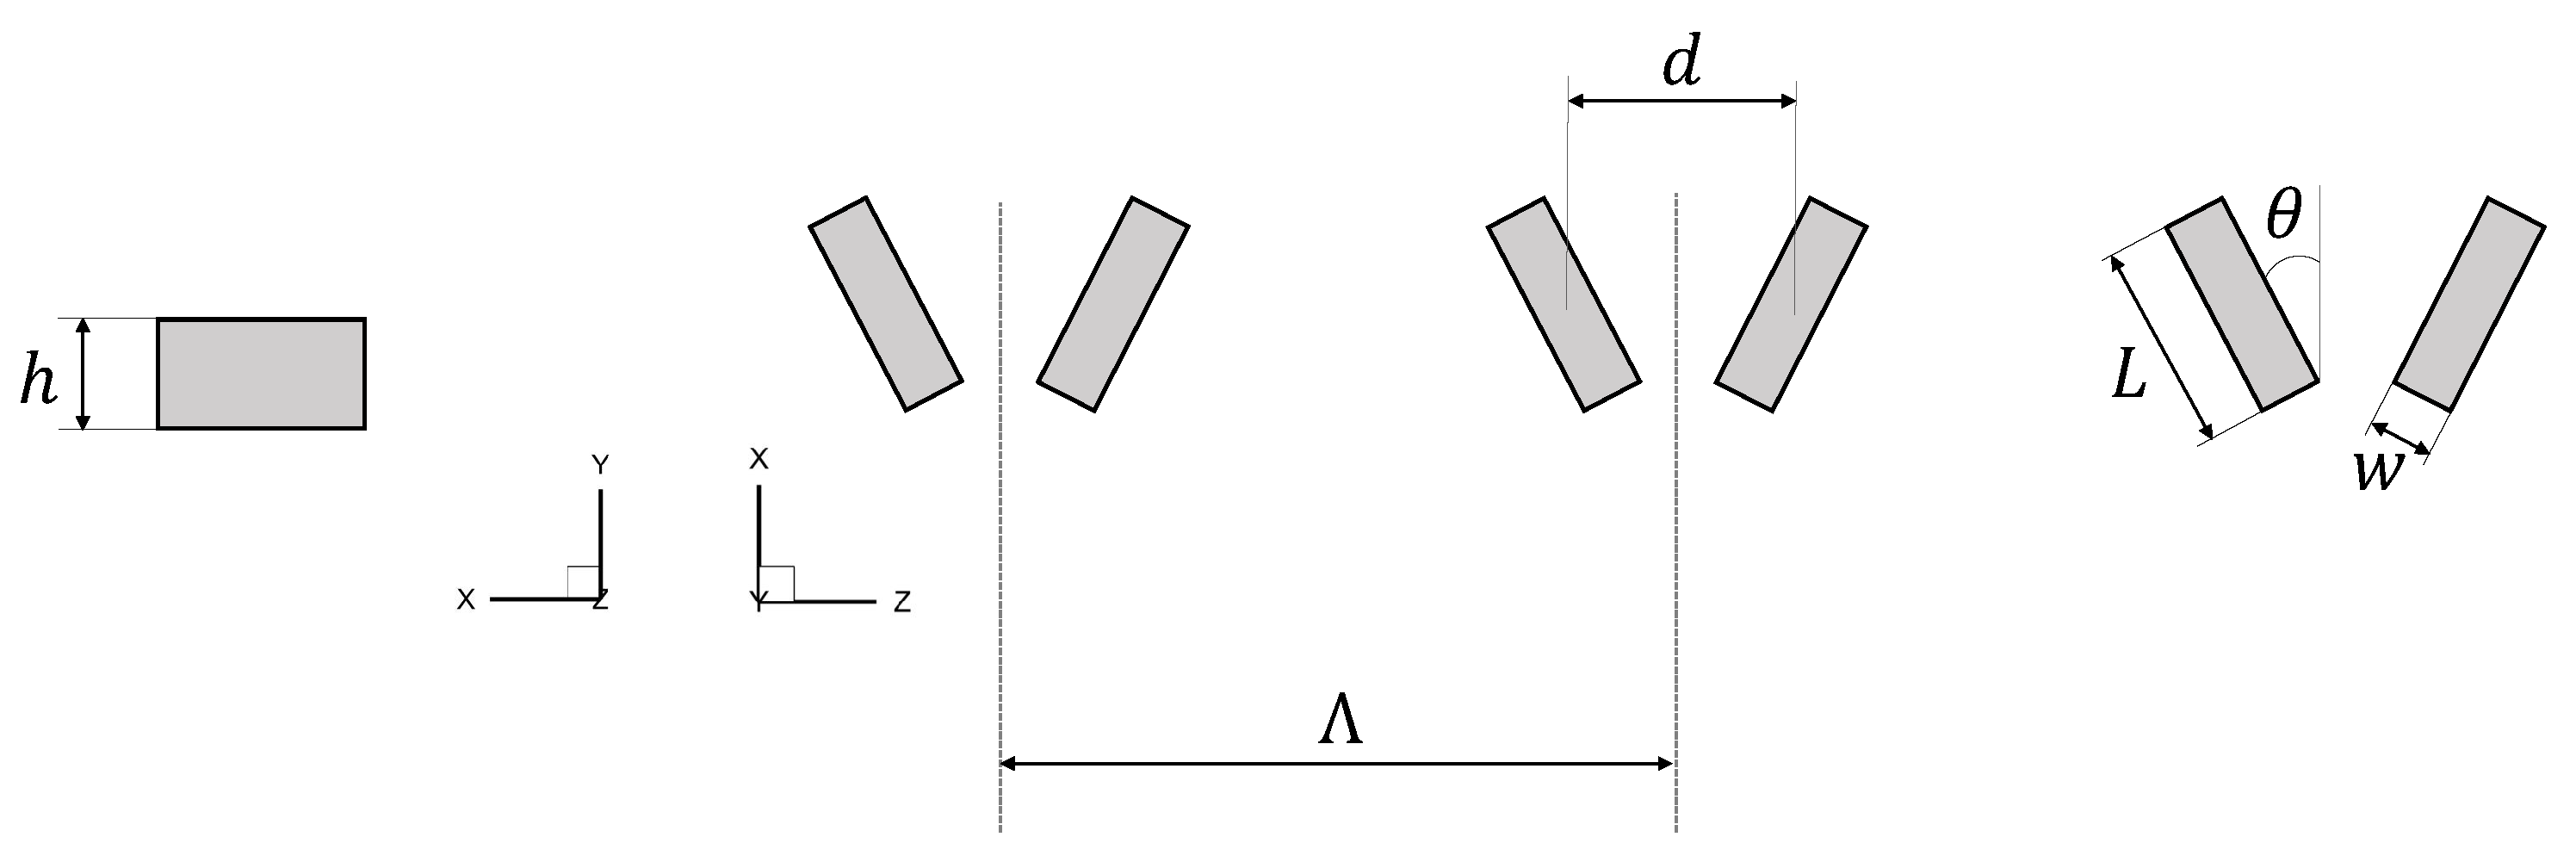
The spanwise inner distance between the centers of two MVGs in a pair is denoted by d, and the spanwise distance between two pairs of MVGs is represented by Λ . Each MVG has a width (w), length (L), and height (h) and forms an angle ( θ ) with respect to the free-stream velocity. To extend the current parametric study, the height, inner distance, and spanwise periodicity are varied. The parameters include h ranging from [0.360:0.0554:0.526] δ 99 , M V G and Λ covering [1.949:0.900:7.34] δ 99 , M V G , where the bracketed values denote the initial point, spacing, and endpoint of the parameter grid. The ratio d / λ varies between [0.2, 0.35, 0.5, 0.65, and 0.8]. This configuration results in a total of 140 cases. A schematic overview of all parameters is provided in Figure 2. Table 1 lists the values for these different parameters for the base case.

2.3. Vortex Characterization

As detailed in Section 1, previous computational studies have primarily focused on boundary layer stabilization using free-stream vortices. The Batchelor vortex [13] serves as the model for an idealized free-stream vortex, with its velocity profile defined by
V θ ( r , θ ) = Γ 2 π r 1 exp ( r 2 R c 2 ) .
In this formula, V θ [m/s] represents the tangential velocity component, corresponding to the V component in a horizontal profile or the W component in a vertical profile. Γ [m2/s] denotes the circulation, and R c [m] signifies the vortex radius. When analyzing realistic vortices, a method must be developed to compare these realistic vortices with their idealized counterparts. The generated vortex velocity profiles are fitted along the average of horizontal and vertical lines through the vortex center to achieve this comparison using a non-linear least squares method. Although the position of maximum velocity remains consistent across both profiles, there is often a noticeable asymmetry in the vortex, depending on the specific case. This asymmetry arises from the influence of the bottom wall and the presence of the other vortex within the pair. The fitted Batchelor vortex used for comparison is based on the average of both profiles, accounting for these asymmetrical influences.
To quantify the asymmetry present in a vortex pair, a measure of asymmetry was developed for comparative analysis across different cases. By examining the velocity profiles of vortices in both horizontal and vertical directions, distinct peaks were observed, indicating the maximum or minimum speeds of the vortex in each direction. To assess asymmetry, the ratio of the horizontal to vertical distances between these peaks was calculated, defining the aspect ratio. Although this method primarily considers the horizontal and vertical planes, it provides a sufficient estimation of asymmetry as the primary factor influencing asymmetry is the horizontal (bottom) wall. An aspect ratio of one implies that the peaks of the vortex velocity profiles in the horizontal and vertical directions are equidistant from the vortex center.

3. Results

In this section, the results of the vortex analysis are presented. Initially, the velocity profiles are displayed, followed by an overview of the vector map and the method used to determine the vortex center. Subsequently, heatmaps are presented to visualize the data across the different cases, as well as scatter plots comparing the different parameters. These heatmaps and scatter plots offer a comprehensive depiction of the observed variations and patterns, enabling a comparative analysis. Lastly, the Q criterion visualizations provide qualitative insights into the vortical structures.

3.1. Batchelor Vortex Fitting

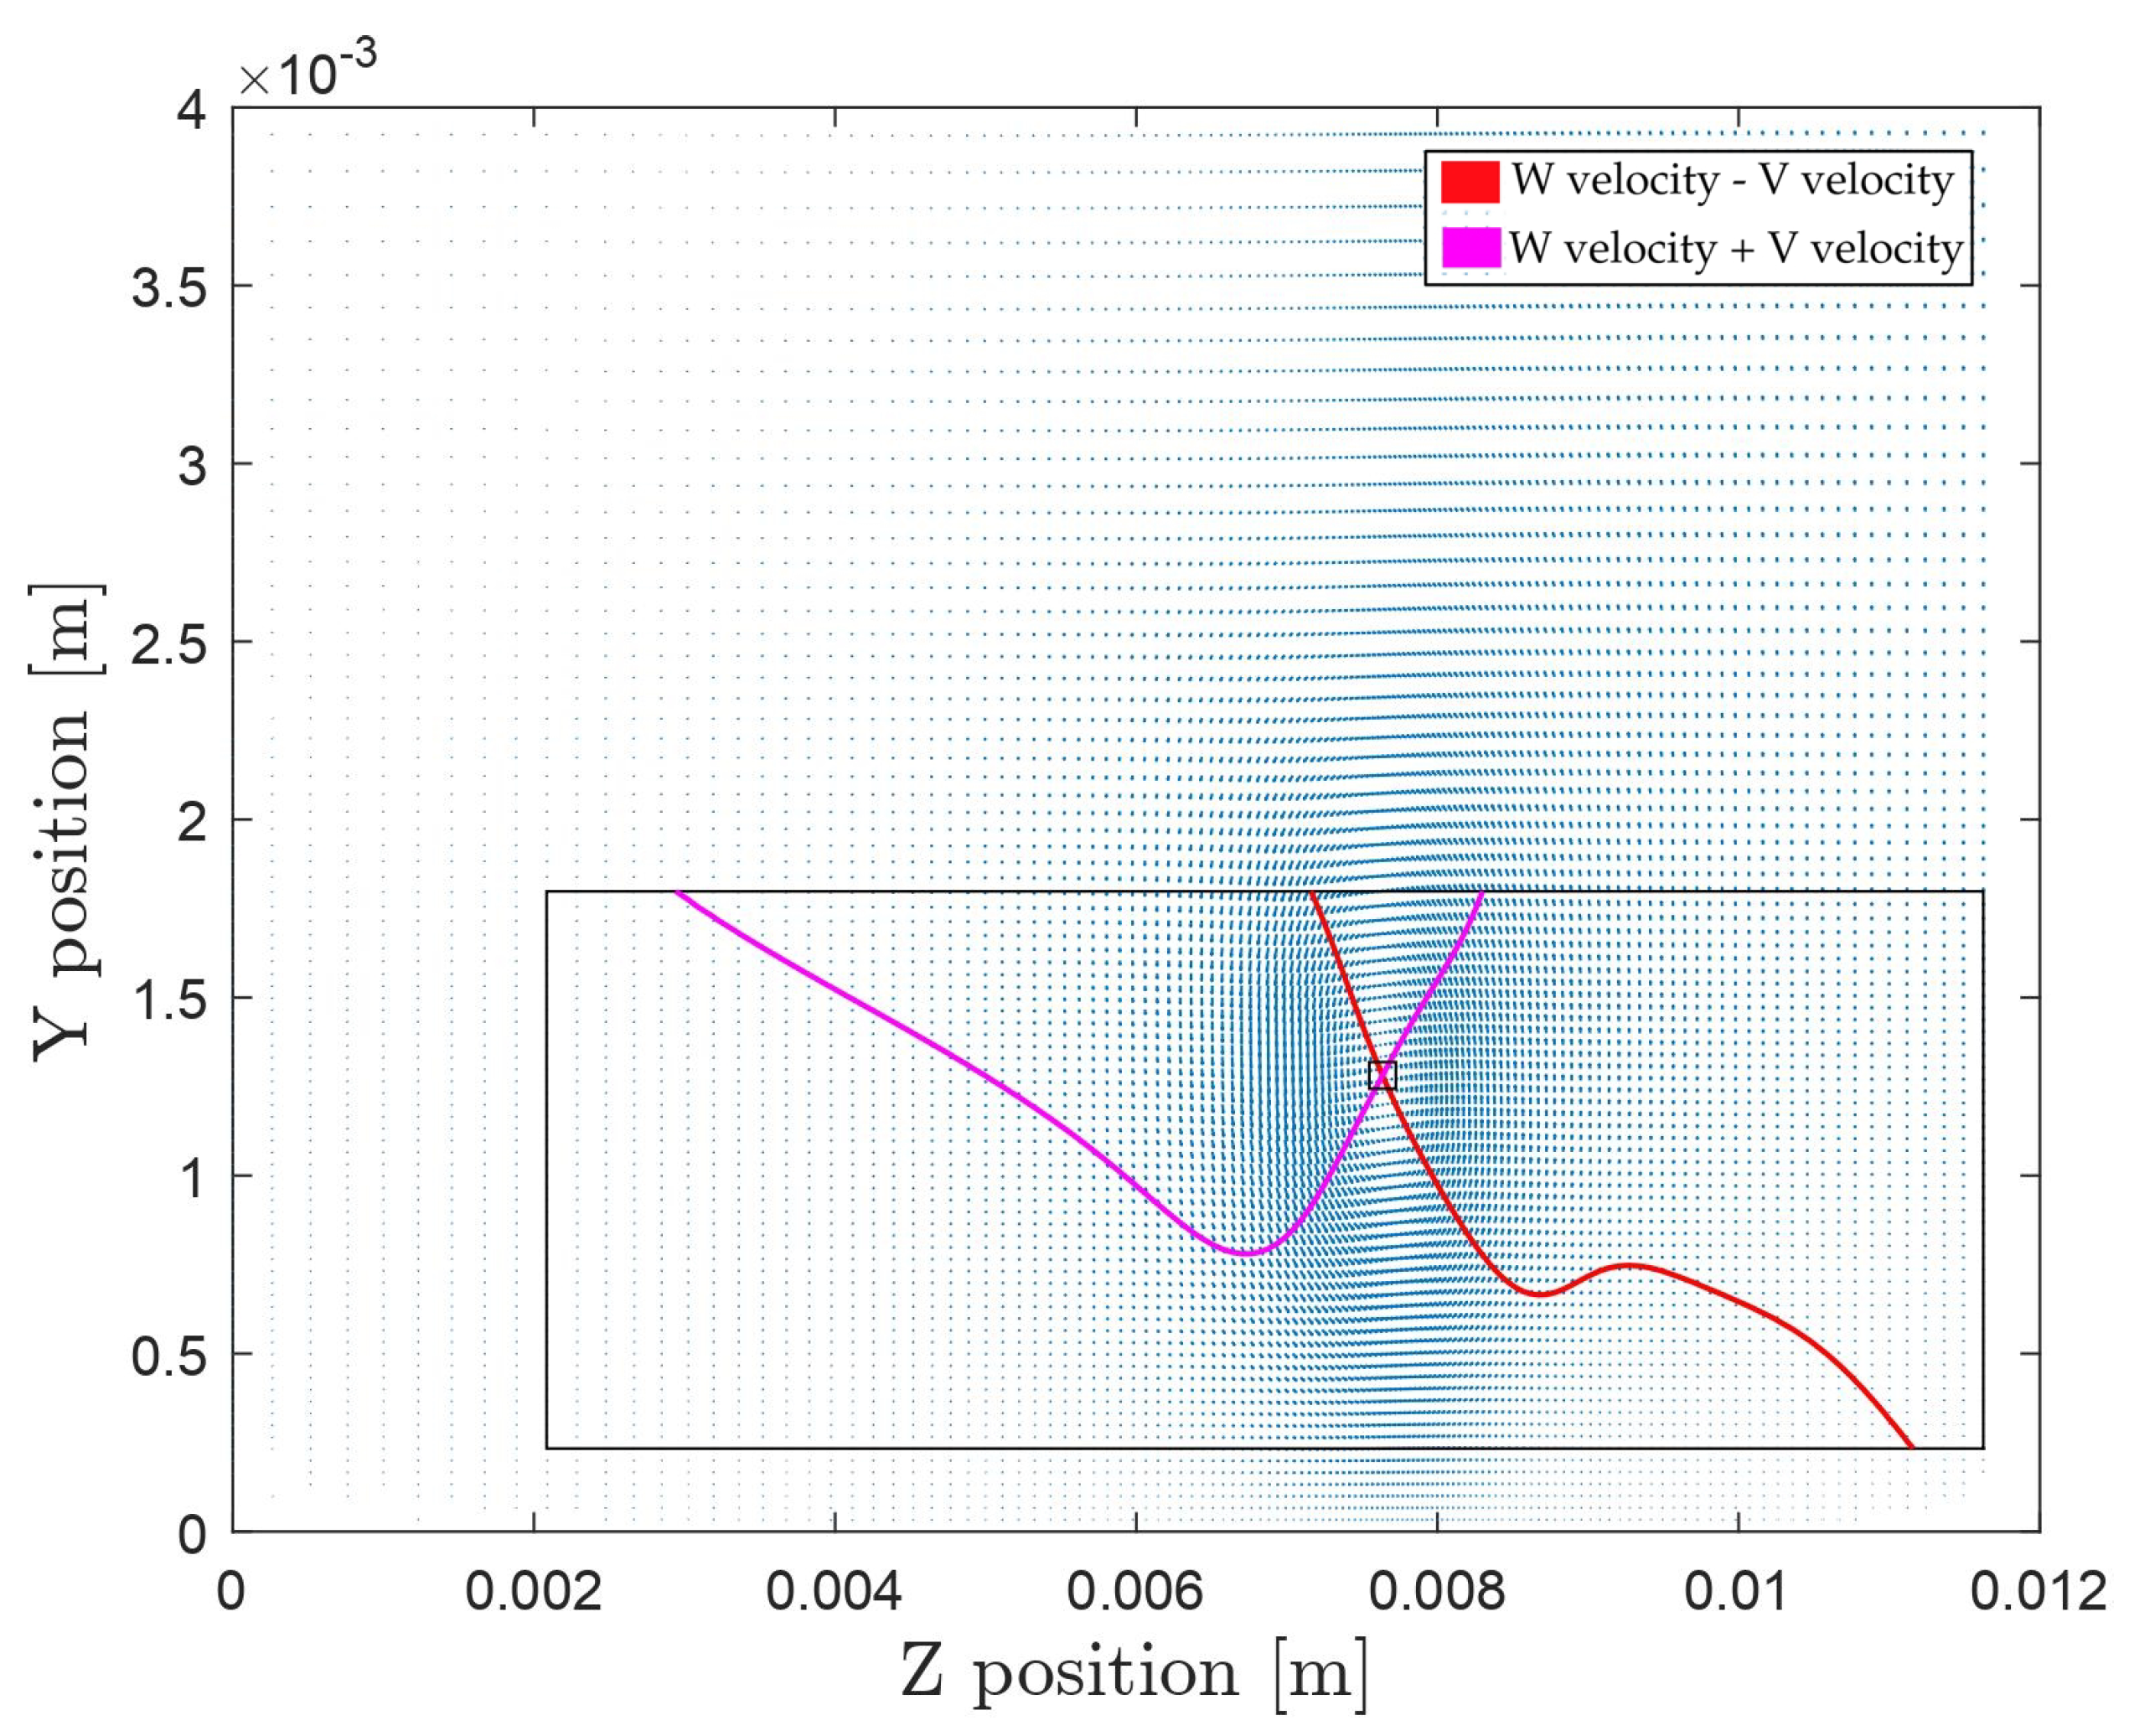
To gain more information about the vortex center, the velocity fields are examined by plotting two lines: isocurves of the spanwise velocity subtracted by the upward velocity set to zero, and vice versa. This method provides a robust approach to locating the vortex center, avoiding the influence of the zero spanwise (w) or upward (v) velocity components near walls, as can be seen in Figure 3. Figure 4 presents an example of the velocity profiles along the horizontal and vertical lines through the vortex center, where the negative of the vertical velocity is plotted. This approach allows the two profiles to overlap, providing a clearer view of any asymmetry. Significant asymmetry would result in a large difference between the velocity profiles. A notable observation is the tendency of the W velocity profile to approach zero as it reaches the wall. These plots also illustrate the impact of low spanwise periodicity, which often causes the V velocity to not return to zero due to the influence of the adjacent vortex pair.
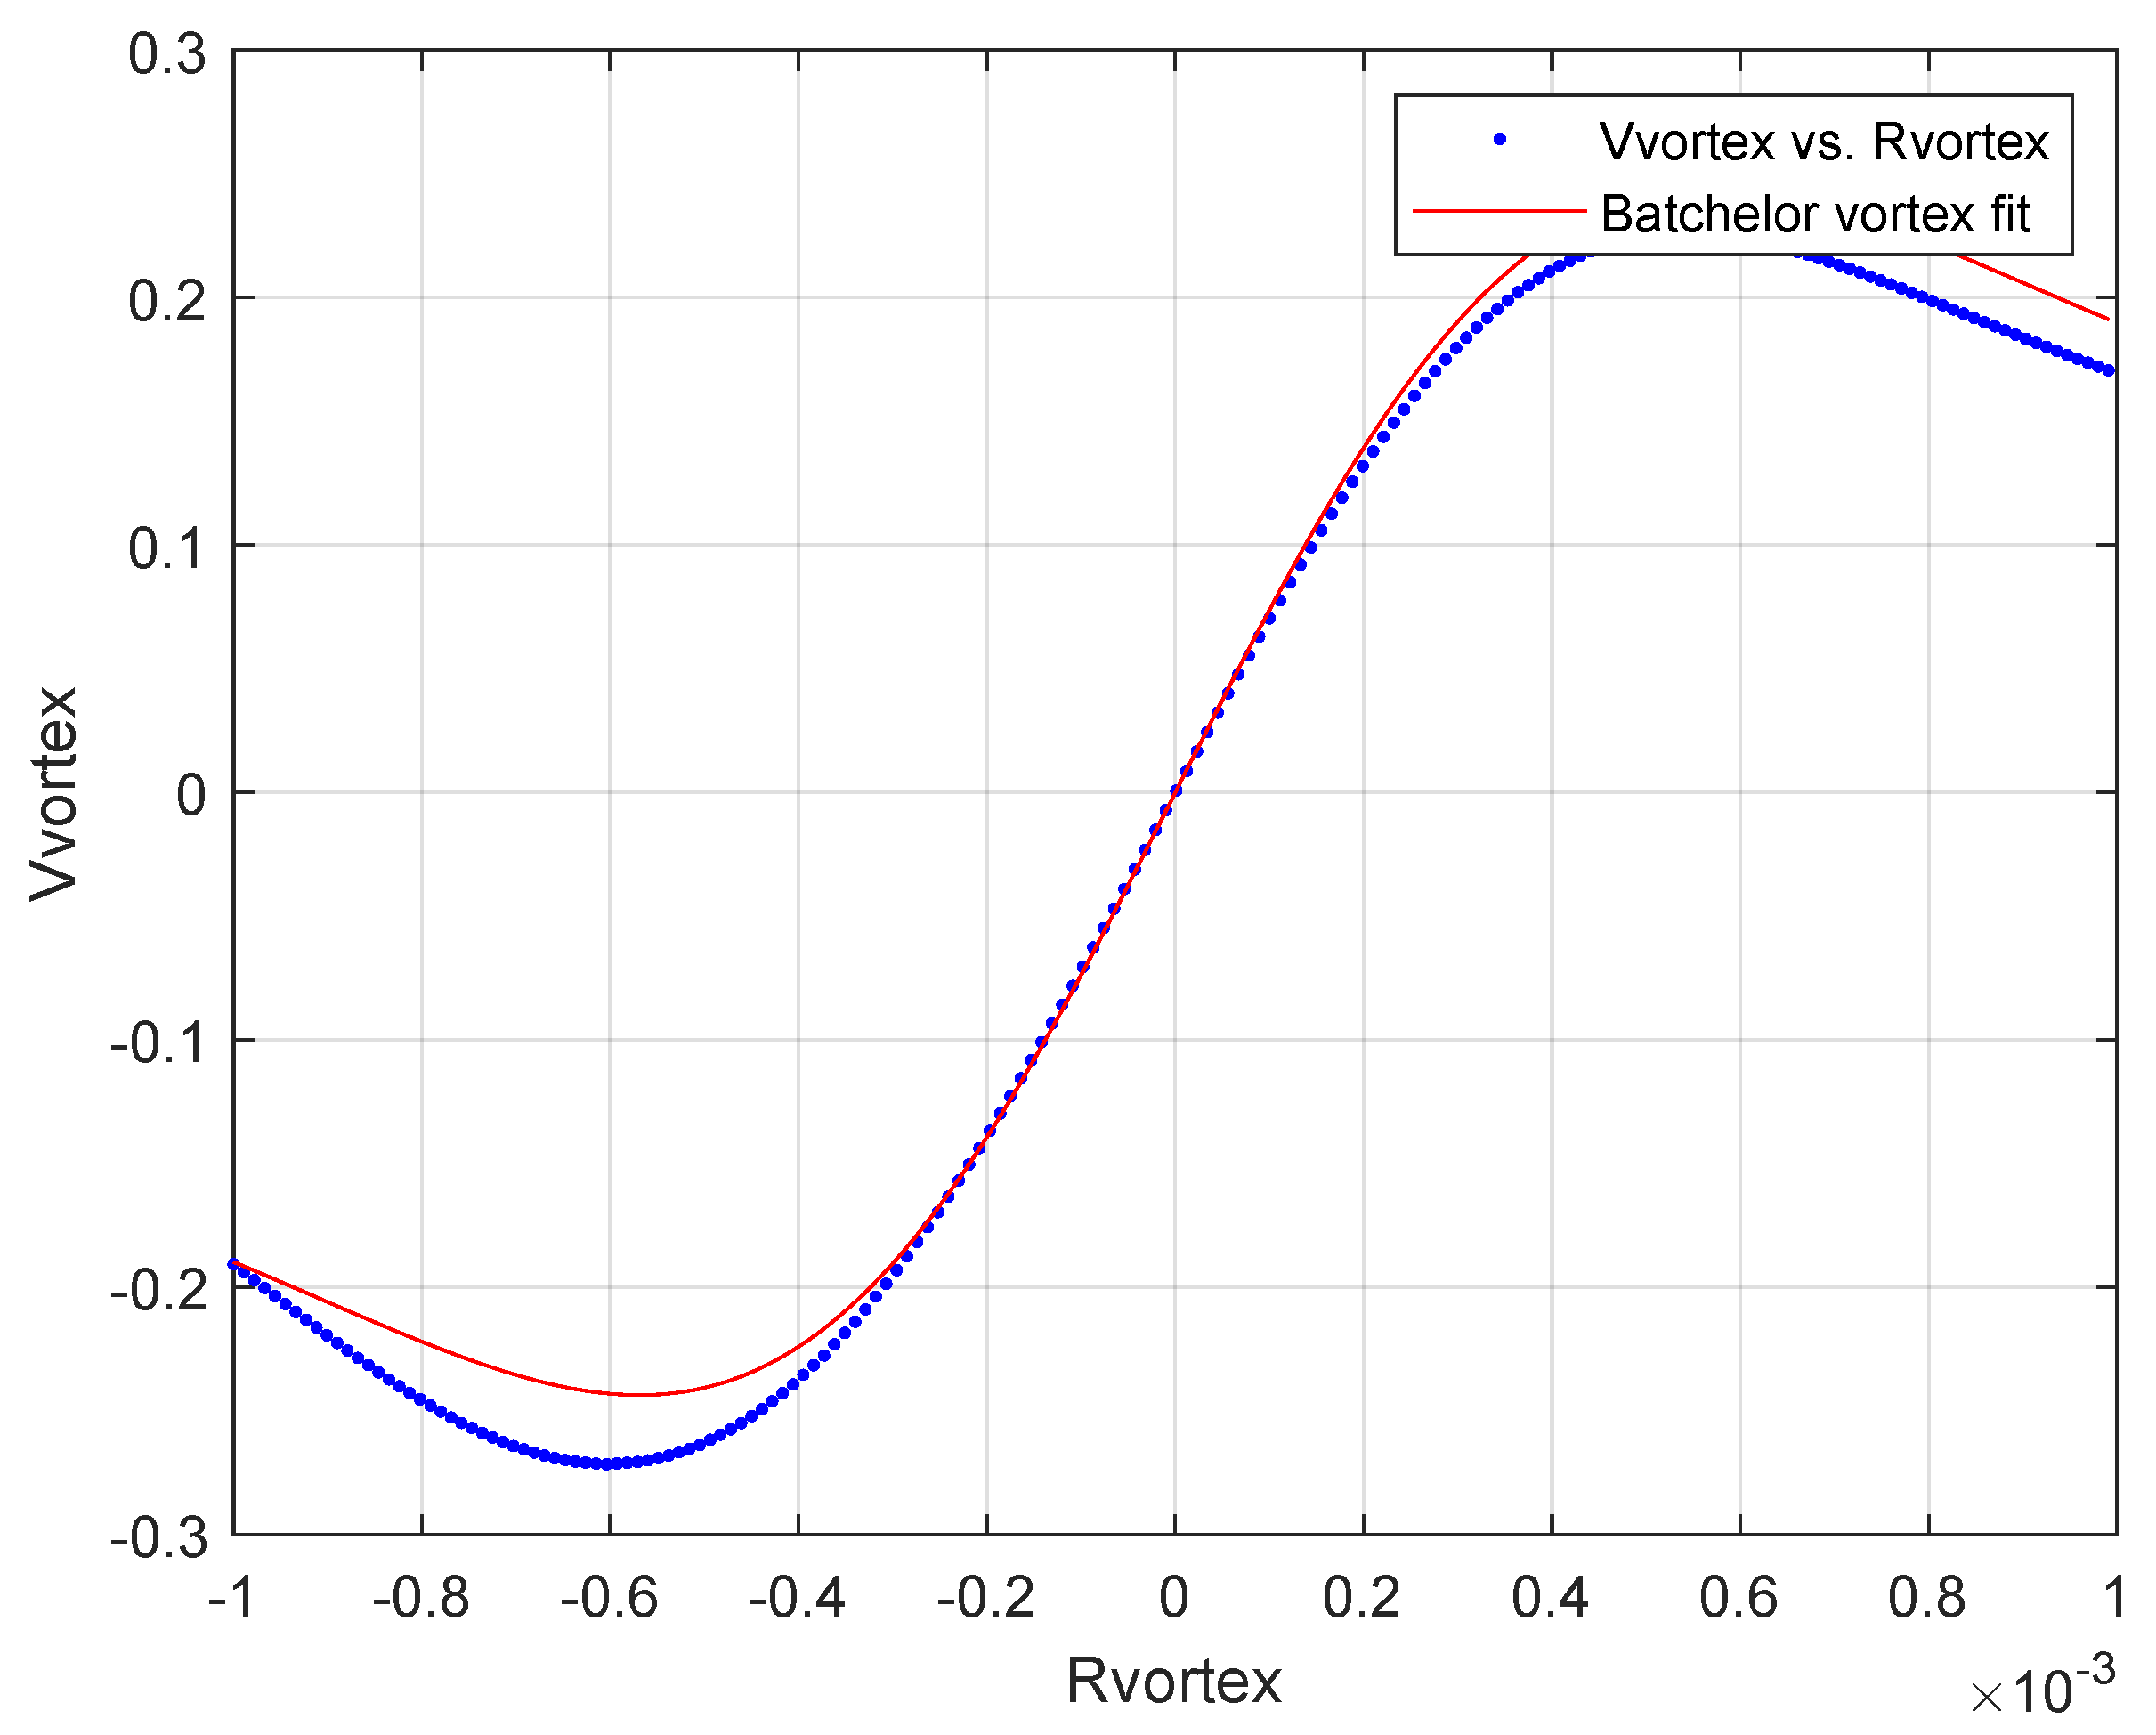
As discussed in Section 2.3, a Batchelor vortex is fitted to the average velocity profiles to compare the real vortices generated by the MVGs with an idealized vortex. Figure 5 illustrates this comparison, where the red line depicts the idealized vortex’s velocity profile around the vortex core and the blue line shows the average velocity of the actual vortex. This fitting process enables the estimation of important parameters, specifically the circulation ( Γ ) and vortex radius ( R c ).

3.2. Heatmaps

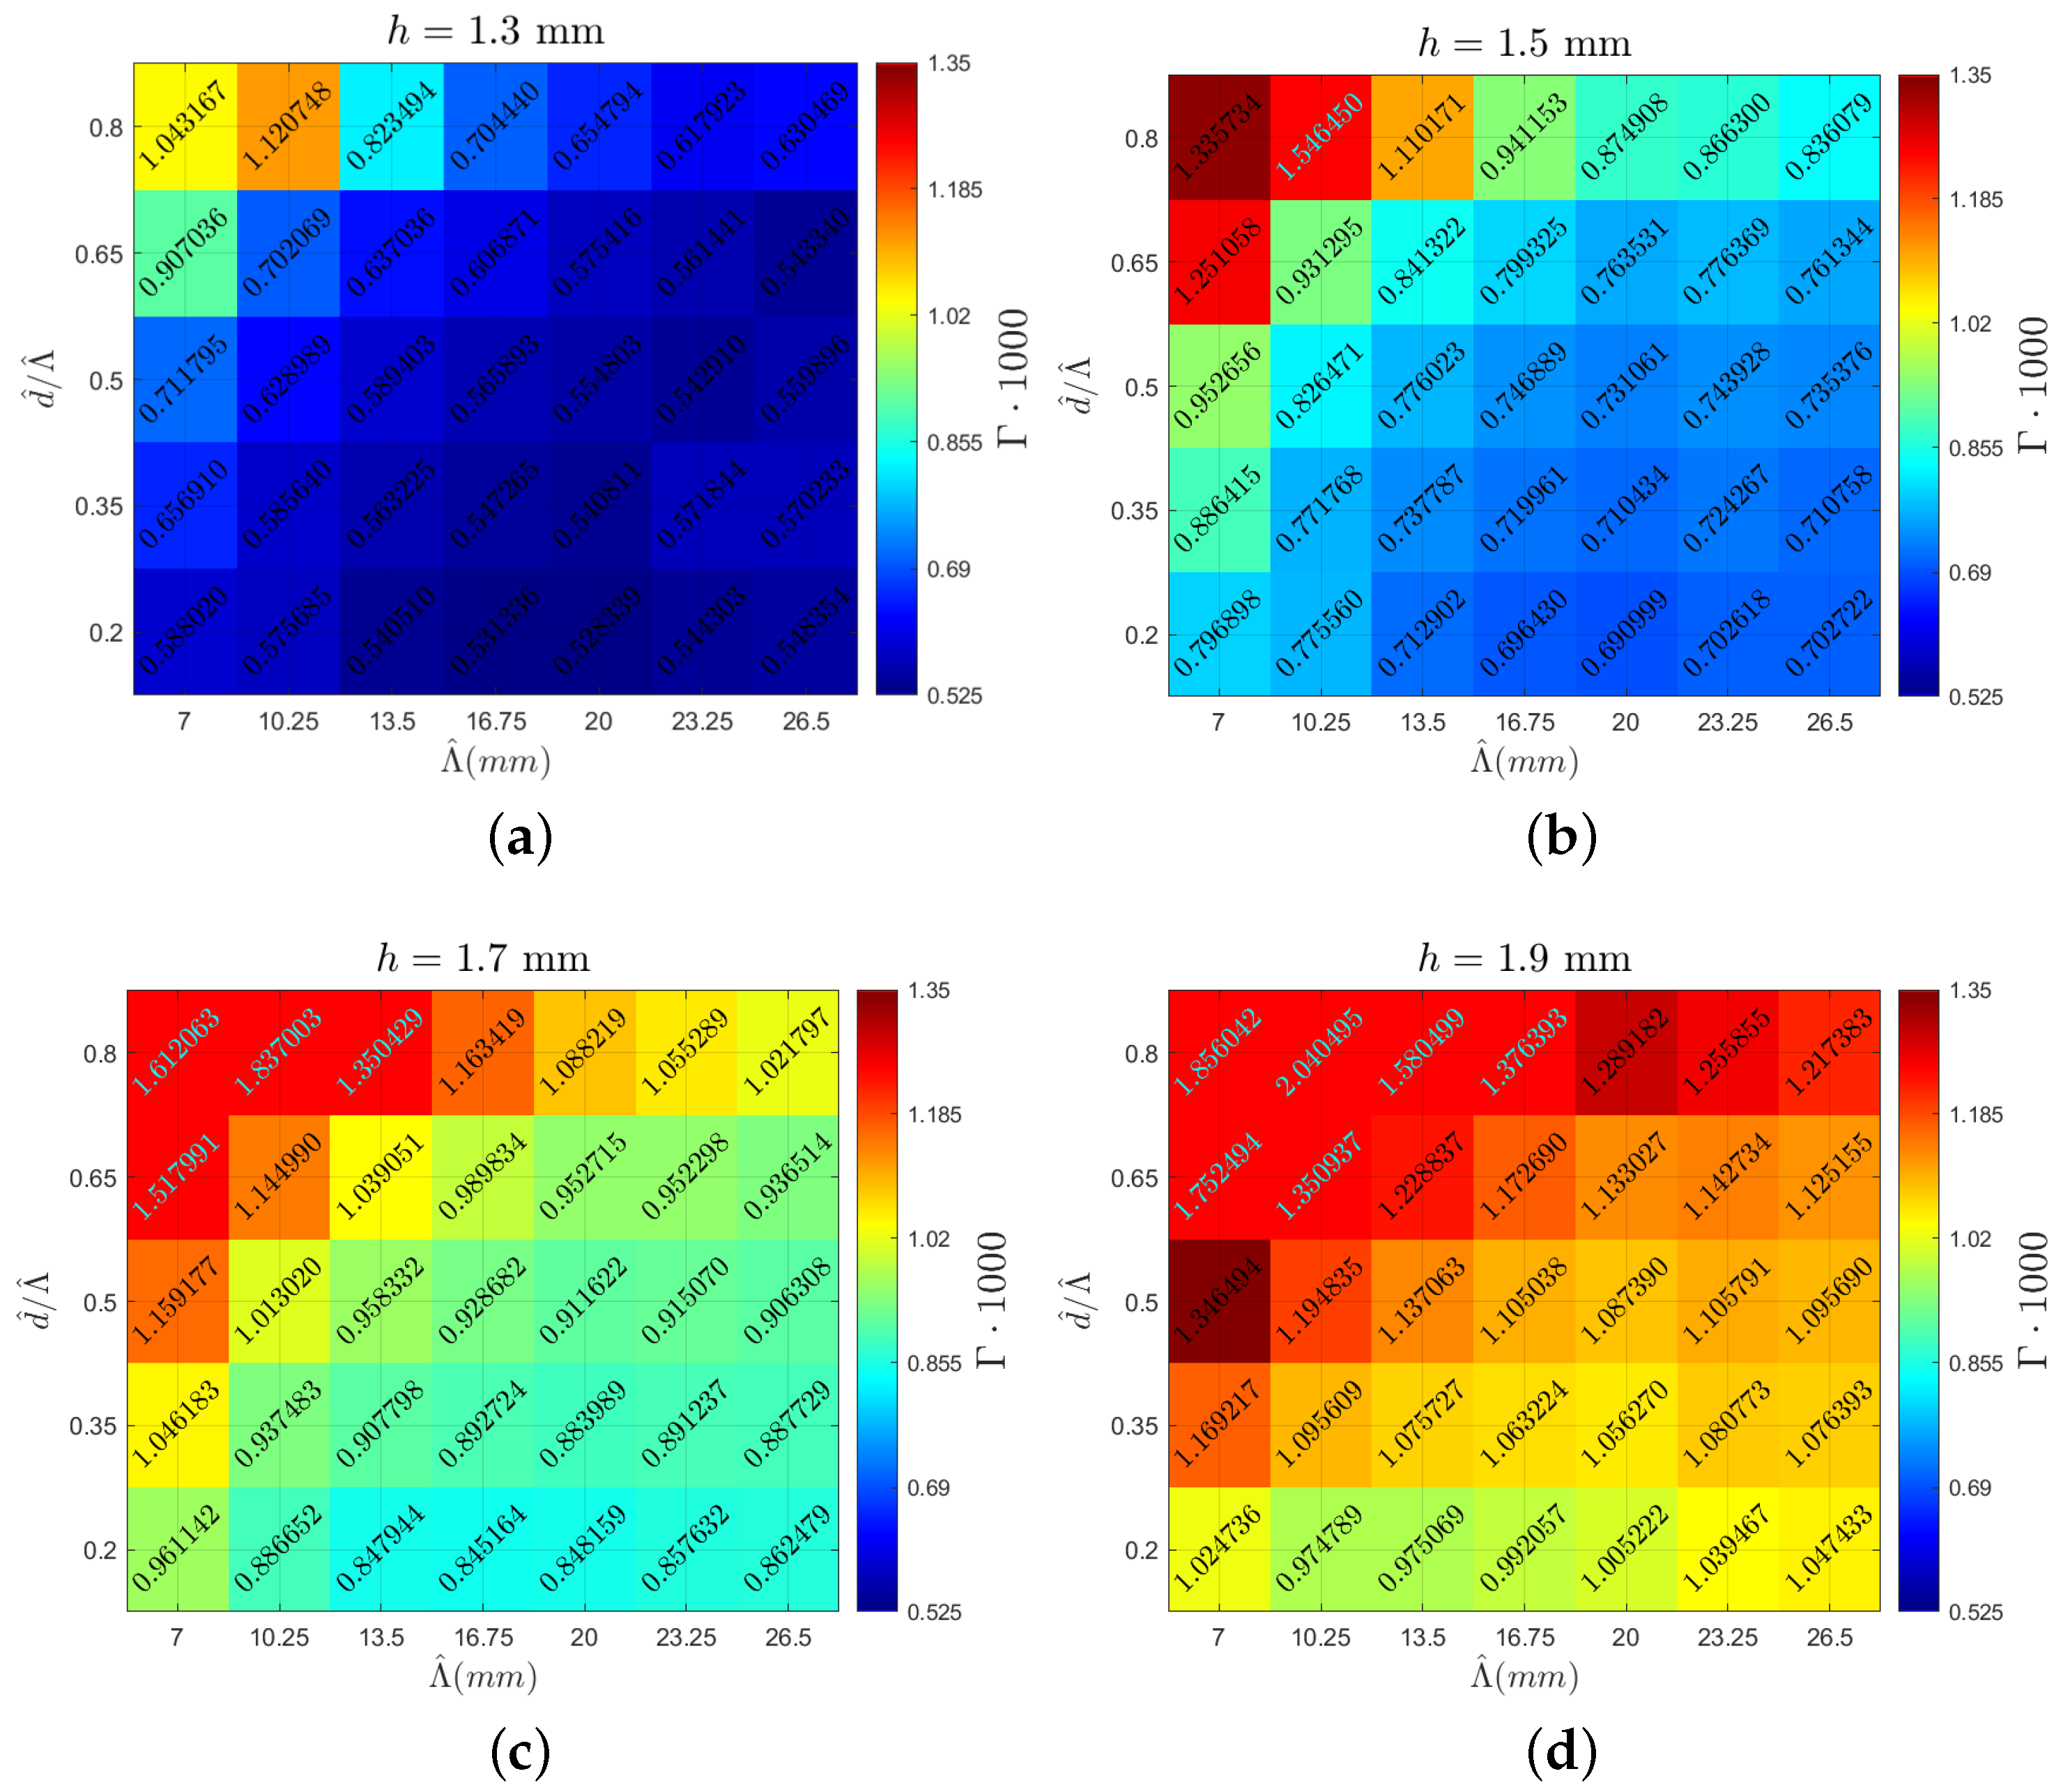
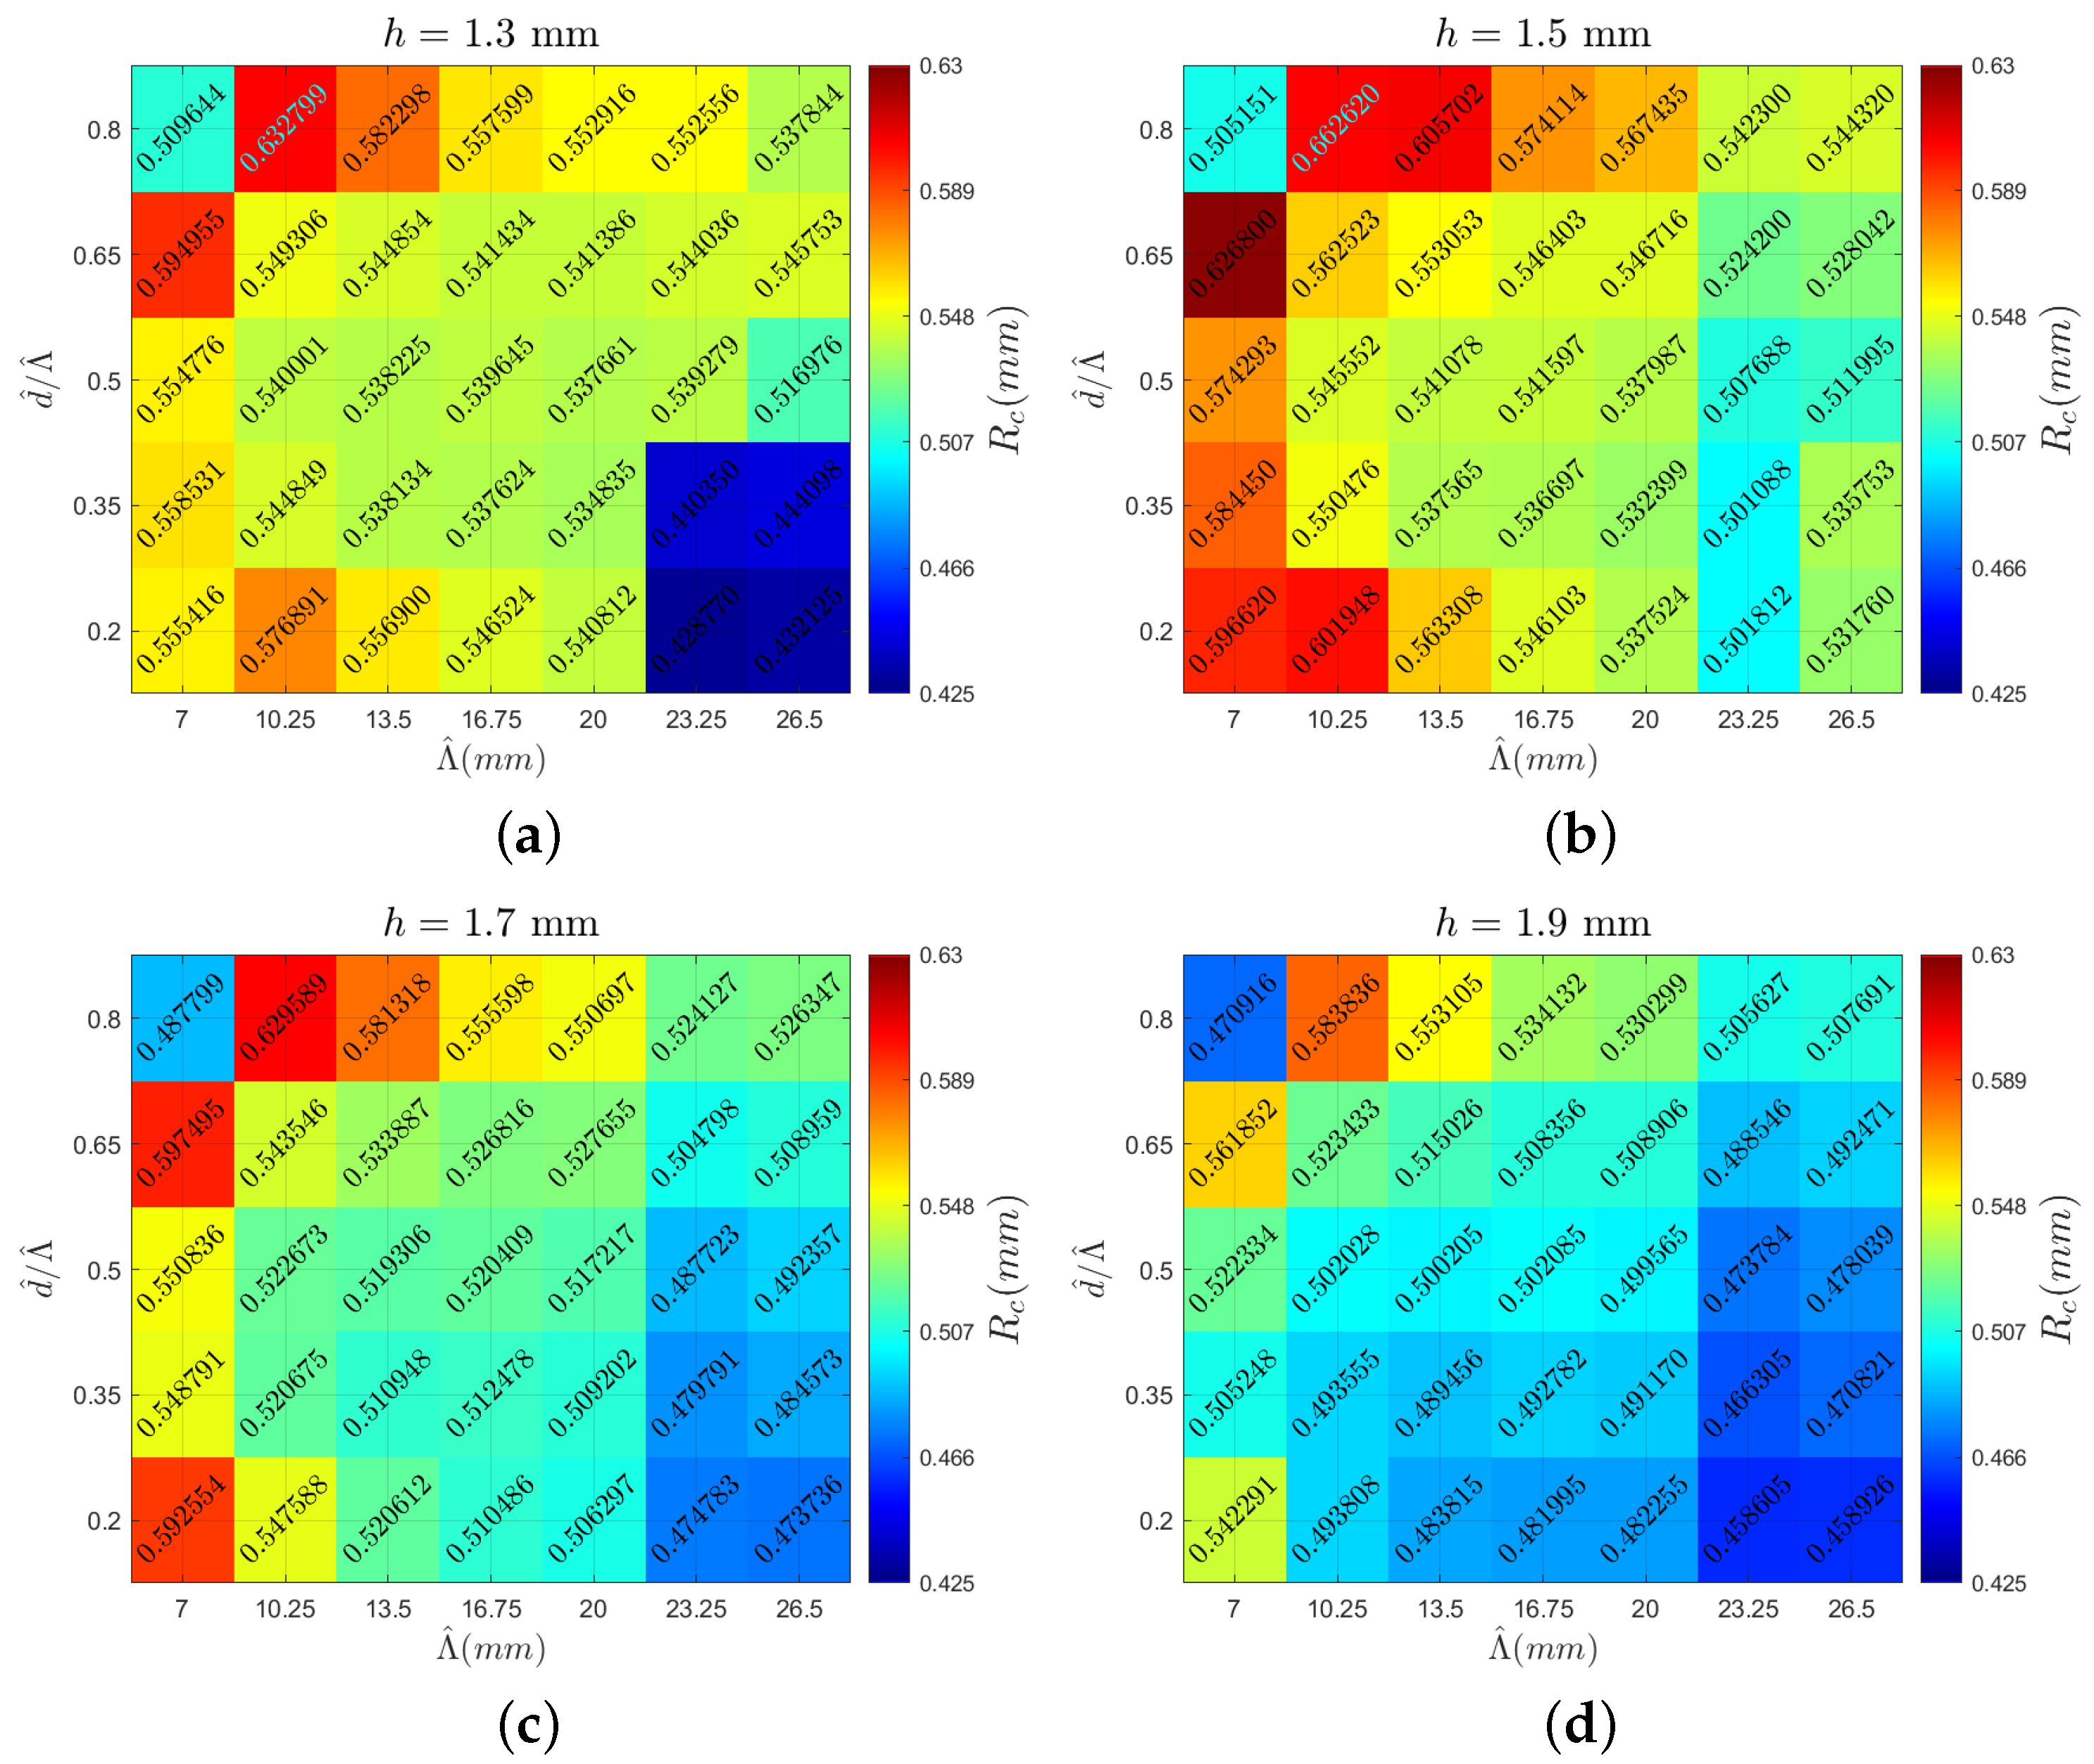
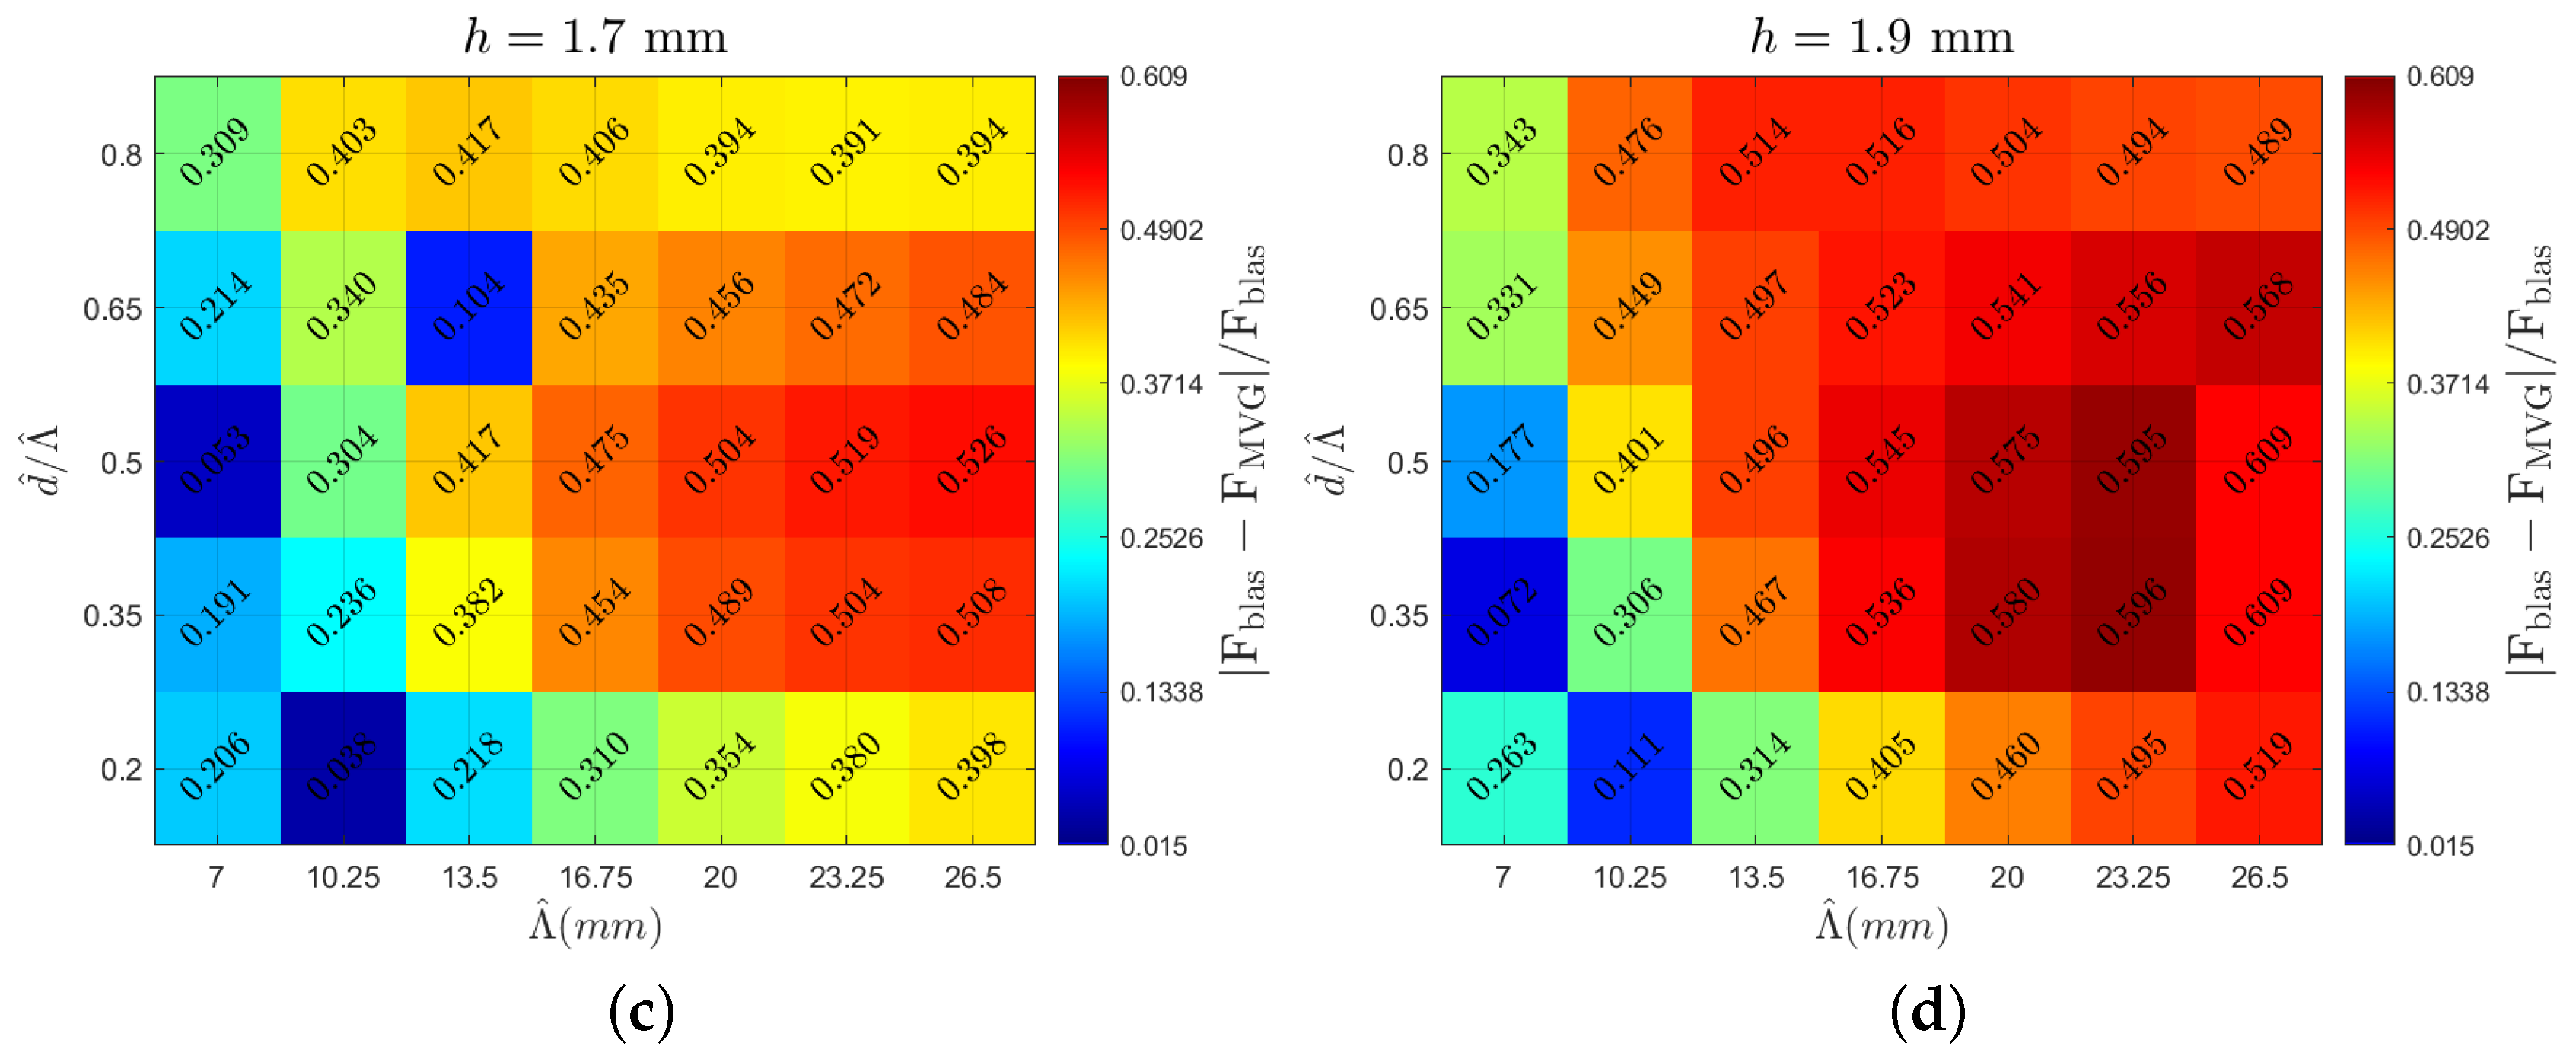
The following section presents the analyzed vortex parameters. The heatmaps are created with spanwise periodicity ( Λ ) on the horizontal axis and the ratio of inner distance d to Λ on the vertical axis. Each heatmap corresponds to a specific MVG height indicated at the top of the figure. This arrangement enables the visualization of various vortex characteristics, highlighting the local peaks and overall trends. Comparing different figures provides insights into how the examined parameters vary across different MVG heights. The color scale for each parameter remains consistent across all the cases. Figure 6 shows the circulation value (multiplied by 1000 for clarity) for all the cases, with a heatmap stretching from a circulation value of 5.25 × 10 4 in dark blue to 1.35 × 10 3 in dark red. The same color scale is used in all the heatmaps, with outliers outside this range denoted in light blue font. Figure 7 displays the vortex radius ( R c ), with the upper limit being 0.63 mm and the lower limit being 0.425 mm. Looking at the aspect ratio in Figure 8, the upper limits are −0.768 and the lower limits are −1.34. Lastly, the potential drag reduction is plotted in Figure 9. The drag reduction is quantified as a decrease in the force of a regular Blasius boundary layer to the flow field with MVGs present, and it is written as | F blas F MVG | / F blas . This is based on the stability calculations of Szabó et al. [11].

3.3. Drag Reduction Potential and Correlation Maps

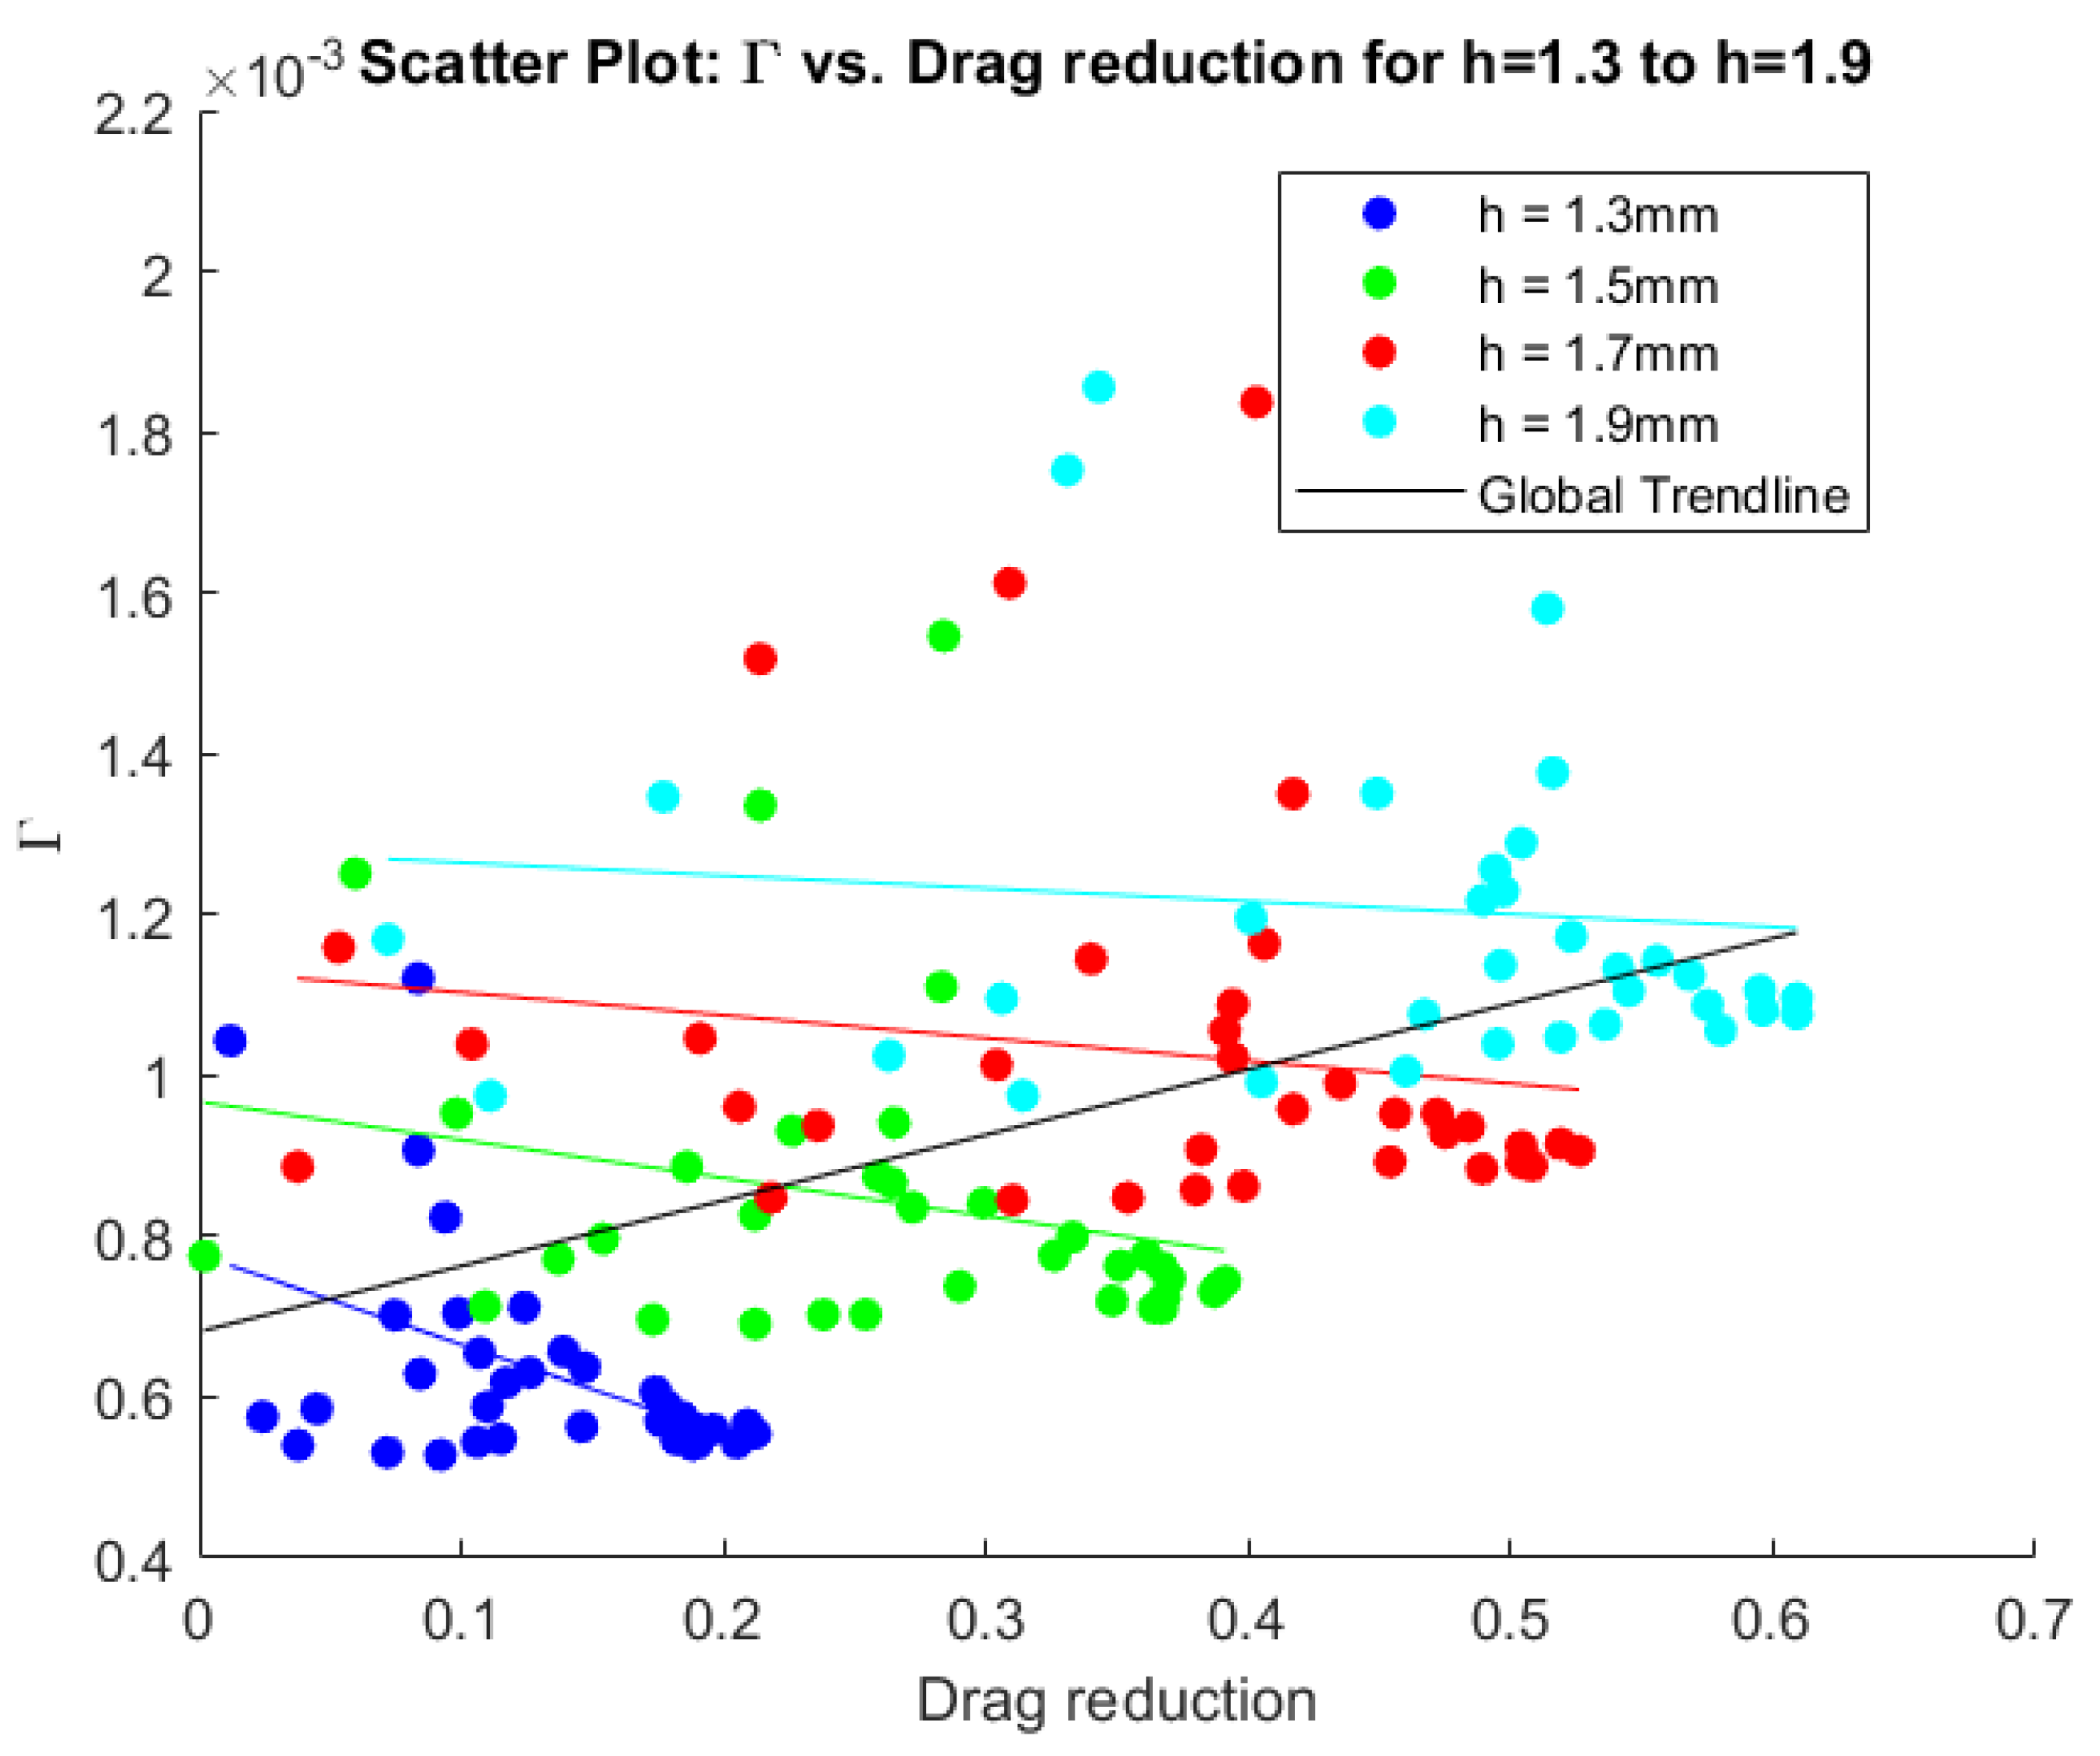
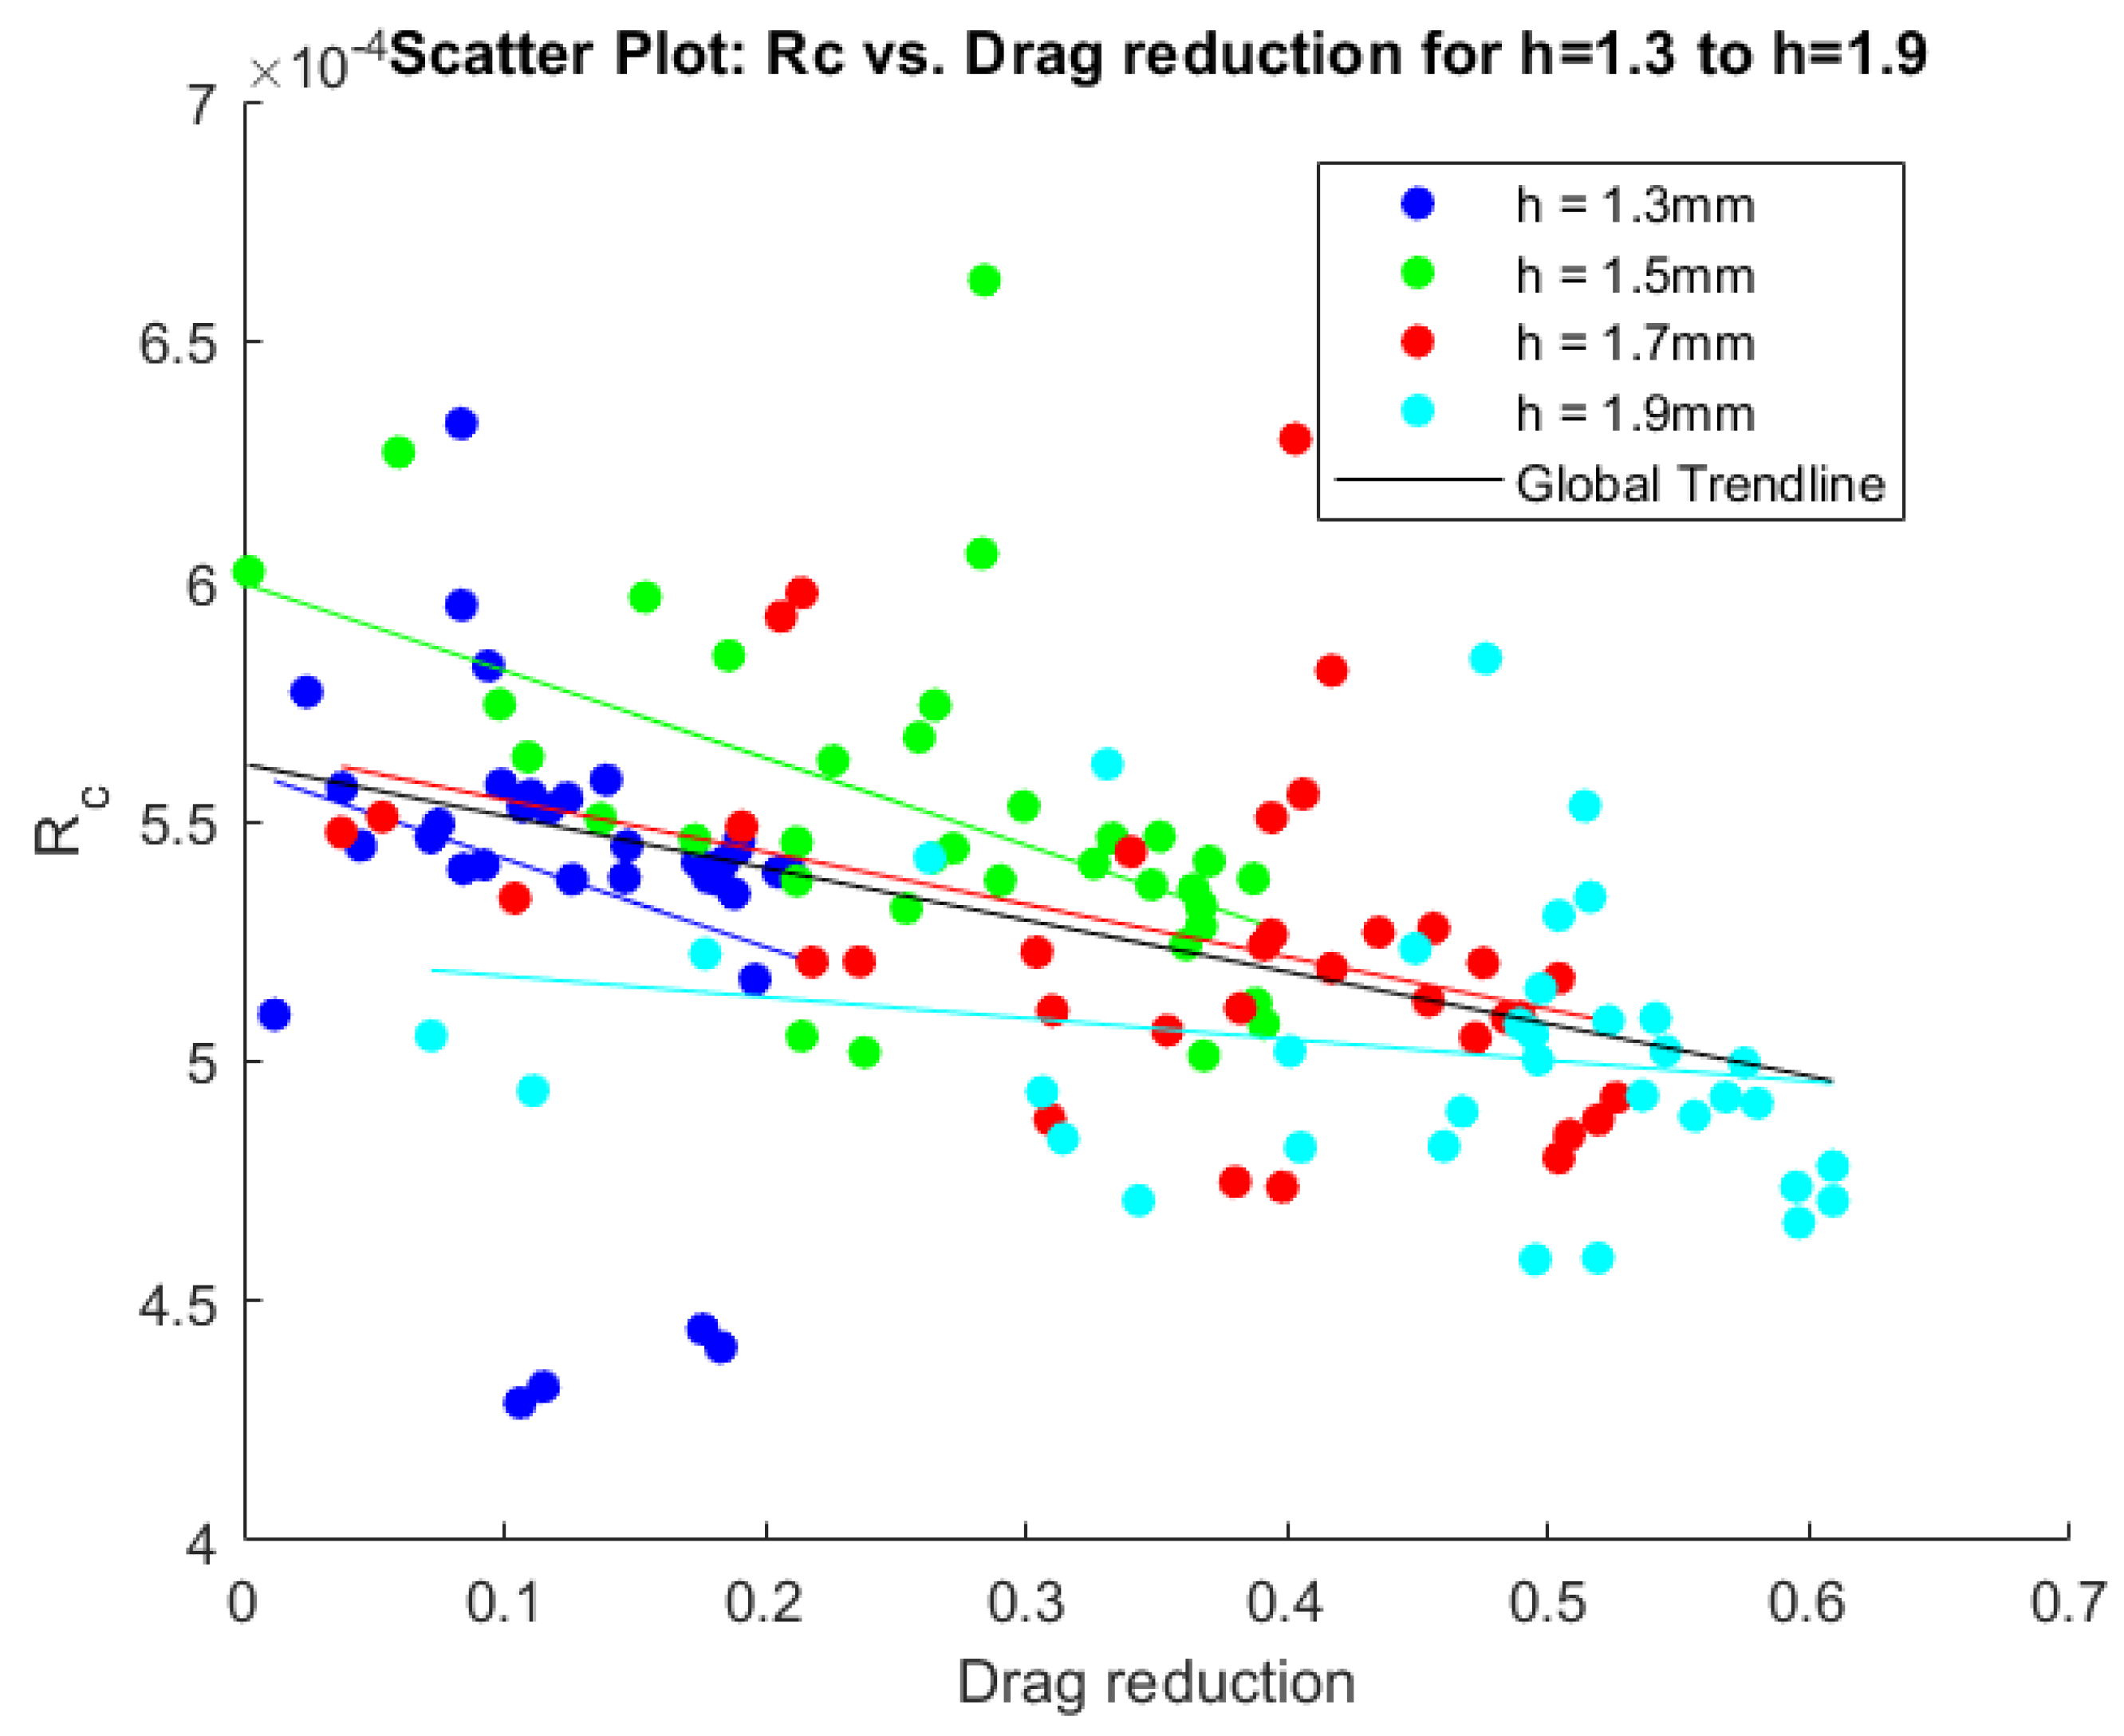
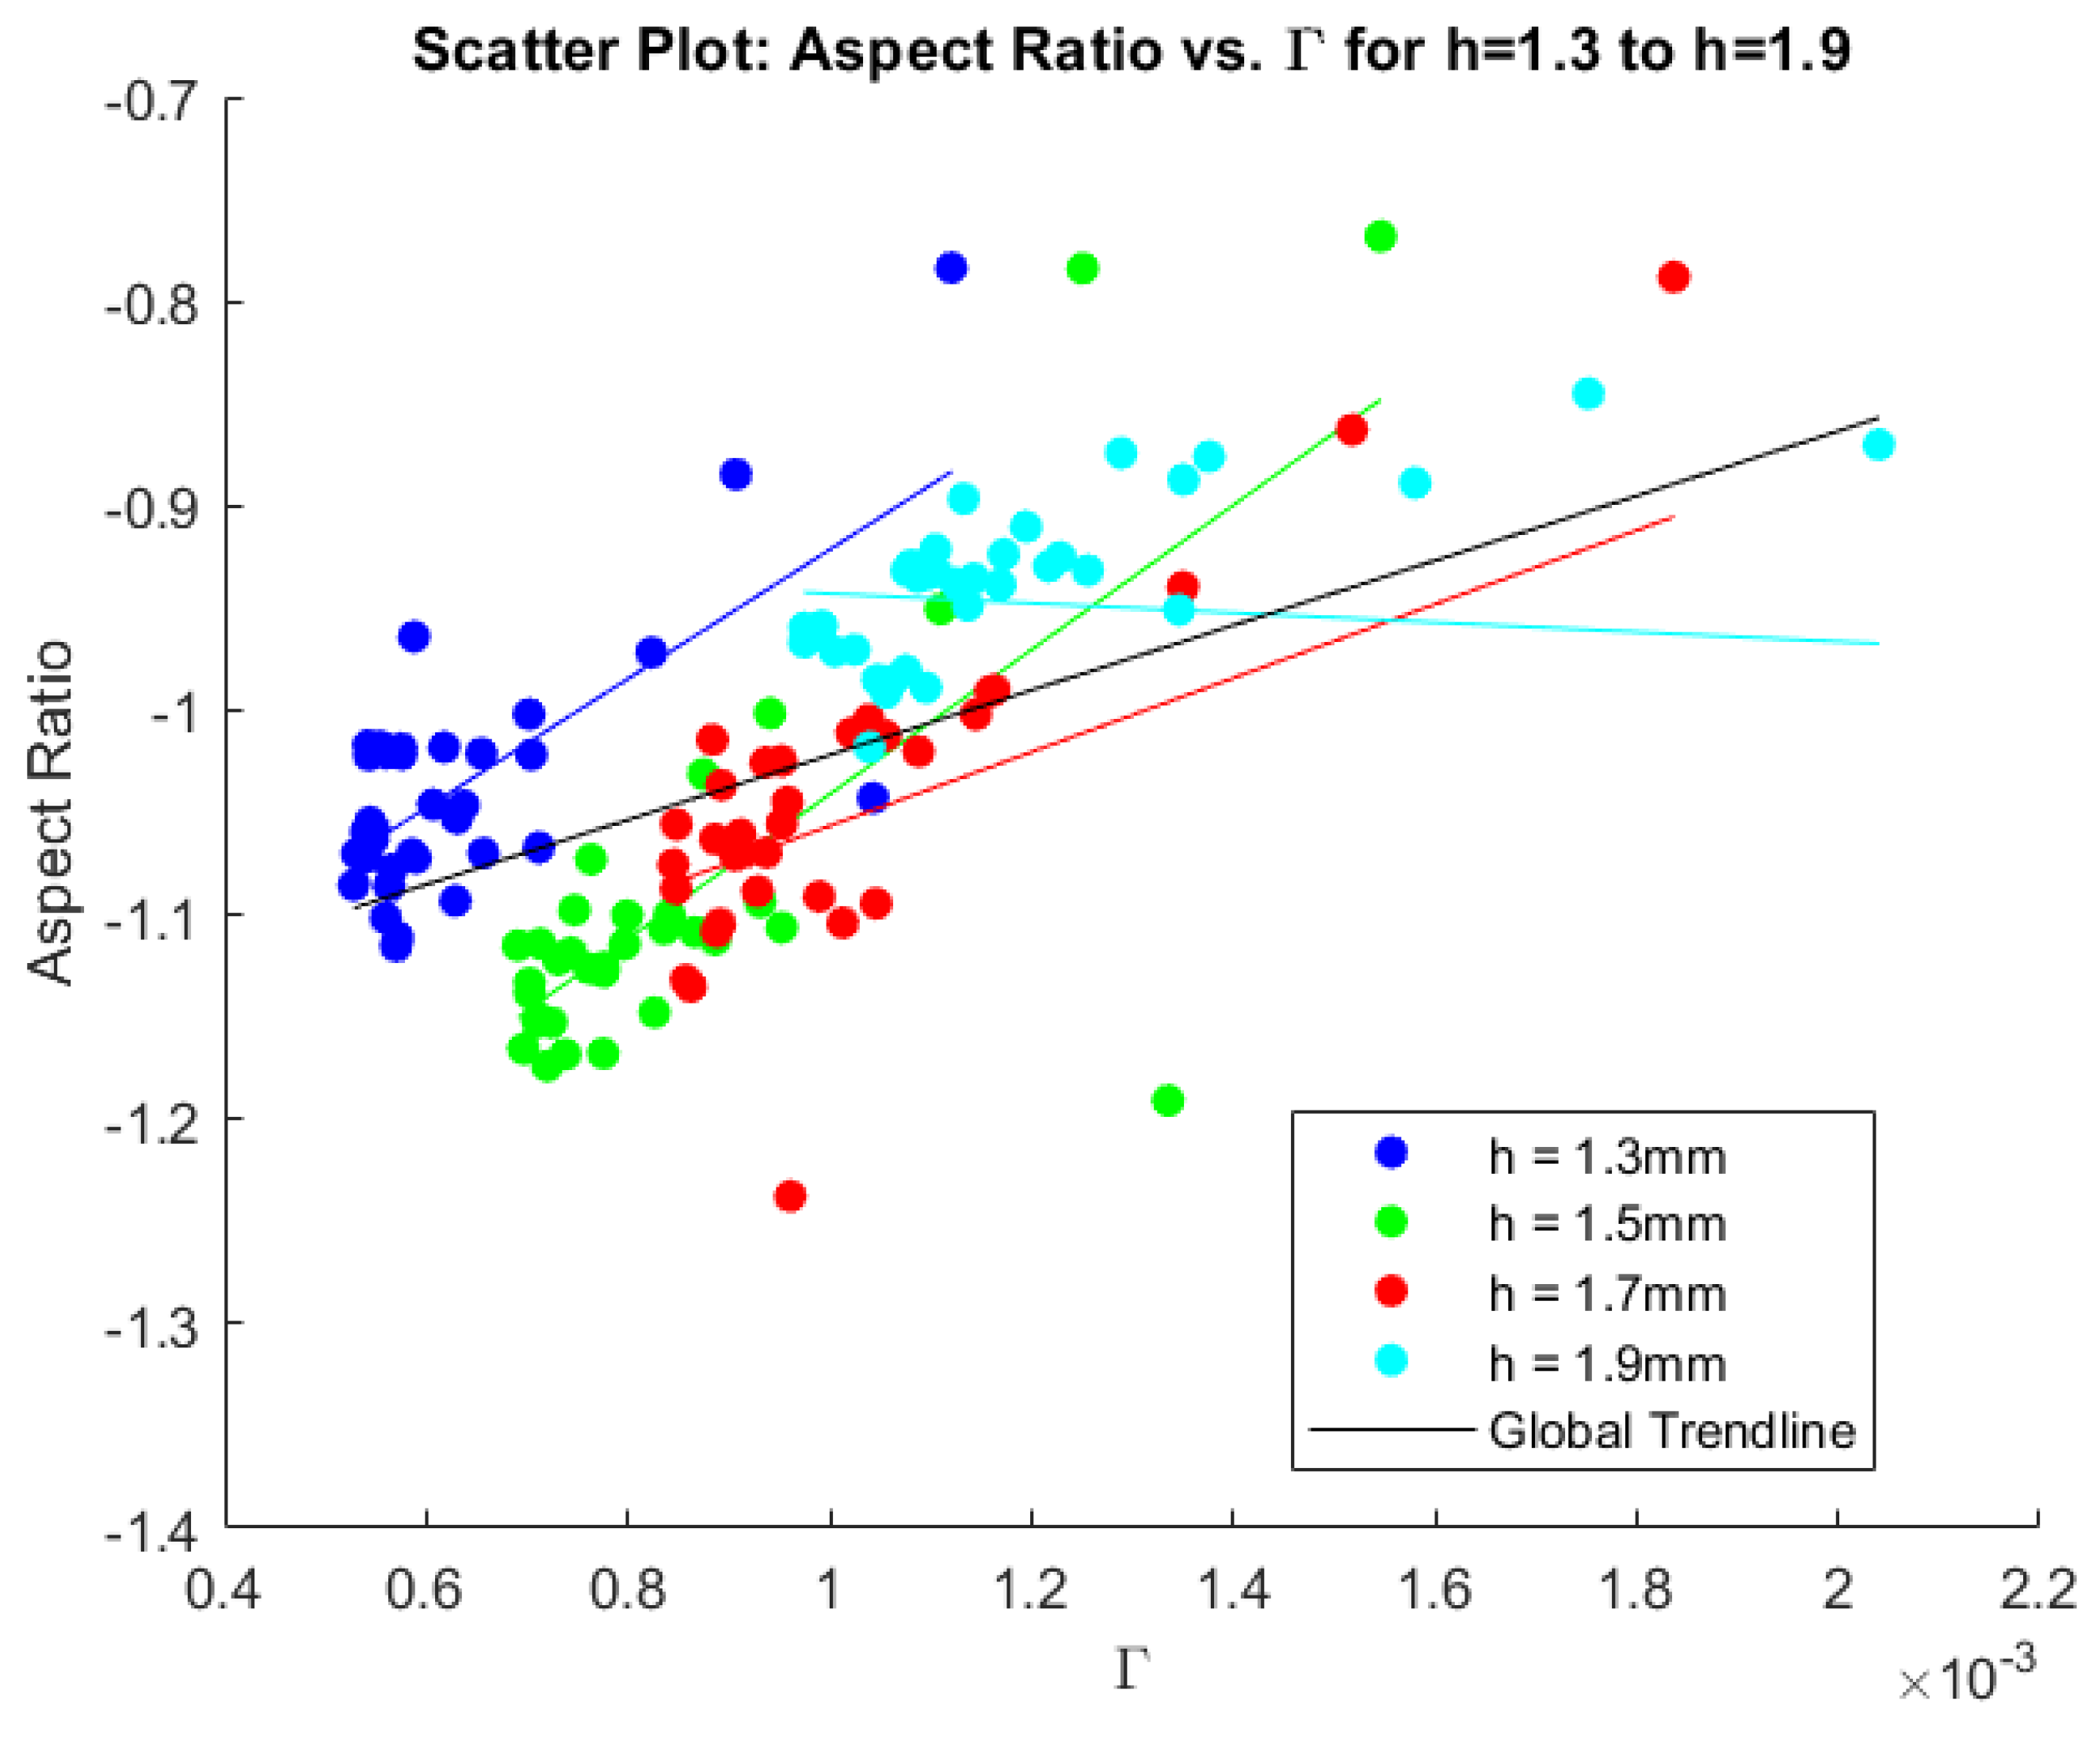
The following figures show the scatter plots of all the cases. Each height is displayed in a different color, with a trendline plotted for every height individually as well as a general trendline in black. Figure 10, Figure 11, and Figure 12 show, respectively, the circulation, vortex radius, and aspect ratio compared to the potential drag reduction. Figure 13 shows the aspect ratios compared to the circulation values.

3.4. Vortical Structure Analysis

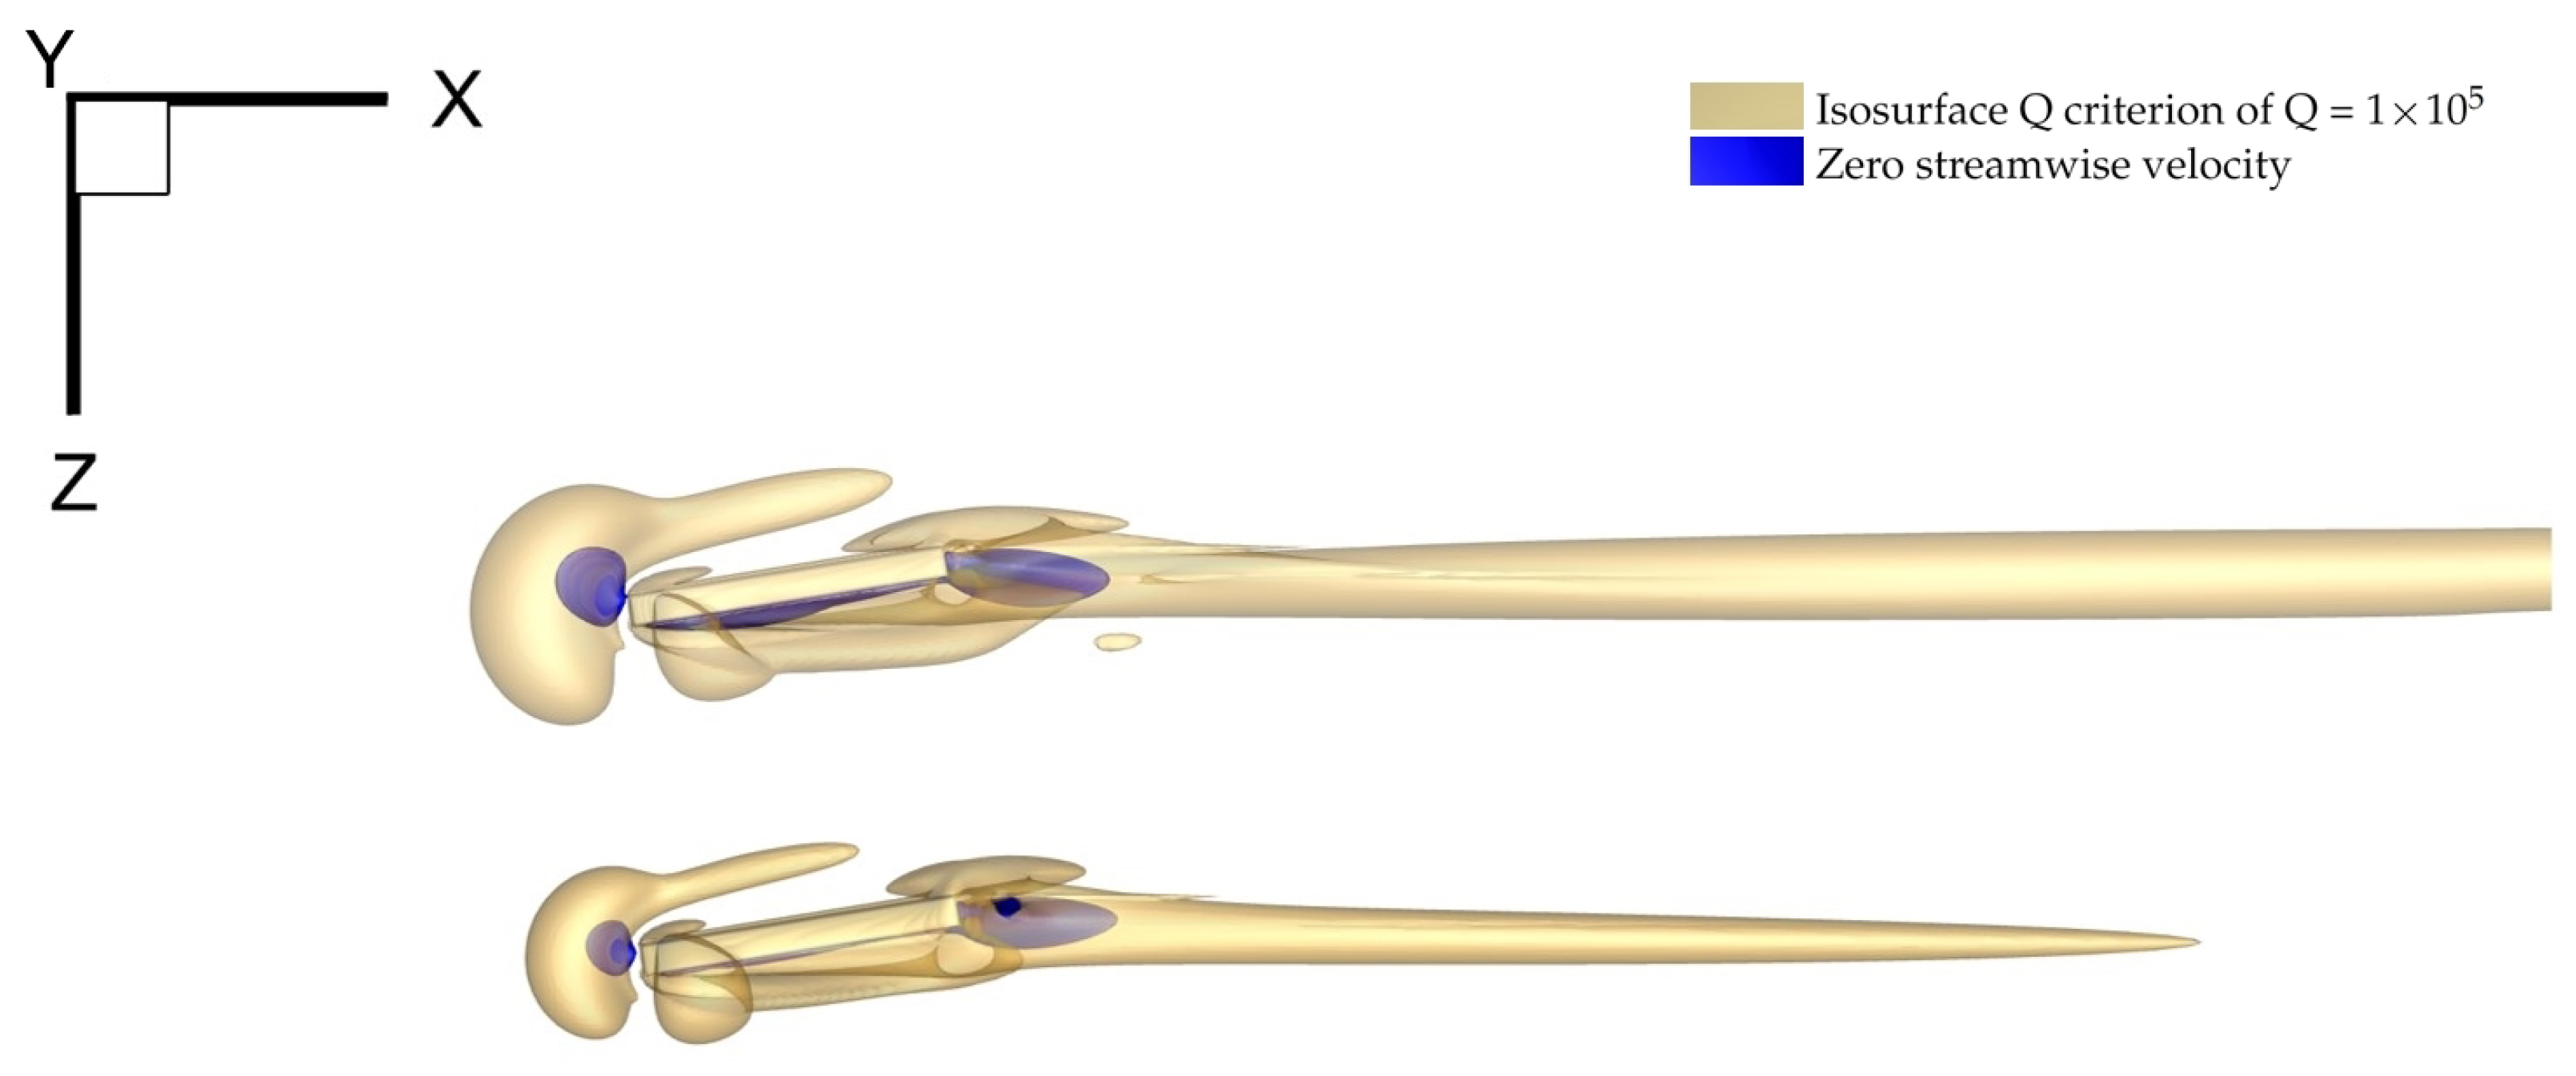
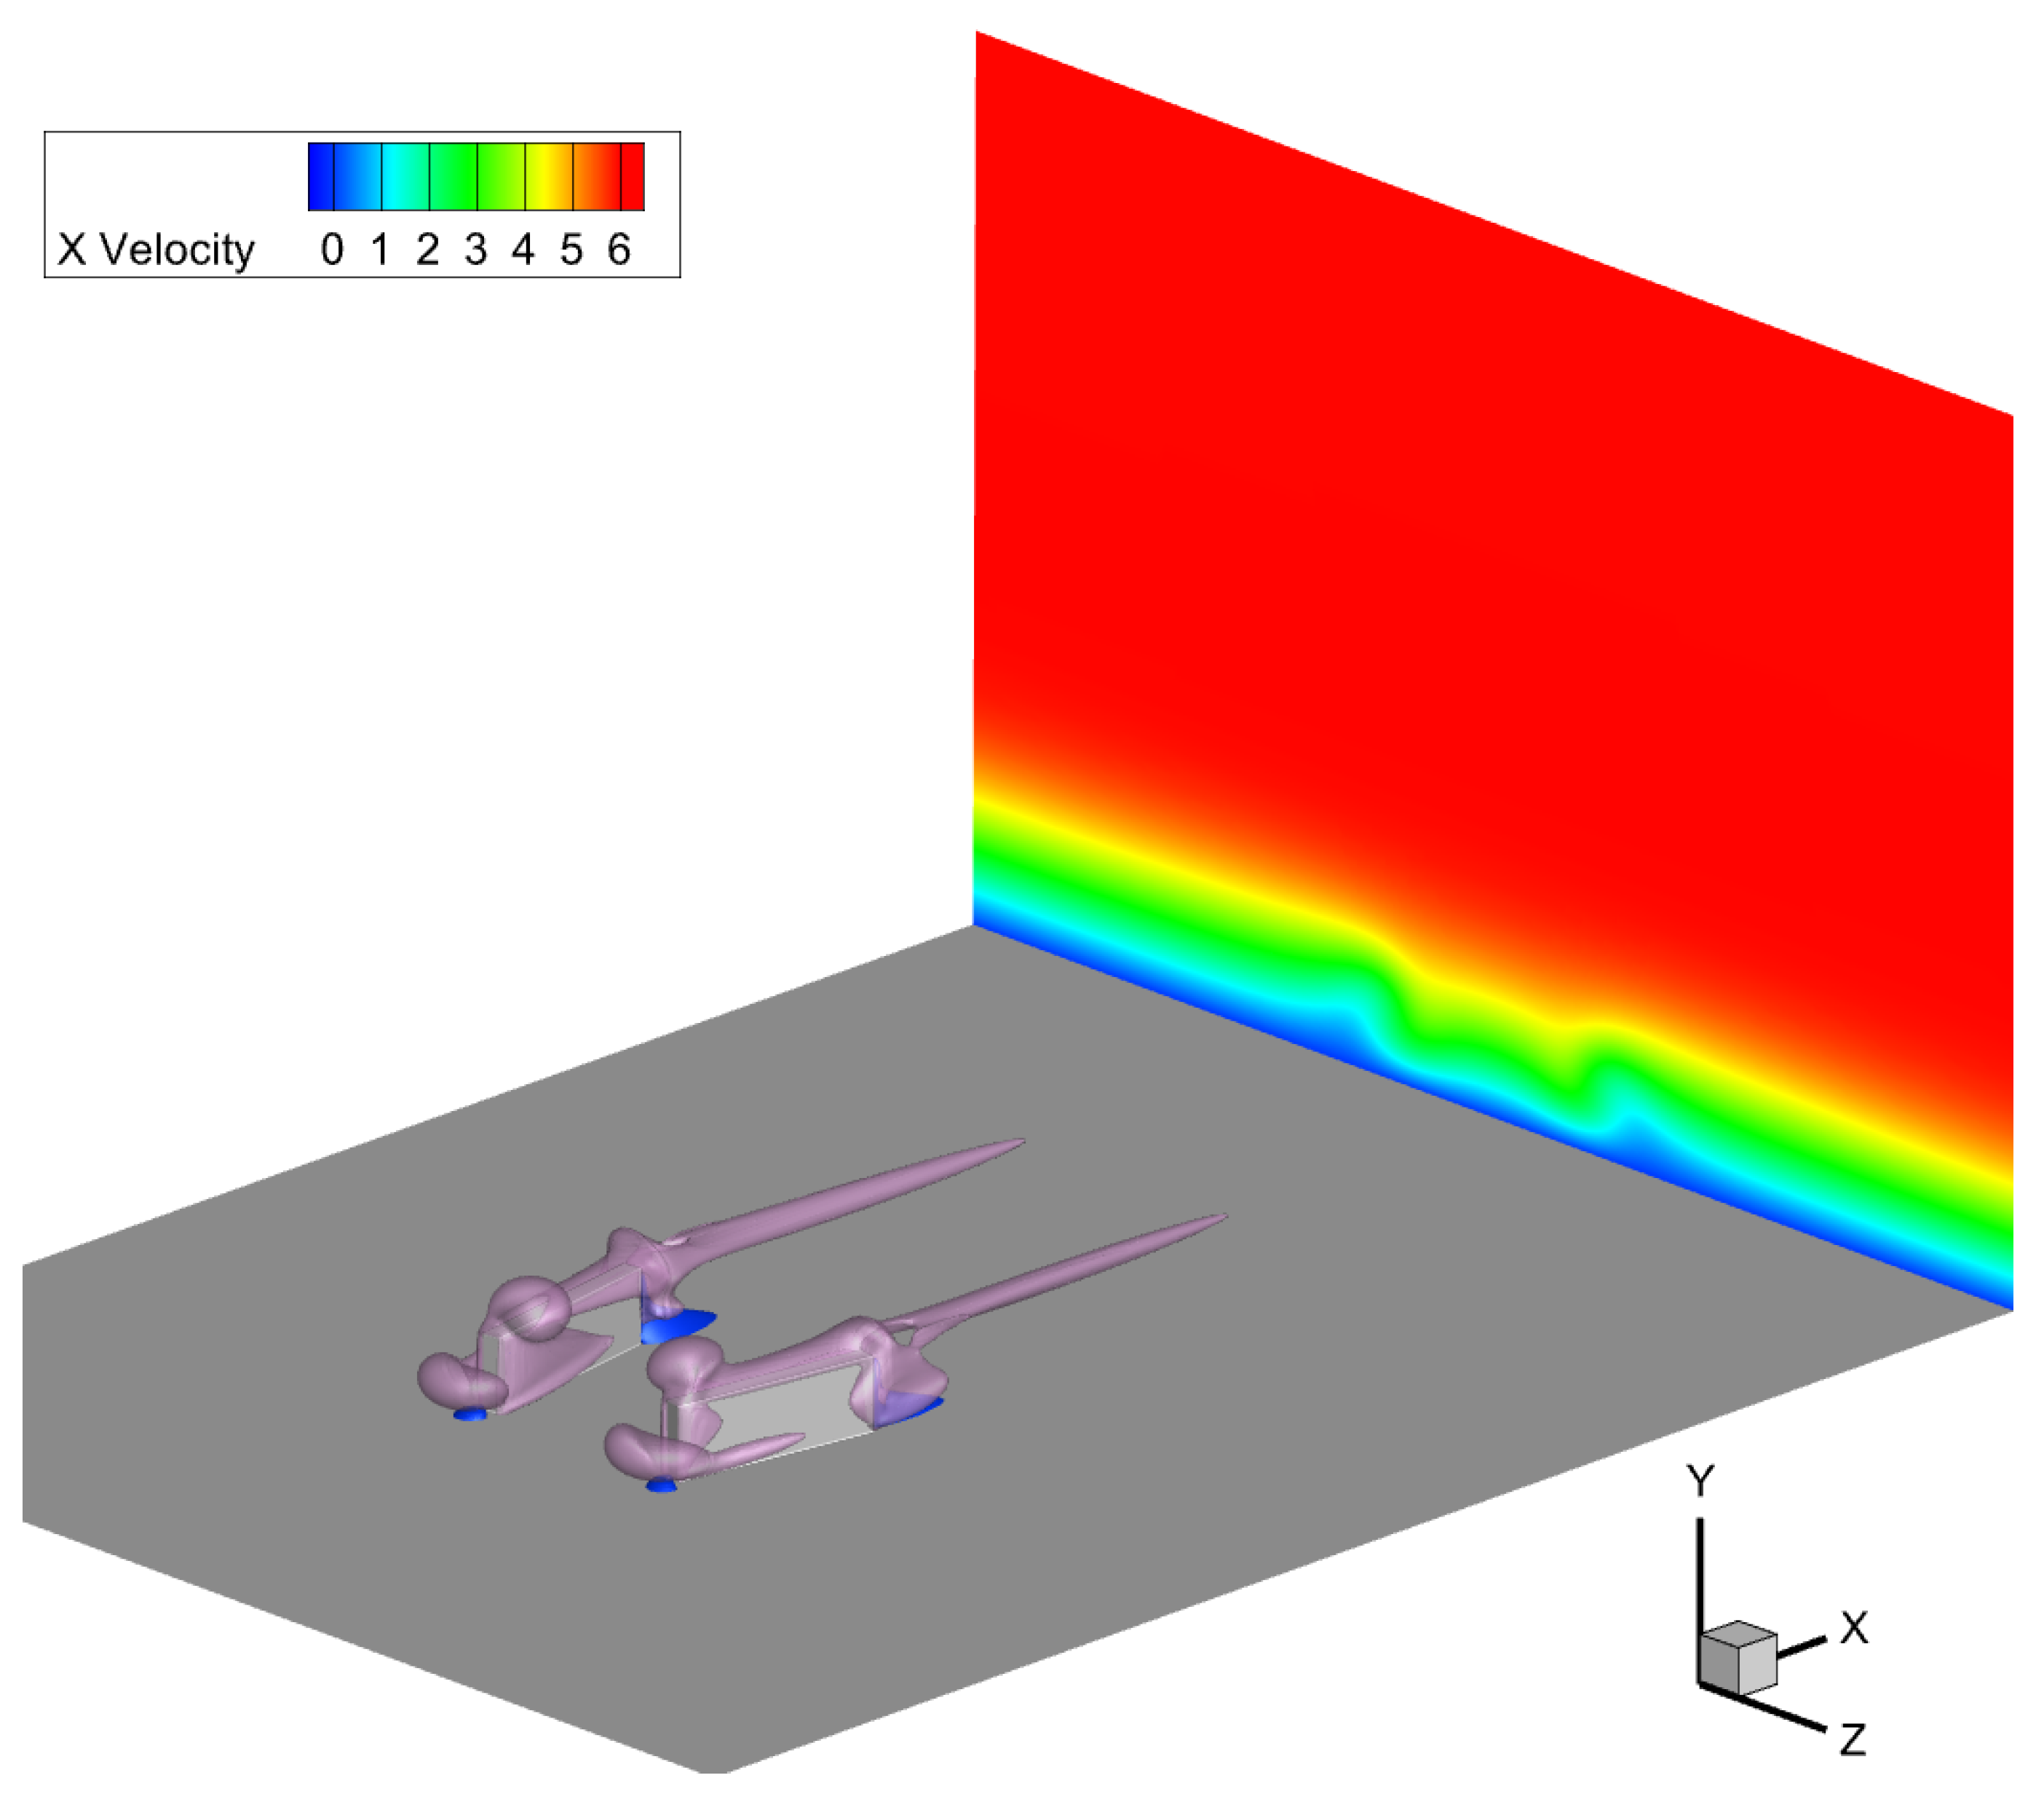
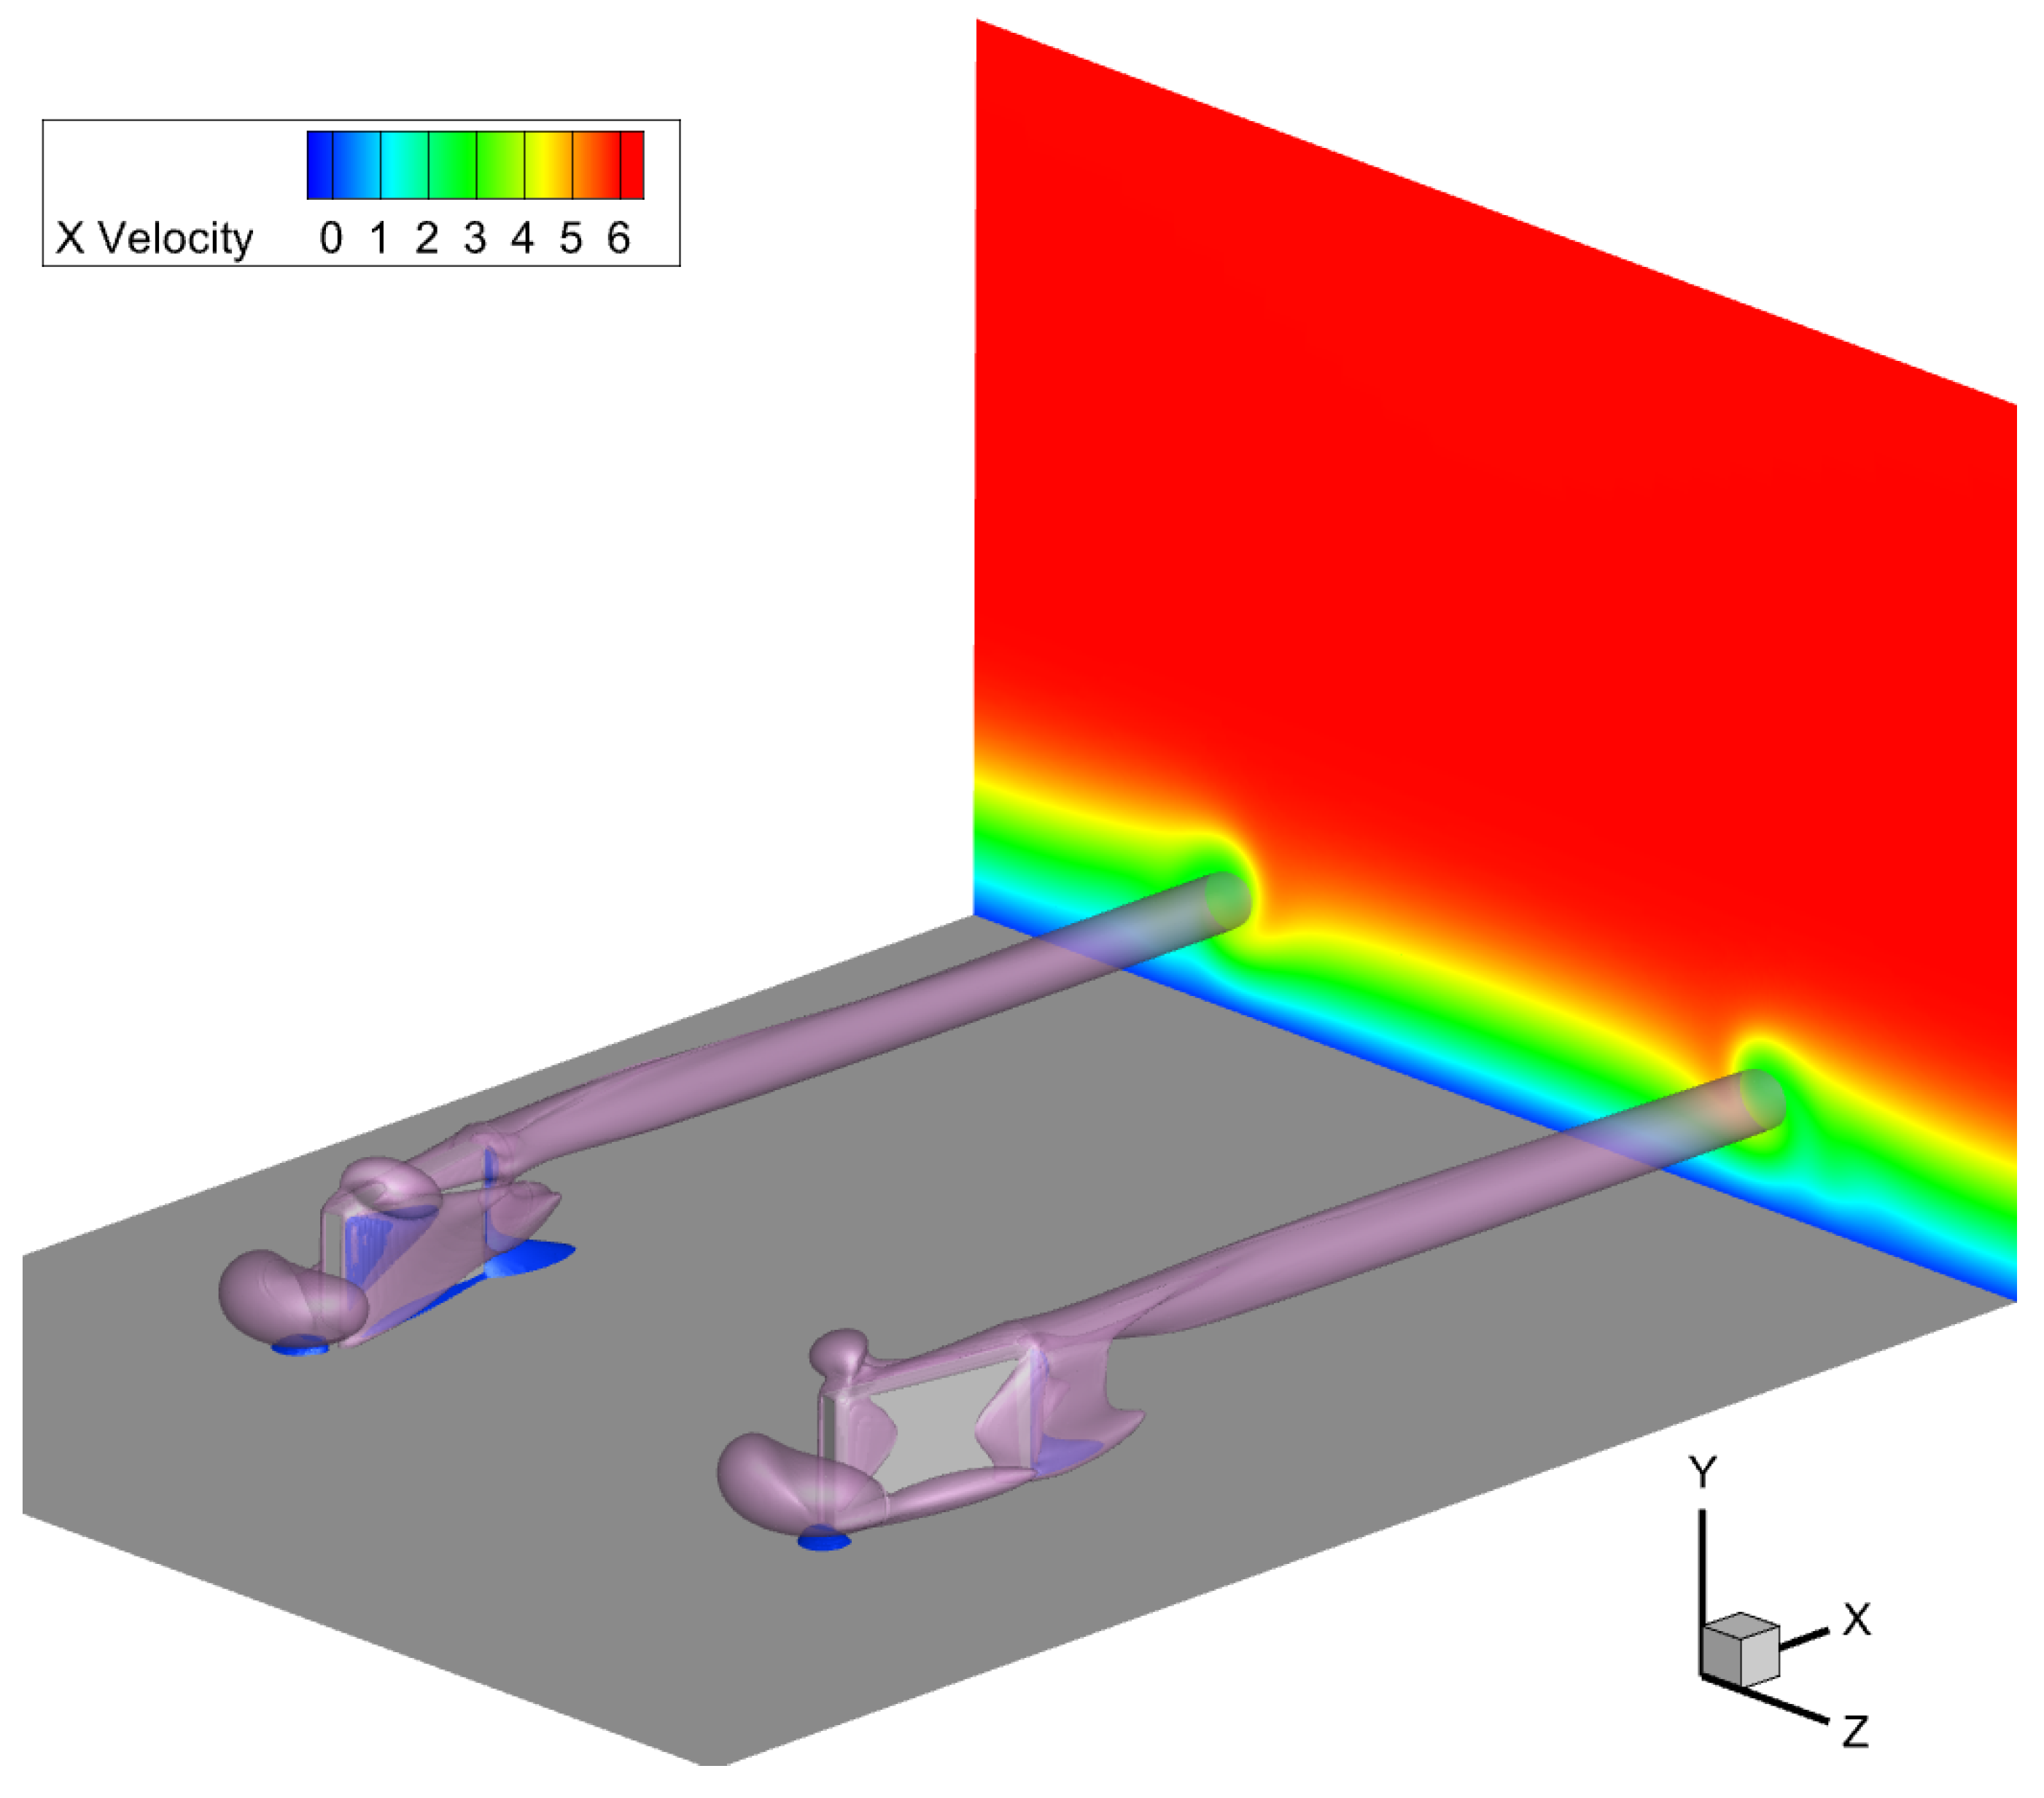
To visually represent the vortex strength in the near-field close to the MVG, a Q criterion analysis was conducted on all the cases. Figure 14 presents a comparison between two different cases. The top case exhibits a much more pronounced vortical structure compared to the bottom case. Additionally, isosurfaces denoting zero streamwise velocity are observed. Although these isosurfaces do not provide direct numerical values regarding the vortex size or strength, they offer a visual representation of these parameters, facilitating the linkage of the calculated vortex parameters to the physical flow structure. In Figure 15 and Figure 16, the cross-sectional planes clearly show the interaction and effect of the analyzed vortices on the boundary layer. The “lift-up” mechanism, as described in Section 1, is evident, and its strength varies depending on the MVG configuration. This visual analysis helps to better understand the relationship between the MVG design and its impact on the vortex behavior and boundary layer characteristics.

4. Discussion

In this section, we discuss the initial conclusions that can be deduced from the dataset and plots presented above.

4.1. Circulation ( Γ )

Examining the circulation values from Figure 10 reveals a distinct trend where the circulation increases significantly with a larger MVG height. This pattern is evident across all the simulations, which were conducted with a consistent boundary layer height. As the height of the MVG increases, a larger portion of it is situated in the faster-moving region of the boundary layer. This interaction with the higher-velocity flow increases the circulation value, leading to this trend. This relationship underscores the influence of the MVG height on the vortex characteristics within the boundary layer.
When examining the trends for the same MVG height, as observed in the heatmaps of Figure 6, a peak is observed at lower lambda values and higher d over Λ values. This indicates that, as the inner distance of the MVG pair increases, the circulation also increases, whereas the opposite is true for the periodicity values. Additionally, a link can be made to the results of Szabó et al. [11], where N factors are calculated. In short, the N factor essentially indicates the premature transition from laminar to turbulent flow. There is a strong correlation between circulation and the N factor. The reason for this is that a stronger vortex generates greater shear stresses in the boundary layer, which can accelerate flow destabilization. Furthermore, comparing the circulation values to the potential drag reduction downstream reveals a trend where higher drag reduction corresponds to higher circulation values, with a global Pearson correlation coefficient of 0.45. This is without taking out any outliers, which would show an even stronger correlation. However, no clear trend is observed within the same MVG height, suggesting that circulation is not the primary factor in drag reduction. This presents an interesting dilemma as circulation is crucial for assessing the potential flow destabilization. Consequently, there is a limit to increasing the height of the MVGs concerning the impact on circulation and flow stability. Understanding these relationships is essential for optimizing the MVG design to balance drag reduction and flow stability.

4.2. Aspect Ratio

As described in Section 2.3, the shape of the vortex is analyzed by means of an “aspect ratio”, meaning the distance between the vortex’s velocity profile peaks in the horizontal and vertical directions. Figure 17 shows an example of a strong asymmetrical vortex, how the vortex velocity profile looks in both directions, and how this is visible on the vector plot, as shown in Figure 3. The plots of Figure 12 reveal a trend where the absolute value of the aspect ratio decreases from above 1 to below 1 as the MVG height increases, indicating a change in the vortex shape with increasing MVG height. The aspect ratio is defined as the distance between the peaks in the Y direction over the distance between the peaks in the Z direction. This means that a low aspect ratio corresponds to a flatter elliptical shape of the maximum velocity contours, while a higher aspect ratio indicates a more elongated (vertical) shape. Thus, increasing the MVG height results in a “flattening” of the vortex. The main reason for this can also be found in the velocity profiles themselves as we see that the influence of the wall is far greater for lower MVG pairs.
As can be seen in Figure 8, for a given MVG height, a greater spread between the MVG pairs (higher periodicity) generally leads to lower aspect ratios, likely due to the reduced influence of the adjacent MVG pairs. Placing single MVGs closer together tends to create flatter vortices as the aspect ratio decreases with a higher inner distance over the periodicity values. There does not appear to be a strong correlation between the aspect ratio and drag reduction, as shown in Figure 12, again indicating that this is not a crucial factor in optimal streak creation. Here, a correlation coefficient of 0.23 is only achieved. However, a clear trend emerges when comparing the aspect ratios to the circulation values, shown in Figure 13, where a stronger global correlation coefficient of 0.49 is found. A lower aspect ratio, indicating a flatter vortex, corresponds to a higher circulation value. This observation aligns with the previously described analysis of the circulation trends.

4.3. Vortex Radius ( R c )

Interestingly, when examining the vortex radius for different MVG heights, the data show that the radius generally decreases as the MVG height increases, as shown in Figure 11, indicating a more concentrated vortex core. Low periodicity values are a significant factor in increasing the vortex radius. Both effects are related to the previously described influence of the wall as well as the adjacent vortex pairs on the vortex velocity profile. When vortex pairs are very close together, the velocity peaks shift, increasing the vortex diameter, showcased in Figure 7. Considering both the asymmetry and radius values is crucial as the Batchelor vortex fit assumes an axisymmetric vortex and does not account for strong asymmetrical effects. This limitation can result in outliers, particularly at the edges of the investigated domain. One of these outliers is analyzed in Figure 17, where the high asymmetry also results in an R c value that does not follow the general trend, meaning that the asymmetry plays a large role for these outlier cases. A clear correlation exists between the vortex radius and drag reduction: a lower radius tends to be more effective in achieving larger downstream drag reduction. The vortex radius significantly influences the streak generation and amplitude, which are critical factors in the attenuation of TS waves.

5. Conclusions

In conclusion, this study on the effect of Miniature Vortex Generators (MVGs) on boundary layer flows provided significant insights into the possible changed MVG parameters and their effect on the downstream drag reduction, as well as the effect on the characteristics of the vortices themselves. This analysis of the vortex behavior shows the critical role of optimizing MVG configurations to achieve the desired transition delay for drag reduction purposes. The key takeaway points can be summarized as follows:
The MVG height compared to the boundary layer height is one of the most important parameters, with notable changes in the vortex characteristics observed for these different heights. Specifically, an increased MVG height leads to a higher circulation and a reduction in the vortex radius (Rc) whilst also “flattening” the vortex, meaning it has the tendency to be longer in the spanwise direction compared to the vertical direction. The elevated circulation values associated with higher MVGs also correlate with an increased risk of a premature transition from laminar to turbulent flow due to the stronger vortices inducing higher shear stresses in the boundary layer, possibly destabilizing the flow. An optimal MVG height must thus be determined to balance performance and stability. While higher MVGs generally demonstrate improved performance in terms of delaying the transition and reducing the drag, they also exhibit higher circulation values. This increase in circulation makes the boundary layer more susceptible to bypass transition, which can negate the benefits of using MVGs. Therefore, a careful balance must be struck to maximize the aerodynamic advantages while minimizing the risk of unintended transition. Among the parameters studied, the vortex radius ( R c ) emerged as the most crucial factor in achieving drag reduction. The correlation between R c and drag reduction underscores the importance of managing the vortex size to optimize the aerodynamic efficiency.
In summary, the study underscores the complexity of optimizing the MVG parameters to achieve the desired aerodynamic outcomes. The interplay between MVG height, circulation, vortex shape, and transition risk necessitates a nuanced approach to the design and implementation. Looking at the vortex characteristics themselves paves the way to defining a more optimized strategy in terms of changing the MVG parameters. Now, an innovation is presented in this field: instead of changing the physical parameters and having to conduct a stability analysis, one can look at the desired vortex characteristics and change the MVG parameters to suit this. Future research should look further into these (and possibly more) vortex characteristics and could also extend the currently analyzed parameter range. The insights gained from this investigation provide a valuable foundation for further advancements in boundary layer control and aerodynamic optimization.

Author Contributions

Conceptualization, G.D.B. and M.V.; methodology, G.D.B., A.S., P.T.N., G.P. and M.V.; software, G.D.B., A.S., P.T.N. and M.V.; validation, G.D.B., A.S., P.T.N., G.P. and M.V.; formal analysis, G.D.B.; investigation, G.D.B.; resources, A.S., P.T.N. and M.V.; data curation, G.D.B. and M.V.; writing—original draft preparation, G.D.B.; writing—review and editing, G.D.B., A.S., P.T.N. and M.V.; visualization, G.D.B.; supervision, M.V.; project administration, G.P. and M.V.; funding acquisition, G.P. and M.V. All authors have read and agreed to the published version of the manuscript.

Funding

The authors gratefully acknowledge the funding of this research under the Celsa framework by grant No. CELSA/21/024.

Institutional Review Board Statement

Not applicable.

Informed Consent Statement

Not applicable.

Data Availability Statement

The data presented in this study are available on request from the corresponding author. The data are not publicly available due to privacy.

Conflicts of Interest

The authors declare no conflicts of interest.

References

  1. Li, L.; Xu, P.; Xu, W.; Lu, B.; Wang, C.; Tan, D. Multi-field coupling vibration patterns of the multiphase sink vortex and distortion recognition method. Mech. Syst. Signal Process. 2024, 219, 111624. [Google Scholar] [CrossRef]
  2. Morkovin, M.V. On the Many Faces of Transition. In Viscous Drag Reduction; Wells, C.S., Ed.; Springer: Boston, MA, USA, 1969; pp. 1–31. [Google Scholar]
  3. Reshotko, E. Transient growth: A factor in bypass transition. Phys. Fluids 2001, 13, 1067–1075. [Google Scholar] [CrossRef]
  4. Tollmien, W. Über die Entstehung der Turbulenz. 1. Mitteilung. Nachrichten Von Der Ges. Der Wiss. Göttingen Math.-Phys. Kl. 1928, 1929, 21–44. [Google Scholar]
  5. Kachanov, Y.S. Physical Mechanisms of Laminar-Boundary-Layer Transition. Annu. Rev. Fluid Mech. 1994, 26, 411–482. [Google Scholar] [CrossRef]
  6. Gad-el Hak, M. Flow Control. Appl. Mech. Rev. 1989, 42, 261–293. [Google Scholar] [CrossRef]
  7. Fransson, J.H.M.; Brandt, L.; Talamelli, A.; Cossu, C. Experimental and theoretical investigation of the nonmodal growth of steady streaks in a flat plate boundary layer. Phys. Fluids 2004, 16, 3627–3638. [Google Scholar] [CrossRef]
  8. Landahl, M.T. On sublayer streaks. J. Fluid Mech. 1990, 212, 593–614. [Google Scholar] [CrossRef]
  9. Brandt, L.; Henningson, D.S. Transition of streamwise streaks in zero-pressure-gradient boundary layers. J. Fluid Mech. 2002, 472, 229–261. [Google Scholar] [CrossRef]
  10. Siconolfi, L.; Camarri, S.; Fransson, J.H.M. Stability analysis of boundary layers controlled by miniature vortex generators. J. Fluid Mech. 2015, 784, 596–618. [Google Scholar] [CrossRef]
  11. Szabó, A.; Nagy, P.T.; De Baets, G.; Vanierschot, M.; Paál, G. Stability analysis of a streaky boundary layer generated by miniature vortex generators. Comput. Fluids 2024, 269, 106123. [Google Scholar] [CrossRef]
  12. Fransson, J.H.M.; Talamelli, A.; Brandt, L.; Cossu, C. Delaying Transition to Turbulence by a Passive Mechanism. Phys. Rev. Lett. 2006, 96, 064501. [Google Scholar] [CrossRef] [PubMed]
  13. Batchelor, G.K. Axial flow in trailing line vortices. J. Fluid Mech. 1964, 20, 645–658. [Google Scholar] [CrossRef]
  14. De Tullio, N.; Paredes, P.; Sandham, N.D.; Theofilis, V. Laminar–turbulent transition induced by a discrete roughness element in a supersonic boundary layer. J. Fluid Mech. 2013, 735, 613–646. [Google Scholar] [CrossRef]
  15. Konishi, Y.; Asai, M. Experimental investigation of the instability of spanwise-periodic low-speed streaks. Fluid Dyn. Res. 2004, 34, 299–315. [Google Scholar] [CrossRef]
  16. Fransson, J.H.M.; Brandt, L.; Talamelli, A.; Cossu, C. Experimental study of the stabilization of Tollmien–Schlichting waves by finite amplitude streaks. Phys. Fluids 2005, 17, 054110. [Google Scholar] [CrossRef]
  17. Shahinfar, S.; Fransson, J.H.M.; Sattarzadeh, S.S.; Talamelli, A. Scaling of streamwise boundary layer streaks and their ability to reduce skin-friction drag. J. Fluid Mech. 2013, 733, 1–32. [Google Scholar] [CrossRef]
  18. Shahinfar, S.; Sattarzadeh, S.S.; Fransson, J.H.M.; Talamelli, A. Revival of Classical Vortex Generators Now for Transition Delay. Phys. Rev. Lett. 2012, 109, 074501. [Google Scholar] [CrossRef] [PubMed]
  19. Weingaertner, A.; Mamidala, S.B.; Fransson, J.H. Application of Miniature Vortex Generators for Boundary Layer Transition Delay. In Proceedings of the AIAA SCITECH 2023 Forum, National Harbor, MD, USA & Online, 23–27 January 2023. [Google Scholar] [CrossRef]
  20. Siconolfi, L.; Camarri, S.; Fransson, J.H.M. Boundary layer stabilization using free-stream vortices. J. Fluid Mech. 2015, 764, R2. [Google Scholar] [CrossRef]
  21. De Baets, G.; Szabo, A.; Nagy, P.T.; Paal, G.; Vanierschot, M. Vortex Characteristics of Miniature Vortex Generators: A Numerical Investigation. In Proceedings of the Canadian Society for Mechanical Engineering: 31st Annual Conference of the Computational Fluid Dynamics Society of Canada, Toronto, ON, Canada, 26–29 May 2024. [Google Scholar]
  22. Schlichting, H.; Gersten, K. Boundary-Layer Theory; Springer: Berlin/Heidelberg, Germany, 2017. [Google Scholar] [CrossRef]
  23. Camarri, S.; Fransson, J.H.M.; Talamelli, A. Numerical Investigation of the AFRODITE Transition Control Strategy. In Progress in Turbulence V; Springer Proceedings in Physics; Talamelli, A., Oberlack, M., Peinke, J., Eds.; Springer International Publishing: Cham, Switzerland, 2014; Volume 149, pp. 65–69. [Google Scholar] [CrossRef]
  24. Vanierschot, M.; Szabó, A.; Nagy, P.T.; Paál, G. Direct Numerical Simulation of the Wake Flow of a Miniature Vortex Generator and its Interaction with a Laminar Boundary Layer. In Proceedings of the Conference on Modelling Fluid Flow CMFF22, Budapest, Hungary, 30 August–2 September 2022. [Google Scholar]
  25. Roache, P.J. Perspective: A Method for Uniform Reporting of Grid Refinement Studies. J. Fluids Eng. 1994, 116, 405–413. [Google Scholar] [CrossRef]
  26. Sattarzadeh, S.S.; Fransson, J.H.M. On the scaling of streamwise streaks and their efficiency to attenuate Tollmien–Schlichting waves. Exp. Fluids 2015, 56, 58. [Google Scholar] [CrossRef]
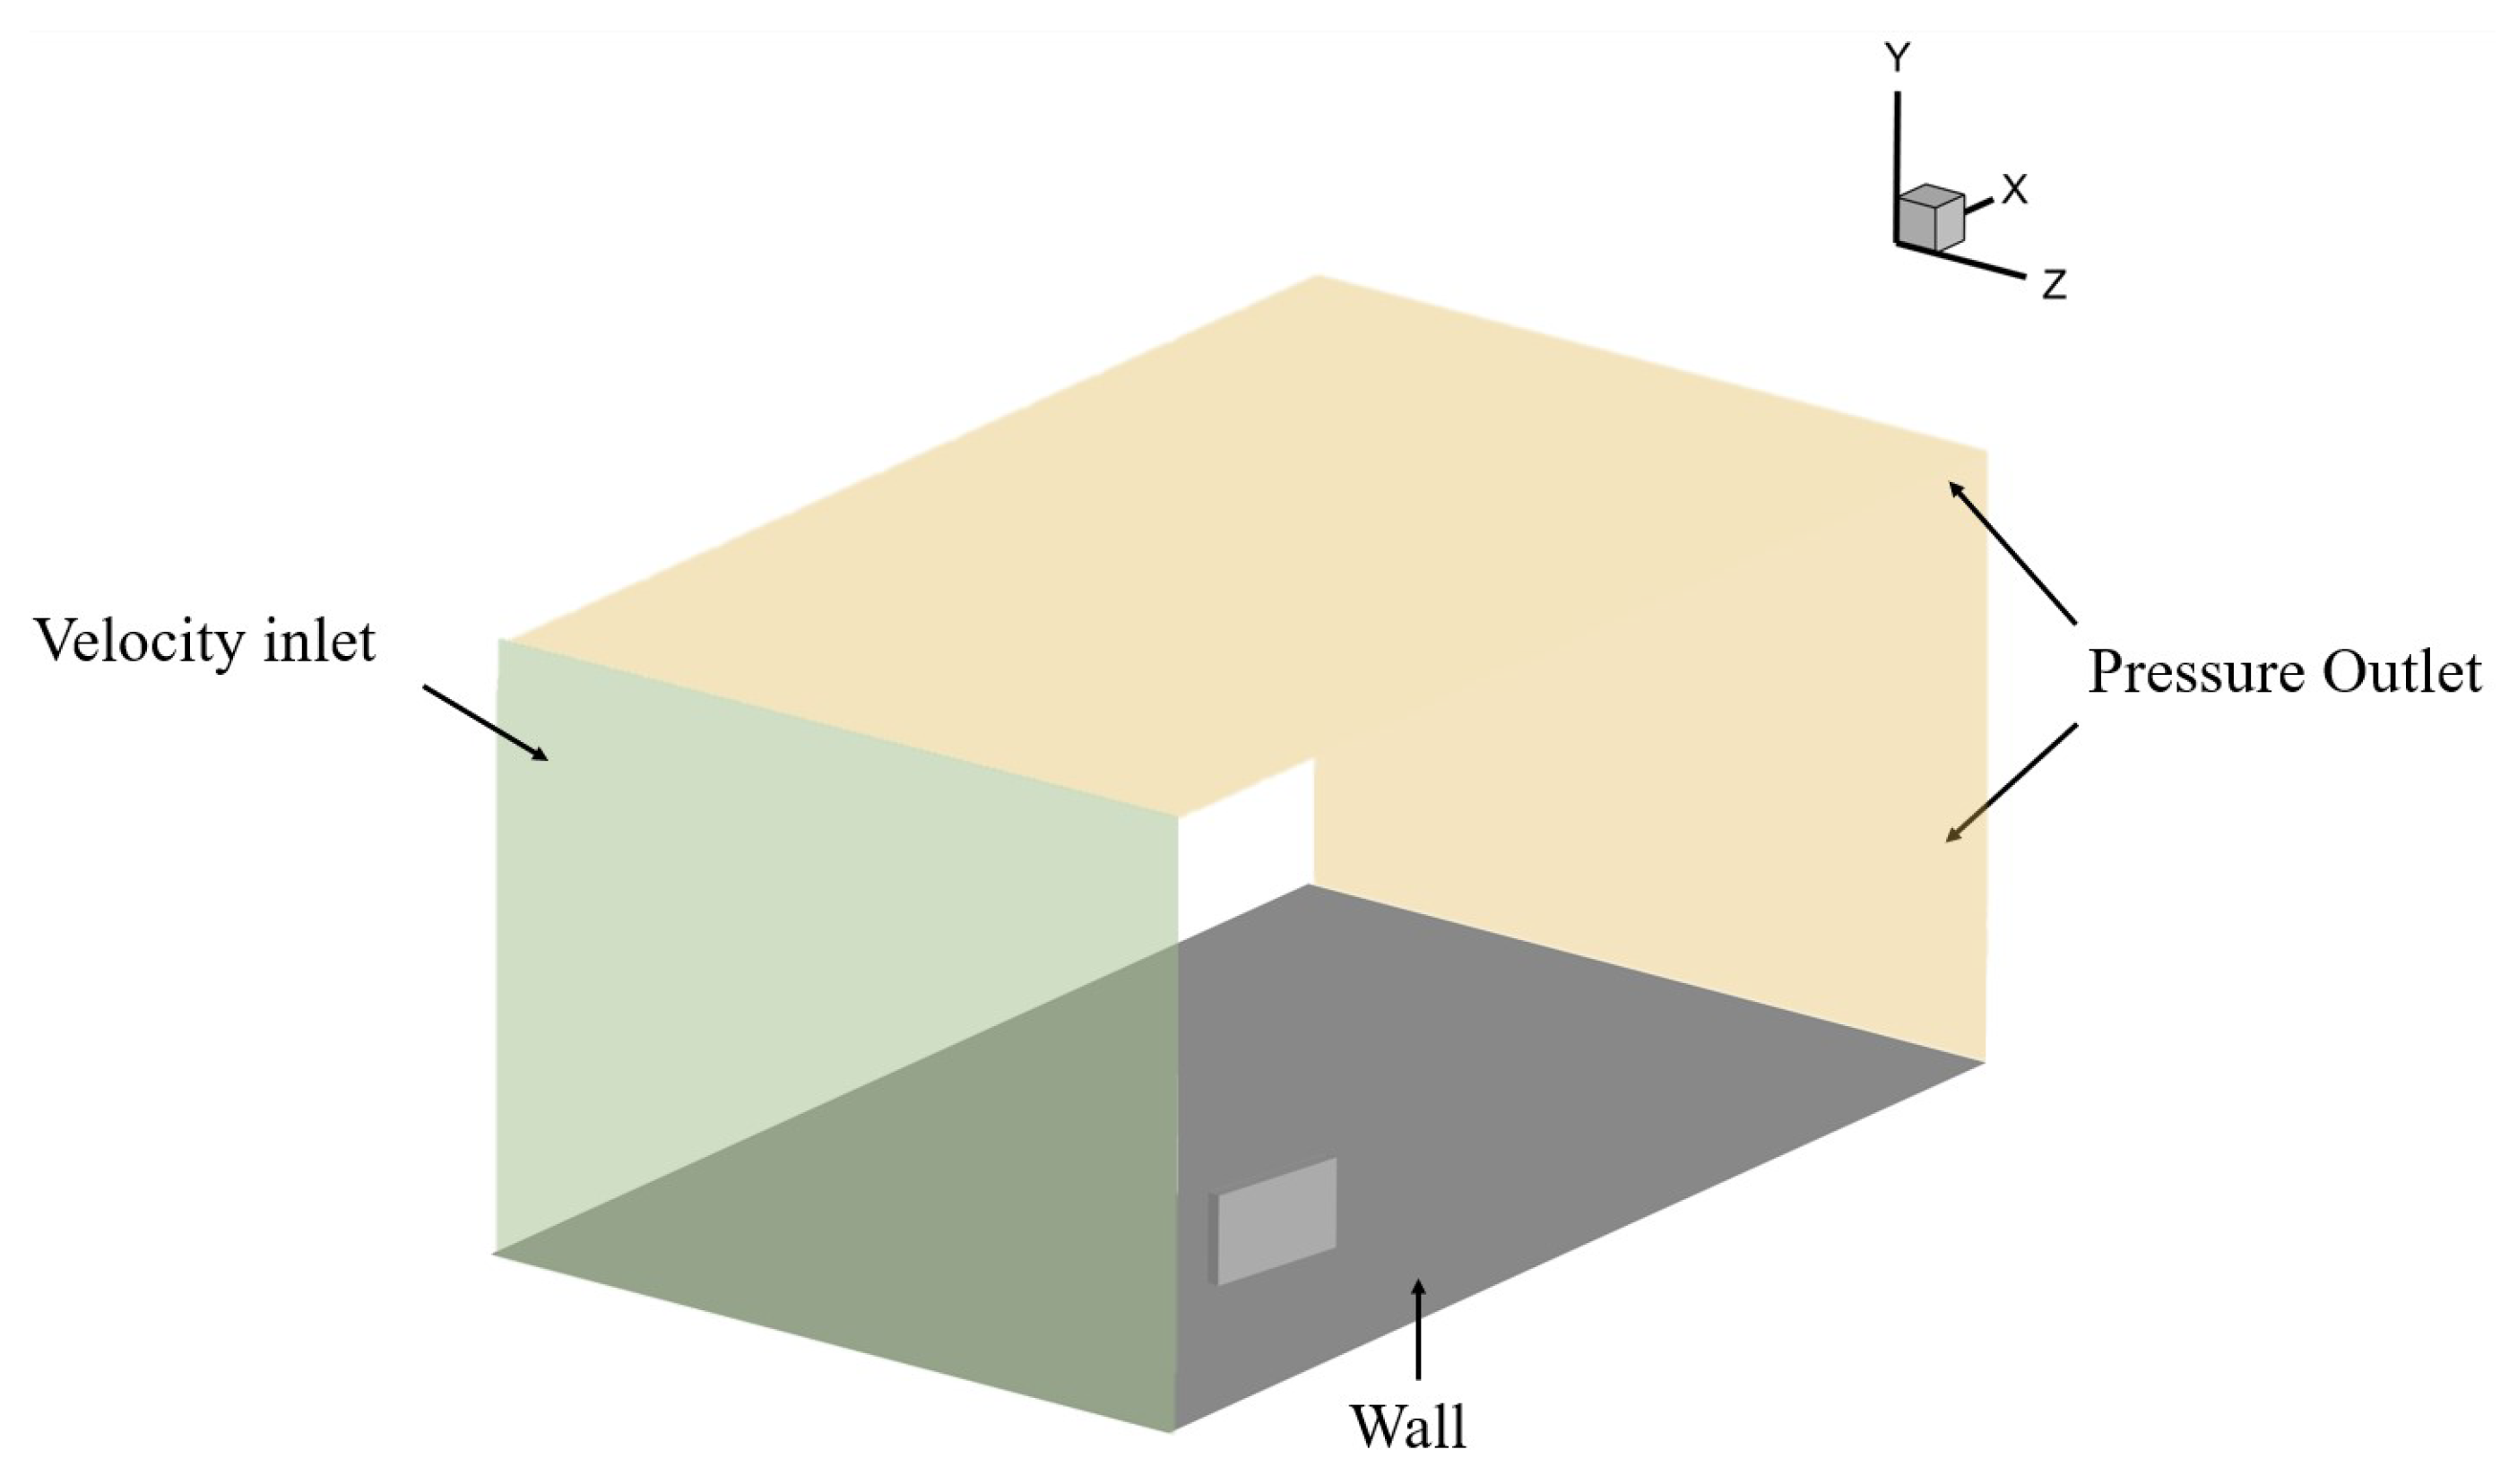
Figure 1. Overview of the computational domain, with the green plane showing the inlet and orange showing outlets. The wall region with a single MVG is gray. A symmetry condition is applied on the side walls.
Applsci 14 06966 g001
Figure 2. Schematic overview of MVG parameters.
Applsci 14 06966 g002
Figure 3. Vector plot showcasing the vortex contour intersection for finding vortex centers.
Applsci 14 06966 g003
Figure 4. Horizontal and vertical velocity profiles through the vortex center.
Applsci 14 06966 g004
Figure 5. Comparing the averaged velocity profile (in blue) to the fitted Batchelor vortex profile (in red).
Applsci 14 06966 g005
Figure 6. Case overview heatmaps showcasing the circulation ( Γ ) values for MVG heights of (a) 1.3 mm, (b) 1.5 mm, (c) 1.7 mm, and (d) 1.9 mm.
Applsci 14 06966 g006
Figure 7. Case overview heatmaps showcasing the vortex radius ( R c ) values for MVG heights of (a) 1.3 mm, (b) 1.5 mm, (c) 1.7 mm, and (d) 1.9 mm.
Applsci 14 06966 g007
Figure 8. Case overview heatmaps showcasing the vortex aspect ratio values for MVG heights of (a) 1.3 mm, (b) 1.5 mm, (c) 1.7 mm, and (d) 1.9 mm.
Applsci 14 06966 g008
Figure 9. Case overview heatmaps showcasing the decrease in force of a regular Blasius boundary layer compared to the flow field with MVGs present based on the stability calculations in Szabó et al. [11] for MVG heights of (a) 1.3 mm, (b) 1.5 mm, (c) 1.7 mm, and (d) 1.9 mm.
Applsci 14 06966 g009aApplsci 14 06966 g009b
Figure 10. Scatter plot displaying drag reduction and circulation ( Γ ) for all cases. The colored lines represent trendlines fitted on the data, while the black line denotes the total trendline including all data.
Applsci 14 06966 g010
Figure 11. Scatter plot displaying drag reduction and radius of the vortex ( R c ) for all cases. The colored lines represent trendlines fitted on the data, while the black line denotes the total trendline including all data.
Applsci 14 06966 g011
Figure 12. Scatter plot displaying drag reduction and aspect ratio for all cases. The colored lines represent trendlines fitted on the data, while the black line denotes the total trendline including all data.
Applsci 14 06966 g012
Figure 13. Scatter plot displaying circulation and aspect ratio for all cases. The colored lines represent trendlines fitted on the data, while the black line denotes the total trendline including all data.
Applsci 14 06966 g013
Figure 14. Comparison between two cases: top view of the flow structure, with vortical structures visualized in yellow isosurfaces of Q = 1 × 10 5 . In dark blue, regions of zero streamwise velocity are shown.
Applsci 14 06966 g014
Figure 15. 3D visualization of the near-field flow field, including purple isosurfaces of Q = 1 × 10 5 . In dark blue, regions of zero streamwise velocity are shown and a cross-section of the velocity field at the end of the domain, showcasing the change in boundary layer.
Applsci 14 06966 g015
Figure 16. 3D visualization of the near-field flow field, including purple isosurfaces of Q = 1 × 10 5 . In dark blue, regions of zero streamwise velocity are shown and a cross-section of the velocity field at the end of the domain, showcasing the change in boundary layer.
Applsci 14 06966 g016
Figure 17. On the left, a vortex velocity profile plot, similar to Figure 4, with on the right a vector plot, similar to Figure 3. For this case, found in the heatmaps in Figure 8 at 1.9 mm, top left, the absolute value of asymmetry is 1.345. In yellow, the dashed ellipse denotes the rough outline of the vortex shape.
Applsci 14 06966 g017
Table 1. Base parameters of the MVG setup.
h (mm) Λ (mm)d (mm)L (mm)w (mm) Θ (°) X MVG (mm)
1.3133.253.250.39222
0.36 δ 99 , MVG 3.60 δ 99 , MVG 0.90 δ 99 , MVG 0.90 δ 99 , MVG 0.08 δ 99 , MVG 61.48 δ 99 , MVG
Disclaimer/Publisher’s Note: The statements, opinions and data contained in all publications are solely those of the individual author(s) and contributor(s) and not of MDPI and/or the editor(s). MDPI and/or the editor(s) disclaim responsibility for any injury to people or property resulting from any ideas, methods, instructions or products referred to in the content.