Abstract
There is an ongoing effort to advance methodologies for culturing functional photoreceptors in vitro for retinal regenerative strategies. To support the formation of functional photoreceptors, a scaffold should replicate the native environment. The aim of this study was to optimize a sodium alginate–gelatin (SA-G) bioink to mimic the retinal properties while ensuring the printing of constructs with high shape fidelity. The optimized bioink was thoroughly characterized in terms of its physical, mechanical, and rheological properties, printability assessment, and preliminary biocompatibility. The material showed a constant degradation rate, which is crucial for effective tissue regeneration as it provides support for cell differentiation and polarization while gradually degrading to allow cell proliferation and matrix deposition. The optimized bioink displayed stiffness comparable to the native photoreceptor layer, potentially providing appropriate mechanical cues for photoreceptor maturation. Additionally, it exhibited shear-thinning behavior, the presence of yield stress, and fast recovery kinetics, which are essential for successful extrusion. The high shape fidelity of 3D-printed constructs suggested the feasibility of printing complex patterns to drive photoreceptor polarization. The preliminary cell results demonstrated homogeneous cell distribution and sustained cell viability over time. Overall, these findings indicate that the optimized bioink can provide the mechanical and topographical cues necessary for cultivating photoreceptors in vitro for retinal regeneration.
1. Introduction
Many pathologies affecting retinal tissue lead to irreversible vision impairments due to the loss of photoreceptors. Regenerative medicine represents a viable strategy for treating these conditions by replacing dead photoreceptors with healthy ones. Research advancements in cell therapies have shown promise in restoring retinal cells and retinal function [1]. For instance, the use of induced pluripotent stem cells (iPSCs) to generate a functional retinal pigment epithelium has demonstrated potential in clinical trials [2]. Yet, significant hurdles, including the long-term survival and integration of transplanted cells, remain [3]. Moreover, photoreceptors are difficult to cultivate and maintain in vitro [4]. To tackle these issues, cells can be transplanted using a scaffold, allowing for the delivery of an organized and functional cell layer that integrates better with the host tissue compared with cell injection. Yet, few studies on the fabrication of photoreceptor scaffolds have been reported in the literature. Most of these studies focused on creating scaffolds with an architecture that guides cell differentiation and orientation, which is crucial for fulfilling the light-sensing function [5]. Steedman et al. proved that the presence of microtopography positively affected cell attachment and induced the differentiation of retinal progenitor cells [6]. Similarly, Jung et al. showed that a 3D micropatterned scaffold can guide the attachment and the differentiation of pluripotent stem cells into photoreceptors [7]. Besides topographical cues, scaffold stiffness has also been identified as a key parameter for driving cells to differentiate into photoreceptors and for maintaining lineage specification [8,9]. Therefore, selecting suitable substrate materials and fabrication techniques is crucial for recapitulating both the architecture and properties of the in vivo photoreceptor environment [8]. Current substrates fail to mimic both the architecture and the stiffness of the native milieu, thus hindering progress in retinal regenerative approaches [7,10]. Hence, recreating the environment of photoreceptors in vitro still represents an engineering challenge.
Recently, 3D bioprinting has been suggested as a promising technique to fabricate scaffolds for photoreceptors, as it allows 3D porous architectures with precise control over pore size, geometry, and cell spatial distribution to be obtained without significantly affecting cell viability [5,11,12,13]. Different bioprinting technologies have been developed and employed according to the application [14]. For instance, Masaeli et al. demonstrated the feasibility of fabricating a 3D in vitro retina model using an inkjet-based bioprinter [12]. However, with this approach, cells had to be printed in culture medium to avoid clogging issues. So, the native stiffness could not be matched. Among the bioprinting approaches, pneumatic-driven extrusion-based bioprinting is one of the most common due to its versatility in printing a wide range of bioinks and its ease of use [15]. Additionally, it enables the production of clinically relevant constructs, in terms of size, within a reasonable time. Bioinks employed in extrusion bioprinting must display shear-thinning behavior to enable successful extrusion and printing while preserving the structure given by the printing process [16]. Shi et al. used an alginate–pluronic bioink that included a retinoblastoma-derived cell line to replicate the photoreceptor layer in a 3D in vitro model [17]. They evaluated the impact of two different printing patterns on cell morphology; however, the stiffness of the bioink was not investigated. Hence, to date, a bioink capable of meeting the requirements for extrusion-based bioprinting and simultaneously accurately replicating retinal properties has yet to be developed [11,18].
Sodium alginate–gelatin (SA-G) blends have been successfully applied over the years in extrusion-based 3D bioprinting for engineering different tissues, such as liver and neural tissue [19,20,21]. These blends have shown a good printability window, a rapid crosslinking rate, printing accuracy, and biocompatibility [22,23]. Moreover, they can be obtained via an easy and cost-effective process. We believe that an SA-G bioink holds great potential for bioprinting a functional photoreceptor layer, as gelatin provides cell attachment sites, while sodium alginate exhibits a suitable stiffness for the development of photoreceptors. Hunt et al. found that a sodium alginate-based hydrogel functionalized with arginine–glycine–aspartate groups promoted photoreceptor cell differentiation in comparison with hydrogels based on hyaluronic acid and pure gelatin due to its stiffness [8].
The present research aims to introduce a novel platform that is potentially able to guide and sustain functional photoreceptors in vitro through both topographical and mechanical cues. To this end, we optimized a bioink composed of sodium alginate and gelatin to replicate retinal native properties, such as stiffness, while ensuring successful extrusion and high shape fidelity in printed constructs. To the best of our knowledge, no bioink with these features has been developed previously. To investigate the properties of the optimized SA-G bioink, we performed a comprehensive characterization based on well-established testing protocols as well as protocols developed specifically for this study.
2. Materials and Methods
A schematic representation of the research methodology is reported in Figure 1.
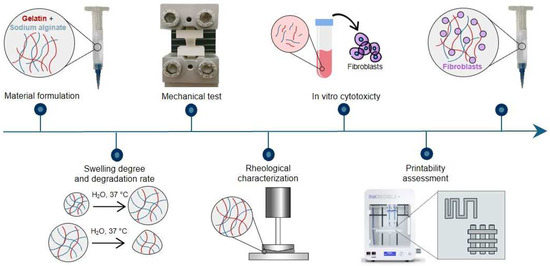
Figure 1.
Graphic representation of the research methodology.
2.1. Material Preparation
To prepare the SA-G bioink, low-viscosity sodium alginate (154725, Lot Number: SR01864) and gelatin (bovine skin type B, G9391, Lot Number: SLCF9893) powders were purchased from MP Biomedicals (Santa Ana, CA, USA) and Sigma-Aldrich (St. Louis, MO, USA), respectively.
The hydrogel precursor solution was prepared as follows. First, the powders were separately sterilized in 99.99% ethanol (Sigma-Aldrich, St. Louis, MO, USA) for 15 min. The sterilization process was repeated three times. After the complete evaporation of ethanol, 0.4 g of sodium alginate powders were dissolved in 10 mL of sterile phosphate-buffered saline (PBS, 1X, w/o Calcium, w/o Magnesium, pH = 7.4, Gibco, Thermo Fisher Scientific, Waltham, MA, USA) overnight under vigorous magnetic stirring. Similarly, 1 g of gelatin was dissolved in 10 mL of sterile PBS at 37 °C until total solubilization. The two resulting solutions were mixed together in a volume ratio of 1:1. Hence, the final alginate and gelatin concentrations in the precursor were 2% and 5% wt./v. These concentrations were selected after an optimization process based on preliminary extrudability and printability tests. The precursor solution was stored at 4 °C and used within one week.
The crosslinking solution was prepared by dissolving 2% wt./v of calcium chloride (CaCl2, Sigma-Aldrich, St. Louis, MO, USA) into sterile distilled water and stored at 4 °C until use. The CaCl2 concentration and the crosslinking duration were optimized based on previous studies [24]. The use of CaCl2 is widely reported in the literature to crosslink sodium alginate [25]. The crosslinking mechanism is based on ionic bonds between calcium ions and carboxylate ions present in the alginate. Briefly, sodium alginate is a linear polysaccharide containing carboxylate ions, each bonded with a sodium ion. When alginate is immersed in a CaCl2 solution, the dissociated calcium ions replace the sodium ions in the alginate, ionically bonding with the carboxylate ions. Since each calcium ion can bond with two carboxylate ions, the process results in the crosslinking of the polymer chains and, thus, in the formation of a hydrogel [25].
2.2. Swelling Degree and Degradation Rate
To evaluate the hydrogel swelling and degradation properties, the SA-G precursor solution was transferred into a Petri dish and crosslinked at 4 °C for 10 min. Hydrogel cylindrical samples (n = 3) of 7 mm diameter and 3 mm thickness were obtained by using a biopsy punch. The samples were then crosslinked by submerging them in the CaCl2 crosslinking solution for 10 min at room temperature.
To evaluate the swelling degrees and degradation rates, the samples were placed in a 6-well plate, immersed in complete culture medium composed of high glucose Dulbecco’s Modified Eagle’s Medium (DMEM, GibcoTM, Thermo Fisher Scientific, Waltham, MA, USA) supplemented with 10% fetal bovine serum albumin (FBS, American Type Culture Collection, Manassas, VA, USA) and 1% penicillin/streptomycin antibiotics (GibcoTM, Thermo Fisher Scientific, Waltham, MA, USA), and incubated at 37 °C for the following time points: 15 min, 30 min, 1 h, 2 h, 3 h, 4 h, 5 h, and 6 h (same set of samples for each time point) [26]. After specific incubation periods, the samples were weighed to determine the swelling degree. The swelling degree at each time point was computed according to Equation (1):
where Wt is the sample weight at each time point, and W0 is the starting sample weight before adding the solution.
The same set of samples was employed to study the degradation rate. In more detail, after reaching the swelling equilibrium, samples were incubated at 37 °C for 1, 3, 5, 7, 10, 14, and 21 days. At each time point, the samples were weighed, and the degradation rate was calculated by quantifying the weight decrease as in Equation (2):
where Wt is the sample weight at each time point, and Ws is the sample weight reached at swelling equilibrium.
2.3. Mechanical Tests
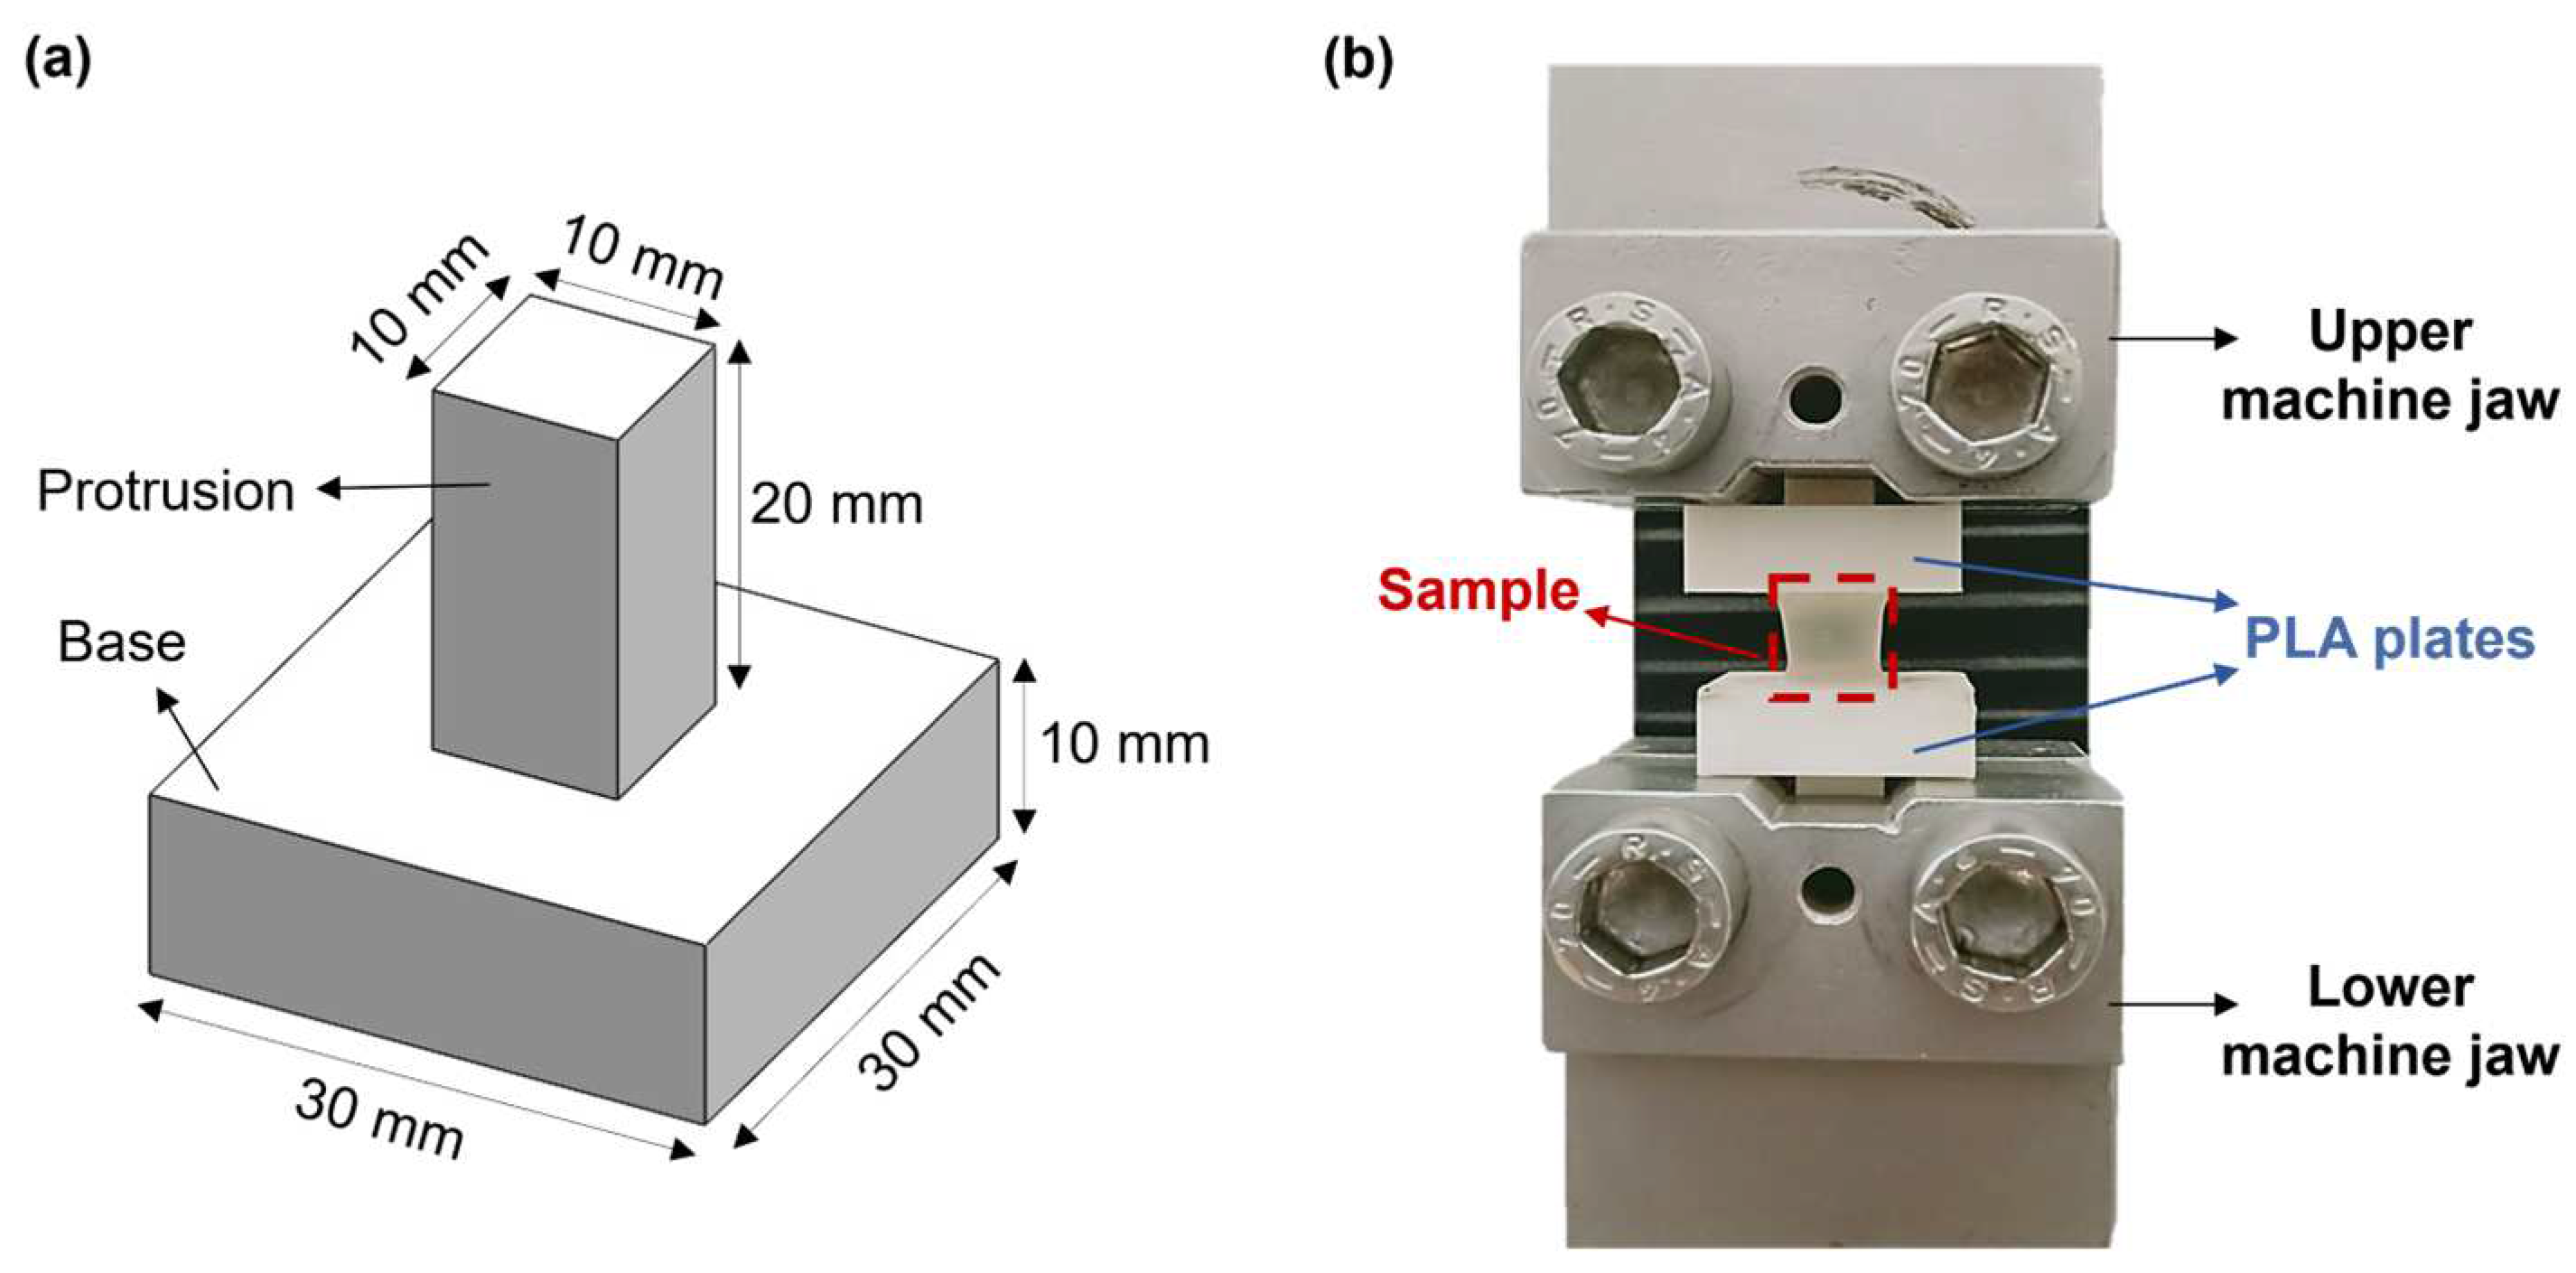
Hydrogel mechanical properties were measured by performing uniaxial tensile tests through an ad hoc setup. This includes two poly(lactic acid) (PLA, K Kentstrapper, Florence, Italy) plates fabricated using fused-deposition modeling (Verve, Kentstrapper, Florence, Italy). Each plate consists of a base and a protrusion with dimensions of (30 × 30 × 10) mm and (10 × 10 × 20) mm, respectively (Figure 2a). The protrusions were designed to be inserted and secured into the jaws of a testing machine (Synergie 200, MTS Systems, Eden Prairie, MN, USA) by tightening, thus preventing any slipping of the plates. Hydrogel samples (n = 5) obtained as described in Section 2.2 were tightly glued to the bases of the plates by using a biocompatible tissue adhesive (3MTM VetbondTM, Thermo Fisher Scientific, Waltham, MA, USA). Subsequently, the plates along with the sample were mounted onto the testing machine, which was equipped with a 100N loading cell (Figure 2b). Samples were pulled until failure at a displacement rate of 0.1 mm/s at room temperature (25 °C). The displacement rate was selected based on previous tensile tests on retinal samples [27].
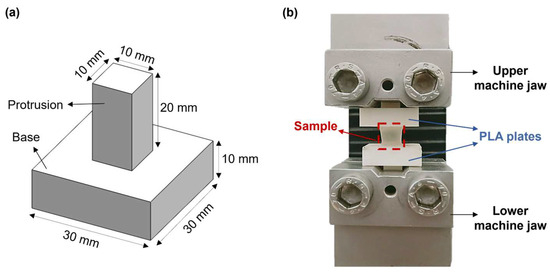
Figure 2.
(a) CAD model of the poly(lactic acid) (PLA) plates designed to perform uniaxial tensile tests; (b) Experimental setup used for the uniaxial tensile tests.
For the analyses, force (N)−elongation (mm) data were elaborated to obtain the stress [kPa]−strain [mm/mm] relationship for each sample. The stress and the strain were computed as indicated in Equations (3) and (4), respectively. The elastic modulus (E) was extracted from the stress–strain plots as the slope of the initial linear region of the stress–strain curve.
where σ and ε are the stress and the deformation, respectively. F is the force applied to the original cross section A, and ΔL is the change in length with respect to the original length L0.
2.4. Rheological Characterization
Rheological analyses were carried out at 25 °C using a rotational rheometer (Discovery HR2, TA Instruments, New Castle, DE, USA) equipped with a cone-plate geometry (diameter: 20 mm). The testing temperature was selected based on the printing temperature. Prior to all tests, a conditioning step, consisting of a rotation of the tool at 10 s−1 for 30 s followed by a soak period of 30 s, was included.
To evaluate the rheological properties of the SA-G bioink, two specific tests were performed: a flow curve and a strain sweep. In the former, the viscosity and the shear stress exerted on the material in response to the applied shear rates were measured in a continuous flow experiment. Specifically, the shear rate was progressively increased in a logarithmic manner from 0.001 to 10,000 s−1. Ten points per decade were registered, and the test time was 180 s., i.e., 30 s per decade. In the latter, material responses, namely the storage modulus (G′) and the loss modulus (G″), were measured by applying oscillatory strains in a logarithmic manner from 0.01% to 1000% at a frequency of 1 Hz. Ten points per decade were recorded. The testing parameters for the flow curve and strain sweep were determined by conducting preliminary tests. To assess the impact of cells on the bioink rheological properties, both tests were repeated on the SA-G bioink loaded with L929 cells at different cell densities (5 × 10⁶ cells/mL and 10 × 106 cells/mL) [16]. The cell encapsulation procedure will be illustrated in Section 2.7.
To investigate the material recovery ability after shear application and removal, a strain recovery test and an elastic recovery test were carried out. In the strain recovery test, the viscosity was measured during the following consecutive steps that mimic the printing process: (i) pre-printing phase (shear rate of 0.05 s−1 for 300 s); (ii) printing (sudden increase in shear rate to 811 s−1 for 60 s); (iii) post-printing phase (shear rate of 0.05 s−1 for 300 s). Thirty points per step were recorded. A 0.05 s−1 shear rate was chosen to simulate material resting conditions, whereas 811 s−1 was found to be the maximum shear rate value applied to the material during extrusion. It was computed by using Equation (5), which was derived from the Hagen–Poiseuille law with Rabinowitsch correction [28].
where Q (mm3s−1) is the flow rate, R (mm) is the inner radius at the outlet of the nozzle used in the bioprinting process and (n − 1) is the slope of the viscosity versus shear rate graph on a log–log plot obtained from the flow curve. To assess the material elastic recovery after the printing process, oscillatory time sweeps made at a frequency of 1 Hz were performed with alternating high/low shear stresses, i.e., 7 × 10⁻⁴ and 10−6 MPa, respectively. The maximum shear stress value set in this test was the one corresponding to a shear rate of 811 s−1. The material was allowed to recover for 2 min to simulate the non-printing phases. All rheological measurements were repeated three times.
2.5. In Vitro Cytotoxicity
Cylindrical hydrogel samples (n = 3), prepared as described in Section 2.2, were placed in 6-well plates and incubated in complete culture medium at 37 °C and 5% CO2. The medium was collected at different incubation times (1, 5, and 7 days). Meanwhile, L929, a murine fibroblast cell line (Catalog No. CCL-1TM, American Type Culture Collection, Manassas, VA, USA), was routinely cultured in complete culture medium at 37 °C and 5% CO2, with medium replacement every 2 days. The cells were cultured for four sequential passages until they reached the desired density. L929 cells were then seeded in 12-well plates at a density of 1 × 10⁵ cell/well and grown until they reached 70% confluency. Subsequently, these cells were cultured for 24 h with the medium that had been incubated with the hydrogel samples. As a control, cells were cultured with fresh complete culture medium. All experiments were performed in replicates of three (n = 3). After 24 h, cell viability was assessed using the alamarBlueTM assay (InvitrogenTM, Carlsbad, CA, USA) according to the manufacturer’s instruction. Alamar blue is an oxidation–reduction indicator that changes color upon reduction by living cells. To perform the assay, the alamar blue stock solution was diluted to 1:10 with complete culture medium. The resulting 10% alamar blue solution was incubated with the cells for 3 h at 37 °C. After incubation, a volume of 100 µL/well was transferred to a 96-well plate for absorbance reading. The absorbance at 570 nm and 600 nm was measured using a microplate reader (infinite 200Pro, Tecan Group Ltd, Männedorf, Switzerland), and the percentage viability was computed as the percent difference in reduction between treated and control cells.
2.6. Printability Assessment
Cellink INKREDIBLE+ (Cellink AB, Gothenburg, Sweden) was used to print the SA-G bioink. Such a 3D bioprinter is based on pneumatic extrusion technology and is equipped with dual printheads featuring a heating system and built-in photocuring modules. Moreover, it includes patented clean-chamber technology that efficiently filters air through an H13 HEPA filter, thus providing a clean printing environment. All structures introduced in this section were designed with Solidworks 2020 (Dassault Systems Solid WorksCorp, Waltham, MA, USA), sliced with PrusaSlicer 2.3.3. (Prusa Research, Prague, Czech Republic), and printed at 25 °C. Two conical nozzles with inner diameters of 22G (0.41 mm) and 25G (0.25 mm) were used. Prior to printing, the hydrogel precursor solution stored at 4 °C was incubated at 37 °C for 15 min, thus allowing the solution to be transferred to a printing cartridge. The printing cartridge was left at 25 °C for 40 min before printing to enable partial gelatin crosslinking. After printing, all structures were physically crosslinked at 4 °C for 5 min followed by chemical crosslinking in a 2% wt./v CaCl2 bath for 10 min.
Printability was assessed by evaluating the filament formation and printing accuracy in terms of filament merging and shape fidelity in multi-layered structures [16]. For the first test mentioned, four lines were printed at different increasing velocities, i.e., 5, 10, 15, and 20 mm/s, by applying a pressure of 25 kPa. The test was repeated using a printing pressure of 30 kPa. The line widths were measured using ImageJ software (NIH, Stapleton, NY, USA, ver. 1.54i) after imaging the lines with an optical microscope (Eclipse Ti2, Nikon, Tokyo, Japan). Based on the results of this test, optimized printing parameters were chosen for further analyses. The printing accuracy on the x–y plane was determined through the filament fusion test [29]. For this test, a precise pattern was designed that involved parallel lines spaced at different distances (from 0.5 mm to 3 mm), with a progressive 0.5 mm increase for each subsequent line. Ultimately, circular discs with a diameter of 30 mm and a thickness of 0.4 mm were designed and printed with four layers to evaluate the shape fidelity of multilayered constructs. Specifically, the dimensions of the printed structures were measured using ImageJ software and compared with the original dimensions set in the digital model of the structure. Moreover, optical images taken by the Eclipse Ti2 microscope were analyzed to investigate the pore geometry of the printed discs. Subsequently, the printability index (Pr) was computed using Equation (6) [16]:
where L and A are the pore perimeter and area, respectively.
2.7. Bioprinting
Before bioprinting, L929 cells routinely cultured in complete culture medium were centrifuged and resuspended in fresh culture medium at a density of 5 × 10⁶ cells/mL. The cell suspension was mixed with the SA-G precursor solution previously heated at 37 °C for 15 min by means of a luer-lock connector to homogeneously encapsulate cells within the solution. The SA-G bioink containing cells was transferred into a printing cartridge equipped with a 22G (0.41 mm) conical nozzle and left at 25 °C for 40 min before printing. Four-layered grids with dimensions of 10 mm × 10 mm × 1 mm were then printed using the printing parameters established with the printability tests (Section 2.6). The printed structures were crosslinked as indicated in Section 2.1 and cultured at 37 °C and 5% CO2. Cell viability was evaluated with the LIVE/DEAD Cell Viability Assay (Invitrogen, Carlsbad, CA, USA) following manufacturer instructions. Fluorescent images were acquired with an optical microscope (Eclipse Ti2, Nikon, Tokyo, Japan) 1 and 5 days after printing.
2.8. Statistical Analyses
Statistical analyses were performed with IBM SPSS software (ver. 29). Results are presented as mean ± SD. To evaluate the effect of cell density on the SA-G viscosity, the Friedman test was used with a 95% confidence interval, whereas for the cytotoxicity analysis of degradation products, two-way ANOVA was employed with a 95% confidence interval. Significant differences were reported for p-values lower than 0.05, with * indicating a p-value < 0.05.
3. Results and Discussion
3.1. Swelling Degree and Degradation Rate
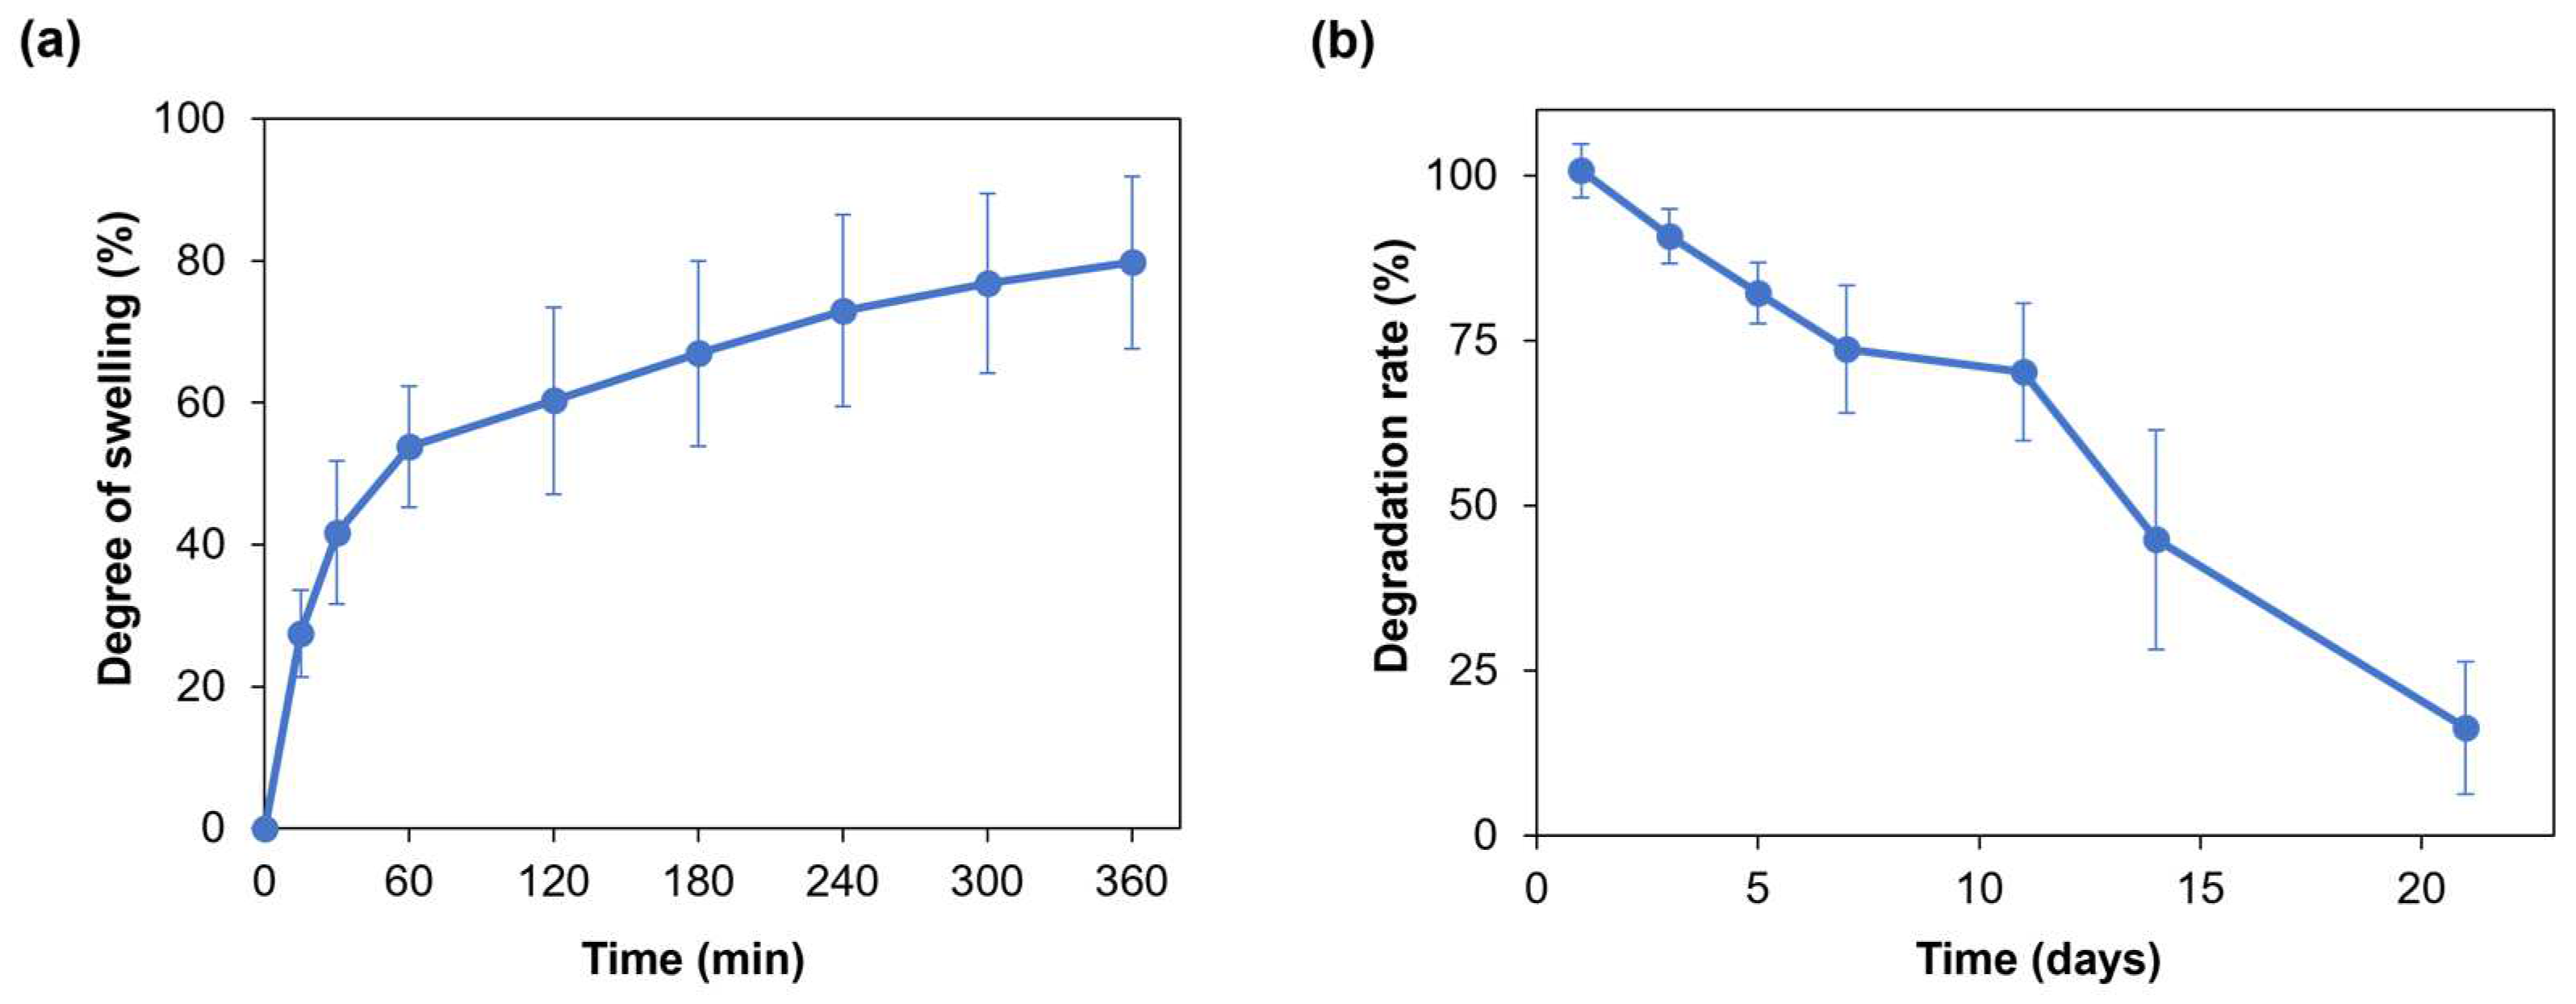
Hydrogel swelling ability is crucial for the penetration of nutrients and for the transport of metabolic products, thus promoting cell viability and proliferation within the hydrogel [30]. Moreover, when developing a hydrogel as a bioink, its swelling behavior needs to be evaluated and optimized to preserve the shape fidelity of the printed structures once immersed in culture medium [16]. Figure 3a displays the average swelling degree of the SA-G hydrogel samples. Within the first hour, the average degree of swelling increased to approximately 55%. Then, the hydrogel samples continued swelling at a slower rate with an average rise of 20% until the sixth hour, when they reached the swelling plateau. The maximum swelling degree value was 80%, on average. Such a value allows for the uptake and transport of nutrients dissolved in the cell culture medium, thus favoring cell viability and proliferation, while retaining shape fidelity of the printed constructs. Indeed, based on the findings of Li et al., bioinks characterized by a swelling degree of nearly 100% did not show significant spreading of filaments and pores in the printed constructs [31].
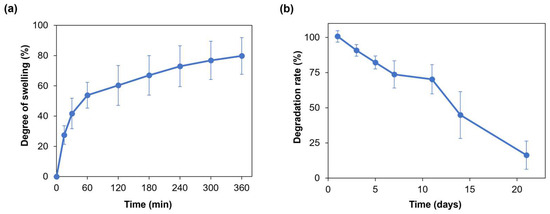
Figure 3.
(a) Swelling degree (%) of the SA-G hydrogels over time; (b) Degradation rate (%) of the SA-G hydrogels over time. Error bars represent the standard deviation. SA-G: sodium alginate–gelatin.
As for the degradation rate, the material should progressively degrade to allow cells to proliferate and deposit new extracellular matrix while preserving the initial structure of the printed constructs [32]. The SA-G hydrogel samples exhibited a constant weight decrease over 21 days (Figure 3b). On day 21, the average weight decrease was 16%, although few samples were completely degraded.
3.2. Mechanical Testing
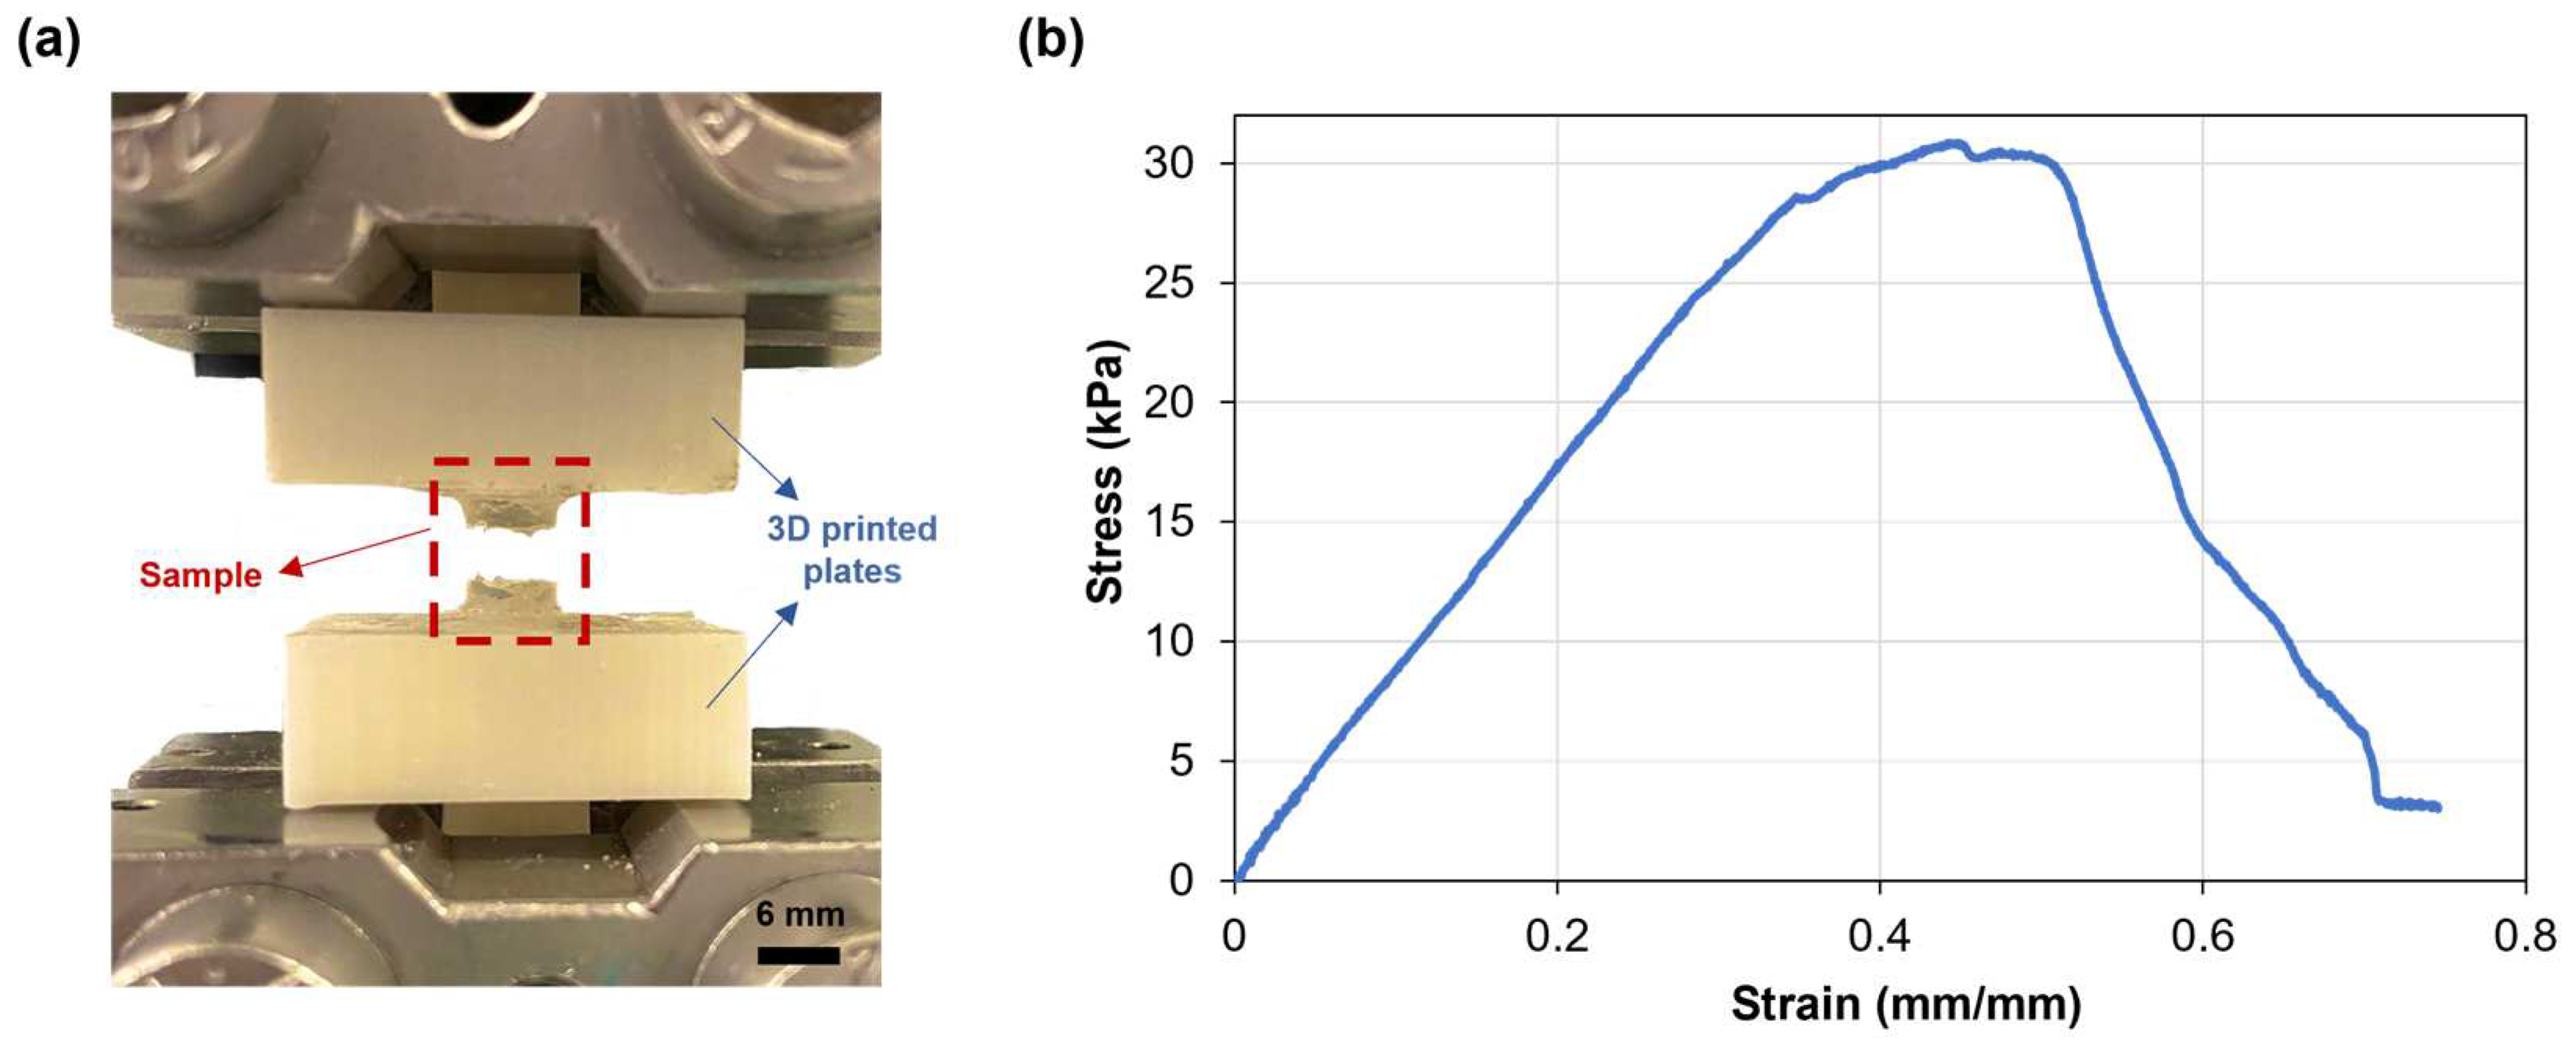
The mechanical properties of the SA-G hydrogel samples were studied through uniaxial tensile testing, as knowledge about retinal mechanical properties is mainly based on uniaxial tensile tests [33]. Since the conventional grips used for uniaxial tensile testing exert localized pressure on soft materials, leading to significant local deformations and fractures, a custom setup able to constrain the sample without causing clamping-induced fractures was designed and developed. The sample fracture site at the end of mechanical testing proved the effectiveness of the new setup (Figure 4a). Figure 4b shows a typical tensile stress−strain curve of the tested SA-G hydrogels. The curve presents a linear elastic region followed by failure, consistent with the literature [34]. As observed in Figure 4b, the fracture was not instantaneous. The stress dropped gradually, indicating a progressive failure of the hydrogel. This behavior may be due to the presence of regions with slightly different crosslinking degrees, although further studies are needed to confirm this hypothesis. The average elastic modulus (E), extrapolated from the stress–strain graph, was 37.5 ± 0.36 kPa. According to our previous results, the average E of porcine retinal tissue at room temperature is lower (13.4 ± 0.0067 kPa) [27]. However, the test was performed ex vivo on the entire retinal tissue. Qu et al. exploited a phase-resolved acoustic radiation force optical coherence elastography method to determine the elastic properties of different porcine retinal layers in vivo. They found that the stiffness increased from the ganglion layer to the photoreceptors, with the maximum value of 25.9 ± 7.36 kPa in the photoreceptor layer [35]. Hence, the stiffness of the SA-G bioink is akin to the stiffness of the native photoreceptor layer. Thus, it can provide in vivo-like mechanical cues, which are essential for promoting cell differentiation into photoreceptor phenotypes [8].

Figure 4.
(a) SA-G hydrogel samples after testing. Scale bar = 6 mm; (b) Representative stress–strain curve of hydrogel samples when pulled until failure. SA-G: sodium alginate–gelatin.
3.3. Rheological Characterization
The study of bioink rheological properties is a prerequisite for a successful extrusion-based process. Indeed, it enables a preliminary evaluation of the bioink extrudability and printability [16]. Therefore, SA-G bioink rheological behavior, including its viscosity, viscoelastic properties, and shear and elastic recovery, was deeply investigated.
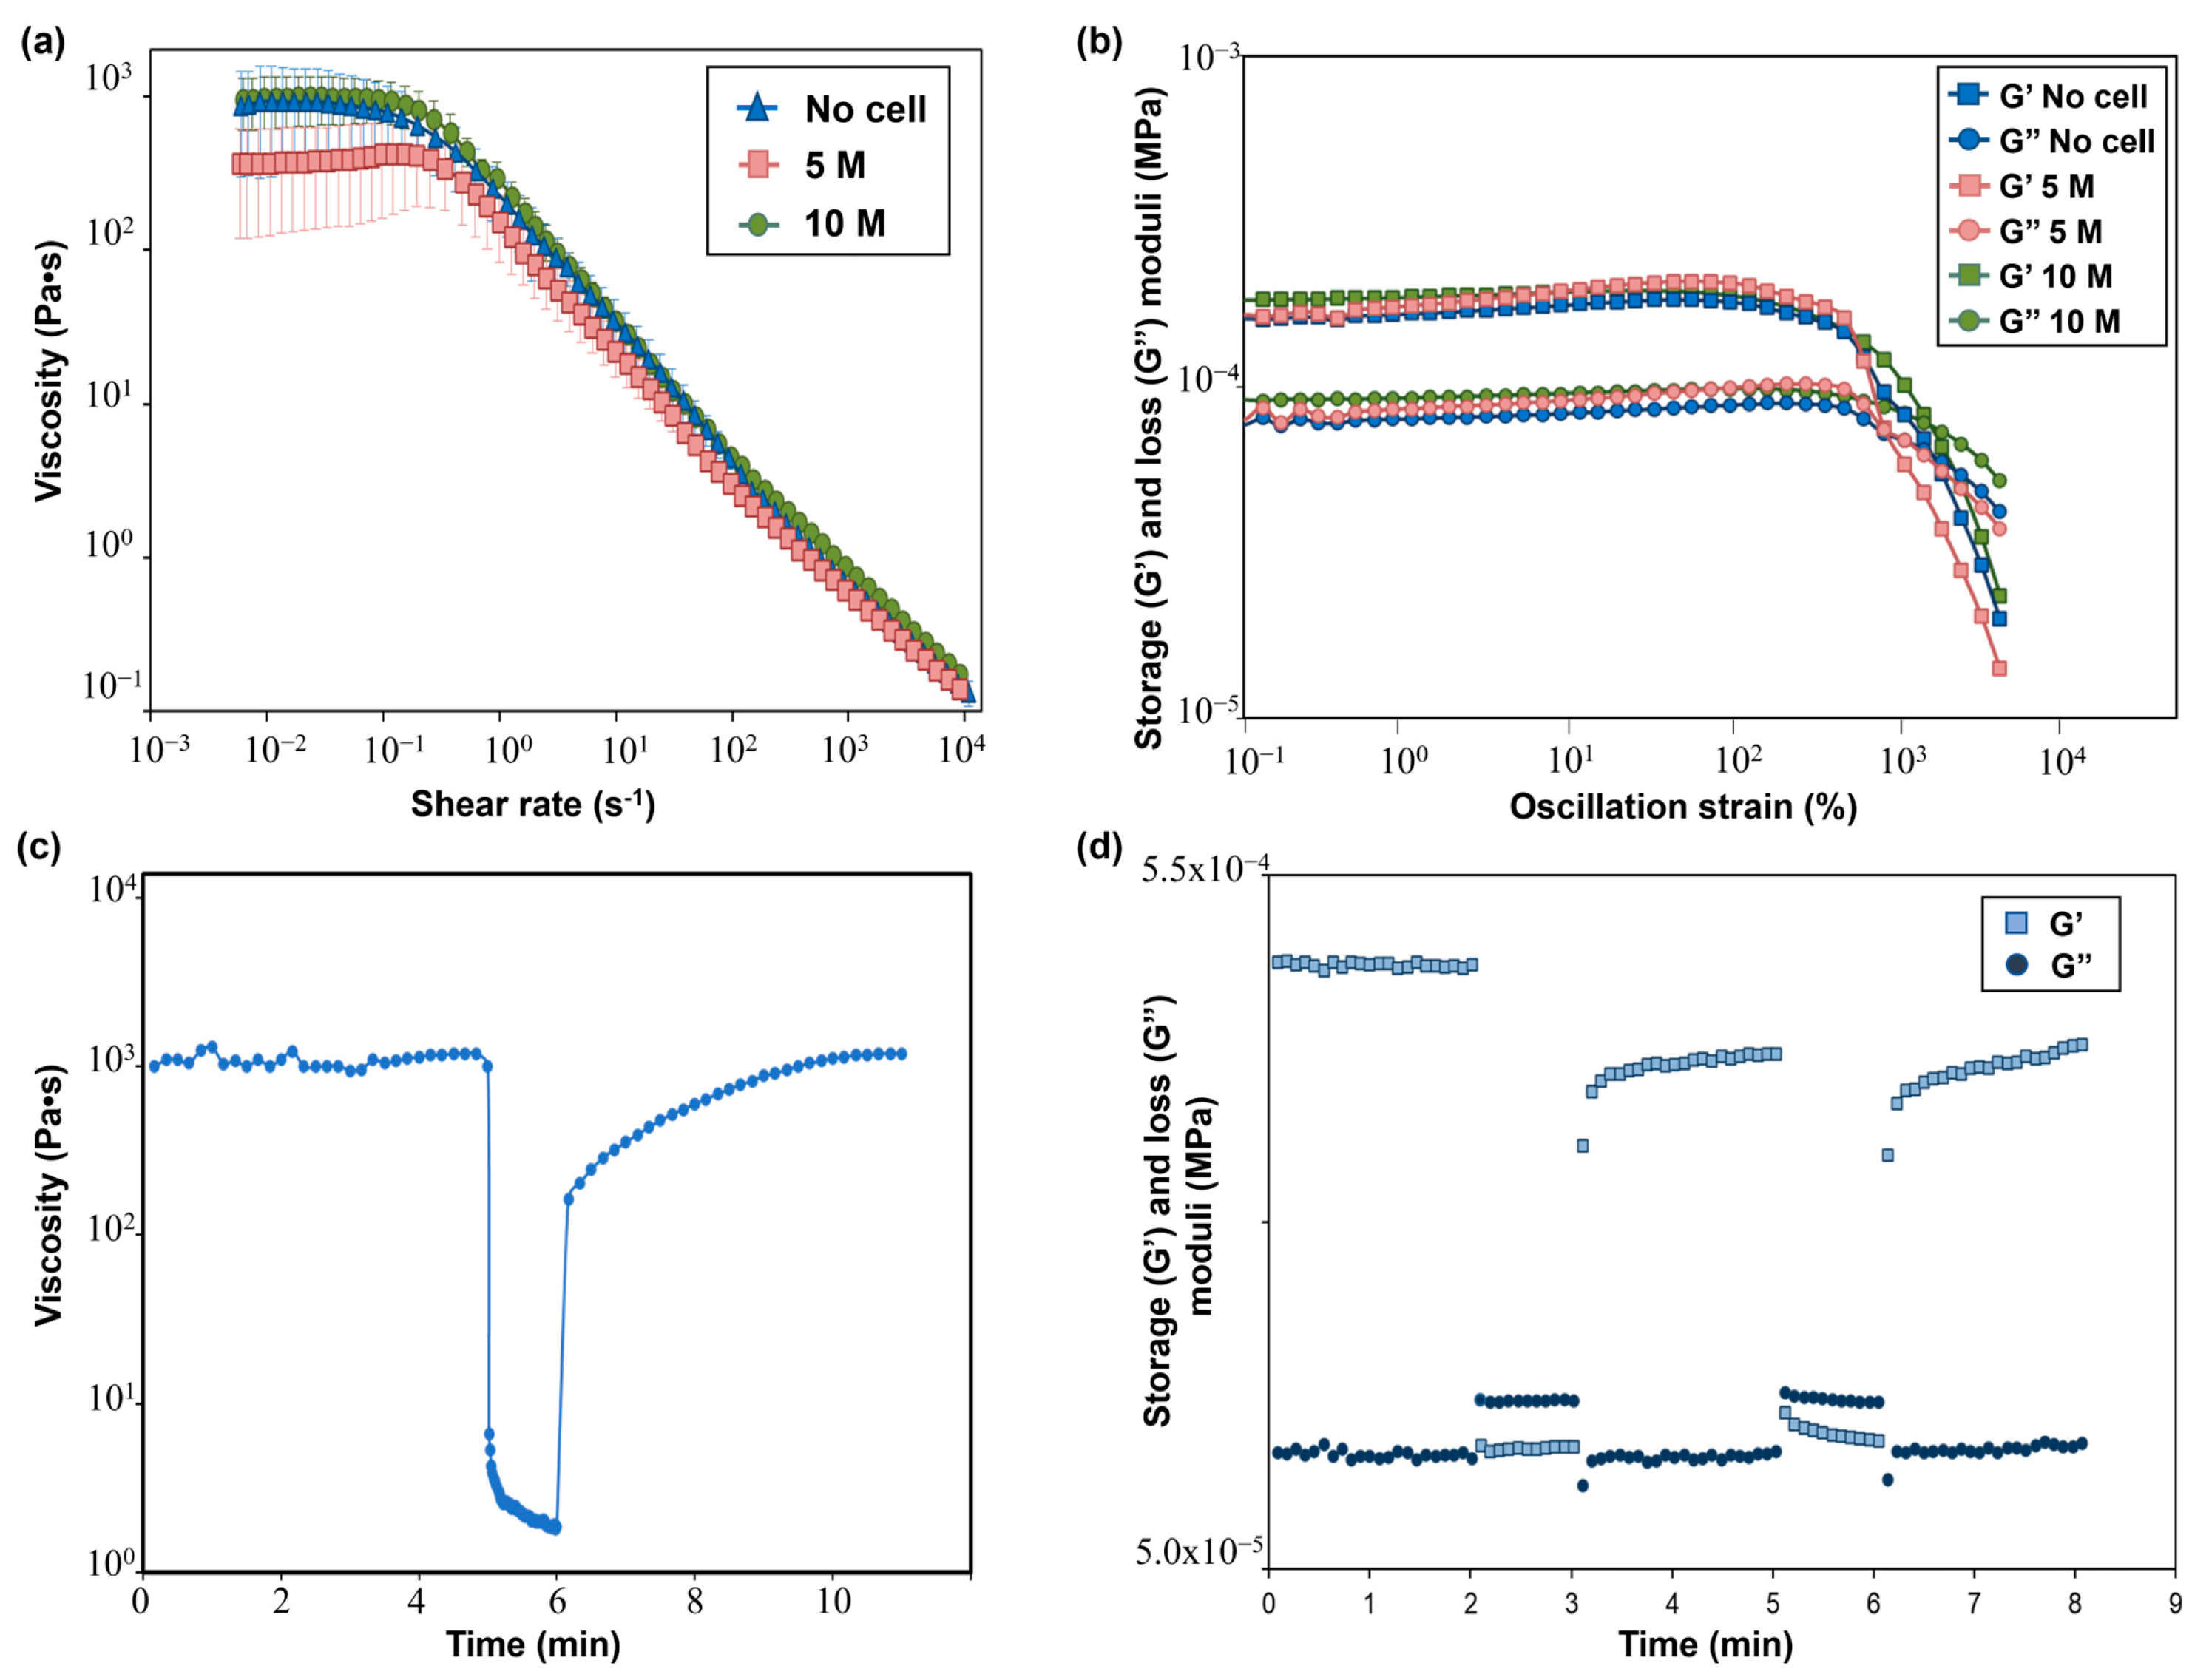
The flow curves performed on the SA-G precursor solutions with and without cells are displayed in Figure 5a. From these curves, the presence of a pseudoplastic (or shear thinning) behavior, i.e., a decrease in the material viscosity when applying a shear stress, can be evaluated. The pseudoplastic behavior is a requirement that a bioink must fulfill to be suitable for extrusion-based 3D bioprinting [16]. Specifically, shear-thinning behavior is necessary to extrude with ease a material that has a relatively high zero-shear-rate viscosity (i.e., the viscosity of the material when no shear rate is applied) through a narrow nozzle. Indeed, during the extrusion, a high shear rate is applied to the material, thus reducing its viscosity and allowing for a more uniform filament deposition. As for the SA-G solution without cells, a zero-shear-rate viscosity plateau of 1000 Pa·s was encountered, followed by shear-thinning behavior starting from 0.1 s−1. The presence of cells did not significantly impact the zero-shear-rate viscosity value nor the pseudoplastic behavior, in agreement with the findings of Jain et al. [36]. Another desirable rheological feature of a bioink is represented by the presence of a yield stress, which is the stress value at which the material starts flowing and, therefore, an indication of the material’s ability to maintain its own shape after the extrusion process. A high yield stress will prevent the printed structure from collapsing before cross-linking occurs. Such a characteristic was evaluated by plotting the viscoelastic properties, namely the storage modulus (G’) and loss modulus (G”), of the SA-G solutions (Figure 5b). For all solutions, at low strain values, G’ was higher than G”, thus implying that the materials have solid-like behavior, whereas starting from a strain of approximately 800%, G” was higher than G’, resulting in liquid-like behavior of the materials. The point at which G’ and G’’ have the same value is called the crossover point, and it indicates the presence of a yield stress. Indeed, after the crossover point, the material can flow, thus enabling extrusion during the 3D printing process. All inks exhibited a crossover, thus showing the presence of a clear yield stress and, hence, their extrudability. No significant differences in G’ and G” values were encountered between cell-laden bioinks and the bioink without cells.
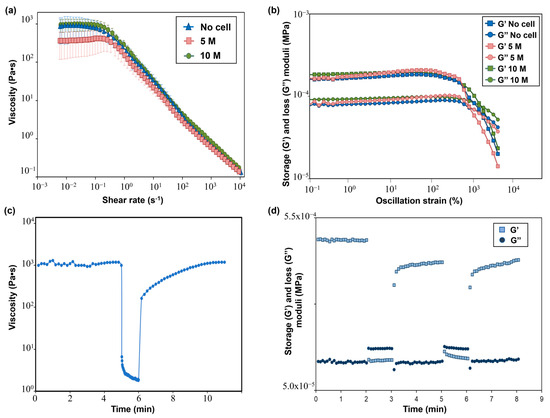
Figure 5.
(a) Flow curves showing the viscosity−shear rate behavior of SA-G bioinks with and without cells. Error bars represent the standard deviation. Analyses were performed on SA-G bioinks with no cells, with cells included at a density of 5 M cells/mL, and with cells included at a density of 10 M cells/mL; (b) Results of strain sweep tests displaying the storage (G’) and loss (G’’) moduli against the oscillation strain. G’ and G’’ are represented by square markers and circle markers, respectively. Analyses were performed on SA-G bioinks with no cells, with cells included at a density of 5 M cells/mL, and with cells included at a density of 10 M cells/mL. (c) Strain recovery test results; (d) Elastic recovery test results. G’ and G’’ are represented by square markers and circle markers, respectively. SA-G: sodium alginate–gelatin.
Recovery tests were performed to evaluate the material’s ability to regain its original properties after printing. Since rheological properties were not affected by the presence of cells at any cell density, these tests were carried out on the SA-G bioink without cells. The results of the strain recovery test are presented in Figure 5c. The viscosity at resting conditions was about 1000 Pa·s; then, when a high value of shear rate was applied, the viscosity value dramatically dropped. These results agreed with the previous findings regarding zero-shear-rate viscosity and pseudoplastic behavior. Once the high shear was removed, the viscosity returned to its initial resting value after a small transition region. Such an outcome proved that the SA-G material has fast recovery kinetics, which is essential to ensure high shape fidelity. The good material recovery ability was confirmed by the elastic recovery test, where rapid transitions from solid-like to liquid-like behavior were found when alternating stress values were applied (Figure 5d).
Taken together, these findings demonstrate that the SA-G bioink is a well-suited material for extrusion-based 3D bioprinting [37].
3.4. In Vitro Cytotoxicity
As for the cytotoxicity of the products released during material degradation, cell viability was analyzed after culturing cells in contact with eluates of the SA-G hydrogel samples for 1, 5, and 7 days. The time points were chosen according to the results of the degradation test (Section 3.1). Cell viability was not significantly affected by the presence of the degradation products (Figure 6). Indeed, at every time point, the cell viability was found to be higher than 90%. Additionally, no statistical difference was found between the viability of the controls and of the cells in contact with SA-G eluates at any time point (p-value = 0.07). This result suggests that the SA-G bioink is non-cytotoxic and, hence, can be loaded with cells for 3D bioprinting applications.
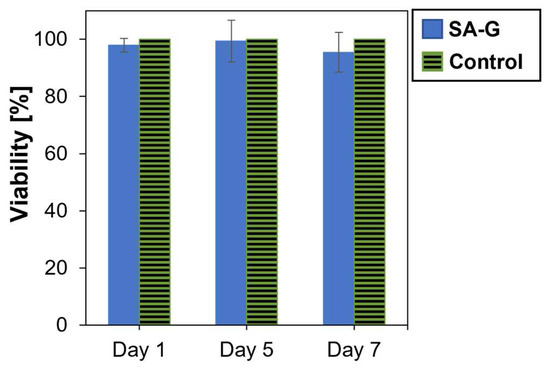
Figure 6.
Viability (%) of cells determined by the alamarBlue assay after 1, 5, and 7 days of contact with SA-G degradation products. Error bars represent the standard deviation. SA-G: sodium alginate–gelatin.
3.5. Printability Assessment
Once it was verified that the SA-G bioink met the rheological requirements needed for the extrusion-based process, filament formation and printing accuracy were assessed.
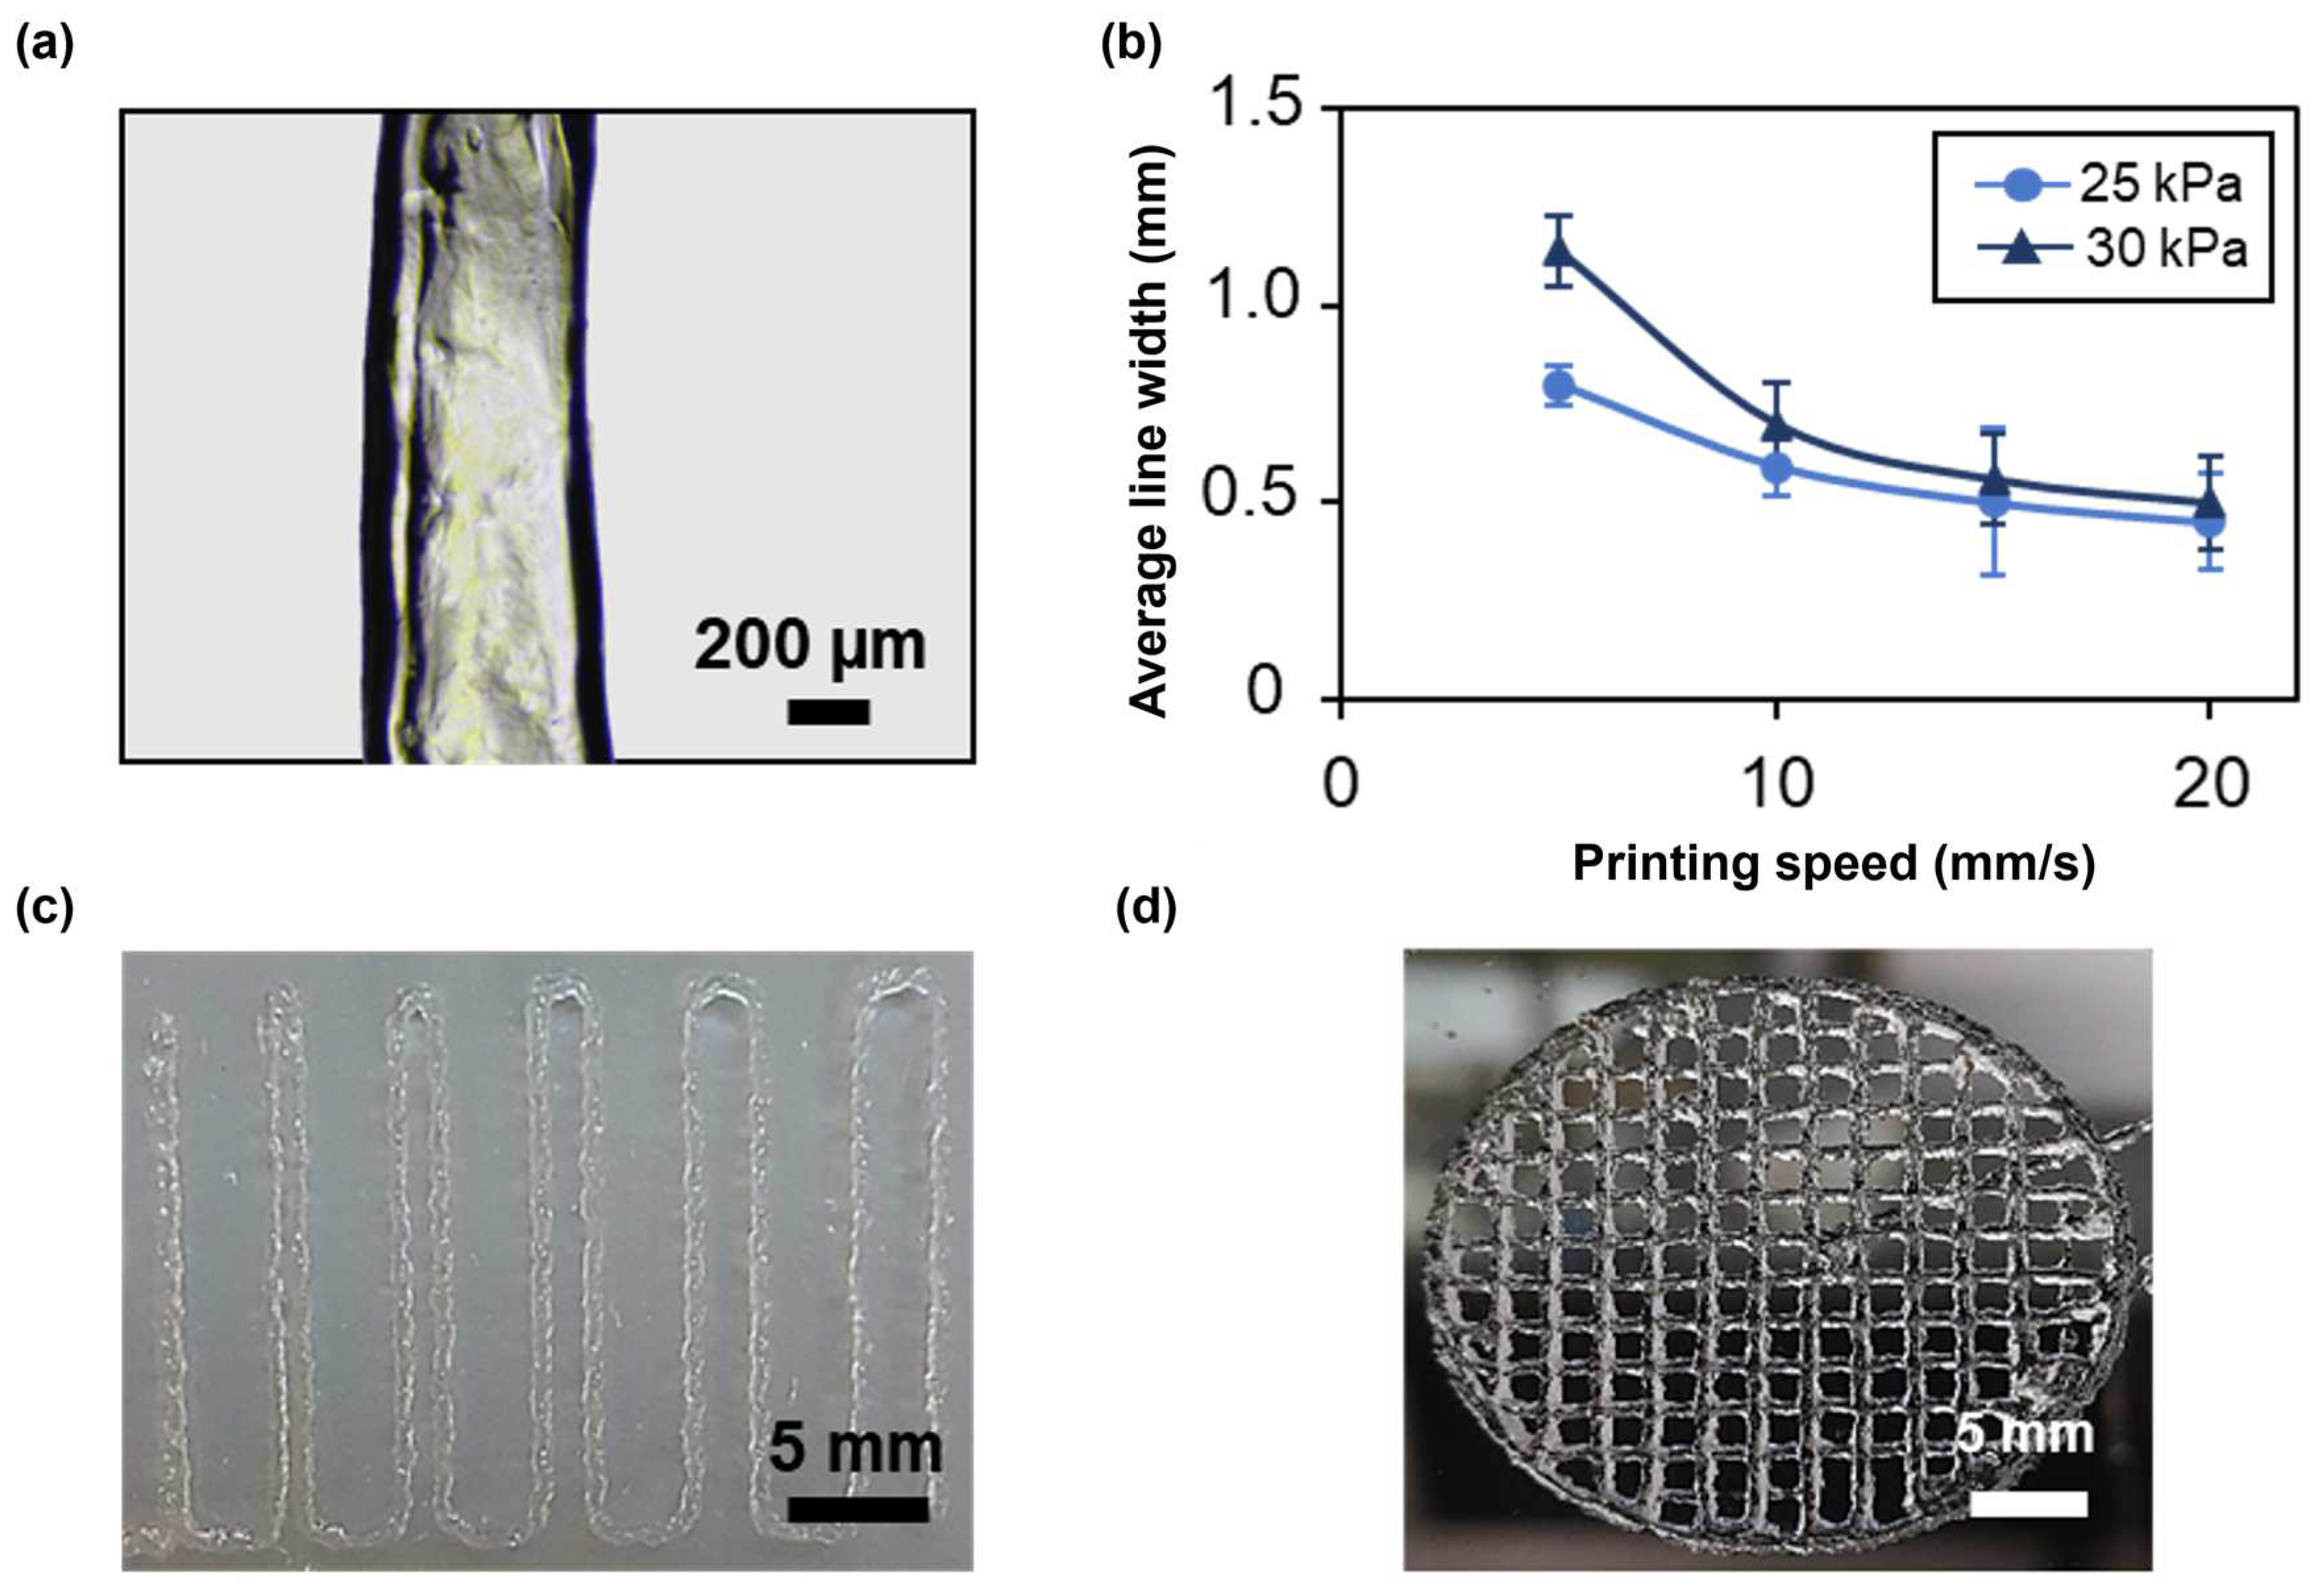
The first test consisted in printing four lines at different speeds and pressures with a 22G nozzle to evaluate filament continuity and the average line width using an optical microscope (Figure 7a). At all applied pressures, the average line width decreased as the speed increased (Figure 7b), achieving an average line width of 0.45 ± 0.124 mm at 25 kPa and of 0.5 ± 0.2 mm at 30 kPa for a printing speed of 20 mm/s, thus approximating, in both cases, the value of the nozzle inner diameter. The printing of narrower lines is due to a smaller amount of deposited material when higher speeds are applied. However, these speeds led to filament discontinuity and inhomogeneities. In contrast, filaments printed at 5 and 10 mm/s were continuous and homogeneous. Applying a higher pressure resulted in the deposition of a greater amount of material, as it induced higher flow rates. Therefore, at increasing pressures, broader lines were obtained. For instance, at a printing speed of 10 mm/s, the average line width was 0.592 ± 0.079 and 0.7 ± 0.1 for a pressure of 25 and 30 kPa, respectively. Thus, when using the 22G nozzle, the best compromise between printing resolution and filament continuity was achieved at a printing speed of 10 mm/s and an applied pressure of 25 kPa. Finally, the effect of nozzle diameter on printing resolution was evaluated by repeating the test using a 25G conical nozzle. In this case, to obtain a continuous filament, a minimum pressure of 120 kPa, nearly five times the pressure needed with the 22G nozzle, was required. Consistent with the results obtained using a 22G nozzle, the average line width decreased with increasing speed (Figure S1). The 25G nozzle provided higher printing resolution compared with the 22G nozzle, achieving an average line width of 0.30 ± 0.091 at a printing speed of 20 mm/s. These findings indicate that nozzle diameter significantly impacts the printing conditions and resolution. The choice of nozzle diameter should be tailored to the desired application. For bioinks containing cells, and especially primary cells, it is crucial to minimize cell death by optimizing the printing conditions. According to the literature, increased dispensing pressure is a major cause of cell damage due to elevated shear stresses on the cells [38]. As future studies will focus on assessing the formation of a functional photoreceptor layer that includes primary stem cells within the SA-G bioink, the 22G nozzle, a printing speed of 10 mm/s, and a pressure of 25 kPa were selected for further printability tests and for 3D bioprinting.

Figure 7.
(a) Representative microscopy image of a single printed filament. Scale bar = 200 μm. (b) Average line width at different printing speeds and pressures using a 22G conical nozzle. Error bars represent the standard deviation. (c) Picture of the result of a filament fusion test. Scale bar = 5 mm. (d) Picture of porous circular discs. Scale bar = 5 mm. All the structures were printed using SA-G bioink. SA-G: sodium alginate–gelatin.
Printing accuracy was investigated through the filament fusion test, calculation of the printability index, and the comparison of real dimensions with the digital ones. Based on the results of the filament fusion test, filaments merged only when printed at a filament spacing of 0.5 mm (Figure 7c). The same outcome was obtained when printing Nivea Creme, considered in the literature as a demonstration ink, proving SA-G bioink’s ability to print fine details like small pores with sharp angles [39]. To better investigate such capabilities, small pore geometries were obtained by printing porous circular discs (Figure 7d). Consequently, the printability index (Pr), which depends on the pore perimeter and area, was derived. The average Pr (1.080 ± 0.0025) was close to the ideal Pr, showing a high geometric accuracy. Ultimately, no relevant difference was encountered between the average diameter of the printed constructs (30.25 ± 0.056 mm) and that of the digital model (30 mm).
In conclusion, the SA-G bioink was demonstrated to be printable with high shape fidelity and printing accuracy.
3.6. Bioprinting
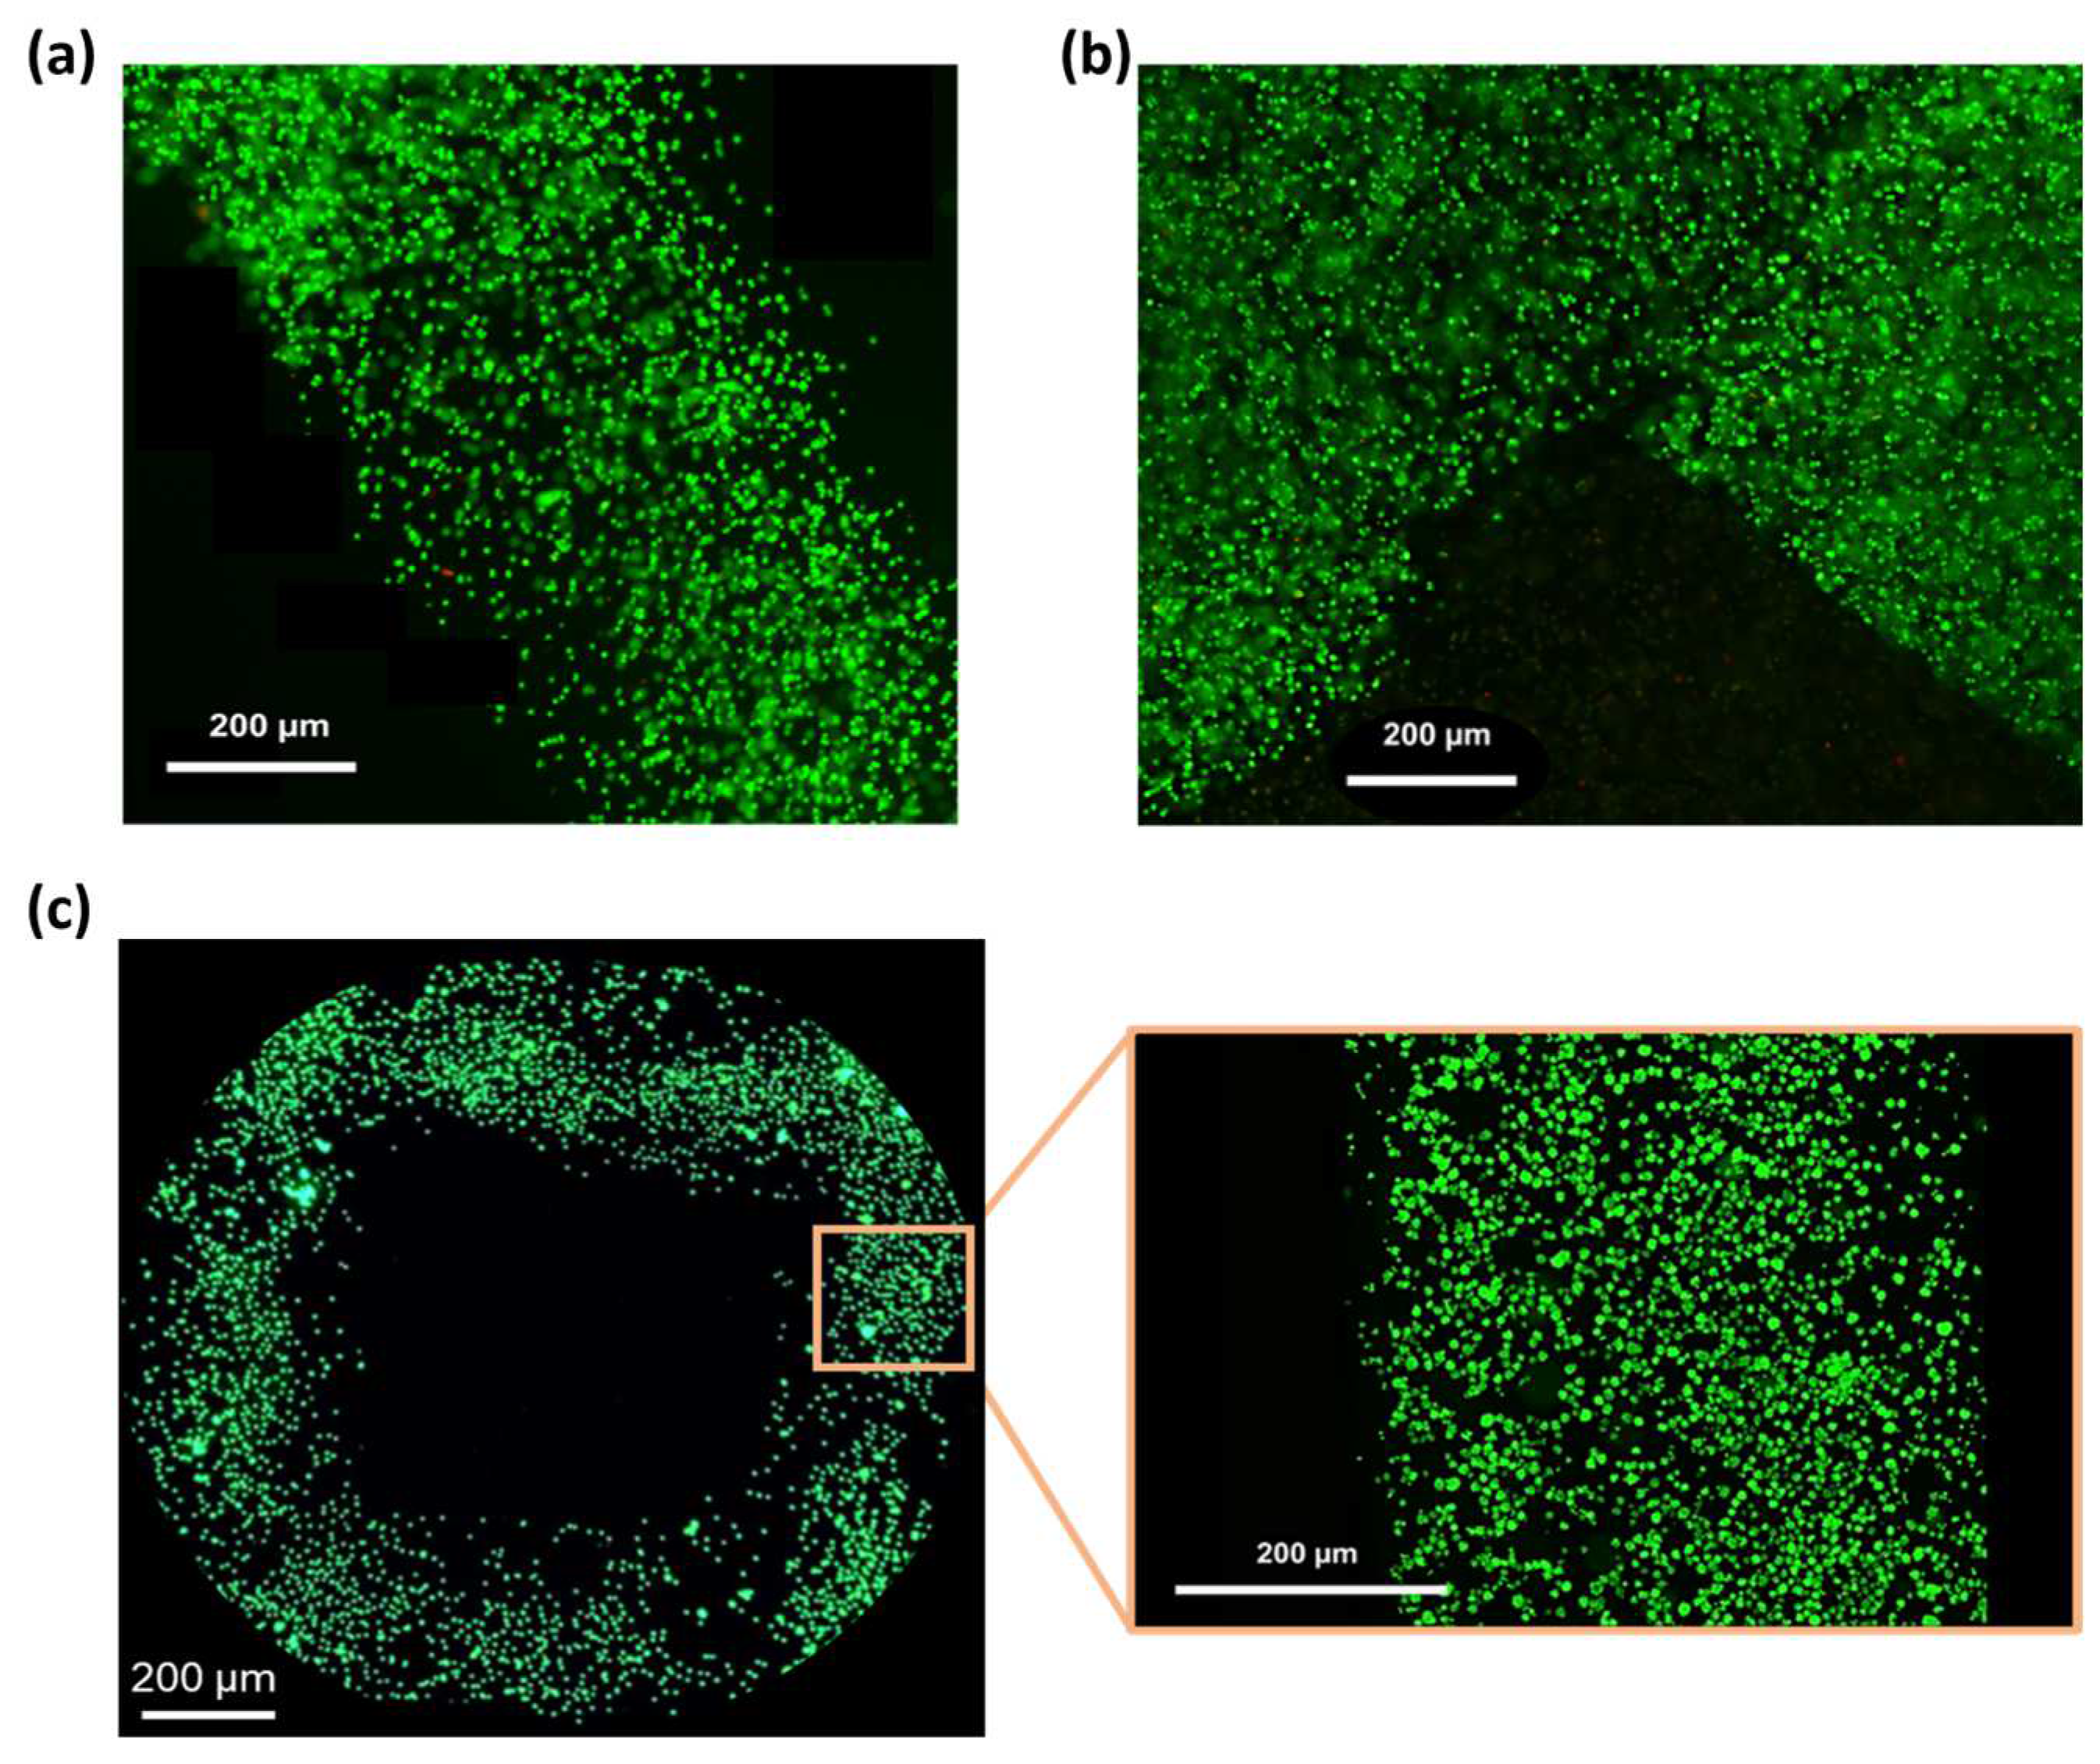
Based on the results of the printability assessment (Section 3.5), the cell-laden SA-G bioink was printed at a speed of 10 mm/s and a pressure of 25 kPa. Post-printing cell viability was assessed by staining living (green) and dead (red) cells. High cell viability (>98%) was observed after 1 day of culture (Figure 8a,b) and was maintained at day 5 (Figure 8c), with no abnormal cell death detected. This is consistent with the in vitro cytotoxicity findings (Section 3.4), confirming that the SA-G bioink does not negatively affect cell viability. In addition, the high post-printing viability indicates that the shear stresses generated during bioink printing did not cause major cell death. Ultimately, Figure 8 demonstrates a homogeneous cell distribution throughout the printed constructs.

Figure 8.
Fluorescence microscopy images of the LIVE/DEAD assay. Green and red indicate live and dead cells, respectively: (a) Image of a printed filament 1 day after printing; (b) Image of a corner within the printed grid 1 day after printing; (c) View of a pore of the printed grid and a zoomed-in view of a filament 5 days after printing. Scale bar = 200 μm.
These results pave the way for incorporating more relevant cell types, such as primary stem cells, into the bioink. In this study, a well-established immortalized cell line (L929 cells) was selected for preliminary biocompatibility screening, as there is no photoreceptor cell line able to comprehensively recapitulate photoreceptor phenotypes [4]. Further investigations are needed to assess the impact of the SA-G bioink on the behavior of primary cells.
4. Conclusions
In this study, we aimed to optimize an SA-G bioink formulation to match the properties of the native photoreceptor layer and to be successfully extruded and printed with good resolution. To assess its suitability as a substrate for photoreceptors in in vitro culture, we conducted a comprehensive characterization of an SA-G bioink. Our results showed that the stiffness of the bioink closely mimics the in vivo photoreceptor stiffness. This parameter plays a crucial role in the development of a functional photoreceptor layer, as it influences the cell behavior guiding the cell phenotype and genotype. In addition, through rheological and printability tests, we demonstrated the bioink’s ability to fabricate multilayered structures characterized by high shape fidelity. This feature is crucial for obtaining a microstructure able to drive photoreceptor polarization, thus replicating their highly organized in vivo configuration. Ultimately, the viability of fibroblasts, both in contact with material extracts and embedded within the bioink, proved that the SA-G material is non-cytotoxic. Taken together, these findings suggest that the proposed SA-G bioink may be used as a tissue mimetic to produce a cellularized construct with the specific pore size and geometry capable of promoting photoreceptor development, alignment, and functional culture in vitro. Future studies should focus on incorporating stem cells into the SA-G bioink to form a functional photoreceptor layer in vitro. This step will require the selection of the appropriate culture medium and growth factors and the execution of several tests to determine the optimal cell density for mimicking the native high packing density of photoreceptors. Different printing patterns will then be explored to determine which microstructure best supports native-like spatial cell organization. The formation of a functional photoreceptor layer will be evaluated by conducting a thorough biological analysis, including of cell viability and proliferation and the expression of specific markers. Finally, in vivo studies need to be performed to assess the functional integration and stability of the engineered photoreceptor layer.
Supplementary Materials
The following supporting information can be downloaded at: https://www.mdpi.com/article/10.3390/app14166980/s1, Figure S1: Average line width at different printing speeds using a 25G conical nozzle.
Author Contributions
Conceptualization, B.B., S.M. and F.B.; methodology, B.B. and F.I.; investigation, B.B. and F.I.; data curation, B.B. and F.P.; writing—original draft preparation, B.B.; writing—review and editing, S.M., F.I., F.P., F.B. and M.L. All authors have read and agreed to the published version of the manuscript.
Funding
This research received no external funding.
Data Availability Statement
The raw data supporting the conclusions of this article will be made available by the authors on request.
Conflicts of Interest
The authors declare no conflict of interest.
References
- Bovi dos Santos, G.; de Lima-Vasconcellos, T.H.; Móvio, M.I.; Birbrair, A.; Del Debbio, C.B.; Kihara, A.H. New Perspectives in Stem Cell Transplantation and Associated Therapies to Treat Retinal Diseases: From Gene Editing to 3D Bioprinting. Stem Cell Rev. Rep. 2024, 20, 722–737. [Google Scholar] [CrossRef] [PubMed]
- Rajendran Nair, D.S.; Seiler, M.J.; Patel, K.H.; Thomas, V.; Camarillo, J.C.M.; Humayun, M.S.; Thomas, B.B. Tissue Engineering Strategies for Retina Regeneration. Appl. Sci. 2021, 11, 2154. [Google Scholar] [CrossRef] [PubMed]
- Belgio, B.; Salvetti, A.P.; Mantero, S.; Boschetti, F. The Evolution of Fabrication Methods in Human Retina Regeneration. Appl. Sci. 2021, 11, 4102. [Google Scholar] [CrossRef]
- Schnichels, S.; Paquet-Durand, F.; Löscher, M.; Tsai, T.; Hurst, J.; Joachim, S.C.; Klettner, A. Retina in a Dish: Cell Cultures, Retinal Explants and Animal Models for Common Diseases of the Retina. Prog. Retin. Eye Res. 2020, 81, 100880. [Google Scholar] [CrossRef]
- Murphy, A.R.; Truong, Y.B.; O’Brien, C.M.; Glattauer, V. Bio-Inspired Human In Vitro Outer Retinal Models: Bruch’s Membrane and Its Cellular Interactions. Acta Biomater. 2020, 104, 1–16. [Google Scholar] [CrossRef] [PubMed]
- Steedman, M.R.; Tao, S.L.; Klassen, H.; Desai, T.A. Enhanced Differentiation of Retinal Progenitor Cells Using Microfabricated Topographical Cues. Biomed. Microdevices 2010, 12, 363–369. [Google Scholar] [CrossRef]
- Jung, Y.H.; Phillips, M.J.; Lee, J.; Xie, R.; Ludwig, A.L.; Chen, G.; Zheng, Q.; Kim, T.J.; Zhang, H.; Barney, P.; et al. 3D Microstructured Scaffolds to Support Photoreceptor Polarization and Maturation. Adv. Mater. 2018, 30, e1803550. [Google Scholar] [CrossRef]
- Hunt, N.C.; Hallam, D.; Karimi, A.; Mellough, C.B.; Chen, J.; Steel, D.H.W.; Lako, M. 3D Culture of Human Pluripotent Stem Cells in RGD-Alginate Hydrogel Improves Retinal Tissue Development. Acta Biomater. 2017, 49, 329–343. [Google Scholar] [CrossRef]
- Ghareeb, A.E.; Lako, M.; Steel, D.H. Coculture Techniques for Modeling Retinal Development and Disease, and Enabling Regenerative Medicine. Stem Cells Transl. Med. 2020, 9, 1531–1548. [Google Scholar] [CrossRef]
- McUsic, A.C.; Lamba, D.A.; Reh, T.A. Guiding the Morphogenesis of Dissociated Newborn Mouse Retinal Cells and HES Cell-Derived Retinal Cells by Soft Lithography-Patterned Microchannel PLGA Scaffolds. Biomaterials 2012, 33, 1396–1405. [Google Scholar] [CrossRef]
- Lorber, B.; Hsiao, W.K.; Hutchings, I.M.; Martin, K.R. Adult Rat Retinal Ganglion Cells and Glia Can Be Printed by Piezoelectric Inkjet Printing. Biofabrication 2014, 6, 015001. [Google Scholar] [CrossRef] [PubMed]
- Masaeli, E.; Forster, V.; Picaud, S.; Karamali, F.; Nasr-Esfahani, M.H.; Marquette, C. Tissue Engineering of Retina through High Resolution 3-Dimensional Inkjet Bioprinting. Biofabrication 2020, 12, 025006. [Google Scholar] [CrossRef] [PubMed]
- Shi, P.; Tan, Y.S.E.; Yeong, W.Y.; Li, H.Y.; Laude, A. A Bilayer Photoreceptor-Retinal Tissue Model with Gradient Cell Density Design: A Study of Microvalve-Based Bioprinting. J. Tissue Eng. Regen. Med. 2018, 12, 1297–1306. [Google Scholar] [CrossRef] [PubMed]
- Tripathi, S.; Mandal, S.S.; Bauri, S.; Maiti, P. 3D Bioprinting and Its Innovative Approach for Biomedical Applications. MedComm 2023, 4, e194. [Google Scholar] [CrossRef] [PubMed]
- Perin, F.; Spessot, E.; Famà, A.; Bucciarelli, A.; Callone, E.; Mota, C.; Motta, A.; Maniglio, D. Modeling a Dynamic Printability Window on Polysaccharide Blend Inks for Extrusion Bioprinting. ACS Biomater. Sci. Eng. 2023, 9, 1320–1331. [Google Scholar] [CrossRef] [PubMed]
- Schwab, A.; Levato, R.; D’Este, M.; Piluso, S.; Eglin, D.; Malda, J. Printability and Shape Fidelity of Bioinks in 3D Bioprinting. Chem. Rev. 2020, 120, 11028–11055. [Google Scholar] [CrossRef] [PubMed]
- Shi, P.; Edgar, T.Y.S.; Yeong, W.Y.; Laude, A. Hybrid Three-Dimensional (3D) Bioprinting of Retina Equivalent for Ocular Research. Int. J. Bioprint. 2017, 3, 138–146. [Google Scholar] [CrossRef] [PubMed]
- Wang, P.; Li, X.; Zhu, W.; Zhong, Z.; Moran, A.; Wang, W.; Zhang, K.; Chen, S. 3D Bioprinting of Hydrogels for Retina Cell Culturing. Bioprinting 2018, 12, e00029. [Google Scholar] [CrossRef] [PubMed]
- Hiller, T.; Berg, J.; Elomaa, L.; Röhrs, V.; Ullah, I.; Schaar, K.; Dietrich, A.C.; Al-Zeer, M.A.; Kurtz, A.; Hocke, A.C.; et al. Generation of a 3D Liver Model Comprising Human Extracellular Matrix in an Alginate/Gelatin-Based Bioink by Extrusion Bioprinting for Infection and Transduction Studies. Int. J. Mol. Sci. 2018, 19, 3129. [Google Scholar] [CrossRef]
- Fantini, V.; Bordoni, M.; Scocozza, F.; Conti, M.; Scarian, E.; Carelli, S.; Di Giulio, A.M.; Marconi, S.; Pansarasa, O.; Auricchio, F.; et al. Bioink Composition and Printing Parameters for 3D Modeling Neural Tissue. Cells 2019, 8, 830. [Google Scholar] [CrossRef]
- Bedell, M.L.; Navara, A.M.; Du, Y.; Zhang, S.; Mikos, A.G. Polymeric Systems for Bioprinting. Chem. Rev. 2020, 120, 10744–10792. [Google Scholar] [CrossRef] [PubMed]
- Shams, E.; Barzad, M.S.; Mohamadnia, S.; Tavakoli, O.; Mehrdadfar, A. A Review on Alginate-Based Bioinks, Combination with Other Natural Biomaterials and Characteristics. J. Biomater. Appl. 2022, 37, 355–372. [Google Scholar] [CrossRef] [PubMed]
- Wang, X.; Ao, Q.; Tian, X.; Fan, J.; Tong, H.; Hou, W.; Bai, S. Gelatin-Based Hydrogels for Organ 3D Bioprinting. Polymers 2017, 9, 401. [Google Scholar] [CrossRef] [PubMed]
- Fayyazbakhsh, F.; Khayat, M.J.; Leu, M.C. 3D-Printed Gelatin-Alginate Hydrogel Dressings for Burn Wound Healing: A Comprehensive Study. Int. J. Bioprint. 2022, 8, 274–291. [Google Scholar] [CrossRef] [PubMed]
- Lu, H.; Butler, J.A.; Britten, N.S.; Venkatraman, P.D.; Rahatekar, S.S. Natural Antimicrobial Nano Composite Fibres Manufactured from a Combination of Alginate and Oregano Essential Oil. Nanomaterials 2021, 11, 2062. [Google Scholar] [CrossRef] [PubMed]
- Lee, B.H.; Lum, N.; Seow, L.Y.; Lim, P.Q.; Tan, L.P. Synthesis and Characterization of Types A and B Gelatin Methacryloyl for Bioink Applications. Materials 2016, 9, 797. [Google Scholar] [CrossRef] [PubMed]
- Belgio, B.; Boschetti, F.; Mantero, S. Towards an In Vitro Retinal Model to Study and Develop New Therapies for Age-Related Macular Degeneration. Bioengineering 2021, 8, 18. [Google Scholar] [CrossRef] [PubMed]
- Rahimnejad, M.; Labonté-Dupuis, T.; Demarquette, N.R.; Lerouge, S. A Rheological Approach to Assess the Printability of Thermosensitive Chitosan-Based Biomaterial Inks. Biomed. Mater. 2020, 16, 015003. [Google Scholar] [CrossRef]
- Ribeiro, A.; Blokzijl, M.M.; Levato, R.; Visser, C.W.; Castilho, M.; Hennink, W.E.; Vermonden, T.; Malda, J. Assessing Bioink Shape Fidelity to Aid Material Development in 3D Bioprinting. Biofabrication 2018, 10, 014102. [Google Scholar] [CrossRef]
- Bociaga, D.; Bartniak, M.; Grabarczyk, J.; Przybyszewska, K. Sodium Alginate/Gelatine Hydrogels for Direct Bioprinting-the Effect of Composition Selection and Applied Solvents on the Bioink Properties. Materials 2019, 12, 2669. [Google Scholar] [CrossRef]
- Li, Z.; Huang, S.; Liu, Y.; Yao, B.; Hu, T.; Shi, H.; Xie, J.; Fu, X. Tuning Alginate-Gelatin Bioink Properties by Varying Solvent and Their Impact on Stem Cell Behavior. Sci. Rep. 2018, 8, 8020. [Google Scholar] [CrossRef]
- Barceló, X.; Eichholz, K.F.; Garcia, O.; Kelly, D.J. Tuning the Degradation Rate of Alginate-Based Bioinks for Bioprinting Functional Cartilage Tissue. Biomedicines 2022, 10, 1621. [Google Scholar] [CrossRef]
- Ferrara, M.; Lugano, G.; Sandinha, M.T.; Kearns, V.R.; Geraghty, B.; Steel, D.H.W. Biomechanical Properties of Retina and Choroid: A Comprehensive Review of Techniques and Translational Relevance. Eye 2021, 35, 1818–1832. [Google Scholar] [CrossRef] [PubMed]
- He, J.; Chen, R.; Lu, Y.; Zhan, L.; Liu, Y.; Li, D.; Jin, Z. Fabrication of Circular Microfluidic Network in Enzymatically-Crosslinked Gelatin Hydrogel. Mater. Sci. Eng. C 2016, 59, 53–60. [Google Scholar] [CrossRef] [PubMed]
- Qu, Y.; He, Y.; Zhang, Y.; Ma, T.; Zhu, J.; Miao, Y.; Dai, C.; Humayun, M.; Zhou, Q.; Chen, Z. Quantified Elasticity Mapping of Retinal Layers Using Synchronized Acoustic Radiation Force Optical Coherence Elastography. Biomed Opt. Express. 2018, 9, 4054–4063. [Google Scholar] [CrossRef]
- Jain, T.; Baker, H.B.; Gipsov, A.; Fisher, J.P.; Joy, A.; Kaplan, D.S.; Isayeva, I. Impact of Cell Density on the Bioprinting of Gelatin Methacrylate (GelMA) Bioinks. Bioprinting 2021, 22, e00131. [Google Scholar] [CrossRef]
- Ouyang, L.; Highley, C.B.; Rodell, C.B.; Sun, W.; Burdick, J.A. 3D Printing of Shear-Thinning Hyaluronic Acid Hydrogels with Secondary Cross-Linking. ACS Biomater. Sci. Eng. 2016, 2, 1743–1751. [Google Scholar] [CrossRef] [PubMed]
- Xu, H.Q.; Liu, J.C.; Zhang, Z.Y.; Xu, C.X. A Review on Cell Damage, Viability, and Functionality during 3D Bioprinting. Mil. Med. Res. 2022, 9, 70. [Google Scholar] [CrossRef]
- Paxton, N.; Smolan, W.; Böck, T.; Melchels, F.; Groll, J.; Jungst, T. Proposal to Assess Printability of Bioinks for Extrusion-Based Bioprinting and Evaluation of Rheological Properties Governing Bioprintability. Biofabrication 2017, 9, 044107. [Google Scholar] [CrossRef]


Disclaimer/Publisher’s Note: The statements, opinions and data contained in all publications are solely those of the individual author(s) and contributor(s) and not of MDPI and/or the editor(s). MDPI and/or the editor(s) disclaim responsibility for any injury to people or property resulting from any ideas, methods, instructions or products referred to in the content. |
© 2024 by the authors. Licensee MDPI, Basel, Switzerland. This article is an open access article distributed under the terms and conditions of the Creative Commons Attribution (CC BY) license (https://creativecommons.org/licenses/by/4.0/).