Abstract
In daily routine movement, the ankle joint plays a crucial role in stability and mobility, especially when different types of terrain are involved. However, the simple task of standing can become a biomechanical difficulty when performed on a slope since demands that have to be accommodated are made on the complex structure of the ankle joint. The purpose of this study is to develop finite element (FE) models of the ankle joint with different inclined foot postures and to analyse the stress distributions on the ankle joint while standing on an inclined or declined surface. In this study, the FE model of the foot was developed, and von Mises stress distribution at the ankle joint was explored. The results show that the bone, cartilage, and ligament of the ankle experienced a different von Mises stress distribution pattern during flat standing in comparison with slope standing. In addition, this study found that the maximum von Mises stress distribution at the component of the ankle joint is higher during slope standing than flat standing. Taken together, these results suggest that slope standing, both inclined and declined, with more than 10° inclination, might contribute to a higher risk of injury as a higher maximum stress was observed. Therefore, to maintain proper body posture, it is suggested that weight be evenly distributed at both feet, since this can reduce stress at the ankle.
1. Introduction
Standing on slopes, whether inclined or declined, presents unique challenges to the human body’s balance and stability [1]. In everyday life, encounters with sloped surfaces are common, ranging from walking up a hill to navigating stairs or ramps. The human body’s intricate interactions with muscle control, gravitational forces, and sensory systems enable it to stay balanced on sloped surfaces. When standing on an inclined or declined surface, individuals must adapt their posture, muscle activation patterns, and weight distribution to counteract the effects of gravity pulling them downhill or uphill [2]. This adjustment involves complex neuromuscular coordination to stabilise the body and prevent falls or loss of balance.
One of the benefits of standing on an inclined or declined surface in biomechanics is that it challenges the body’s proprioceptive system [3], which is responsible for sensing and controlling body position and movement. This can lead to improved coordination and proprioception, ultimately enhancing overall stability and balance. Additionally, standing on an inclined or declined surface can improve muscle strength and endurance [4], as well as increase blood flow to the lower extremities. This can also help to improve posture and reduce muscle soreness.
However, standing on an inclined or declined surface also poses certain risks in biomechanics. The uneven surface can place added stress on the joints, particularly the ankles and knees, increasing the risk of injury [5]. It is important to start with a gradual incline or decline and progress slowly to allow the body to adapt and strengthen the necessary muscles and ligaments. It is also important to use proper form when standing on an incline or decline. Bending the knees and keeping the body upright is essential. Finally, it is important to stretch before and after any exercise on an incline or decline to reduce the risk of injury.
Ankle stability and strength play a crucial role when standing on an inclined or declined surface in biomechanics. The uneven terrain can put extra strain on the ankles, increasing the risk of sprains or other injuries [6]. It is important to have good ankle mobility and engage the muscles surrounding the ankle joint to maintain balance and prevent instability. Ankle exercises such as squats, lunges, and calf raises can help to improve stability and strength.
The finite element analysis (FEA) has been utilised as an addition to experimental methods in order to anticipate the load distribution between the foot and various supports. FEA was commonly utilised previously in order to investigate the ankle joint. A model of the foot using FEA has been developed to investigate the dynamic behaviour and internal loading during standing [7]. In addition, the ankle joint model using three-dimensional (3D) actual geometry of skeletal and soft tissue has also been developed in order to analyse the effect of soft tissue stiffness on plantar pressure distribution and internal load transfer [8]. Instead of static, FEA has also been integrated with rigid body dynamic analysis during gait to obtain the contact pressure distribution at the knee and ankle joint [9]. Other than that, in the physical well-being aspect, the FEA model has been established in order to explore the effect of sagittal angle related to posterior malleolus fracture [10]. FEA has also been applied in developing a new approach to ankle prosthesis [11] and in investigating the performance of the ankle prosthesis during gait [12]. These approaches provide additional information on the internal stresses and strains of the ankle–foot complex [8]. A simulation on finite element analysis is required to investigate and analyse the ankle joint due to these conditions. However, there is a limited research focus on the ankle joint model simulation during slope standing.
It is crucial to comprehend the physiological reactions and biomechanical theories linked to slope standing in order to improve sports performance, optimise rehabilitation regimens, and build ergonomic workspaces. Researchers and practitioners may develop interventions to lessen the difficulties associated with incline and decline standing by clarifying the elements impacting balance and stability on sloped surfaces. This will ultimately improve safety, effectiveness, and well-being in a variety of contexts. Thus, the objectives of this study are to develop finite element models of the ankle joint with different inclined foot postures and to analyse the stress distributions on the ankle joint while standing on an inclined or declined surface.
2. Materials and Methods
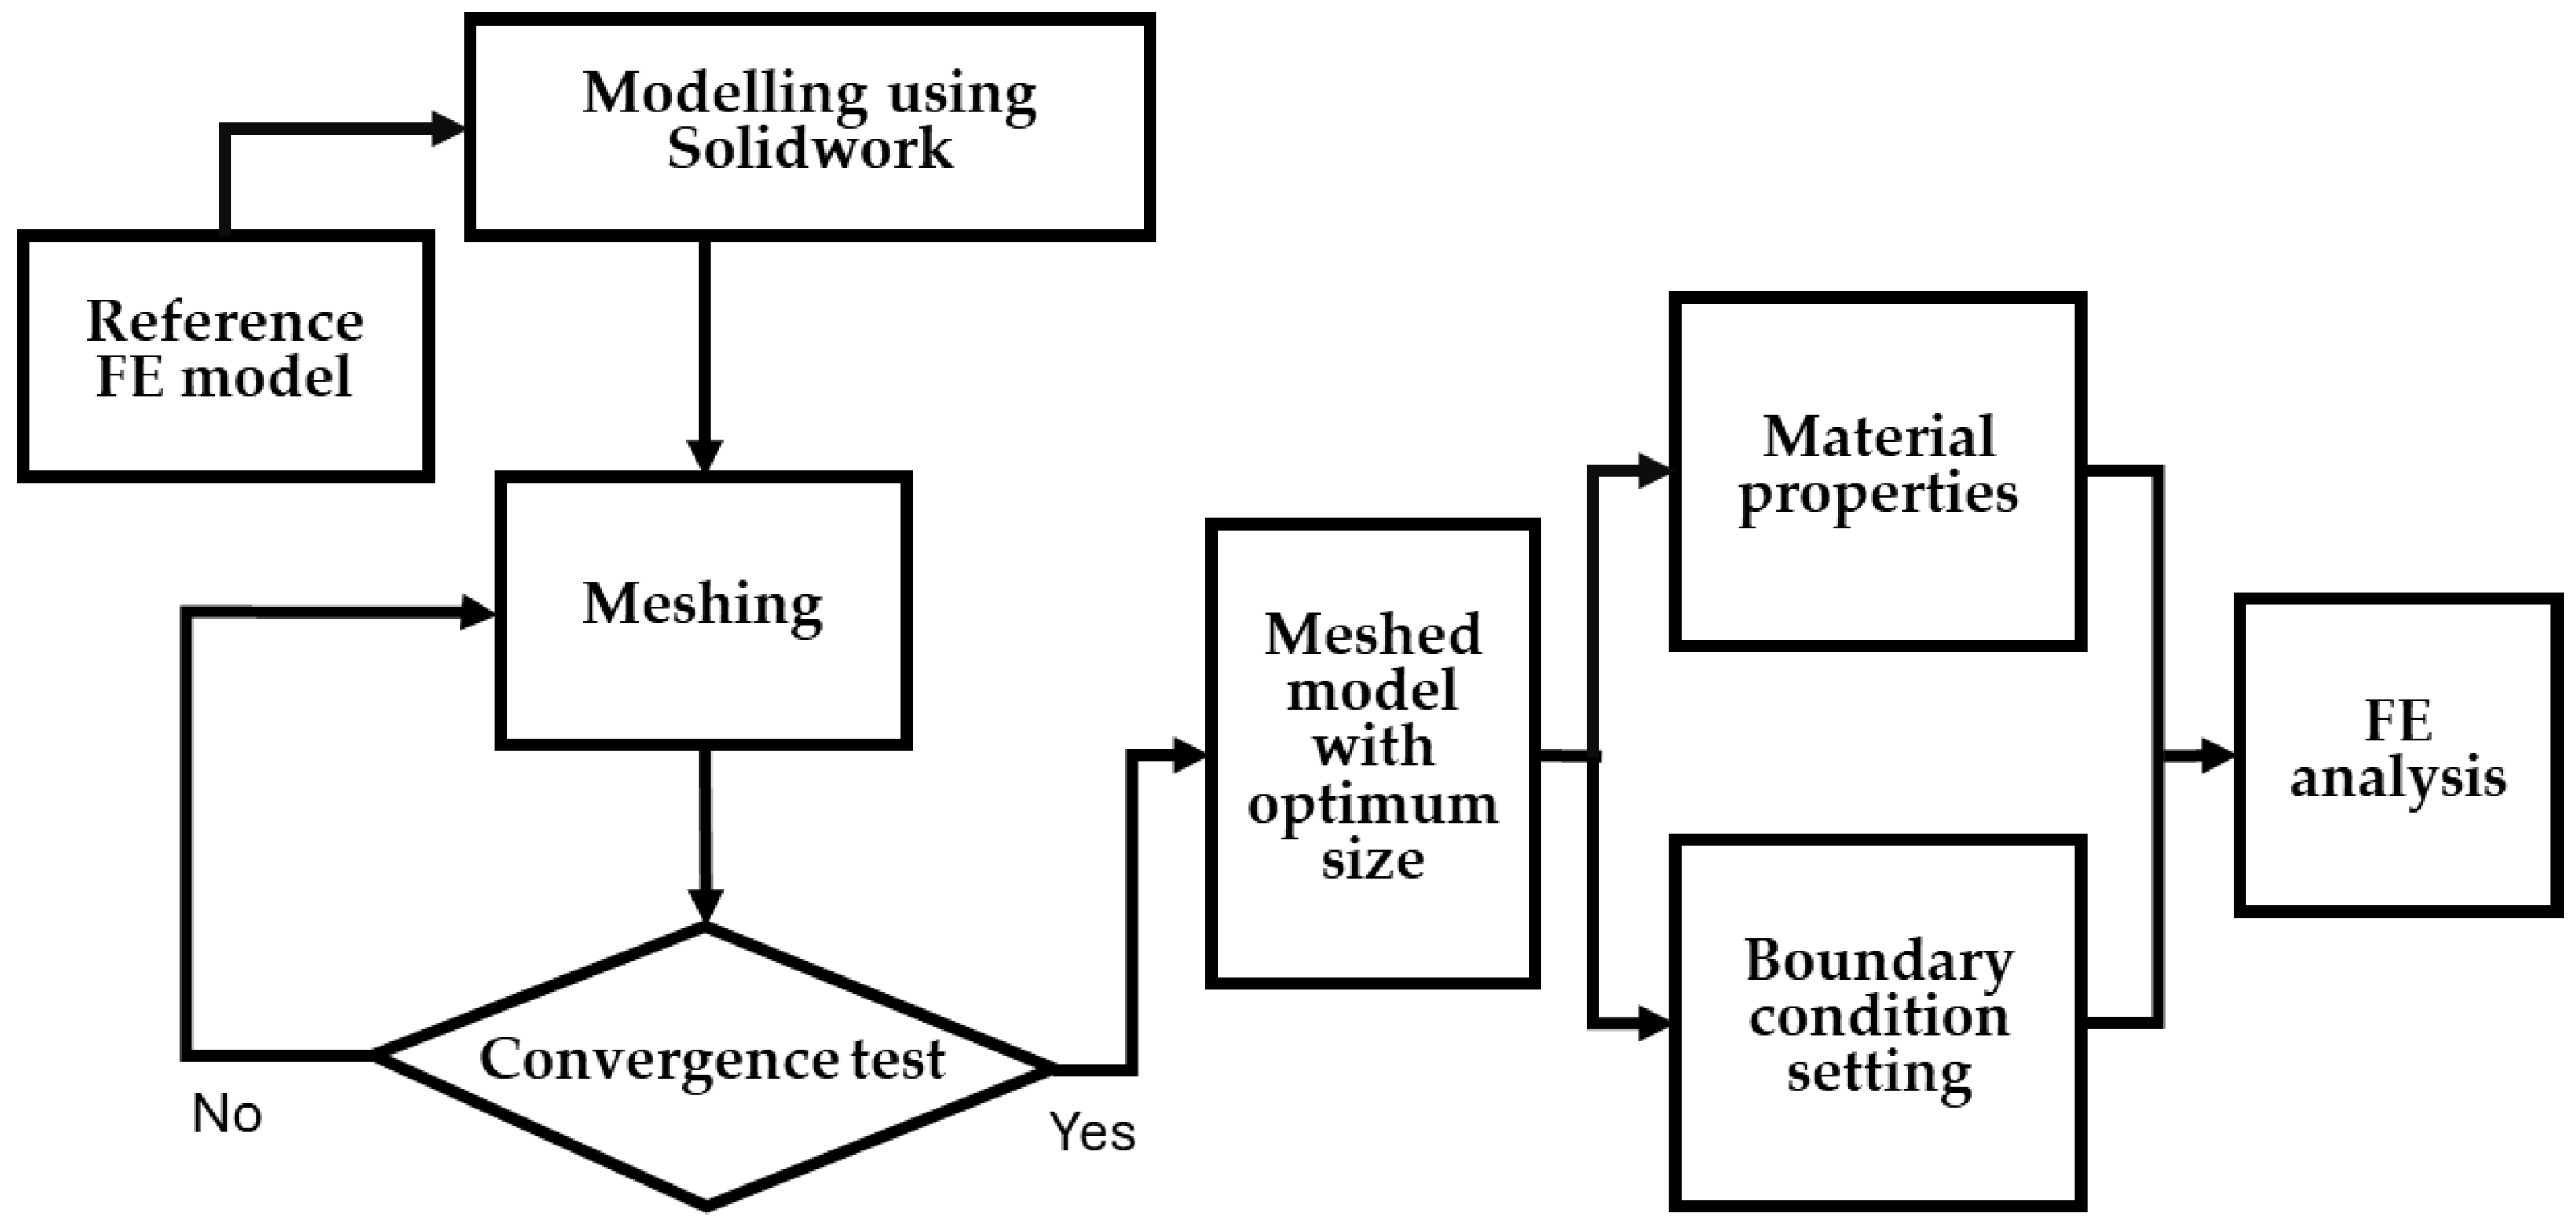
The workflow of the present method is shown in Figure 1. A three-dimensional (3D) model of the ankle was developed based on the reference model obtained from the Turbosquid database. The model represents a foot of a male subject with an age of 23 years, body weight of 60 kg, and foot length of 245 cm. The 3D model was created using Solidworks 2018 and meshed using ANSYS version 19.2. A convergence test was performed to determine the optimum element size. The meshed model was then put through the common FE analysis process.

Figure 1.
Workflow of the present study.
2.1. Geometrical Modelling of the Ankle Joint
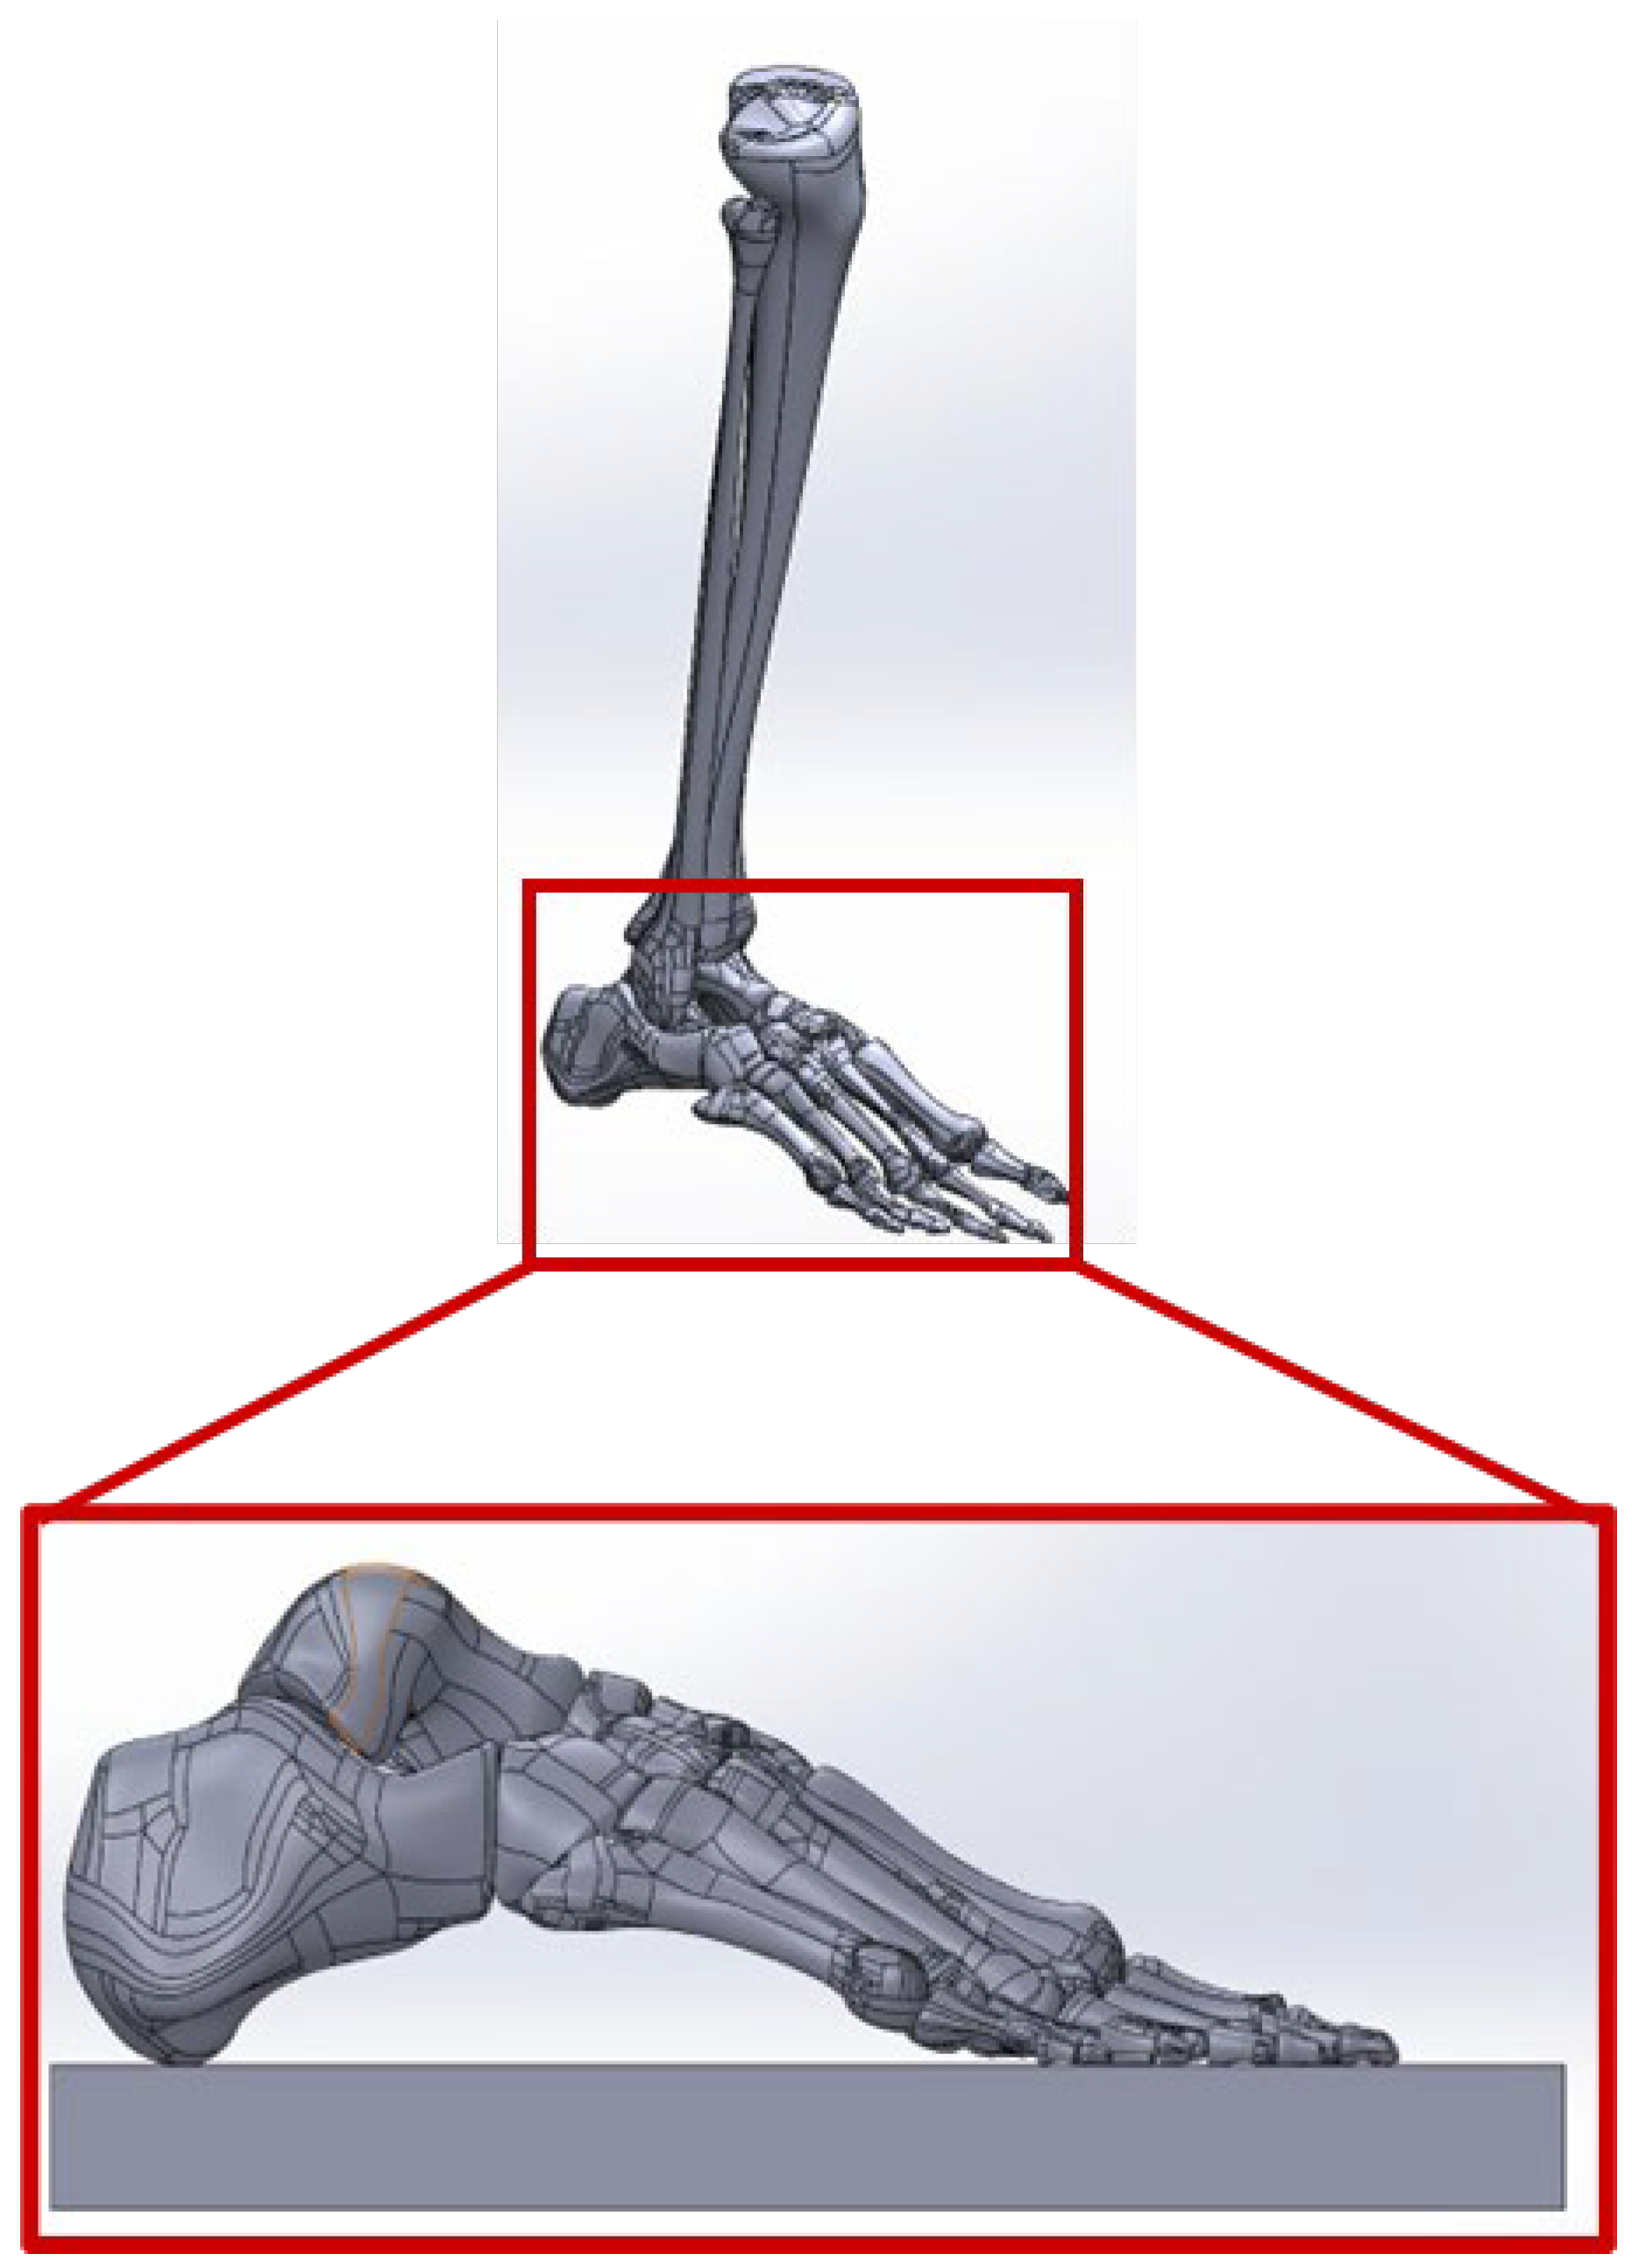
Figure 2 shows a geometrical model of bone structure in 3D. The model is not combined as one model because there are no ligaments and cartilages in the original foot model. Hence, the gaps between the bones need to be filled with the cartilage and connected by ligaments. The phalanges were assumed to contact the plane surface.
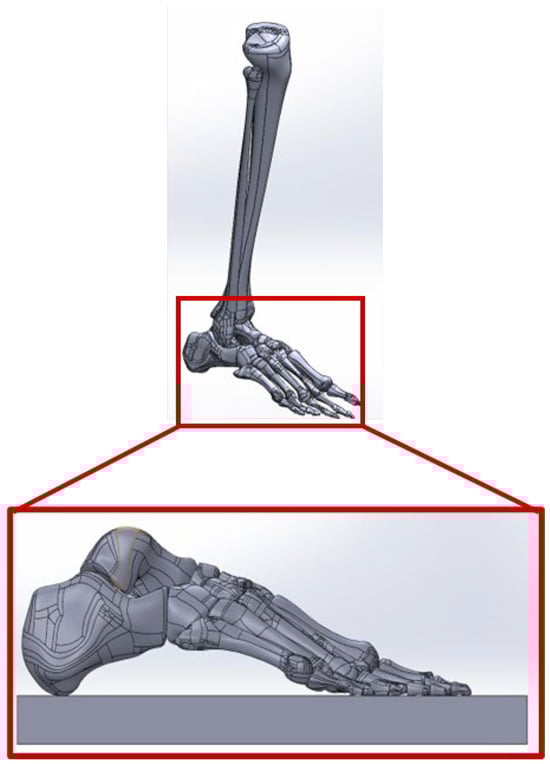
Figure 2.
The bone structure of the foot on a plane surface.
The construction and insertion site of the cartilage and ligaments to the foot model are based on the X-ray image of the subject’s foot. Cartilages were added inside the model using Solidworks 2018 software. Cartilage is a tissue that connects bone to bone. A simple shape was created and added at the specified location based on the X-ray image and verified through literature. By changing the plane’s degree and axis, all cartilage can be created and connected in the model. The intersect function was used to create an inner volume between the bones. The interaction volume is the simulated cartilage in the model. Figure 3a shows the cartilage in the model, which is in red.
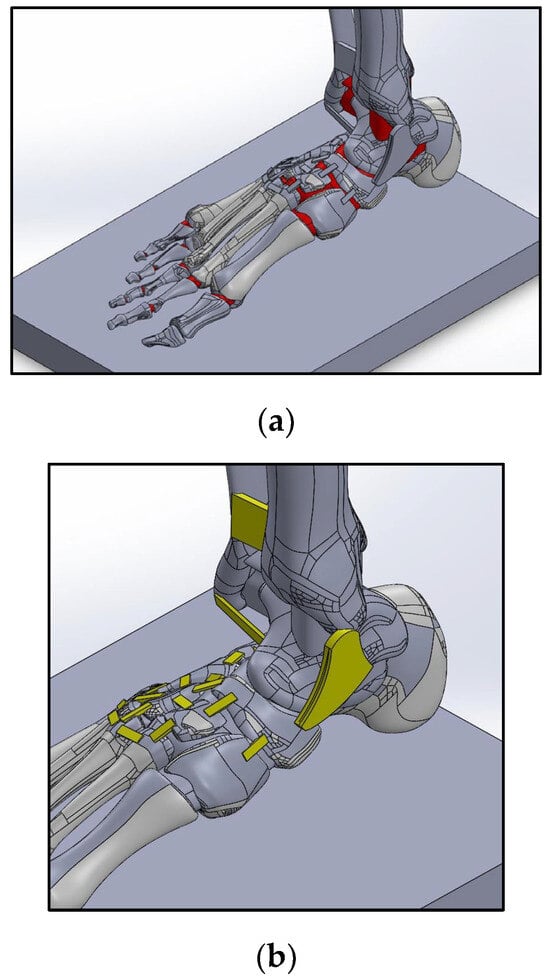
Figure 3.
Model of foot. (a) Cartilages in ankle joint model. (b) Ligaments in the foot.
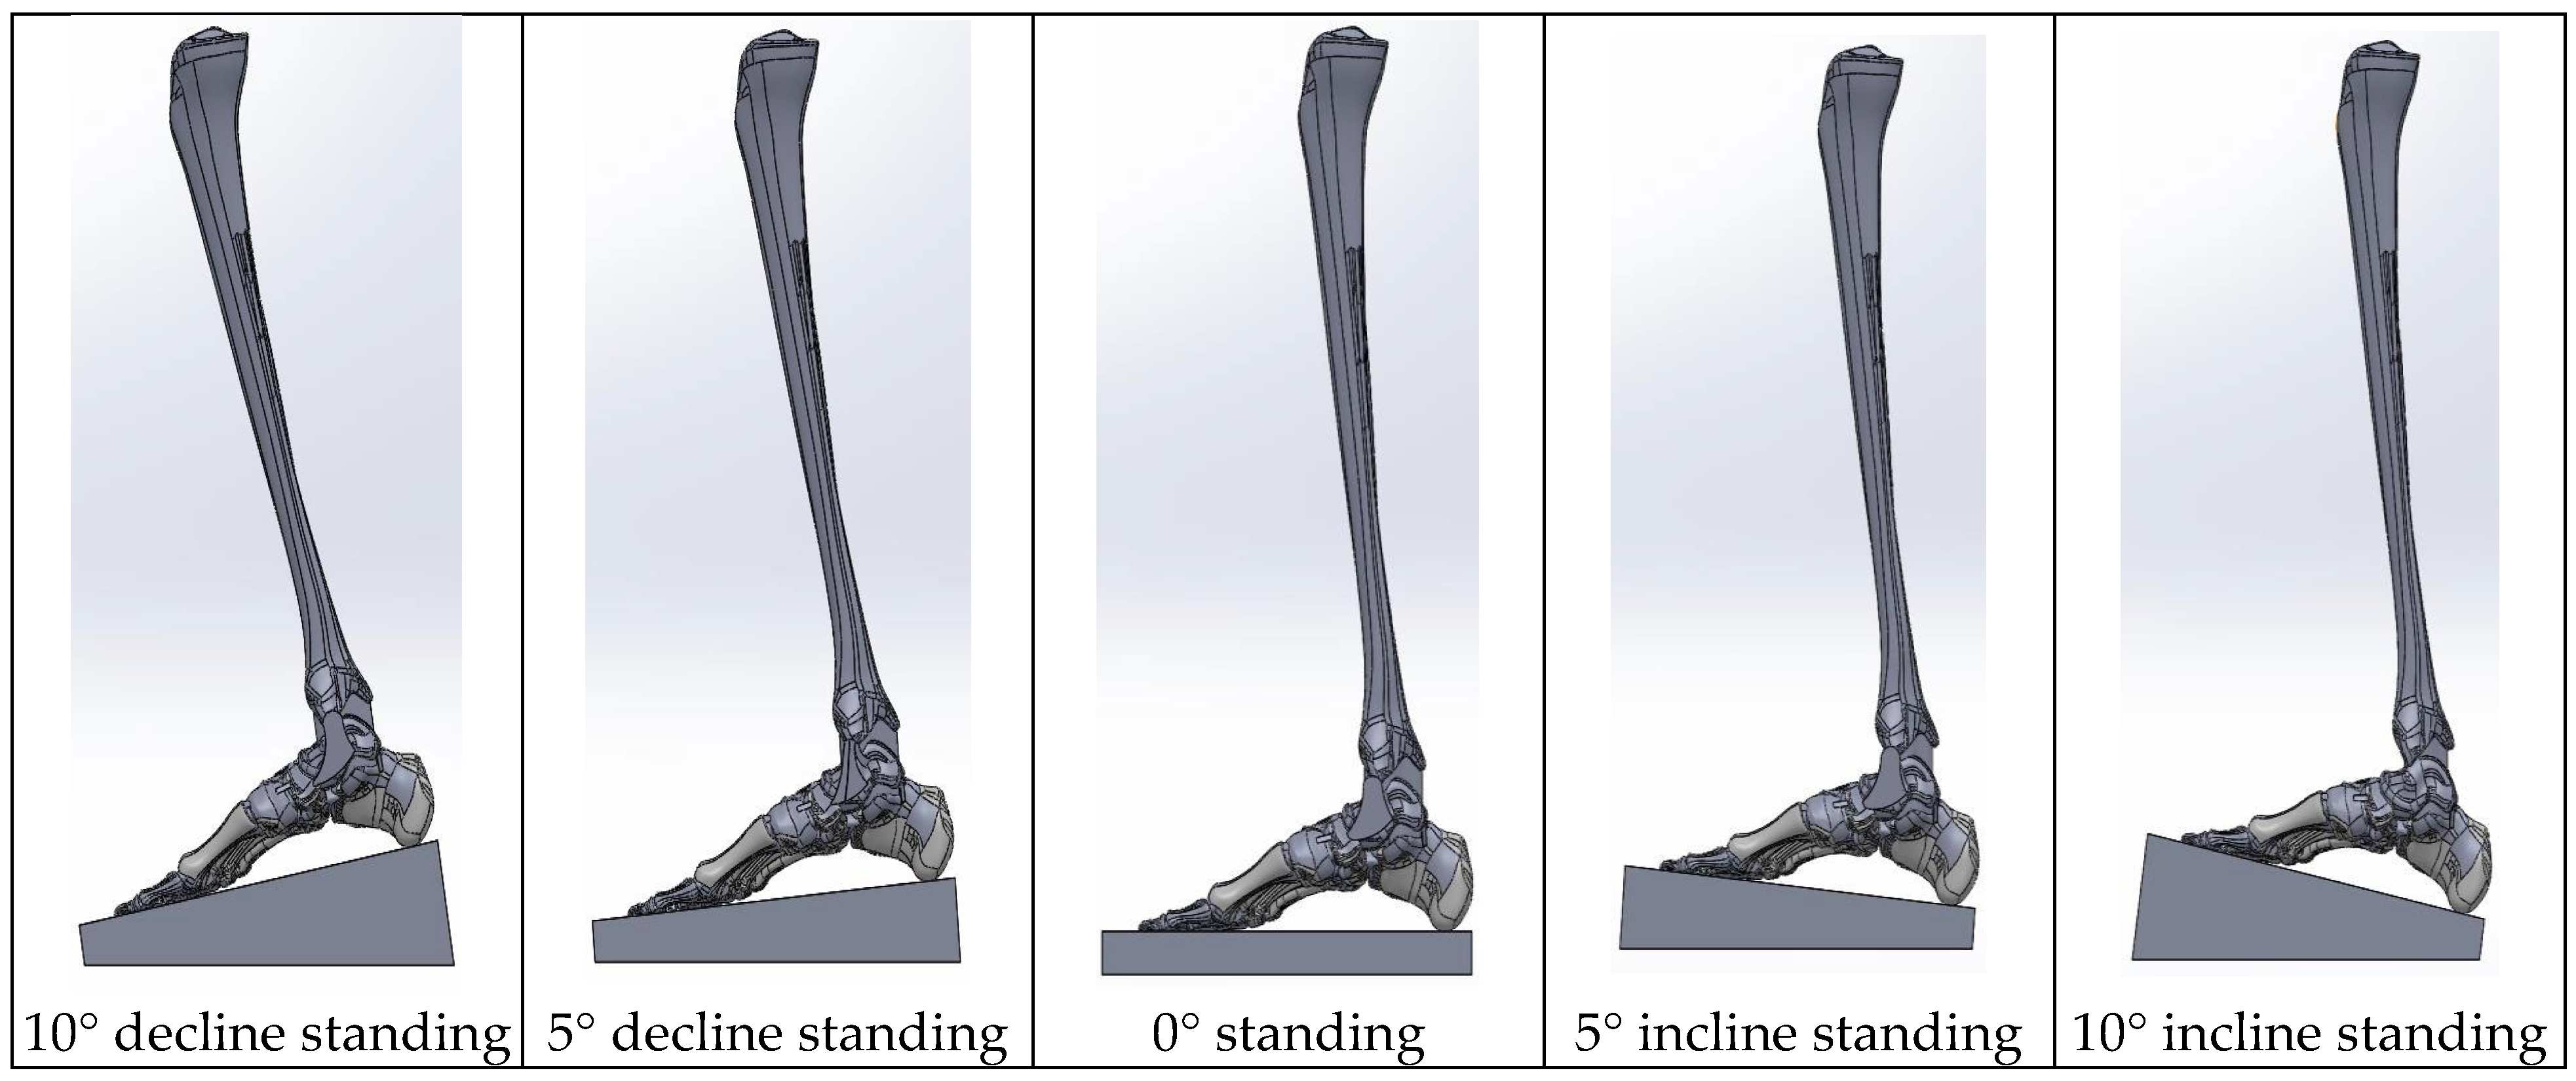
Next, the ligaments were included in the model. A simple structure was created and attached to all the important locations to simulate the ligaments. A model that included ligaments (yellow) was created, as shown in Figure 3b. After the model was created, this model was simulated to stand on the level surface. For various inclined and declined surfaces, the plate angle was changed to simulate the slope surface standing. Figure 4 shows the different models in the various inclined surfaces created according to the literature [13]. The knee was assumed to adopt the effect of incline/decline surfaces to maintain the orientation of tibia perpendicular to the foot.
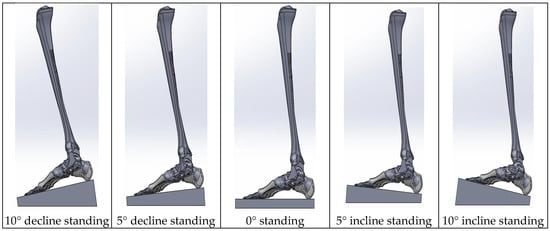
Figure 4.
Models of the foot at various incline/decline surfaces.
2.2. Finite Element Model of Ankle Joint
- (a)
- Meshing
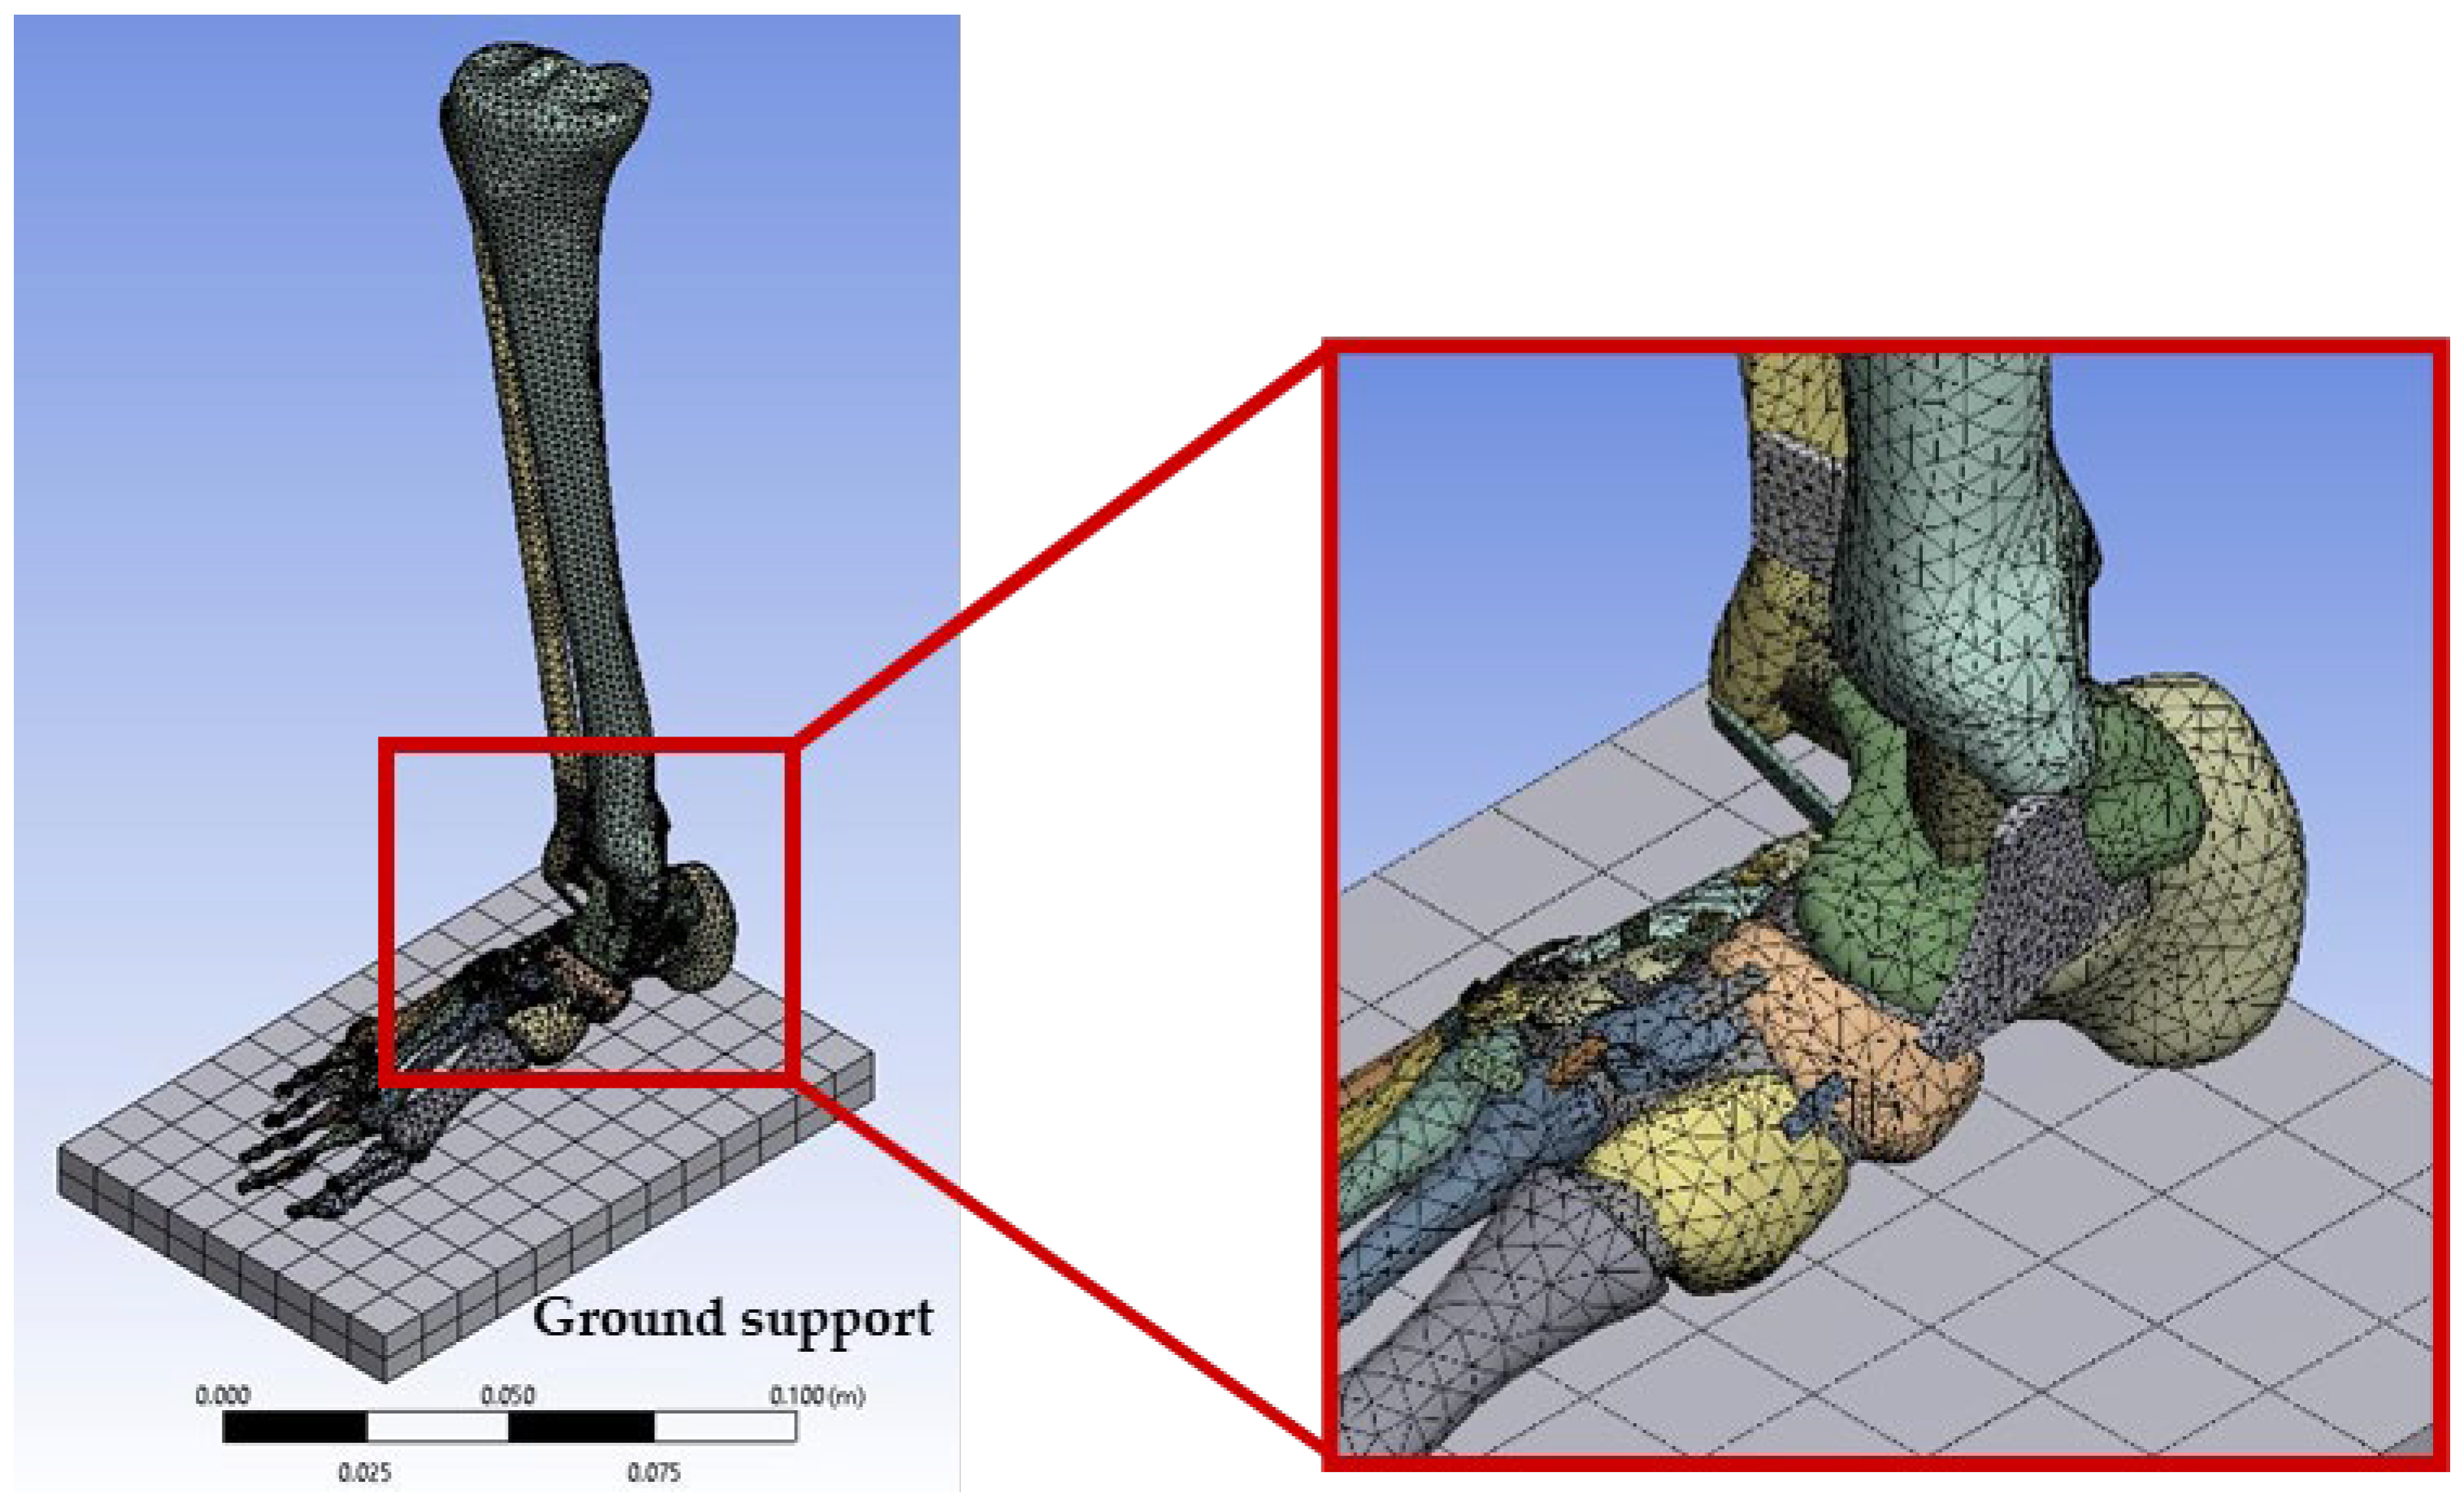
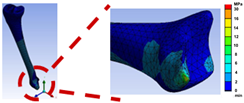
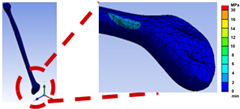
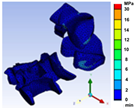
Meshing is a part of the engineering simulation process where complex geometries are divided into elements. Good meshing is required in critical areas such as areas of interest in stress distribution (ankle joint) to increase the accuracy of simulation results. Before meshing was performed, the model was exported in a STEP file and opened in ANSYS. The finite element model was meshed with the ten-nodes 3D-tetrahedral element for bone, cartilage, ligament, and ground support. The ligaments were modelled as a solid element to observe the stress distribution on it. Although most of the previous studies used a tension-only truss to model the ligaments [8,11], there are also previous studies that used isotropic solid element, as mentioned by [14]. Two elements were set on the thickness of each ligament. The model was performed under linear static analysis. Figure 5 shows the complete meshing of the ankle joint model, and the magnified view of the ankle joint.

Figure 5.
Complete meshed model with magnified view of the ankle joint.
- (b)
- Convergence test
The number of elements was based on different sets of mesh sizes and types from the previous meshing. The meshing process of the model needs to be set with fixed mesh types but different sizes to obtain a different number of elements in each part. The solution made with a mesh discretization was observed and recorded. Then, it proceeded with finer mesh, and the results were compared with the previous test. If the results showed a different significant amount, the process was repeated with finer mesh. This step was repeated until the results were approximately similar for the mesh to be considered enough for the model. The increment of the element number resulted in a longer computational time due to the time-consuming nature of solving the mathematical models to complete the solution. Excessively large values of element size should be avoided because the result produced by ANSYS will be inaccurate and contain a higher percentage value of error.
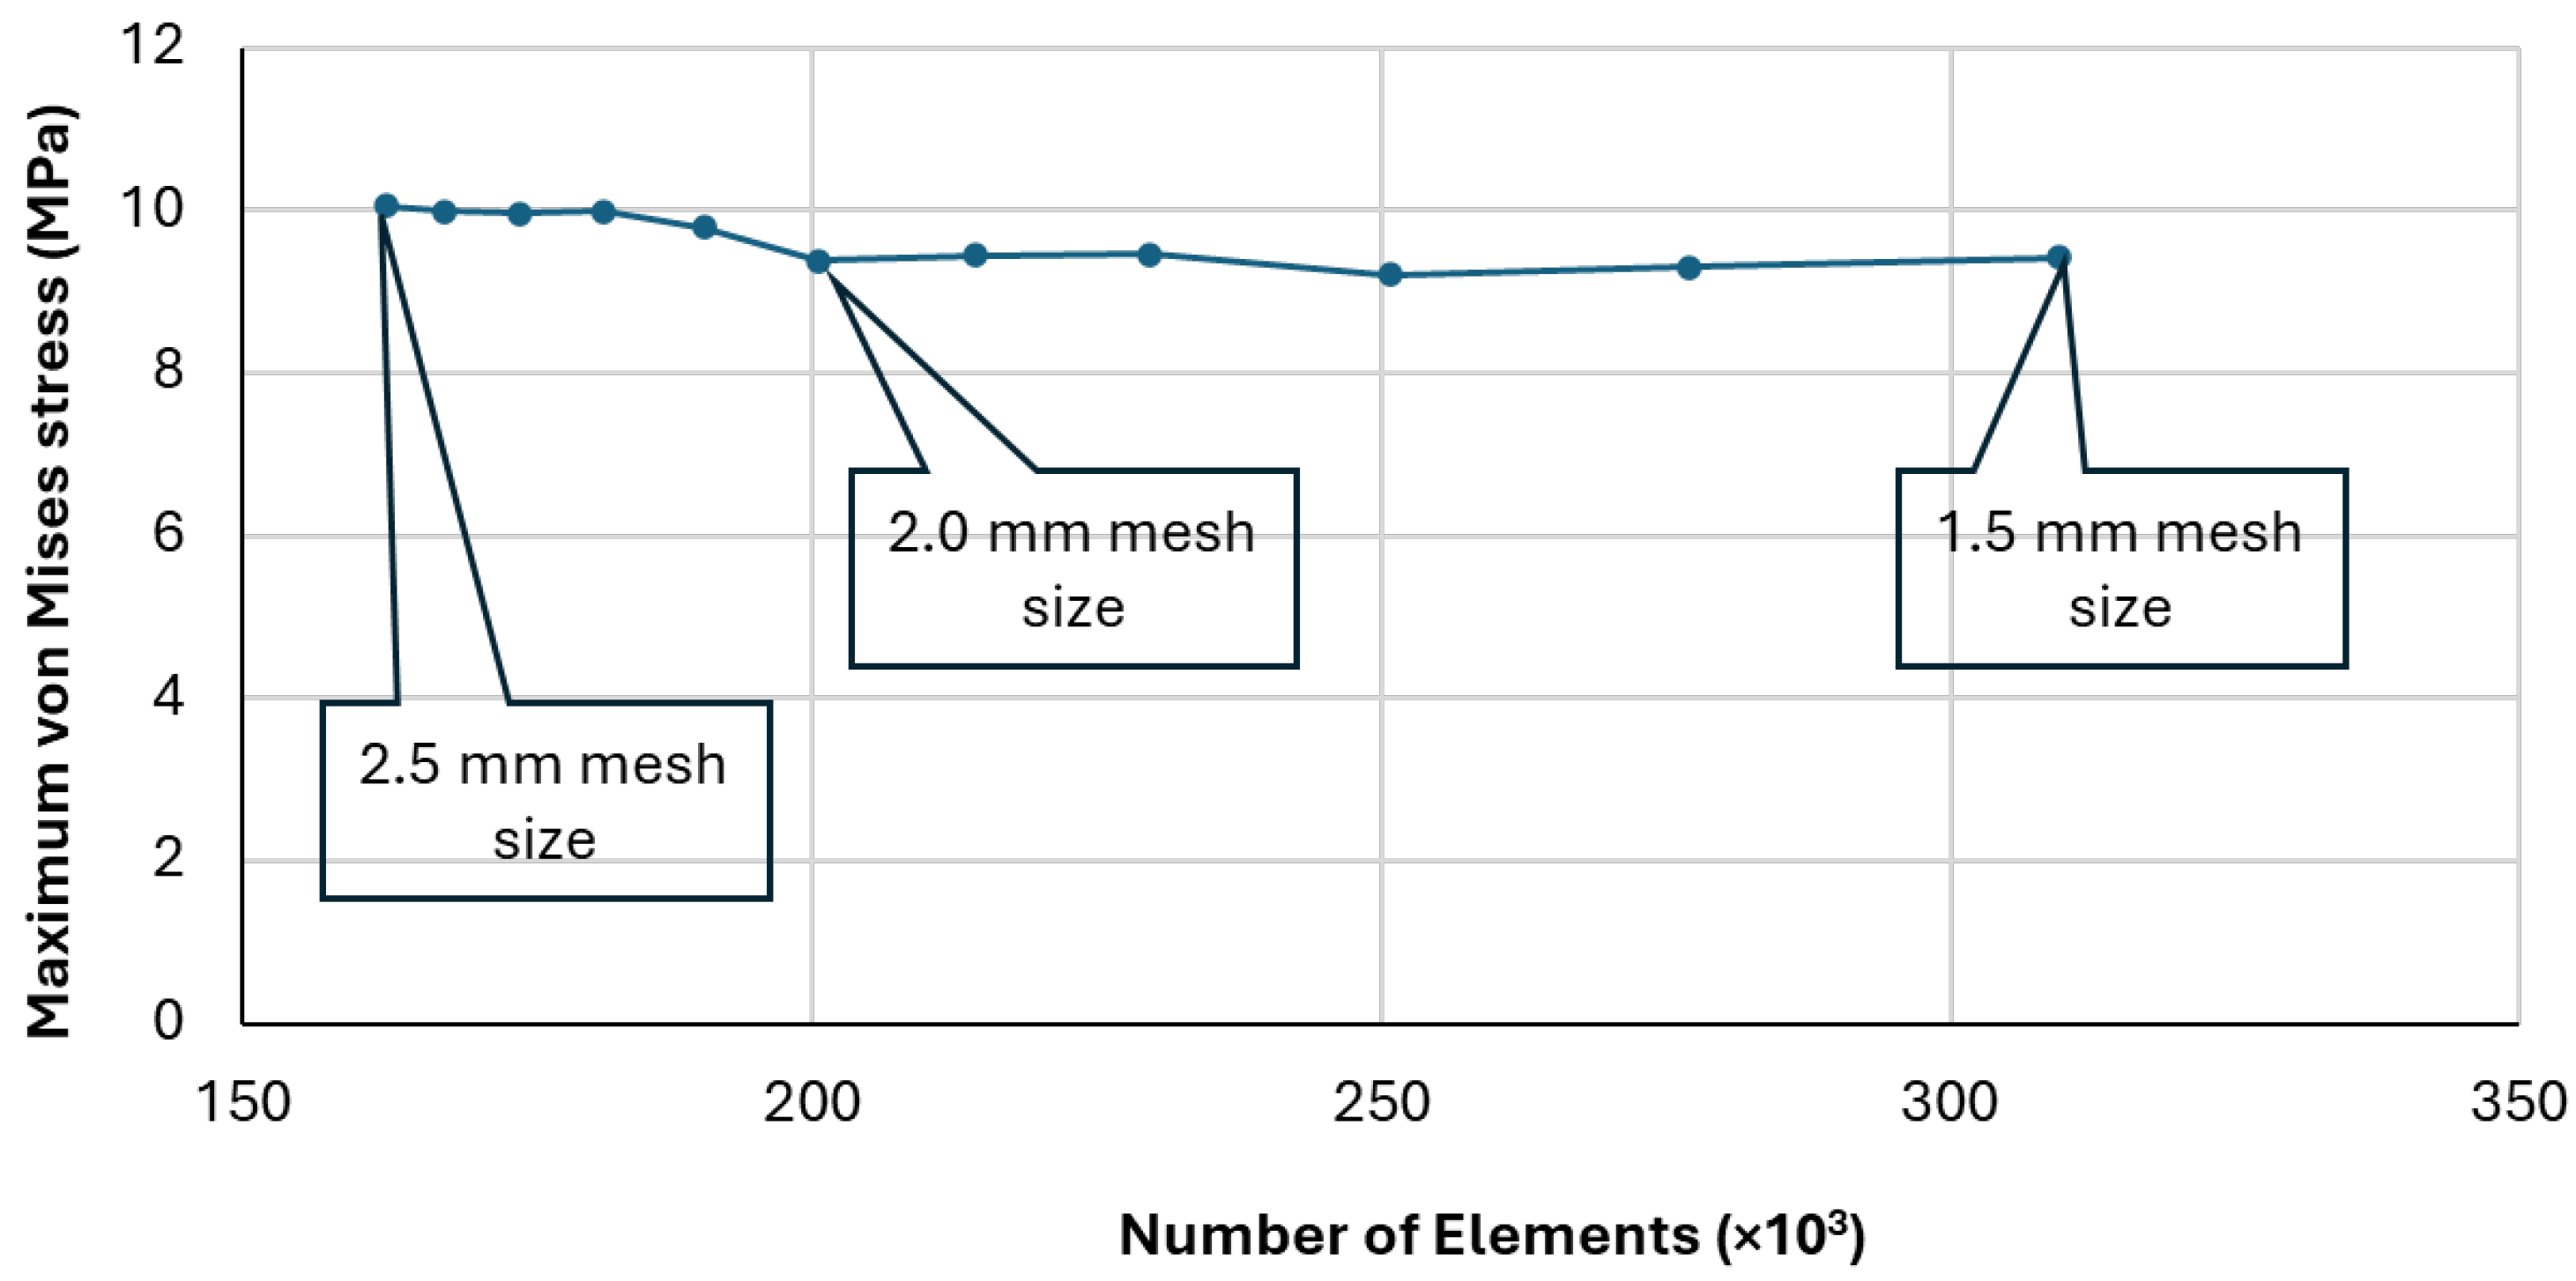
A simulation with an arbitrary load of 300 N was applied on top of the tibia for the convergence test. The influence of mesh size on the maximum von Mises stress of the model was recorded and the meshing process was repeated with a decrement of the mesh size by 0.1 mm (from 2.5 mm to 1.5 mm) as shown in Figure 6. The changes in mesh size only involve the structure of bone while the cartilages and ligaments stay constant. Based on the convergence test curve shown, the optimum element size obtained is 2.0 mm with 200,485 elements, where the graph starts to reach a constant at that mesh size.
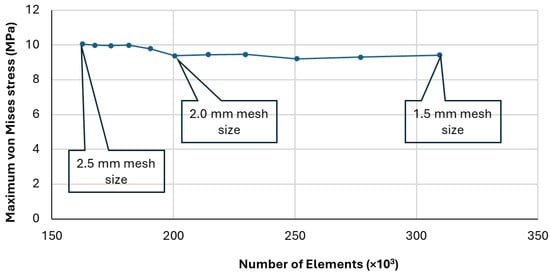
Figure 6.
Convergence test results.
- (c)
- Material properties
After the optimum mesh size was found, the material properties in each part of the ankle joint were defined. There were four central parts of material: bone, ligament, cartilage, and ground support. Each of these parts has different material properties. The material properties for the model can be directly imported from the engineering data of ANSYS. Bone, ligament, and cartilage have their own unique Young’s Modulus and Poisson’s ratio. However, there are no existing biological material properties such as ligament and cartilage in the engineering data. New material properties have to be added manually to the engineering data before defining these models. The material properties of bone, ligament, and cartilage are adopted from the literature [11] and tabulated in Table 1. The material properties were assigned to every component of the model to obtain accurate results.

Table 1.
Material properties of bone, ligament, and cartilage [11].
2.3. Boundary Conditions
A simulation on the foot model with ankle joint was performed under static conditions. A vertical downward load of 300 N was applied on top of the tibia to reflect the self-weight of the subject during standing. Direction of the force was set to vertical to correspond to the gravitational force. The force was obtained approximately based on 60 kg of the subject’s body weight and divided by two, to reflect double leg standing condition. The rigid ground support was set as fixed. The foot model was attached to the ground support top surface. The type of contact was set as bonded for all connections of bone, ligament, cartilage, and ground support. These boundary conditions will be similar for all models with various inclined slopes. In this study, the subject is assumed in balance for all loading cases. Hence, the motion of the ankle joint in eversion/inversion that may occur to keep the subject in balance was negligible.
2.4. Prediction of Failure
The result obtained was used to determine the location of possible failure that might occur at the ankle joint. The location for peak stress that leads to injury during incline or decline standing can be identified by checking the peak stress and strain of the model. Failure possibility has been checked using the equation of safety, Factor of Safety (FOS).
The lower the percentage of FOS, the higher the chance of failure at the particular part (i.e., bone, ligaments, and cartilage) observed.
3. Results
3.1. Von Mises Stress Distribution at the Ankle Joint during Slope Standing
The FE model developed enables von Mises stress distribution to be predicted during level and slope standing. For validation of the model, the acquired von Mises stress distribution was compared with results given in the literature that were obtained during level standing on the talus, tibia, and fibula, as shown in Table 2. The Young Modulus and Poisson Ratio for bone, cartilage, and ligaments used in the current study is similar to the compared study in the literatures [11,15]. As seen in the table, the value of von Mises stress distributions is comparable with a slight difference. The slight difference might be due to different boundary conditions applied in developing the FE model.
Table 2.
Comparison of maximum von Mises stress on ankle joint during level standing between present study and the literatures [11,15].
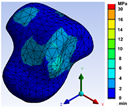
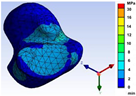
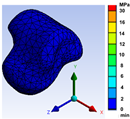
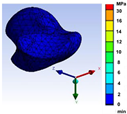
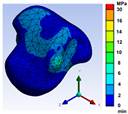
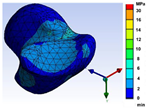
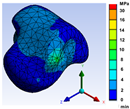
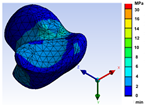
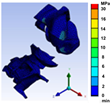
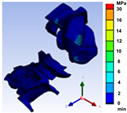
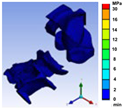
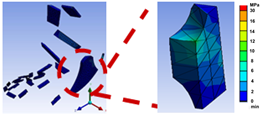
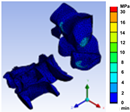
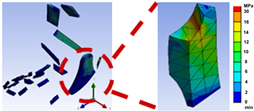
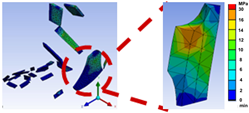
The FE model of the ankle on five inclination conditions was analysed and the von Mises stress distributions and maximum von Mises stress were obtained. The result of the ankle joint model was specified into the effect on bones, i.e., talus, tibia and fibula, cartilage, and ligament. The von Mises stress was analysed according to colour contour as represented in Table 3 and Table 4.
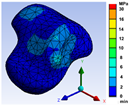
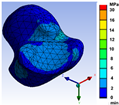
Table 3.
Von Misses stress distribution on bones (talus, tibia, and fibula).
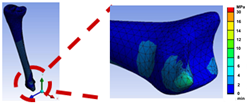
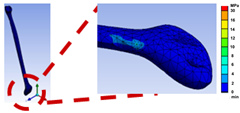
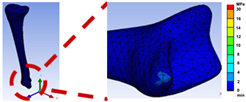
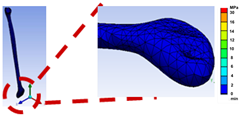
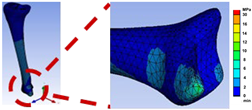
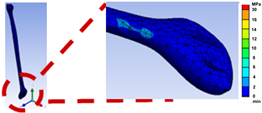
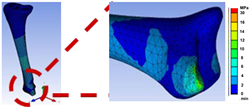
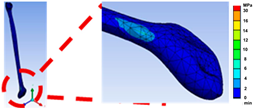
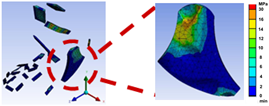
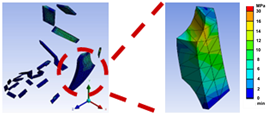
Table 4.
Von Misses stress distribution on cartilage and ligament.
As can be seen in Table 3, an overall blue colour contour, which represents 0–2 MPa stress, has covered all of the talus during flat standing. Instead of that, a light blue contour, which represents 2–4 MPa, was spread around the talus, and a small lighter blue contour, representing 4–6 MPa, can be observed at the edge and bottom of the talus during 5° and 10° decline standing. As for 5° incline standing, similar to decline standing, the talus was covered with a light blue contour (2–4 MPa) but with a larger contour at the top of the talus, and there was a small lighter blue contour, which represents 4–6 MPa, that was located at the edge and bottom of the talus. During 10° incline standing, a light blue contour (2–4 MPa) was more significant than another standing covered on the top surface of the talus. The stress increased until the greenish-blue contour, which represents 6–8 MPa, appeared at the edge and bottom of the talus bone.
Other than that, the tibia was covered with an overall blue contour, representing 0–2 MPa, with a small light blue that represents 2–4 MPa at the bottom edge of the tibia during flat standing. Meanwhile, the tibia was covered with a light blue contour (2–4 MPa) around the middle part during the 5° decline standing and covered with a lighter blue contour (4–6 MPa) that covered the middle and bottom of the tibia during 10° decline standing. The contour was more significant than in other situations. A small green and yellow contour that represents 10–14 MPa was shown at the end edge of the tibia. Instead, there was an increment in von Mises stress at the middle and bottom of the tibia where a light blue contour was observed, which represents 2–4 MPa, during 5° incline standing. The stress increased at the bottom edge of the tibia as the colour changed from light blue to light green, rising from 4 MPa to 12 MPa. Similarly, the talus was covered with a light blue contour during 10° incline standing, but there was a yellow contour at the end edge of the tibia that represents 12–14 MPa.
In addition, as shown in Table 3, the whole fibula was covered with a blue contour (0–2 MPa) during flat standing. Instead, a small light blue contour (2–4 MPa) was observed at the bottom of the fibula during both 5° and 10° decline standing. A similar spot of light blue contour (2–4 MPa) was observed during 5° and 10° incline standing, but there was a tiny spot of lighter blue representing 4–6 MPa found during 10° incline standing.
Furthermore, Table 4 presents the von Mises stress distribution at the cartilage and ligament of the foot. From the table, it can be seen that the whole cartilage was covered by a blue contour, which represents 0–2 MPa von Mises stress during flat standing. However, for both 5° and 10° decline standing, a small light blue contour (2–4 MPa) was concentrated around the connected area of the tibia and talus as well as calcaneus and talus. A similar result was shown for 5° and 10° incline standing.
Similar to cartilage, the von Mises stress distribution on the ligament during flat standing was around 0–2 MPa as a blue contour covering the whole ligament was observed. However, during the 5° decline standing, a bright green contour, which represents 10–12 MPa, was observed at the talocalcaneal ligament which connects the talus and calcaneus. In addition, a light blue to green colour contour (8–10 MPa) was observed at the talofibular and tibiofibular ligament and an orange contour (16–30 MPa) occurred at the talocalcaneal ligament. Likewise, during 10° decline standing, small orange contours (16–30 MPa) were observed, but at the calcaneofibular ligament.
The von Mises distribution during incline standing at 5° inclination had a similar result to decline standing where a bright green contour (10–12 MPa) at the talocalcaneal ligament was shown. Meanwhile, during 10° incline standing, the green contour (8–10 MPa) was observed at the talofibular, tibiofibular, and deltoid ligaments.
3.2. Maximum von Misses Stress
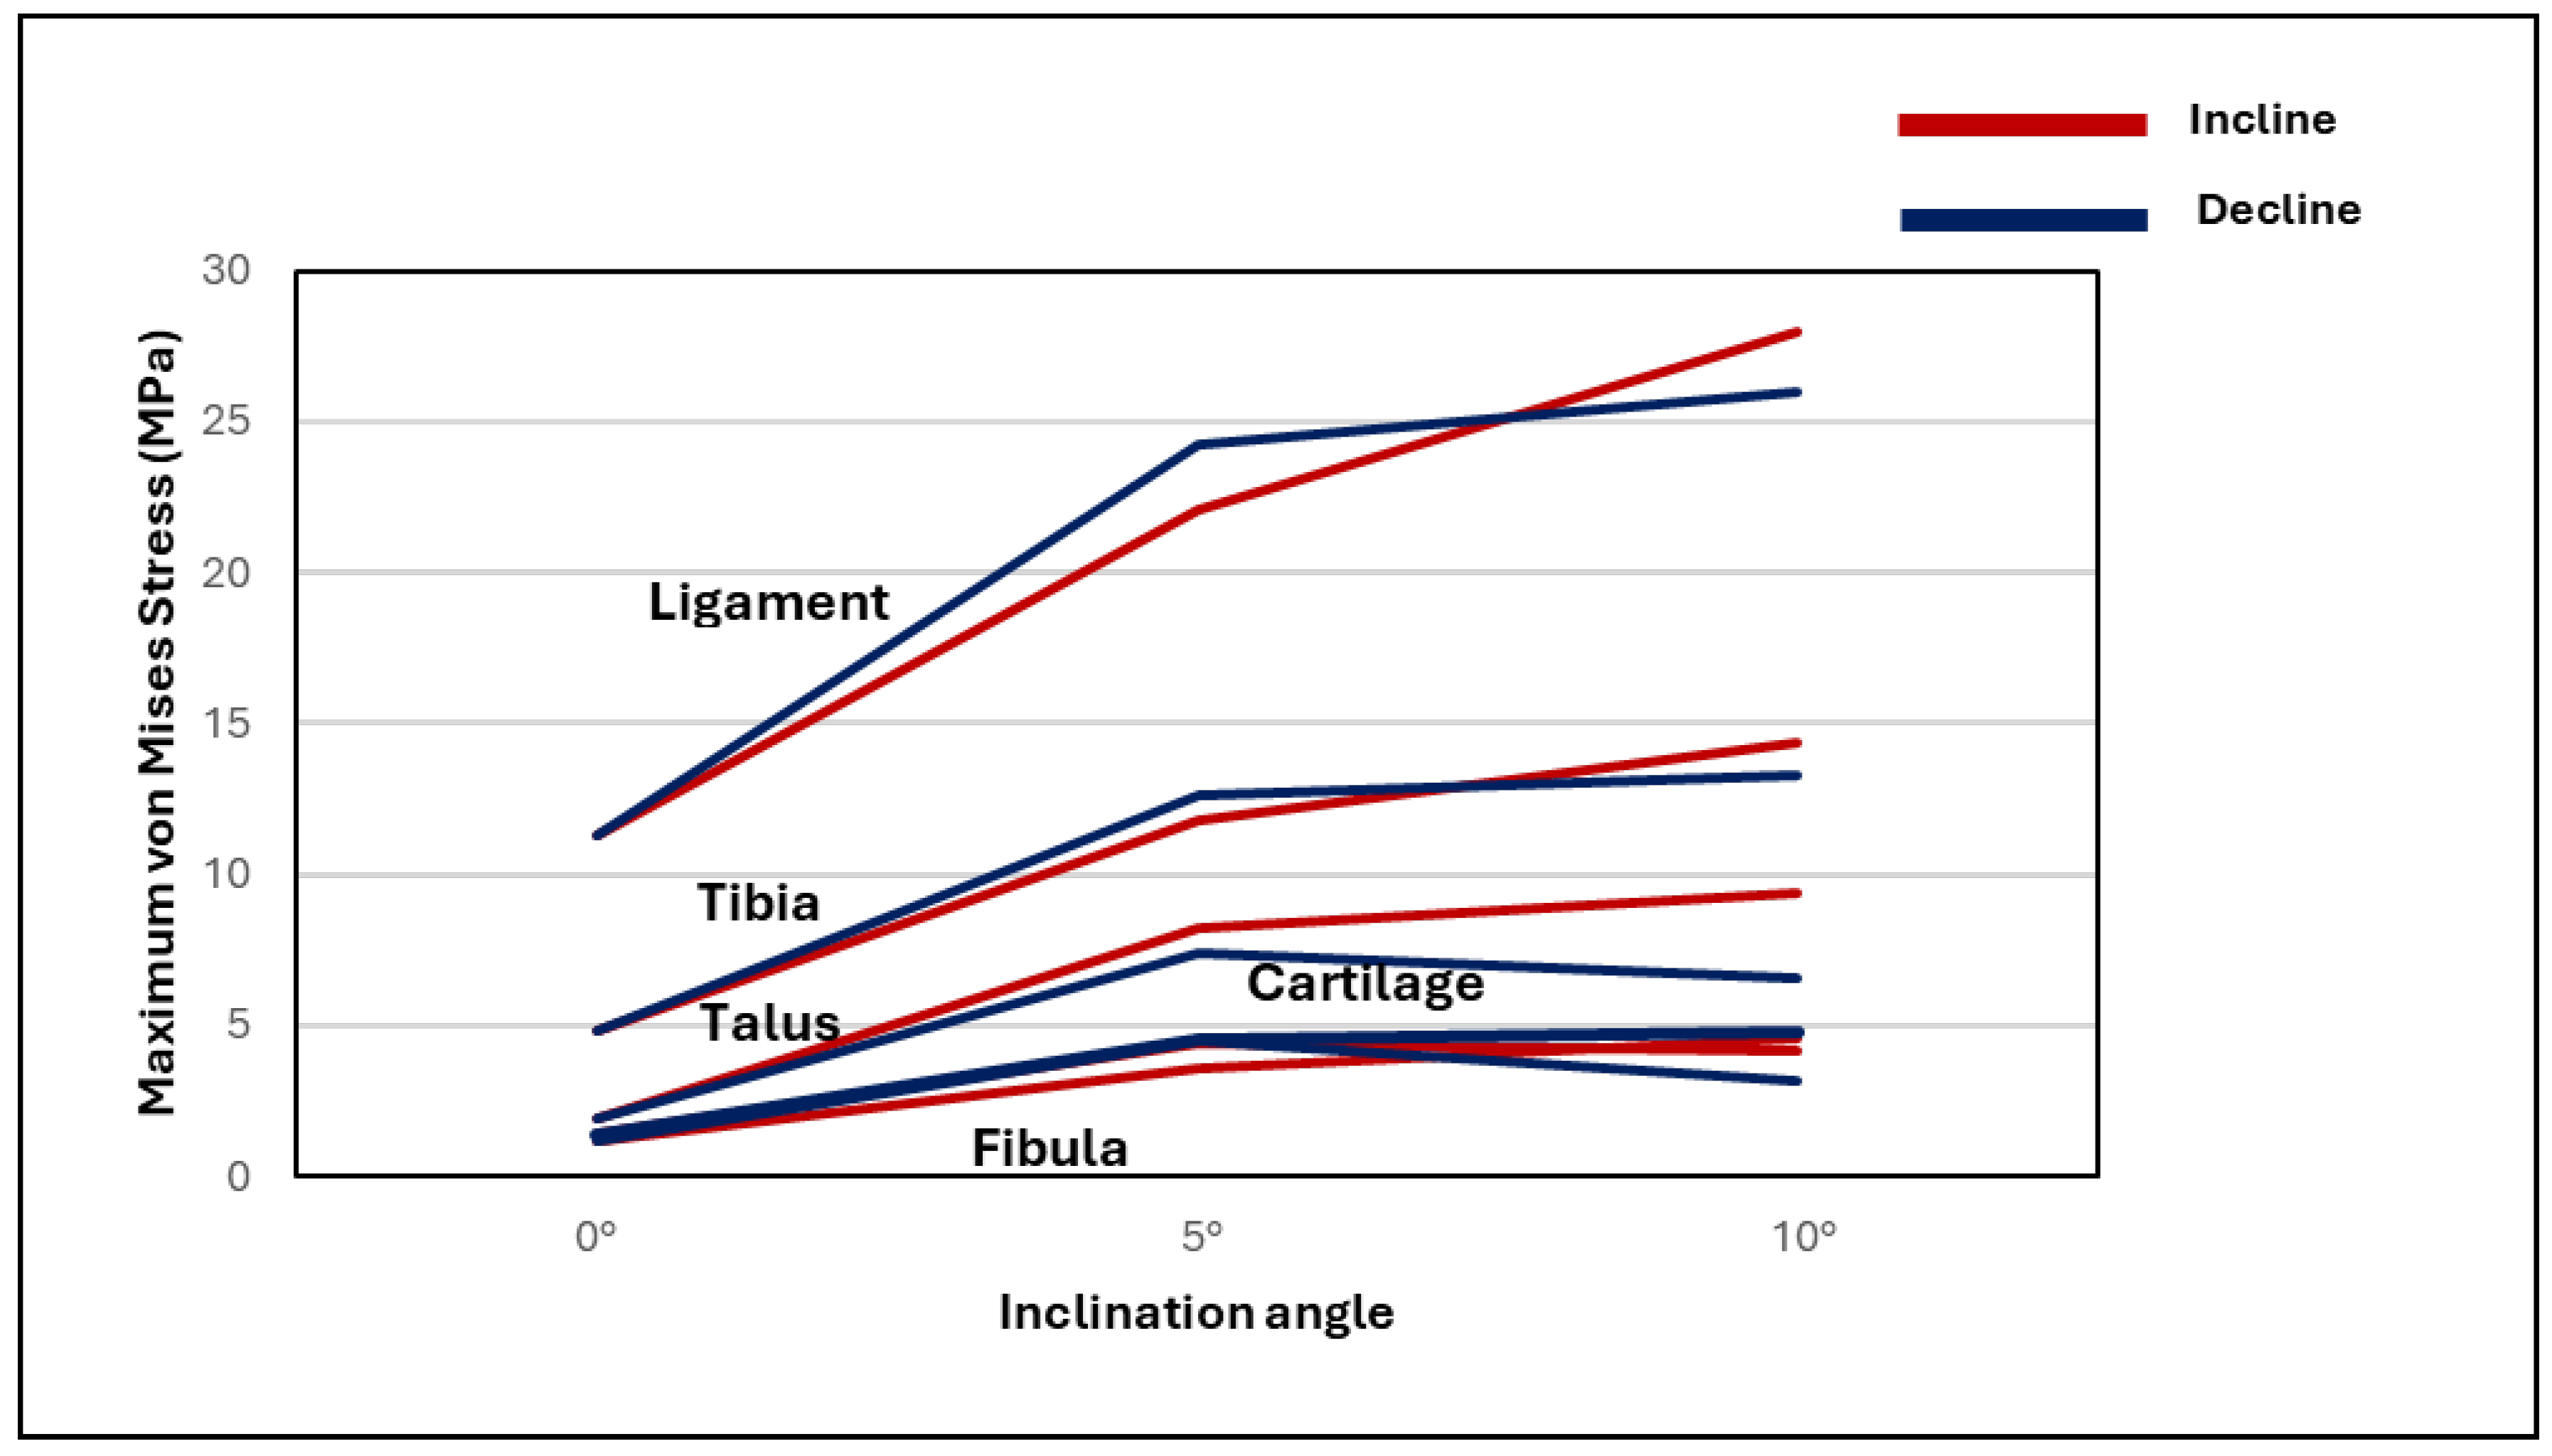
The maximum von Mises stress on the talus, tibia, and fibula was also analysed in this study. The maximum von Mises stress found during level and slope standing is presented in Figure 7.
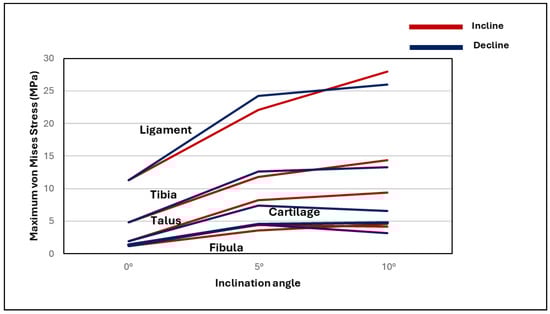
Figure 7.
Comparison of maximum Von Mises stress during flat and slope standing.
Based on the result, it was reported that the ligament experienced an obvious increment of von Mises stress from 24.2 MPa on 5° to 26.0 MPa on 10° inclination compared to 11.3 MPa on flat standing during decline standing. In addition, the highest von Mises stress was found during standing on 10° inclination—28 MPa compared to 22.1 MPa on 5° inclination and 11.3 MPa on flat standing. Overall, the results show that the maximum von Mises stress at the ankle joint is higher during incline and decline standing compared to flat standing for all components of the ankle.
3.3. Failure Prediction
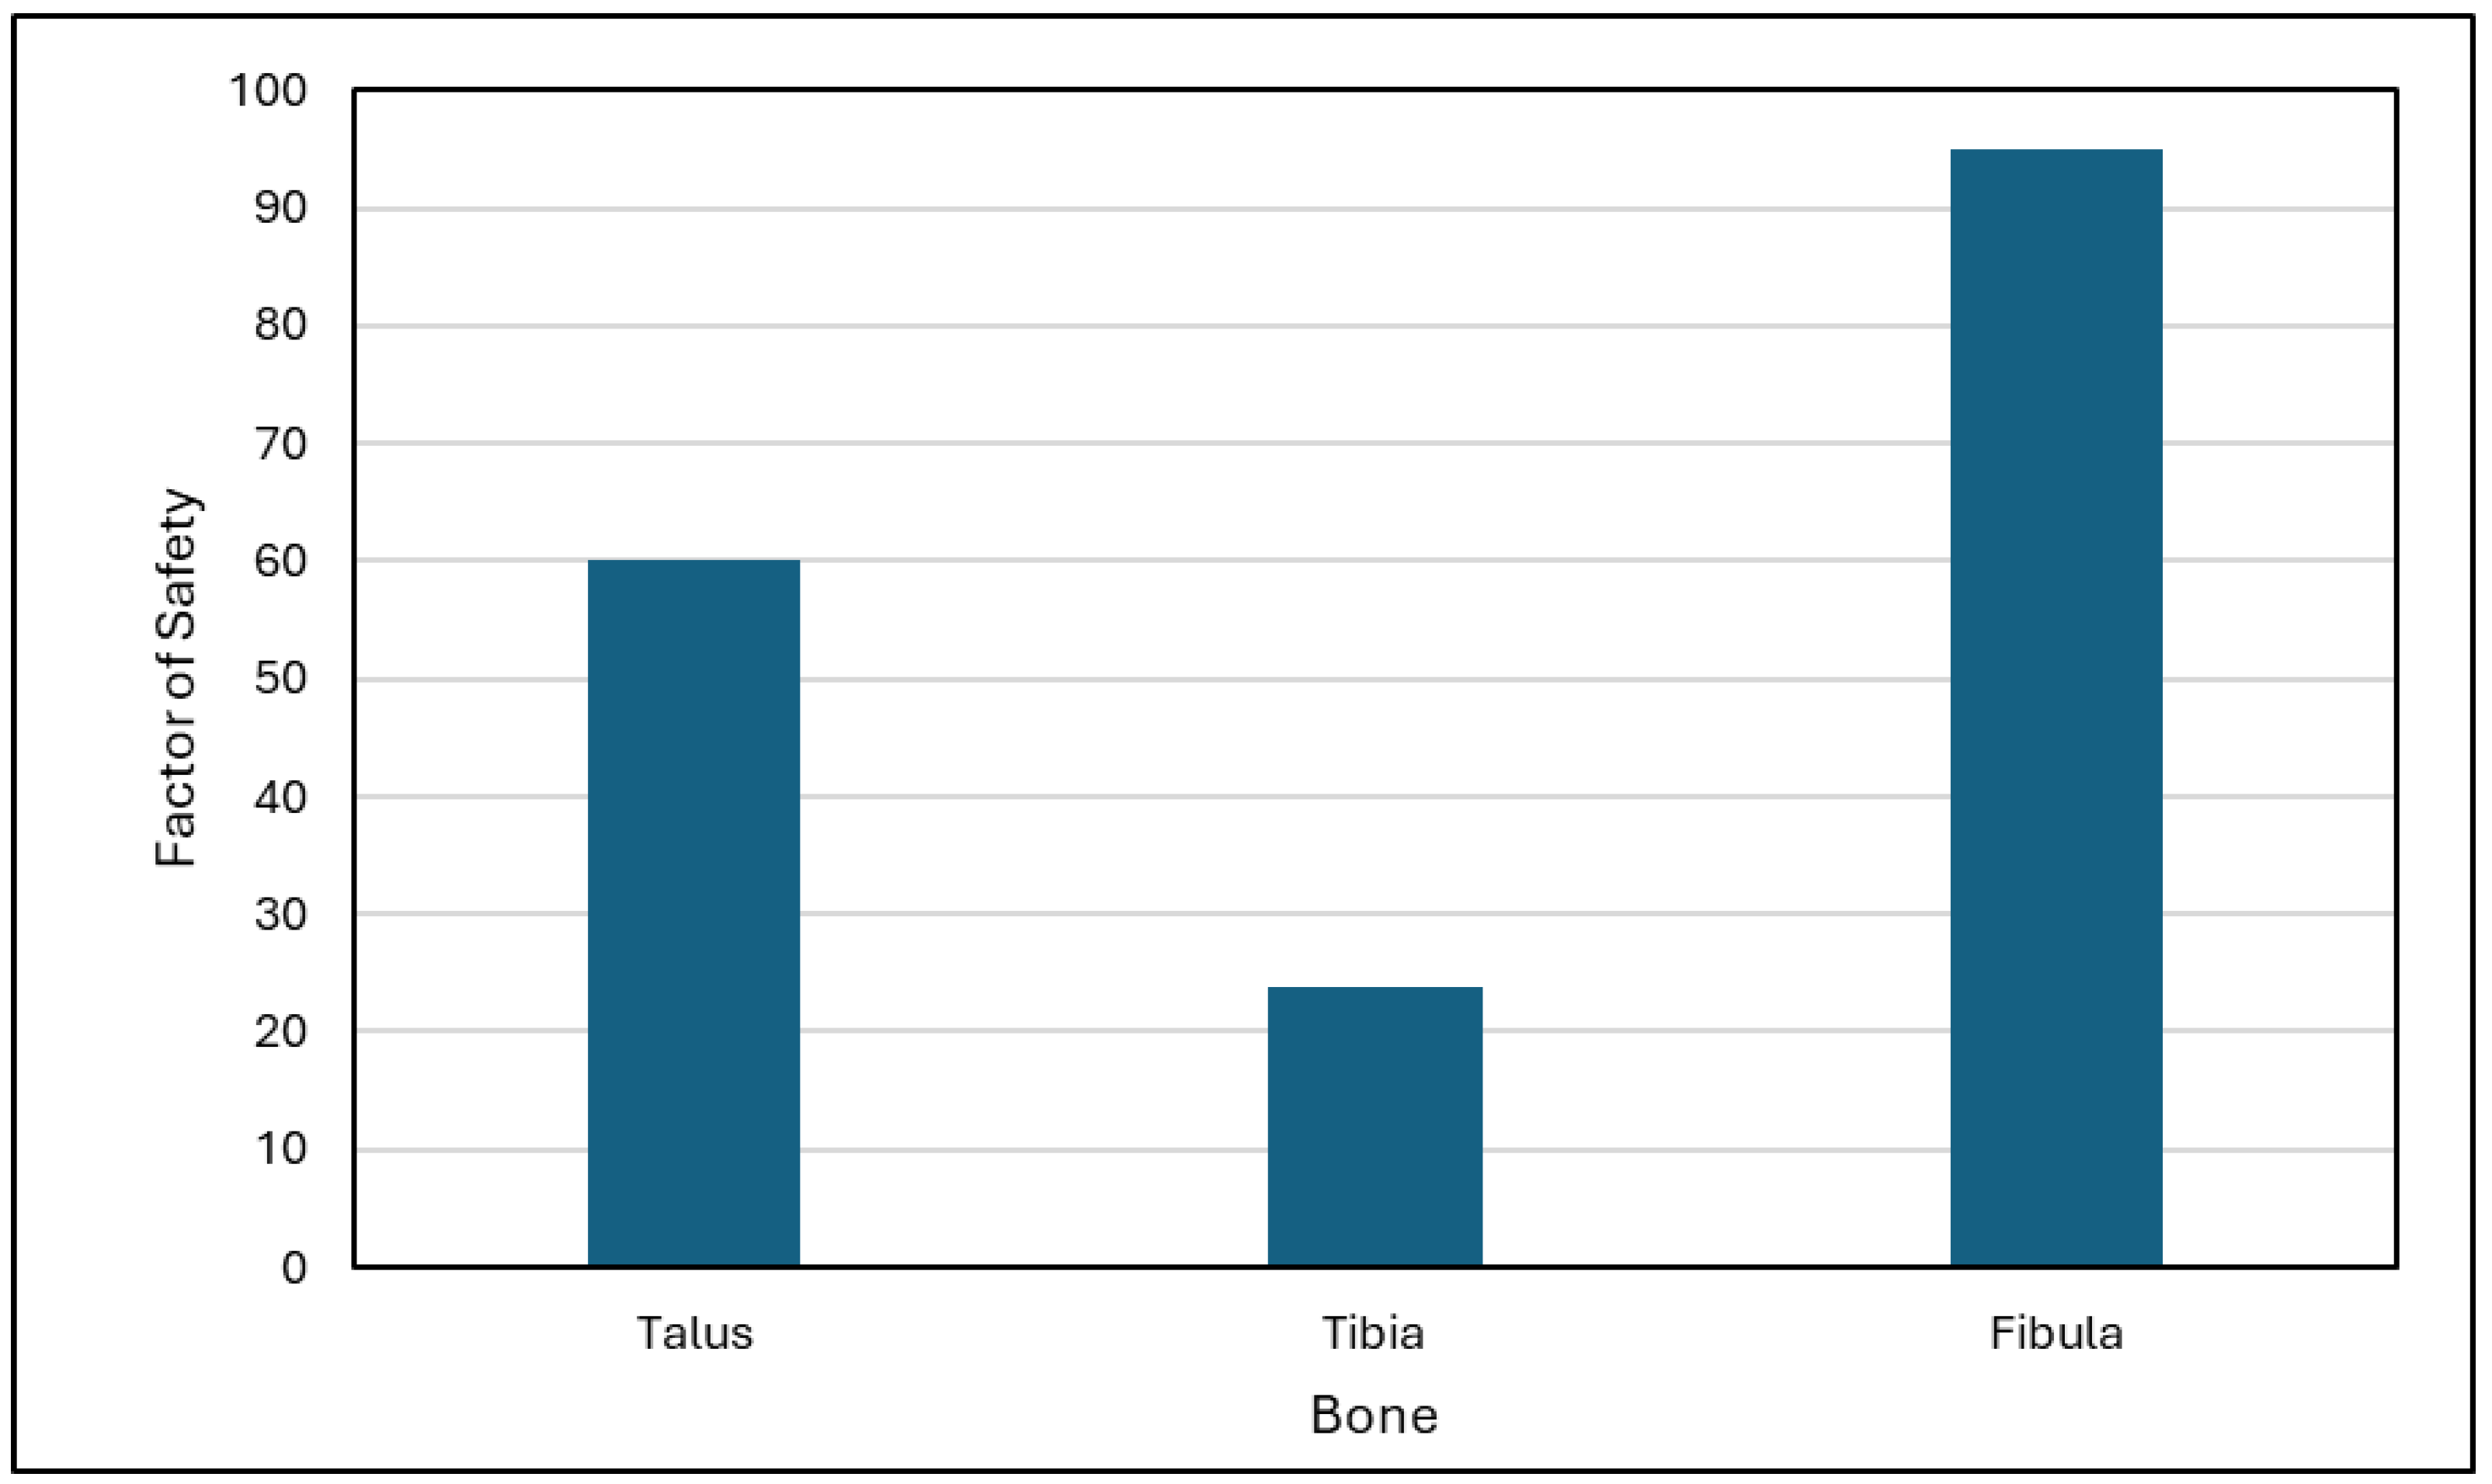
Based on Equation (1), the failure prediction that is determined by factor of safety (FOS) is presented in Figure 8. In general, healthy bones have an FOS greater than one, meaning they can withstand loads greater than those typically encountered without fracturing or breaking.

Figure 8.
Factor of safety on ankle joint bones.
Based on the results, it can seem that all bones are beyond one. Therefore, it means the bones are in a safe region for standing on various incline platforms.
4. Discussion
The FE model developed in the present study was analysed based on von Mises stress responses at the ankle for slope standing. The analysis was performed under static linear elastic and the stresses obtained at the ankle part was assumed to not exceed the yield limit of the materials. Von Mises stress was used to evaluate the failure risk for the ankle joint because it considered the combined effect of normal and shear stresses. Based on the results, there are a few potential reasons that contribute to the increment of stress at the ankle joint component during incline and decline standing compared to flat standing.
Firstly, incline standing that involves a steeper slope requires the foot to be dorsiflexed, and similarly, declined standing requires the foot to be dorsiflexed to accommodate the slope [6]. Dorsiflexion is where the foot bends towards the shin. Inclined and declined standing changes the range of motion (ROM) at which joints operate [16]. The ankle joint experiences different angles of dorsiflexion and plantarflexion during slope standing compared to flat standing, impacting the distribution of forces and stress on the bones of the ankle. The decreased ROM of ankle dorsiflexion may lead to an increase in ground reaction force (GRF) and loading [17], which leads to an increment of stress on the ankle joint.
Furthermore, the higher force generated during incline standing to move against gravity and the higher impact force absorbed and distributed during declined standing [18] lead to a higher stress on the bones of the ankle during slope standing compared to flat standing. This higher stress due to the impact forces and joint loading may contribute to the risk of injury related to signs of fatigue, fractures, and pain at the patellofemoral [19].
In addition, inclined standing requires more effort from the muscles that plantarflex the ankle (push the foot down), including the calf muscles. This increased activity puts an additional load on the talus bone. As for declined standing, it requires the activation of eccentric muscles [16,19], especially in the lower leg, in order to control the descent. Eccentric muscle contractions involve lengthening of the muscle while producing force, and this can contribute to higher stress on the talus. As reported previously, the activation of the tibial muscle is changing due to the ankle response to the inclined surface during slope standing [20], and the magnitude and duration of activity in the gluteus maximus and hamstring are increased during incline standing [21,22]. Therefore, another possible reason that leads to stress increment on the bones of ankle joints is muscle engagement [16,23].
The combination of these factors results in an increased demand on the bones of the ankle during slope standing, leading to higher stress compared to standing on a flat surface. It is important to note that individuals with certain biomechanical issues, musculoskeletal conditions, or improper footwear may be more susceptible to increased stress and potential injury during slope standing. While slope standing can increase stress on the bones of the ankle joint, proper gait mechanics, muscle strength, and joint stability play crucial roles in mitigating excessive stress and preventing injuries.
In comparison to the maximum von Mises stress distribution view, the highest stress distribution was observed in ligaments compared to bones and cartilage. Ligaments, bones, and cartilage all undergo mechanical stresses during slope standing or any weight-bearing activity; but, because of their particular biomechanical characteristics and functions inside the body, the distribution and magnitude of these stresses might differ. The possible explanation for these differences is due to the material properties of the component itself. Ligaments are fibrous connective tissues that can resist tensile forces. The tensile strength of ligaments is high but the ability to withstand compressive forces is restricted [24]. Instead of that, bones are robust and strong, able to sustain compressive loads [25]. Although cartilage can resist compression, it is also capable of bearing some tensile loads [26] but to a lesser extent than ligaments. Due to these differences in material properties, ligaments tend to experience higher stress under tensile loading compared to bones and cartilage.
Other than that, specific anatomical functions might explain the various von Mises stress distributions found at each component of the ankle. Ligaments primarily function to stabilise joints by reducing excessive movement and providing structural support [27]. During slope standing, ligaments may uphold a significant portion of the load to maintain joint stability. Bones, on the other hand, support the body’s weight and provide a framework for muscle attachment [28]. Cartilage acts as a cushion between bones and helps distribute forces within joints [29]. However, it generally experiences lower stresses compared to ligaments and bones. There are some limitations that are associated with this study. First, the cartilage and ligament of the ankle joint were assumed as linear elastic. Although these soft tissues can be considered as viscoelastic materials, the present analysis was performed under linear elastic region. The loads applied are relatively low compared to the material yield limit of all ankle parts. There are even studies that show that linear elastic model can stimulate bulk behaviour for cartilage accurately [30,31]. Despite limitations of the present model, particularly on ligament, the results showed that the stresses obtained on bones are not much different compared to other studies [11,15]. Hence, this limitation does not give a significant effect on the present findings. Second, the cartilage and ligaments were constructed to ensure the connectivity on foot structure that mainly consisted of bone. Other soft tissues such as skin and plantar fascia were omitted. Future research considering all soft tissues in the foot may need to be conducted to observe the effect of parts’ interaction on the ankle biomechanics. Moreover, simulation of the ankle joint as a flexure hinge in the field of compliant mechanism is a quite interesting topic to be explored in future, particularly for prosthetic design.
5. Conclusions
This study aimed to develop finite element models of the ankle joint with various inclined foot postures and to analyse the stress distributions on the ankle joint due to an inclined or declined surface. This study successfully developed the finite element model of the ankle joint with various inclined foot postures. This study reported that, in general, the components of the ankle joint (bone, cartilage, and ligament) experienced different von Mises stress distribution patterns during flat standing in comparison with slope standing. In addition, this study found that the maximum von Mises stress distribution at the component of the ankle joint is higher during slope standing than flat standing. Taken together, these results suggest that slope standing, both inclined and declined more than 10 °, might contribute to a higher risk of injury as higher maximum stress was observed. Therefore, a better precaution and adaptation strategy should be taken during standing on slopes such as maintaining a proper body posture to ensure weight is evenly distributed at both feet, which can reduce stress at the ankle.
Author Contributions
Contributions of the authors are listed as follows: Conceptualisation, N.A.A.A.Y., K.S.B., M.F.I., M.H.M.S. and M.N.S.S.A.; Methodology, N.A.A.A.Y., K.S.B., M.F.I., M.H.M.S. and H.T.; Investigation, N.A.A.A.Y., K.S.B., M.F.I., M.N.S.S.A. and H.T.; Writing—original draft preparation, N.A.A.A.Y., K.S.B. and M.N.S.S.A.; Writing—review and editing, M.F.I., M.H.M.S. and H.T.; Funding acquisition, M.F.I. All authors have read and agreed to the published version of the manuscript.
Funding
The authors extend their appreciation to the Researchers Supporting Project (project number RSPD2024R1072), King Saud University, Riyadh, Saudi Arabia.
Institutional Review Board Statement
Not applicable.
Informed Consent Statement
Not applicable.
Data Availability Statement
The raw data supporting the conclusions of this article will be made available by the authors on request.
Acknowledgments
The authors extend their appreciation to the Researchers Supporting Project number (RSPD2024R1072), King Saud University, Riyadh, Saudi Arabia.
Conflicts of Interest
The authors declare no conflicts of interest.
References
- Li, J.; Zhang, Y.; Song, S.; Hou, Y.; Hong, Y.; Yue, S.; Li, K. Dynamical Analysis of Standing Balance Control on Sloped Surfaces in Individuals with Lumbar Disc Herniation. Sci. Rep. 2020, 10, 1676. [Google Scholar] [CrossRef] [PubMed]
- Dutt-Mazumder, A.; Gruben, K.G. Modulation of sagittal-plane center of pressure and force vector direction in human standing on sloped surfaces. J. Biomech. 2021, 119, 110288. [Google Scholar] [CrossRef] [PubMed]
- Lee, J.W.; Park, J.S. The Correlation between Proprioception and Postural Control in Healthy Adults. Iran. J. Public Health. 2022, 51, 2360–2361. [Google Scholar] [CrossRef]
- Park, S.Y.; Kim, S.H.; Park, D.J. Effect of slope angle on muscle activity during variations of the Nordic exercise. J. Exerc. Rehabil. 2019, 15, 832–838. [Google Scholar] [CrossRef]
- Murray, K.J.; Azari, M.F. Leg length discrepancy and osteoarthritis in the knee, hip and lumbar spine. J. Can. Chiropr. Assoc. 2015, 59, 226–237. [Google Scholar] [PubMed]
- Kwon, Y.; Shin, G. Foot kinematics and leg muscle activation patterns are altered in those with limited ankle dorsiflexion range of motion during incline walking. Gait Posture 2022, 92, 315–320. [Google Scholar] [CrossRef]
- Taha, Z.; Norman, M.S.; Omar, S.F.S.; Suwarganda, E. A Finite Element Analysis of a Human Foot Model to Simulate Neutral Standing on Ground. Procedia Eng. 2016, 147, 240–245. [Google Scholar] [CrossRef]
- Cheung, J.T.M.; Zhang, M.; Leung, A.K.L.; Fan, Y.B. Three-dimensional finite element analysis of the foot during standing—A material sensitivity study. J. Biomech. 2005, 38, 1045–1054. [Google Scholar] [CrossRef]
- Park, S.; Lee, S.; Yoon, J.; Chae, S.W. Finite element analysis of knee and ankle joint during gait based on motion analysis. Med. Eng. Phys. 2019, 63, 33–41. [Google Scholar] [CrossRef]
- Guan, M.; Zhao, J.; Kuang, Y.; Li, G.; Tan, J. Finite element analysis of the effect of sagittal angle on ankle joint stability in posterior malleolus fracture: A cohort study. Int. J. Surg. 2019, 70, 53–59. [Google Scholar] [CrossRef]
- Ozen, M.; Sayman, O.; Havitcioglu, H. Modeling and stress analyses of a normal foot-ankle and a prosthetic foot-ankle complex. Acta Bioeng. Biomech. 2013, 15, 19–27. [Google Scholar] [PubMed]
- Wang, Y.; Li, Z.; Wong, D.W.C.; Cheng, C.K.; Zhang, M. Finite element analysis of biomechanical effects of total ankle arthroplasty on the foot. J. Orthop. Transl. 2018, 12, 55–65. [Google Scholar] [CrossRef] [PubMed]
- Hansen, A.H.; Childress, D.S.; Miff, S.C. Roll-over characteristics of human walking on inclined surfaces. Hum. Mov. Sci. 2004, 23, 807–821. [Google Scholar] [CrossRef] [PubMed]
- Malakoutikhah, H.; de Cesar Netto, C.; Madenci, E.; Latt, L.D. Evaluation of assumptions in foot and ankle biomechanical models. Clin. Biomech. 2022, 100, 105807. [Google Scholar] [CrossRef]
- Mondal, S.; Ghosh, R. A numerical study on stress distribution across the ankle joint: Effects of material distribution of bone, muscle force and ligaments. J. Orthop. 2017, 14, 329–335. [Google Scholar] [CrossRef]
- Pickle, N.T.; Grabowski, A.M.; Auyang, A.G.; Silverman, A.K. The functional roles of muscles during sloped walking. J. Biomech. 2016, 49, 3244–3251. [Google Scholar] [CrossRef]
- Almansoof, H.S.; Nuhmani, S.; Muaidi, Q. Role of ankle dorsiflexion in sports performance and injury risk: A narrative review. Electron. J. Gen. Med. 2023, 20, em521. [Google Scholar] [CrossRef]
- Hong, Y.N.G.; Lee, J.; Shin, C.S. Transition versus continuous slope walking: Adaptation to change center of mass velocity in young men. Appl. Bionics Biomech. 2018, 2018, 2028638. [Google Scholar] [CrossRef] [PubMed]
- Park, S.K.; Jeon, H.M.; Lam, W.K.; Stefanyshyn, D.; Ryu, J. The effects of downhill slope on kinematics and kinetics of the lower extremity joints during running. Gait Posture 2019, 68, 181–186. [Google Scholar] [CrossRef]
- Bavdek, R.; Zdolšek, A.; Strojnik, V.; Dolenec, A. Peroneal muscle activity during different types of walking. J. Foot Ankle Res. 2018, 11, 50. [Google Scholar] [CrossRef]
- Wall-Scheffler, C.M.; Chumanov, E.; Steudel-Numbers, K.; Heiderscheit, B. Electromyography activity across gait and incline: The impact of muscular activity on human morphology. Am. J. Phys. Anthr. 2011, 143, 601–611. [Google Scholar] [CrossRef] [PubMed]
- Franz, J.R.; Lyddon, N.E.; Kram, R. Mechanical work performed by the individual legs during uphill and downhill walking. J. Biomech. 2012, 45, 257–262. [Google Scholar] [CrossRef] [PubMed]
- Liu, Y.; Qiang, L.; Song, Q.; Zhao, M.; Guan, X. Effects of backpack loads on leg muscle activation during slope walking. Appl. Sci. 2020, 10, 4890. [Google Scholar] [CrossRef]
- Hoffmann, A.; Gross, G. Tendon and ligament engineering in the adult organism: Mesenchymal stem cells and gene-therapeutic approaches. Int. Orthop. 2007, 31, 791–797. [Google Scholar] [CrossRef] [PubMed]
- Hart, N.H.; Nimphius, S.; Rantalainen, T.; Ireland, A.; Siafarikas, A.; Newton, R.U. Mechanical basis of bone strength: Influence of bone material, bone structure and muscle action. J. Musculoskelet. Neuronal Interact. 2017, 17, 114–139. [Google Scholar] [PubMed]
- Mostakhdemin, M.; Nand, A.; Ramezani, M. Articular and artificial cartilage, characteristics, properties and testing approaches—A review. Polymers 2021, 13, 2000. [Google Scholar] [CrossRef]
- Jung, H.-J.; Fisher, M.B.; Woo, S.L.-Y. Role of biomechanics in the understanding of normal, injured, and healing ligaments and tendons. BMC Sports Sci. Med. Rehabil. 2009, 1, 9. [Google Scholar] [CrossRef]
- Su, N.; Yang, J.; Xie, Y.; Du, X.; Chen, H.; Zhou, H.; Chen, L. Bone function, dysfunction and its role in diseases including critical illness. Int. J. Biol. Sci. 2019, 15, 776–787. [Google Scholar] [CrossRef]
- Fox, A.J.S.; Bedi, A.; Rodeo, S.A. The basic science of articular cartilage: Structure, composition, and function. Sports Health. 2009, 1, 461–468. [Google Scholar]
- Zhang, K.; Li, L.; Yang, L.; Shi, J.; Zhu, L.; Liang, H.; Wang, X.; Yang, X.; Jiang, Q. Effect of degenerative and radial tears of the meniscus and resultant meniscectomy on the knee joint: A finite element analysis. J. Orthop. Transl. 2019, 18, 20–31. [Google Scholar] [CrossRef]
- Bell, J.S.; Winlove, C.P.; Smith, C.W.; Dehghani, H. Modeling the steady-state deformation of the solid phase of articular cartilage. Biomaterials 2009, 30, 6394–6401. [Google Scholar] [CrossRef] [PubMed]

Disclaimer/Publisher’s Note: The statements, opinions and data contained in all publications are solely those of the individual author(s) and contributor(s) and not of MDPI and/or the editor(s). MDPI and/or the editor(s) disclaim responsibility for any injury to people or property resulting from any ideas, methods, instructions or products referred to in the content. |
© 2024 by the authors. Licensee MDPI, Basel, Switzerland. This article is an open access article distributed under the terms and conditions of the Creative Commons Attribution (CC BY) license (https://creativecommons.org/licenses/by/4.0/).