Article

Research on the Corrosion Inhibition Effect of Xanthium sibiricum on Reinforced Steel and the Prediction of Reinforced Concrete Performance under a Stray Current and Chloride Environment

1
College of Water Conservancy and Hydropower Engineering, Hohai University, Nanjing 210003, China
2
Changjiang River Scientific Research Institute, Wuhan 430010, China
*
Author to whom correspondence should be addressed.
Appl. Sci. 2024, 14(16), 6986; https://doi.org/10.3390/app14166986
Submission received: 17 July 2024 / Revised: 5 August 2024 / Accepted: 8 August 2024 / Published: 9 August 2024
(This article belongs to the Special Issue Durability and Intelligent Evaluation of Concrete Structures)

Abstract

:

Featured Application

The results obtained in this study can be applied to optimize engineering design, providing assistance in enhancing the durability of concrete structures.

Abstract

This study examined a newly developed environmentally friendly plant-based corrosion inhibitor (Xanthium sibiricum). The natural potential method, linear polarization method, steel weight loss method, and corrosion area method were employed to verify the inhibitor’s effectiveness in chloride-containing concrete. The results indicated that Xanthium sibiricum elevated the natural potential of reinforcing steel in concrete, increased its self-corrosion potential, and reduced the self-corrosion current. After three months of curing, the corrosion rate of steel without an inhibitor was approximately 47.5% faster than the experimental group, with the steel loss rate about 40% more severe. The effectiveness of the inhibitor was influenced by increased chloride content in concrete. A two-dimensional multiphase ion transport model of reinforced concrete with realistic aggregate distribution was established using the finite element method (FEM). This model simulated chloride ion transport under typical civil engineering service environments—the coupled effects of a stray current and chloride environment. A predictive formula for the residual compressive strength of reinforced concrete was derived after corrosion under various voltages and chloride ion concentrations for a specific duration. In conjunction with a pump station project operating in a similar environment, the optimal dosage of the Xanthium sibiricum inhibitor for practical engineering was determined to be 2 g/L. At this dosage, the strength of reinforced concrete specimens increased by approximately 31.1%. Finally, a predictive formula for the residual compressive strength of reinforced concrete with an added inhibitor was obtained after corrosion under various voltages and chloride ion concentrations for a specific duration. The conclusions can enhance the durability and safety of concrete structures in similar projects, showing promising application prospects.

1. Introduction

Reinforced concrete, a common and widely used civil engineering material, is often employed in complex and harsh environments. Examples include coastal pump stations, hydroelectric power plant buildings, and cross-sea bridges. These structures frequently operate under the coupled effects of stray currents and chloride environments. When the chloride ion concentration in these service environments exceeds the critical threshold [1], weak areas of the passive film in concrete structures are destroyed, forming localized pitting. As corrosion progresses, the relatively intact passive film surrounding these pits is also eroded, exposing a larger area of the substrate and accelerating metal phase corrosion. Figure 1 illustrates the chemical reactions of chloride ion attack on the metal phase in concrete materials [2]. Additionally, chloride ions in reinforced concrete interact with one of concrete’s hydration products—monosulfate (AFm). This interaction promotes the formation of corrosion by-products, namely Friedel salts [3]. This chemical reaction signifies ongoing corrosion activity. The accumulation of these salts leads to concrete volume expansion, thereby increasing the risk of damage to concrete structures.
Additionally, stray currents in service environments refer to electrical currents that do not flow along designed or specified circuits. These currents induce electrochemical corrosion [4], affecting metals such as the reinforcing steel in civil engineering structures. When stray currents flow through reinforcing steel in concrete, areas with intact passive layers act as cathodes in the “corrosion cell”, undergoing hydrogen evolution corrosion and generating hydrogen gas. This gas, unable to quickly escape from the concrete, creates hydrostatic pressure in the corrosion area. Consequently, the metal phase separates from the surrounding concrete, significantly reducing the concrete’s grip and protective capacity on the metal. Conversely, areas where the metal has been depassivated expose the metal substrate, acting as anodes in the “corrosion cell”. The metal substrate oxidizes, producing substantial corrosion products that often increase the volume of the metal phase. For instance, the volume expansion caused by various oxide products from steel corrosion increases local stress in the concrete, damaging the protective layer around the reinforcing steel. Furthermore, the presence of stray currents accelerates chloride ion transport in concrete. The coupled effect of these two environmental factors poses a serious threat to the durability and safety of concrete structures [5]. Therefore, studying the corrosive effects of stray currents and chlorides on reinforced concrete structures is of significant importance.
In practical engineering, corrosion inhibitors are widely applied as an economical and effective anti-corrosion measure. Their primary function is to suppress the bipolar reactions of metal electrochemical corrosion. Specifically, the inhibiting components react on the metal surface to form an adsorption film. This film elevates the corrosion potential or increases charge transfer resistance [6], thereby mitigating corrosion effects under stray current and chloride ion attack.
Currently, environmentally friendly corrosion inhibitors are a research focus in this field. Corrosion inhibitors based on plant extracts [7,8] have significant potential for application. Academic reports have identified several plants with notable corrosion inhibition effects. These include perilla [9], Spartina alterniflora [10], orange peel [11], green tea [12] and so on. Ref. [9] introduced a plant-based corrosion inhibitor extracted from perilla seeds. They employed HPLC-MS, FT-IR, XPS, and chemical computation methods. The results indicated the presence of two effective components in perilla seeds: luteolin and apigenin. The adsorption behavior conformed to Langmuir adsorption theory. The adsorption free energy was −22.7 kJ/mol. A higher absolute value of adsorption energy correlates with better corrosion inhibition effects. Pradipta et al. compared the corrosion inhibition effects of green tea extract and standard commercial Ca(NO2)2 inhibitor [13] on reinforced concrete in mortar. At equivalent concentrations, both showed similar steel corrosion inhibition efficacy. In electrochemical tests, changes in the anodic and cathodic slopes of steel, within a corrosion cell, proved green tea extract to be a composite inhibitor. It formed a protective layer on the steel surface, enhancing its polarization resistance.
Xanthium sibiricum is a novel, environmentally friendly plant-based corrosion inhibitor that has received limited academic attention. Xanthium sibiricum, as the fruit of a common wild plant, is mainly distributed in China and some other Asian countries and regions, making it widely available and easy to obtain. Its surface is covered with stiff, hooked bristles, and the color is generally brown. It is relatively hard in texture, and due to the presence of the bristles, the surface has an irregular texture. From a chemical perspective, it contains various alkaloids and flavonoids, which have antioxidant properties [14]. The 1,5-dicaffeoylquinic acid it contains is considered a potential corrosion inhibitor component.
While research findings on biomass corrosion inhibitors are abundant, most studies remain focused on evaluating corrosion inhibition efficiency and investigating the mechanisms of action, with less emphasis on the practical engineering applications of biomass corrosion inhibitors. There is also limited consideration of the impact of corrosion inhibitors on the durability of concrete structures when they are incorporated. On the other hand, current research on the corrosion of reinforced concrete primarily concentrates on single ion or multi-ion exposure environments, with less attention given to studies of corrosion resistance and the exploration of chloride ion transport mechanisms under the combined effects of stray currents and high chloride salt environments. Therefore, this study first employed the natural potential method [15], corrosion area [16] and steel weight loss method [17], and linear polarization method [18] to verify the inhibitory effect of Xanthium sibiricum on steel in chloride-containing concrete. Subsequently, a two-dimensional multiphase ion transport model distinguishing coarse aggregates and cement mortar was constructed to simulate chloride ion transport in concrete under a stray current and chloride environment. Based on the simulation results, predictive formulas for the residual compressive strength of reinforced concrete were derived for various voltages and chloride ion concentrations after a specific corrosion period. Finally, field tests were conducted on an actual project operating in similar environments. These tests determined the optimal dosage of the Xanthium sibiricum corrosion inhibitor for practical applications. Furthermore, in connection with the above formulas, a prediction formula was developed. This formula estimates the remaining compressive strength of reinforced concrete after a specific corrosion period, taking into account various dosages of corrosion inhibitors.

2. Experiments and Methods

2.1. Verification Test of Xanthium sibiricum’s Corrosion Inhibition Effect on Reinforcing Steel

2.1.1. Experimental Materials

HRB400 grade reinforcing steel bars with a diameter of 20 mm were selected. These bars were cut into small segments approximately 200 mm in length. The segments were then immersed in a citric acid solution for one week. After removal, they were polished with sandpaper until the surface was smooth and shiny. Finally, the segments were cleaned with alcohol, dried in an oven, and set aside for later use. The cement, sand, aggregates, mineral admixtures, and chemical additives used for mixing concrete were all sourced from Ningbo Hengzhu Building Materials Co., Ltd. in Zhejiang Province (Ningbo, China). Additionally, 500 g of Xanthium sibiricum extract, sodium chloride, and epoxy resin adhesive were prepared.

2.1.2. Preparation of Concrete Specimens

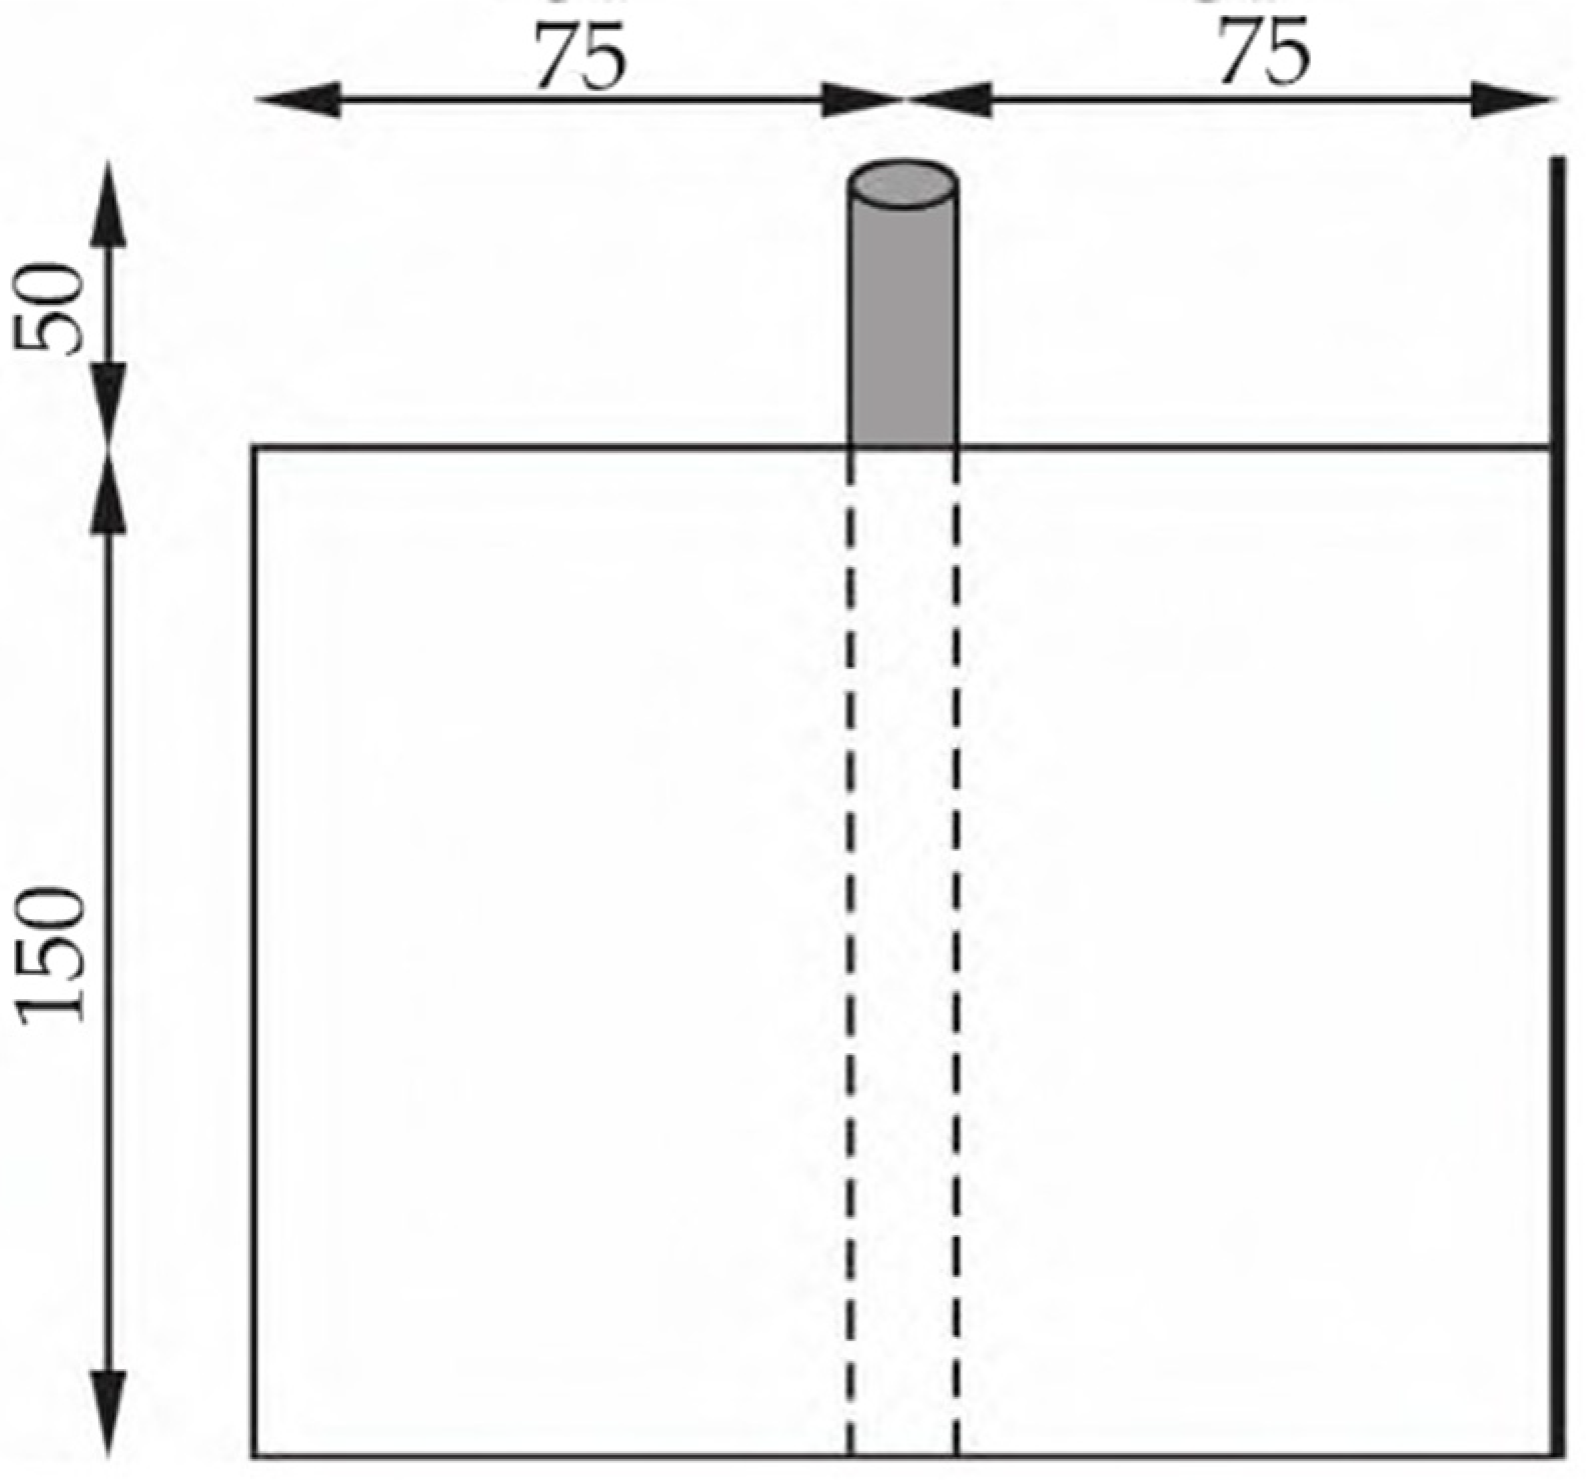
This experiment utilized concrete specimens with a fixed water–cement ratio of 0.43. All specimens were of uniform specifications, with dimensions set at 150 mm × 150 mm × 150 mm. A diagram is shown in Figure 2, and the concrete mix proportions used in the experiment are presented in Table 1. According to the JGJ/T 192-2009 “Technical Specification for Application of Steel Reinforcement Corrosion Inhibitors”, the mass ratio of powdered rust inhibitor to Cl should be greater than or equal to 1.2 [19]. The Cl concentrations in the concrete specimens were 0.5% and 1% of the cement mass. The ratios of Cl content to Xanthium sibiricum corrosion inhibitor content were set at 1:1, 1:2, and 1:3. The specific proportions are detailed in Table 2. After molding, the concrete samples underwent a 24 h curing process before demolding. The exposed reinforcing steel on the specimen surface was then sealed with epoxy resin. Subsequently, the specimens were placed in a standard curing environment at 20 °C with humidity ≥ 95%, where they were cured until reaching an age of 28 days.

2.1.3. Natural Potential Method Testing

The method utilizes the electrochemical potential difference formed during the corrosion process of reinforcing steel, creating a corrosion couple on the steel. By detecting the potential differences between the concrete surface, the interior of the concrete, and the reinforcing steel, it is possible to assess the degree of steel corrosion. The evaluation criteria for reinforcing steel corrosion are shown in Table 3.

2.1.4. Reinforcing Steel Mass Loss Test and Corrosion Area Test

  • Reinforcing Steel Mass Loss Method: After cutting the concrete specimens, the reinforcing steel samples were obtained and initially weighed, with their mass recorded as m1. The samples were then immersed in a 10% ammonium citrate solution to remove corrosion products. After this treatment, they were weighed again, and their mass was recorded as m2. The following formula was used to calculate the mass loss ratio of the reinforcing steel:
    R = m 1 m 2 m 1 × 100 %
    where R represents the rebar weight loss rate (%), m1 represents the initial quality of steel bars (g), m2 represents the quality of steel bars after rust removal (g).
2.
Corrosion Area Method: After cutting the concrete specimens, the reinforcing steel was extracted. Transparent sulfuric acid test paper was used to trace the corroded areas on the surface, as shown in Figure 3. Relevant analytical tools were employed to calculate the corroded area. The following formula was used to determine the corrosion area ratio of the reinforcing steel:
P = s s 0 × 100 %
where P represents the corrosion area rate of steel bars (%), s represents the corrosion area of steel bars (mm2), and s0 represents the total surface area of steel bars (mm2).

2.1.5. Linear Polarization Method Testing

The linear polarization method utilizes electrochemical principles to measure the corrosion current density and rate of reinforcing steel. It determines the polarization resistance value by analyzing the potential shift induced by micro-currents, specifically the potential fluctuations near the natural potential of the reinforcing steel. This method allows for the continuous monitoring of the reinforcing steel’s corrosion rate dynamics while maintaining electrode integrity, providing a non-destructive means for corrosion rate assessment. In the testing system, a platinum electrode serves as the auxiliary electrode, and silver/silver chloride (in saturated potassium chloride solution) acts as the reference electrode. The polarization range is approximately from −880 mV to −100 mV. Figure 4 shows the electrode testing system in the test. The evaluation of the steel corrosion rate is shown in Table 4.

2.2. Simulation of Chloride Ion Transport in Concrete

The Self-written finite element calculation program used in the study is based on the finite element method, solving partial differential equations or systems of partial differential equations to perform physical simulations. We utilized two modules of the software: the electrostatic field and the porous medium dilute substance transport, while considering the multiphase nature of concrete materials, to simulate the transport of chloride ions in concrete.

2.2.1. Finite Element Model and Calculation Parameters

This finite element model considers the multi-phase nature of concrete materials. Based on the cross-section of concrete specimens from the previous experiment, a two-dimensional model distinguishing between aggregates and mortar was established. The geometric mesh division of this model is shown in Figure 5, comprising a total of 62,170 elements. This model was subsequently used to simulate the ion migration and diffusion processes of chloride ions within concrete under stray current and chloride environment conditions. Table 5 presents the calculation parameters determined based on the reference literature [20,21].

2.2.2. Calculation Conditions

In actual engineering scenarios, the polarization potential caused by stray currents generally does not exceed 150 mV, and the chloride ion concentration in service environments typically ranges from 0.6 to 1.8 mol/L. Therefore, the calculations will simulate chloride ion penetration under four voltage values: 0 mV, 50 mV, 100 mV, and 150 mV, with varying chloride ion concentrations.

2.3. Field Tests in Actual Engineering Projects

The Taojia River Drainage Hub and Water Supply Project in Yuyao City is located on the west side of the Taojia River estuary in Simen Town, Yuyao City, Ningbo, Zhejiang. This pump station is situated in a high-chloride environment along China’s East Sea coast. The service environment of the pump station is determined by its geographical location and the stray currents generated by power transmission lines of the plant and surrounding sea walls. Using this as the experimental background, the study investigates the optimal dosage of a Xanthium sibiricum corrosion inhibitor in practical engineering and predicts the remaining compressive strength of reinforced concrete after adding this inhibitor.
The experimental plan involved casting 64 concrete specimens, each measuring 150 mm × 150 mm × 150 mm, with embedded reinforcing steel, and 60 specimens were divided into 4 groups of 15 each. During the casting process, the Xanthium sibiricum corrosion inhibitor was added to the four groups at concentrations of 0 g/L, 1 g/L, 2 g/L, and 3 g/L, respectively, forming four sample sets with different inhibitor concentrations. The proportion of inhibitor added was determined by the ratio of Xanthium sibiricum mass to the volume of concrete pore liquid. After casting, all specimens underwent standard curing for 28 days. Following curing, all 60 specimens were placed in seawater under conditions identical to the Taojia River pump station’s service environment, simulating the performance changes in concrete during pump station operation. Over the next five months, on the same day each month, three specimens from each of the four concentration groups were removed for uniaxial compression testing [22,23,24]. The test was repeated three times for each group, and the average value was used to represent the compressive strength of each concrete specimen under different dosages of rust inhibitor after varying periods of corrosion.
After allocating the above 4 groups of specimens, the remaining 4 specimens were mixed with the Xanthium sibiricum corrosion inhibitor at concentrations of 0, 1 g/L, 2 g/L, and 3 g/L, respectively. Following 28 days of standard curing, these 4 specimens underwent uniaxial compression testing. The purpose of this was to obtain the compressive strength of reinforced concrete specimens that had just reached maturity without experiencing corrosion.

2.3.1. Experimental Materials and Equipment

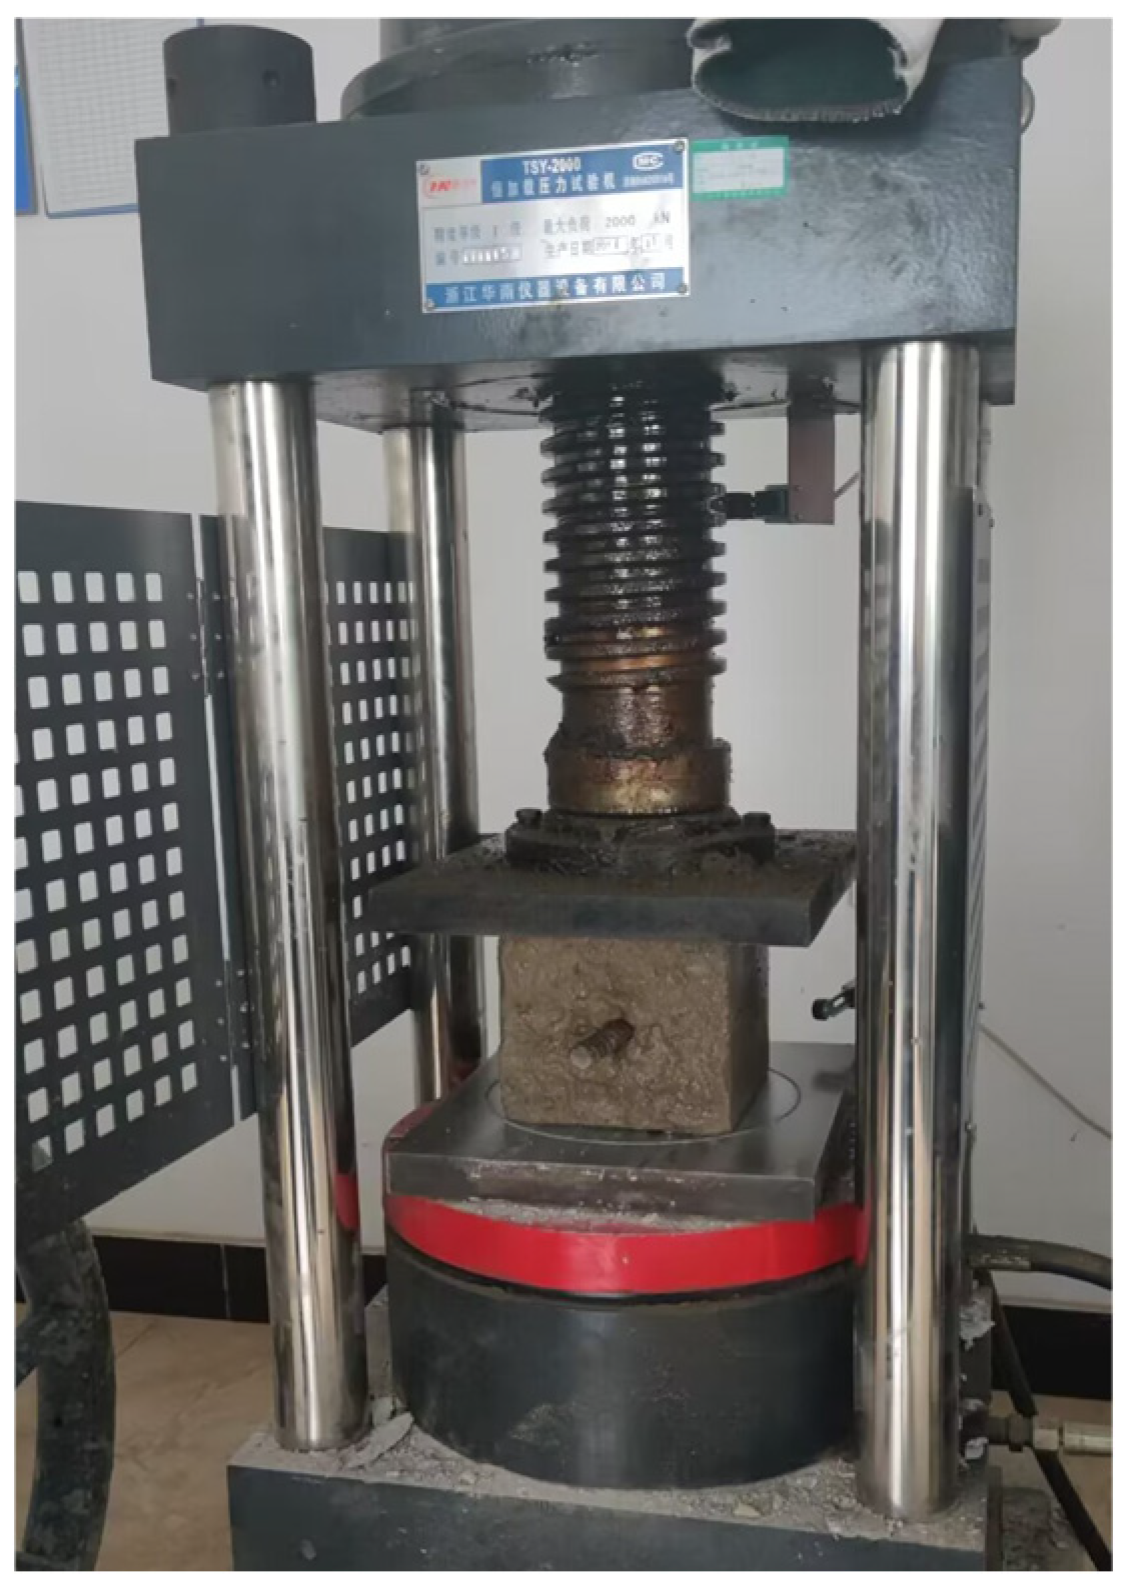
All materials were sourced from the construction site. The cement used in the concrete was P.O42.5 grade cement from Ningbo Yongshun Building Materials Technology Co., Ltd. (Ningbo, China) The mineral powder is S95 grade, the fly ash is Class II, and the water reducer is the LH-100 type polycarboxylic acid. The reinforcing steel was HRB400 threaded rebar cut from the construction site’s rebar shed. The uniaxial compression test utilized a TSY-2000 constant loading pressure testing machine (Lushida, Shaoxing, China). Figure 6 illustrates the fracture process of the specimens.

2.3.2. Specimen Preparation

First, obtain the commercial concrete used at the construction site for casting the test specimens. Apply machine oil evenly to the bottom and sides of the concrete molds. Then, use a shovel to fill the molds with concrete, ensuring the filling is as uniform as possible, while scattering different amounts of Xanthium sibiricum powder and embedding HRB400 steel bars according to the grouped categories. After filling, use a vibrating device to thoroughly vibrate the concrete in the molds. This helps the concrete flow adequately and removes internal air bubbles, thereby enhancing its density and overall strength. After completing the vibrating process, use a scraper to level the surface of the concrete specimens. Place the specimens in a room-temperature environment for initial setting. Approximately 24 h later, demold the specimens and then place them in a standard curing room for 28 days of curing, ultimately obtaining the test specimens. The prepared samples awaiting curing are shown in Figure 7.

3. Results and Discussions

3.1. Evaluation of the Corrosion Inhibition Effect of the Inhibitor on Chloride-Containing Reinforced Concrete

3.1.1. Natural Potential of Reinforcing Steel

Figure 8a shows the changes in the natural potential of the reinforcing steel from 1 to 9 months in concrete blocks under various inhibitor dosages when the Cl content was 0.5%. Without the addition of the inhibitor, the natural potential of the reinforcing steel changed significantly. After only two months, the natural potential value had dropped below −300 mV, and further decreased to below −350 mV during the 5th to 6th month. According to the evaluation criteria, there was a greater than 90% probability of reinforcing steel corrosion. After adding the Xanthium sibiricum corrosion inhibitor, the natural potential of the reinforcing steel improved notably compared to the control group D-1. As the inhibitor dosage increased, the natural potential of the reinforcing steel showed an upward trend. Generally, the natural potential values decreased with extended curing time, with different groups showing similar trends.
Figure 8b shows the line graph of natural potential values of reinforcing steel under the effect of the inhibitor when the Cl content was 1%. It can be observed that the trend in the inhibitor’s influence on the natural potential values is consistent with (a). When the ratio of chloride ions to inhibitor content remained constant, the natural potential values decreased with increasing chloride content. This suggests that increased chloride content may adversely affect the efficacy of the inhibitor.

3.1.2. Mass Loss Rate and Corrosion Area Rate of Reinforcing Steel

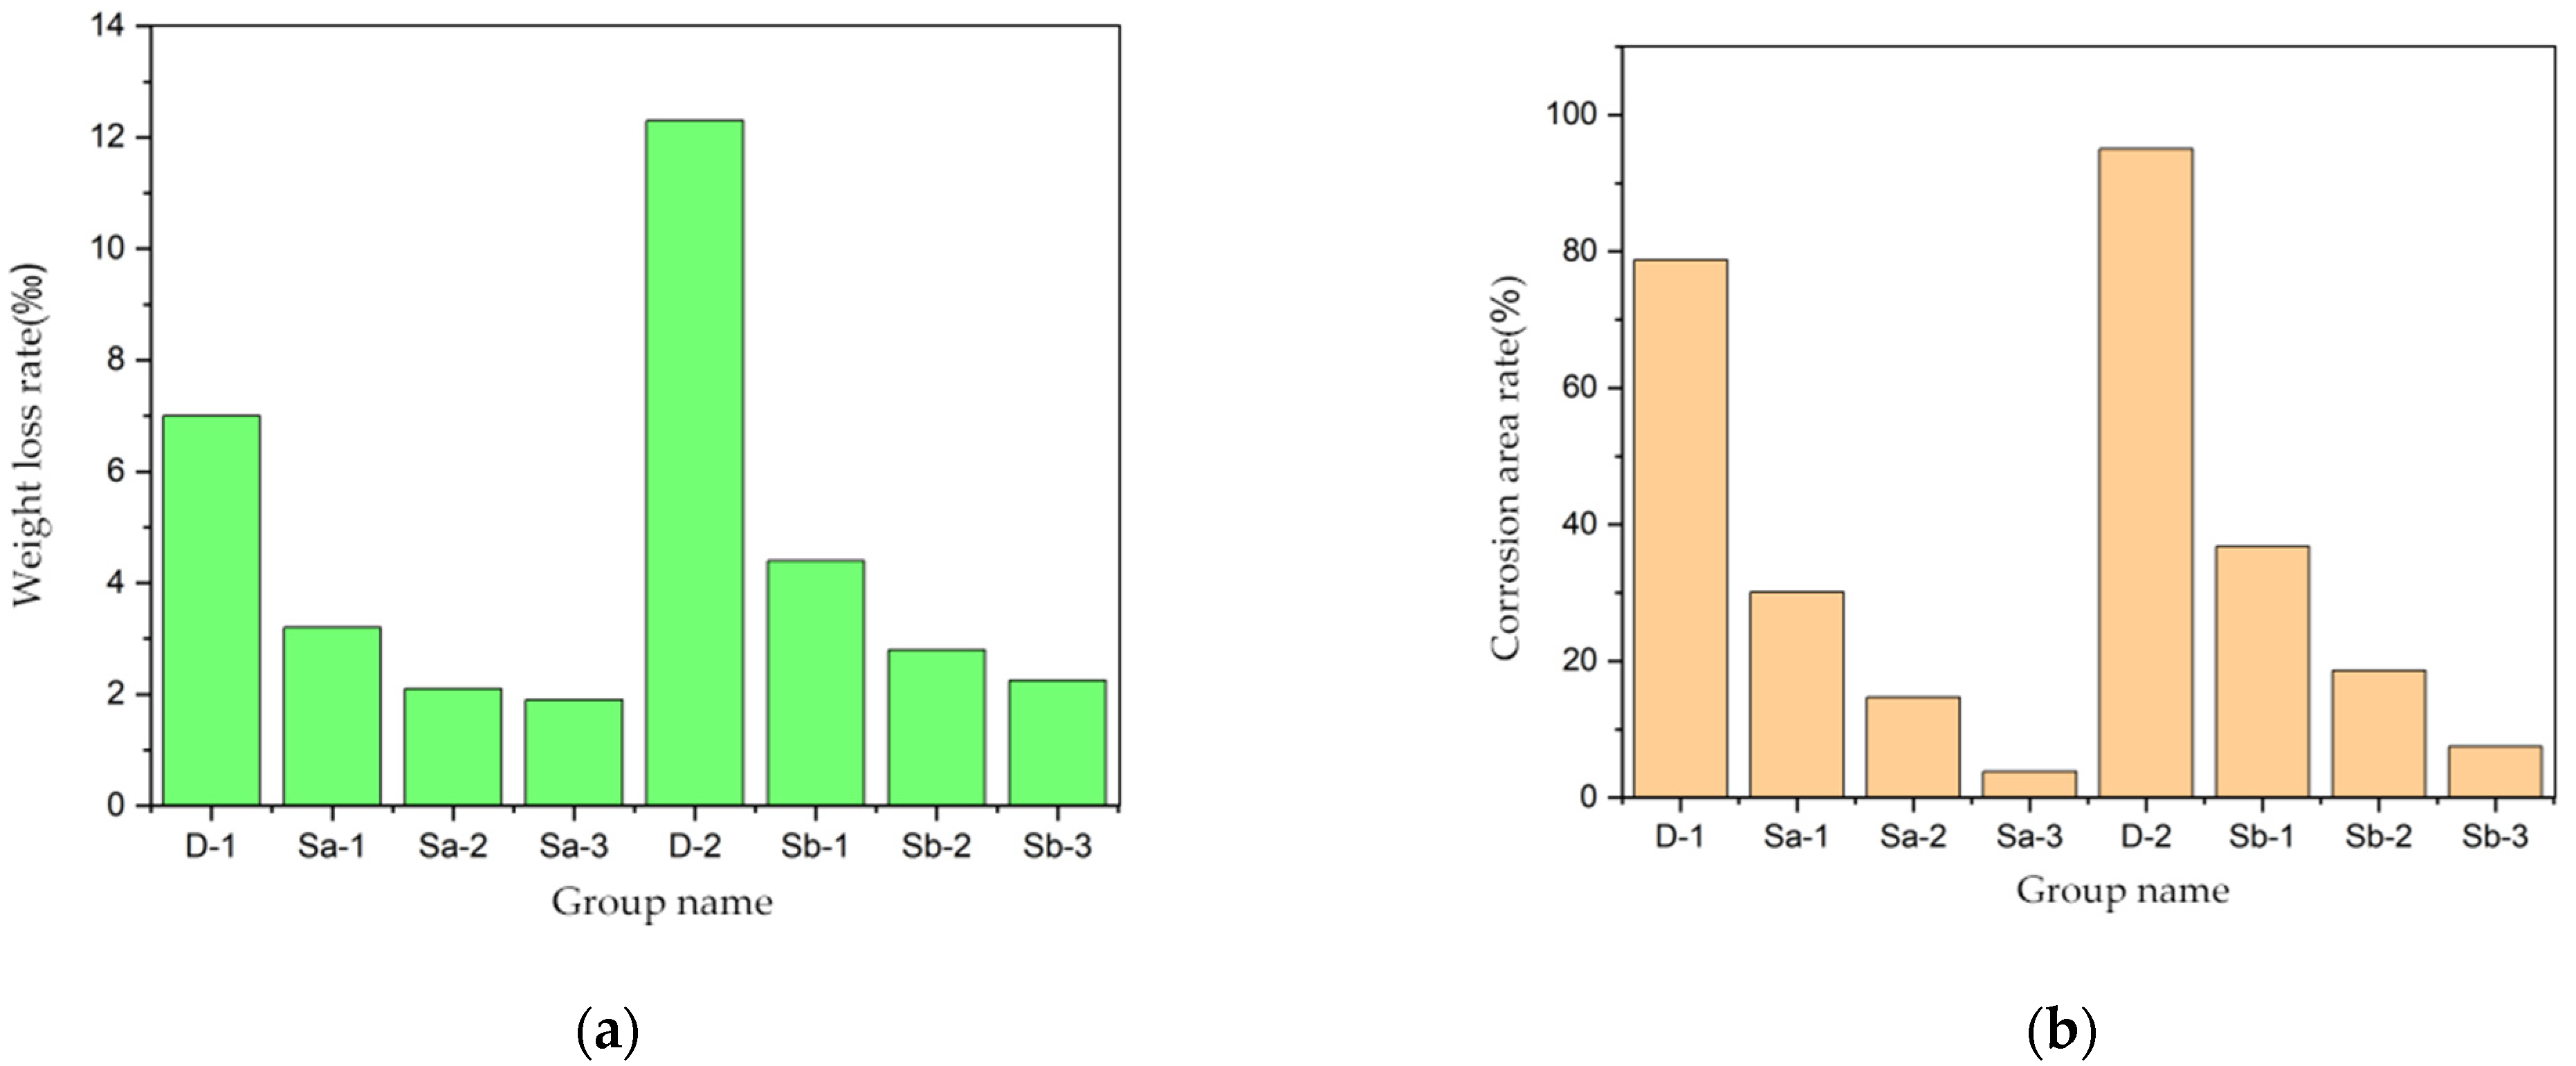
Figure 9a illustrates the mass loss of reinforcing steel in chloride-containing concrete under the influence of Xanthium sibiricum. As the corrosion inhibitor was added, the proportion of mass loss in the reinforcing steel gradually decreased, directly reflecting a reduction in the level of steel corrosion. In the control group D-2, where steel mass loss was most severe, the loss rate reached 12.4‰. In contrast, in the Sa-3 group, which showed the best corrosion inhibition effect, the mass loss ratio of the reinforcing steel was only 1.9‰.
Figure 9b shows the changes in the corrosion area ratio of reinforcing steel in chloride-containing concrete under the influence of Xanthium sibiricum. It is evident that the control group without the inhibitor experienced the most severe corrosion, with corrosion covering almost the entire surface of the reinforcing steel, reaching a corrosion area ratio of 93.7%. As the amount of Xanthium sibiricum corrosion inhibitor increased, the extent of reinforcing steel corrosion significantly decreased. When the chloride ion content was 0.5% and the inhibitor addition ratio was 1.5%, the corrosion area ratio of the reinforcing steel was as low as 3.78%. Conversely, when the mass ratio of Xanthium sibiricum to chloride ions was 1:1, the corrosion area ratio of the reinforcing steel increased significantly, exceeding 30%.
Comparing Figure 9a,b, it is evident that when the mass ratio of chloride ions to Xanthium sibiricum remains constant, the corrosion of steel bars is more severe in a 1% chloride ion concentration environment. This reflects the weakening effect of increased chloride content in concrete on the corrosion inhibition efficacy of the Xanthium sibiricum inhibitor.

3.1.3. Linear Polarization Method

After three months of curing, Tafel curves were determined for the reinforcing steel inside the concrete specimens containing the corrosion inhibitor and the control group. Data fitting was performed based on these Tafel curves. Figure 10 shows the polarization curves of reinforcing steel under the influence of 0.5% chloride ion content and the corrosion inhibitor. Table 6 presents various data obtained by fitting calculations using fitting program on the Tafel polarization curves of the reinforcing steel.
From Figure 10, it can be observed that at a fixed chloride ion content, as the amount of Xanthium sibiricum extract increases, the corrosion potential of the reinforcing steel shifts in a positive direction. Compared to the control group, the changes in Sa-1 and Sa-2 are particularly notable. The relevant literature [25,26] indicates that the magnitude of reinforcing steel’s corrosion potential can reflect its corrosion tendency. A positive shift in corrosion potential represents a slowing of the steel corrosion process, suggesting that the Xanthium sibiricum corrosion inhibitor can achieve a good inhibition effect. Table 6 shows that the corrosion rate of reinforcing steel in the D-1 group without the inhibitor is approximately 47.5% faster than that of the experimental group Sa-3, with the steel loss rate being about 40% more severe. As the ratio of chloride ion content to Xanthium sibiricum content increases, the self-corrosion current density of the reinforcing steel gradually decreases, implying a reduction in the electrochemical reaction rate at the test electrode surface. It is preliminarily speculated that active compounds in high concentrations of Xanthium sibiricum, due to their strong oxidizing properties, chemically react with the metal surface, promoting the formation of a dense protective passivation layer. This effectively reduces contact between the reinforcing steel and chloride ions, inhibiting the rate of corrosion reactions and enhancing the corrosion resistance of the reinforcing steel.

3.2. Analysis of Finite Element Calculation Results

3.2.1. Model Validation

Figure 11 presents cloud diagrams showing the partial simulation results of chloride ion diffusion in concrete under the influence of stray currents and chloride salt. The different colors in the color scale of Figure 11 represent varying concentrations of chloride ions due to different depths of chloride ion intrusion.
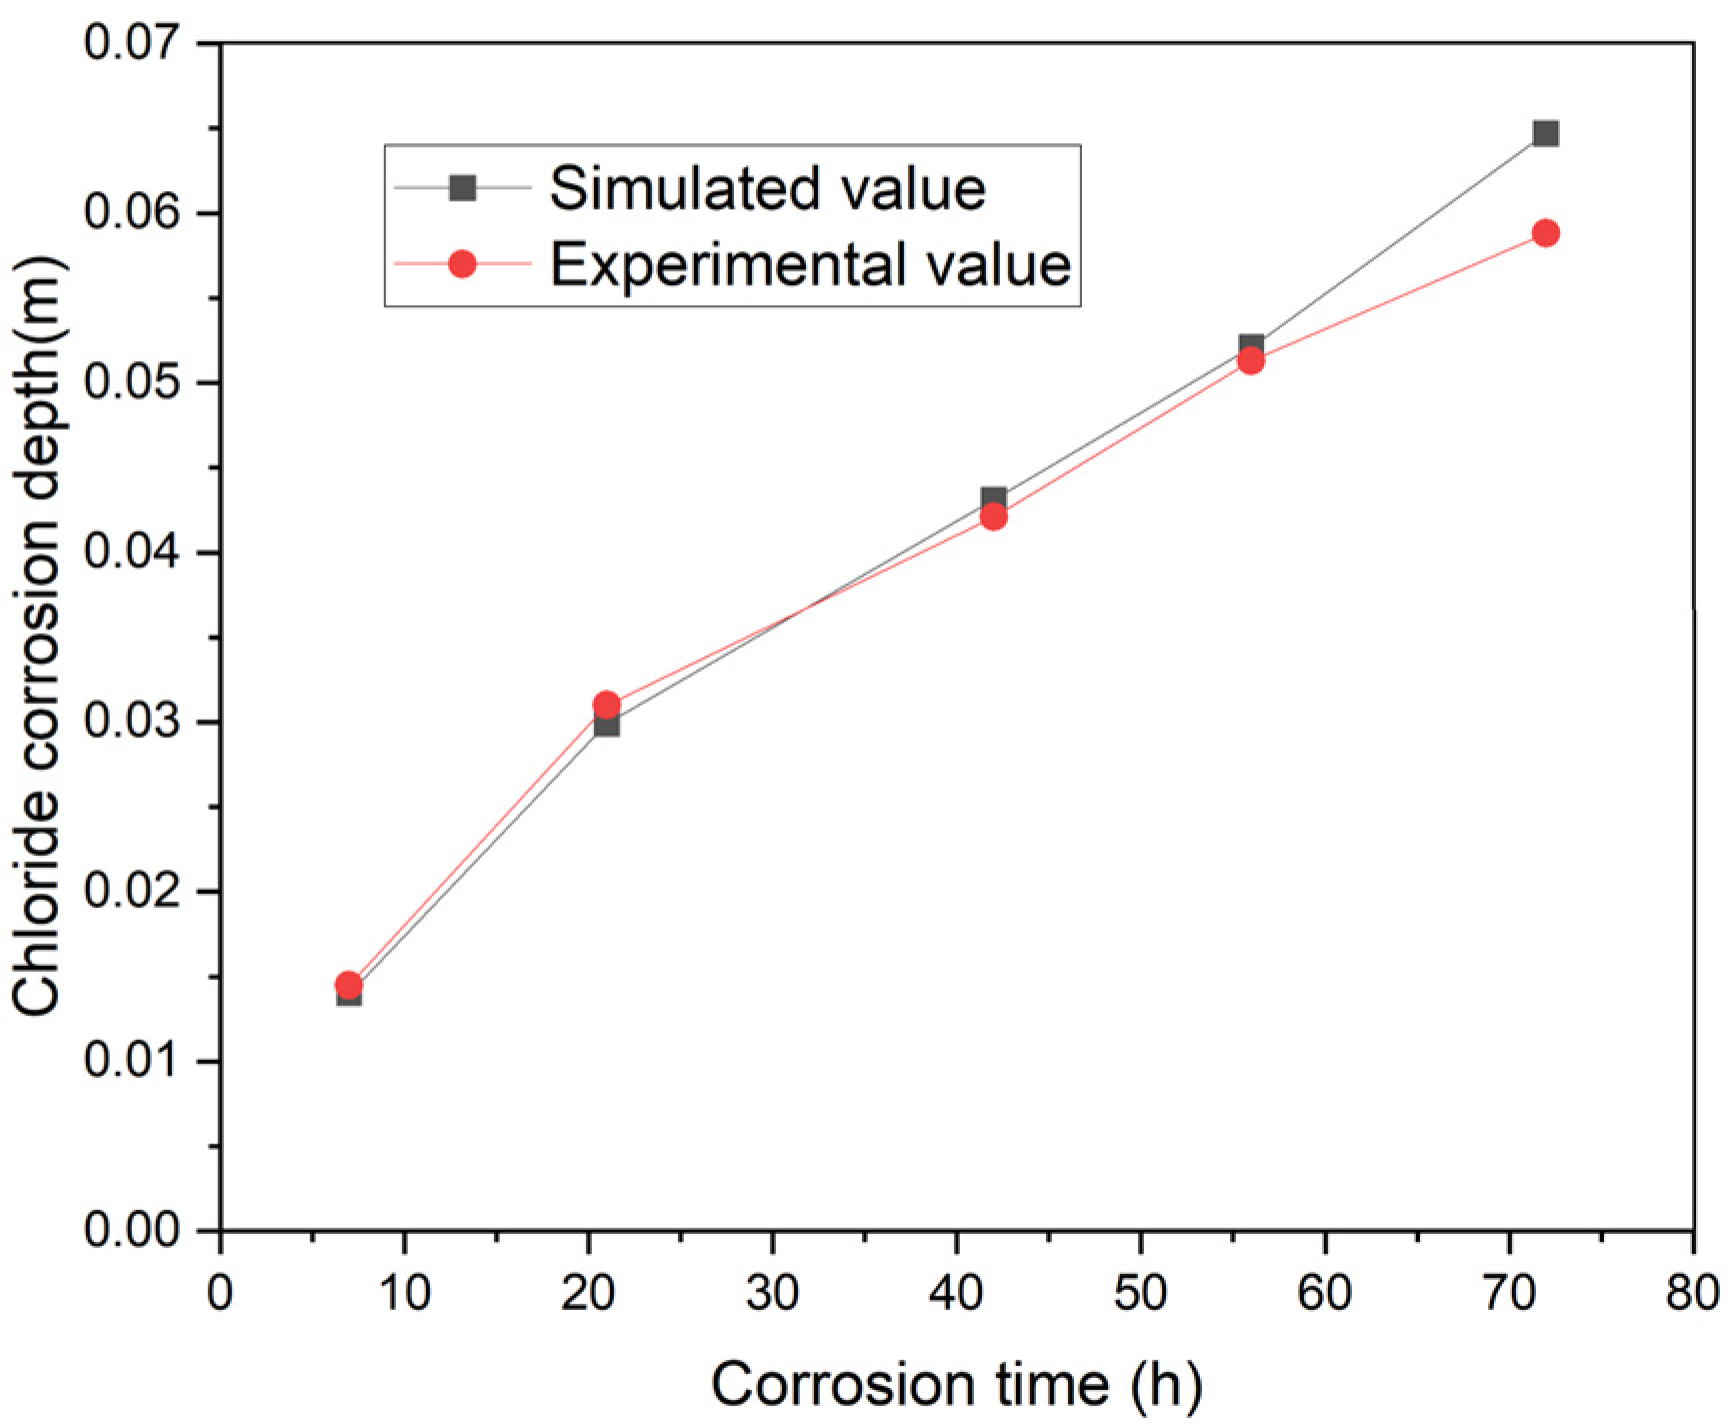
In these cloud diagrams, the red contour lines represent the limit boundary of chloride ion diffusion. Their maximum depth indicates the penetration depth of chloride ions in concrete at a specific time under different external chloride ion concentrations and voltages. Figure 12 shows a line graph comparing the simulated calculation values with experimental data for the depth of cathode chloride ion penetration. The experimental data are sourced from [21]. As can be seen from the figure, the simulated values are largely consistent with the experimental test values. Through a correlation analysis of these two sets of data, their Pearson correlation coefficient is found to be 0.9875. This demonstrates the accuracy and effectiveness of the ion diffusion model employed.

3.2.2. Prediction of Chloride Ion Penetration Depth in Concrete

From Figure 11, it can be observed that when only considering the changes in chloride ion concentration, the depth of chloride ion penetration inside the concrete gradually increases over time. However, the rate of penetration decreases gradually with time. According to Fick’s Second Law [27], during the ion transport process, the higher the chloride ion concentration outside the boundary, the more rapid the penetration speed of chloride ions in the solution, and the shorter the time required for the chloride ion concentration to reach the threshold value. Therefore, the simulation results are consistent with the inferences from Fick’s Second Law.
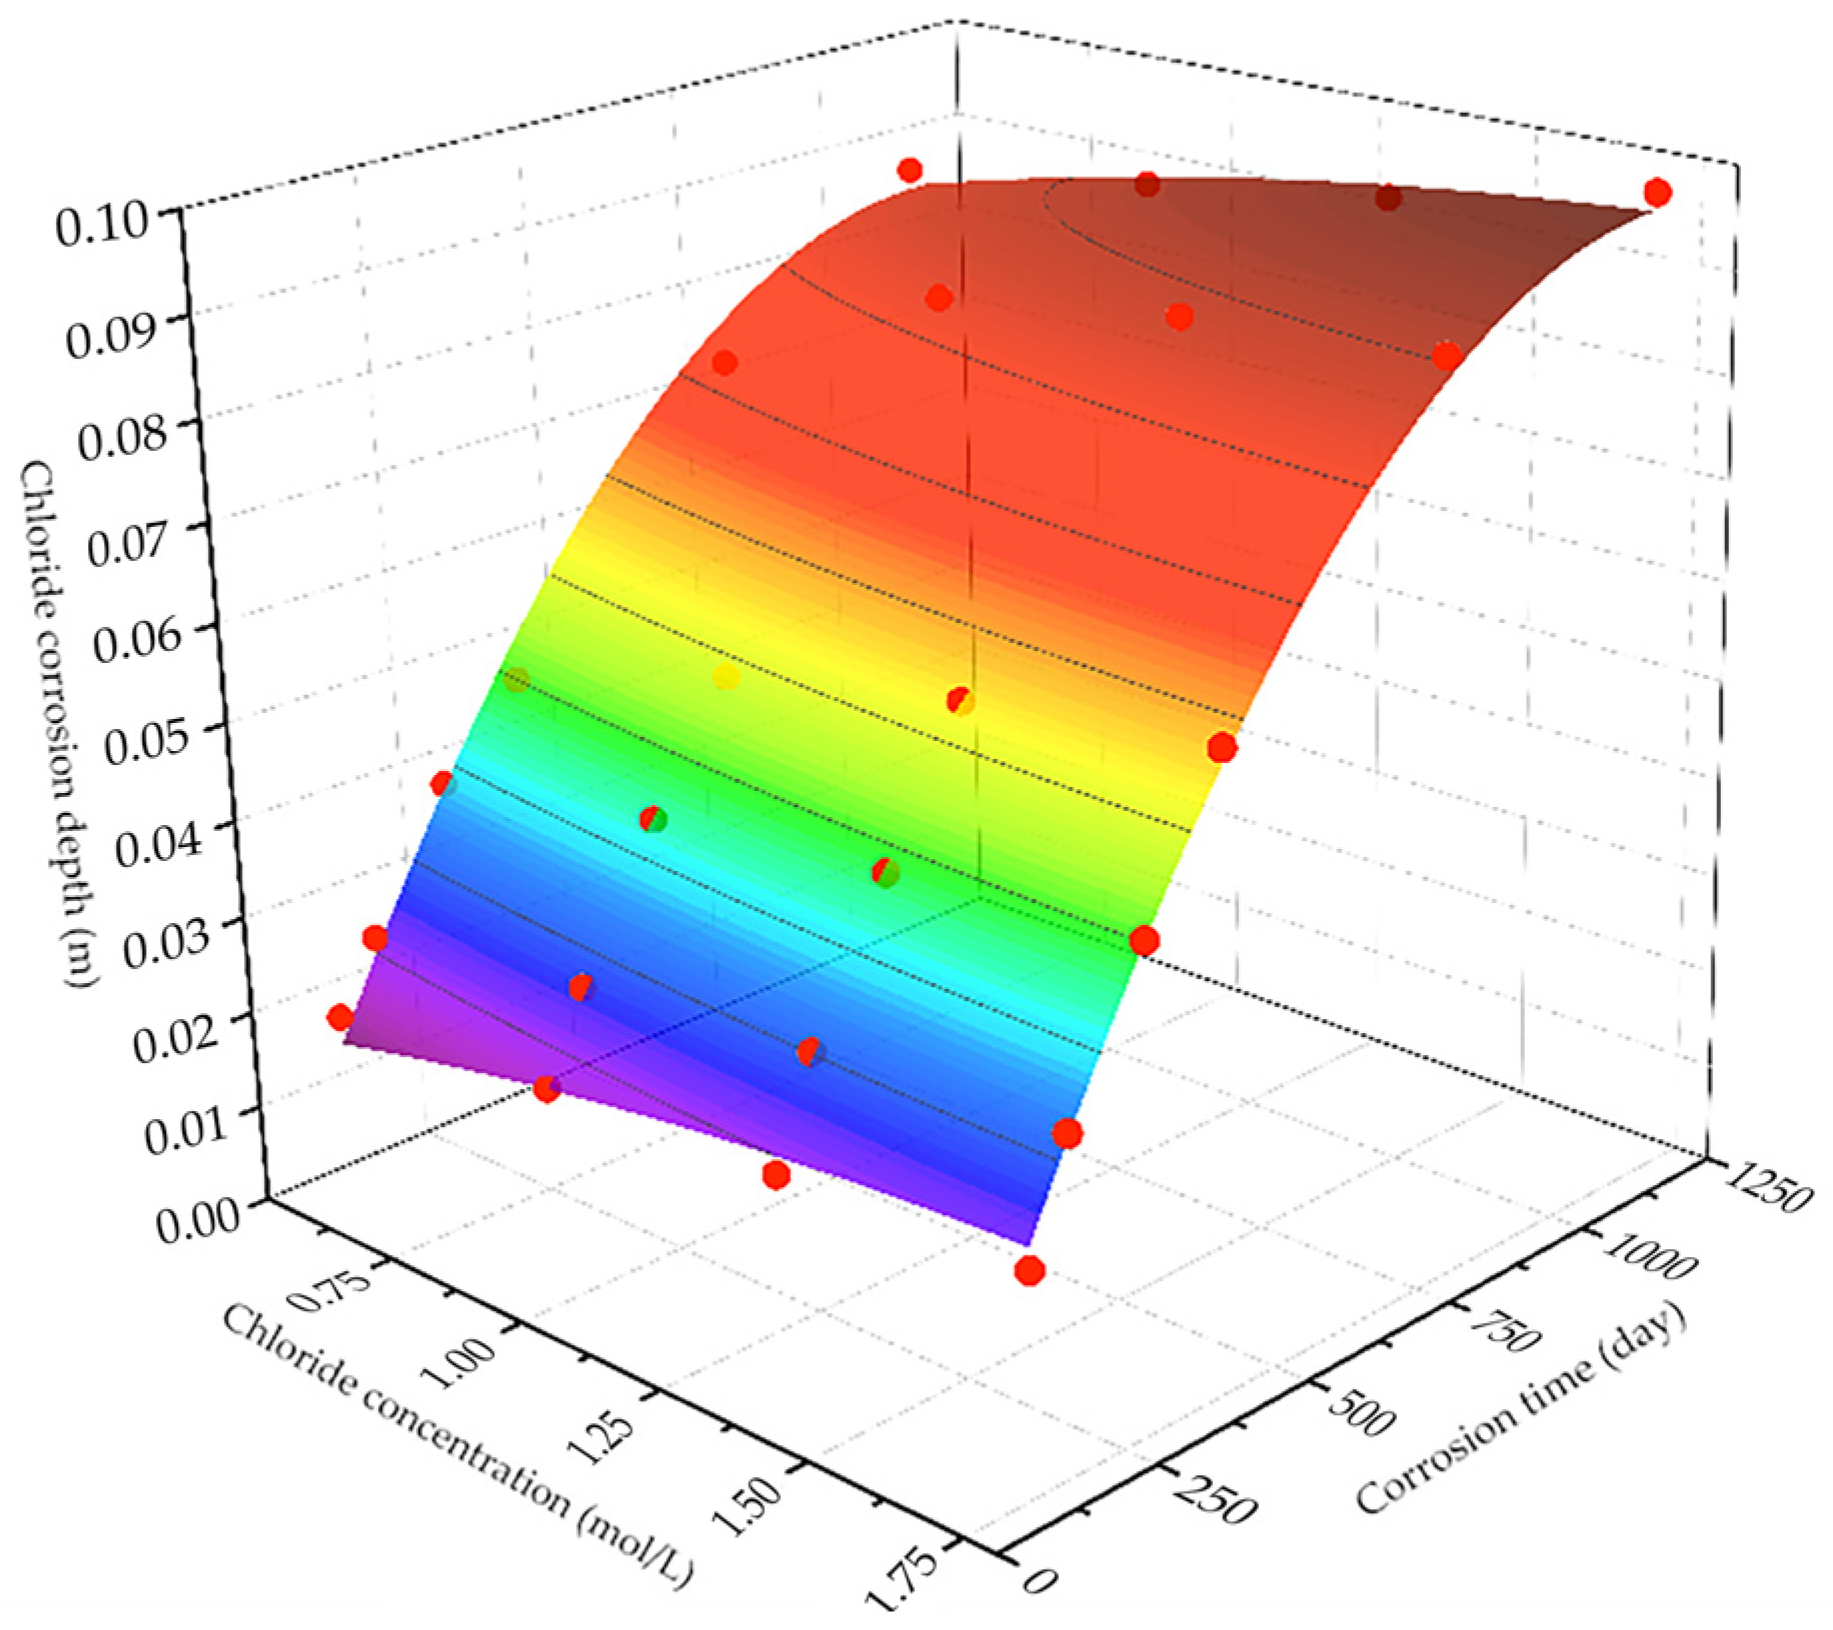
In this section, using the simulated values obtained from finite element calculations, a quadratic polynomial fitting was first applied to quantify the relationship among chloride ion penetration depth, chloride ion concentration, and corrosion time under the same voltage conditions. Figure 13 presents the fitted surfaces of chloride ion penetration depth versus chloride ion concentration and corrosion time under different voltages (it displays the fitted surface under the voltage of 150 mV).
Subsequently, a cubic polynomial fitting was performed between the fitting coefficients of chloride ion penetration depth, chloride ion concentration, and corrosion time under the same voltage conditions and the voltage itself. This resulted in a quantitative relationship between chloride ion penetration depth, voltage, chloride ion concentration, and corrosion time, as expressed in Equation (3):
d t = 10 5 ( 10 6 255450 15453 397 10 6 318456 17157 1831 3053.2 610 75.9 6.1 408215 94375 4482 570 2.2 0.4 0.04 0.003 1453.2 325 23.3 1.3 ψ 3 ψ 2 ψ 1 ) T 1 C C l t C C l 2 t 2 C C l t
where dt is the chloride ion corrosion depth of reinforced concrete (m), Ψ is the voltage intensity of the stray current (V), C Cl is the chloride ion concentration in the service environment (mol/L), t is the corrosion time of reinforced concrete (days).

3.2.3. Prediction of Remaining Compressive Strength of Concrete

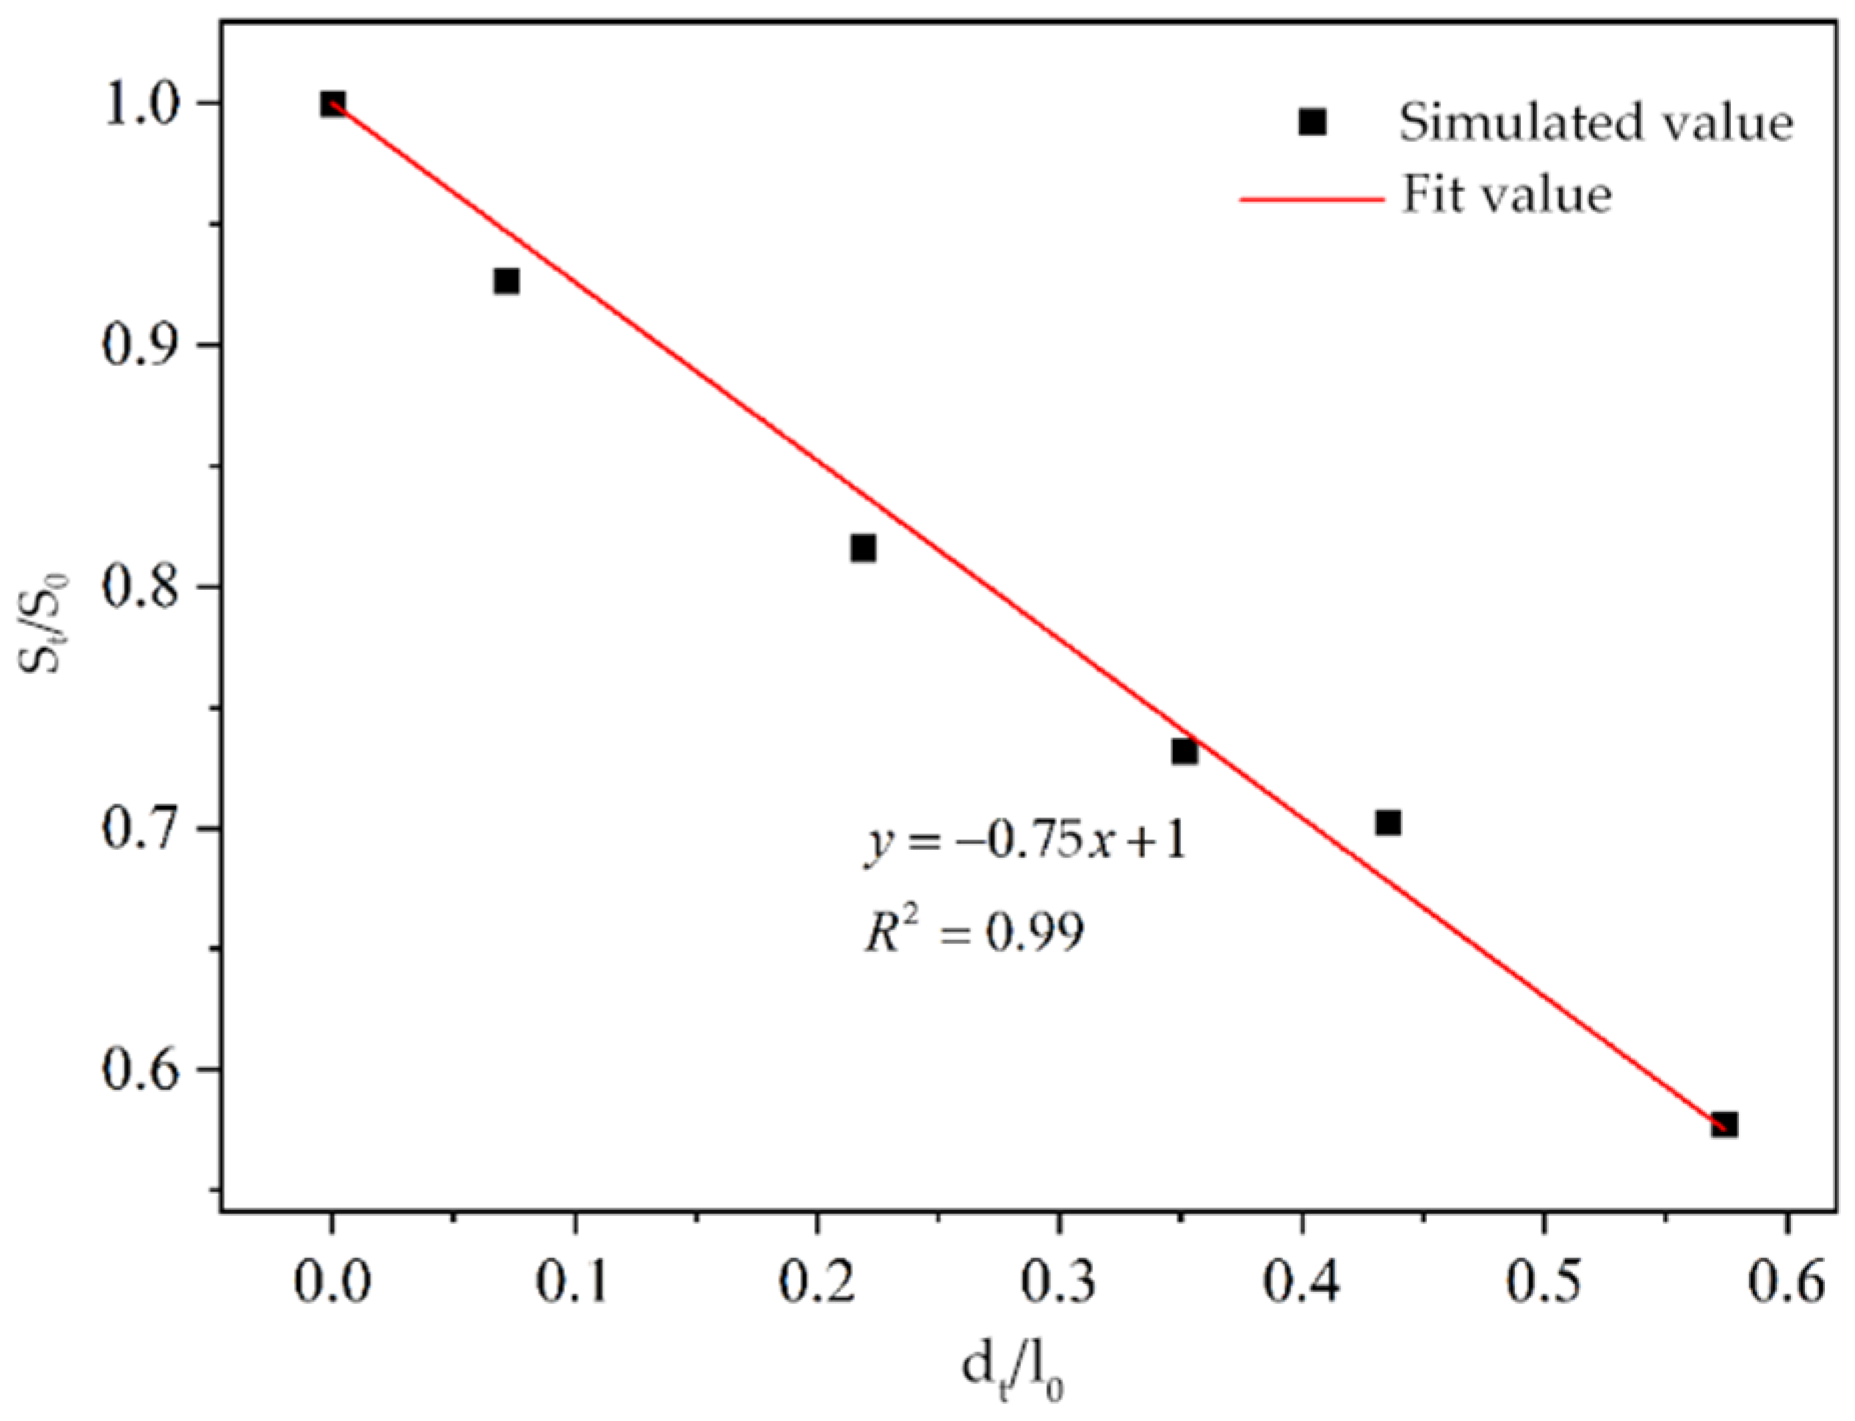
In this section, using the compressive strength obtained from the uniaxial compression numerical model in the reference literature [21] and the corrosion data obtained from finite element calculations, after normalization processing, linear fitting was performed. The fitting image is shown in Figure 14. From the figure, it can be seen that the strength of concrete and the corrosion depth of chloride ions show a negative correlation in a linear function relationship.
By substituting S/S0 and dt/l0 into the fitted linear function, we can obtain Formula (4) for the current compressive strength s of reinforced concrete, which can be used to predict the strength of corroded concrete:
S t = ( 1 k d t l 0 ) S 0
where St is the remaining compressive strength of reinforced concrete (MPa), S0 is the initial compressive strength of reinforced concrete (MPa), l0 is the edge length of the reinforced concrete specimen along the corrosion direction (m), and k is the strength loss coefficient.
Formula (4) essentially reflects the strength reduction in reinforced concrete after corrosion. The strength loss coefficient k is related to the concrete mix ratio, steel bar material properties, etc. According to Figure 13, the strength loss coefficient k is 0.75. By directly substituting the prediction formula (4) for chloride ion corrosion depth, we obtain Formula (5), which is the prediction formula for the remaining compressive strength of reinforced concrete after corrosion for a certain time under different voltages and chloride ion concentrations:
S t = S 0 0.7 5   S 0 l 0 10 5 ( 10 6 255450 15453 397 10 6 318456 17157 1831 3053.2 610 75.9 6.1 408215 94375 4482 570 2.2 0.4 0.04 0.003 1453.2 325 23.3 1.3 ψ 3 ψ 2 ψ 1 ) T 1 C C l t C C l 2 t 2 C C l t

3.3. Analysis of Field Test Results

3.3.1. Optimal Dosage of Xanthium sibiricum Corrosion Inhibitor in Engineering Applications

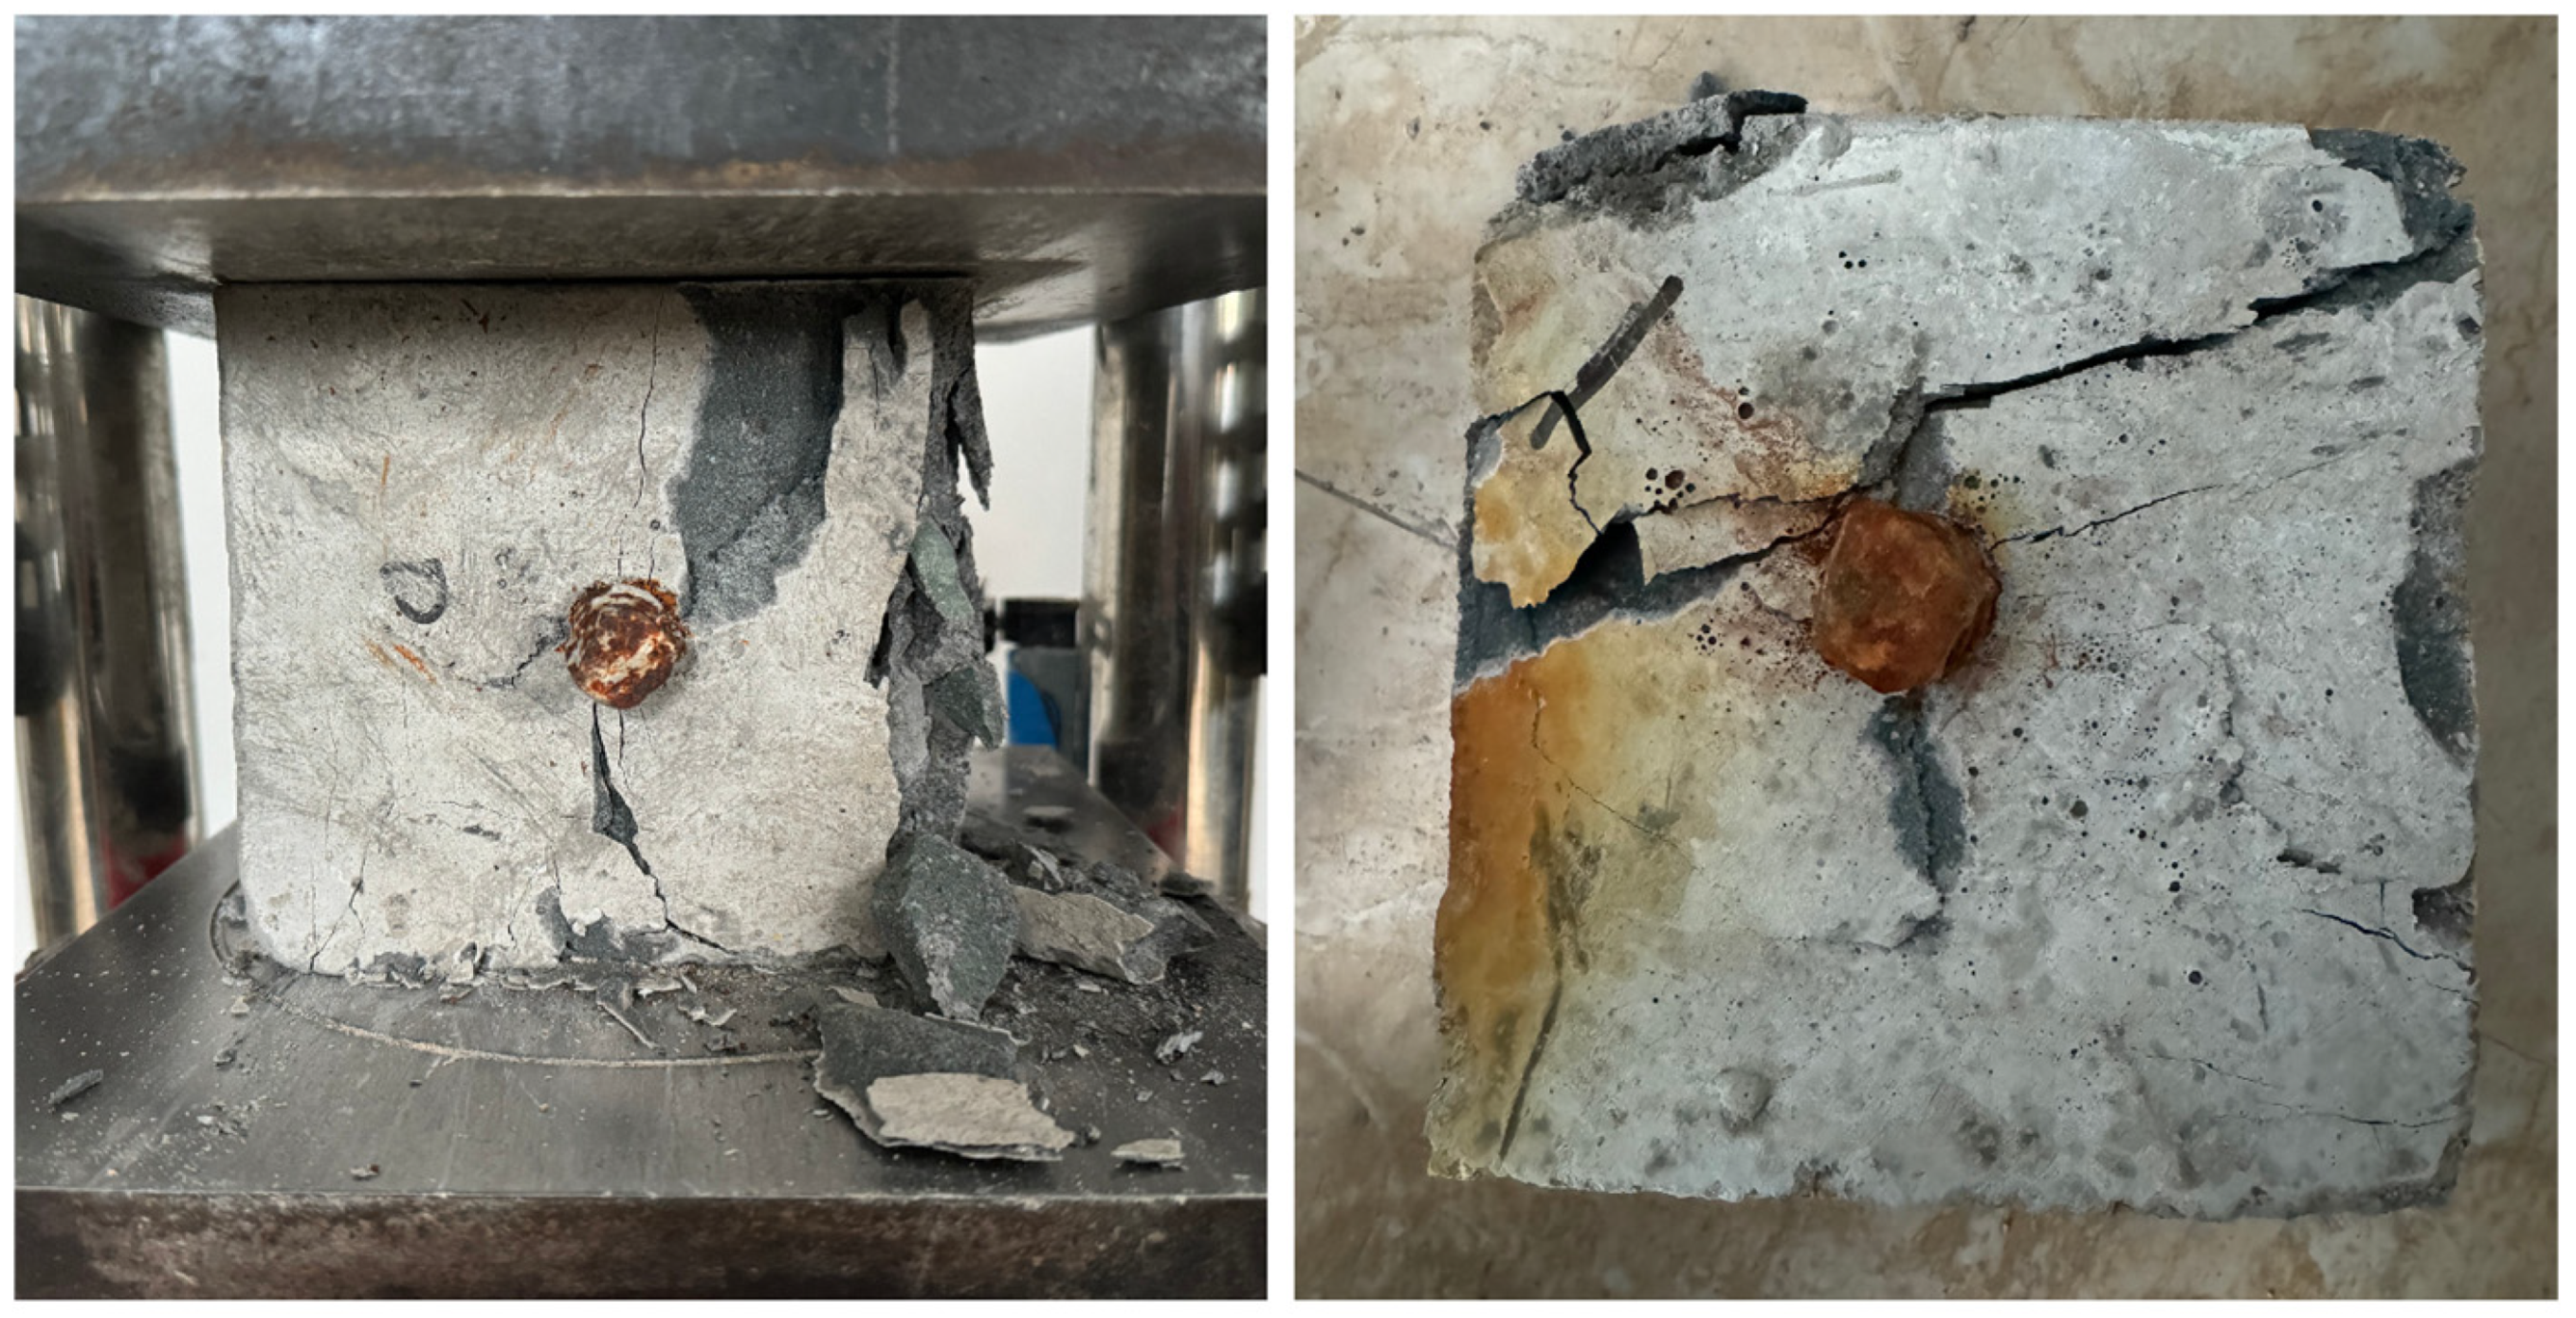
Figure 15 shows the reinforced concrete specimen being fractured and its remnants during the field test.
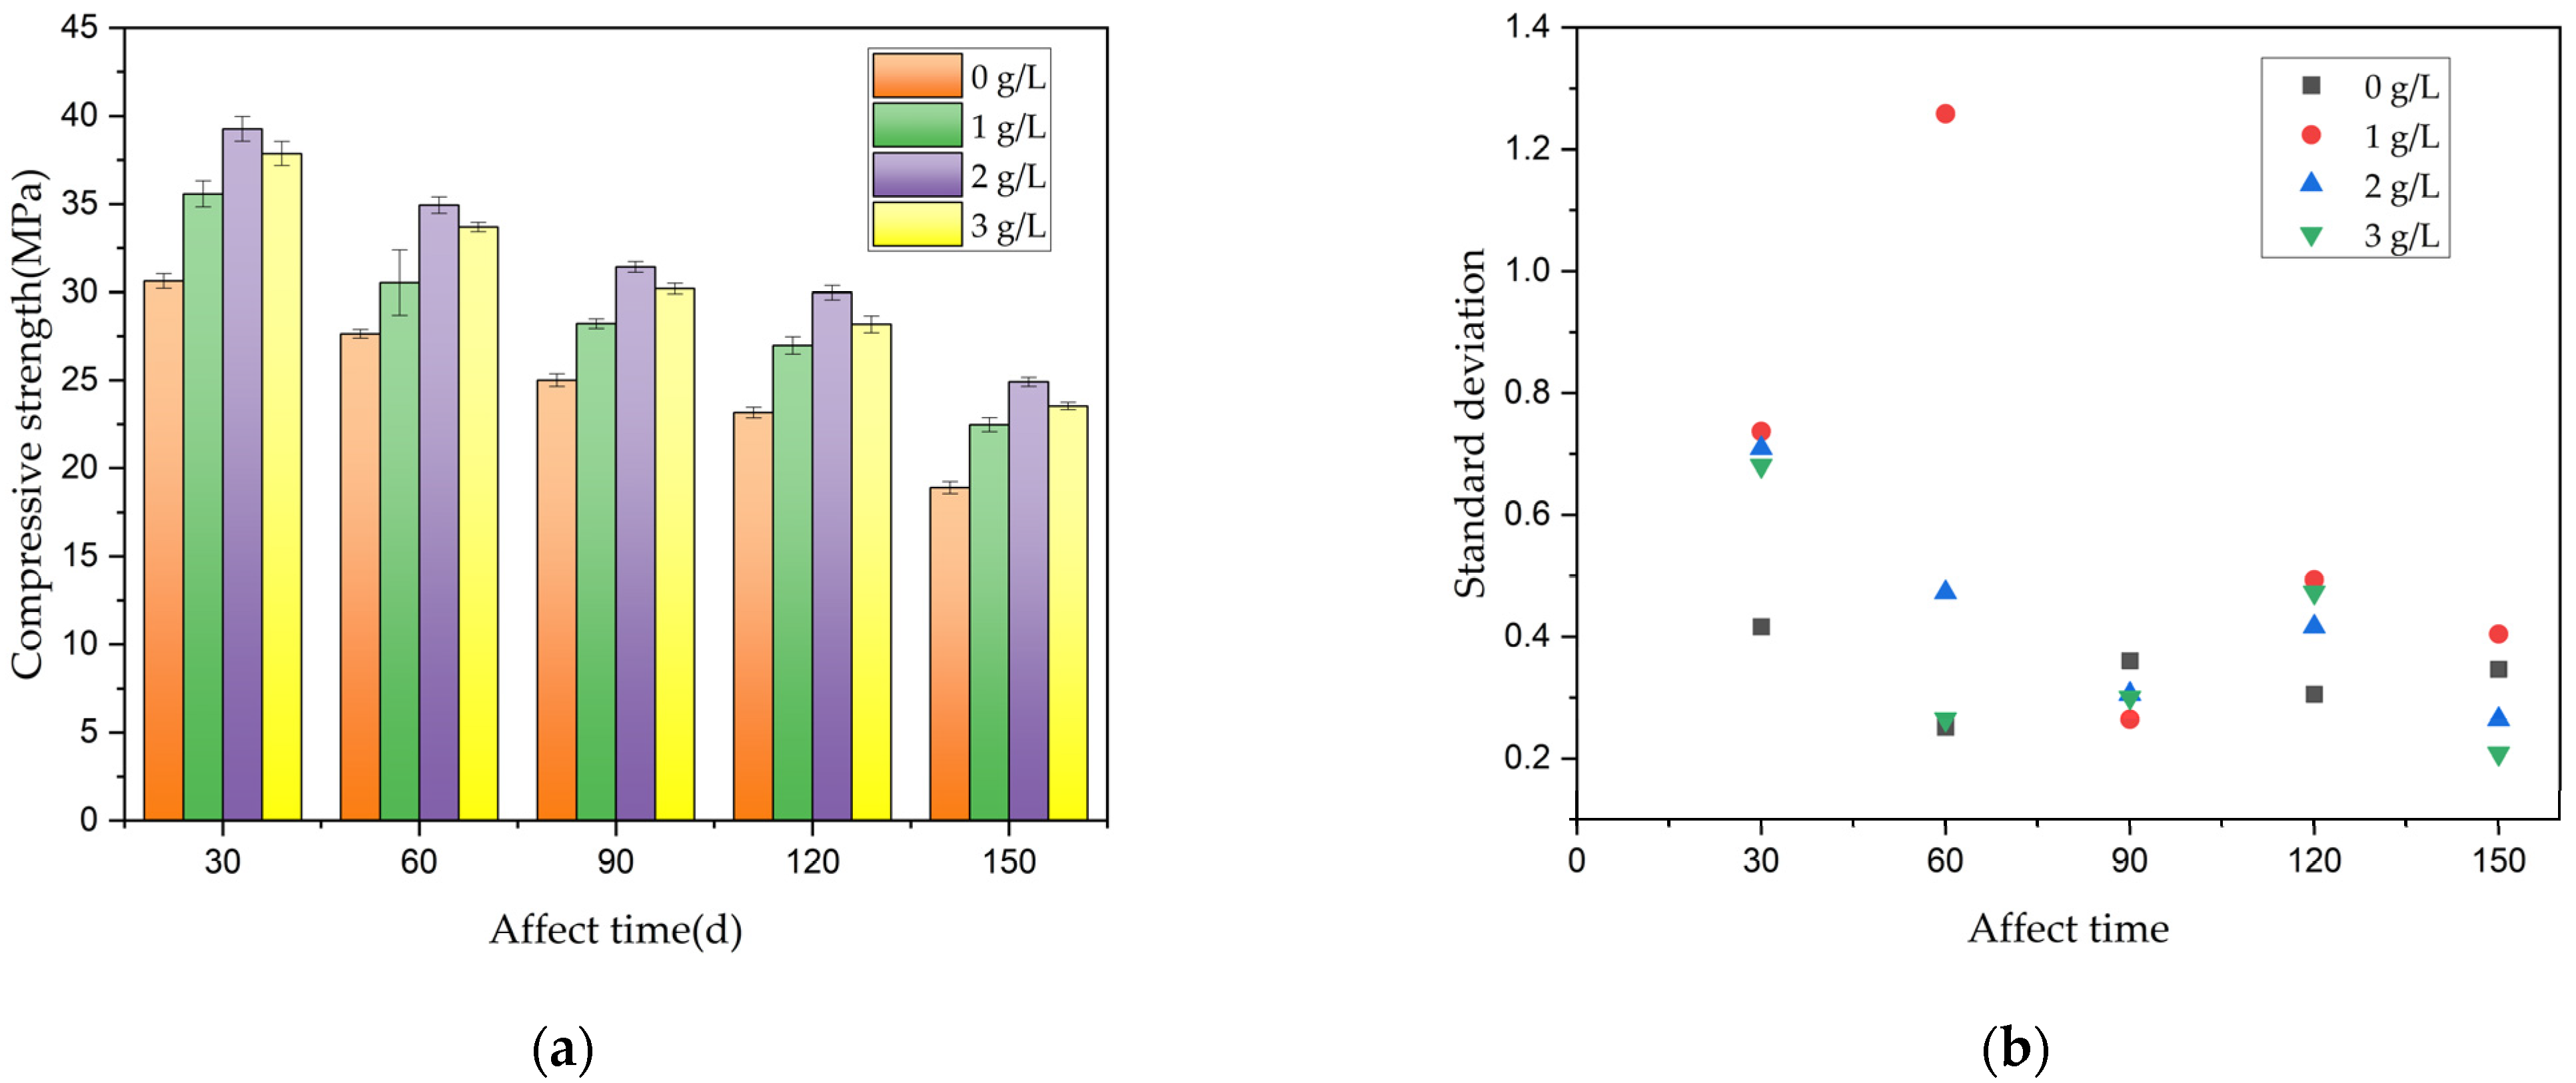
Figure 16a shows the compressive strength of concrete specimens with different dosages of Xanthium sibiricum corrosion inhibitor at various times under the influence of stray currents and chloride salt. Figure 16b displays the standard deviation of the experimental data. The majority of the experimental data show small fluctuations. The stress loading rate during the test was 0.5 MPa/s.
The figure clearly demonstrates that the addition of Xanthium sibiricum extract effectively enhanced the remaining compressive strength of reinforced concrete employed in a brine environment. As the dosage increased, the compressive strength of the reinforced concrete gradually improved, with the best corrosion inhibition effect observed at a dosage of 2 g/L. Over a service period of nearly six months, the strength performance of reinforced concrete has increased by about 31.1% compared to the untreated one. When the dosage exceeded 2 g/L, the strength performance of the reinforced concrete showed a decline, reflecting that excessive addition of the corrosion inhibitor might negatively impact the strength and durability of the concrete structure.
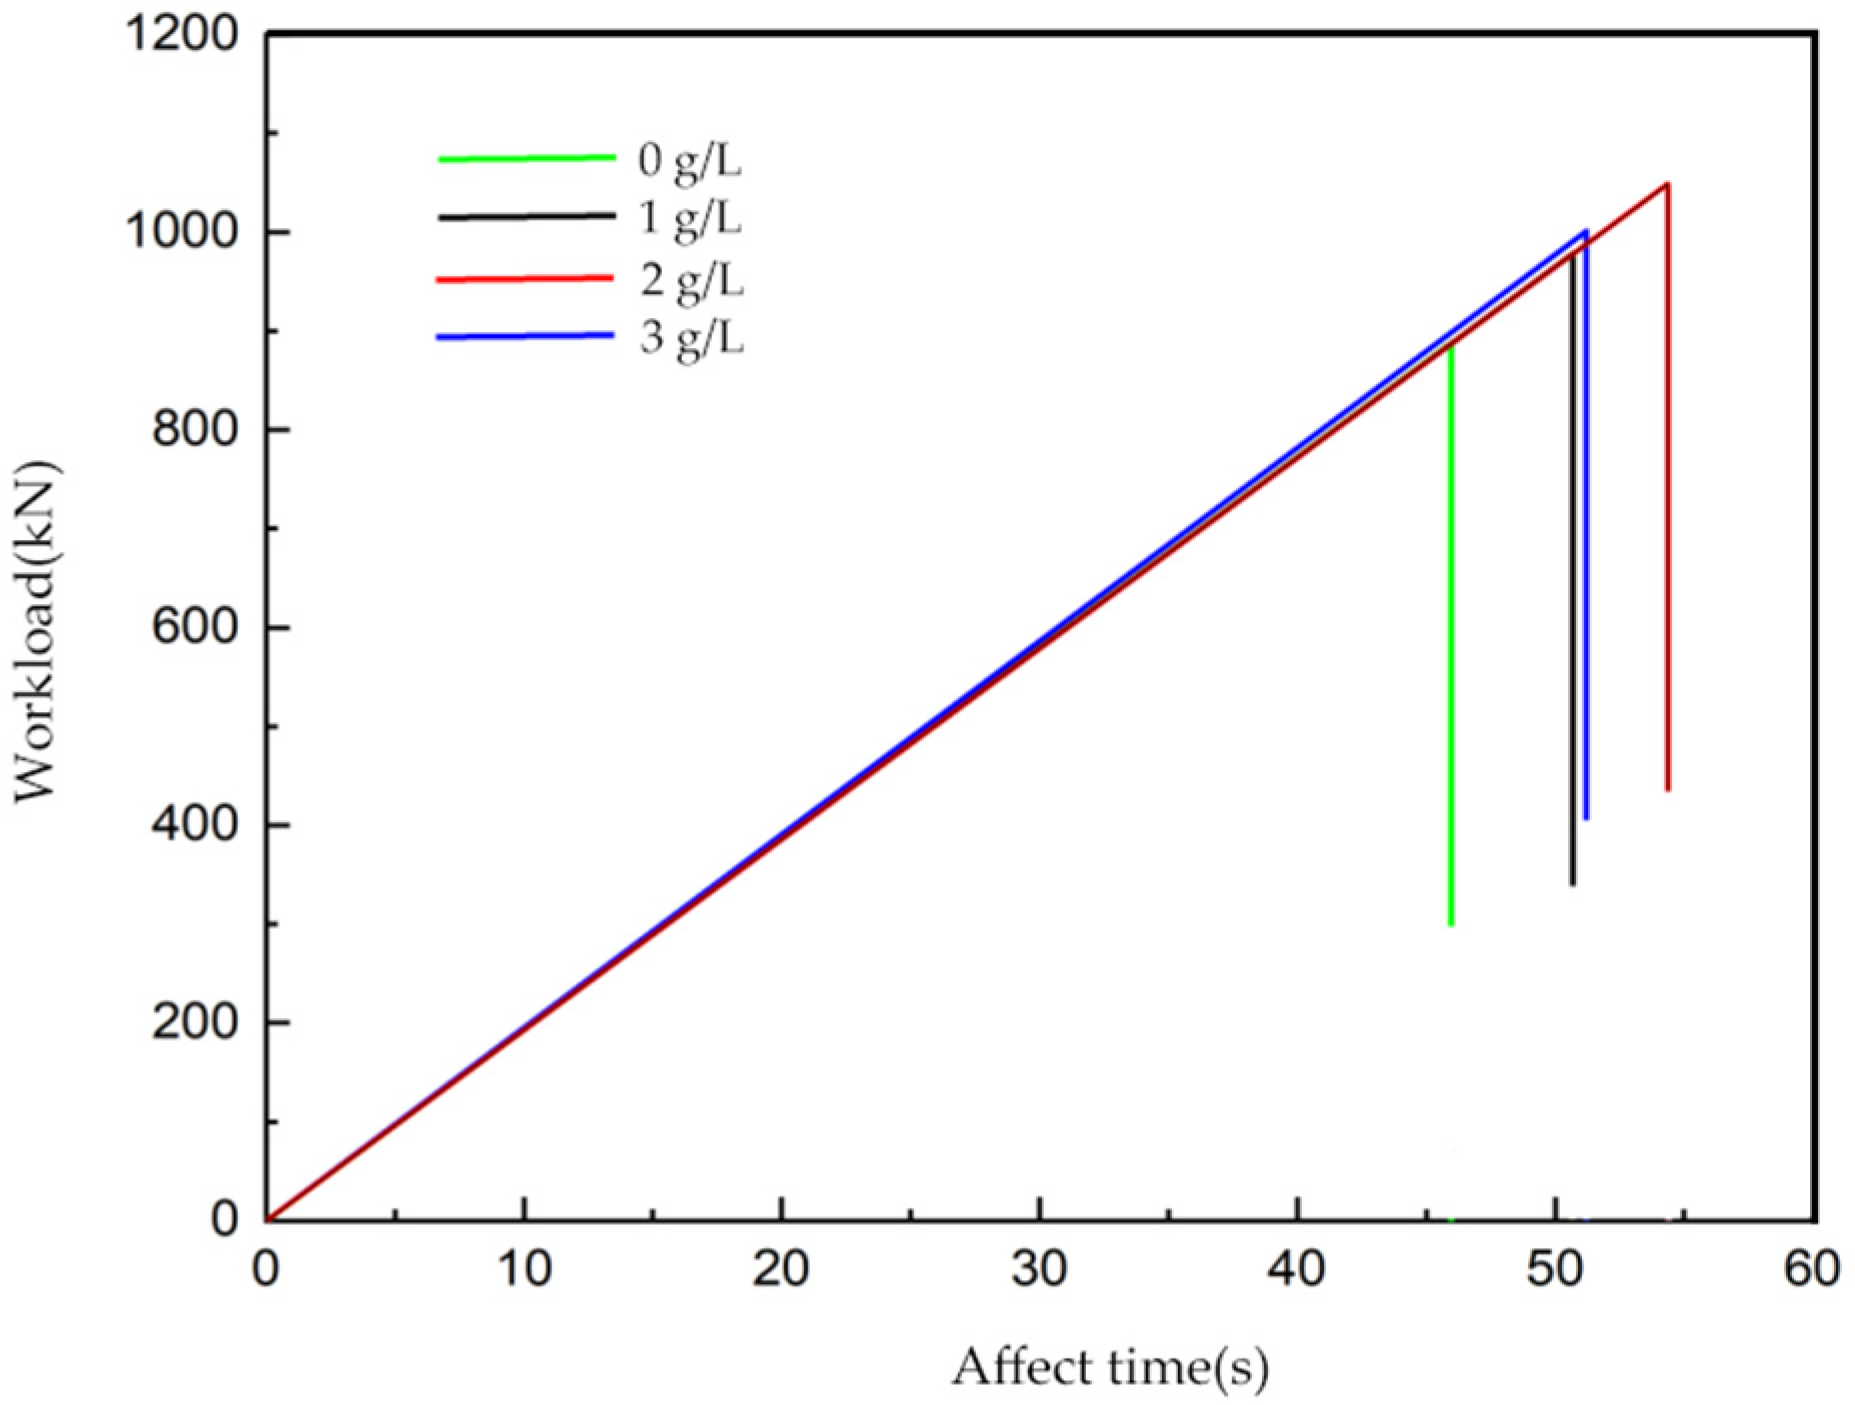
Additionally, as a control group, four separate concrete specimens underwent uniaxial compression tests after reaching the standard curing time of 28 days. The load–time curves drawn from data collected using SuperTest7.2 software are shown in Figure 17. As can be seen from the figure, when the corrosion inhibitor dosage is 2 g/L, the peak load value of reinforced concrete at maturity is the highest, reaching 1048.45 kN, corresponding to a mature uncorroded compressive strength of 43.2 MPa. When the dosages are 0 g/L, 1 g/L, and 3 g/L, the compressive strengths of concrete are, respectively, 38.6 MPa, 41.9 MPa, 42.6 MPa.

3.3.2. Prediction of Remaining Compressive Strength of Reinforced Concrete Containing Corrosion Inhibitor

The remaining compressive strength of reinforced concrete specimens with different corrosion inhibitor dosages under different corrosion times was compared with the uncorroded compressive strength of the control group, as shown in Figure 18.
Combined with the percentage of comparison results in Figure 16, by fitting the quantitative relationship between the compressive strength of uncorroded specimens with added corrosion inhibitor and the dosage, based on Formula (5), we can obtain Formula (6), which predicts the remaining compressive strength of reinforced concrete with the added corrosion inhibitor after corrosion for a certain time under different voltages and chloride ion concentrations:
S t * = 7 × 10 6 ( 0.85 a 2 + 4.3 a + S 0 ) ( 1 0.75 l 0 10 5 ( 10 6 255450 15453 397 10 6 318456 17157 1831 3053.2 610 75.9 6.1 408215 94375 4482 570 2.2 0.4 0.04 0.003 1453.3 325 23.3 1.3 ψ 3 ψ 2 ψ 1 ) T 1 C C l t C C l 2 t 2 C C l t ) 6
where St* is the residual compressive strength of the reinforced concrete after corrosion following the addition of Xanthium sibiricum inhibitor (MPa), a is the dosage of the rust inhibitor (g/L).This formula provides a quantitative solution for similar studies. They can follow this to propose corresponding prediction formulas, which will help with a refined engineering design and the operation and maintenance of concrete structures, showing good application prospects.

4. Conclusions

This study investigated the corrosion of reinforcing steel in chloride-containing concrete under the influence of Xanthium sibiricum using the natural potential method, linear polarization method, steel mass loss method, and corrosion area method. It verified the corrosion inhibition effect of Xanthium sibiricum as an emerging eco-friendly plant-based corrosion inhibitor. The study employed finite element methods to simulate chloride ion transport in concrete under the influence of stray currents and chloride salt, proposing a prediction formula for the remaining compressive strength of reinforced concrete materials after a certain corrosion time under different voltages and chloride ion concentrations. Combined with practical engineering, it quantitatively explored the impact of the Xanthium sibiricum corrosion inhibitor on the mechanical properties of reinforced concrete, provided the optimal dosage for practical applications, and presented a prediction formula for the remaining compressive strength of reinforced concrete containing the inhibitor after a certain corrosion time. The specific conclusions are as follows:
(a)
As a corrosion inhibitor, Xanthium sibiricum can increase the natural potential of reinforcing steel within concrete. It raises the potential from −350 mV (indicating inevitable corrosion) to below −200 mV (indicating resistance to corrosion). It effectively increases the self-corrosion potential of reinforcing steel and reduces the self-corrosion current. The best corrosion inhibition effect is achieved when the mass ratio of Xanthium sibiricum to chloride ions is 3:1. After three months of curing, the corrosion rate of reinforcing steel without the inhibitor is approximately 47.5% faster than the experimental group, with the steel loss rate being about 40% more severe. Additionally, an increased chloride content in concrete affects the efficacy of the corrosion inhibitor.
(b)
As the corrosion time extends, the corrosion depth of reinforced concrete increases linearly while the compressive strength decreases linearly, indicating a negative correlation between corrosion depth and compressive strength. The two-dimensional multiphase ion transport model based on the finite element method can accurately simulate the chloride ion transport process under the coupled effects of stray currents and a brine environment. Based on this, a quantitative relationship between corrosion depth and corrosion time under different voltages and chloride ion concentrations was obtained, leading to the derivation of prediction formula (5) for the remaining compressive strength of reinforced concrete materials after a certain corrosion time under different voltages and chloride ion concentrations.
(c)
Combined with a pumping station project serving in a similar environment, the optimal dosage of the Xanthium sibiricum corrosion inhibitor in practical engineering was determined to be 2 g/L. Under this dosage, the strength of reinforced concrete specimens increased by about 31.1%. Prediction formula (6) was derived for the remaining compressive strength of reinforced concrete after a certain corrosion time under different voltages and chloride ion concentrations, following the addition of the corrosion inhibitor.

Author Contributions

Conceptualization, Q.L., M.Y., J.Z. and S.Q.; methodology, Q.L., M.Y., J.Z. and S.Q.; software, Q.L. and M.Y.; validation, Q.L., M.Y. and J.Z.; formal analysis, Q.L., M.Y. and J.Z.; data curation, Q.L., M.Y. and J.Z.; writing—original draft preparation, Q.L. and M.Y.; writing—review and editing, Q.L., J.Z. and M.Y.; supervision, M.Y. and S.Q.; project administration, M.Y. and S.Q.; funding acquisition, S.Q. All authors have read and agreed to the published version of the manuscript.

Funding

This research was funded by the National Natural Science Foundation of China, grant number 52079049 and the Water Conservancy Science and Technology Plan Project of Zhejiang Province, China, grant number RC2429.

Institutional Review Board Statement

Not applicable.

Informed Consent Statement

Not applicable.

Data Availability Statement

The original contributions presented in the study are included in the article, further inquiries can be directed to the corresponding author.

Acknowledgments

The authors acknowledge the Fundamental Research Funds for the Central Universities.

Conflicts of Interest

The authors declare no conflicts of interest.

References

  1. Yang, L.F.; Hu, C.; Chen, Z. Stochastic and time-dependent diffusion of chloride ion in concrete and its concentration distribution. J. Build. Mater. 2013, 16, 210–216. [Google Scholar]
  2. Liu, Q. Study on Green Corrosion Inhibition of Reinforced Concrete in Pump Stations under Salt Brine Environments. Master’s Thesis, Hohai University, Nanjing, China, 2024. [Google Scholar]
  3. Haiyan, Y.; Cuina, Q.; Lintong, H.; Qing, X. Research on expansion and stability of Friedel’s salt. Ferroelectrics 2022, 596, 39–55. [Google Scholar] [CrossRef]
  4. Zhang, H.; Yan, L.; Zhu, Y.; Ai, F.; Li, H.; Li, Y.; Jiang, Z. The effect of immersion corrosion time on electrochemical corrosion behavior and the corrosion mechanism of EH47 ship steel in seawater. Metals 2021, 11, 1317. [Google Scholar] [CrossRef]
  5. Lin, Y.; Zheng, W.; Liu, S.; Yuan, M.; Qin, X. Multi-ion erosion test and molecular dynamics simulation of carbon nanotube concrete under stray current and salt brine environment. Dev. Built Environ. 2024, 17, 100335. [Google Scholar] [CrossRef]
  6. Marichev, V.A. First experimental evaluation of partial charge transfer during anion adsorption. Colloids Surf. A Physicochem. Eng. Asp. 2009, 348, 28–34. [Google Scholar] [CrossRef]
  7. Salleh, S.Z.; Yusoff, A.H.; Zakaria, S.K.; Taib, M.A.A.; Seman, A.A.; Masri, M.N.; Ter Teo, P. Plant extracts as green corrosion inhibitor for ferrous metal alloys: A review. J. Clean. Prod. 2021, 304, 127030. [Google Scholar] [CrossRef]
  8. Yatmaz, H.A.; Gokoglu, N. Effects of plant extract-sulphide combinations on melanosis inhibition and quality in shrimp (Aristeus antennatus). Int. J. Food Prop. 2016, 19, 359–370. [Google Scholar] [CrossRef]
  9. Li, Y.; Xu, W.; Lai, J.; Qiang, S. Inhibition effect and mechanism explanation of perilla seed extract as a green corrosion inhibitor on Q235 carbon steel. Materials 2022, 15, 5394. [Google Scholar] [CrossRef] [PubMed]
  10. Liu, Q.Y.; Yang, H.R.; Zhou, A.P. Experimental analysis of the rust inhibition performance of Spartina alterniflora extracts. Shandong Water Resour. 2019, 3, 20–21. (In Chinese) [Google Scholar]
  11. Bui, H.T.; Dang, T.D.; Le, H.T.; Hoang, T.T. Comparative study on corrosion inhibition of vietnam orange peel essential oil with urotropine and insight of corrosion inhibition mechanism for mild steel in hydrochloric solution. J. Electrochem. Sci. Technol. 2019, 10, 69–81. [Google Scholar]
  12. Pradipta, I.; Kong, D.; Tan, J.B.L. Natural organic antioxidants from green tea inhibit corrosion of steel reinforcing bars embedded in mortar. Constr. Build. Mater. 2019, 227, 117058. [Google Scholar] [CrossRef]
  13. Shen, D. Electrochemical impedance spectroscopy study on corrosion inhibitor for reinforced concrete. Int. J. Electrochem. Sci. 2017, 12, 4183–4192. [Google Scholar] [CrossRef]
  14. Bo, X.; Yan, Y.; Xu, T.; Zhong, A.J.; Wu, Z.J. A Comparative Study on the Chemical Composition Changes and Antioxidant Activity of Xanthium sibiricum after Stir-frying to a Yellow Color. Ginseng Res. 2024, 3, 46–48. [Google Scholar]
  15. Tsukahara, E. Estimation Method of Corroded Portion of Reinforcing Steel Bar by Natural Potential Measurement. Non-Destr. Test. Civ. Eng. 2000, 261, 671–678. [Google Scholar]
  16. Tada, Y.; Miura, T.; Nakamura, H. Detection method of corrosion area of rebar and corrosion induced internal crack by using electromagnetic wave radar. In Bridge Maintenance, Safety, Management, Life-Cycle Sustainability and Innovations; CRC Press: Boca Raton, FL, USA, 2021; pp. 1672–1679. [Google Scholar]
  17. Law, D.W.; Cairns, J.; Millard, S.G.; Bungey, J.H. Measurement of loss of steel from reinforcing bars in concrete using linear polarisation resistance measurements. Ndt E Int. 2004, 37, 381–388. [Google Scholar] [CrossRef]
  18. Zhao, Y.-N.; Zhu, Y.-L. Evaluation of inhibitors in an artificially synthesized oilfield production water. Corros. Sci. Protetion Technol. 2009, 20, 298–300. [Google Scholar]
  19. JGJ/T 192-2009; Technical Specifications for the Application of Reinforcement Corrosion Inhibitors. China Architecture and Building Press: Beijing, China, 2009. (In Chinese)
  20. Yang, P.; Sant, G.; Neithalath, N. A refined, self-consistent Poisson-Nernst-Planck (PNP) model for electrically induced transport of multiple ionic species through concrete. Cem. Concr. Compos. 2017, 82, 80–94. [Google Scholar] [CrossRef]
  21. Li, Y.; Xu, W.; Li, H.; Lai, J.; Qiang, S.; Luo, T. Multi-ion erosion experiment and corrosion mechanism verification of steel fiber–reinforced concrete under stray current. J. Mater. Civ. Eng. 2022, 34, 04022355. [Google Scholar] [CrossRef]
  22. Li, X. Study on Bending Performance of Reinforced Concrete Beams Damaged by HDC Reinforcement under Sulfate Environment. Master’s Thesis, Xi’an University of Technology, Xi’an, China, 2023. [Google Scholar]
  23. Huang, J.Y.; Hu, X.D.; Hong, D.H.; Li, Z.Q.; Liu, N. Effect of Electrochemical Injection of Corrosion Inhibitor into Rebar Deteriorated by Chlorides in Concrete. J. Build. Mater. 2011, 4, 546–549. [Google Scholar]
  24. Yang, J.Y.; Xia, B.H.; Li, R.J.; Yang, W.J.; Jiang, W.L. Experimental Study on Degradation of Compressive Strength of Concrete under Steel Corrosion Expansion. Chongqing Archit. 2022, 10, 38–41. [Google Scholar]
  25. Farahmand, R.; Sohrabi, B.; Ghaffarinejad, A.; Meymian, M.R.Z. Synergistic effect of molybdenum coating and SDS surfactant on corrosion inhibition of mild steel in presence of 3.5% NaCl. Corros. Sci. 2018, 136, 393–401. [Google Scholar] [CrossRef]
  26. Fei, F.L.; Hu, J.; Yu, Q.J.; Wei, J.X.; Nong, Y.B. The effect of a tailored electro-migrating corrosion inhibitor on the corrosion performance of chloride-contaminated reinforced concrete. Mater. Corros. 2015, 66, 1039–1050. [Google Scholar] [CrossRef]
  27. Cai, J.; Zhu, L.; Wei, Q.; Huang, D.; Luo, M.; Tang, X. Drying Kinetics of a Single Biomass Particle Using Fick’s Second Law of Diffusion. Processes 2023, 11, 984. [Google Scholar] [CrossRef]
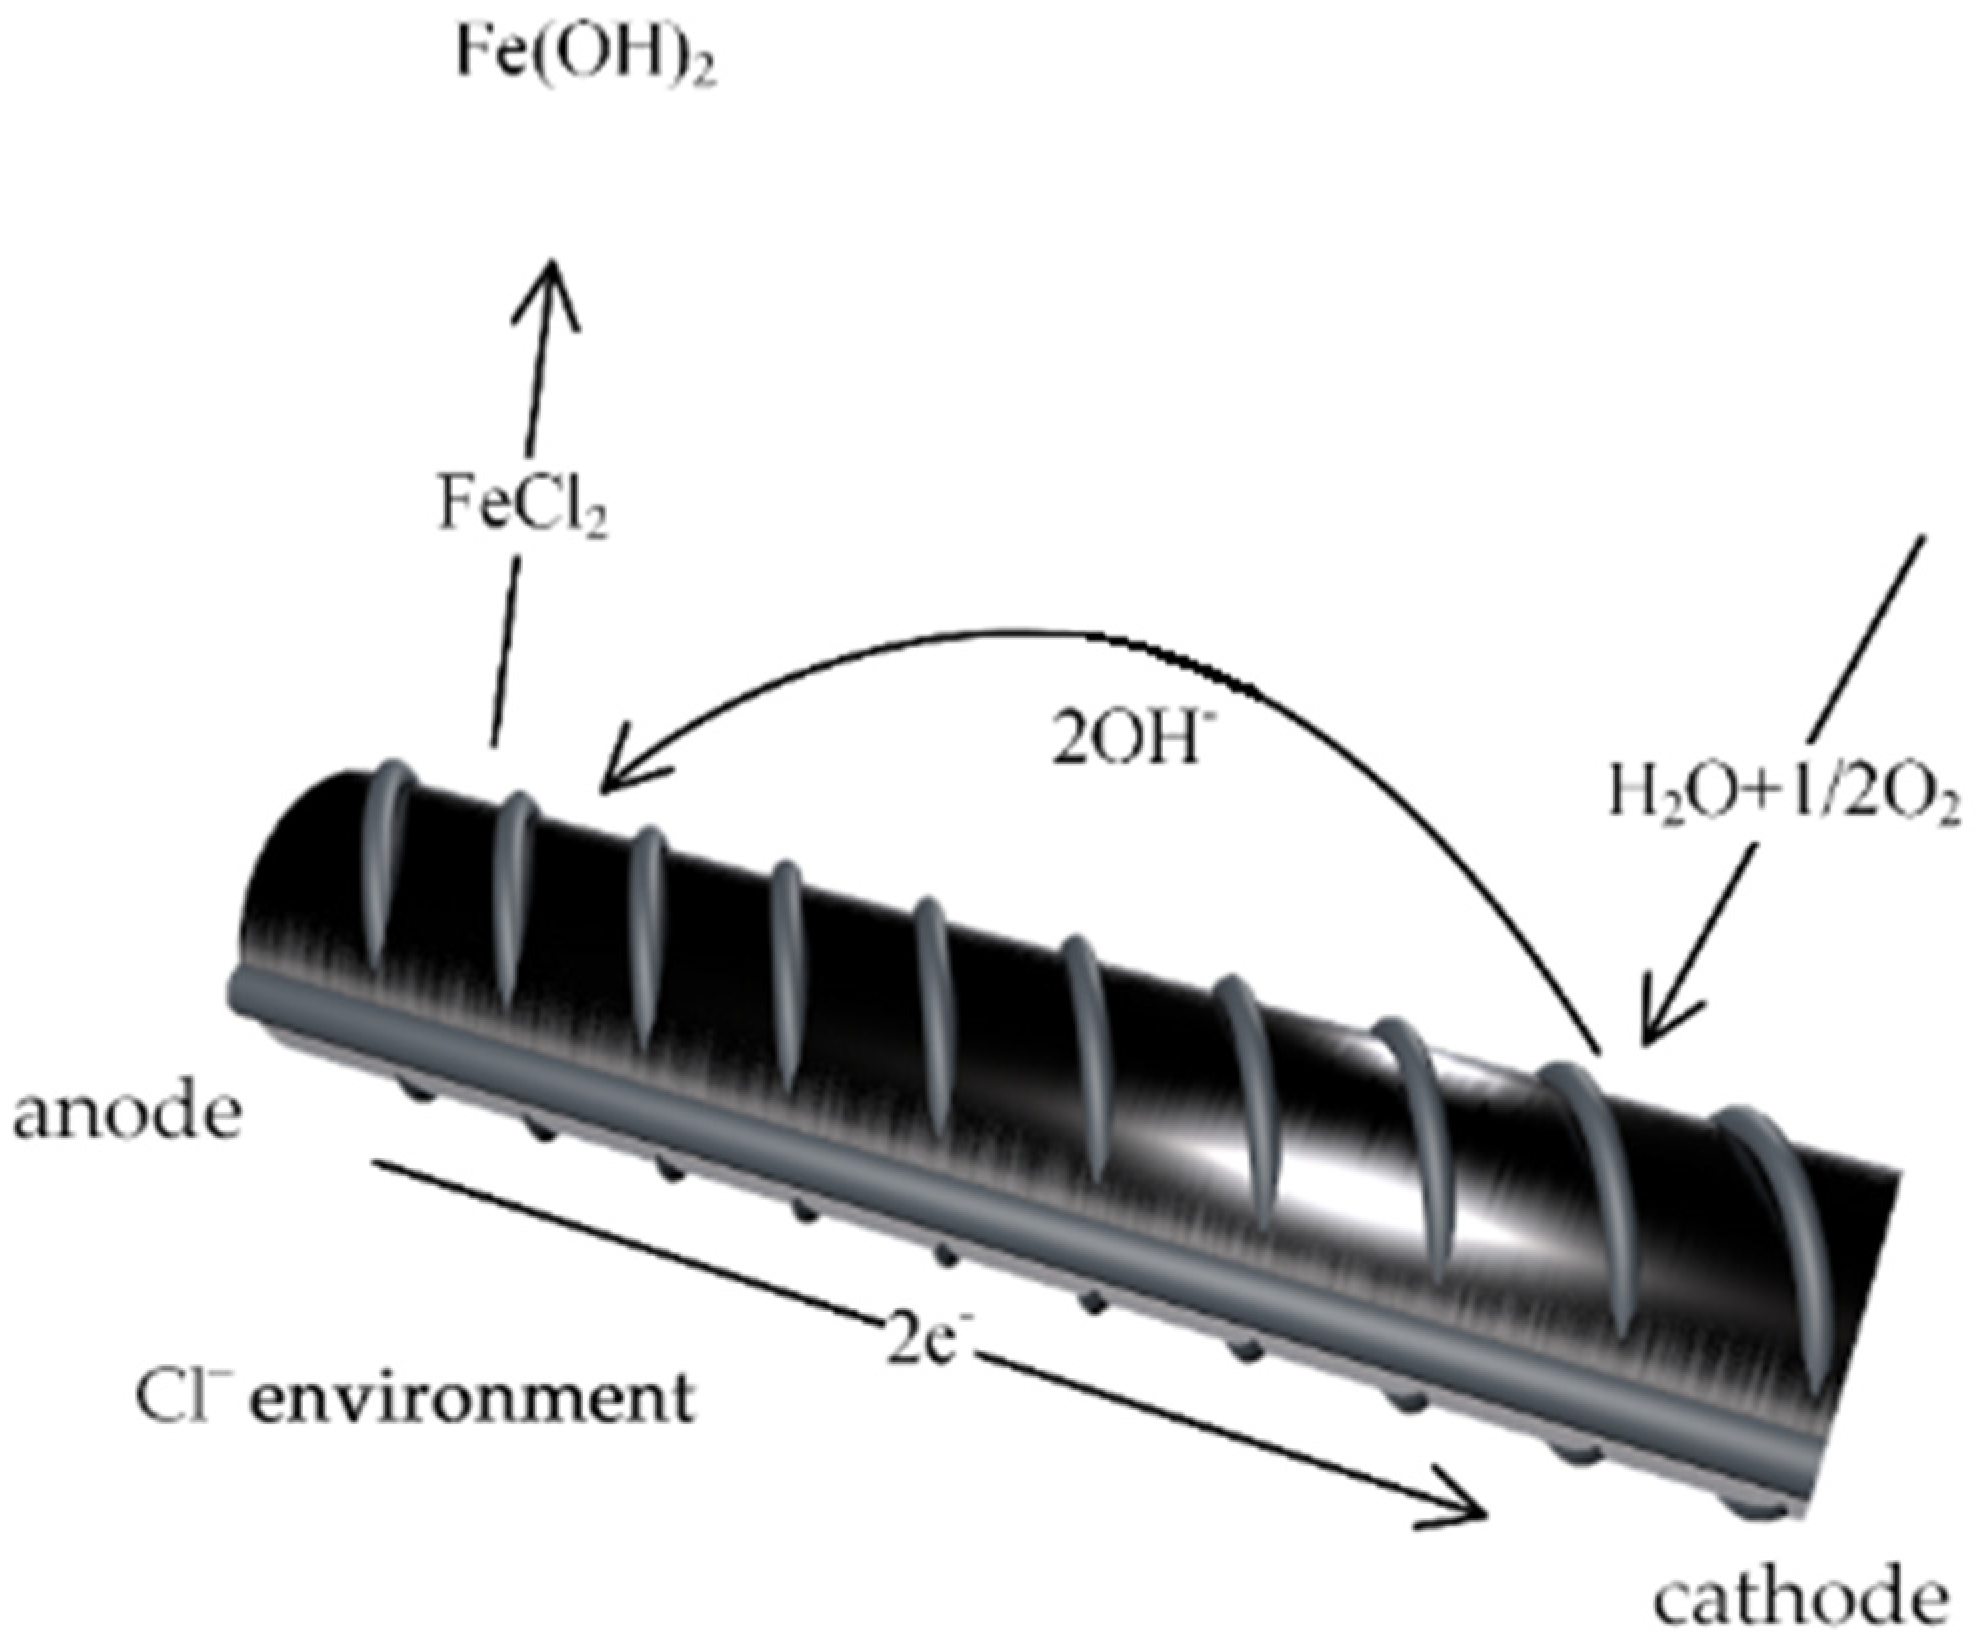
Figure 1. Chloride ion erosion on steel bars.
Applsci 14 06986 g001
Figure 2. Reinforced concrete specimen.
Applsci 14 06986 g002
Figure 3. Draw the corroded part of the steel bars.
Applsci 14 06986 g003
Figure 4. Linear polarization method electrode system.
Applsci 14 06986 g004
Figure 5. Finite element model.
Applsci 14 06986 g005
Figure 6. Specimen compression.
Applsci 14 06986 g006
Figure 7. Concrete specimens to be cured.
Applsci 14 06986 g007
Figure 8. Changes in natural potential of steel bars when inhibitor is added: (a) specimens with a chloride ion content of 0.5%; (b) specimens with a chloride ion content of 1%.
Applsci 14 06986 g008
Figure 9. Reinforcement under the effect of the inhibitor: (a) corrosion area rate of steel bars; (b) steel bar weight loss rate.
Applsci 14 06986 g009
Figure 10. Tafel curve of steel bars when inhibitor is added.
Applsci 14 06986 g010
Figure 11. Chloride ion corrosion cloud diagrams.
Applsci 14 06986 g011
Figure 12. Comparison between simulated and experimental values of chloride ion corrosion depth.
Applsci 14 06986 g012
Figure 13. Surface fitting of corrosion depth of chloride ions over time at different chloride ion concentrations.
Applsci 14 06986 g013
Figure 14. Fitting curve of the relationship between reinforcement concrete corrosion depth and compressive strength.
Applsci 14 06986 g014
Figure 15. Samples fractured during the experiment.
Applsci 14 06986 g015
Figure 16. Uniaxial compressive test data: (a) compressive strength at different corrosion times under different concentrations of inhibitor dosage; (b) standard deviation.
Applsci 14 06986 g016
Figure 17. Concrete compressive strength at maturity without corrosion.
Applsci 14 06986 g017
Figure 18. Comparison of compressive strength of reinforced concrete before and after corrosion.
Applsci 14 06986 g018
Table 1. Concrete mix proportion (unit: kg/m3).
CementSandStoneWaterAdmixturesSand Ratio (%)Slump (cm)Gas Content (%)
30076711901299133164
Table 2. The dosage of rust inhibitor in concrete specimens.
Control GroupExperimental Group
Group NameCl (%)Inhibitor (%)Group NameCl (%)Inhibitor (%)
D-10.50Sa-10.50.5
D-21.00Sa-20.51.0
Sa-30.51.5
Sb-11.01.0
Sb-21.02.0
Sb-31.03.0
Table 3. Evaluation indicators for corrosion of steel bars.
Potential Measurement Value (mV)Corrosion Possibility
E > −200corrosion possibility is lower than 10%
−200 > E > −350uncertain
E < −350corrosion possibility is higher than 90%
Table 4. Characteristic values of corrosion rate of steel bars.
Polarization Resistance (Ω·cm2)Corrosion Current Density (μA/cm2)Steel Bar Loss Rate (mm/year)Corrosion Rate
0.25~2.5100~100.1~1very high
2.5~2510~10.01~0.1high
25~2501~0.10.001~0.01medium
>250<0.1<0.001hard to erode
Table 5. Calculation parameters.
Material Porosity   ( φ ) Tortuosity   ( τ ) Correction   Factor   ( β ) Diffusion Coefficient (DClα·m2/s)Chloride Ion Boundary Concentration (C0,Cl·mol/m3)
cement mortar0.098.601.33 1.22 × 10 12 1.71 × 10 3
aggregate0.0116.101.33 1.96 × 10 14
Table 6. Fitting results of Tafel curve extrapolation method.
Group NameCorrosion Current Density (μA/cm2)Corrosion Potential (V)βa (mV)βc (mV)Corrosion Rate (g/(m2·h))Steel Bar Loss Rate (mm/Year)
D-11.49−0.782284.76−34.151.18 × 10−21.33 × 10⁻²
Sa-10.91−0.749200.88−38.510.95 × 10−20.97 × 10⁻²
Sa-20.80−0.725239.57−35.820.84 × 10−20.96 × 10⁻²
Sa-30.56−0.721214.76−40.700.80 × 10−20.95 × 10⁻²
Disclaimer/Publisher’s Note: The statements, opinions and data contained in all publications are solely those of the individual author(s) and contributor(s) and not of MDPI and/or the editor(s). MDPI and/or the editor(s) disclaim responsibility for any injury to people or property resulting from any ideas, methods, instructions or products referred to in the content.