Article

Experiment on the Tensile Strength of Concrete Joint Surface at Early Ages

1
College of Water Conservancy and Hydropower Engineering, Hohai University, Nanjing 210003, China
2
Changjiang River Scientific Research Institute, Wuhan 430010, China
3
Huai’an Water Conservancy Survey & Design Inst Co., Ltd., Shenzhen Rd., Huai’an 223005, China
*
Author to whom correspondence should be addressed.
Appl. Sci. 2024, 14(16), 6968; https://doi.org/10.3390/app14166968
Submission received: 5 July 2024 / Revised: 2 August 2024 / Accepted: 5 August 2024 / Published: 8 August 2024
(This article belongs to the Special Issue Durability and Intelligent Evaluation of Concrete Structures)

Abstract

:

Featured Application

The results can be used to more accurately model the mechanical properties of concrete bond surfaces during simulation.

Abstract

Concrete is widely used in large-scale hydraulic structures, which often need to undergo multiple pouring operations due to construction demands, temperature-induced shrinkage phenomena, and structural reinforcement and repair, which in turn creates the bonding surface of old and new concrete. Therefore, it is of great significance to study the strength of the bond between old and new concrete. We designed and completed a split tension test to investigate the evolution of the tensile strength of concrete joint surfaces with age at early ages. The test groups included three sets of matured concrete aged 3 days, 5 days, and 10 days, respectively. Within each group, multiple test specimens were prepared with different ages of the interface, ranging from 1 day to 15 days. The test utilized ready-mixed concrete materials from a commercial batching plant. To ensure uniform and standard roughness of the interface between new and matured concrete, a method employing non-destructive surface roughening tapes was employed. During the test, each specimen was subjected to tensile failure at its corresponding age. The maximum load applied by the testing machine at the point of tensile failure was recorded for each age group. Based on the fundamental principles of material mechanics and relevant formulas, the tensile strength of the interface at different ages was determined for each test group. The obtained data were then used to fit a curve representing the relationship between the early-age tensile strength of concrete and its age, using MATLAB R2020b software. The results show that there is a small increase in the tensile strength of the bonding surface as the age of the old test blocks is increased. This experiment revealed the changing pattern of early-age tensile strength of concrete at the interface with age, providing a basis for accurately simulating the mechanical properties of the interface during numerical simulations. Then, based on the existing temperature-controlled simulation program, a simplified simulation and calculation method of concrete cracking is proposed to make it possible to determine the tensile cracking (vertical cracking) when the stress exceeds the standard. The validity is verified by simulation calculations of a simplified model, using the tensile strength curves obtained from the tests.

1. Introduction

Concrete is widely used in large-scale hydraulic structures. During the design and construction process, due to construction requirements, temperature-induced shrinkage, structural reinforcement, and repairs, concrete structures often undergo multiple pouring operations. Concrete structures are often exposed to a variety of stresses, such as tension, compression, shear, torsion, etc., in the process of load bearing. Among them, problems such as air bubbles within the post-cast concrete may lead to a weak bond between the old and new concrete interfaces; coupled with the difference between the shrinkage characteristics of the newly poured part and the mature concrete, the strength of the two bonding surfaces is thus weakened, making it easy for cracks to be formed, and thus becoming a weak point in the overall structure. Therefore, it is of great significance to study the strength of the interface between new and old concrete. Currently, the investigation into the bonding strength between new and old concrete interfaces is primarily conducted through experimental research and analysis [1,2,3,4]. The bond strength tests are categorized into the following three types according to the stress state generated in the bond surface: tensile, shear, and (tensile) compressive shear tests. Momayez et al. [5,6] conducted bond strength tests on 164 specimens using each of the three types of test methods above. After analyzing the test results, it was found that the results of the bond strength test on the bonding surfaces were significantly affected by the type of test. In the order of oblique shear test, double-sided shear or pure shear test, split test, and pull-off test, the bond strength decreases sequentially with the test methods.
Increasing the roughness of the bonding interface can significantly improve the bonding properties of old and new concrete [7,8,9,10,11] and enhance the strength of the concrete bonding interface. For example, applying surface treatment methods to the existing base concrete layer before adding a new concrete layer can be effective. Typical surface treatment methods include using a wire brush [12], sandblasting [13,14,15], water spraying [16], manual chiseling [17], and grooving [18,19]. In some cases, different types of adhesives can be added to the base layer to enhance bonding strength. Additionally, the research on aging mainly focuses on the following two aspects: first, altering the age of the old concrete substrate, and second, changing the age of the new and old concrete specimens after the pouring is completed. Based on the consideration of roughness factors, Bai Haiyan et al. [20] designed an experiment using the chiseling method. The test results showed that increasing the roughness of the interface between new and old concrete can significantly improve the bond strength. Bentz’s research team [21] chose to chisel the surface of the old concrete two weeks after pouring, and then pour the repair material. Tensile strength measurements were conducted on the samples on the 2nd, 7th, 14th, and 28th days after pouring. The experimental results indicated that the test age had a certain impact on the tensile strength; as the age increased, the tensile strength of the interface between the new and old concrete slightly increased.
In summary, the study of the tensile strength of the bond surface of old and new concrete plays an important role in guiding the correct modeling of the mechanical properties of the joint surface during simulation calculations. In this paper, in order to investigate the tensile strength of a concrete joint surface at an early age, the split tension test method is adopted, and the innovative use of no-chiseling stopping tape to produce a uniform rough surface of concrete and expand the cross-section area of concrete specimen blocks is used to enhance the accuracy of the test results. Finally, the development curves of the tensile strength of the early-age seam surface of concrete under different age conditions were obtained.

2. Materials and Methods

The splitting tensile test [22] aims to simulate the variation process of tensile stress (MPa) at the interface between new and old concrete over time (d). The experimental design considers three scenarios with intervals of 3 days, 5 days, and 10 days between the pouring of new and old concrete. The test procedure involves initially pouring the concrete specimens on both sides, followed by pouring the new concrete specimen in the middle, at intervals of 3 days (or 5 days, or 10 days). For each test group, splitting tensile tests were conducted when the middle concrete specimen reached the ages of 1 day, 3 days, 5 days, 7 days, and 15 days. The entire experiment was divided into three groups, each with five subgroups of concrete specimens at different ages. In total, 15 rectangular molds of 150 mm × 150 mm × 550 mm and 30 cubic molds were used.
To ensure the accuracy of the experimental results, it is necessary to strictly control the concrete pouring times. This study uses C30 grade concrete mixed with a mixer as the test material, as this concrete meets the required strength standards for this experiment. By conducting splitting tensile tests on concrete specimens of different ages, this research aims to systematically obtain data on the tensile stress at the interface between new and old concrete over time. The goal is to deeply explore the intrinsic relationship between the interface performance and its age.

2.1. Preparation of Concrete Specimens

To ensure the experimental results align with practical engineering conditions, this experiment plans to implement roughening treatment on the interface between new and old concrete. However, considering the small volume and limited contact area of the specimens, using traditional manual roughening methods may not guarantee uniform treatment, potentially leading to variations in experimental conditions among different specimens. Therefore, this experiment decided to use a non-roughening stop-grout tape (Figure 1) to simulate the roughened interface of the concrete specimens, ensuring consistency and controllability of the experimental conditions.
Using a non-roughening stop-grout tape not only simplifies the experimental operation process and ensures precise controllability of the treatment effect but, more importantly, it can more realistically and accurately simulate the roughening process of concrete interfaces in actual engineering. In real-world engineering scenarios, the roughening of concrete interfaces is a critical procedure aimed at increasing the roughness of the interface. This promotes effective bonding and stress transfer between new and old concrete, thereby enhancing the overall performance and durability of the structure.
First, precisely cut the non-roughening stop-grout tape into 150 mm × 150 mm square pieces according to the required specifications. Then, place the cut slurry belt pieces onto one side of the 150 mm × 150 mm square molds, ensuring that they are tightly fitted against the inner walls of the molds with no gaps, to simulate the roughening treatment effect of the concrete interface in actual engineering.
Next, conduct a one-time batch casting operation to prepare 30 concrete cubes, each with dimensions of 150 mm × 150 mm × 150 mm. After the casting is complete, follow the concrete curing standards and let the blocks sit undisturbed for 24 h before demolding. Upon demolding, the roughened surfaces formed by the stop-grout tape on the sides of the blocks are clearly visible, closely resembling the appearance and texture of roughened concrete interfaces in actual engineering projects. The roughened surfaces created with the stop-grout tape are shown in Figure 2.

2.2. Concrete Mix Ratio

The materials used are as follows: the cement is P.042.5 from Ningbo Yongshun Building Material Technology Co., Ltd. (Ningbo, China), the mineral powder is S95 from Ningbo Henglong New Material Co., Ltd. (Ningbo, China), the fly ash is Grade II from Yuyao Rongsen Building Material Trading Co., Ltd. (Ningbo, China), the expansion agent is SY-K from Wuhan Sanyuan Special Building Material Co., Ltd. (Wuhan, China), and the admixture is polycarboxylic acid from Hangzhou Longhui New Building Material Co. (Hangzhou, China).
The concrete mix ratio is shown in Table 1.

2.3. Preparation Process

(1)
Weighing Materials: According to the proportions listed in Table 1, accurately measure and prepare sufficient quantities of each component raw material. Subsequently, sequentially add these raw materials into the mixer as per the specified order. Throughout the process, strict measures must be taken to prevent any foreign impurities from contaminating the mixture, ensuring the purity of the concrete mix, and the accuracy of the test data.
(2)
Dry Mixing Stage: Start the mixer and ensure it operates smoothly. Begin with a period of dry mixing, where cement and aggregates are blended into a uniform mixture.
(3)
Wet Mixing Stage: Add the pre-measured water and admixtures, and the concrete enters the wet mixing stage. During this phase, the cement and water are thoroughly combined to form a uniform slurry mixture. (Each mixing cycle lasts 60 s, and three cycles are required).
(4)
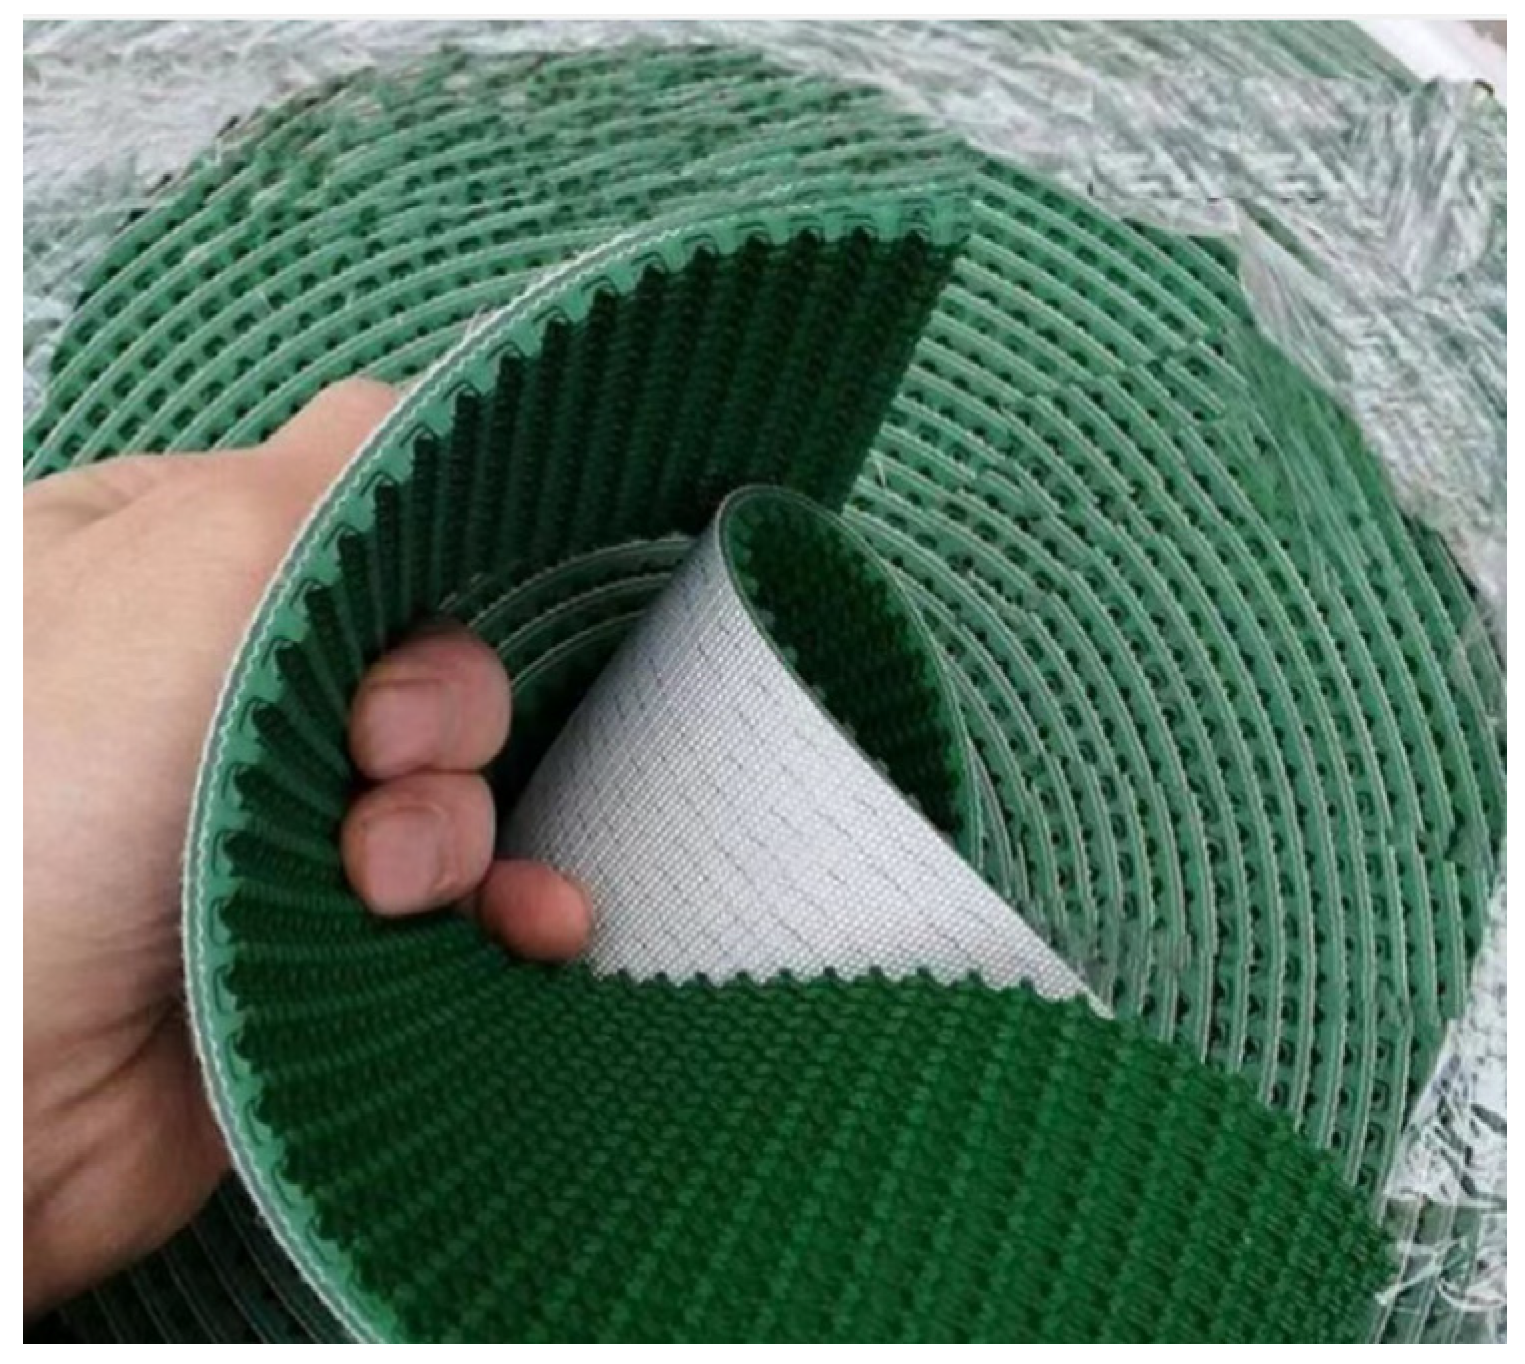
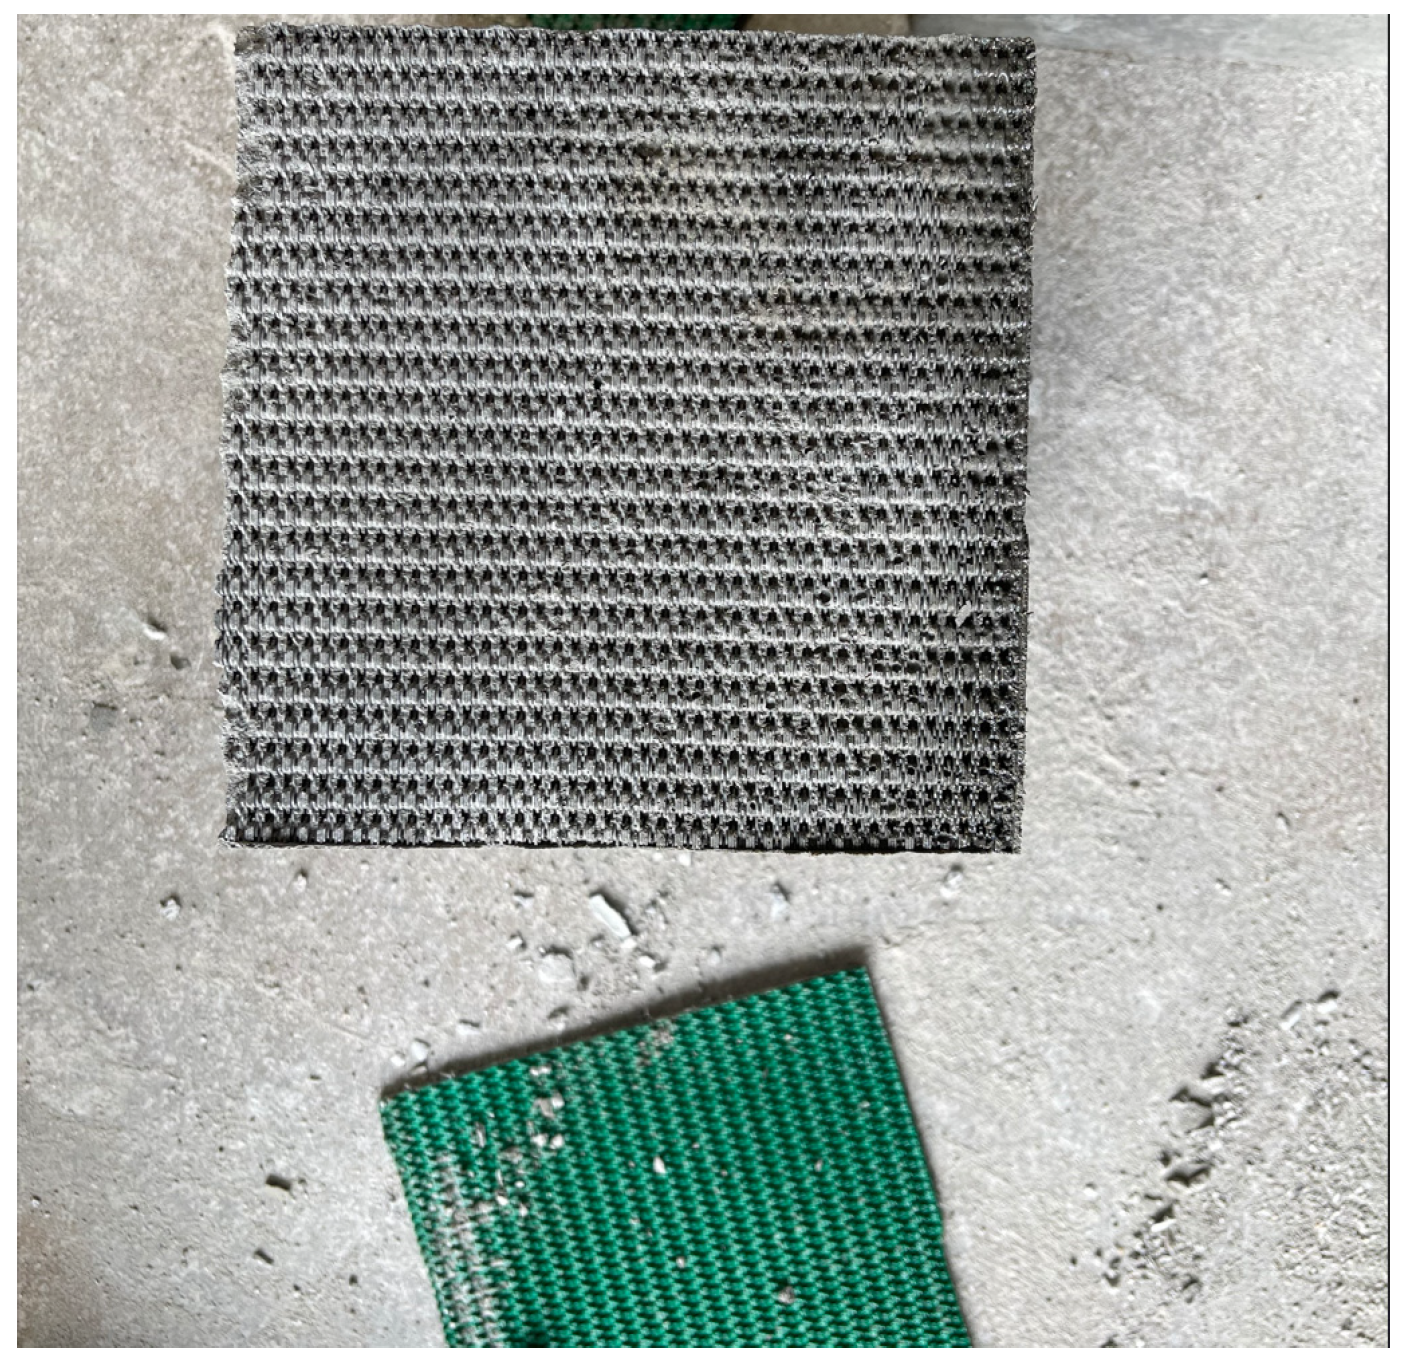
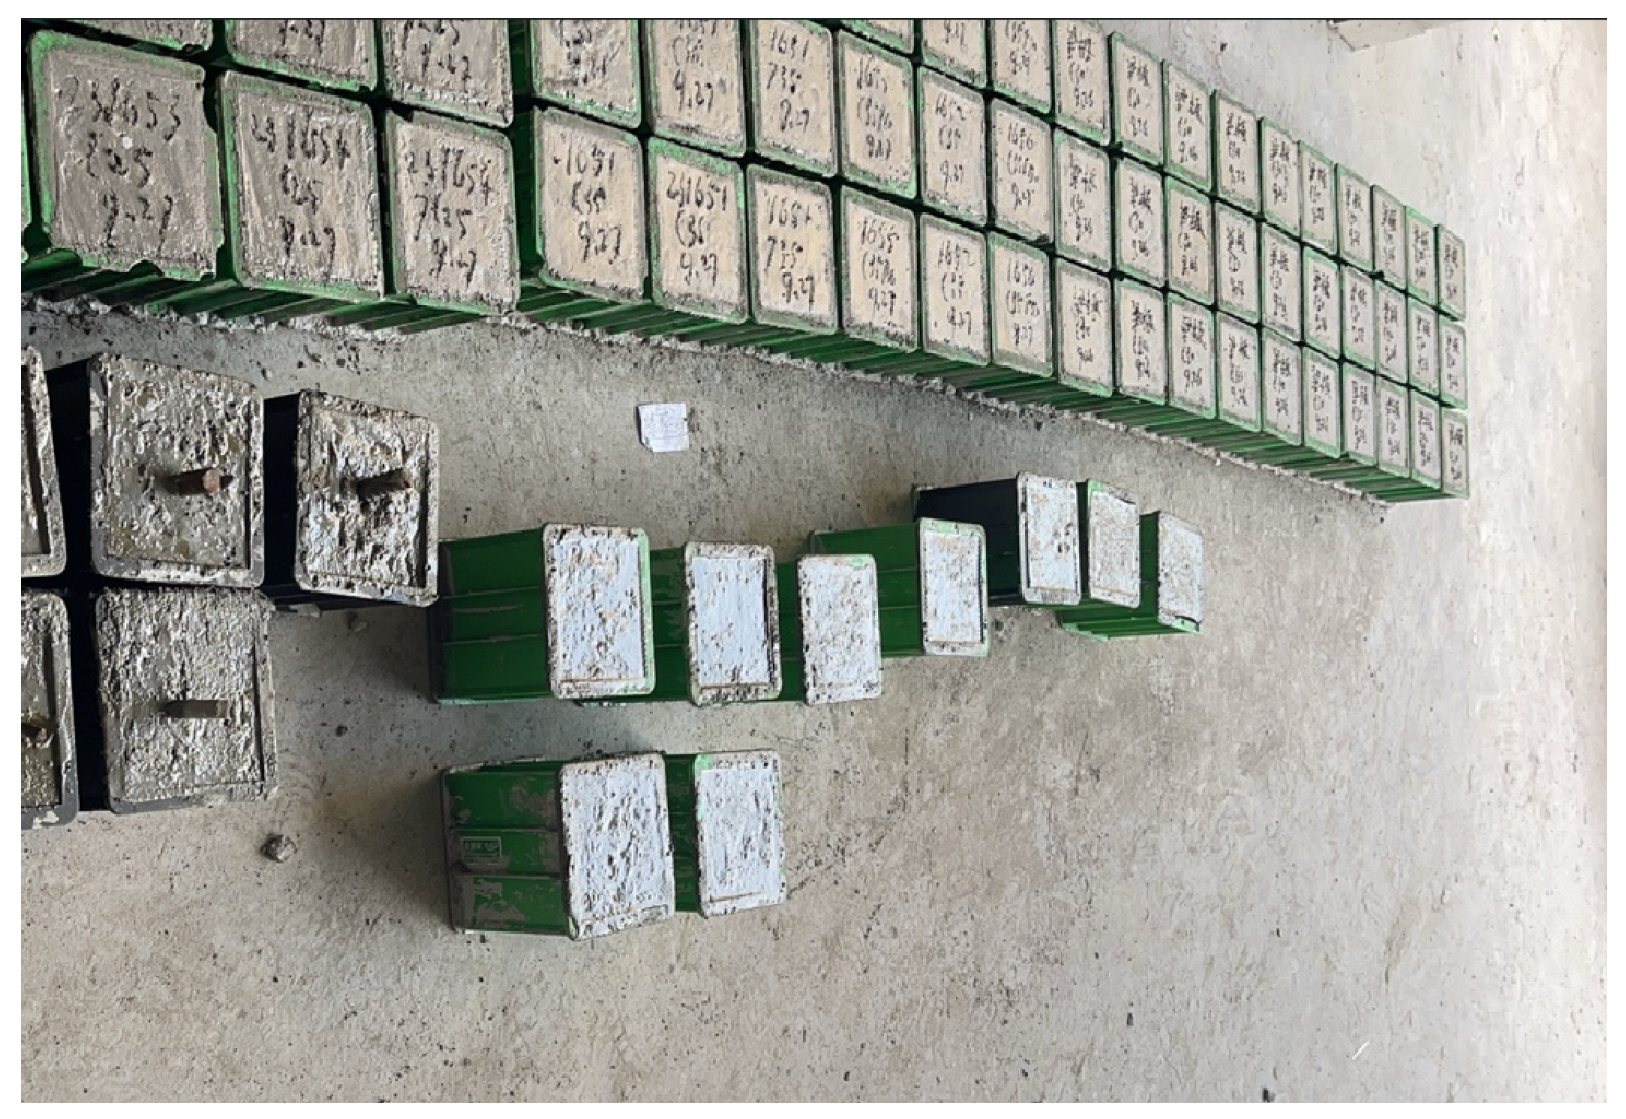
Pouring the Test Blocks: After the mixing process is completed, pour the uniformly mixed concrete onto a flat surface. Then, evenly apply a layer of machine oil to the bottom and sides of the 150 mm × 150 mm × 150 mm cubic molds. However, ensure that the side where the grout stopping tape is placed is not oiled, as this facilitates the formation of a good bond at the joint surface. Use a shovel to fill the molds with concrete, ensuring the material is evenly distributed. Next, use a vibrating device to thoroughly vibrate the concrete in the molds. This helps the concrete flow adequately, and removes internal air bubbles, thereby enhancing its density and overall strength. After completing the vibrating process, use a scraper to level the surface of the concrete specimens. This step helps ensure the flatness of the specimens, effectively eliminating any potential surface irregularities and achieving a uniform surface. Once all of the above operations are completed, place the prepared concrete specimens in a room temperature environment for initial setting (Figure 3), ensuring they attain the necessary strength and durability during the subsequent curing phase. Here, it is particularly important to ensure that the amount of new concrete poured is slightly overfilled. This allows the concrete to achieve a level surface directly during the vibrating process, avoiding the need for multiple filling and vibrating operations due to insufficient filling. Repeating the vibrating steps can cause the machine oil to seep into the concrete, severely hindering the effective bonding between the new and old concrete.
(5)
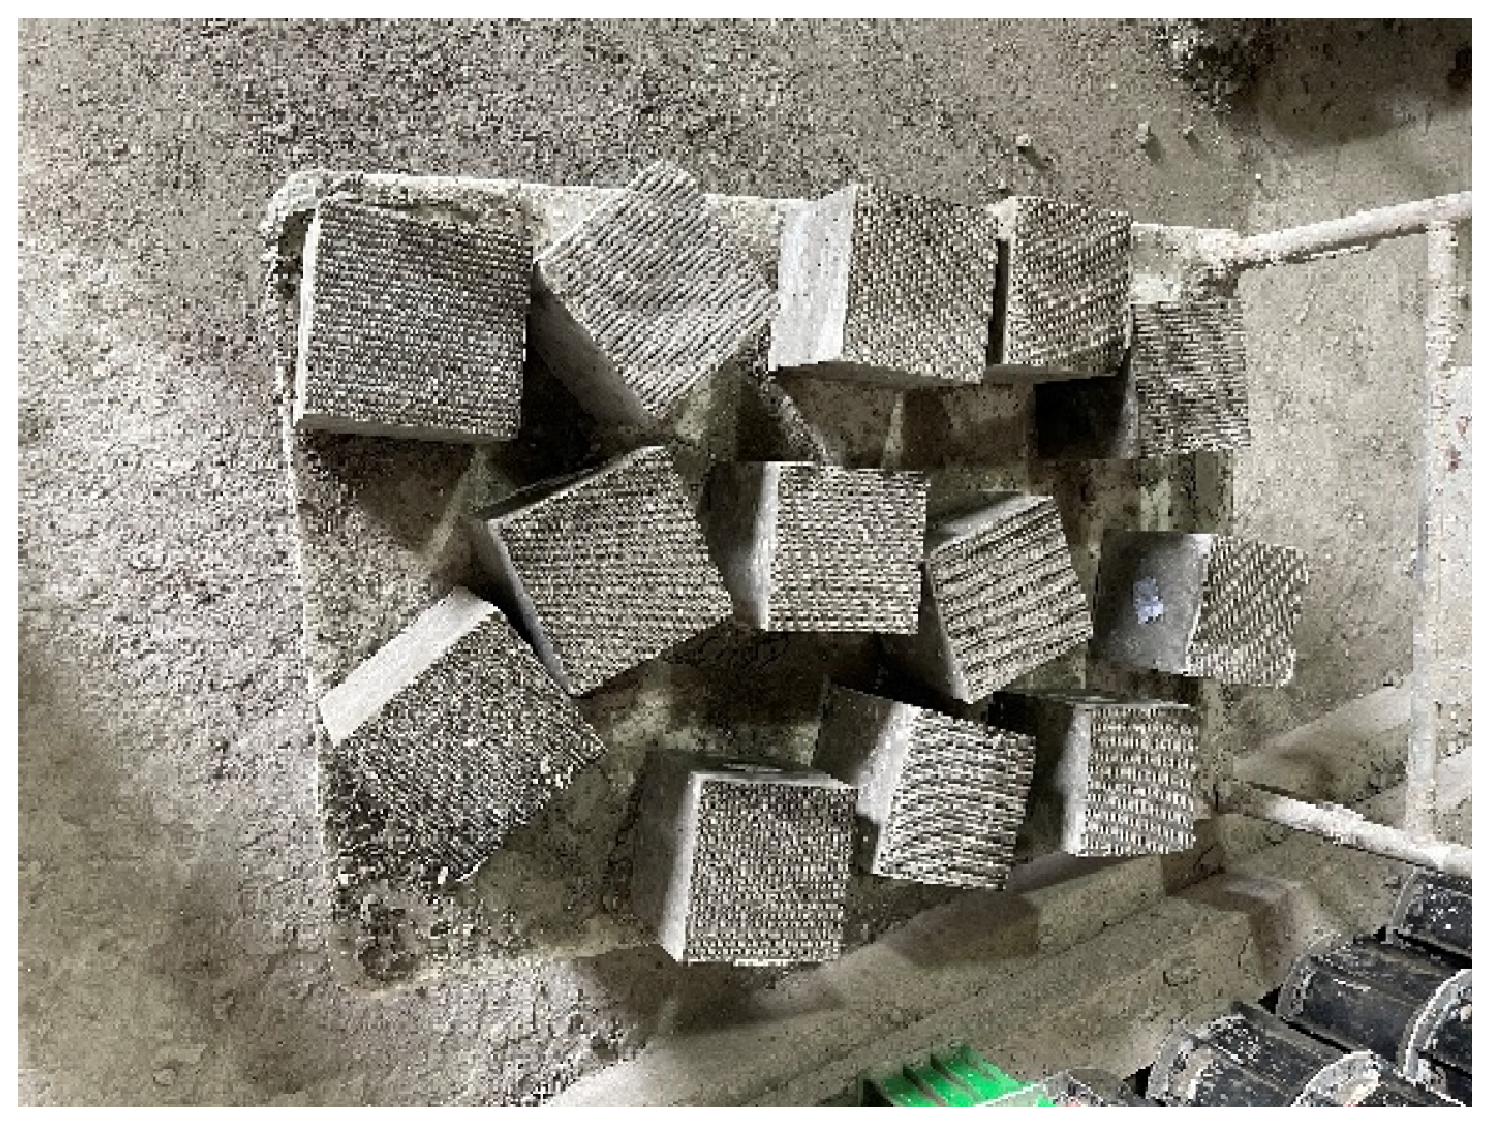
Curing of Test Blocks: After successful demolding of the test blocks (Figure 4), all samples are transferred to a curing room that adheres to strict temperature and humidity standards. The room consistently maintains a temperature within the range of 20 °C ± 2 °C, and ensures that the air humidity remains above 95% at all times. The curing room is shown in Figure 5.
(6)
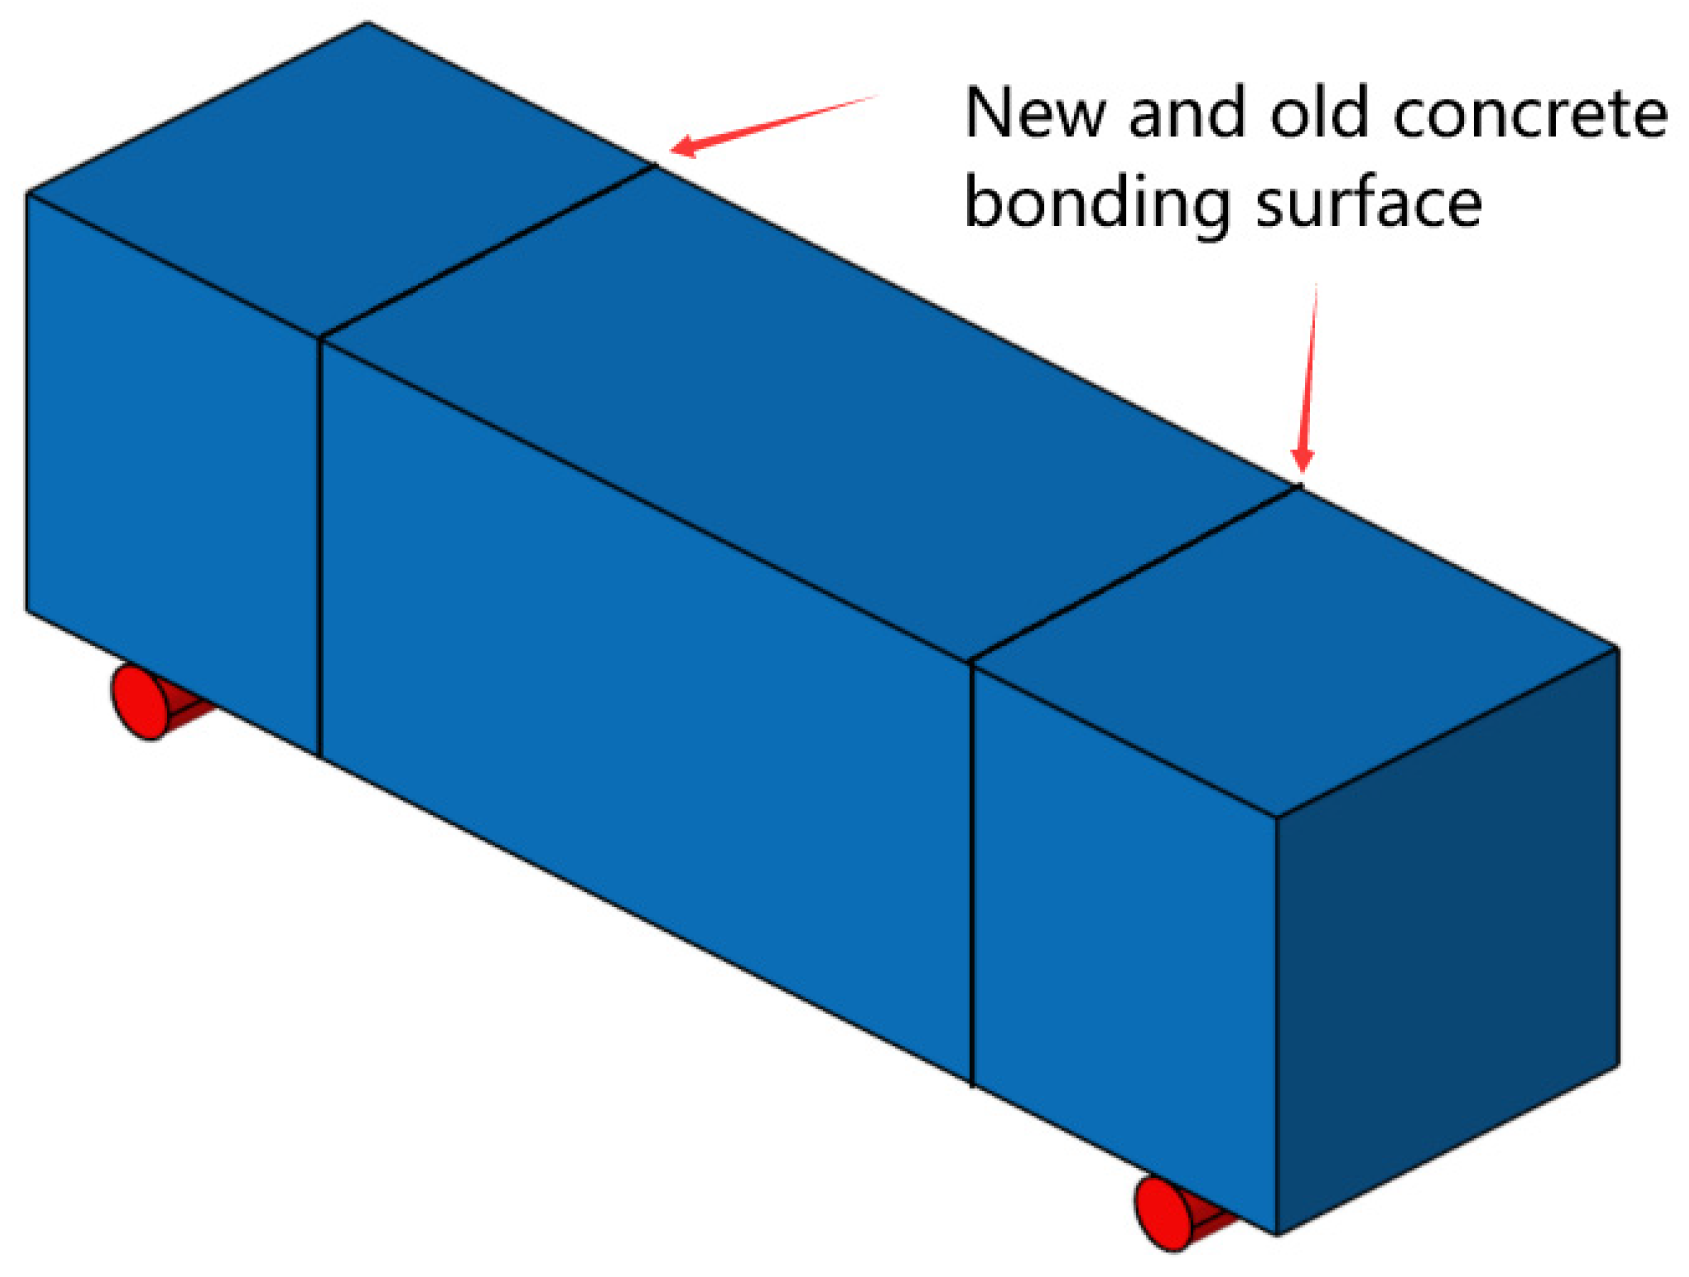
Pouring the Central Test Block: According to the experimental design, remove 10 concrete test blocks at the age of 3 days, 5 days, and 10 days. Evenly brush oil on the bottom and sides of the 150 mm × 150 mm × 550 mm rectangular mold, then place the selected square test blocks at both ends of the mold, ensuring their rough surfaces face the center of the mold. During the operation, it is necessary to gently knock the mold to ensure that the specimen and the bottom of the mold are tightly adhered to prevent the mortar in the freshly poured concrete from flowing into the bottom of the specimen, which will have an impact on the overall specimen structure, and the accuracy of the test results.

2.4. Experimental Procedure

(1)
Select specimens of the corresponding age and check the surface to ensure that there are no cracks at the seam surface.
(2)
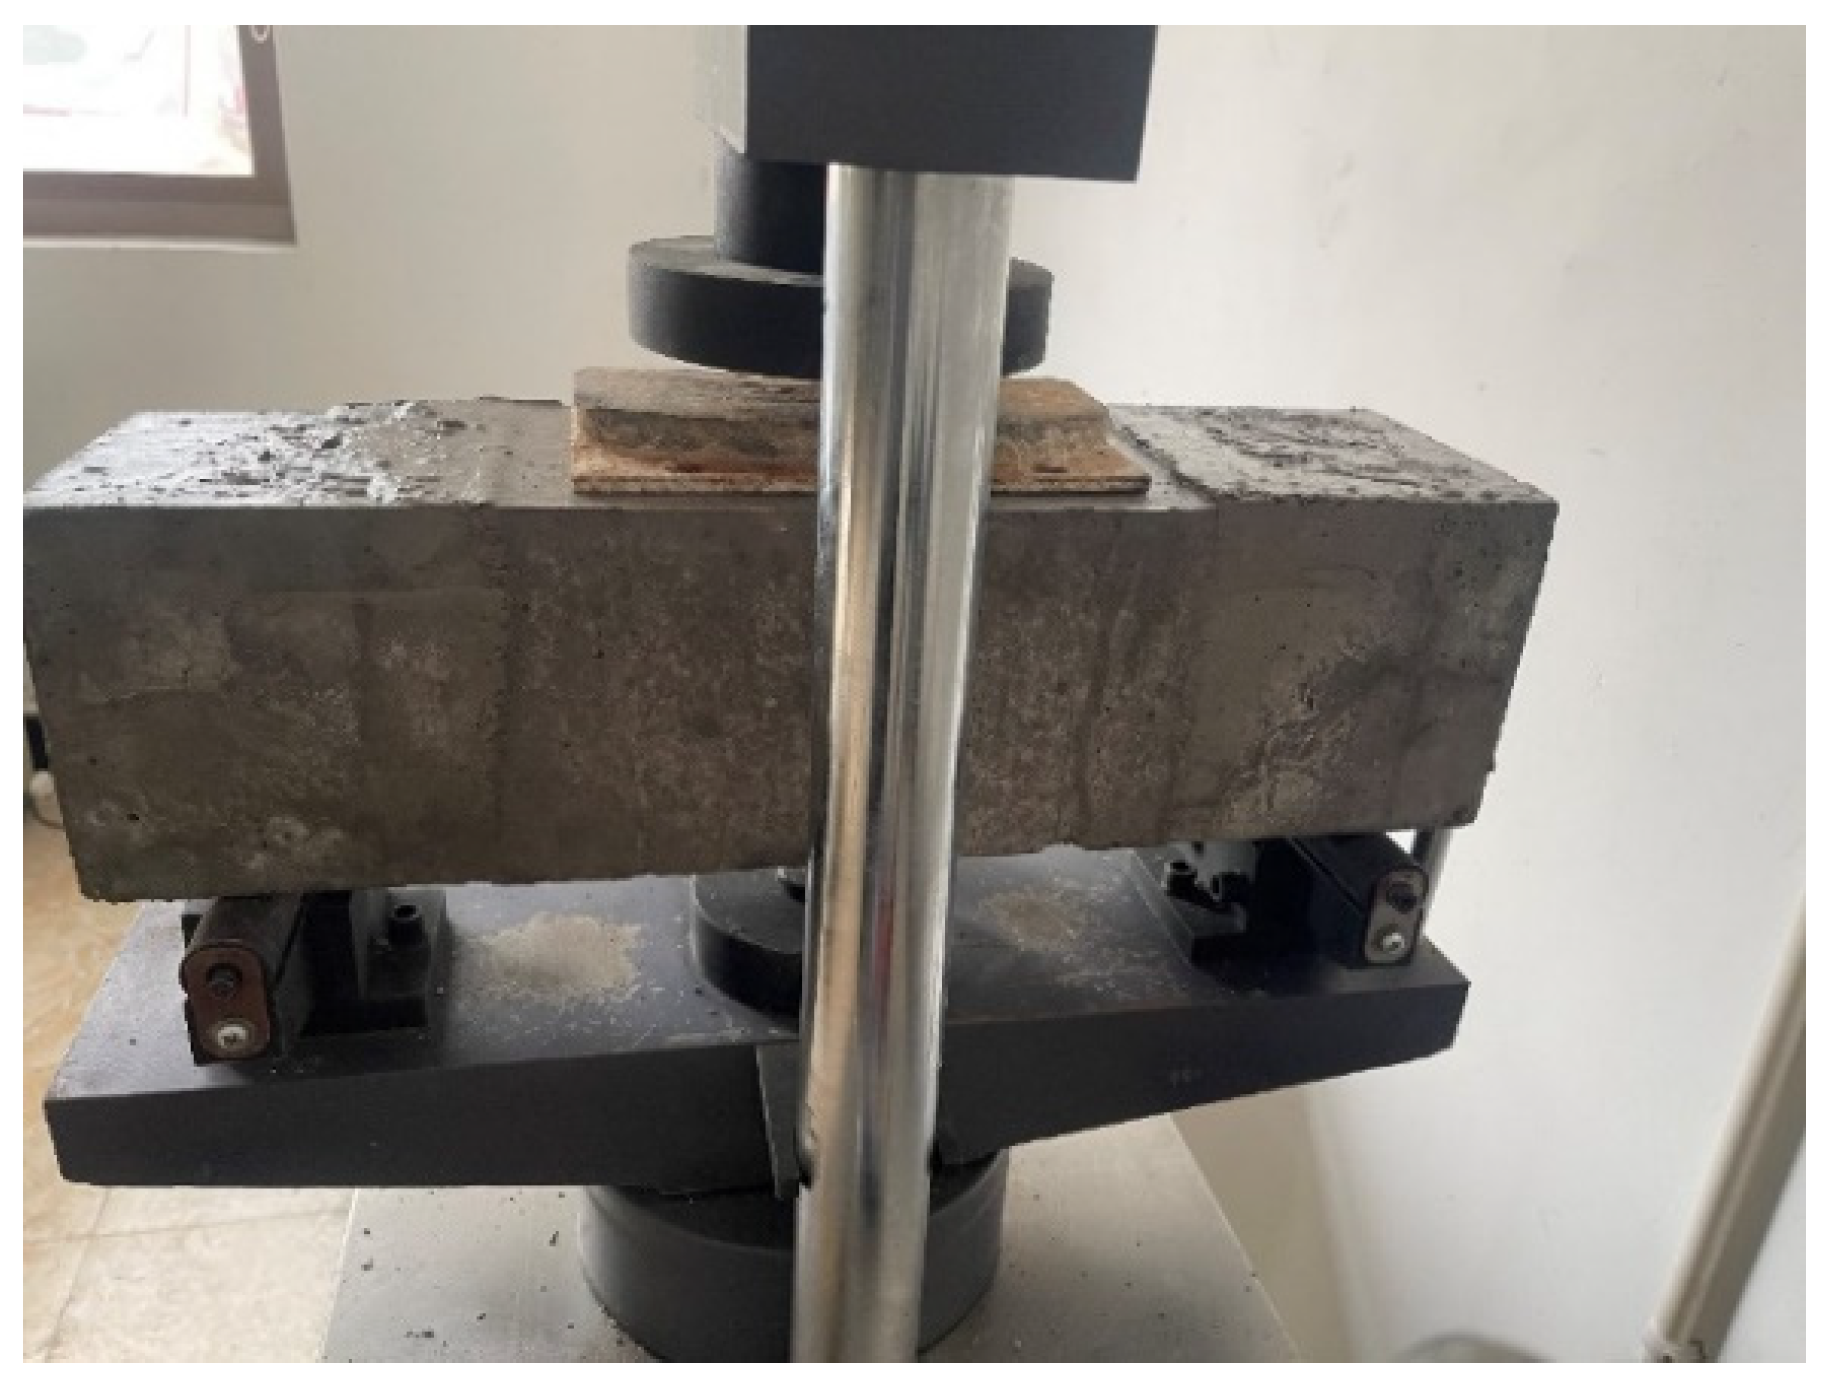
Prepare the materials and equipment required for the test, including a rectangular slab of iron. Thoroughly clean the test bench and the tools and instruments to remove any concrete debris and adsorbed iron filings that may remain and interfere with the experimental process. Subsequently, the test block was placed smoothly on the test bench, ensuring that the left and right side support positions remained symmetrical. Next, the hydraulic pump system was energized, and the supporting computer equipment was turned on to prepare for the upcoming test (Figure 6).
(3)
Enter the testing machine program, enter the specimen cross-section size of 150 mm × 150 mm, and adjust the loading rate to the lowest gear 0.6 kN/s.
(4)
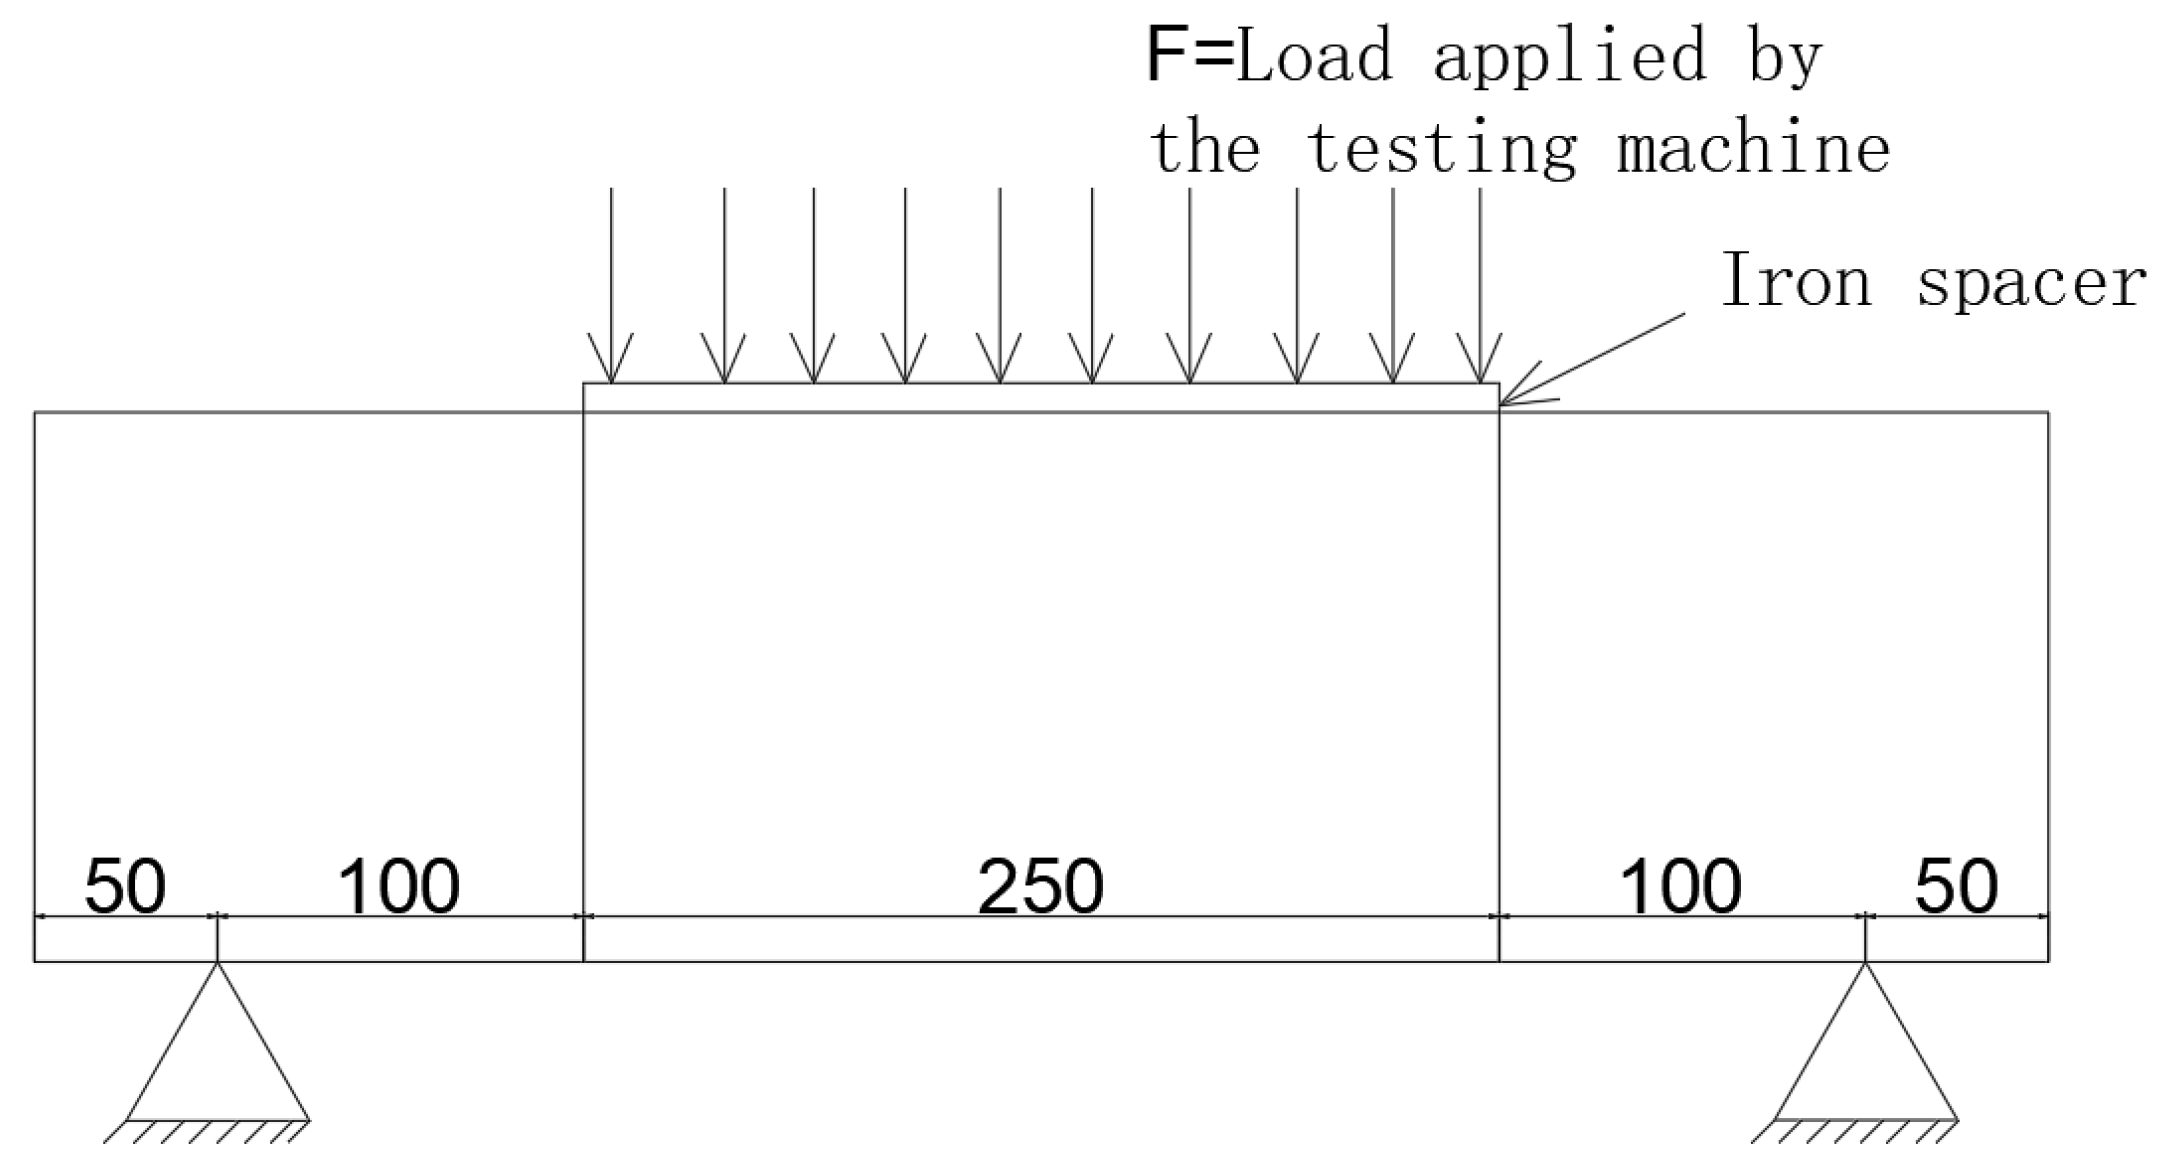
To start the test, click on the “Run” button and wait for the test piece to slowly rise, until it comes into contact with the top iron block, at which time the load data applied by the bending tester and the curve will start to appear. At this time, the data and curve of the load applied by the flexural testing machine will appear. Until the specimen is pressed and cracked, the testing machine will unload automatically and record the load applied at the ultimate moment.
(5)
The results of the tests were photographed and recorded.
(6)
At the end of the experiment, the computer was first turned off, and the hydraulic pump was subsequently stopped. Then, use the trolley to move the completed split tensile damage test specimen block to the preset waste specimen block storage area. Finally, clean up the small debris scattered on the test bench as a result of the test process, and restore the test bench to neatness.

3. Results and Discussion

Due to the small size of the specimen, the heat of hydration does not significantly affect the strength of the specimen, so the effect of the heat of hydration is ignored.
A simplified force schematic of the test block is shown in Figure 7, and the 3D model is shown in Figure 8.
The direct result obtained from the test is the load applied by the testing machine (kN); the specific results are shown in Table 2, Table 3 and Table 4.
According to the tensile stress calculation formula ( σ = M / W Z , where M is the bending moment and Wz is the section modulus in bending), the tensile strength of the seam surface at the corresponding age was calculated, and the fitted trends of the tensile strength of the seam surface are shown in Figure 9, Figure 10 and Figure 11, which indicate that the age of the old specimen was 3d, 5d, and 10d, respectively. The curve fitting form is f t ( τ ) = a × ( 1 e b τ c ) , and the curve fitting results are as follows:
f t ( τ ) = 2.53 × ( 1 e 0.15 τ 1.38 )
f t ( τ ) = 2.66 × ( 1 e 0.16 τ 1.31 )
f t ( τ ) = 2.66 × ( 1 e 0.22 τ 1.23 )
Figure 12 shows a comparison of the fitted curves for the three sets of tests.
In this paper we have experimentally measured the loads required for splitting and tensile damage of the old and new concrete joint surfaces, and calculated the tensile strength of the joint surfaces. The results show that the tensile strength of the joint surface increases slightly as the age of the old test block increases. However, the increase in the final value of the tensile strength with the age development of the bond surface was not obvious when the age of the old test blocks exceeded 5d. According to the comparison graphs of the fitted curves of the three groups of tests, we can infer that when the age of the old specimen blocks reaches more than 10d, the strength of the bond surface will not change significantly with the age improvement of the specimen blocks. Furthermore, as the age of the bond surface develops, the tensile strength of the bond surface rises rapidly until it approaches the maximum value, around 15d.
Yang Rui [23] of Hohai University conducted a test similar to the one in this paper, but there are some shortcomings in his test, which are as follows:
(1)
The size of the test block is too small, being 50 mm × 50 mm × 50 mm, and it is plain concrete without aggregate.
(2)
The contact surface of old and new concrete is smooth.
(3)
The load at the time of damage can be obtained by shear test, the displacement can be measured by micrometer, and the tangential stiffness can be deduced from the stress–strain relationship, which is different from the results of this test.
The gap between such test conditions and the actual construction of the water conservancy project is large, the concrete structure of the water conservancy project is large in volume, and all contain aggregate. Therefore, we improved the test conditions by using C30 concrete containing aggregates with the same mix ratio as the actual project for the test, and utilized the grouting belt to produce a uniform rough surface, which can be better than the actual project. The results from this test can be used in the process of simulation calculations to provide appropriate guidance for correctly modeling the mechanical properties of the bonding surfaces, such as determining the cracking of vertical construction joints.
Properties such as tensile strength at the bonding surface are not simply considered to be equivalent to the properties of the concrete itself. Applying the tensile strength of the bonding surface of the old and new concrete obtained from the tests above to the temperature control simulation program can make the stress results calculated by the simulation more in line with reality. The current temperature-controlled simulation program is not accurate enough to simulate cracking, due to stress overruns. When temperature control measures are inadequate at an early stage, or when surface insulation is missing during a cold snap, small cracks may form in the concrete. The cracks at construction joints are often so narrow that they are hard to detect with the naked eye, or even with instruments, and are usually identified only by water seepage. Some internal cracks may remain undetected for long periods. Despite their small width, these cracks significantly impact the overall structure’s stresses.
Therefore, we developed a simplified simulation calculation method for determining concrete cracking, which is as follows:
In the first step, the stresses in the center of the cell are calculated as follows: before calculating the stresses in the next step, the six stress components in the center of the cell shape are calculated using the interpolated values of the eight nodal stresses in its current time step.
The second step shows whether the unit survives the judgment of cracking, as follows: for the first step of the calculation of the six stress components of the shape of the center, determine the first principal stress, if it is more than the tensile strength of the age of the time; then, determine tensile cracking, the cracking unit of the nodes of the stress unloading, and the unit to reduce the strength (modulus of elasticity and tensile strength).
The third step is the stress release of the cracked unit, which is as follows: when the unit is cracked, its stress is released, referring to the calculation method of the tunnel excavation load [24,25,26] (specifically, the mana method is used); then, the nodes of the unit produce the load with the opposite direction of the stress before cracking, which acts on the calculation of the next step.
The fourth step is the seam surface subsequent tensile or tensile judgment, which is as follows: there is a subsequent time step in the thermal expansion and contraction calculations, and if the unit forms center stress for compressive stress, the modulus of elasticity increased to a large value; if the unit forms center stress for tensile stress, the modulus of elasticity is still a small value.
The flowchart of this simplified algorithm is shown in Figure 13.
To verify the effectiveness and applicability of the improved procedure, a simplified model of a concrete rod was constructed. The bar is made of C30 concrete, it extends along the Y-axis direction, and the total length is set to be 5 m. In the X-axis and Z-axis directions, the cross-section of the bar is square, and the side lengths are both 0.1 m. The mesh model is shown in Figure 14.
The bar was placed horizontally, and during the construction process, the left part of the bar was poured first, and then the right part was poured after the 10-day interval, forming a vertical construction joint between the two. In the simulation calculation, the constraints were applied to the two end faces of the bar in the Y-direction, and the self-weight of the concrete material was ignored. At this time, the only internal stresses in the bar are the temperature stresses caused by the temperature change. The concrete calculation parameters are shown in Table 5 and Equations (4)–(6).
The modulus of elasticity of C30 concrete (GPa) is as follows:
E ( τ ) = 30.5 × ( 1 e 0.35 τ 0.73 )
The formula for calculating tensile strength of C30 concrete (MPa) is as follows:
f t ( τ ) = 3 × ( 1 e 0.32 τ 0.7 )
The adiabatic temperature rise of C30 concrete (°C) is as follows:
θ = 49.8 × ( 1 e 0.65 τ 0.74 )
One feature point is taken in each of the two parts of the bar and in the center of the bonding surface unit, the coordinates of the feature points are shown in Table 6, and the schematic diagram of the feature point location is shown in Figure 15, in which feature point 2 is the feature point in the bonding surface unit.
After the concrete of this bar had reached maturity, the ambient temperature was allowed to drop gradually from 20 °C to −40 °C, then return to 20 °C, gradually warm up to 45 °C, and return to 20 °C. Observe whether the seam surface is cracked, and whether the state of the tensile or compressive pairs of the cracked seam surface and the bar stresses are reasonable. Because of the small size of the rods, the internal temperature will change more quickly with the air temperature.
Refer to Figure 16, Figure 17, Figure 18, Figure 19, Figure 20, Figure 21, Figure 22, Figure 23 and Figure 24 for graphs of the temperature versus time and stress versus time at the feature point.
As shown in the above figure, with the gradual decrease of the external temperature, the internal temperature of the concrete synchronously shows a decreasing trend, and at the same time, the internal stress of the concrete shows a continuously increasing trend. At the characteristic point 2 (bond surface unit), when the stress rises to 2.75 MPa, according to the fitting Equation (3) of the tensile strength of the seam surface, the program determines that the fracture occurs at the seam surface, and then the internal stresses of the rods on the left side and the right side of the seam surface are released. During the subsequent gradual warming process, the compressive stresses in the Y-direction were gradually increased until they were restored when the temperature was restored to 20 °C. The program was able to determine that the compressive stresses in the Y-direction had been released. This series of processes shows that the program has the ability to accurately identify whether cracking occurs in concrete vertical joints, and the tensile or compressive states of the joint surface and the stress state of the bars after cracking are reasonable.

4. Conclusions

In this paper, a split tension test was designed and completed to investigate the evolution of the tensile strength of the seam surface of early-aged concrete with age. The test consisted of three groups of old concrete with ages of 3d, 5d, and 10d, and several test groups with ages of 1d, 3d, 5d, 7d, and 15d were set up in each group, respectively. C30 concrete material was used for the tests. In order to ensure that the joint surface of old and new concrete has a uniform roughness, no-chiseling grouting tape was used to produce a rough joint surface. All of the prepared concrete specimens were cured in a curing room that met the standard conditions. The final test data were recorded. This can provide a certain basis for the temperature control simulation calculation before the construction of the project, improve the accuracy of the simulation calculation results, and then achieve the improvement of the temperature control of concrete crack prevention during the construction period. The main conclusions are as follows:
(a)
The direct result obtained from the test is the load applied by the testing machine. According to the data read from the testing machine, the load required for splitting and tensile breakage of the three groups of old specimens with ages of 3d, 5d, and 10d shows a general upward trend.
(b)
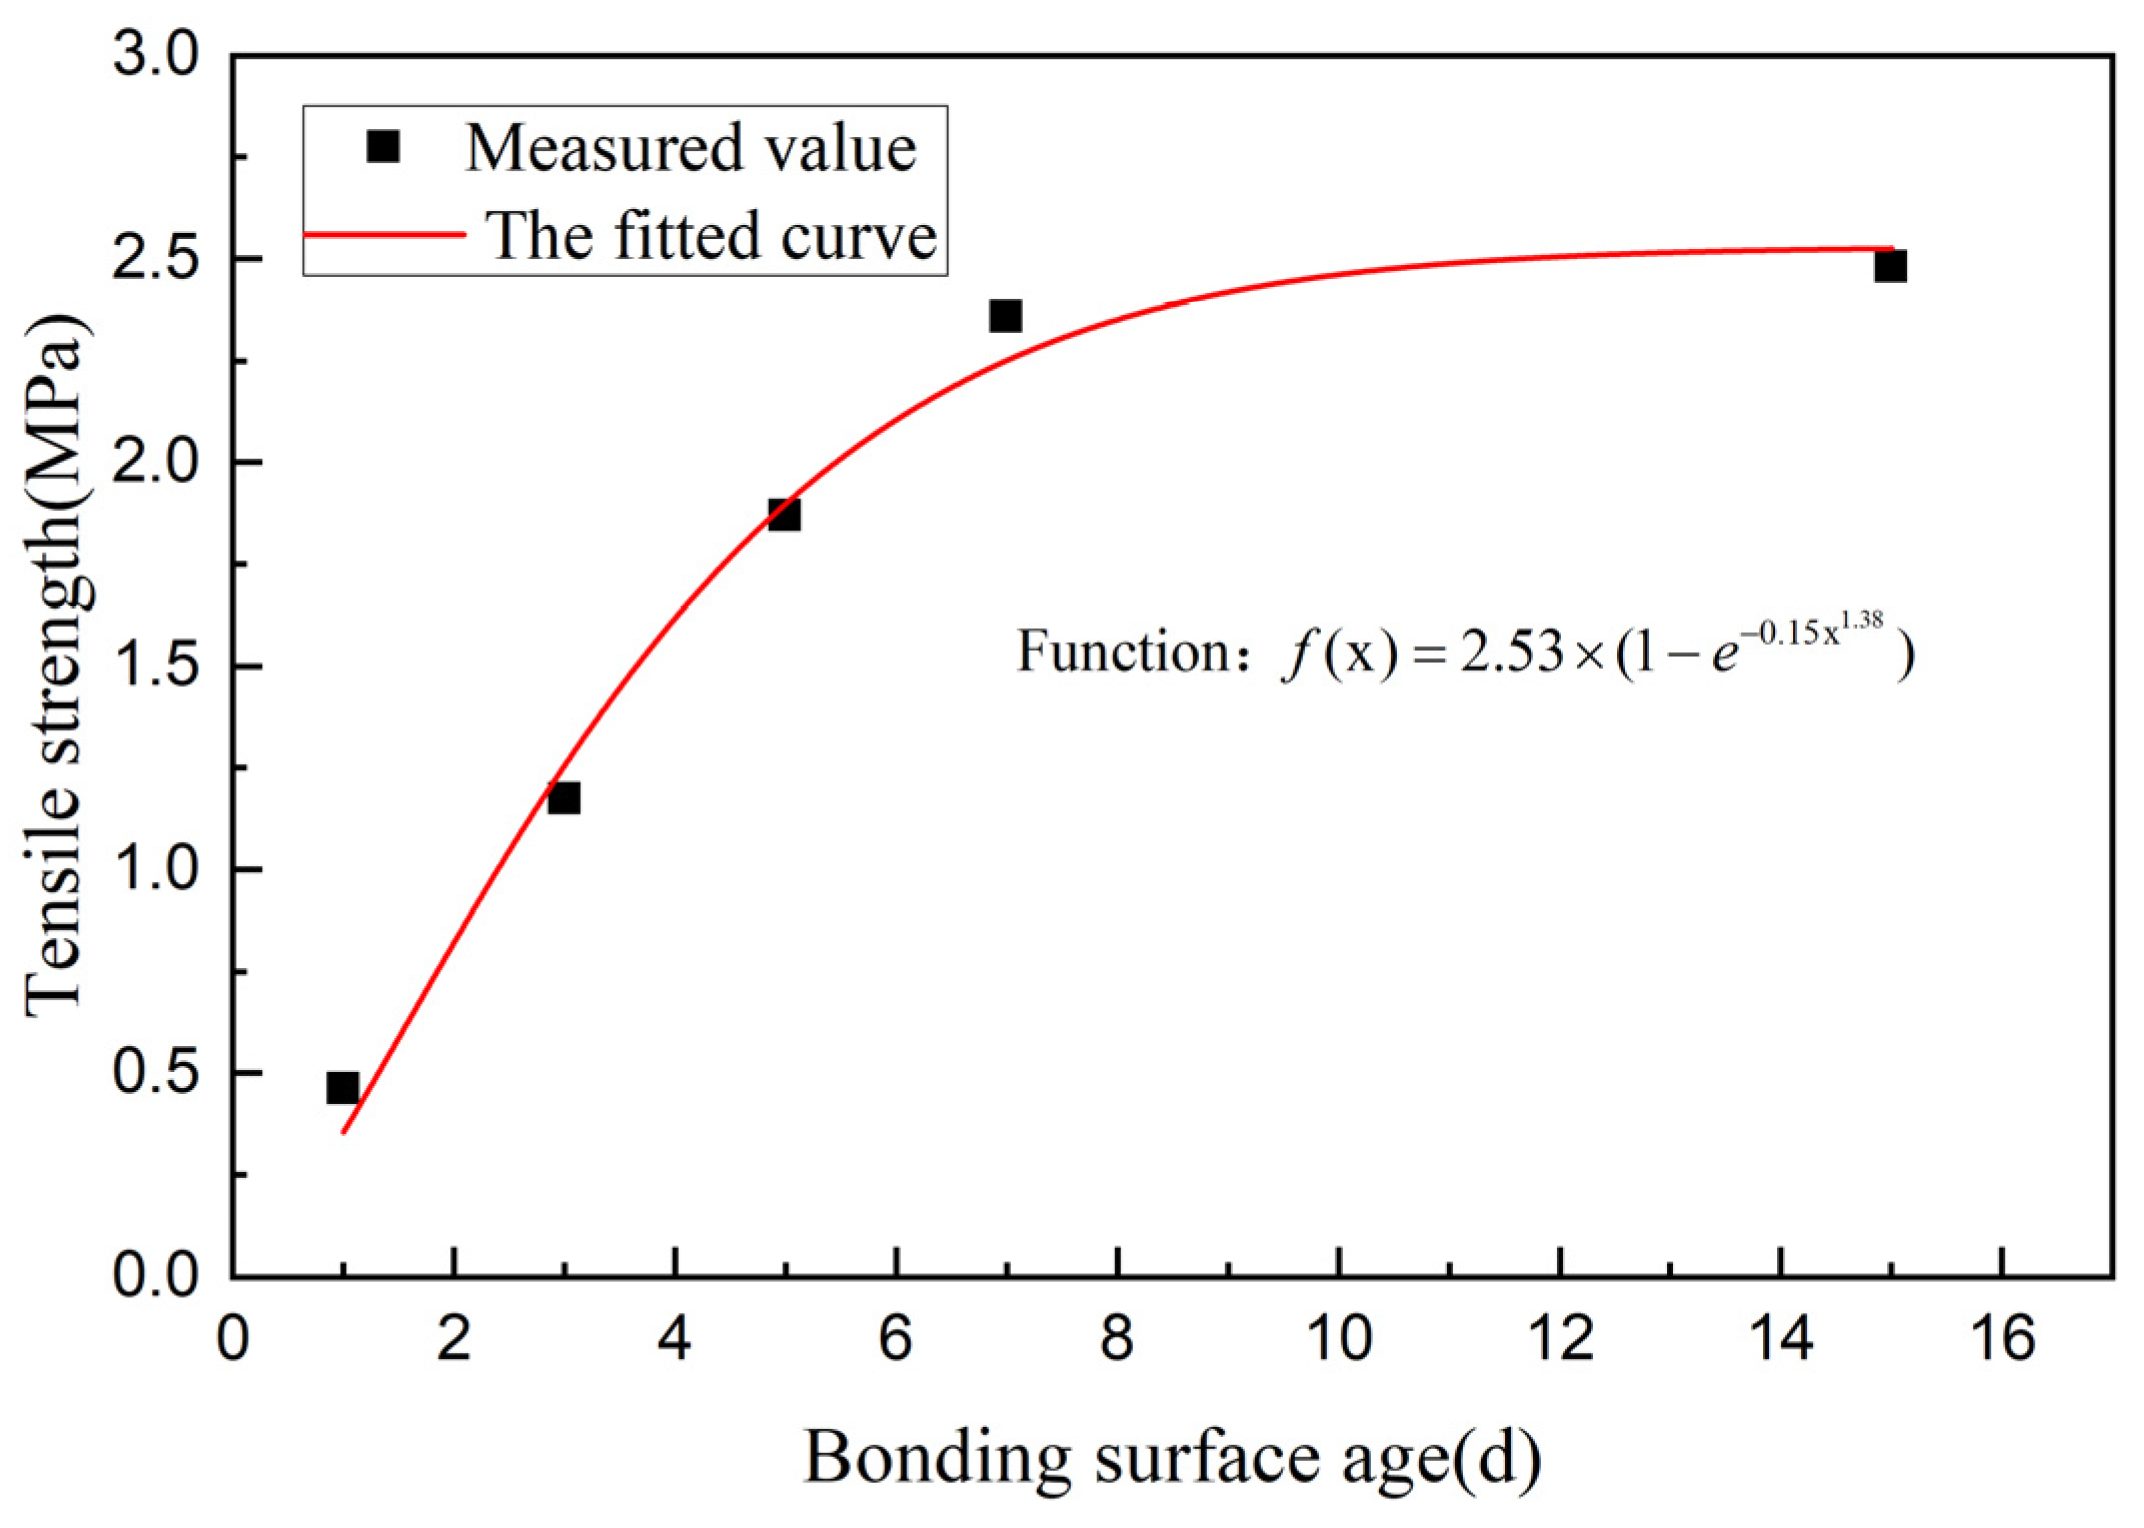
Based on the basic principles of material mechanics and related formulas, the seam surface tensile strength of each specimen at the corresponding age was calculated based on the recorded load data, and the seam surface tensile strengths were obtained for each group of tests at different seam surface ages.
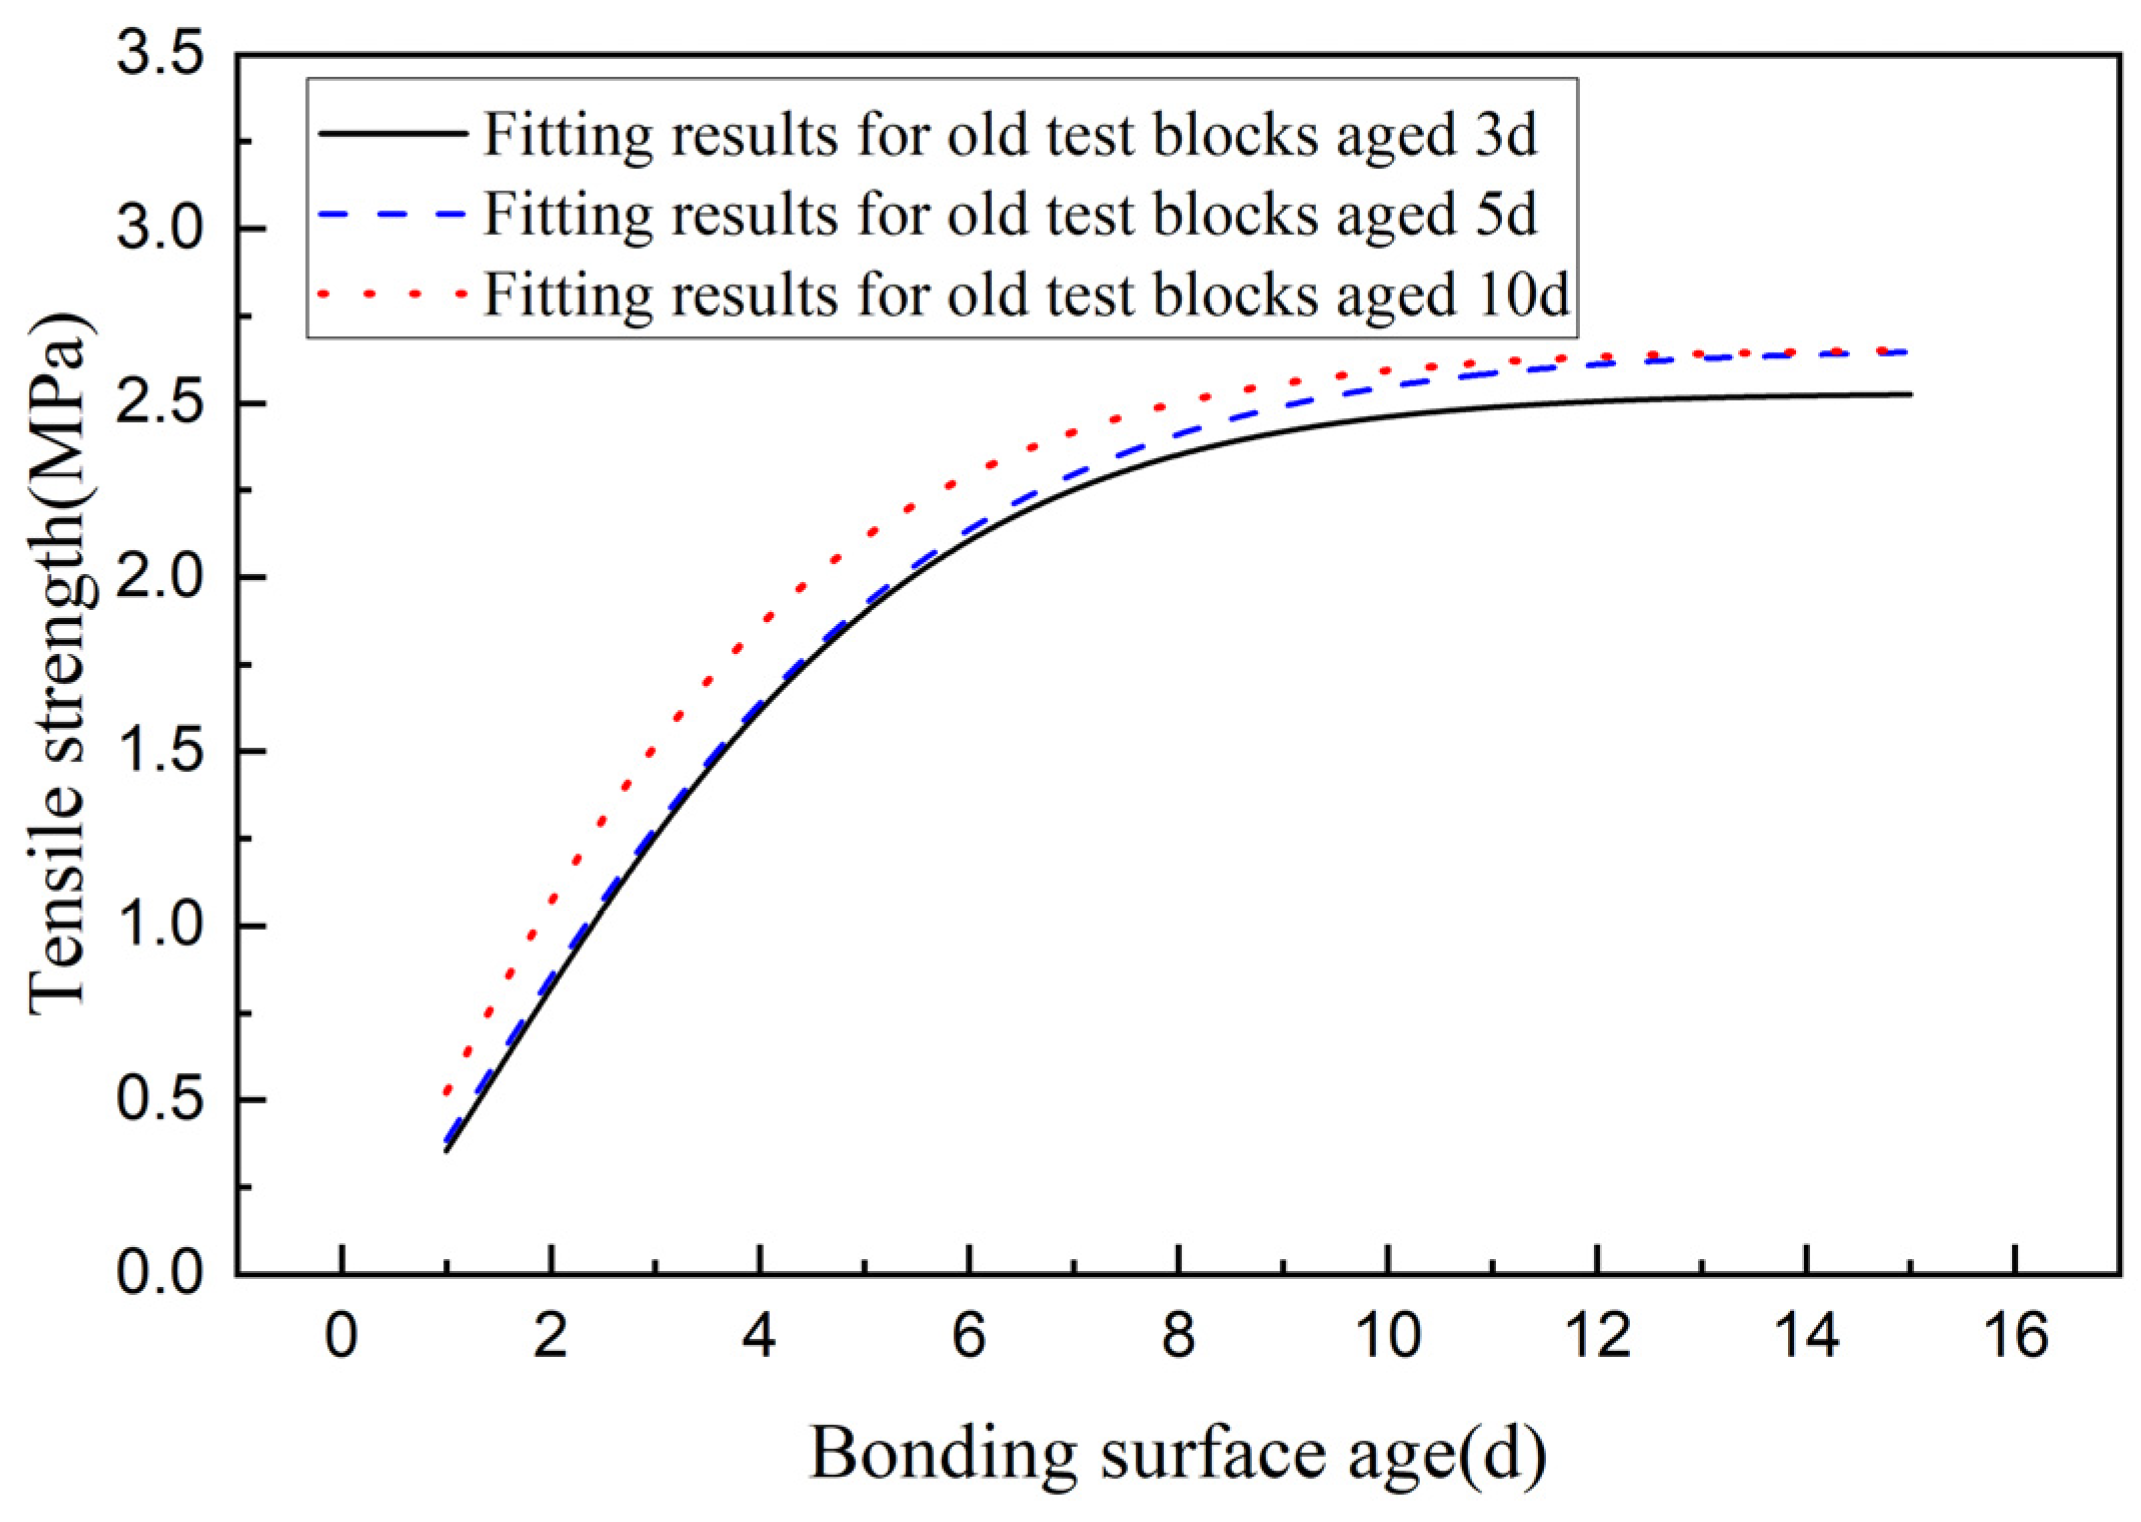
(c)
The curve was fitted using MATLAB software, and the fitting results were function (1)–(3), respectively. Through the above test steps and data analysis, it reveals the change rule of tensile strength of seam surface of concrete at an early age with the growth of age, which provides a basis for the correct simulation of mechanical properties of the seam surface during simulation calculation.
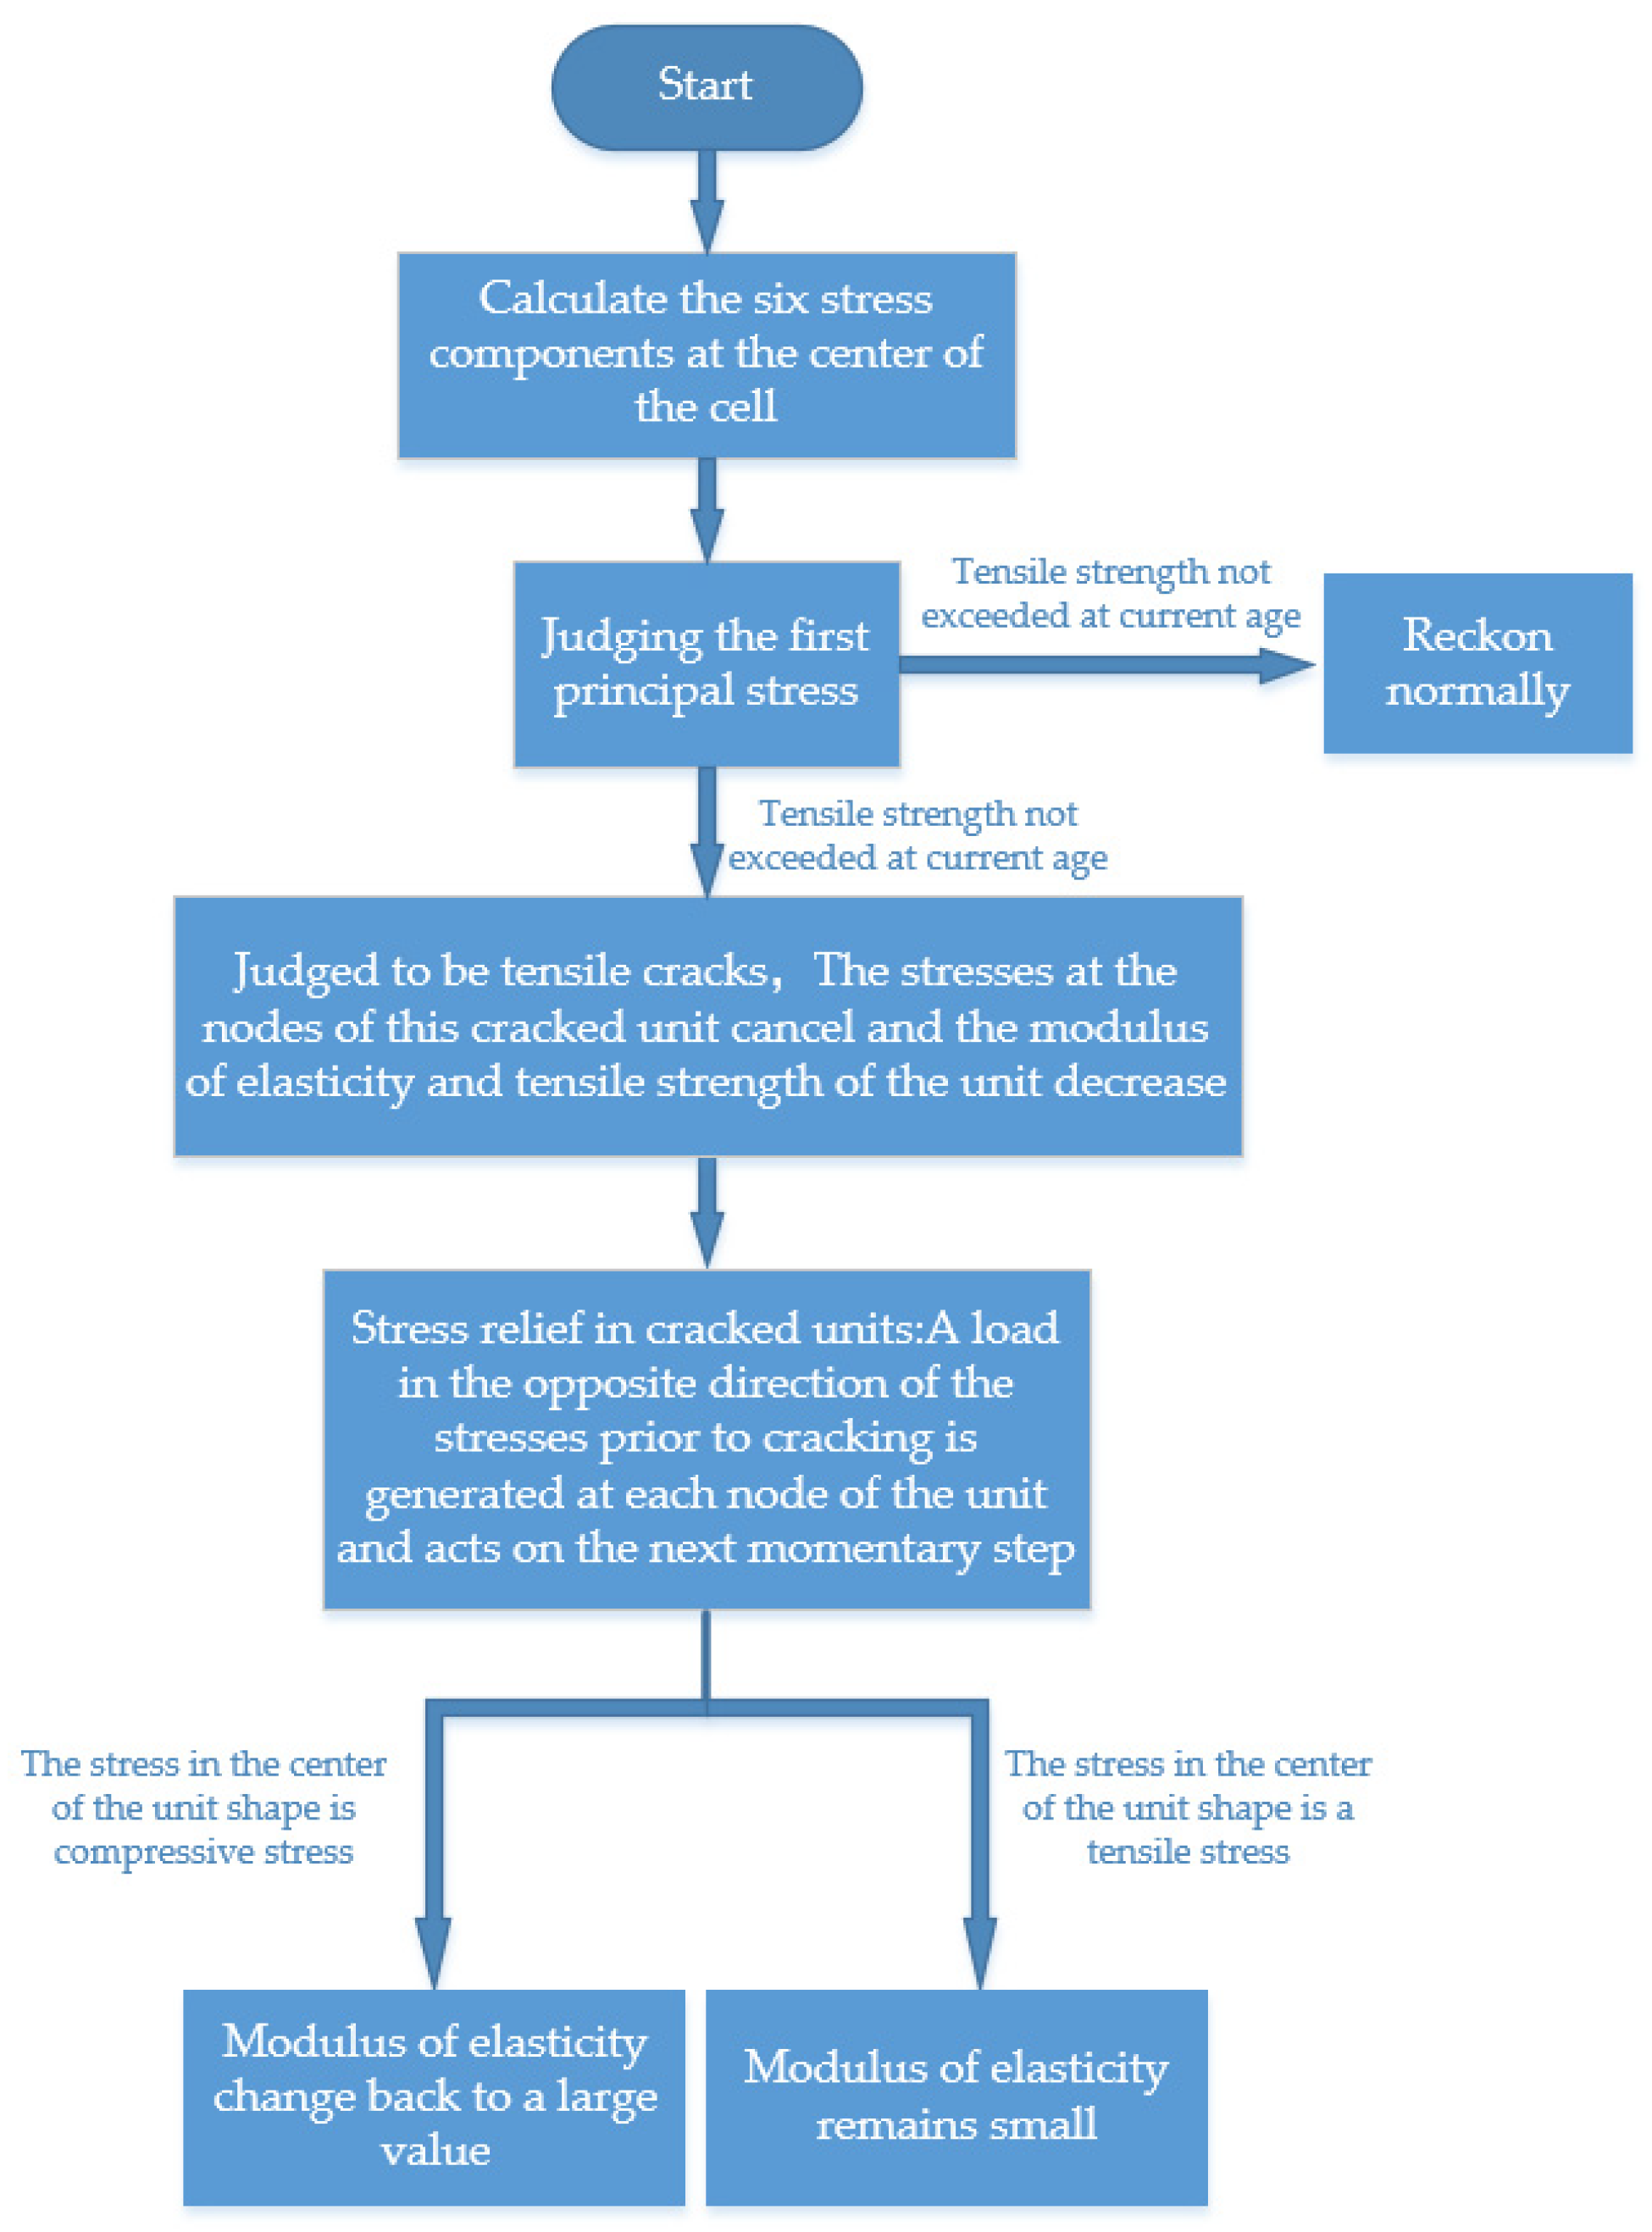
(d)
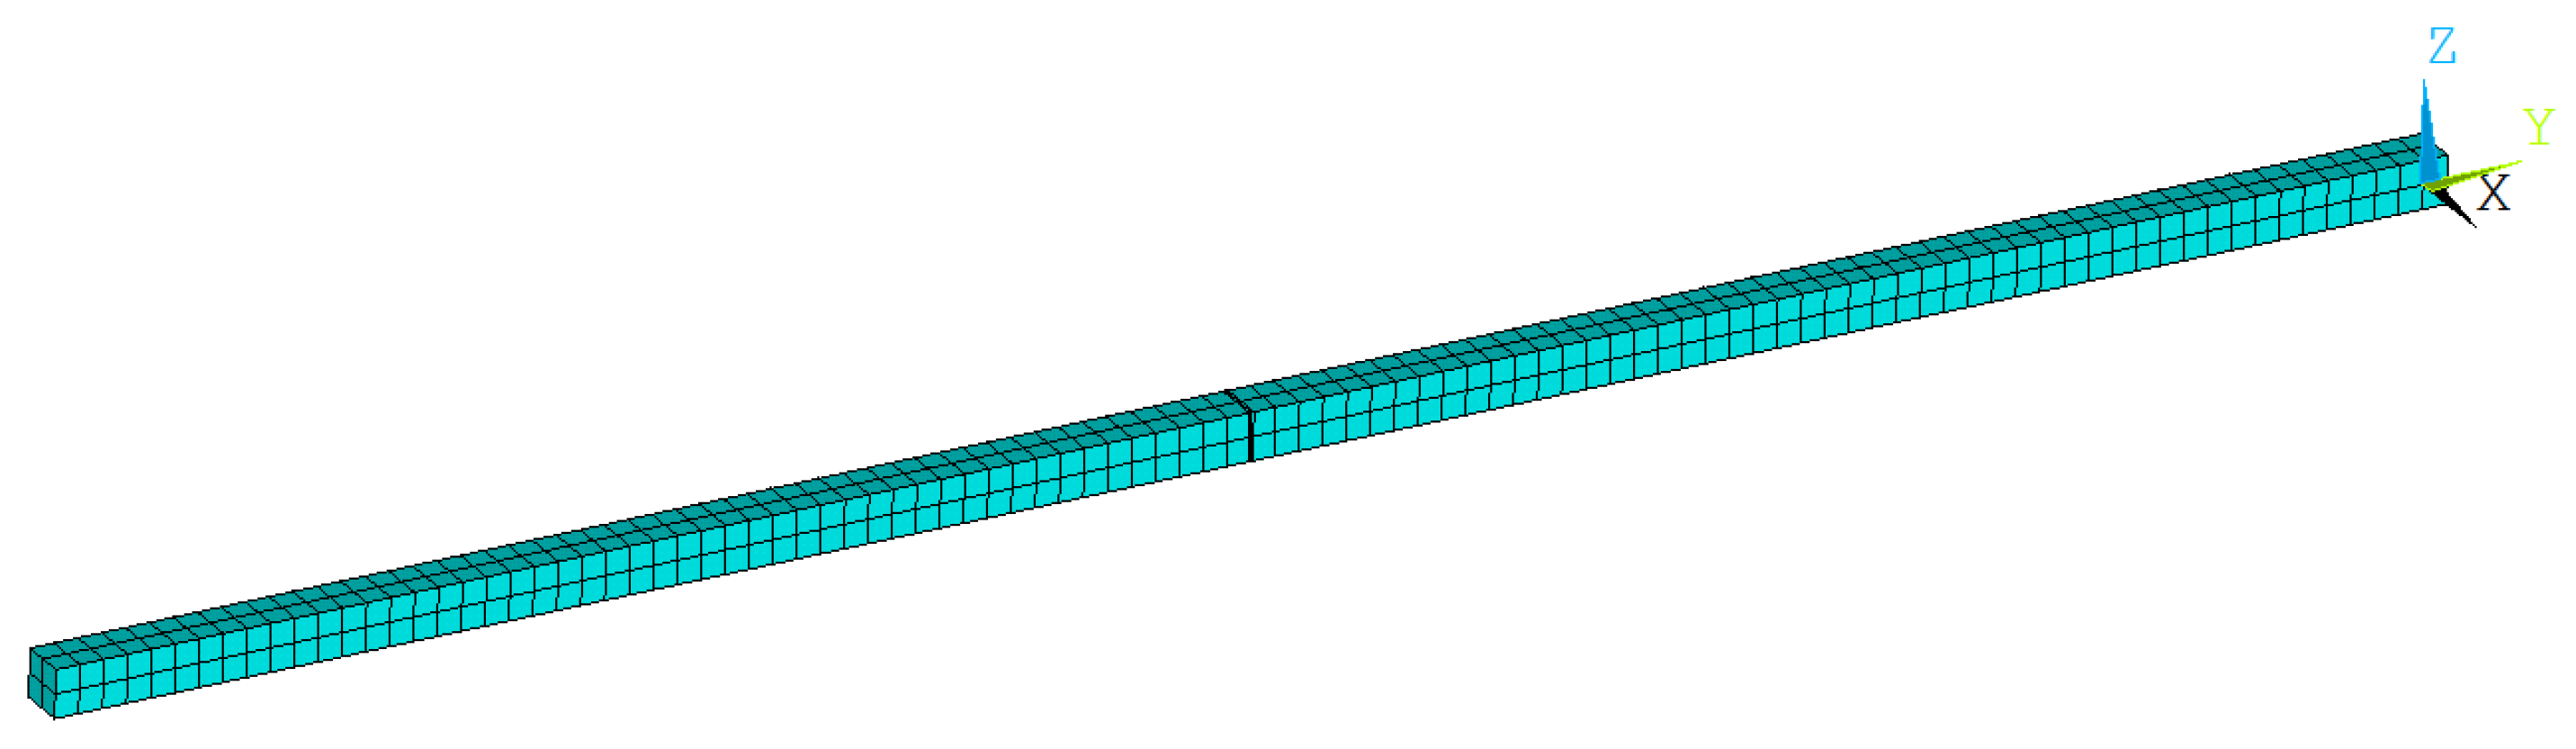
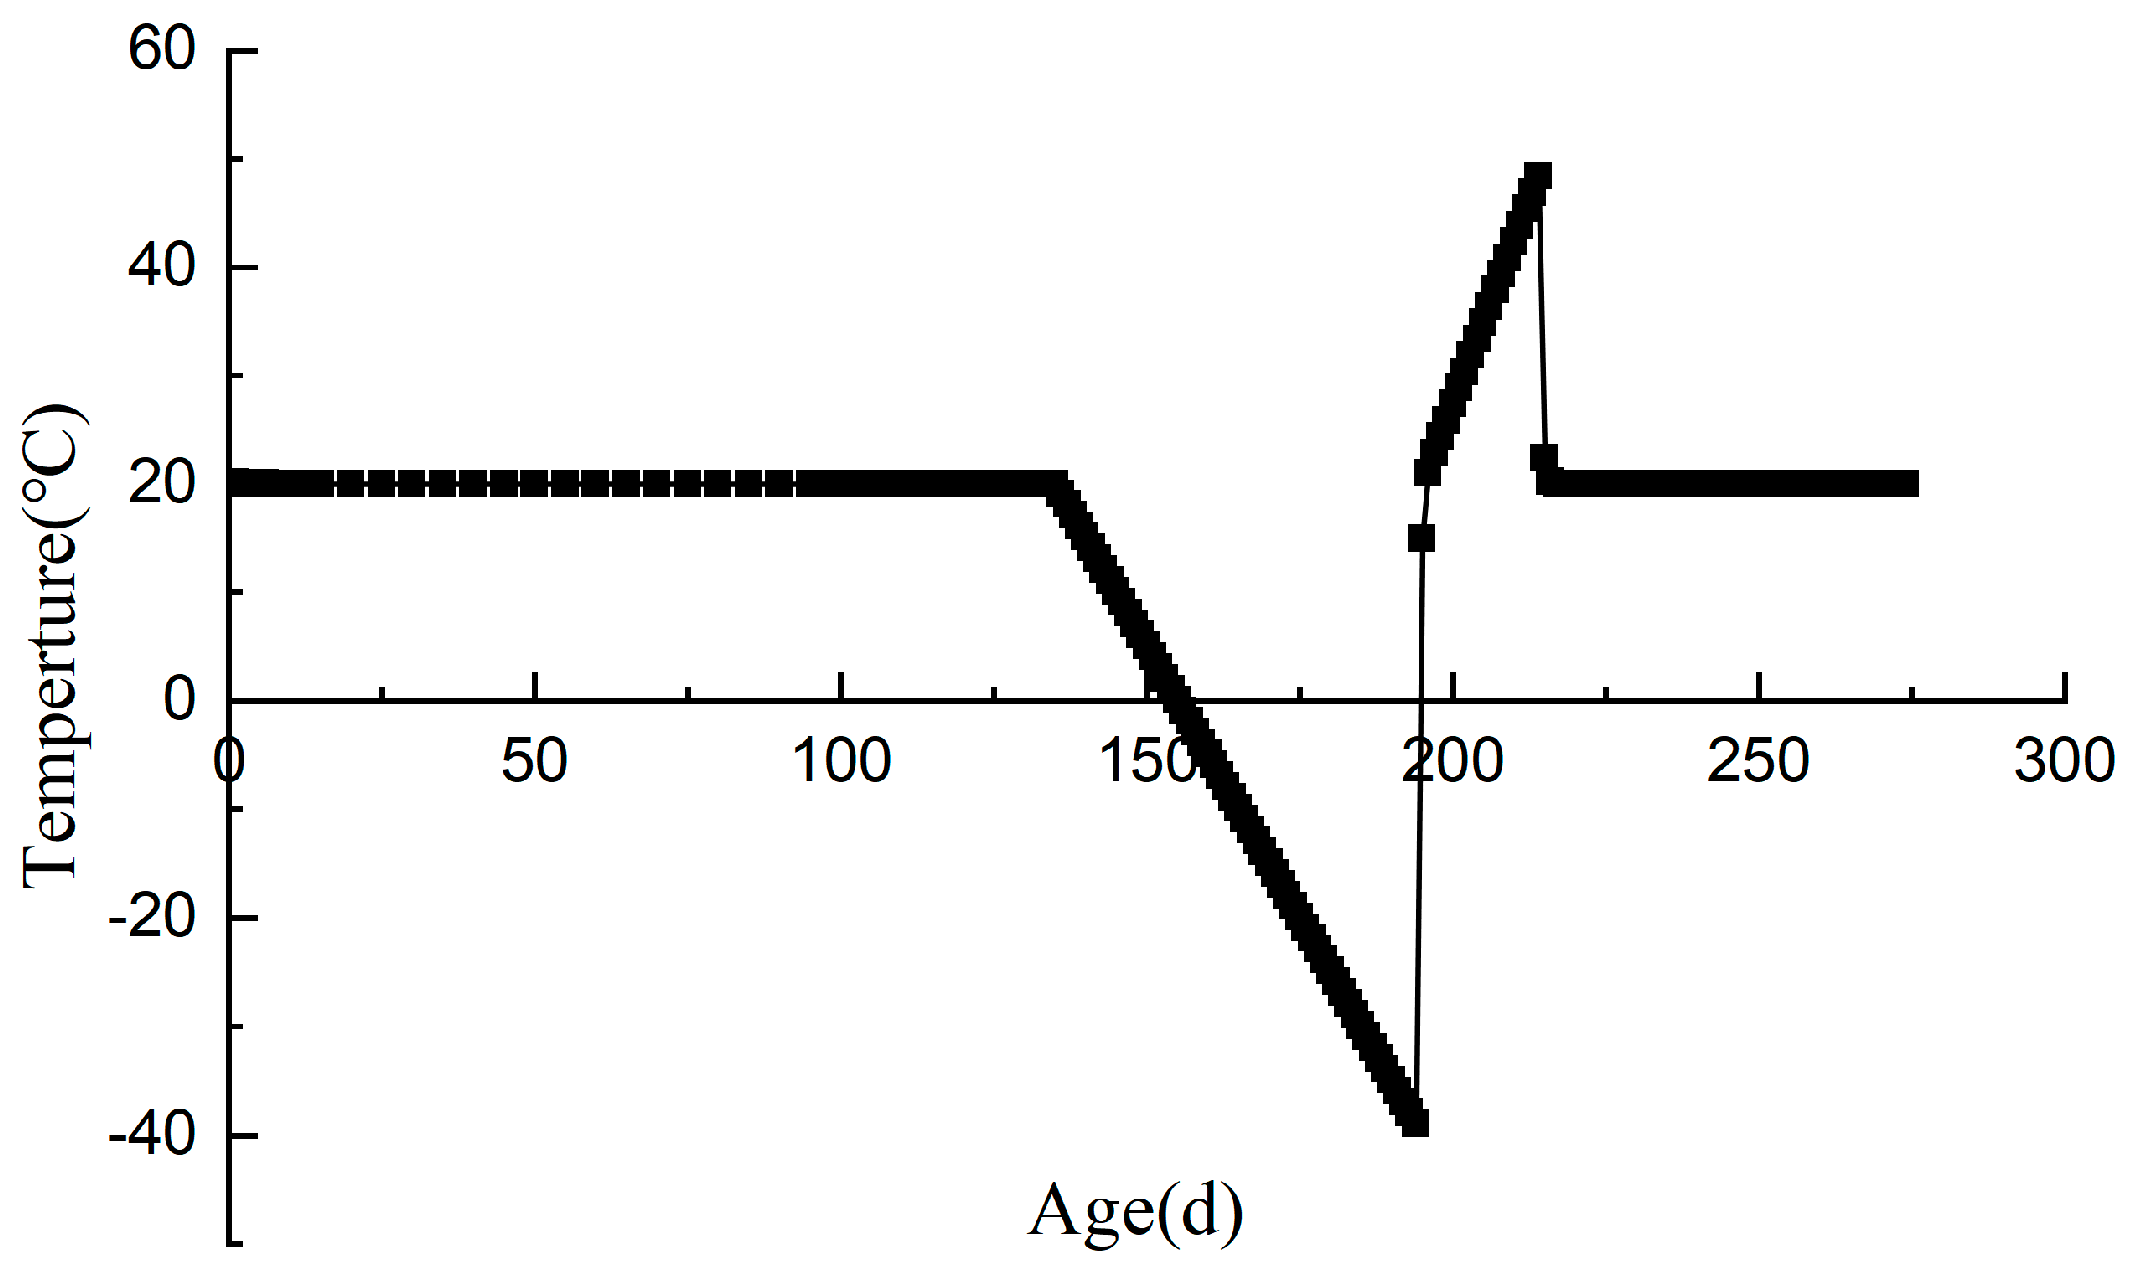
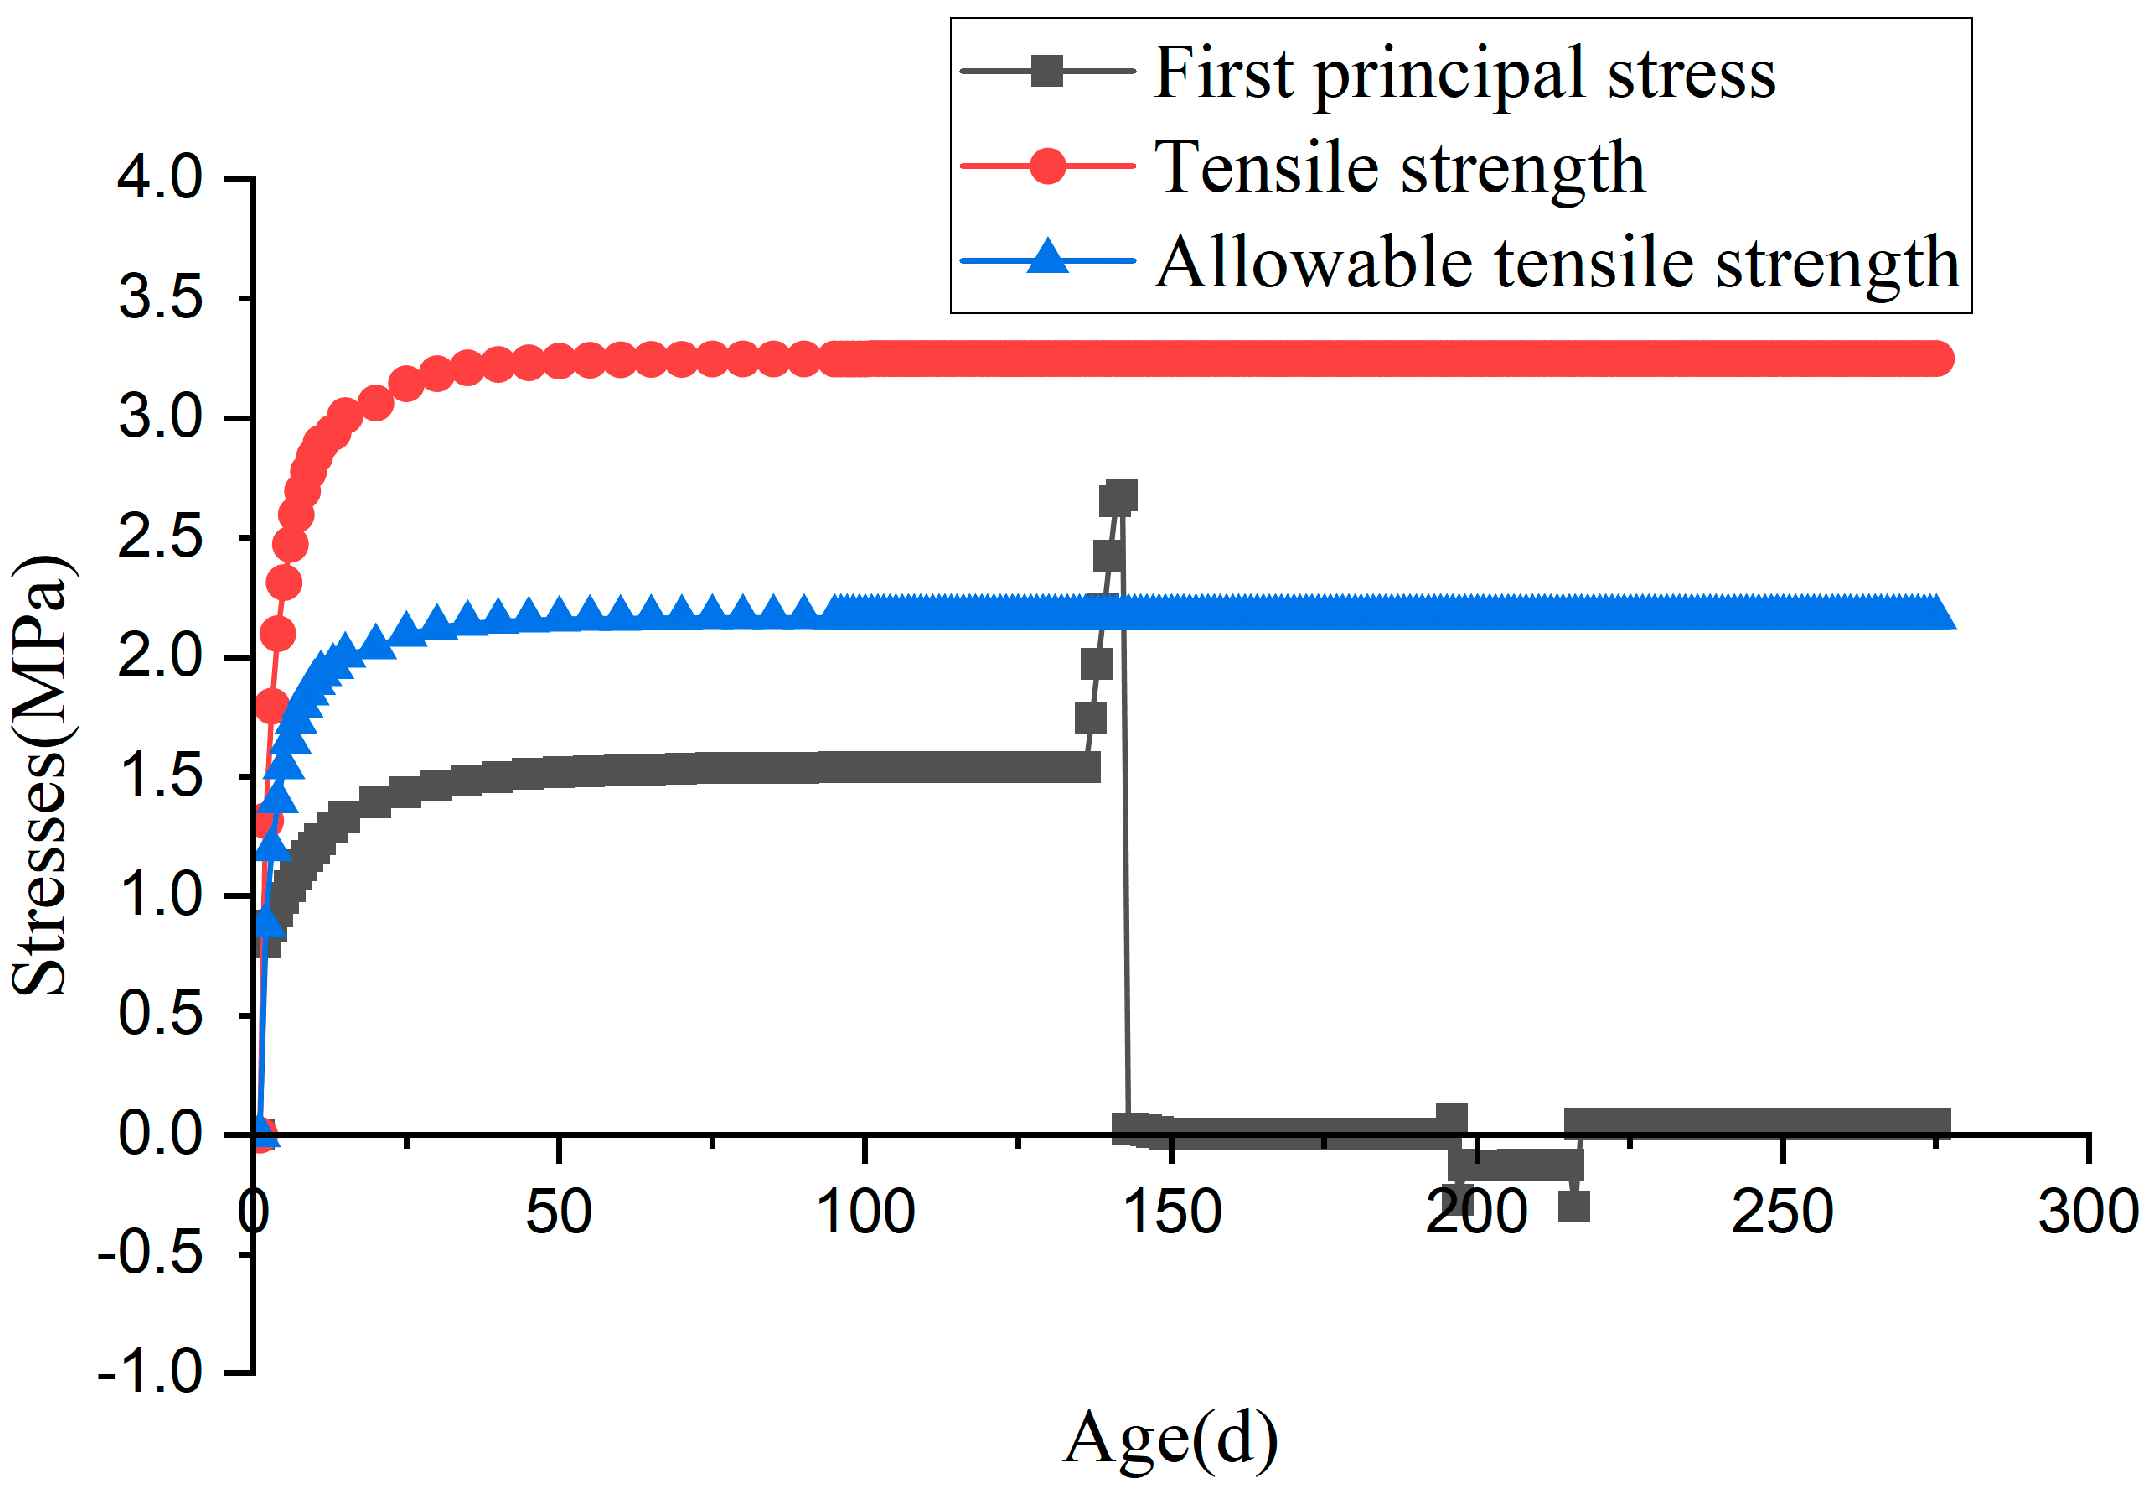
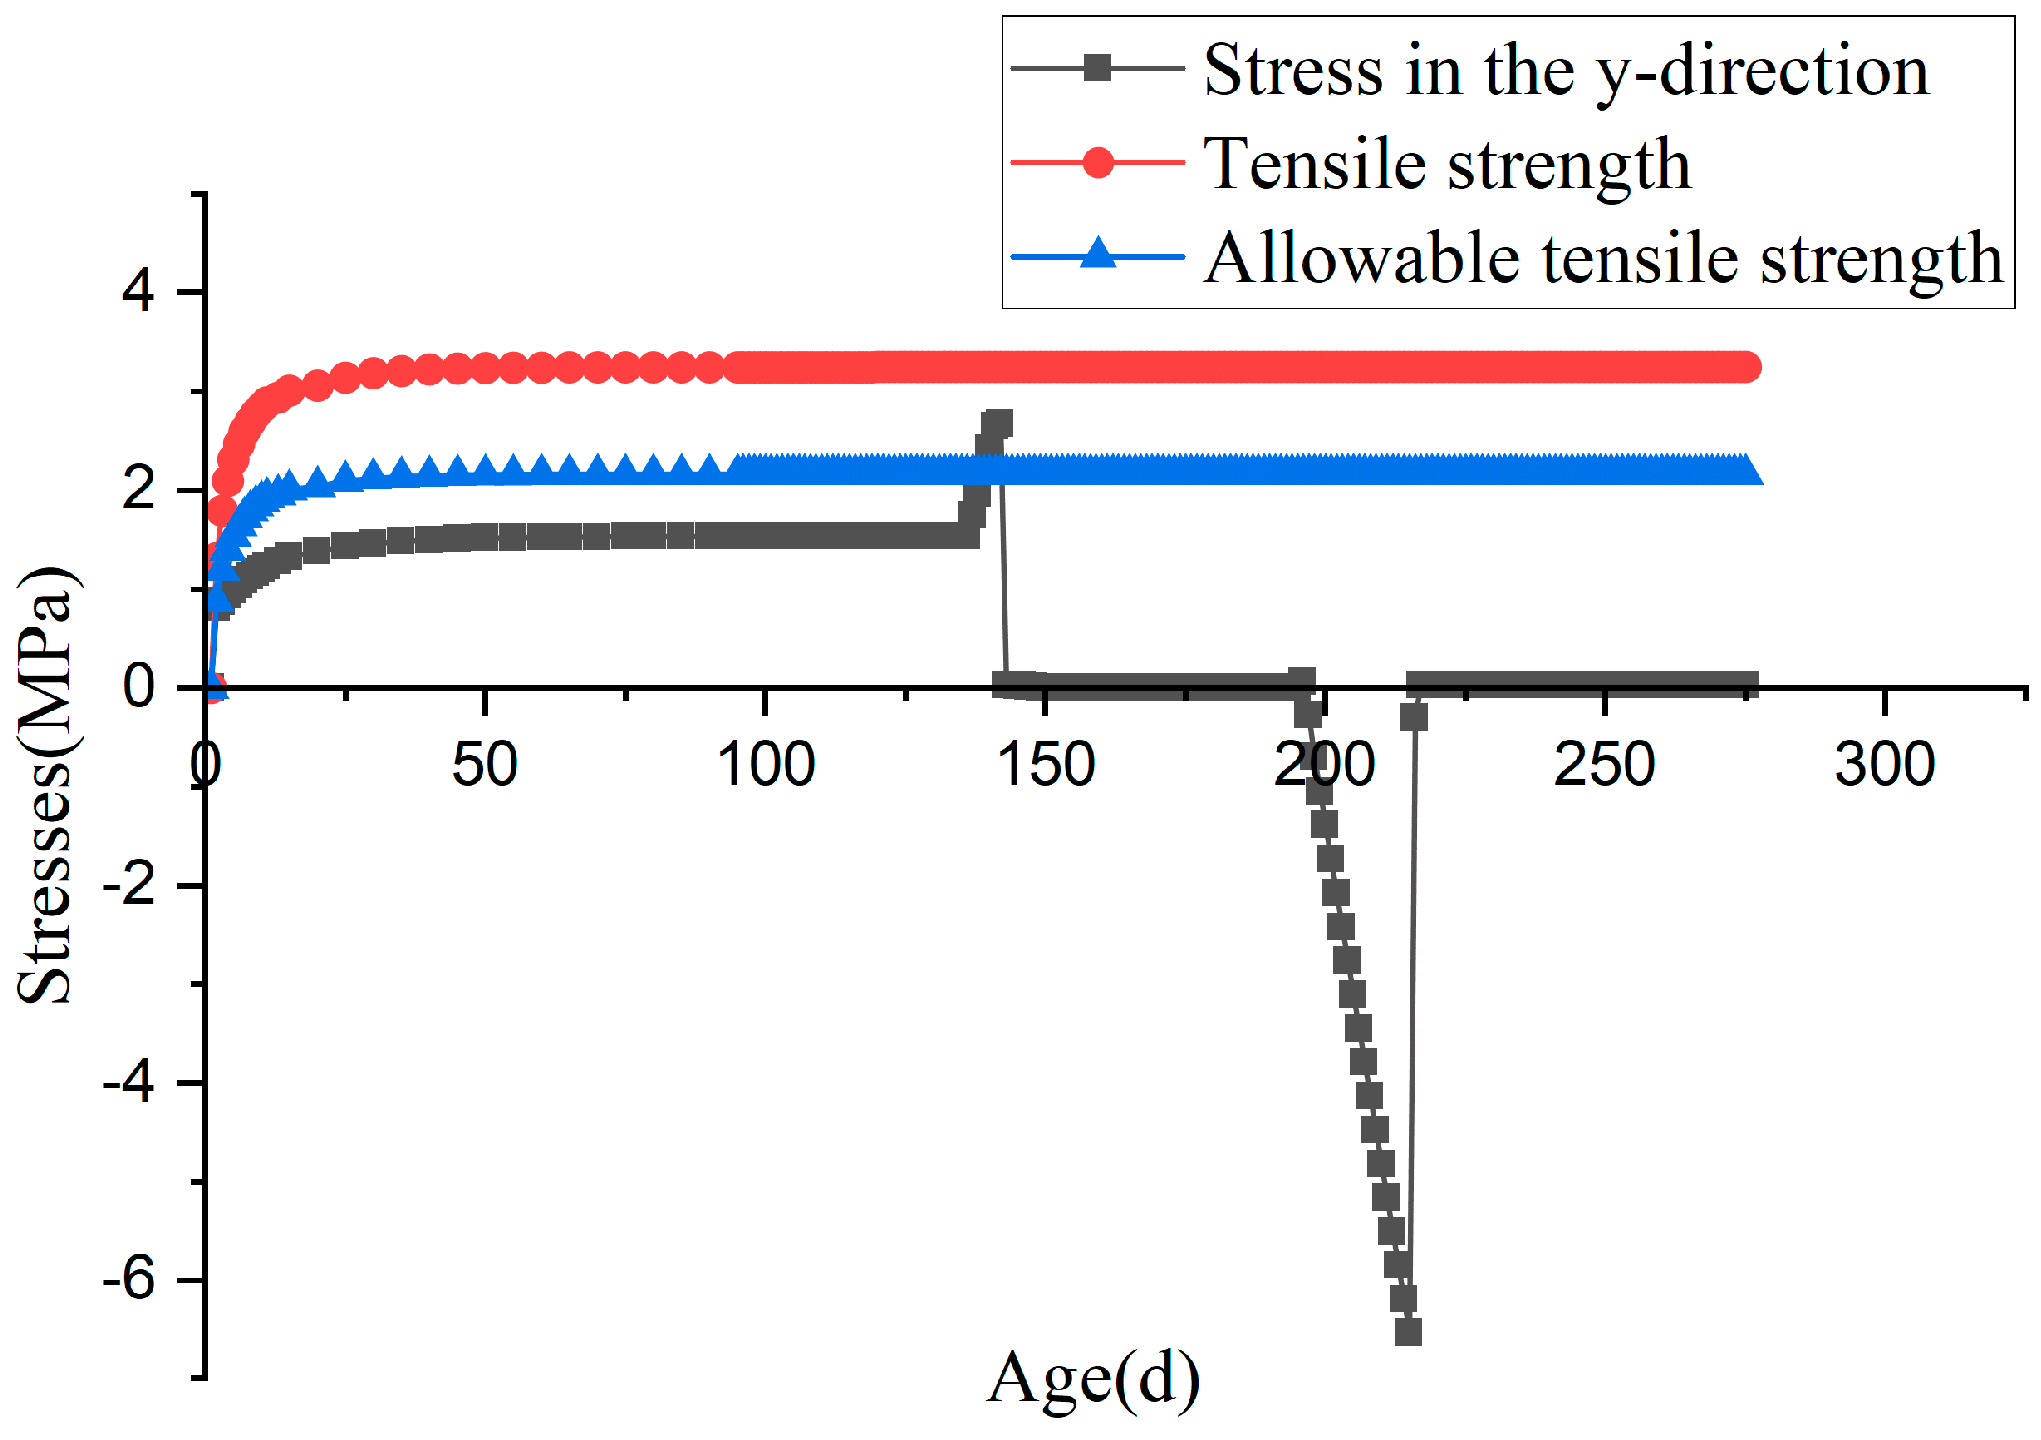
A simplified simulation calculation method for judging concrete cracking was written, and we constructed a simplified concrete rod model to verify the effectiveness and applicability of the improved procedure.

Author Contributions

Conceptualization, J.S., S.Q., M.Y., Y.C., M.W. and F.W.; methodology, J.S., S.Q., M.Y., Y.C., M.W. and F.W.; validation, J.S., S.Q., M.Y., Y.C., M.W. and F.W.; formal analysis, J.S., S.Q., M.Y., Y.C., M.W. and F.W.; data curation, J.S., S.Q., M.Y., Y.C., M.W. and F.W.; writing—original draft preparation, J.S.; writing—review and editing, J.S. and S.Q.; supervision, J.S. and S.Q.; project administration, J.S. and S.Q.; funding acquisition, J.S. and S.Q. All authors have read and agreed to the published version of the manuscript.

Funding

This research was funded by the National Natural Science Foundation of China, grant number 52079049, and the Water Conservancy Science and Technology Plan Project of Zhejiang Province, China, grant number RC2429.

Institutional Review Board Statement

Not applicable.

Informed Consent Statement

Not applicable.

Data Availability Statement

The original contributions presented in the study are included in the article, further inquiries can be directed to the corresponding author.

Conflicts of Interest

Authors Yu Chen, Minghao Weng and Fusheng Wang were employed by the company Huaian Water Conservancy Survey & Design Institute Co., Ltd. The remaining authors declare that the research was conducted in the absence of any commercial or financial relationships that could be construed as a potential conflict of interest.

References

  1. Zhao, Z.F. Research on Bonding Mechanism and Testing Method of New and Old Concrete. Ph.D. Thesis, Dalian University of Technology, Dalian, China, 1998. [Google Scholar]
  2. Li, X.P. Experimental Study on Frost and Seepage Resistance of New and Old Concrete Bonded Surfaces. Ph.D. Thesis, Dalian University of Technology, Dalian, China, 2004. [Google Scholar]
  3. Climaco, J.C.T.; Regan, P.E. Evaluation of Bond Strength between Old and New Concrete in structure Repairs. Mag. Concr. Res. 2001, 53, 377–390. [Google Scholar] [CrossRef]
  4. Emmons, P.H.; Vaysburd, A.M. The Total System Concept-Necessary for Improving the Performance of Repaired Structures. Concr. Int. 1995, 17, 31–36. [Google Scholar]
  5. Momayez, A.; Ramezanianpour, A.A.; Rajaie, H.; Ehsani, M.R. Bi-surface shear test for evaluating bond between existing and new concrete. ACI Mater. J. 2004, 101, 99–106. [Google Scholar]
  6. Momayez, A.; Ehsani, M.R.; Ramezanianpour, A.A.; Rajaie, H. Comparison of methods for evaluating bond strength between concrete substrate and repair materials. Cem. Concr. Res. 2005, 35, 748–757. [Google Scholar] [CrossRef]
  7. Tayeh, B.A.; Abu, B.B.H.; Megat, J.M.A.; Voo, Y.L. Mechanical and permeability properties of the interface between normal concrete substrate and ultra high performance fiber concrete overlay. Constr. Build. Mater. 2012, 36, 538–548. [Google Scholar] [CrossRef]
  8. Costa, H.; Carmo, R.N.F.; Julio, E. Influence of lightweight aggregates concrete on the bond strength of concrete-to-concrete interfaces. Constr. Build. Mater. 2018, 180, 519–530. [Google Scholar] [CrossRef]
  9. He, Y.; Zhang, X.; Hooton, R.D.; Zhang, X.W. Effects of interface roughness and interface adhesion on new-to-old concrete bonding. Constr. Build. Mater. 2017, 151, 582–590. [Google Scholar] [CrossRef]
  10. Gadri, K.; Guettala, A. Evaluation of bond strength between sand concrete as new repair material and ordinary concrete substrate (The surface roughness effect). Constr. Build. Mater. 2017, 157, 1133–1144. [Google Scholar] [CrossRef]
  11. Huang, H.; Yuan, Y.J.; Zhang, W.; Gao, Z.C. Bond behavior between lightweight aggregate concrete and normal weight concrete based on splitting-tensile test. Constr. Build. Mater. 2019, 209, 306–314. [Google Scholar] [CrossRef]
  12. Santos, P.M.D.; Júlio, E.N.B.S. Factors affecting bond between new and old concrete. ACI Mater. J. 2011, 108, 449. [Google Scholar]
  13. Carbonell Muñoz, M.A.; Harris, D.K.; Ahlborn, T.M.; Froster, D.C. Bond performance between ultrahigh- performance concrete and normal-strength concrete. J. Mater. Civ. Eng. 2014, 26, 04014031. [Google Scholar] [CrossRef]
  14. Zanotti, C.; Banthia, N.; Plizzari, G. A study of some factors affecting bond in cementitious fiber reinforced repairs. Cem. Concr. Res. 2014, 63, 117–126. [Google Scholar] [CrossRef]
  15. Banthia, N.; Zanotti, C.; Sappakittipakorn, M. Sustainable fiber reinforced concrete for repair applications. Constr. Build. Mater. 2014, 67, 405–412. [Google Scholar] [CrossRef]
  16. Silfwerbrand, J. Shear bond strength in repaired concrete structures. Mater. Struct. 2003, 36, 419–424. [Google Scholar] [CrossRef]
  17. Wang, B.; Li, Q.; Liu, F.; Wang, J.; Xu, S. Shear bond assessment of UHTCC repair using push-out test. Constr. Build. Mater. 2018, 164, 206–216. [Google Scholar] [CrossRef]
  18. Mirmoghtadaei, R.; Mohammadi, M.; Samani, N.A.; Mousavi, S. The impact of surface preparation on the bond strength of repaired concrete by metakaolin containing concrete. Constr. Build. Mater. 2015, 80, 76–83. [Google Scholar] [CrossRef]
  19. Jafarinejad, S.; Rabiee, A.; Shekarchi, M. Experimental investigation on the bond strength between Ultra high strength Fiber Reinforced Cementitious Mortar & conventional concrete. Constr. Build. Mater. 2019, 229, 116814. [Google Scholar]
  20. Bai, H.Y.; Liu, Z.N.; Lan, H.Y. Effect of interfacial roughness on bond slip of old and new concrete. Fujian Constr. Sci. Technol. 2018, 3, 8–10. [Google Scholar]
  21. Bentz, D.P.; De la Varga, I.; Muñoz, J.F.; Spragg, R.P.; Graybeal, B.A.; Hussey, D.S.; Jacobson, D.L.; Jones, S.Z.; LaManna, J.M. Influence of substrate moisture state and roughness on interface microstructure and bond strength: Slant shear vs. pull-off testing. Cem. Concr. Compos. 2018, 87, 63–72. [Google Scholar] [CrossRef]
  22. SL T352-2020; Hydraulic Concrete Test Specification. China Water & Power Press: Beijing, China, 2009. (In Chinese)
  23. Yang, R. Research on Joint Face Strength Problem of Early-Age Mass Concrete Structures. Master’s Thesis, Hohai University, Nanjing, China, 2016. [Google Scholar]
  24. Wang, W.Q.; Wang, G.S.; Qiang, S.; Chen, S.K. Numerical Simulation of CrackProcessof Large Thin-Walled Concrete Pier Wall Structures during Construction. Water Resour. Power 2018, 36, 139–142. [Google Scholar]
  25. Gao, J.H.; Zhao, W.B.; Li, X.W. Release Load Simulation in Deep Excavation Finite Element Analysis—A Comparison of Three Commonly Used Methods. J. Hohai Univ. Nat. Sci. 2015, 1, 47–52. [Google Scholar]
  26. Tusi, Y.; Cheng, Y.K. A fundamental study of braced excavation construction. Comput. Geotech. 1989, 8, 39–64. [Google Scholar]
Figure 1. Stop-grout tape.
Applsci 14 06968 g001
Figure 2. Roughened interface.
Applsci 14 06968 g002
Figure 3. Test block waiting for initial set.
Applsci 14 06968 g003
Figure 4. Test block after demolding.
Applsci 14 06968 g004
Figure 5. Standard maintenance room.
Applsci 14 06968 g005
Figure 6. Test blocks and testing machine.
Applsci 14 06968 g006
Figure 7. Simplified force diagram of the test block.
Applsci 14 06968 g007
Figure 8. 3D modeling of test blocks.
Applsci 14 06968 g008
Figure 9. Fitting results of tensile strength of old test blocks with age of 3d.
Applsci 14 06968 g009
Figure 10. Fitting results of tensile strength of old test blocks with age of 5d.
Applsci 14 06968 g010
Figure 11. Fitting results of tensile strength of old test blocks with age of 10d.
Applsci 14 06968 g011
Figure 12. Comparison of the fitted curves for the three sets of tests.
Applsci 14 06968 g012
Figure 13. Schematic flow of the simplified algorithm.
Applsci 14 06968 g013
Figure 14. Rod model.
Applsci 14 06968 g014
Figure 15. Feature Point Location.
Applsci 14 06968 g015
Figure 16. Temperature ephemeral profile at feature point 1.
Applsci 14 06968 g016
Figure 17. First principal stress ephemeral curve at feature point 1.
Applsci 14 06968 g017
Figure 18. Y-direction stress ephemeral curve at feature point 1.
Applsci 14 06968 g018
Figure 19. Temperature ephemeral profile at feature point 2.
Applsci 14 06968 g019
Figure 20. First principal stress ephemeral curve at feature point 2.
Applsci 14 06968 g020
Figure 21. Y-direction stress ephemeral curve at feature point 2.
Applsci 14 06968 g021
Figure 22. Temperature ephemeral profile at feature point 3.
Applsci 14 06968 g022
Figure 23. First principal stress ephemeral curve at feature point 3.
Applsci 14 06968 g023
Figure 24. Y-direction stress ephemeral curve at feature point 3.
Applsci 14 06968 g024
Table 1. Concrete Mix Proportion and Performance Indicators.
Concrete Design Mix Ratio
(kg/m3)
CementMineral PowderFly AshExpansive AgentNatural SandManuf-actured SandPebble GravelLarge GravelAdmixtureWater
2415517191458221987927146
Apparent density (kg/m3)Chloride ion content (%)Total alkali content (kg/m3)Slump (mm)
22800.0560.89170
Table 2. Age of test blocks on both sides is 3 days.
Age of the Bonding Surface1d3d5d7d15d
loading (kN)5.2013.221.0326.5227.9
Table 3. Age of test blocks on both sides is 5 days.
Age of the Bonding Surface1d3d5d7d15d
loading (kN)5.2313.6221.5326.5429.48
Table 4. Age of test blocks on both sides is 10 days.
Age of the Bonding Surface1d3d5d7d15d
loading (kN)5.6317.3423.8226.9029.98
Table 5. Calculated parameters for concrete.
Thermal Conductivity
Λ (kj/(m·h·°C))
Specific Heat
C (kj/(kg·°C))
Thermal Diffusivity
a (m2/h)
Coefficient of Linear Expansion
A (1/°C)
Poisson’s Ratio
μ
Densities
ρ (kg/m3)
Final Modulus of Elasticity
E0 (GPa)
11.3320.96990.00470.85 × 10−50.167243030.1
Table 6. Simple rod feature point location.
Feature Point NumberCoordinates of the X-Axis (m)Coordinates of the Y-Axis (m)Coordinates of the Z-Axis (m)
Feature point 10.05−3.250.05
Feature point 20.05−2.500.05
Feature point 30.05−1.750.05
Disclaimer/Publisher’s Note: The statements, opinions and data contained in all publications are solely those of the individual author(s) and contributor(s) and not of MDPI and/or the editor(s). MDPI and/or the editor(s) disclaim responsibility for any injury to people or property resulting from any ideas, methods, instructions or products referred to in the content.

